Article

Modeling the Effect of Green Roof Systems and Photovoltaic Panels for Building Energy Savings to Mitigate Climate Change

1
Shanghai Municipal Engineering Design Institute (Group) Co., Ltd, Shanghai 200092, China
2
Center for Urban and Environmental Change, Department of Earth and Environmental Systems, Indiana State University, Terre Haute, IN 47809, USA
*
Author to whom correspondence should be addressed.
Remote Sens. 2020, 12(15), 2402; https://doi.org/10.3390/rs12152402
Submission received: 22 May 2020 / Revised: 1 July 2020 / Accepted: 25 July 2020 / Published: 27 July 2020

Abstract

:
Green roofs and rooftop solar photovoltaic (PV) systems are two popular mitigation strategies to reduce the net building energy demand and ease urban heat island (UHI) effect. This research tested the potential mitigation effects of green roofs and solar photovoltaic (PV) systems on increased buildings energy demand caused by climate change in Los Angeles County, California, USA. The mitigation effects were assessed based on selected buildings that were predicted to be more vulnerable to climate change. EnergyPlus software was used to simulate hourly building energy consumption with the proper settings of PV-green roofs. All buildings with green roofs showed positive energy savings with regard to total energy and electricity. The savings caused by green roofs were positively correlated with three key parameters: Leaf Area Index (LAI), soil depth, and irrigation saturation percentage. Moreover, the majority of the electricity-saving benefits from green roofs were found in the Heating, Ventilation, and Cooling (HVAC) systems. In addition, this study found that green roofs have different energy-saving abilities on different types of buildings with different technologies, which has received little attention in previous studies.

Graphical Abstract

1. Introduction

Building energy consumption is the largest contributor to anthropogenic heat in many cities [1,2,3], which is demonstrated to be a major contributor to urban heat island (UHI) formation [4,5,6]. Demands for space heating and cooling in buildings, which account for approximately 50% of total building energy consumption [7,8], can be significantly affected by global warming [9,10,11]. The increase in annual building energy usage will cause higher carbon emission because traditional fossil fuels are still the major electricity production resources that are used for cooling in buildings [11].
Policymakers need to make efforts to reduce the energy consumptions in new and existing buildings under the context of climate change [11,12,13]. One important direction is to apply mitigation strategies such as urban greening and increasing renewable energy sources to ease environmental problems, especially the UHI caused by urbanization. Research on urban greening strategies mainly includes tree planting [14,15,16], façade greening [17,18], and roof greening [19,20,21,22]. In high-density urban commercial areas, street trees provide limited contributions to UHI mitigation because their canopies cannot provide shade for buildings taller than the trees themselves. Moreover, there are ground surface area limitations for ground-level tree planting [19]. Therefore, green roofs and rooftop solar photovoltaic (PV) systems research have become popular [12,23,24]. A green roof is a roof with suitable growing media and vegetation, which have become popular as a potential alternative means for re-establishing the connection between nature and a city [25], enhancement of the aesthetic appearance of buildings [26], and improvement of environmental quality [
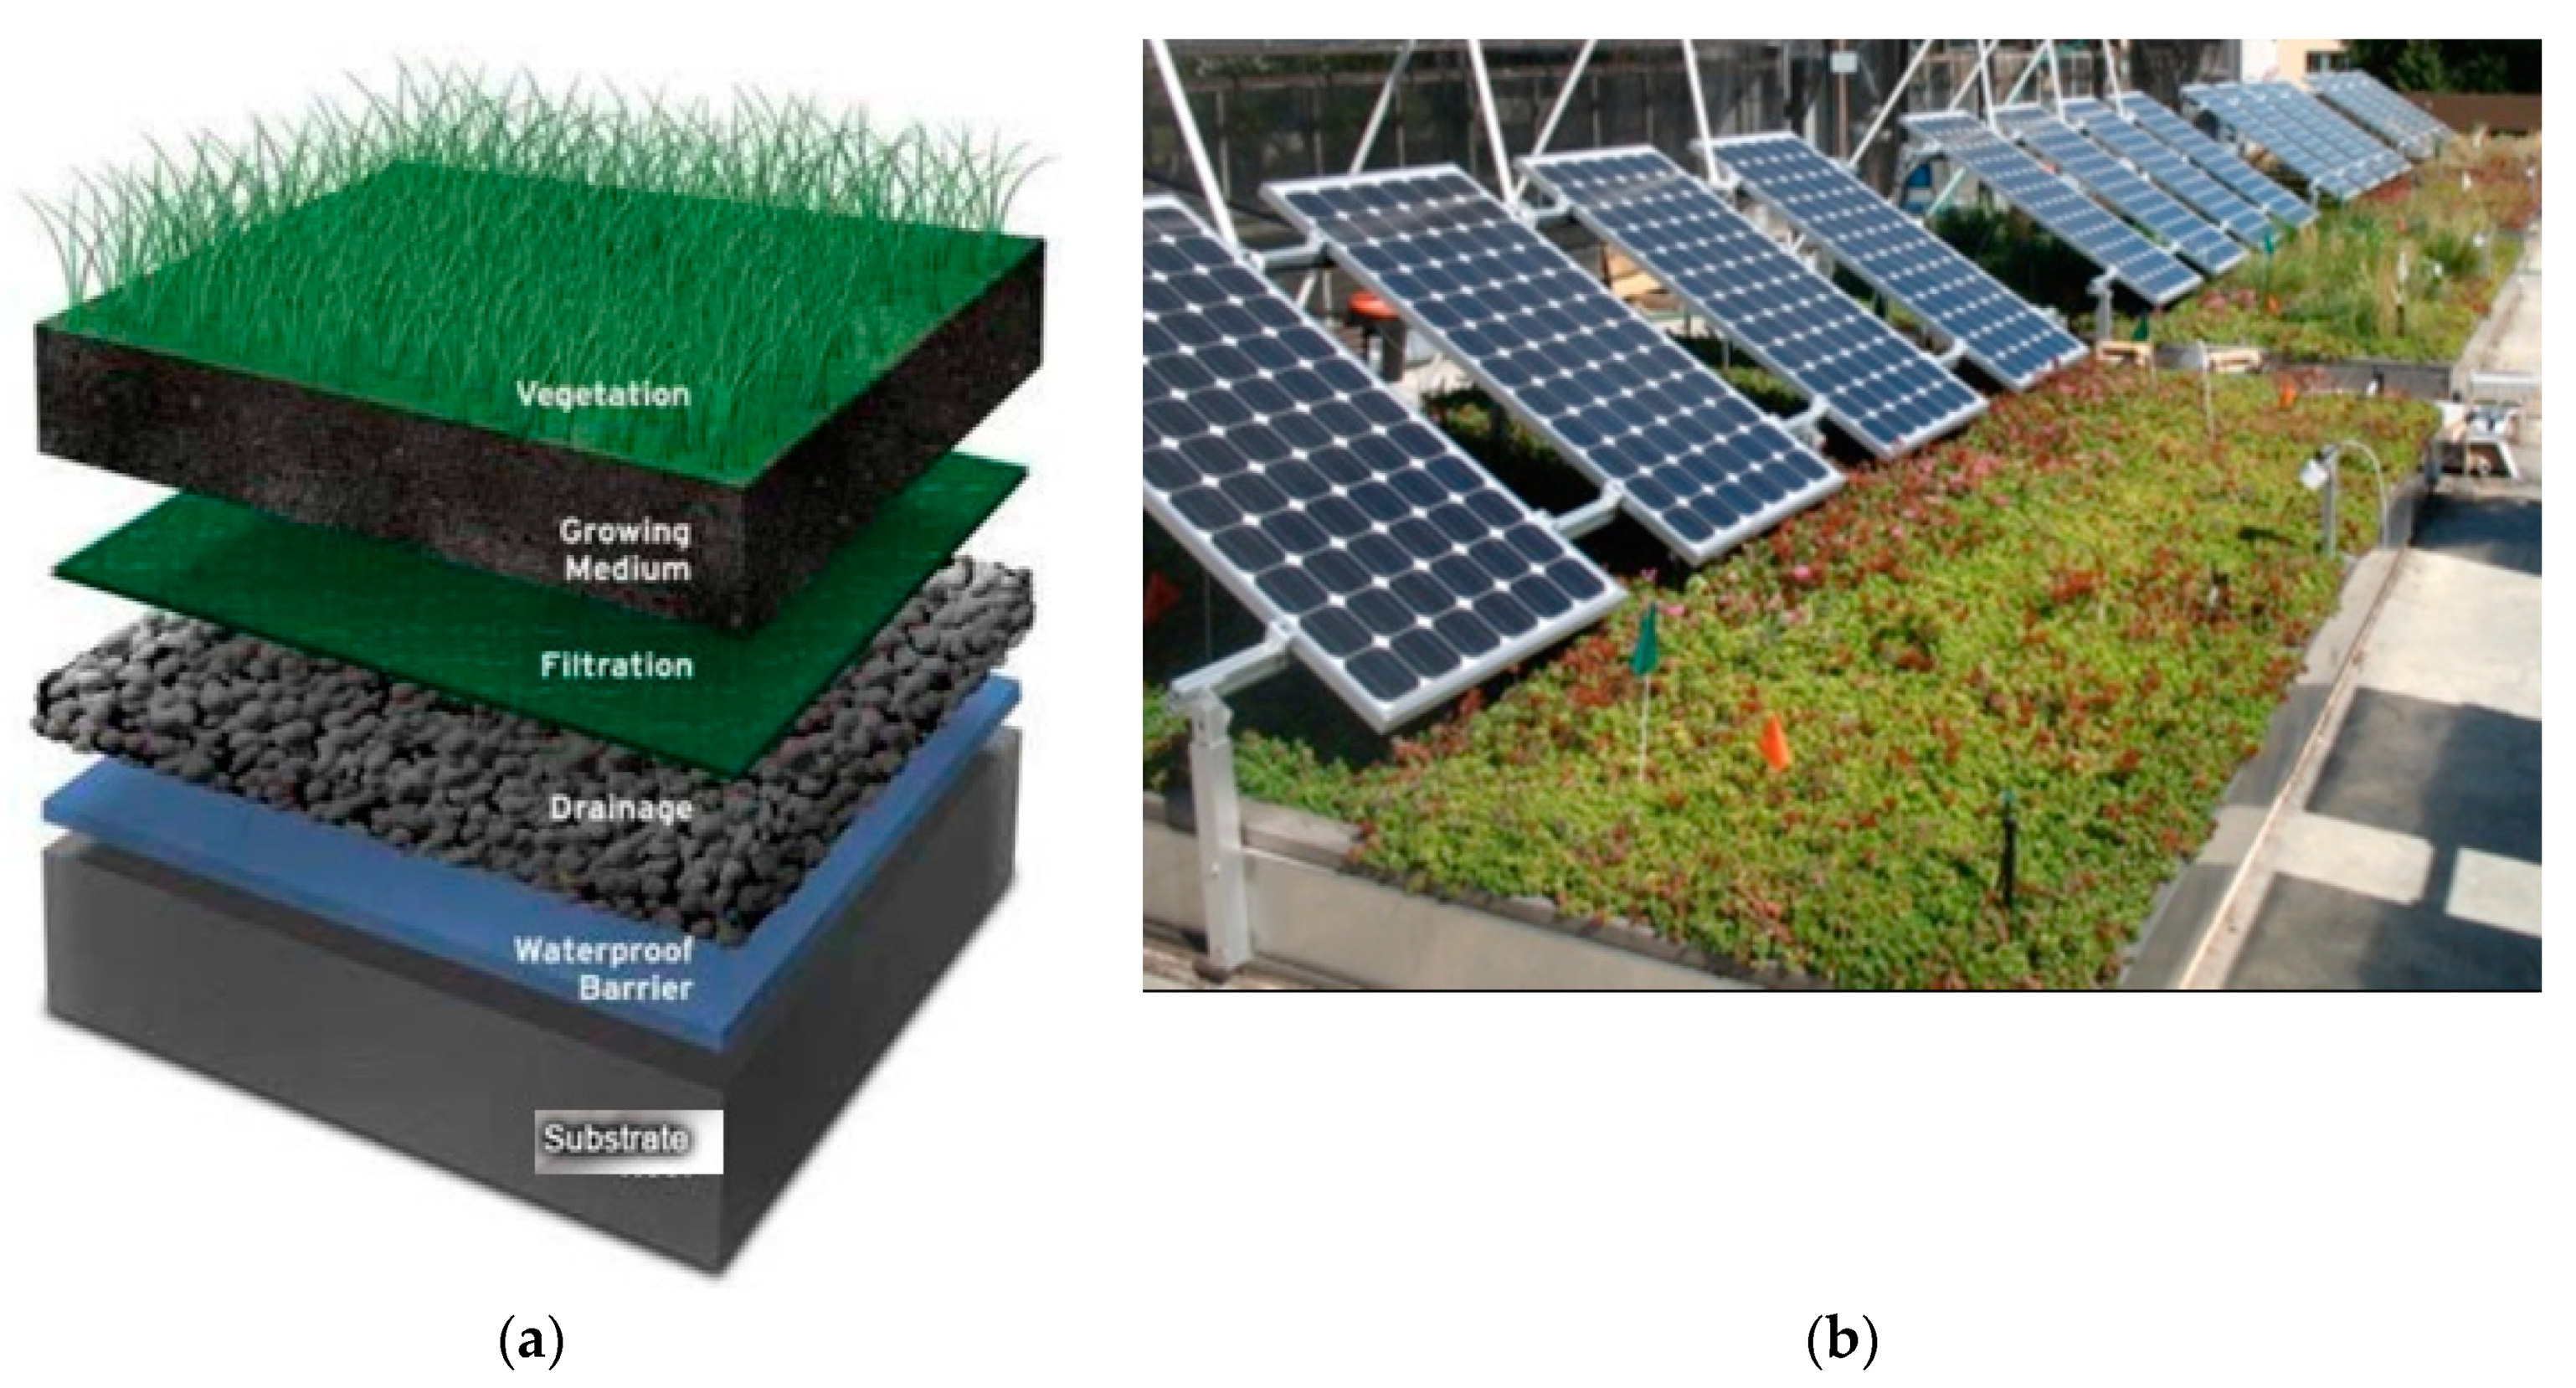
19]. Modern green roofs are generally consisting of many layers, such as vegetation, growing medium, filtration, drainage, waterproof membrane, and substrate [19] (Figure 1a). These layers enhance the insulation capacity of a traditional roof by blocking the heat transfer from solar radiation, which is the main heat source in the buildings. Moreover, the evapotranspiration of vegetation can also create a cooling effect in the building, as the vegetations absorb the solar heat and evaporate water through their biological functions [19]. Green roofs can be classified into intensive and extensive based on the thickness of the substrate layer and the vegetation species planted. Extensive green roofs have thinner substrate layers (up to 15 cm) and limited types of grasses planted on top [27]. The intensive green roofs, which are also called roof gardens, have thicker substrate layers and are planted with taller vegetation, such as shrubs and small trees [27].
Existing studies have examined the performance of green roofs in building indoor temperature reduction and energy consumption savings by considering various factors, including climate [19,28,29], green roof types [19,30], spatial coverage [19], maintenance status [27,29], building density [27], and building height [30]. The majority of existing studies simulated the performance of green roofs using an energy balance model of vegetated rooftops integrated into EnergyPlus software, which was developed by Sailor [20]. Morakinyo et al. suggested that during the daytime, the cooling effect of green roofs was more apparent in the full-intensive type under all climate conditions [19]. However, the extensive green roof types were demonstrated to have better UHI mitigation potential due to less solar heat absorption during the daytime. Heusinger et al. discovered that maintenance, such as irrigation, played a vital role in the performance of green roofs [27]. In recent years, a few studies [18,31,32,33,34,35,36,37,38,39,40] have suggested the integration of green roofs with a solar PV system. In a typical PV-green roof system, PV panels are mounted above the layer of green roof with reasonable distances and angles (Figure 1b), which allows growing room for the vegetation without blocking light to the solar cells. The potential symbiotic relationship between PV panels and green roofs had been proved by many studies [31,35,36,37,38,39,40], which suggested that integrating PV with green roofs can provide reciprocal benefits to both PV electrical production and green roof communities [36]. However, climate conditions, types of vegetation species on green roofs, and the installation heights of PV panels can affect this symbiotic relationship. Chemisana and Lamnatou stated that vegetation provided a cooling effect on the PV systems, which can lead to an increase in output, and this cooling effect varies by plant species [31]. Lamnatou and Chemisana suggested that PV systems could also bring benefits to roof vegetation by protecting the vegetation from exposure to too much sunlight during the summer [35]. Schindler et al. concluded that in their study sites with Mediterranean climate, plant species (Sedum sediforme) showed enhanced growth in plots with PV, but green roof did not improve electricity production by the panels [36]. Osma-Pinto and Ordonez-Plata stated that green roofs can reduce the air temperature around PV panels under tropical conditions if the PV installation heights were lower than 100 cm. However, no evidence of this effect can be found if the PV installation heights were greater than 100 cm [40]. Osma et al. indicated that PV system with separation height of 0.5 m was higher when compared with 0.75 m in their experimental site in Columbia [39,41]. Scherba et al. indicated that the replacement of a traditional black membrane roof with a PV-green roof would reduce the total sensible flux by 50% [34]. Many existing studies [22,29,42] compared green roofs with cool roofs in terms of their cooling abilities; cool roofs are roofs made of a highly reflective type of paint to reflect more sunlight and absorb less heat [43]. Despite the performance in temperature cooling and energy saving, green roofs can provide multiple ecosystem benefits to air quality, biodiversity, retention performance, and microclimate in contrast to single benefit of cool roofs [27].
In many cases, the mitigation potential of building energy consumption increases induced by climate change has been briefly discussed in existing publications [11,17,21,30,44,
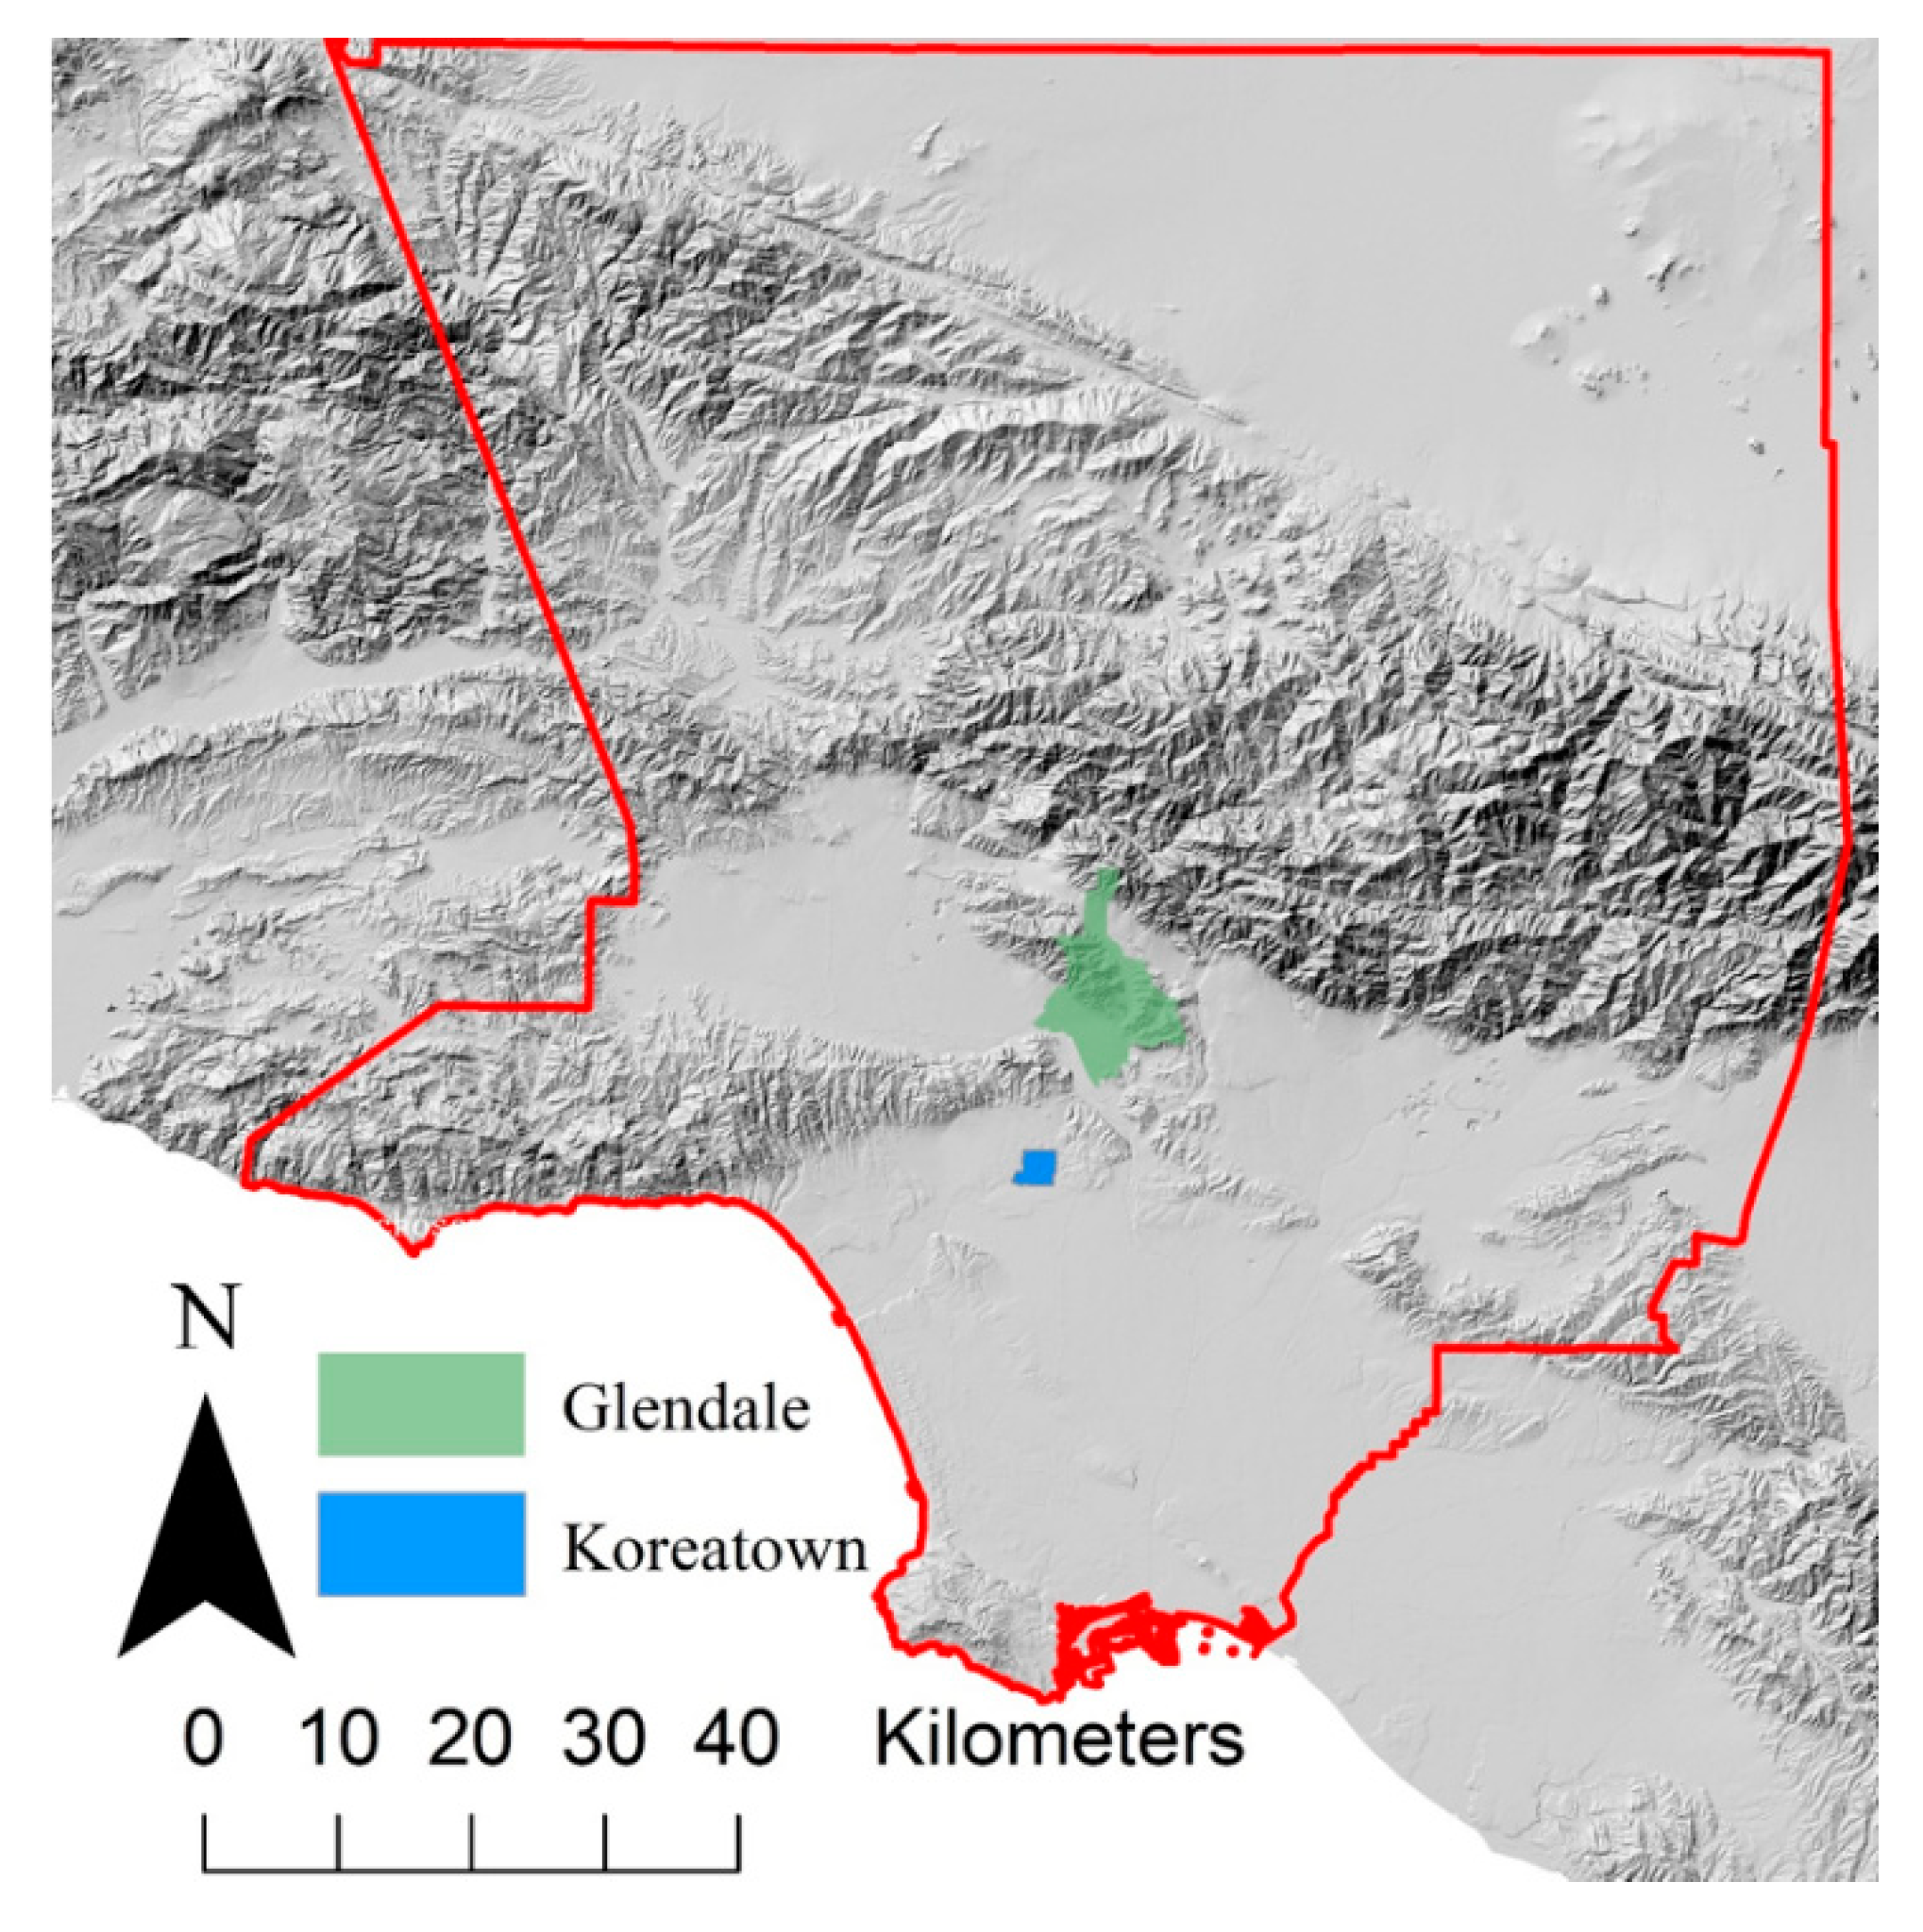
45]. However, little research has been conducted to test the performance of mitigation options, such as sustainable roofs (green roofs, PV roofs, or PV-greens), based on the results of these previous studies, which can be valuable in guiding policymakers. Although many studies have estimated the cooling effect of green roofs, few studies have evaluated their performance under the context of climate change, especially when integrated with PV systems. This study assessed the potential mitigation effects of PV-green roofs on increased building energy demand on selected buildings in two study sites in Los Angeles County, which found to exhibit the largest increase in the cooling energy demand among all neighborhoods caused by climate change according to the findings in Reference [
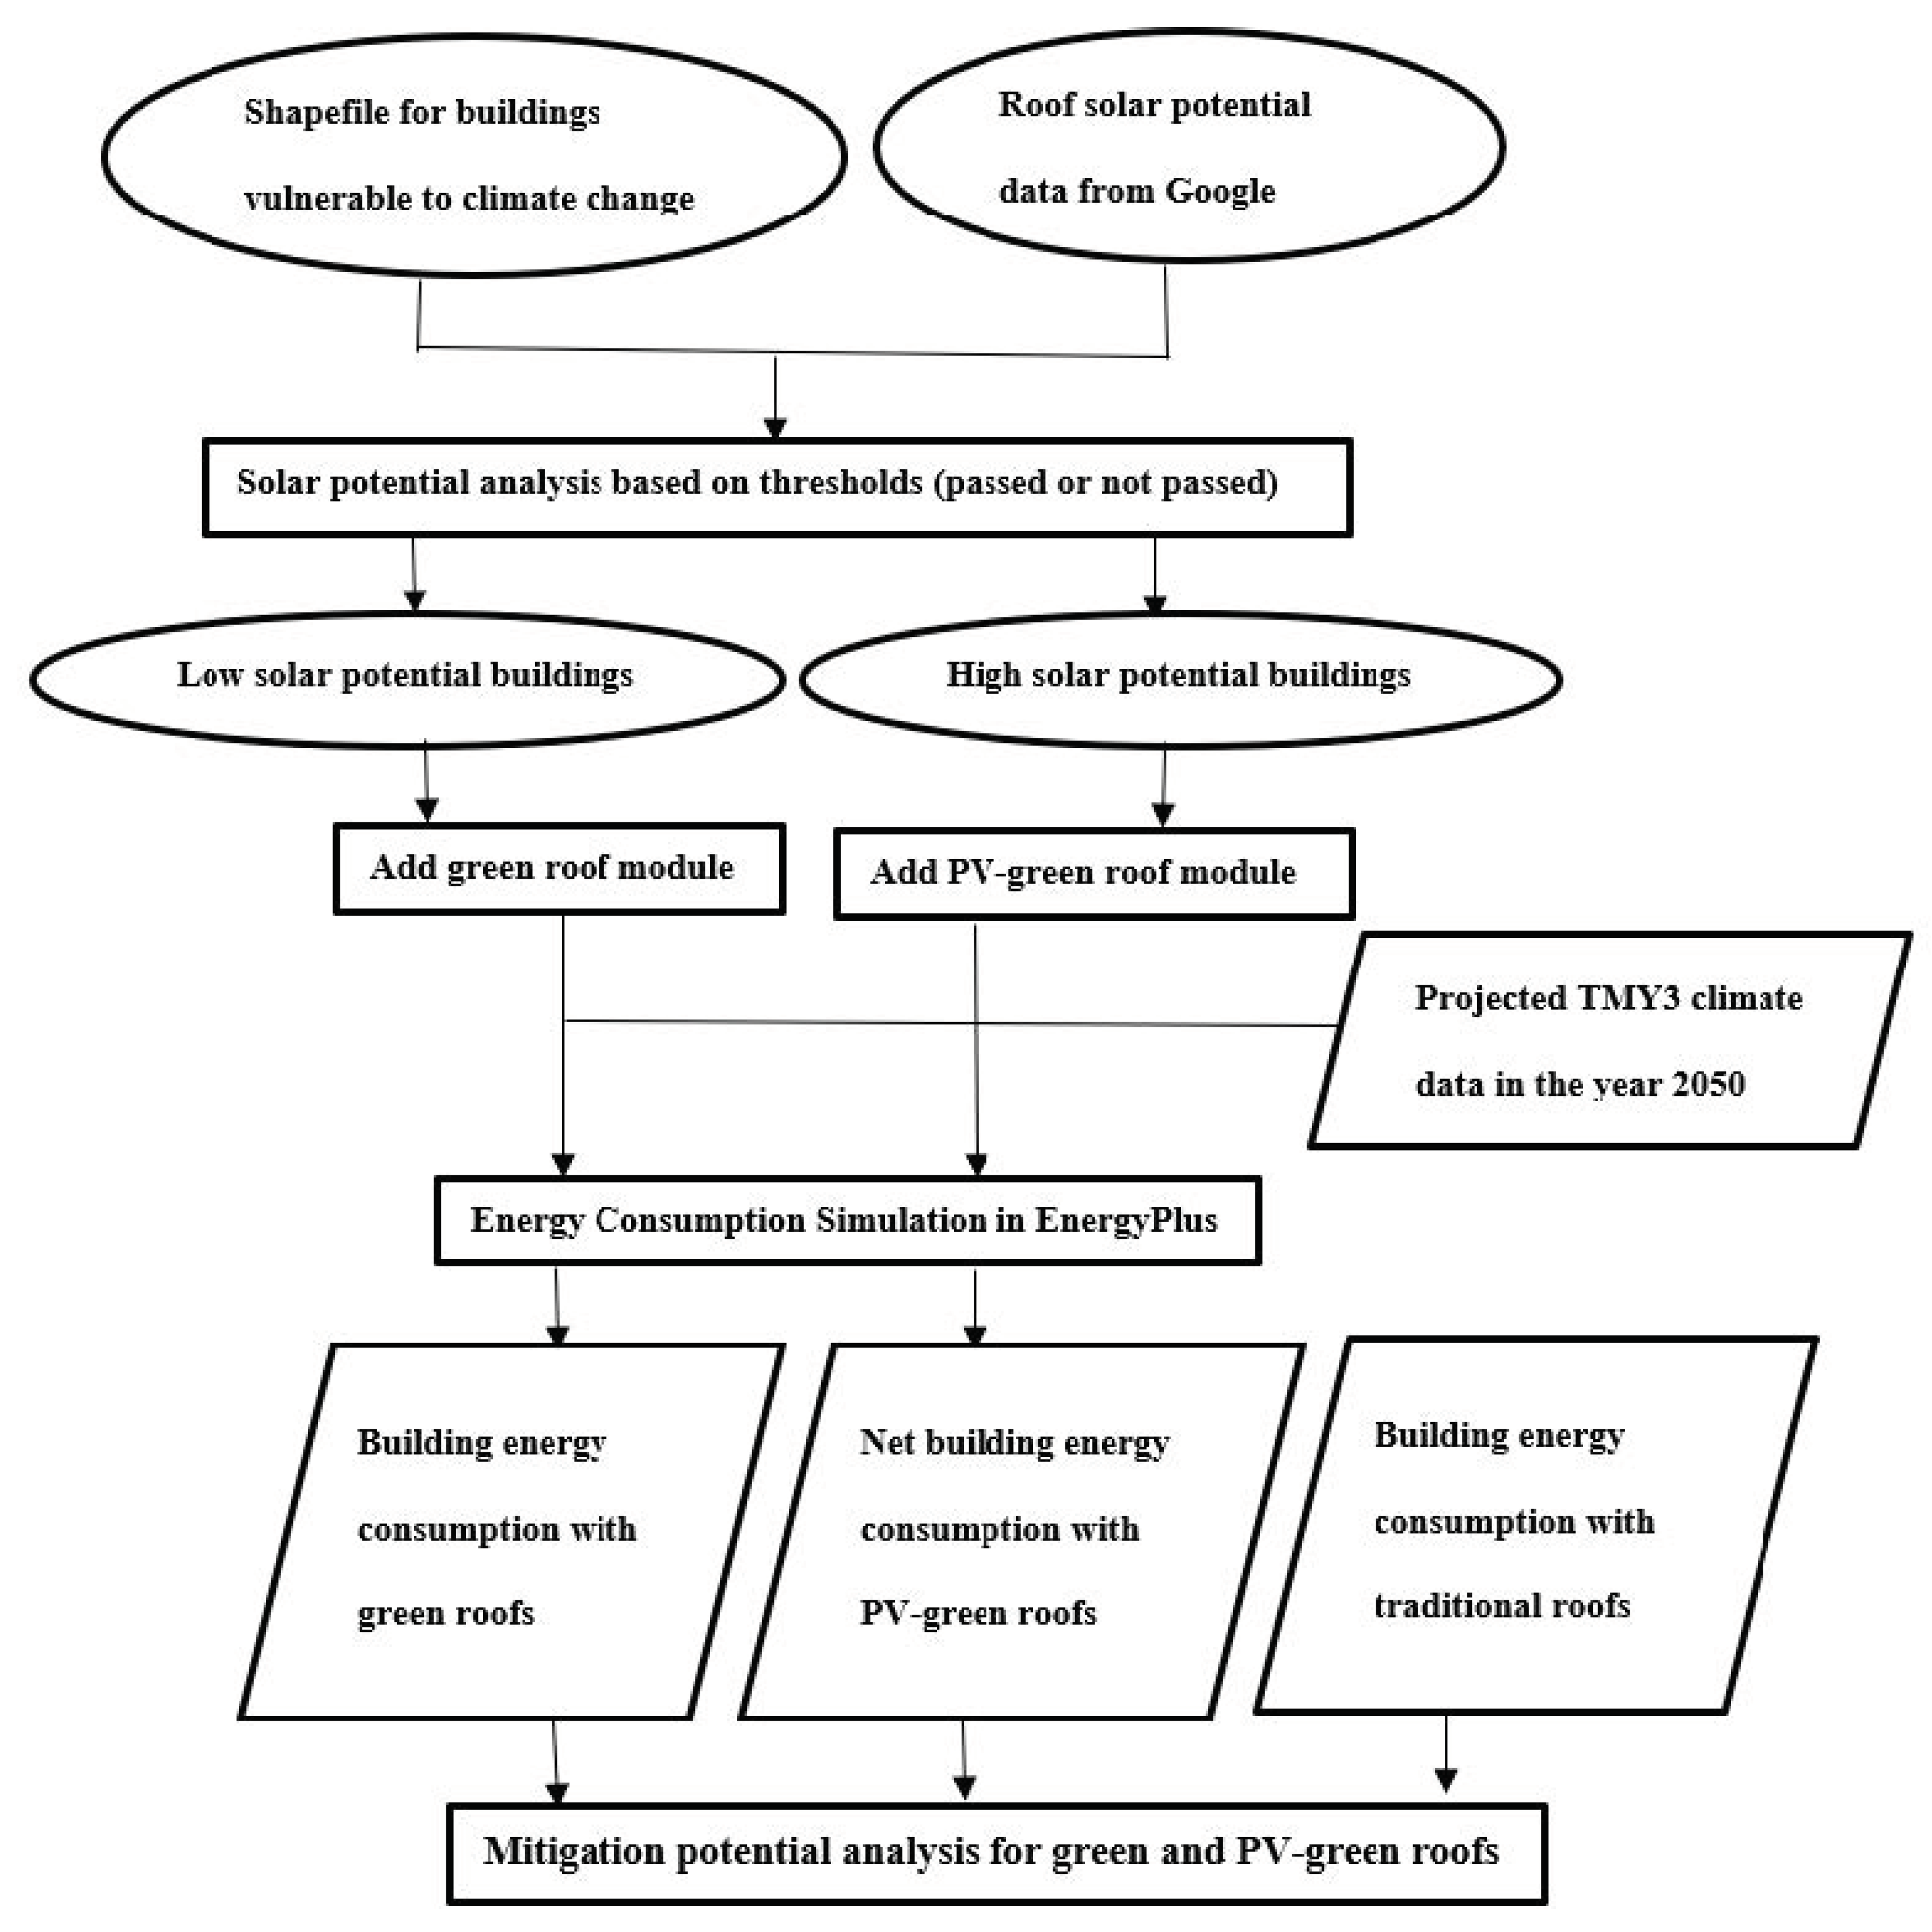
11]. More specifically, the objective of this study is to test the potential mitigation effects of green roofs and PV-green roofs on the buildings that are more vulnerable to climate change in terms of energy demand increase. Specific research questions to be addressed in this research are: (1) To what extent do green roofs or PV-green roofs mitigate the building energy demand increase caused by climate change? and (2) What building types can receive the most benefit from energy savings? To answer these research questions, two hypotheses are put forth: (1) The installation of PV-green roofs can reduce at least 20% of net building energy demand increase caused by climate change for all chosen types of test buildings, and the reduction extent will vary by building type, and (2) Building types that are predicted to have the highest energy demand increase caused by climate change receive the most benefits in terms of energy savings.
Our study filled a gap that highlights the benefits of PV-green roofs under the context of climate change. This is important because given the cooling energy demand could increase dramatically in subtropical and tropical cities due to global warming. The PV-green roofs might present even larger benefits in the future.

2. Materials and Methods

2.1. Study Area and Dataset

The study area, Los Angeles County, is located in California, USA (Figure 2). It is the most populous county in the nation with a population of 10,105,518 in July 2018 according to the U.S. Census [46]. Los Angeles County is subject to micro-climate due to the fact that it occupies three climate zones according to the Koppen climate classification [11].
The major datasets used in this study include the building prototypes, the typical meteorological year (TMY3) weather data, and the open-source solar potential data (Table 1). The building prototypes for all types of testing buildings were obtained from the US Department of Energy (DOE). The TMY data, which obtained from National Solar Radiation Data Base (NSRDB), was a collation of hourly weather data from multiple years for a specific location in a one-year period. The data included seasonal and diurnal variations and represented the typical climatic conditions for a location. Finally, open-source solar potential data for all houses in the United States were published by Google on their Project Sunroof website (https://www.google.com/get/sunroof#p=0) [47]. This data explorer estimates the technical potential of solar power for a single house or region chosen by the user, which was used to analyze the performance of PV-green roofs in the study area.

2.2. Selection of Study Buildings

A detailed discussion of the effect of climate change on building energy demand in Los Angeles County in different spatial and temporal scales can be found in Zheng and Weng [11]. This impact was assessed by comparing building energy demands under current (1991–2005) and future (2050) climate conditions through two metrics: relative change (RC) and absolute difference (AD), in annual, monthly, and diurnal scales under two Intergovernmental Panel on Climate Change (IPCC) emission scenarios: A1F1 (high emission) and A2 (medium emission) of IPCC [48]. The RC can be calculated by the following formula (Equation (1)):
RC = (Ef − Ep)/Ep ∗ 100%
The RC reflects the energy consumption difference between the calibrated current energy consumption and projected future energy consumption [11]. The AD, on the other hand, represents the difference in energy consumption intensity, which can be calculated as follows (Equation (2)):
AD = (Ef − Ep)/FA
where FA is the building floor area, which is the product of the number of floors in a particular building and the area of each floor [11]. According to the results in Zheng and Weng [11], the increased cooling energy demand was found to be more severe than the total energy demand for all types of buildings. Moreover, the two types of restaurants showed the largest ADs in cooling and heating energy intensity among all types of buildings, which might be attributed to their large exposure to the outdoor environment and air intake in addition to the need for regulating waste heat from cooking [11]. There were large within-county spatial variations in the cooling energy demand increases caused by climate change, which was found to be more substantial under the A1F1 scenario [11].
To assess the potential mitigation effects of PV-green roof systems, Glendale and Koreatown were selected as the study sites because they exhibited the largest positive AD and RC in the cooling energy demand among all neighborhoods, respectively. Within the two study sites, the two types of restaurants (full-service and fast-food restaurants) were found to be more susceptible to the large increases in the cooling energy demand in both neighborhoods based on the measured AD or RC. Among the other building types, outpatient buildings, which is a type of hospital that does not take patients for overnight care, showed the highest AD in Glendale. On the other hand, medium offices showed the highest RC in Koreatown. Building composition was the primary factor that caused these two neighborhoods to have large increases in cooling energy demand. The two types of restaurants made up 6.03% and 9.56% of commercial buildings in Glendale and Koreatown, which was higher than that in the entire Los Angeles County (4.26%). Table 2 summarizes the results for 13 selected vulnerable buildings in terms of the performance of PV-green roof mitigation on potential building energy savings. This study intended to include one building per prototype, although not all the prototypes were available in the study sites. For example, post-2004 outpatient facilities and fast-food restaurants could not be found in Glendale.

2.3. Green Roof and Solar Photovoltaic Settings

To evaluate the performance of green and PV-green roof mitigation effects on the potential building energy use increase caused by climate change, EnergyPlus software was used in this study to simulate hourly building energy consumption in Los Angeles County with the proper green roof and photovoltaic modules. This strategy has been widely used in previous research [13,19,27,29,30,34,42,49,50,51] to estimate green roof cooling effects for reduction in indoor temperature and sensible heat fluxes, which can potentially lead to building energy reduction in the summer months. However, studies that evaluate the mitigation potential of green roofs on building energy increases caused by climate change are rare. The purpose of this part of the research is to fill this gap in the current literature and provide a means of evaluating the potential contribution of green roofs based on the results of studies that modeled climate change effects on building energy demand.
Figure 3 presents the methodology used in this study. The vulnerable buildings that are susceptible to the largest increases in energy demand under the context of climate change were identified based on the results from Zheng and Weng [11]. Because solar potential varies at the individual building level, this section was focus on a small study area, which contains less than 30 buildings in total, rather than all buildings in Los Angeles County. Multiple study sites containing a high percentage of vulnerable buildings were selected. The solar potential for each building roof was rated using the open-source roof solar potential data from the Google Project Sunroof database (https://www.google.com/get/sunroof#p=0) [47]. According to Google Project Sunroof, roofs in Los Angeles County should have at least 1405 h of usable sunlight per year to be ranked as high solar potential roofs. Hours of usable sunlight per year were estimated based on the daily analysis of weather patterns. In this study, building roofs with high solar potential were added to both green roofs and PV systems during the simulation. However, only green roofs were added to buildings with low solar potential. The 365-day building energy consumption with hourly interval was simulated in EnergyPlus with building prototype and hourly TMY3 climate data in the two study sites using the algorithm developed in Zheng and Weng [3]. The simulation results of building energy consumption with green roofs or PV-green roofs under the projected climate in 2050 were compared with the scenario of buildings with traditional roofs.

2.3.1. EnergyPlus Green Roof Module Setting

In this study, the EnergyPlus green roof module was used to model green roof fluxes. This module functions as an integral component of the simulation software, performing an energy balance on a vegetated rooftop within each time step [42]. The input of various green roof-related parameters, such as the Leaf Area Index (LAI), plant height, leaf emissivity, soil layer thickness, soil thermal properties, and stomatal resistance, are allowed. The module also accounts for longwave and shortwave radiative exchanges within the plant canopy, plant canopy effects on convective heat transfer, evapotranspiration from soil and plants, and heat conduction and storage in the soil layer [34]. Moreover, the module allows the user to define different irrigation types and to set up specific schedules.
According to Heusinger et al. [27], extensive green roofs have much lower static requirements and are less expensive, so green roofs are generally favored over intensive roof types. Therefore, in this study, an extensive green roof type was chosen instead of the intensive green roof type. Additionally, other studies combined the extensive green roofs with the solar PV system instead of intensive green roofs for PV-green roofs. The setting of parameters in extensive green roofs used in this study followed the settings in Sailor [20], which was based on validated data in two monitored buildings installed with green roofs at Portland State University, Oregon. The key green roof parameters include plant height (0.2 m), LAI (2), soil depth (20 cm), dry soil conductivity (0.4 w/m-k), dry soil specific heat (1000 J/kg-k), and dry soil density (500 kg/m3). For roof irrigation systems, a “smart schedule” was chosen that followed the precipitation schedule and did not allow irrigation when soil is already moist (30% saturation). This schedule can also activate an early morning irrigation system if the soil volumetric moisture content falls below 0.15 m3/m3.

2.3.2. EnergyPlus Solar Photovoltaic Module Setting

EnergyPlus offers different module performance algorithms for predicting the electricity produced by solar electric PV panels. The three different options are (1) Simple, (2) Equivalent One-Diode, and (3) Sandia; and the algorithm choice will determine the mathematical models used to simulate energy production. The simple algorithm allows the user to input an arbitrary efficiency that requires prior knowledge about different PV panel types. The other two models use empirical relationships to predict PV operating performance based on many environmental variables. In this study, the Sandia PV performance algorithm, which is based on extensive measurements and data collection performed at Sandia National Laboratory to predict electricity generated by PV systems, was chosen for simulation. The Sandia model can accurately predict daytime PV cell temperatures and aggregate multiple PV modules by defining the number of cells in series and parallel. These parameters were set differently for each single building based on recommendations such as the area available for solar panels and the recommended solar installation size provided by the Google Project Sunroof website.

3. Results

3.1. Evaluation of Green Roofs and Photovoltaic Panels on Building Energy Savings at the Annual Scale

The solar potential for each building roof was rated using the open-source roof solar potential data from the Google Project Sunroof database, which provides the area available for PV system installation. All 13 buildings passed the threshold of 1405 h of usable sunlight per year and ranked as high solar potential roofs. Therefore, in this study, both green roofs and PV systems were added to each tested building during the simulation. Table 3 presents the available area for PV system installation and simulated annual electricity produced in gigajoules (GJ) for each tested building in 2050. Figure 4 presents the annual energy savings in megajoule per square meter (MJ/m2) from green roofs on the tested buildings compared to traditional roofs at two study sites under the A1F1 emission scenario. All buildings with green roofs showed positive energy savings with regard to both the total energy and electricity demand, although the extent of the savings differed according to building type. The majority of the total energy savings arose from electricity savings. The two types of restaurants showed a higher degree of electricity and natural gas savings than the other building categories, suggesting that they would receive the most benefits in terms of energy savings after the installation of green roofs. However, green roofs were predicted to save less energy for newly constructed restaurants. Green roofs exhibited the largest energy savings for pre-1980 restaurants, but for post-2004 restaurants, showed the least savings. However, this contrast was not obvious for medium offices and outpatient buildings. Figure 5 shows the percentage breakdown of the individual components contributing to the annual electricity savings from green roofs at the two study sites under the A1F1 emission scenario. Most electricity savings were derived from cooling energy savings, followed by savings on fan energy, suggesting that lower indoor temperatures can also save ventilation energy. Other savings (e.g., lighting, equipment, pumps, humidification, and refrigeration) were trivial for most of the tested buildings except for the two outpatient buildings and post-1980 medium office. One reason for this difference is that the space heating energy was supplied by electricity, which also contributed to their electricity savings. Thus, it can be concluded that all benefits of electricity savings from green roofs are from building Heating, Ventilation, and Cooling (HVAC) systems. Figure 6 presents the annual electricity saving percentage due to the integration of green roofs and photovoltaic systems at the two study sites under the A1F1 emission scenario. The annual electricity savings from the installation of PV-green roofs ranged from 1.2% (pre-1980 outpatient building) to 6.92% (post-1980 fast-food restaurant). Table 4 and Table 5 present the RC between 2050 and present (1991–2005) for all tested buildings under the A1F1 emission scenario with regard to the annual total energy and electricity demand, respectively. All restaurants with PV-green roofs were predicted to consume less total energy in 2050 than at present (Table 4), even under the high-emission scenario (A1F1), which indicates the robustness of PV-green roofs. The reduction in the increased net building energy demand caused by climate change ranged from 8.2% (pre-1980 outpatient building) to 299.2% (pre-1980 full-service restaurant). Although PV-green roofs cannot fully offset the increases in predicted electricity consumption in 2050 for the majority of buildings, the extent of the increase is much lower than with traditional roofs (Table 5).
A life-cycle approach, as adopted in Bianchini and Hewage (2012), was performed to analyze the social-economic benefits of installing PV-green roofs on all tested buildings. The parameter settings also followed the settings in Reference [52], which are listed in Table 6. The PV system installation cost for each building was found on the Google Project Sunroof website. The return on investment (ROI) after 20 years was found to exceed 100% in 12 of the 13 tested buildings, and the payback periods for installing PV-green roofs on all tested buildings ranged from 5.3 years (post-1980 medium office) to 14.2 years (post-1980 fast-food restaurant) (Table 7), suggesting that these buildings could receive considerable social-economic benefits. Compared to traditional roofs, which have a lifespan of only 20 years, the expected lifespan of a green roof varies from 30 to 55 years [31,33,35,44]. Therefore, the savings from re-roofing 20 years after initial construction can be counted as a longevity benefit of green roofs. In addition to the longevity benefit, installation of extensive green roofs could also increase property prices by at least 2% [44], which could contribute to the high ROI and reasonable payback period. In this study, the estimation of projected increase in property prices was made based on the current prices of commercial buildings in Glendale and Koreatown using the LoopNet website (https://www.loopnet.com/) [53].

3.2. Evaluation of Green Roofs and Photovoltaic Panels on Building Energy Saving at the Monthly Scale

Because larger increases in building energy demand were observed at finer time scales in Zheng and Weng [11], this section further analyzed the performance of green roofs on energy savings at the monthly scale. Because the outputs of energy generated by PV systems were only provided at the annual scale, this section focused only on the performance of green roofs on electricity savings. Figure 7 demonstrates the monthly electricity saving percentage from green roofs at the two study sites under the A1F1 emission scenario compared with traditional roofs. All buildings with green roofs showed positive electricity savings in all months except the post-2004 fast-food restaurant from October to March, although the negative electricity savings are less than 1%. Moreover, all buildings showed more electricity savings during the summer months than the winter months except for the two outpatient buildings in Glendale. All restaurants showed higher monthly electricity savings in the summer months regardless of location and building age, which indicates that green roofs can provide more benefits to restaurants when temperatures are high at the study sites. The possible reason that outpatient buildings yielded a small electricity saving in summer months is that they possessed large internal load such as the healthcare equipment, which can remain constant on electricity consumption. Moreover, as the healthcare buildings usually have strict ventilation requirements, which can also weaken the energy-saving effects from PV-green roofs. It was also observed that electricity savings were slightly higher for buildings in Glendale than those in Koreatown. The reason for this difference is that Glendale is located in the Burbank-Glendale weather zone, which has higher monthly temperatures than Koreatown. In addition, green roofs installed on older restaurants were found to save more electricity for most months, because newly built restaurants, especially the post-2004 restaurants, were found to be less sensitive to climate change as they were already equipped with advanced HVAC systems and higher insulation levels.

3.3. Evaluation of the Green Roof Model Sensitivity

In this section, the model sensitivity to key input parameters related to green roofs is evaluated. Because a detailed parametric test of all green roof parameters is beyond the scope of this study, only the three most important parameters (LAI, soil depth, and irrigation), which were identified from the previous literature [20,36], are examined. The pre-1980 full-service restaurant in Glendale was selected because it showed the highest electricity saving potential at both time scales (annual and monthly). Table 8 shows the matrix of seven different settings for LAI, soil depth, and irrigation saturation percentage. The base model was defined as the model used in the previous section. Soil depth and LAI variations were set to the minimum and maximum threshold values allowed by EnergyPlus. For roof irrigation systems, the “smart schedule” was used, although the irrigation saturation percentages were set differently. For the low-irrigation model, the irrigation saturation percentage was set to 5%, which means that irrigation would not be performed when the soil is considered to be “moist” (higher than 5% saturation). For the high-irrigation model, the irrigation saturation percentage was set to 95%. All other parameters were unchanged from Section 2.3.1.
Differences in monthly electricity savings for various green roof settings applied to the pre-1980 full-service restaurant under the A1F1 emission scenario in 2050 are presented in Figure 8. The energy-saving ability of the green roof was positively correlated with the three key parameters, which agrees with the results of the literature [20,36]. The irrigation saturation percentage had the largest impact on electricity savings among the three key parameters for most months, and this impact reached its maximum in summer (August). This result differs from what was found by Sailor [20], who suggested that soil thickness had the largest impact on energy use. The reason for this difference is that Glendale is a neighborhood in the Los Angeles Basin that experiences very little precipitation throughout the year (except in winter). Therefore, irrigation is essential for the plants used for green roofs on Glendale buildings.

4. Discussion

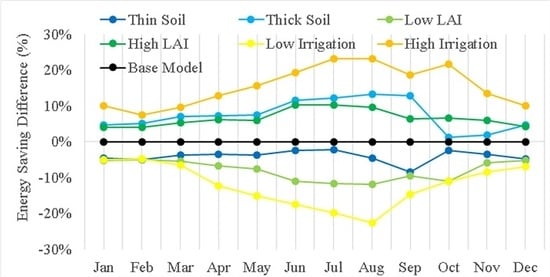
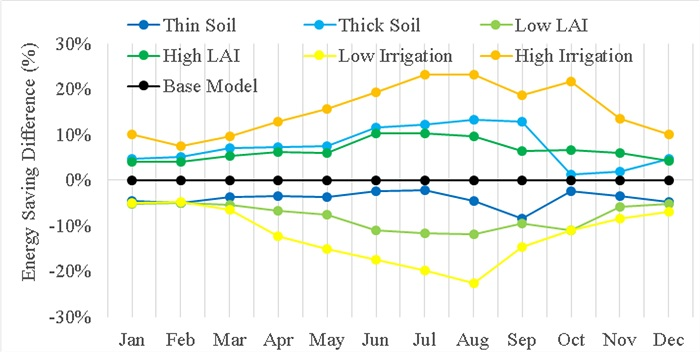
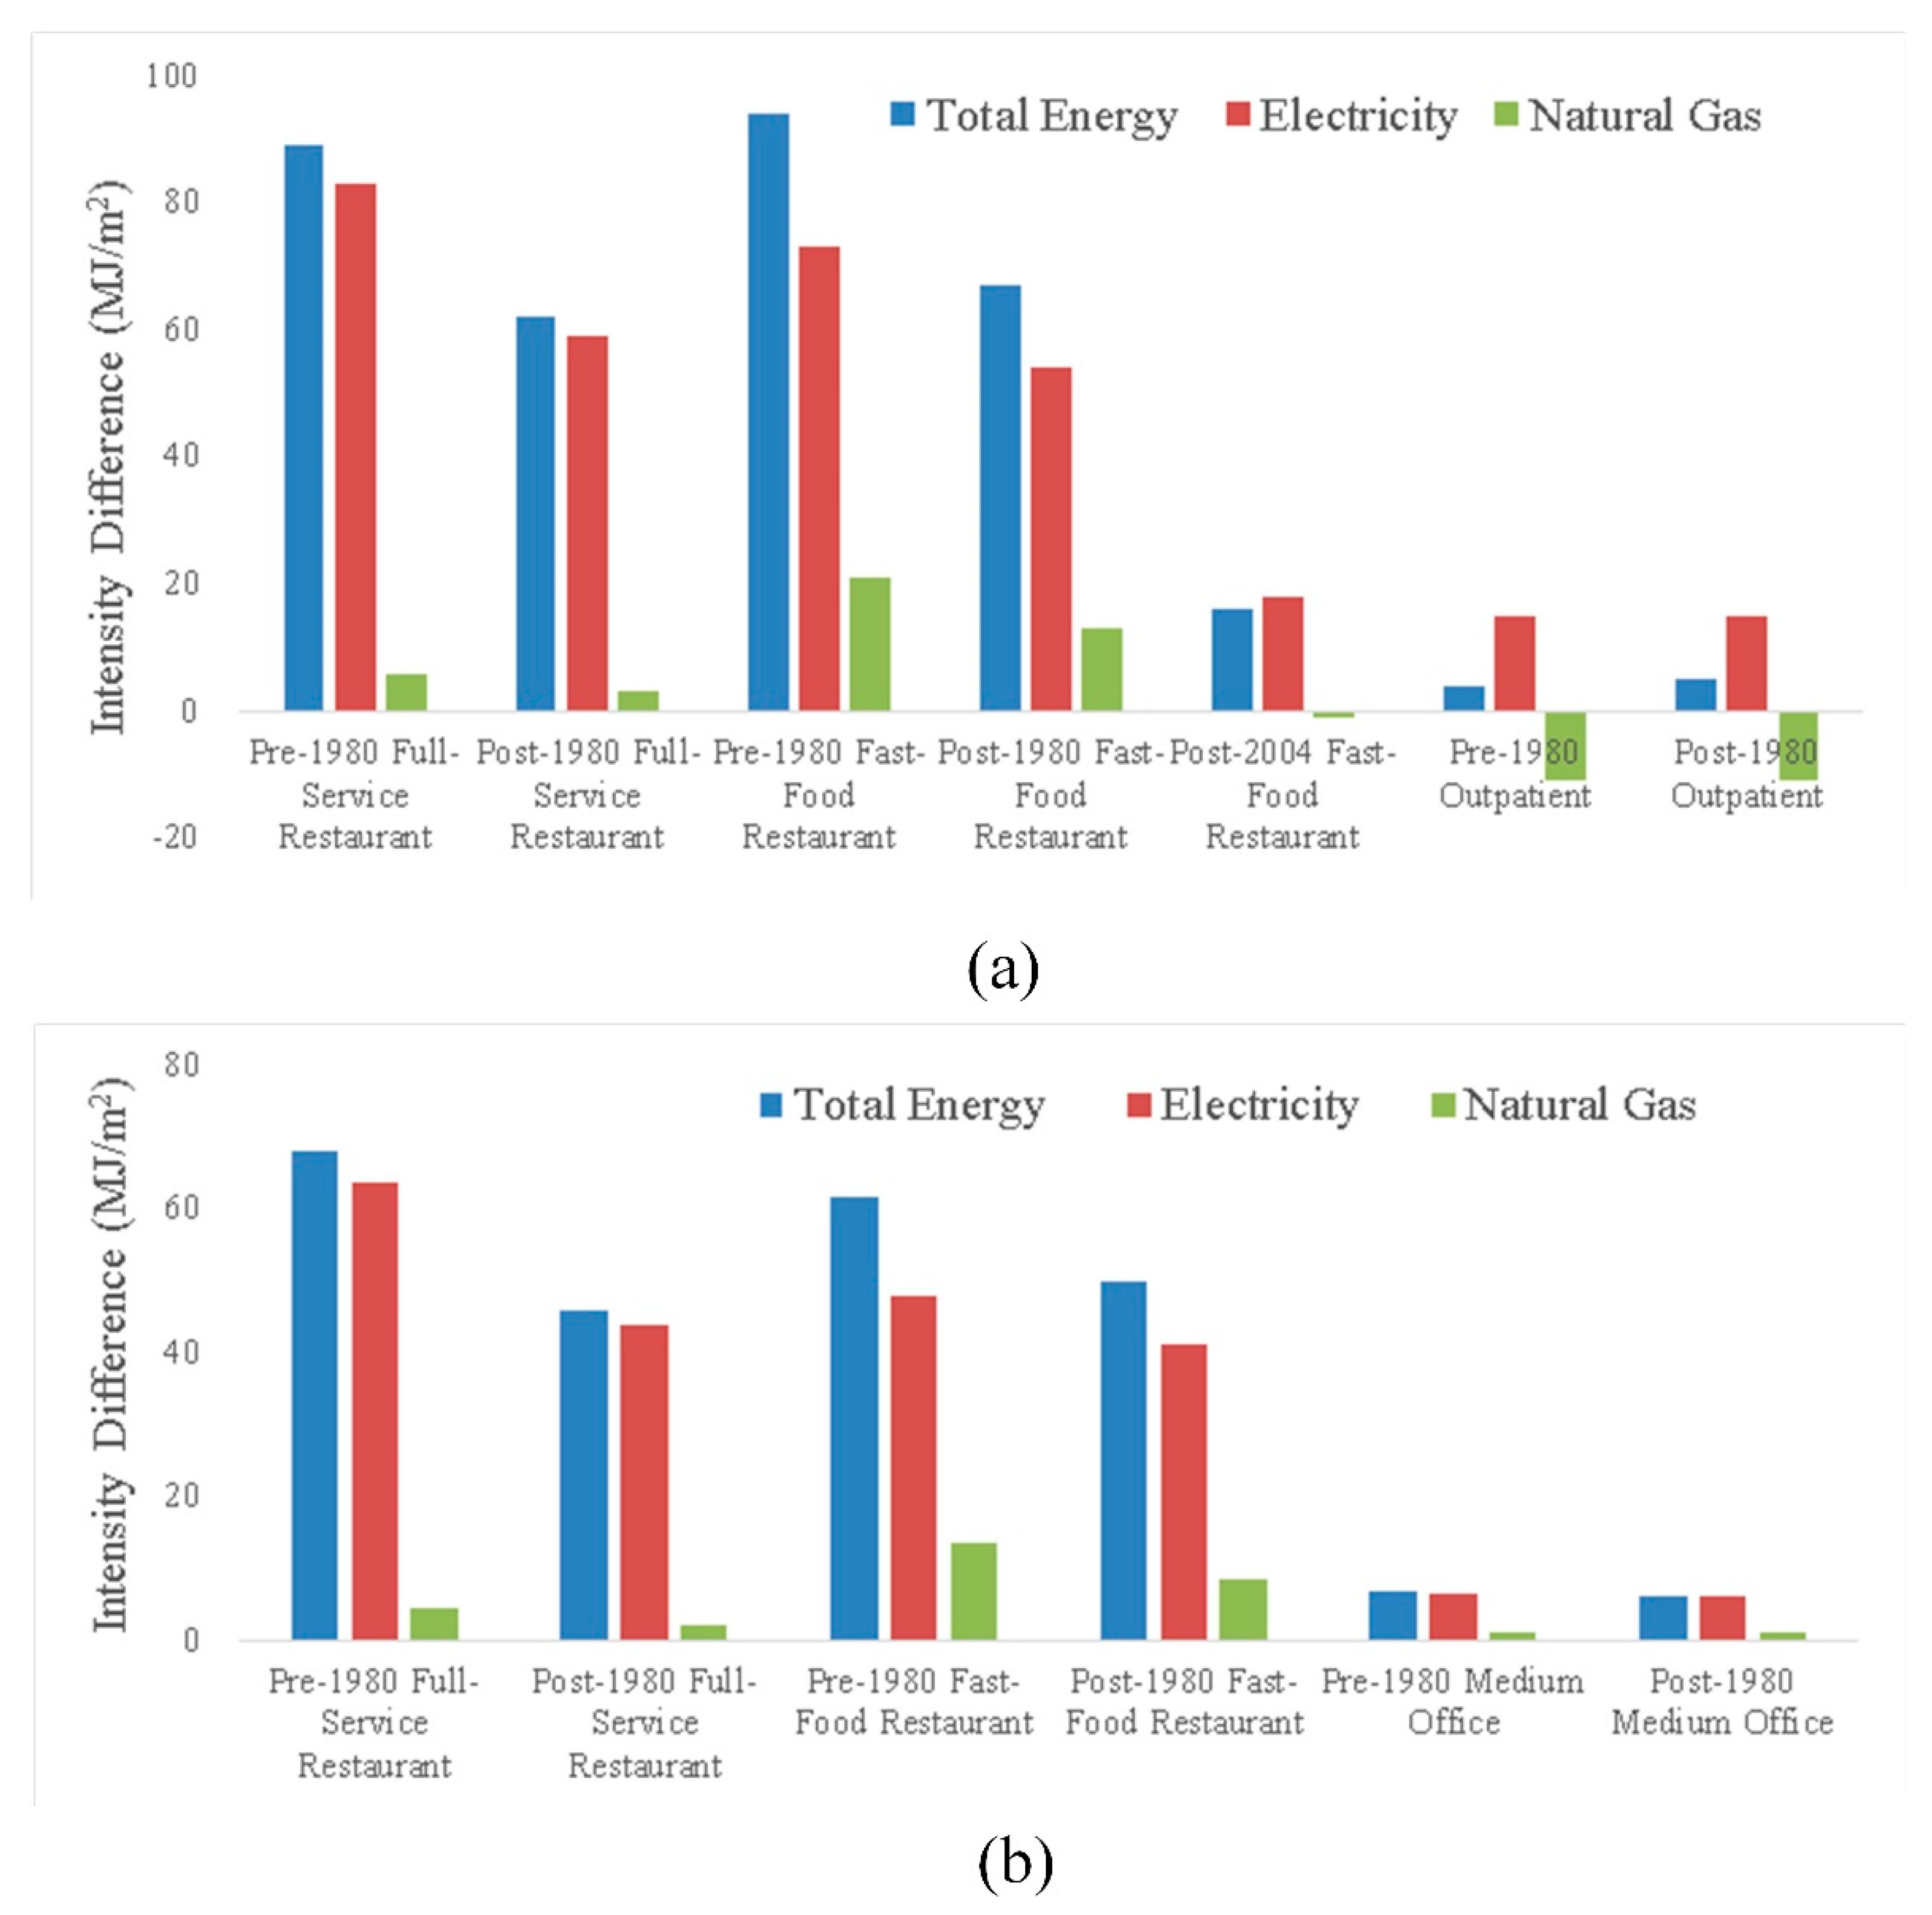
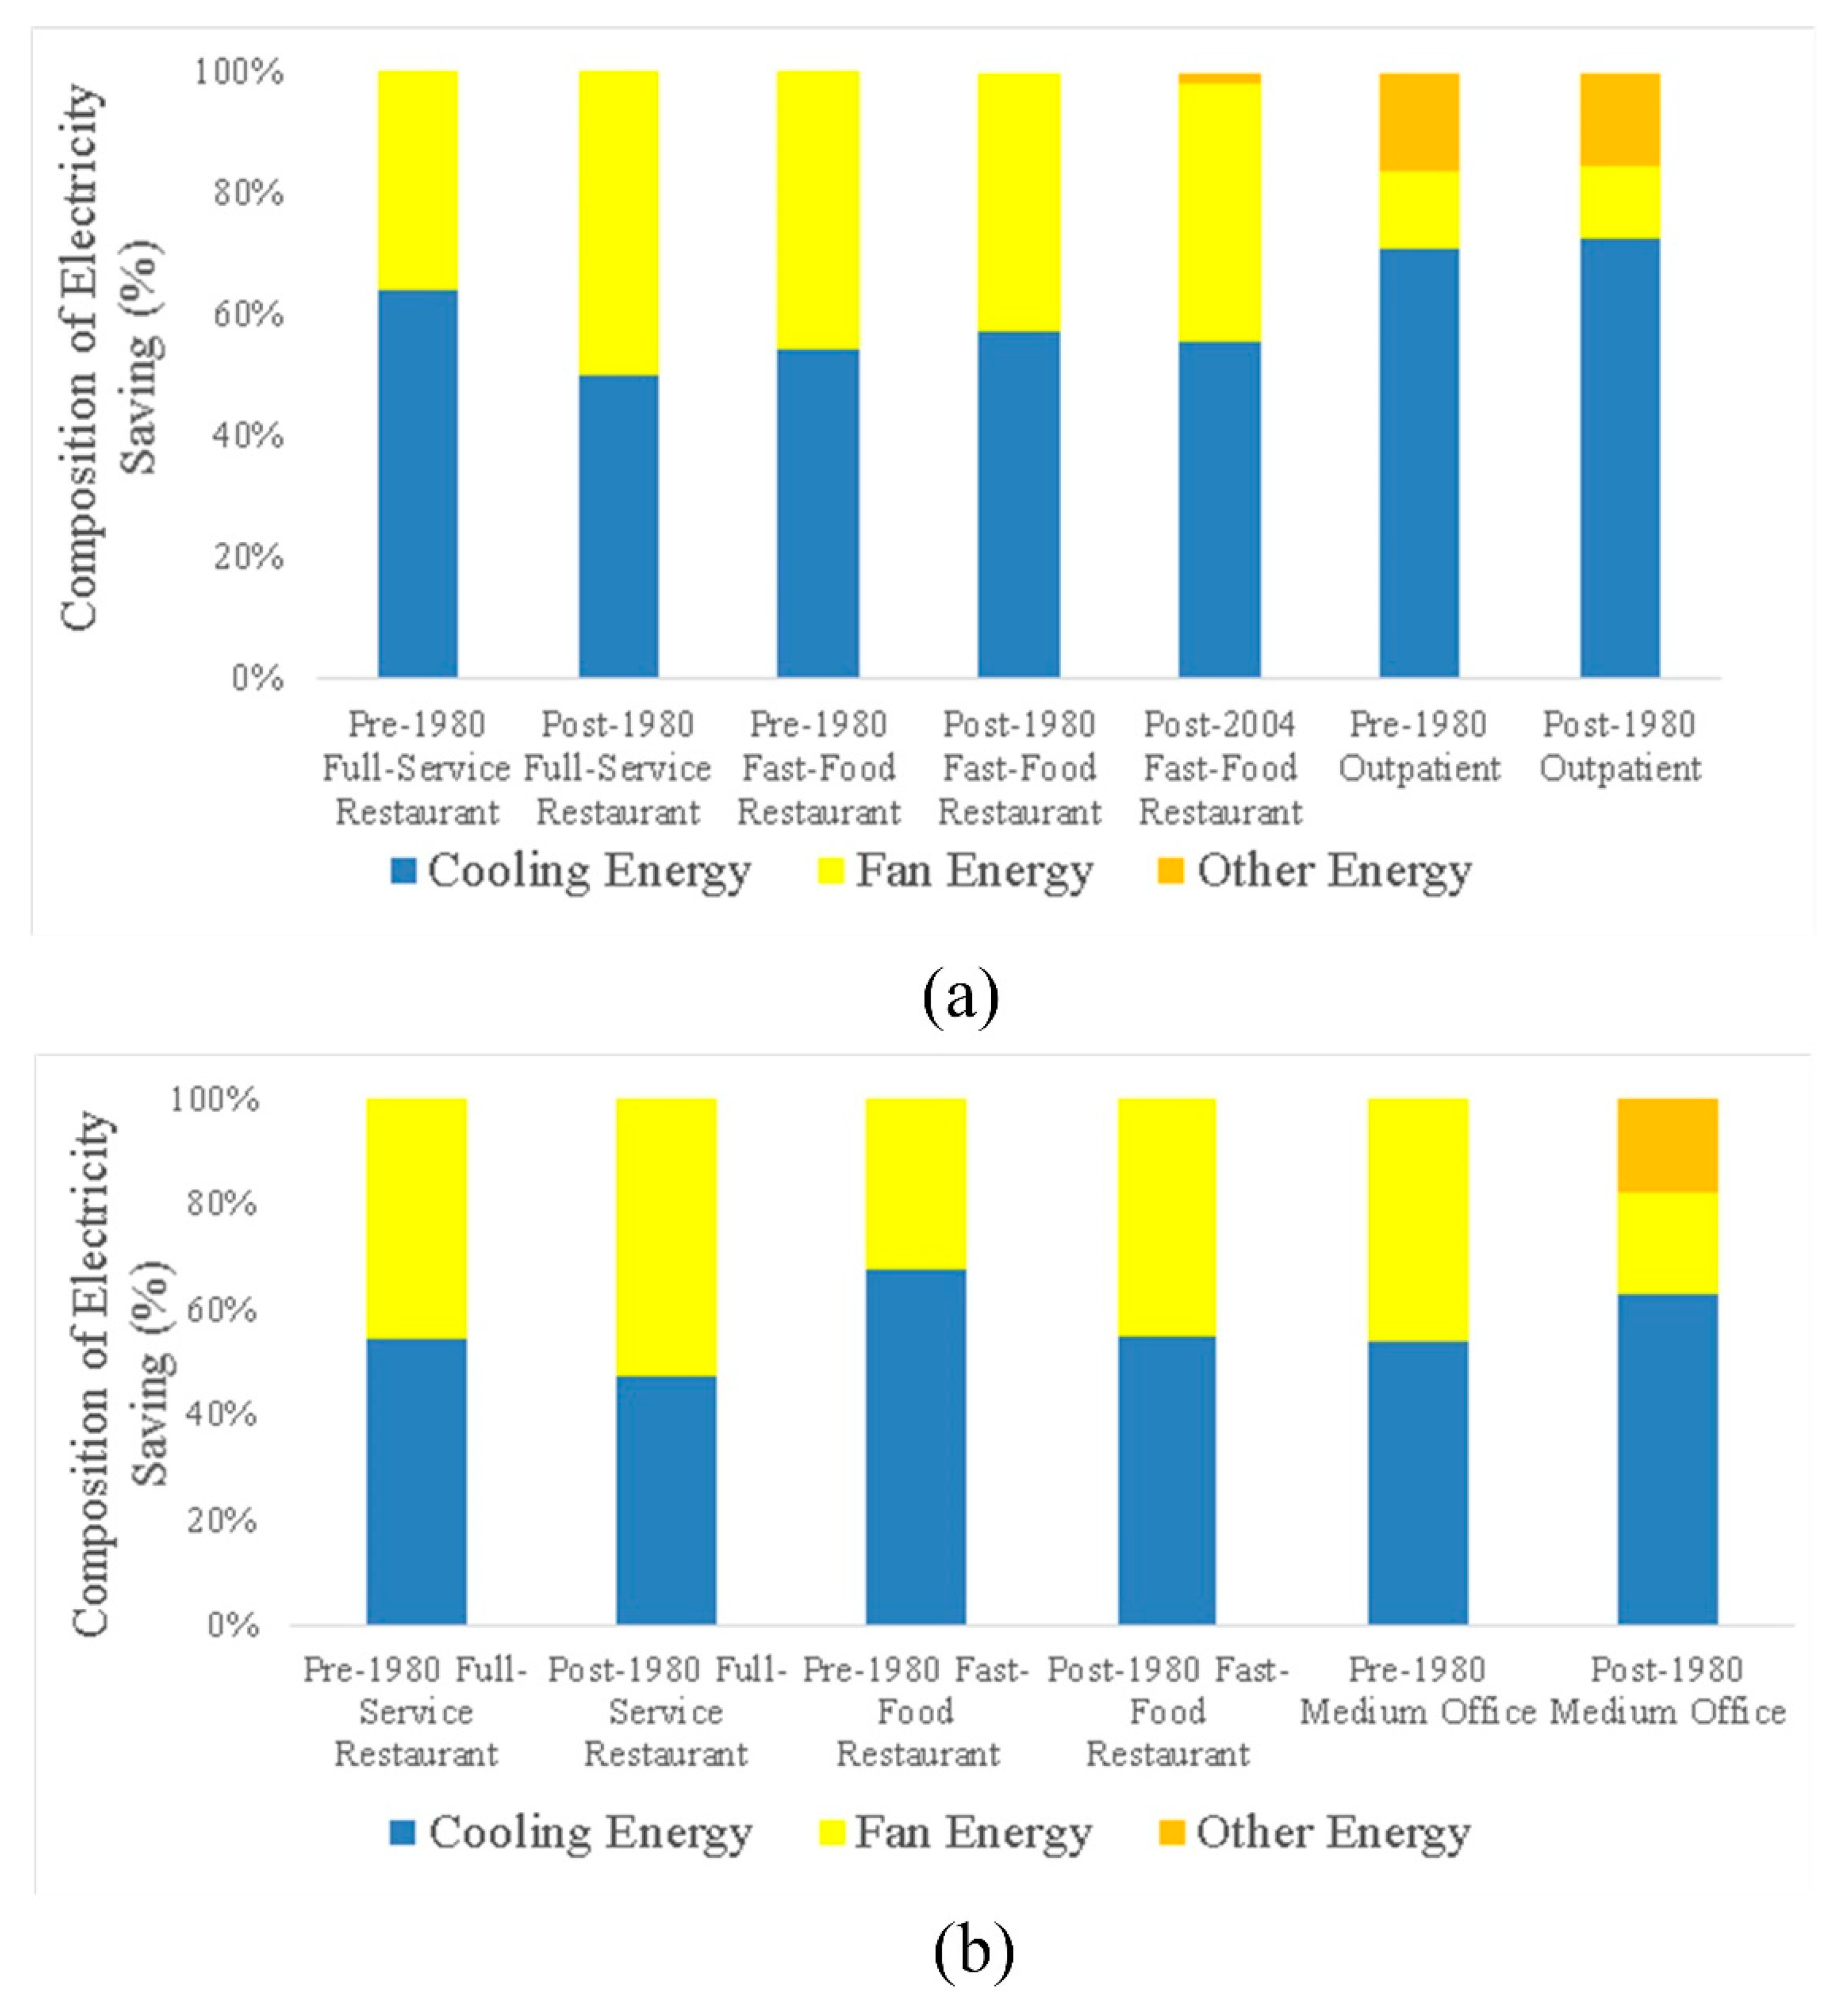
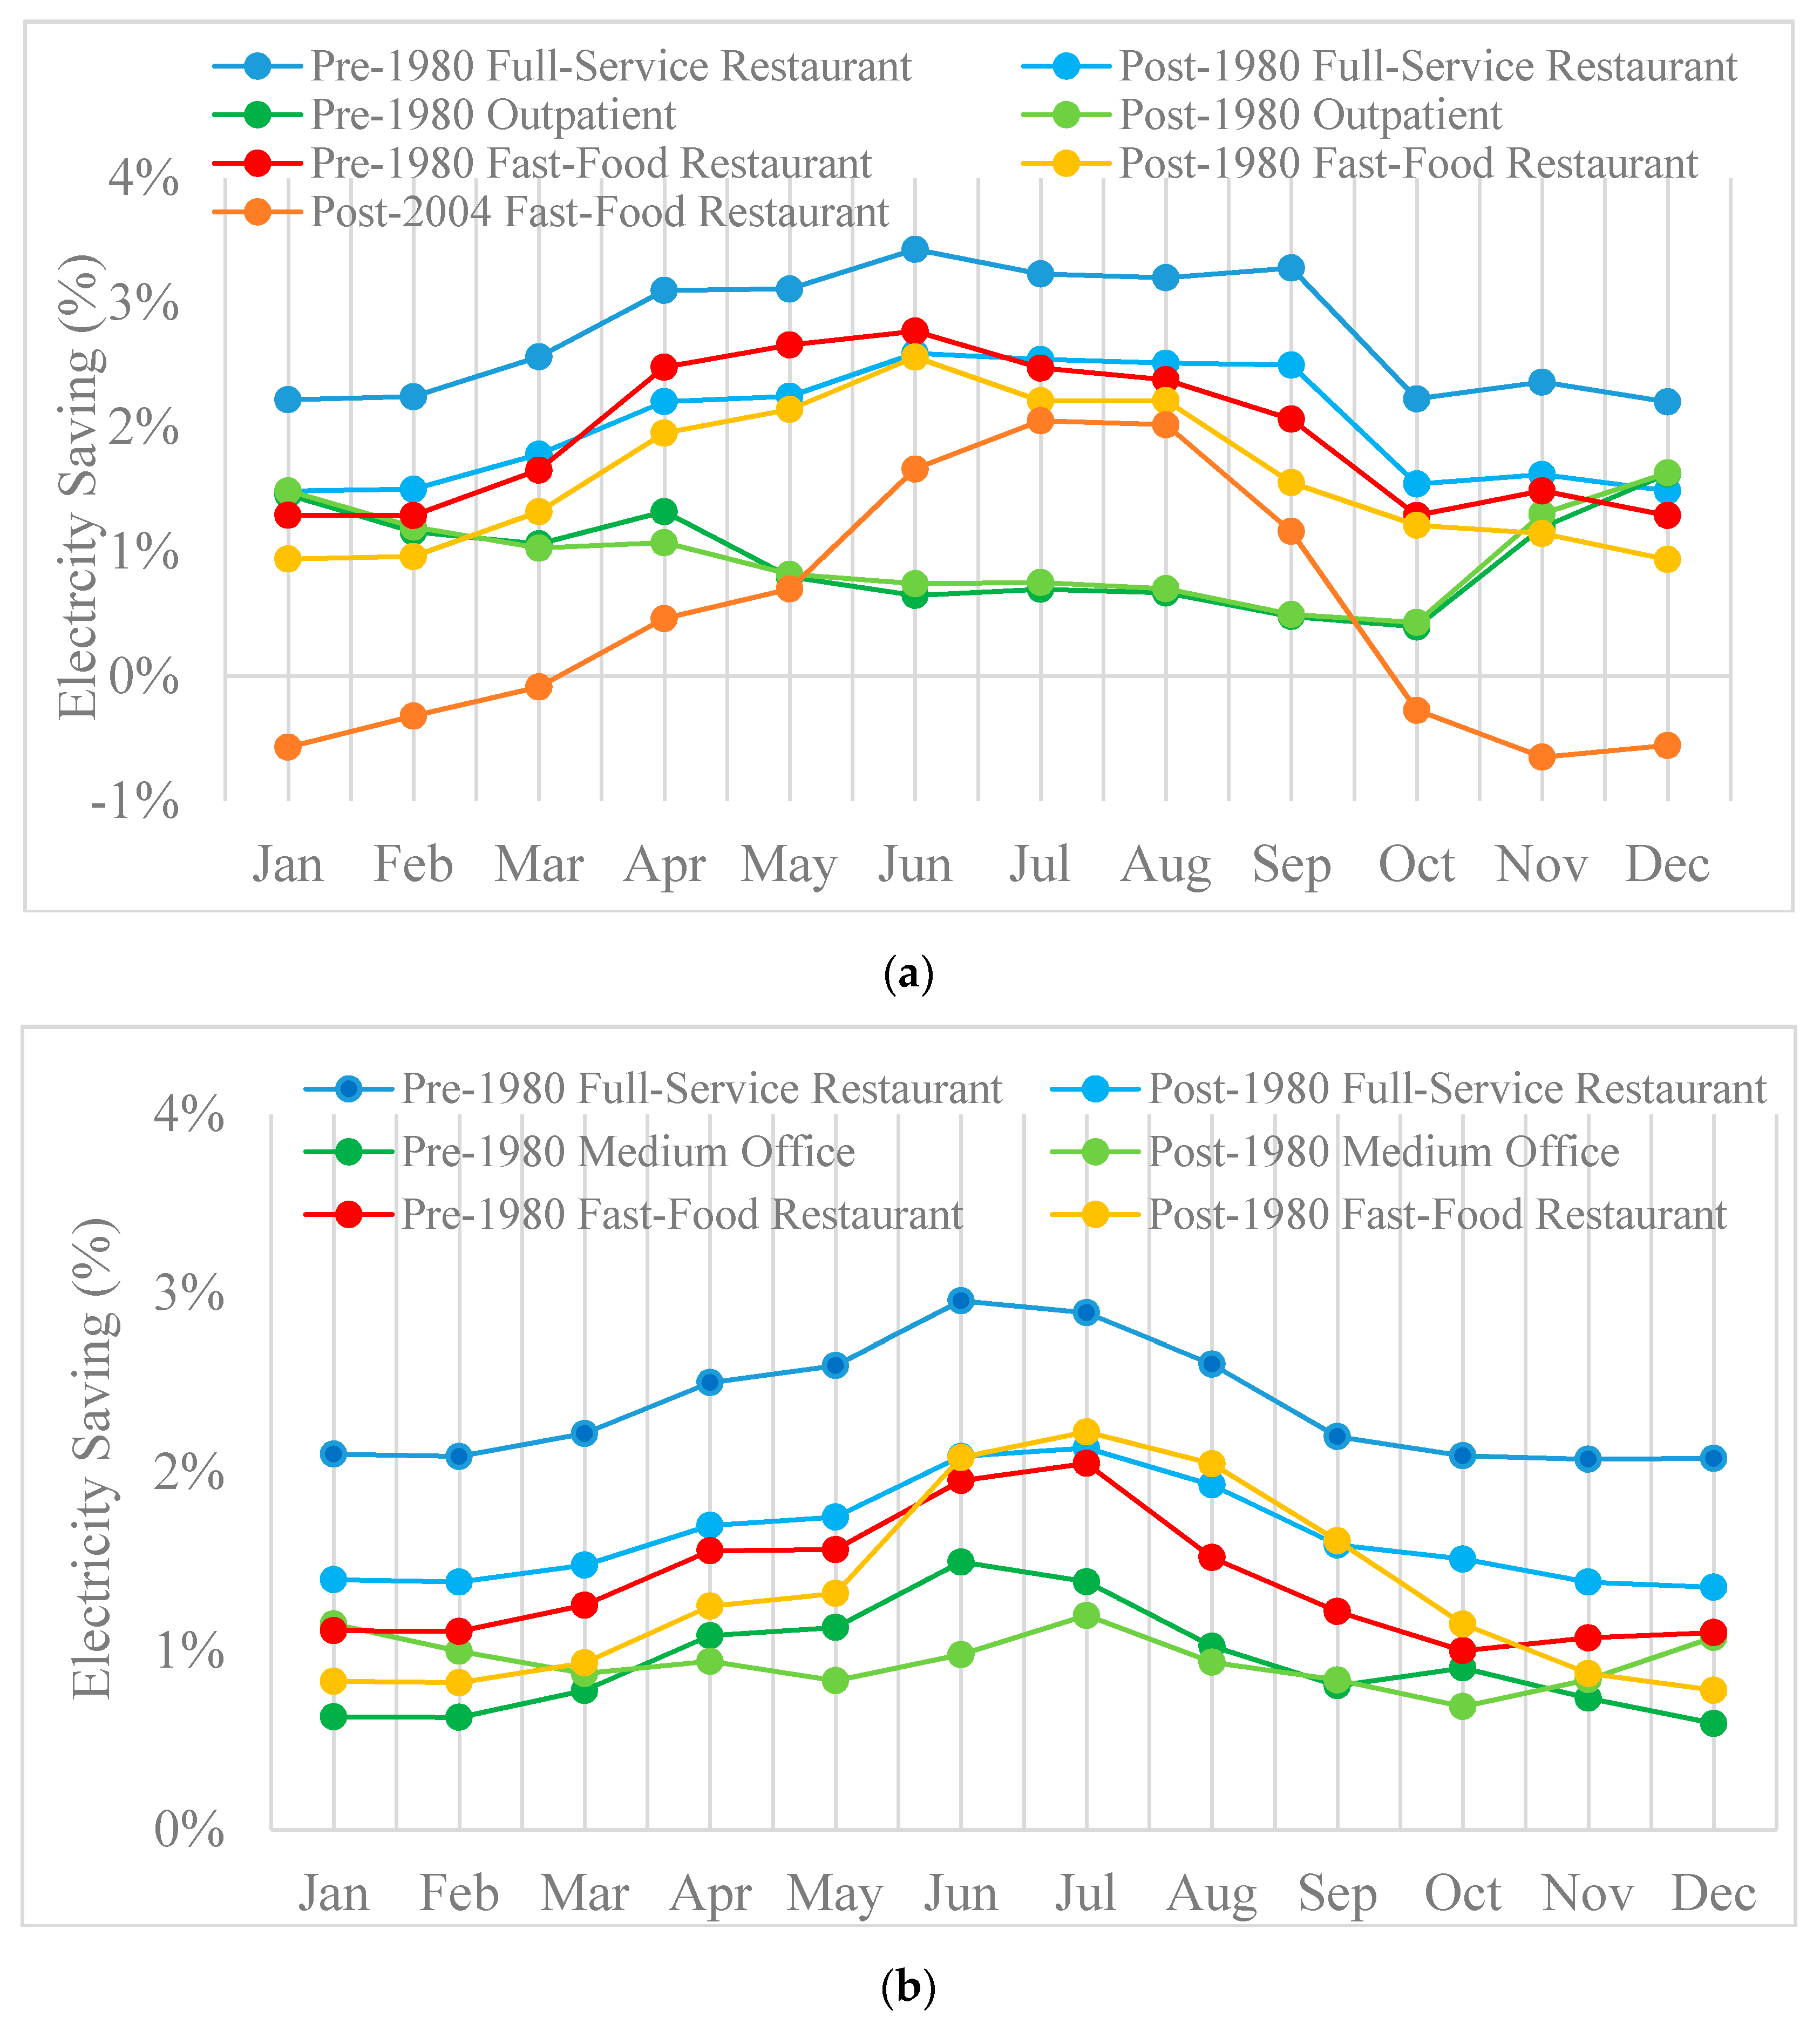
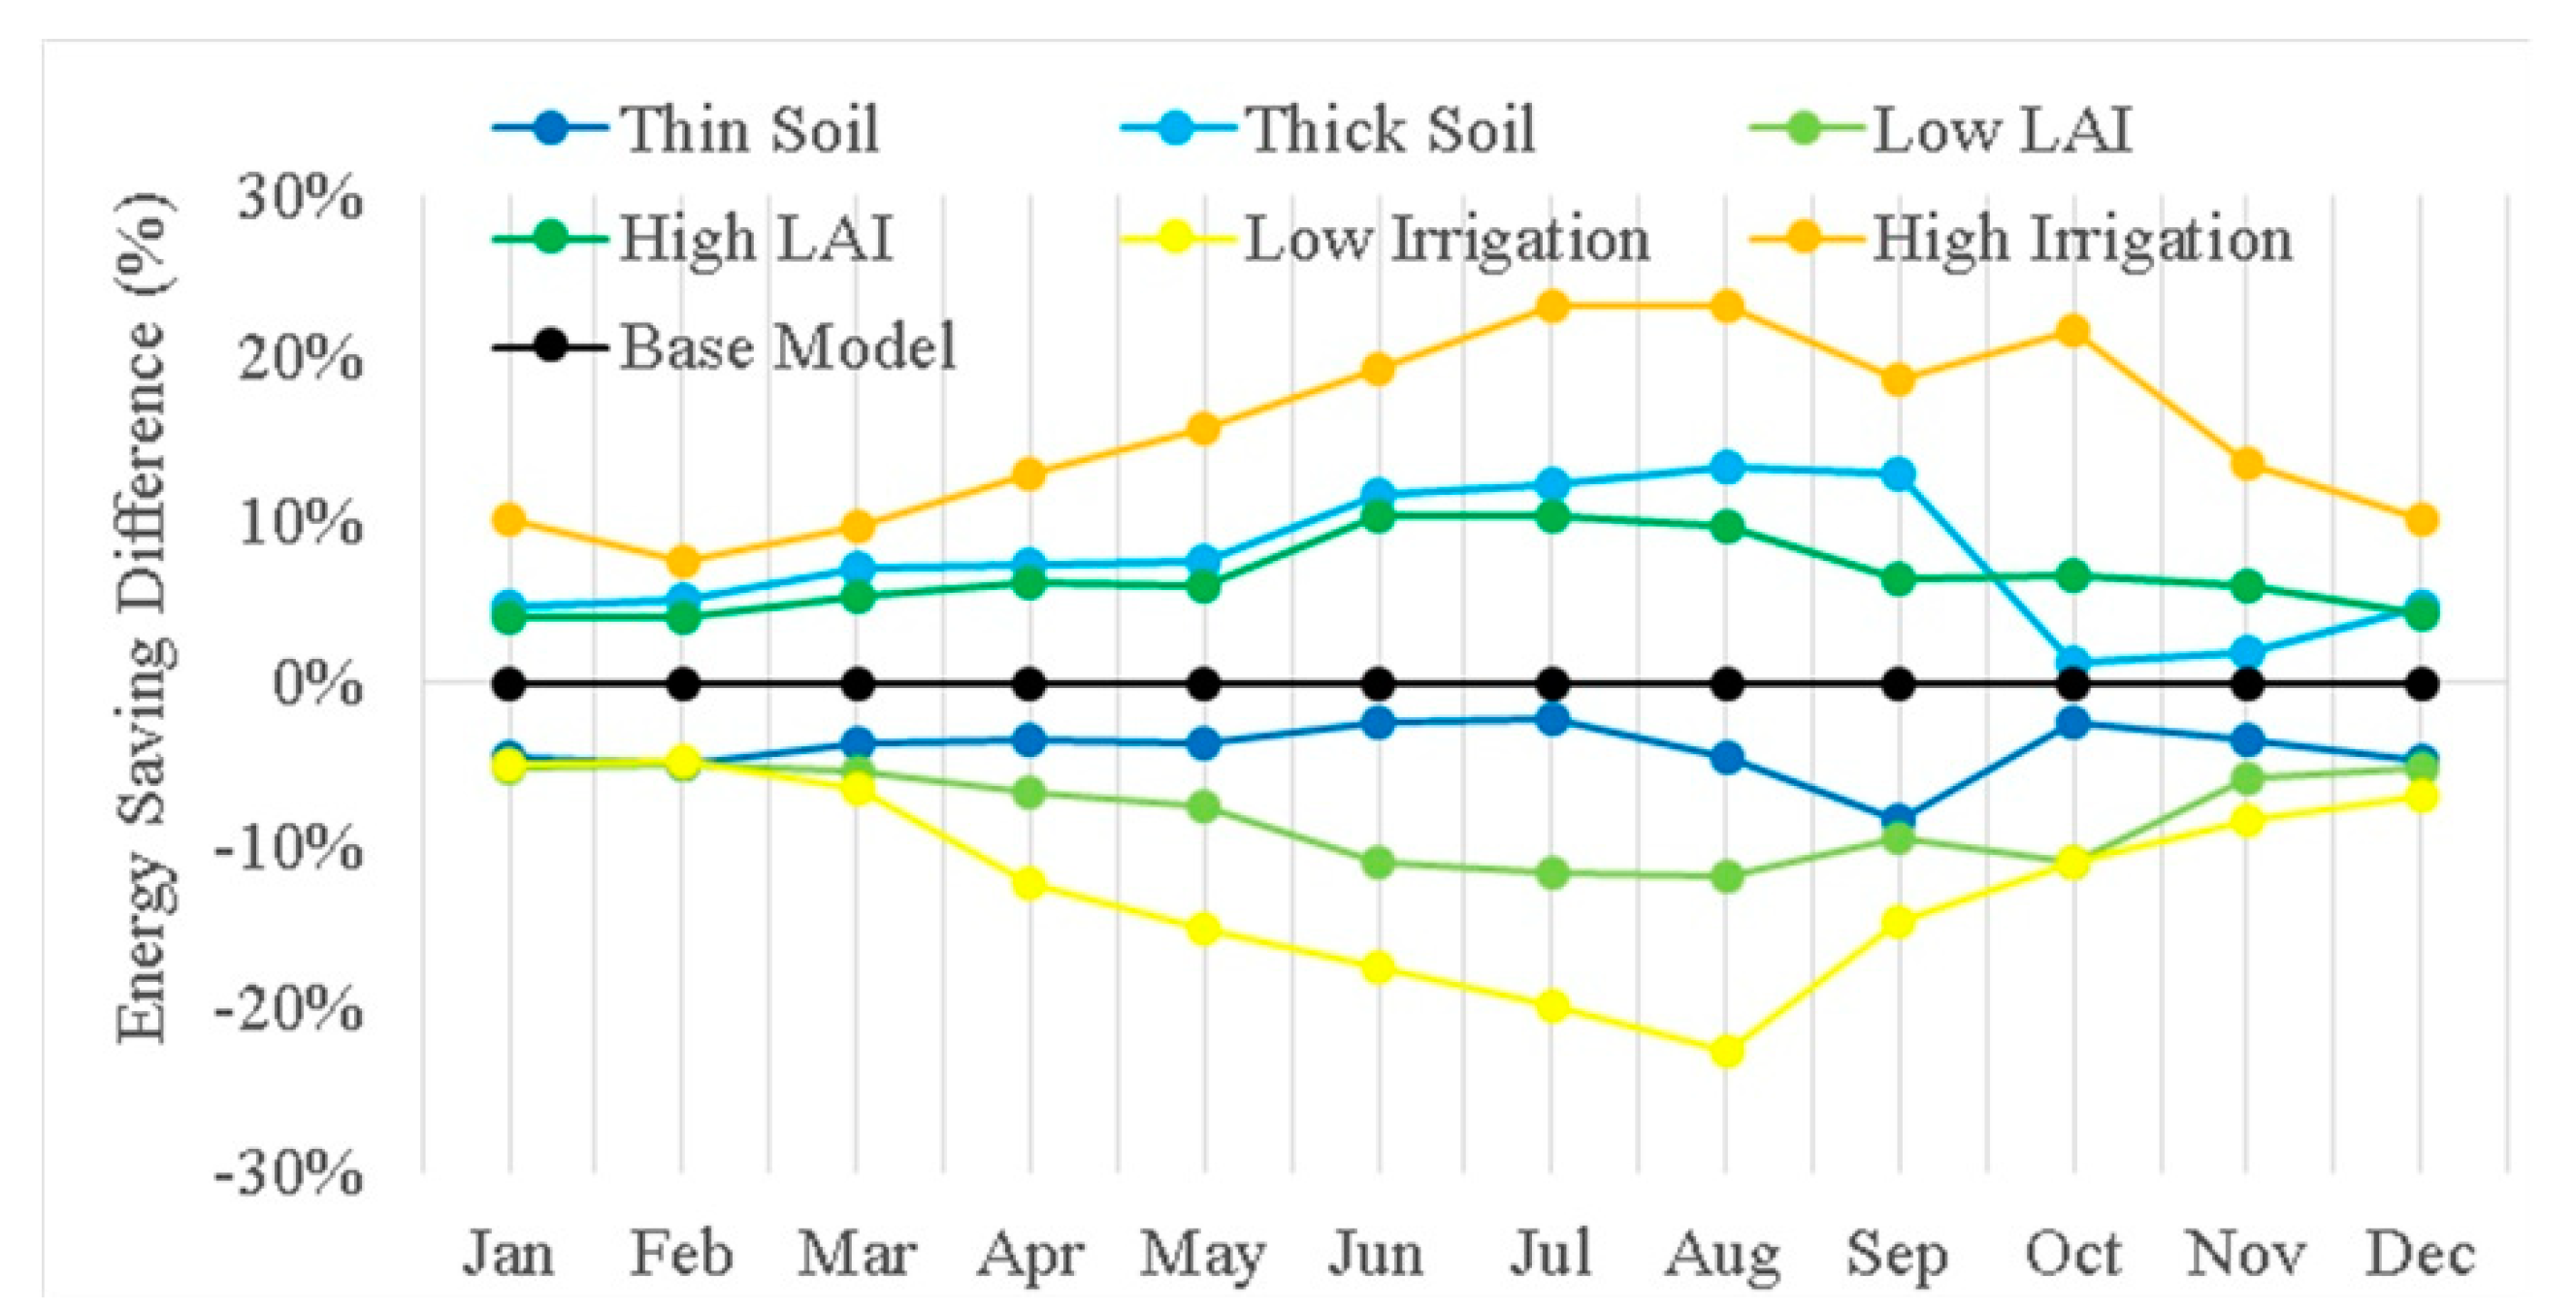
This section discusses the major findings, strengths, and limitations of the methodology used in this study compared with previously published works. All buildings with green roofs showed positive energy savings with regard to total energy and electricity, and the savings caused by green roofs were positively correlated with three key parameters: LAI, soil depth, and irrigation saturation percentage. Moreover, the majority of the electricity-saving benefits from green roofs were found in the HVAC systems. In addition, the energy-saving ability of green roofs did exhibit seasonality. The above findings agree with the results of previous studies [19,20,28,36,41]. However, this study further found that green roofs have different energy-saving abilities on different types of buildings with different technologies, which has received very little attention in previous studies. The two types of restaurants showed a higher degree of electricity and natural gas savings than the other building types, and less energy savings for newly constructed restaurants was also predicted.
The uncertainties in the green roof energy-saving simulation mainly arose from the limitations of the current green roof module in EnergyPlus. The latest version of the module does not have the option for users to input plant species that are widely used in green roofs. Using the current settings in the green roof module would ignore the fact that the LAI for some species may change slightly throughout the year, although this change would not significantly affect the simulation result. Moreover, there is no indicator that shows the settings are applicable to the real environment. For example, it was demonstrated that increased depth of soil layer can promote the energy-saving ability of green roofs. However, an increase in soil thickness will also increase the weight of the green roof, which may exceed the load-bearing capacity of some building roofs. In addition, the distance between PV and green roofs, which can affect PV-power production [39,40,41], cannot be set up using the current version of EnergyPlus. Therefore, this study followed the settings of Sailor [20], which were based on validated data from two monitored buildings with green roofs at Portland State University, Oregon, instead of applied the optimal settings.
To optimize the performance of PV-green roofs, experiments will need to be conducted at the individual building scale that take the local climate condition into consideration when determining the key parameters for the experiment. For example, irrigation and species selection can be essential because Los Angeles County has very low precipitation in summer. The three potential ways to reduce irrigation cost and water usage are to use drought-tolerant plant species, to apply efficient irrigation techniques, and to store rainwater for irrigation [21,27]. In addition to the roofs, the sides of buildings can also be utilized for building energy mitigation, as the benefits of wall-mounted PV-green systems, solar thermal collectors, and hybrid solar windows have been studied in previous studies [18,54].

5. Conclusions

This study discussed the potential mitigation effects of PV-green roofs on vulnerable buildings that are susceptible to the largest increases in energy demand under the context of climate change. Hypothesis 1 “The installation of PV-green roofs can reduce at least 20% of net building energy demand increase caused by climate change for all chosen types of test buildings, and the reduction extent will vary by building type” was partially supported. Reductions in the increased net building energy demand caused by climate change varied by building type, which ranged from 8.2% (pre-1980 outpatient building) to 299.2% (pre-1980 full-service restaurant). The reduction in the net building energy demand was found to exceed 20% in 11 of the 13 tested buildings. Hypothesis 2 “Building types that are predicted to have the highest energy demand increase caused by climate change receive the most benefits in terms of energy savings” was supported. In Zheng and Weng [
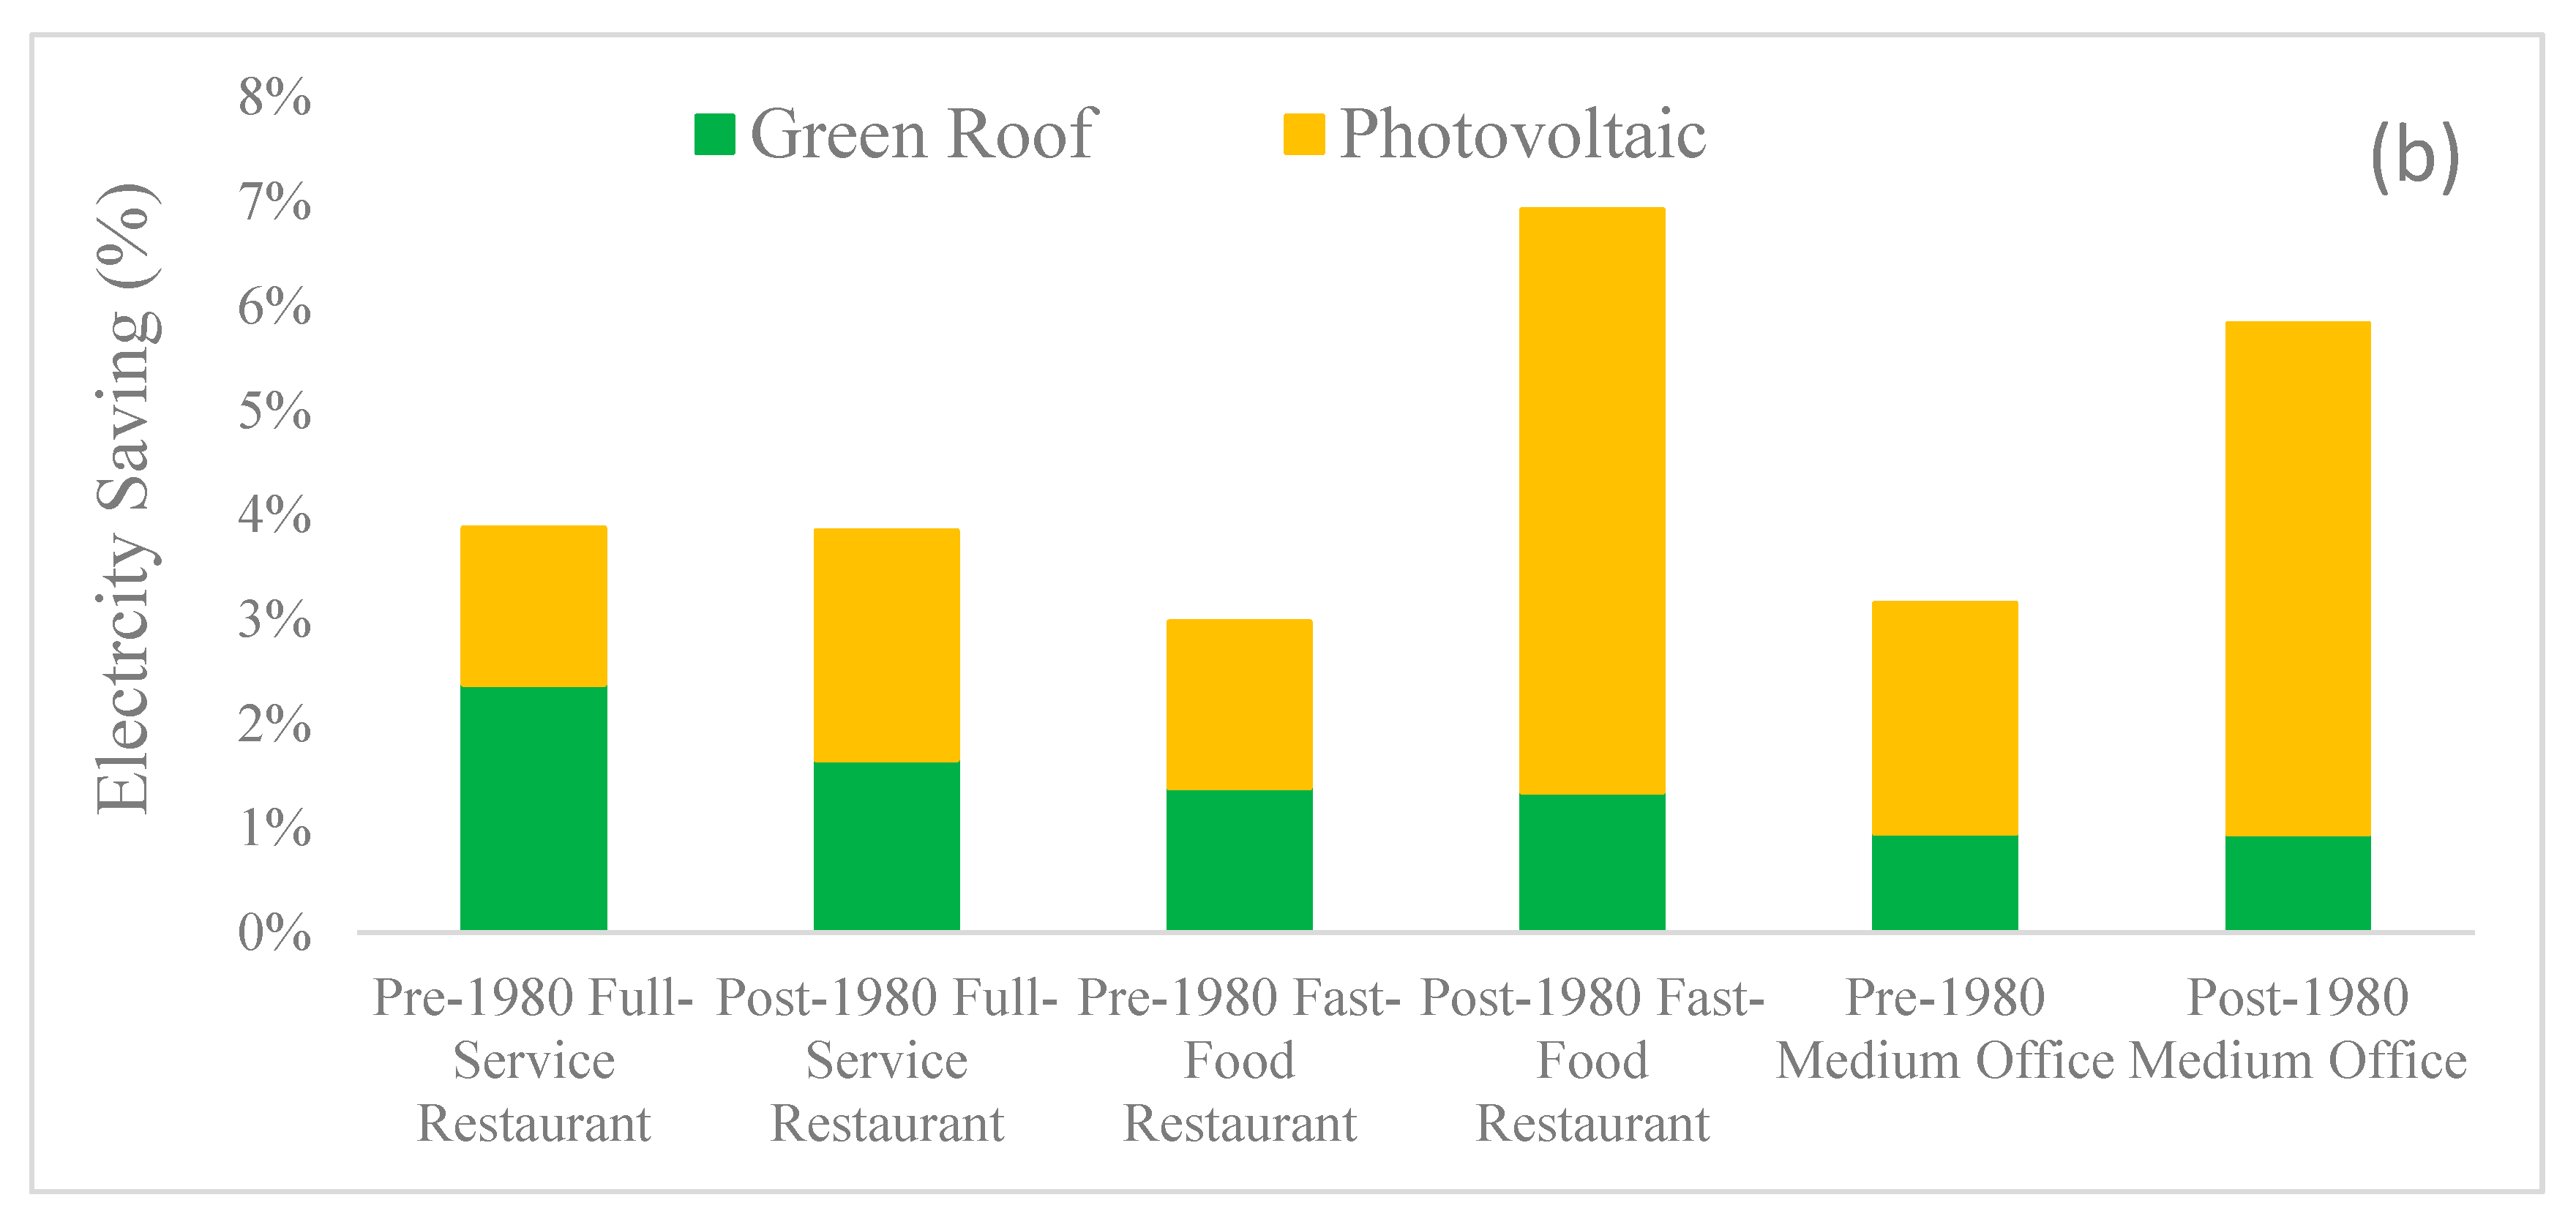
11], two types of restaurants (full-service and fast-food restaurants) were predicted to have the highest summer energy demand increase due to climate change. In this study, restaurants were predicted to have 112.5% to 299.5% reductions in the increased net energy demand due to climate change, much higher than the other types of buildings examined in this study. Moreover, all restaurants with PV-green roofs were predicted to consume less total energy in 2050 than at present even under the high-emission scenario (A1F1), indicated that they received the most benefits in terms of energy savings. All buildings with green roofs showed positive energy savings with regard to total energy and electricity, and the majority of the benefits in terms of electricity savings from green roofs were found in the HVAC systems. In addition, the energy-saving ability of green roofs did exhibit seasonality.
In the existing literature, the mitigation potential of increased building energy consumption caused by climate change have not been extensively discussed, and no experiments have been conducted to test the performance of mitigation options, such as sustainable roofs (green roofs, PV roofs, or PV-green roofs). Our study filled this gap by estimating the mitigation performance of PV-green roofs on buildings that are more vulnerable to climate change in terms of the increased energy demand. The main novelty of this study is that it examined factors, such as local climate conditions, the seasonal effect, building types, and building technologies, which might affect the energy-saving ability of PV-green roofs under the context of climate change. Moreover, the results of projected annual building energy consumption savings were combined with parameters used in the payback period and ROI estimation to analyze the social-economic benefits of installing PV-green roofs on all tested buildings. These results provide valuable information to guide future policymaking. For example, irrigation was found to be the most important factor in electricity savings, which reached its maximum in summer when the Los Angeles Basin experienced high temperature with little precipitation. Our approach has strong applicability due to the fact that all datasets used were publicly available, so it can be used to test buildings in any area.
Future studies can achieve higher modeling accuracy under the context of the development of “Geospatial big data” because the spatial and temporal scales of the data available to the public are expected to become finer in the future. For example, Building Information Modeling (BIM) data, which is an intelligent 3D model-based building dataset, are under development in many cities. The 3D BIM data contain a greater level of detail for each individual building than the 2D building shapefile used in this study. Information such as materials, structures, specific models of HVAC systems, and drainage systems will become available. The integration of BIM and GIS will increase the accuracy of energy consumption simulations and provide more options to customize PV-green roofs at the individual building level. For example, this integration would allow decision-makers and designers to run sensitivity tests while considering different combinations of input parameters, such as types of plants, local water availability, irrigation investments, types of blinds, and facing directions of windows to determine the best option.

Author Contributions

Y.Z. and Q.W. conceived and designed the research; Y.Z. wrote the first draft; Q.W. revised and edited the paper. Both authors approved the final manuscript. All authors have read and agreed to the published version of the manuscript.

Funding

This research received no external funding.

Conflicts of Interest

The authors declare no conflict of interest.

References

  1. Hamilton, I.G.; Davies, M.; Steadman, P.; Stone, A.; Ridley, I.; Evans, S. The significance of the anthropogenic heat emissions of London’s buildings: A comparison against captured shortwave solar radiation. Build. Environ. 2009, 44, 807–817. [Google Scholar] [CrossRef]
  2. Sailor, D.J.; Lu, L. A top–down methodology for developing diurnal and seasonal anthropogenic heating profiles for urban areas. Atm. Environ. 2004, 38, 2737–2748. [Google Scholar] [CrossRef]
  3. Zheng, Y.; Weng, Q. High spatial- and temporal- resolution anthropogenic heat discharge estimation in Los Angeles County, California. J. Environ. Manag. 2018, 206, 1274–1286. [Google Scholar] [CrossRef] [PubMed]
  4. Fan, H.; Sailor, D.J. Modeling the impacts of anthropogenic heating on the urban climate of Philadelphia: A comparison of implementations in two PBL schemes. Atm. Environ. 2005, 39, 73–84. [Google Scholar] [CrossRef]
  5. Ohashi, Y.; Genchi, Y.; Kondo, H.; Kikegawa, Y.; Hirano, Y.; Yoshikado, H. A study of horizontal temperature distribution within urban canopy layer at the Tokyo central area. In Proceedings of the Fifth International Conference on Urban Climate, Lodz, Poland, 1–5 September 2003. [Google Scholar]
  6. Wong, N.H.; Jusuf, S.K.; Syafii, N.I.; Li, W.H.; Tan, A.Y.K. Simulation of the impact of climate change on the current building’s residential envelope thermal transfer value (ETTV) regulation in Singapore. In Proceedings of the International Conference on Sustainable Design and Construction 2011, Kansas City, MO, USA, 23–25 March 2011; pp. 34–42. [Google Scholar]
  7. United States Department of Energy. 2011 Buildings Energy Data Book; United States Department of Energy: Washington, DC, USA, 2011. Available online: https://ieer.org/resource/energy-issues/2011-buildings-energy-data-book/ (accessed on 16 August 2018).
  8. Huang, J.; Gurney, K.R. The variation of climate change impact on building energy consumption to building type and spatiotemporal scale. Energy 2016, 111, 137–153. [Google Scholar] [CrossRef] [Green Version]
  9. Wang, H.; Chen, Q. Impact of climate change heating and cooling energy use in buildings in the United States. Energy Build. 2014, 82, 428–436. [Google Scholar] [CrossRef] [Green Version]
  10. Zhou, Y.; Eom, J.; Clarke, L. The effect of global climate change, population distribution, and climate mitigation on building energy use in the U.S. and China. Clim. Chang. 2013, 119, 979–992. [Google Scholar] [CrossRef]
  11. Zheng, Y.; Weng, Q. Modeling the effect of climate change on building energy demand in Los Angeles County by using a GIS-based high spatial- and temporal-resolution approach. Energy 2019, 176, 641–655. [Google Scholar] [CrossRef]
  12. Dimond, K.; Webb, A. Sustainable roof selection: Environmental and contextual factors to be considered in choosing a vegetated roof or rooftop solar photovoltaic system. Sustain. Cities Soc. 2017, 35, 241–249. [Google Scholar] [CrossRef]
  13. Tang, X.; Qu, M. Phase change and thermal performance analysis for green roofs in cold climates. Energy Build. 2016, 121, 165–175. [Google Scholar] [CrossRef]
  14. Mohajerani, A.; Bakaric, J.; Jeffrey-Bailey, T. The urban heat island effect, its causes, and mitigation, with reference to the thermal properties of asphalt concrete. J. Environ. Manag. 2017, 197, 522–538. [Google Scholar] [CrossRef] [PubMed]
  15. Wang, Y.; Akbari, H.; Chen, B. Urban geometry and environmental urban policy development. Procedia Eng. 2016, 169, 308–315. [Google Scholar] [CrossRef]
  16. Wang, Y.; Akbari, H. The effects of street tree planting on Urban Heat Island mitigation in Montreal. Sustain. Cities Soc. 2016, 27, 122–128. [Google Scholar] [CrossRef]
  17. Li, X.; Ratti, C. Mapping the spatial distribution of shade provision of street trees in Boston using Google Street View panoramas. Urban For. Urban Green. 2018, 31, 109–119. [Google Scholar] [CrossRef]
  18. Moren, M.S.P.; Korjenic, A. Green buffer space influences on the temperature of photovoltaic modules: Multifunctional system: Building greening and photovoltaic. Energy Build. 2017, 146, 364–382. [Google Scholar] [CrossRef]
  19. Morakinyo, T.E.; Dahanayake, K.W.D.K.C.; Ng, E.; Chow, C.L. Temperature and cooling demand reduction by green-roof types in different climates and urban densities: A co-simulation parametric study. Energy Build. 2017, 145, 226–237. [Google Scholar] [CrossRef]
  20. Sailor, D.J. A green roof model for building energy simulation programs. Energy Build. 2008, 40, 1466–1478. [Google Scholar] [CrossRef]
  21. Shafique, M.; Kim, R.; Rafiq, M. Green roof benefits, opportunities and challenges—A review. Renew. Sustain. Energy Rev. 2018, 90, 757–773. [Google Scholar] [CrossRef]
  22. Susca, T.; Gaffin, S.R.; Dell’osso, G.R. Positive effects of vegetation: Urban heat island and green roofs. Environ. Pollut. 2011, 159, 2119–2126. [Google Scholar] [CrossRef]
  23. Lukač, N.; Žalik, B. GPU-based roofs’ solar potential estimation using LiDAR data. Comput. Geosci. 2013, 52, 34–41. [Google Scholar] [CrossRef]
  24. Zheng, Y.; Weng, Q. Assessing solar potential of commercial and residential buildings in Indianapolis using LiDAR and GIS modeling. In Proceedings of the 2014 3rd International Workshop on Earth Observation and Remote Sensing Applications, Changsha, China, 11–14 June 2014; pp. 398–402. [Google Scholar]
  25. Alcazar, S.S.; Olivieri, F.; Neila, J. Green roofs: Experimental and analytical study of its potential for urban microclimate regulation in Mediterranean-continental climates. Urban Clim. 2016, 17, 304–317. [Google Scholar] [CrossRef]
  26. Catalano, C.; Marcenò, C.; Laudicina, V.A.; Guarino, R. Thirty years unmanaged green roofs: Ecological research and design implications. Landsc. Urban Plan. 2016, 149, 11–19. [Google Scholar] [CrossRef]
  27. Heusinger, J.; Sailor, D.J.; Weber, S. Modeling the reduction of urban excess heat by green roofs with respect to different irrigation scenarios. Build. Environ. 2018, 131, 174–183. [Google Scholar] [CrossRef]
  28. Semaan, M.; Pearce, A. Assessment of the Gains and Benefits of Green Roofs in Different Climates. Procedia Eng. 2016, 145, 333–339. [Google Scholar] [CrossRef] [Green Version]
  29. Yang, J.; Kumar, D.L.M.; Pyrgou, A.; Chong, A.; Santamouris, M.; Kolokotsa, D.; Lee, S.E. Green and cool roofs’ urban heat island mitigation potential in tropical climate. Sol. Energy 2018, 173, 597–609. [Google Scholar] [CrossRef]
  30. Herrera-Gomez, S.S.; Quevedo-Nolasco, A.; Pérez-Urrestarazu, L. The role of green roofs in climate change mitigation. A case study in Seville (Spain). Build. Environ. 2017, 123, 575–584. [Google Scholar] [CrossRef]
  31. Chemisana, D.; Lamnatou, C. Photovoltaic-green roofs: An experimental evaluation of system performance. Appl. Energy 2014, 119, 246–256. [Google Scholar] [CrossRef]
  32. Lamera, C.; Becciu, G.; Rulli, M.C.; Rosso, R. Green roofs effects on the urban water cycle components. Procedia Eng. 2014, 70, 988–997. [Google Scholar] [CrossRef] [Green Version]
  33. Lamnatou, C.; Chemisana, D. Photovoltaic-green roofs: A life cycle assessment approach with emphasis on warm months of Mediterranean climate. J. Clean. Prod. 2014, 72, 57–75. [Google Scholar] [CrossRef]
  34. Scherba, A.; Sailor, D.J.; Rosenstiel, T.N.; Wamser, C.C. Modeling impacts of roof reflectivity, integrated photovoltaic panels and green roof systems on sensible heat flux into the urban environment. Build. Environ. 2011, 46, 2542–2551. [Google Scholar] [CrossRef]
  35. Lamnatou, C.; Chemisana, D. A critical analysis of factors affecting photovoltaic-green roof performance. Renew. Sustain. Energy Rev. 2015, 43, 264–280. [Google Scholar] [CrossRef]
  36. Schindler, B.Y.; Blaustein, L.; Lotan, R.; Shalom, H.; Kadas, G.J.; Seifan, M. Green roof and photovoltaic panel integration: Effects on plant and arthropod diversity and electricity production. J. Environ. Manag. 2018, 225, 288–299. [Google Scholar] [CrossRef] [PubMed]
  37. Ramshani, M.; Khojandi, A.; Li, X.; Omitaomu, O. Optimal planning of the joint placement of photovoltaic panels and green roofs under climate change uncertainty. Omega 2020, 90, 101986. [Google Scholar] [CrossRef]
  38. Jahanfar, A.; Drake, J.; Gharabaghi, B.; Sleep, B. An experimental and modeling study of evapotranspiration from integrated green roof photovoltaic systems. Ecol. Eng. 2020, 152, 105767. [Google Scholar] [CrossRef]
  39. Shafique, M.; Xiaowei, L.; Jian, Z. Photovoltaic-green roofs: A review of benefits, limitations, and trends. Sol. Energy 2020, 202, 485–497. [Google Scholar] [CrossRef]
  40. Osma-Pinto, G.; Ordonez-Plata, G. Measuring factors influencing performance of rooftop PV panels in warm tropical climates. Sol. Energy 2019, 185, 112–123. [Google Scholar] [CrossRef]
  41. Osma, G.; Ordonez, G.; Hernandez, E.; Quintero, L.; Torres, M. The impact of height installation on the performance of PV panels integrated into a green roof in tropical conditions. In Energy Production and Management in the 21st Century II: The Quest for Sustainable Energy; WIT Press: Southampton, UK, 2016; Volume 205, pp. 147–156. [Google Scholar] [CrossRef] [Green Version]
  42. Sailor, D.J.; Elley, T.B.; Gibson, M. Exploring the building energy impacts of green roof design decisions—A modeling study of buildings in four distinct climates. J. Build. Phys. 2012, 35, 372–391. [Google Scholar] [CrossRef]
  43. United States Department of Energy. Cool Roofs. Available online: https://www.energy.gov/energysaver/energy-efficient-home-design/cool-roofs (accessed on 16 August 2018).
  44. Cellura, M.; Guarino, F.; Longo, S.; Tumminia, G. Climate change and the building sector: Modelling and energy implications to an office building in southern Europe. Energy Sustain. Dev. 2018, 45, 46–65. [Google Scholar] [CrossRef]
  45. Sathaye, J.A.; Dale, L.L.; Larsen, P.H.; Fitts, G.A.; Koy, K.; Lewis, S.M.; de Lucena, A.F.P. Estimating Risk to California Energy Infrastructure form Projected Climate Change (Publication No. CEC-500-2012-057). Available online: https://eta.lbl.gov/publications/estimating-risk-california-energy (accessed on 16 August 2018).
  46. United States Census Bureau. Available online: https://www.census.gov/quickfacts/fact/table/losangelescountycalifornia/PST045218 (accessed on 16 August 2018).
  47. Google Project Sunroof. Available online: https://www.google.com/get/sunroof (accessed on 16 August 2018).
  48. Intergovernmental Panel on Climate Change. Climate Change 2014: Synthesis Report; Cambridge University Press: New York City, NY, USA, 2014. [Google Scholar]
  49. Gargari, C.; Bibbiani, C.; Fantozzi, F.; Campiotti, C.A. Environmental Impact of Green Roofing: The Contribute of a Green Roof to the Sustainable use of Natural Resources in a Life Cycle Approach. Agric. Agric. Sci. Procedia 2016, 8, 646–656. [Google Scholar] [CrossRef]
  50. Sailor, D.J.; Brooks, A.; Hart, M.; Heiple, S. A bottom-up approach for estimating latent and sensible heat emissions from anthropogenic sources. In Proceedings of the 7th Symposium on the Urban Environment, San Diego, CA, USA, 10–13 September 2007. [Google Scholar]
  51. Silva, C.M.; Gomes, M.G.; Silva, M. Green roofs energy performance in Mediterranean climate. Energy Build. 2016, 116, 318–325. [Google Scholar] [CrossRef]
  52. Bianchini, F.; Hewage, K. Probabilistic social cost-benefit analysis for green roofs: A lifecycle approach. Build. Environ. 2012, 58, 152–162. [Google Scholar] [CrossRef]
  53. LoopNet. Available online: https://www.loopnet.com/ (accessed on 1 January 2019).
  54. Ulavi, T.; Hebrink, T.; Davidson, J.H. Analysis of a Hybrid Solar Window for Building Integration. Energy Procedia 2014, 57, 1941–1950. [Google Scholar] [CrossRef] [Green Version]
Figure 1. The structure of a green roof (a); and green roof mounted with rooftop solar photovoltaic (PV) systems (b).
Remotesensing 12 02402 g001
Figure 2. The location of the two study sites for evaluation of green roofs and photovoltaic panels on building Energy Savings: Glendale and Koreatown, Los Angeles County, California, USA.
Remotesensing 12 02402 g002
Figure 3. The method used to analyze the potential mitigation effect of green and PV-green roofs on building energy demand caused by climate change.
Remotesensing 12 02402 g003
Figure 4. Annual energy savings (MJ/m2) for green roofs on the tested buildings compared to traditional roofs under the A1F1 emission scenario in 2050: (a) Glendale; (b) Koreatown.
Remotesensing 12 02402 g004
Figure 5. Percentage breakdown (%) of the individual components contributing to the simulated annual electricity savings from green roofs compared with traditional roofs under the A1F1 emission scenario in 2050: (a) Glendale; (b) Koreatown.
Remotesensing 12 02402 g005
Figure 6. Percentage (%) of annual electricity savings from the integration of green roofs and photovoltaic systems compared with traditional roofs under the A1F1 emission scenario in 2050: (a) Glendale; (b) Koreatown.
Remotesensing 12 02402 g006aRemotesensing 12 02402 g006b
Figure 7. Percentage (%) of monthly electricity savings from green roofs compared with traditional roofs under the A1F1 emission scenario in 2050: (a) Glendale; (b) Koreatown.
Remotesensing 12 02402 g007
Figure 8. Differences (%) in monthly electricity savings for various green roof settings applied to the selected full-service restaurant constructed before 1980 under the A1F1 emission scenario in 2050 in Glendale, Los Angeles County, USA.
Remotesensing 12 02402 g008
Table 1. Datasets used in this study and data sources.
DataSource
Los Angeles countywide building outline datasetLos Angeles County Data Portal
Building prototypesU.S. Department of Energy
Los Angeles County neighborhood shapefilesLos Angeles County Enterprise GIS
Typical meteorological year weather dataNational Solar Radiation Database
Solar potential dataGoogle Project Sunroof website
Table 2. Selected buildings for performance evaluation of PV-green roof mitigation effects on potential building energy savings.
Area (m2)Number of FloorsTypeNeighborhoodAge
10571Full-Service RestaurantGlendaleBefore 1980
3041Fast-Food RestaurantGlendale1980–2003
2901Full-Service RestaurantGlendale1980–2003
1381Fast-food RestaurantGlendaleBefore 1980
3521Fast-Food RestaurantGlendaleAfter 2004
8761OutpatientGlendale1980–2003
1861OutpatientGlendaleBefore 1980
2191Fast-Food RestaurantKoreatownBefore 1980
3531Full-Service RestaurantKoreatownBefore 1980
4671Full-Service RestaurantKoreatown1980–2003
4551Fast-Food RestaurantKoreatown1980–2003
5873Medium OfficeKoreatownBefore 1980
8283Medium OfficeKoreatown1980–2003
Table 3. Simulation of annual electricity produced by photovoltaic panels in 2050 for the tested buildings under the A1F1 emission scenario.
IDAvailable Area for Photovoltaic System Installation (m2)Simulated Annual Electricity Produced by the Photovoltaic System in Gigajoules (GJ)
118355.84
23911.63
35416.69
4298.62
56519
6425127.02
75716.62
84212.82
97320.52
109929.62
1113939.55
1225374.4
13549160.34
Table 4. Relative change (%) in annual total energy demand between 2050 and present (1991–2005) in all tested buildings under A1F1 emission scenario.
Building TypeNeighborhoodRC (Traditional Roof) (%)RC (PV-green Roof) (%)
Pre-1980 Full-Service RestaurantGlendale1.3%−2.6%
Post-1980 Full-Service RestaurantGlendale1.7%−0.2%
Pre-1980 Fast-Food RestaurantGlendale1.6%−0.9%
Post-1980 Fast-Food RestaurantGlendale1.1%−1.6%
Post-2004 Fast-Food RestaurantGlendale1.0%−0.2%
Pre-1980 OutpatientGlendale5.1%4.7%
Post-1980 OutpatientGlendale5.8%4.7%
Pre-1980 Full-Service RestaurantKoreatown1.0%−1.3%
Post-1980 Full-Service RestaurantKoreatown1.3%−0.9%
Pre-1980 Fast-Food RestaurantKoreatown1.1%−0.8%
Post-1980 Fast-Food RestaurantKoreatown0.6%−3.2%
Pre-1980 Medium OfficeKoreatown9.5%6.1%
Post-1980 Medium OfficeKoreatown7.8%1.5%
Table 5. Relative change (%) in annual electricity energy demand between 2050 and present (1991–2005) in all tested buildings under the A1F1 emission scenario.
Building TypeNeighborhoodRC (Traditional Roof) (%)RC (PV-green Roof) (%)
Pre-1980 Full-Service RestaurantGlendale9.9%2.8%
Post-1980 Full-Service RestaurantGlendale9.5%6.0%
Pre-1980 Fast-Food RestaurantGlendale7.4%3.3%
Post-1980 Fast-Food RestaurantGlendale7.4%2.7%
Post-2004 Fast-Food RestaurantGlendale6.8%3.5%
Pre-1980 OutpatientGlendale5.8%4.6%
Post-1980 OutpatientGlendale6.3%4.2%
Pre-1980 Full-Service RestaurantKoreatown6.8%2.7%
Post-1980 Full-Service RestaurantKoreatown6.6%2.5%
Pre-1980 Fast-Food RestaurantKoreatown4.5%1.4%
Post-1980 Fast-Food RestaurantKoreatown4.5%−2.7%
Pre-1980 Medium OfficeKoreatown10.0%6.5%
Post-1980 Medium OfficeKoreatown7.9%1.6%
Table 6. Key parameters for the social-economic benefit analysis of installing green roofs [44].
Investment/BenefitsValue ($/m2)TypeTime Frame
Initial Construction Cost146InvestmentOne time
Maintenance Cost2InvestmentAnnual
Storm Water Retention0.38BenefitAnnual
Avoid Infrastructure Cost 39BenefitOne time
Longevity Benefit160BenefitAfter 20 years
Reduction of Infrastructure Improvement 8BenefitOne time
Table 7. Return on investment (%) and payback periods (years) for installing green roofs and photovoltaic systems on all tested buildings.
Building TypeNeighborhoodReturn on Investment after 20 Years (%)Payback Period (Years)
Pre-1980 Full-Service RestaurantGlendale173.9%8.5
Post-1980 Full-Service RestaurantGlendale109.2%12.7
Pre-1980 Fast-Food RestaurantGlendale126.8%11.5
Post-1980 Fast-Food RestaurantGlendale95.2%14.2
Post-2004 Fast-Food RestaurantGlendale162.8%8.9
Pre-1980 OutpatientGlendale182.4%9.0
Post-1980 OutpatientGlendale101.3%13.7
Pre-1980 Full-Service RestaurantKoreatown104.5%14.1
Post-1980 Full-Service RestaurantKoreatown124.1%11.9
Pre-1980 Fast-Food RestaurantKoreatown126.8%11.8
Post-1980 Fast-Food RestaurantKoreatown128.3%11.7
Pre-1980 Medium OfficeKoreatown281.1%5.9
Post-1980 Medium OfficeKoreatown322.1%5.3
Table 8. Characteristics of different settings of green roofs simulated under the A1F1 emission scenario.
Simulation Model Leaf Area Index (LAI)Soil Depth (m)Irrigation Saturation Percentage (%)
Base Model 20.230%
Low LAI10.230%
High LAI50.230%
Thin Soil20.130%
Thick Soil20.730%
Low-Irrigation 20.25%
High-Irrigation 20.290%

