Article

Investigation of Slow-Moving Artificial Slope Failure with Multi-Temporal InSAR by Combining Persistent and Distributed Scatterers: A Case Study in Northern Taiwan

1
Department of Land Surveying and Geo-Informatics, The Hong Kong Polytechnic University, Hung Hom, Kowloon, Hong Kong 999077, China
2
State Key Laboratory of Resources and Environmental Information System, Institute of Geographic Sciences and Natural Resources Research, Chinese Academy of Sciences, Beijing 100049, China
3
Department of Geology, Chinese Culture University, Taipei 11114, Taiwan
4
Freeway Bureau, MOTC, Taipei 243083, Taiwan
5
Northern Region Branch Oce, Freeway Bureau, MOTC, Taipei 114027, Taiwan
6
Department of Geotechnical Engineering CECI Engineering Consultants, Inc., Taipei 11491, Taiwan
*
Author to whom correspondence should be addressed.
Remote Sens. 2020, 12(15), 2403; https://doi.org/10.3390/rs12152403
Submission received: 25 June 2020 / Revised: 17 July 2020 / Accepted: 22 July 2020 / Published: 27 July 2020
(This article belongs to the Section Engineering Remote Sensing)

Abstract

:
In Taiwan, landslides pose serious threats to local residents and infrastructures each year due to high mountain relief and distinct seasonal precipitation distribution. Interferometric synthetic aperture (InSAR) provides a powerful tool to map terrain motion and characterize the failure mechanism of unstable slopes. However, it is challenging for the conventional InSAR technique to obtain reliable landslide information in mountainous regions because of insufficient coherent measurements and signal confusion caused by vegetation coverage and rugged terrain. In this study, we adopt an optimized multi-temporal InSAR (MTInSAR) approach to analyze the surface displacement of an artificial side slope along Freeway No. 3, where a catastrophic landslide failure occurred on 25 April 2010, in northern Taiwan. To increase the spatial extent of the deformation signal, we integrate information from both persistent scatterers (PSs) and distributed scatterers (DSs). Topographic residual and height-dependent atmospheric delays are corrected by a component-based method and joint model estimation, respectively. The results reveal the existence of slope movement with a rate of about −30 mm/year prior to the landslide failure. Further analysis shows that the temporal behaviors of downslope movement are correlated with local precipitation. The study demonstrates the need to continuously monitor and verify the stability of artificial slopes to prevent and minimize the probability of a similar landslide occurrence in the future.

1. Introduction

Landslides, as the result of gravitational force and geological instability, are one of the major types of geological disasters around the world [1,2]. To mitigate and reduce landslide hazards, enormous effort has been dedicated to investigating the failure mechanism and assessing the potential vulnerability, such as landslide inventories, forensic assessment, and displacement inventories [3,4,5,6]. However, the current forecasting of landslide location and timing remains a challenge, primarily due to the complex relationship between the abrupt landslide movement and underlying triggers (e.g., precipitation history and seismic events) [7]. Alternatively, landslide deformation mapping over time provides critical information for the risk assessment of the impending slope failure [7,8].
Conventional geodetic techniques (e.g., Global Positioning System (GPS) and total station) can provide slope stability information from point deformation measurements; however, their sparse spatial distributions reduce their applicability in large-scale areas with rugged terrain. The satellite-based interferometric synthetic aperture radar (InSAR) has proven to be a powerful tool to monitor and analyze catastrophic slope failure in vast and inaccessible regions. The microwave measurement enables InSAR to monitor ground movement in centimeter level with high spatial resolution and broad coverage under all weather conditions [9,10]. Benefiting from the extensive archive of SAR acquisitions covering the same area, multi-temporal InSAR (MTInSAR) have been developed in recent years to overcome the limitations associated with conventional InSAR techniques by exploiting time-series information of SAR acquisitions, all of which basically fall into two categories, namely persistent scatterer interferometry (PSI) [11,12,13,14] and short baseline subset (SBAS) [15,16,17,18]. PSI exploits phase information from point-like persistent scatterers (PSs) that keep high coherence in long observation period and usually correspond to man-made objects and large rock outcrops. This method uses N+1 single-look SAR images to form N single-master interferograms with good performance in urban or peri-urban areas [19,20]. SBAS, on the other hand, extracts phase information from distributed scatterers (DSs) that have moderate coherence in interferograms with short spatial and temporal baselines. The DSs are referred to as targets that contain a sum of random scatterers which are spatially multilooked to improve the signal-to-ratio (SNR) during SBAS processing. The time-series InSAR processing has been widely applied in mapping ground deformation associated with seismic activities [21], volcanism [22], glacier movement [23], underground resource exploitation [24], and landslides [5,25,26], etc. However, InSAR is less effective in low coherence environments. Areas covered by dense vegetation are usually excluded from the analysis, resulting in gaps in an InSAR derived deformation map.
Despite the sustainable development of InSAR algorithm, InSAR technique is still less effective in low-coherence environments [27,28]. Areas covered by dense vegetation are usually excluded from the analysis, resulting in gaps in an InSAR derived deformation map. Landslides have severe impacts on local residents in Taiwan due to the unique geological conditions and high annual rainfall [29,30]. Highly vegetated areas and rugged terrain in Taiwan pose great challenge to conventional InSAR techniques for quantitative hazard and risk assessment.
In this study, we modify the existing MTInSAR algorithm to process phase information from both PSs and DSs and thereby improve the spatial coverage in environments with low coherence. Phase denoising and phase unwrapping are treated as an integrated process to avoid extra estimation error due to necessary approximations and presumptions in each individual step. Systematic errors are corrected step-by-step, so improve the final deformation precision. We apply the method to characterize the time series slope displacements prior to the landslide failure of Freeway No. 3 in northern Taiwan. In addition, we address whether the long-term slope movement is correlated with precipitation. This study is expected to demonstrate the applicability of InSAR technique for safety inspections of geotechnical structures in mountainous areas.

2. Study Area and Datasets

2.1. Geological Setting and Evolution of the Freeway No. 3 Landslide

2.1.1. Geological Setting and Local Climate

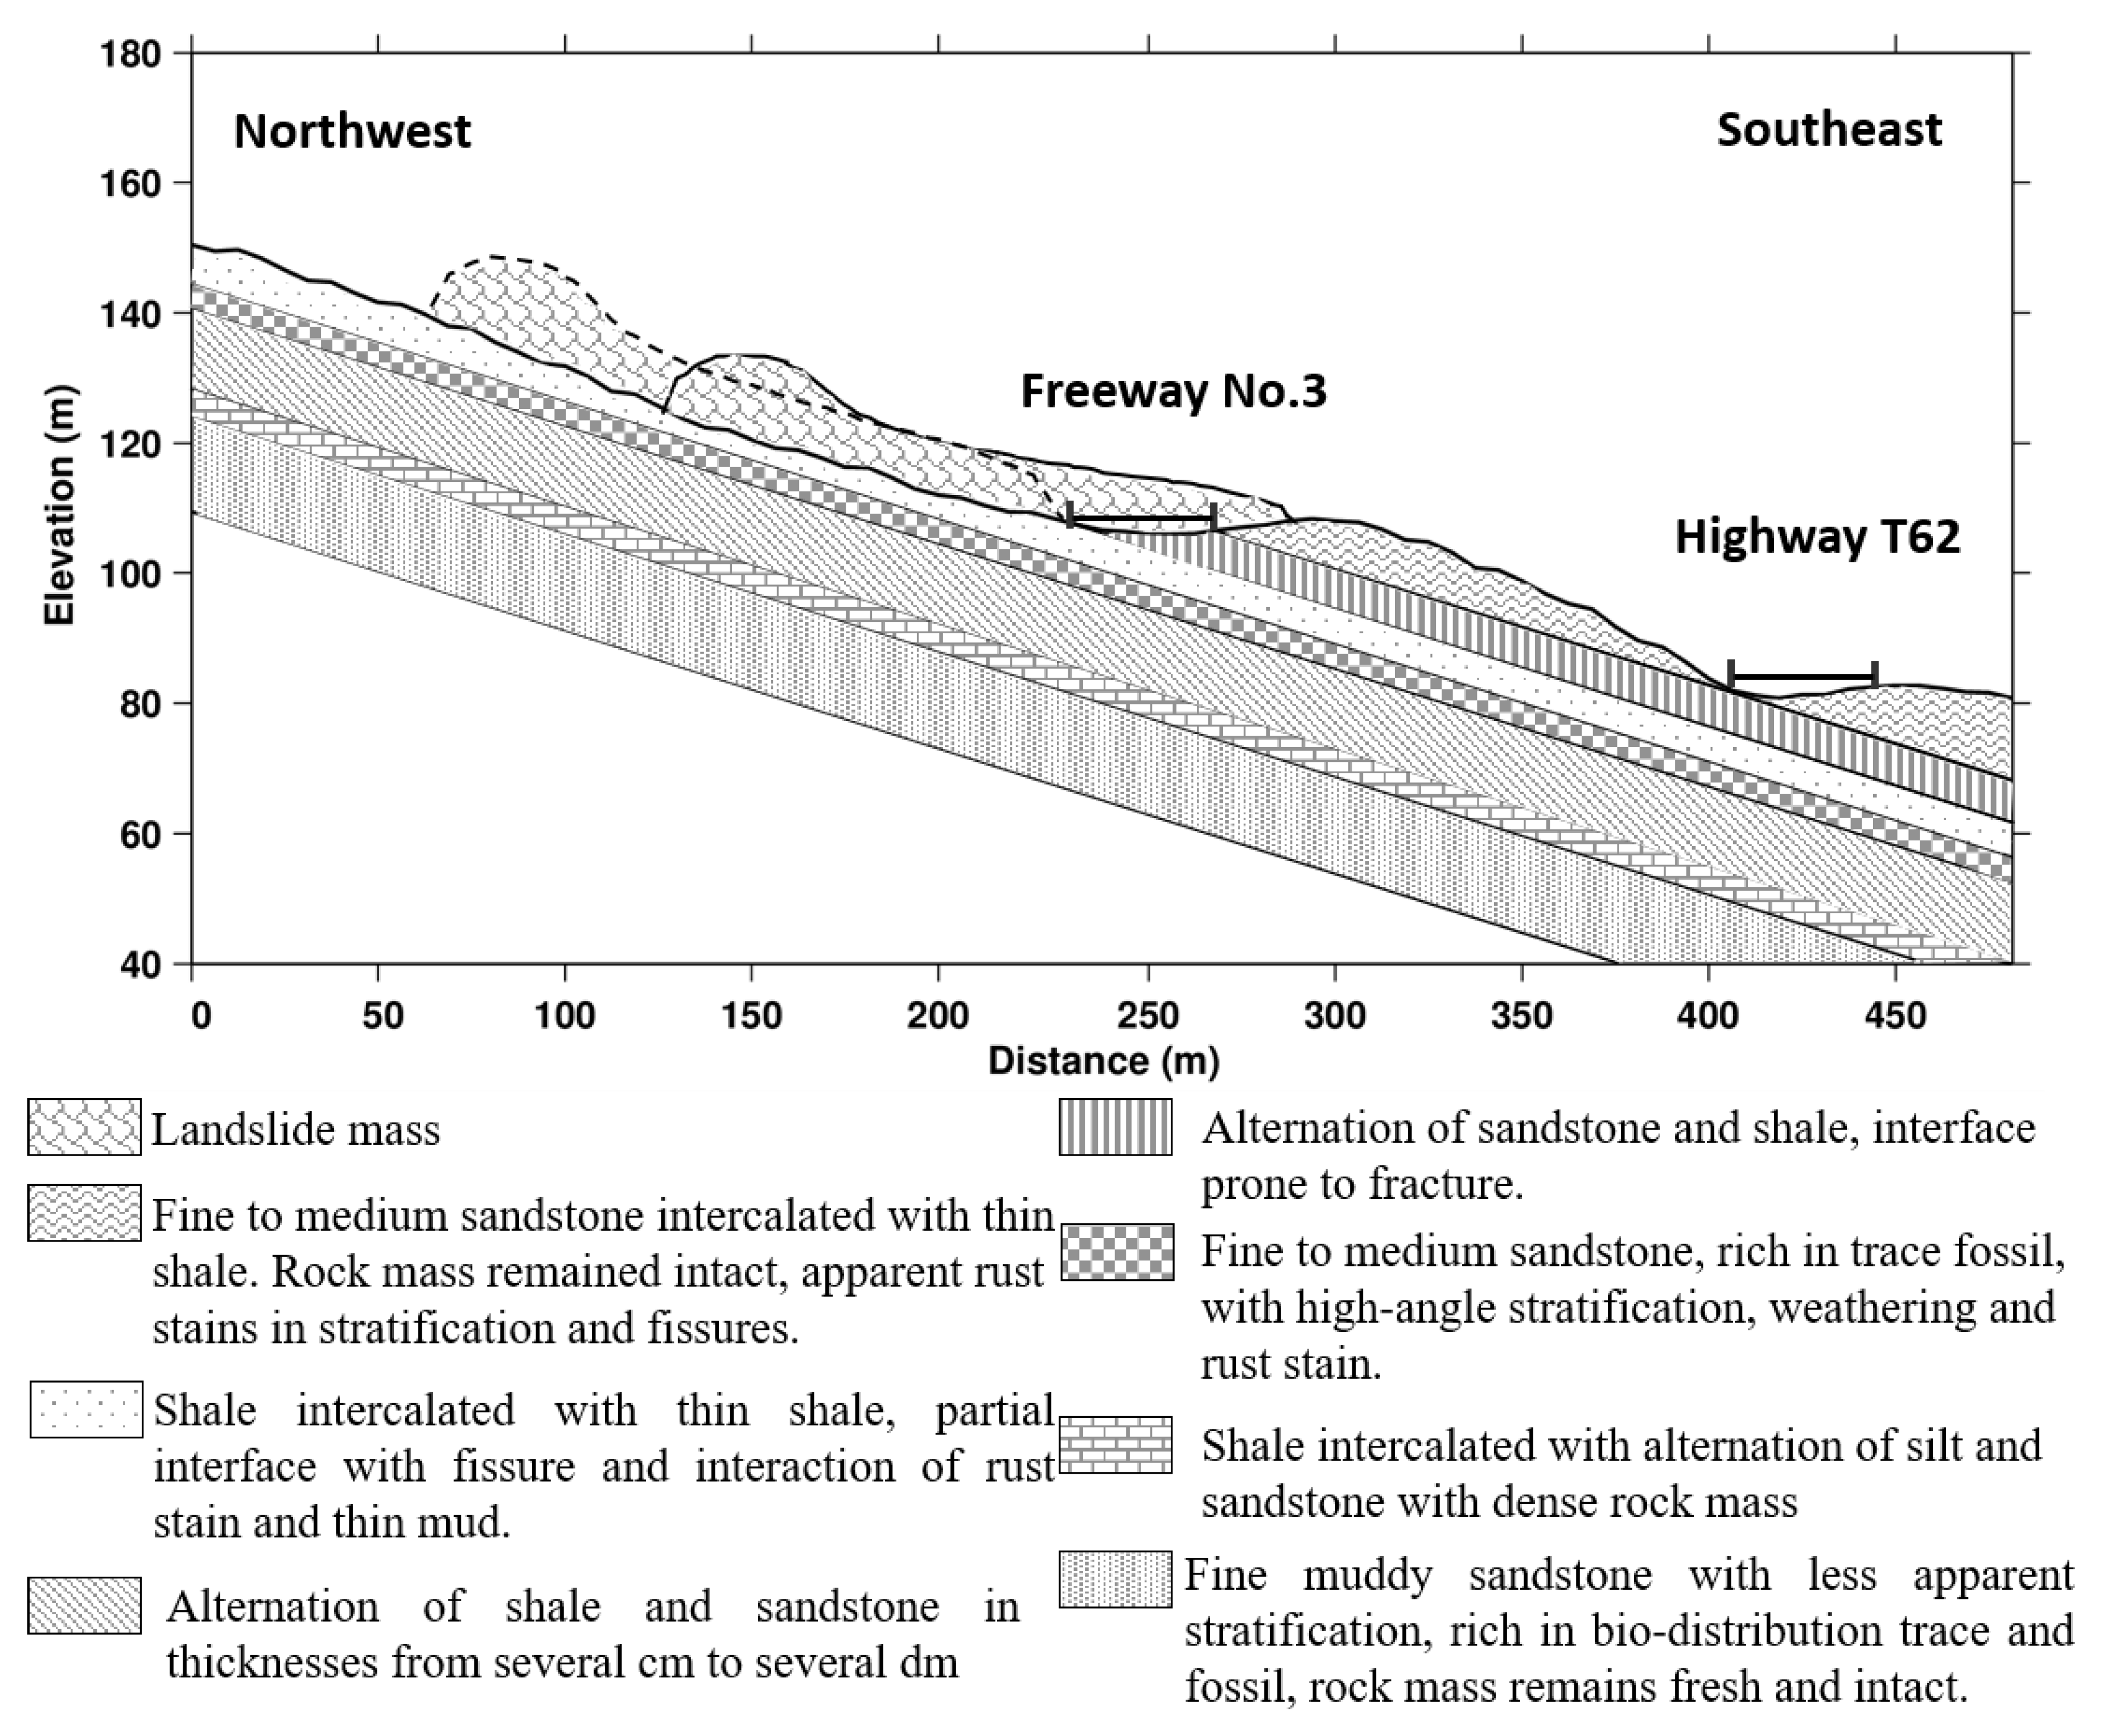
The collapsed slope is located at 3K+035 (approximately 3.1 km, 121°41′39.27′’E, 25°7′12.79′’N) on Freeway No. 3 in northern Taiwan (Figure 1). The slope originally ranged between 12° and 20° with a northwest to southeast aspect at an elevation of 110 m to 162 m. The escarpment forms a cuesta landscape, in which one slope is gentle and follows the dip of the bedding (the sliding surface), and the other slope is steep and rugged due to the differential erosion of the sandstone and shale interbeds. The exposed strata are from the Miocene (Tertiary) Taliao Formation, which is composed of massive sandstone, interbeds of sandstone and shale, and thick-bedded sandstone intercalated with shale (Figure 2). The strike orientations are approximately from N20°E/15°SE to N40°E/15°SE, and that brittle structure indicates as a conjugate shear fractures aligned N66°W/68°NE and N45°W/73°SW. The slope on the right side of the southbound lane is a dip slope. The boring core sample from the dip slope shows that the slope’s 10 m-thick surface layer is thick-bedded sandstone occasionally intercalated with shale and sits atop interbeds of sandstone and shale. In addition, the average rock quality designation (RQD) at the boundary of the sandstone and the shale is no more than 25%, implying that the rock quality of this section is poor [3].
Known as a freeway excavation site, this area has an average excavation depth of 17 m as its original ground elevation was 120 m, while the designed road elevation is 103 m. Together with the excavation of side slopes, the site’s total excavation height is approximately 35 m, resulting in the exposure of not only thick-bedded sandstone, but also shale intercalated with sandstone and shale and sandstone interbeds. The collapsed slope is located within the freeway excavation site and was originally excavated at 30 to 45 degrees; The upper section was a natural slope excavated at 30 degrees, whereas the lower section was a two-stage 10-m slope excavated at 45 degrees with failure protection in the form of prestressed rock anchors and precast reinforced concrete (RC) grid beams.
Influenced by the subtropical-monsoon climate, the study area suffers typhoons in the summer and the northeast monsoon in the winter. On average, there are 190 rainy days per year, yielding an annual precipitation of more than 2000 mm [29,30]. Most of the rainfall occurs in the typhoon season, which is from July to September. Due to mountainous terrain with steep slopes and fractured bedrock, the rainfall associated with these tropical storms increases the risk of landslides and debris flows.

2.1.2. The Landslide

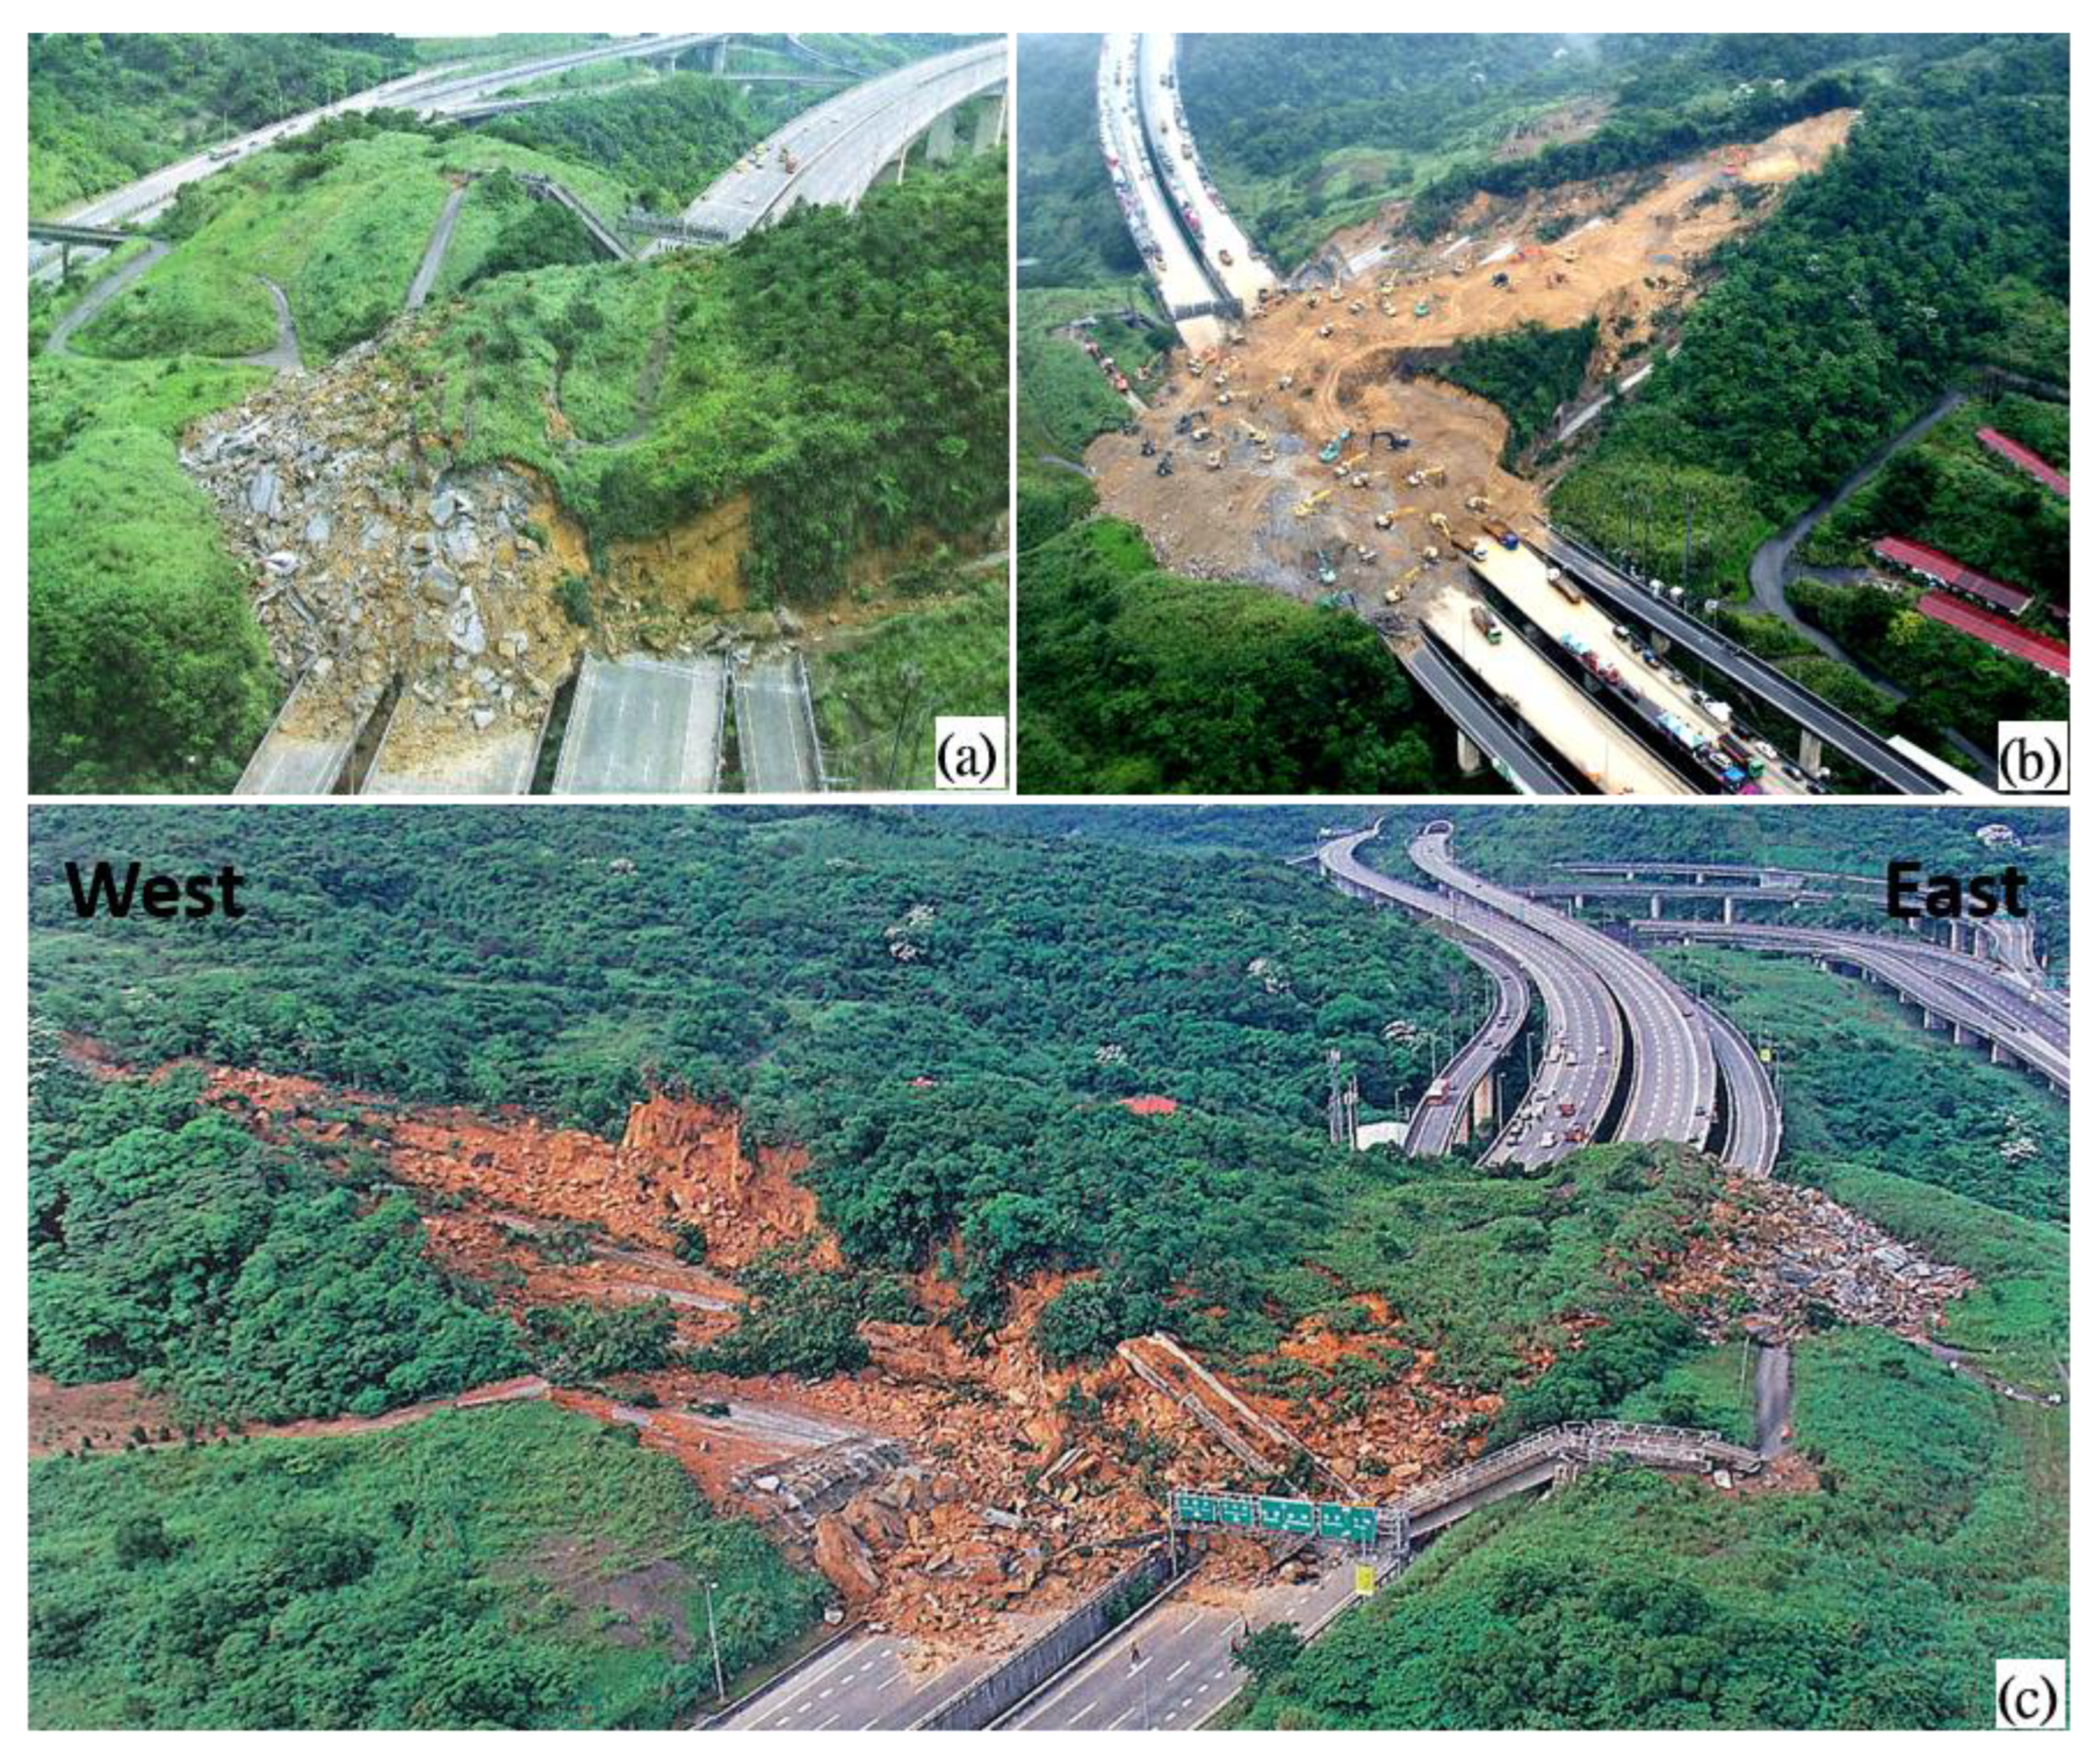
The slope failure of National Freeway No. 3 landslide is a typical example of translational dip-slope slide as the slump moved eastwards along the shale bedding plane in the sandstone and shale interbeds [4,31]. No rainfall or earthquake was recorded in weeks prior to the event. Heavily covered in vegetation (shown in Figure 3), the slide mass mainly consists of the surface soil layer and the broken weathered thick-bedded sandstone occasionally intercalated with shale. The 200,000 m3 of slide mass not only damaged the Dapu Bridge overpass, but also interrupted traffic and killed 4 people as its 200 m-long and 150 m-wide slump covered the six-lane freeway.

2.2. Satellite SAR Data

An archived SAR dataset of L-band ALOS/PALSAR data is used to retrieve the surface movement before the disaster. Compared with other SAR sensors with shorter radar wavelength, the L-band PALSAR data have better performance in vegetated environments. A total of 15 PALSAR images were acquired from an ascending track during the period from January 2007 to March 2010 with a minimum revisiting cycle of 46 days. Figure 4 illustrates the combination of 105 interferometric pairs from 15 SAR images. Considering the narrow region of the collapsed slope, full resolution interferograms are generated with a spatial resolution of 10 m. In addition, a 1-arc-second ALOS World 3D 30 m (AW3D30m) digital surface model (DSM) [32] is used to remove the topographic phase contribution to the interferometric phase.

3. Methodology

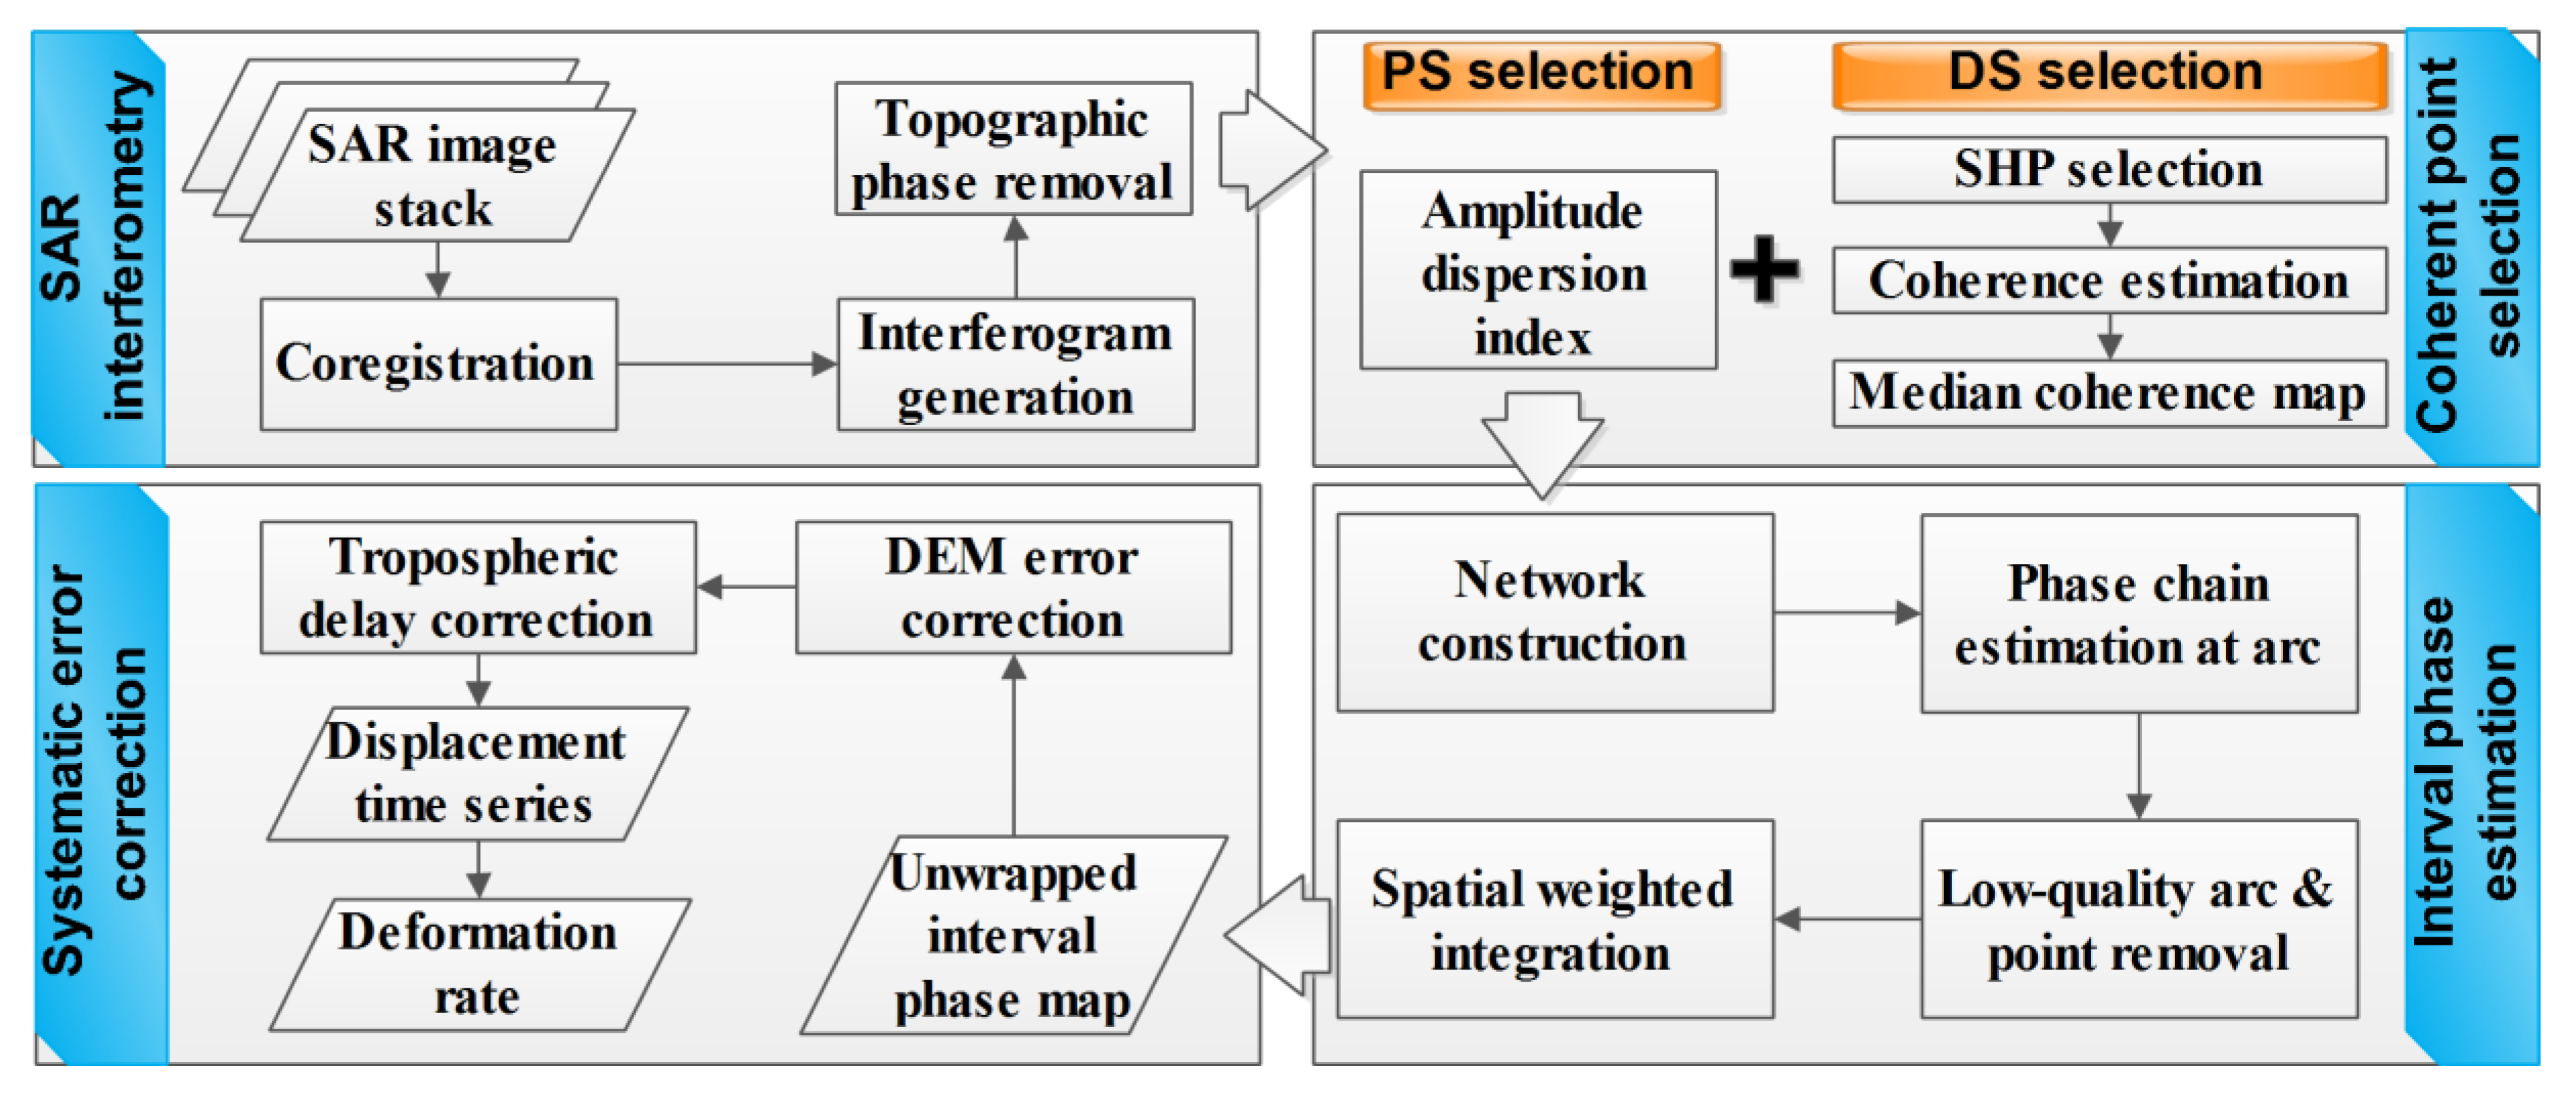
To improve the density and reliability of deformation signal in densely vegetated environments, we modify the existing MTInSAR analysis framework to retrieve the spatial and temporal evolution of landslide movement. The modified framework consists of three steps, i.e., coherent point selection, interval phase estimation, and systematic error correction. Figure 5 displays the flowchart of the MTInSAR analysis. Particularly, coherent phase observations are extracted from the combination of selected PS and DS measurements. The interval phase estimation is performed at arcs then converted to points. Then, the interval phase maps are corrected by removing topographic residuals and atmospheric delays. Finally, the time-series displacements are derived from the conversion of the remaining phase component. In the following the detailed procedure of the modified MTInSAR processing will be explained.

3.1. Coherent Point Selection

It is desired to retrieve ground coherent points as many as possible for the purpose of sufficiently extracting slow slip displacement over vegetated area. To this end, the basic observations in this method contain both PS and DS measurements. For PS, its phase stability can be approximated by temporal amplitude stability [11], which is expressed by amplitude dispersion index (ADI),
D A = σ A μ A
where μ A and σ A represent the mean and standard deviation of time-series amplitudes for a given pixel, respectively. Pixels with ADI less than 0.4 are initially considered as PS candidates [11,12]. In contrast to PS, DS maintains moderate coherence during one or several intervals of SAR acquisitions. For a given pixel within an interferometric pair, its complex coherence value is calculated as,
Γ m , n = t = 1 L s m ( t ) s n ( t ) t = 1 L | s m ( t ) | 2 t = 1 L | s n ( t ) | 2 = γ m , n e i ϕ m , n
where s m ( t ) and s n ( t ) represent the complex phase values of SAR image pair, stands for complex conjugate, the coherence magnitude γ m , n defines the degree of coherence, and ϕ m , n represents the spatially averaged interferometric phase, L is the number of statistically homogeneous pixels (SHPs) surrounding the central pixel. The SHPs for the central pixel can be identified through statistical similarity test (e.g., Kolmogorov-Smirnov (KS) and Anderson-Darlington (AD) test) based on time-series amplitudes [33,34,35]. Points with average temporal coherence larger than 0.25 and number of SHPs larger than 20 are initially selected as DS candidates [36]. The original phases of selected DS points are substituted with the spatially averaged phases. To preserve the phases of point-wise PSs, the DS points that coincide with PSs points are dropped. Noted that, the coherence of PS is always equal to one in all interferograms [33]. Then the selected PSs and DSs are combined for joint process in the following analysis. Their phase and coherence values serve as the basis of the functional and stochastic models of the interval phase estimation, respectively.

3.2. Interval Phase Estimation

Once the coherent points have been selected, phase differences at arcs constructed from Delaunay triangulation form the observations for interval phase estimation. Since the arc-based observations between two neighboring coherent points can largely reduce 2 π ambiguities in phase measurements [18,37], we first estimate the phase intervals at arcs. Assuming there are N + 1 SAR images and M interferometric pairs, the linear system for arcs without considering phase ambiguities is expressed as [38]
A Δ φ = Δ ϕ + R Δ φ ^ = ( A T P ¯ A ) 1 A T P ¯ Δ ϕ V = Δ ϕ A Δ φ ^
where Δ ϕ is a vector containing the phase differences between two adjacent pixels from M interferometric combinations, Δ φ is the estimated phase difference at arc for N SAR acquisition intervals, A is the design matrix connecting SAR acquisition interval and interferogram, R is a stochastic vector with an expectation of zero. P ¯ is equivalent weight matrix, which adjusts the influence of observations to fit the actual accuracy of the corresponding observations [39]. It is expressed as the combination of coherence fisher information matrix (FIM) [40] and down-weighting functions [41]. We solve the linear system (3) by iteratively updating weights according to the residuals until the model is fitted, so the effect from outliers (i.e., phase ambiguities) is suppressed [42]. In case the percentage of outliers exceeds of the upper limit of model and results in corrupted estimation, the arc measurements need to be removed to avoid contaminating subsequent estimation. Such arcs can be identified by equivalent temporal coherence (ETC),
γ P ¯ = | P ¯ · e i ( Δ ϕ B Δ φ ^ ) | t r (   P ¯ )
where t r ( · ) represents the operator to calculate trace of matrix. Arcs with γ P ¯ less than a given threshold (e.g., 0.85) are considered low-quality and are discarded [33,43]. We perform the estimation of (3) and (4) on an arc-by-arc basis until the phase chain at all arcs are obtained. Isolated points are detected and removed to avoid rank deficiency in design matrix A . Then we convert the estimated phase differences at arcs to unwrapped phases at points by spatially weighted integration,
C δ φ = Δ δ φ ^ = ( C T W C ) 1 C T W Δ φ
where C is network matrix relating points and arcs, which is composed by the combination −1, 0 and 1. W is the weight matric of arcs, of which diagonal element is determined by the posterior variance from Equation (3). We refer the readers who are interested in the details of unwrapped interval phase retrieval to Liang, et al. [38].

3.3. Systematic Error Correction

After obtaining interval phases at coherent points, the consecutive phase map can be thought as a linear mixture of statistically independent signals,
δ φ = δ φ d e f o + δ φ t o p o + δ φ a t m + δ φ o r b
where δ φ d e f o represents the phase component due to ground movement, δ φ t o p o represents the phase residual caused by digital elevation model (DEM) inaccuracy, δ φ a t m is the phase screen due to atmospheric delays, δ φ o r b is the phase ramp induced by orbital inaccuracy. Because phase ambiguities have been removed, we only need to separate the error components from the interval phase maps, thus the remaining phase component can be easily converted to displacement.
Firstly, the DEM error can be corrected through the linear relation between spatial baseline and phase residual. Since the linear estimation is prone to the discrepancy between the modeled and real deformation time series [44], we employ a component-based method to correct the topographic error. The detailed analysis and test of the method has been discussed in Liang, et al. [45]. The basic idea stems from the fact that the topographic error has a deterministic spatial pattern which is distinct with other signals and merely correlated with spatial baselines. By using independent component analysis (ICA), the spatial pattern due to topographic error can be identified without requiring a priori deformation model.
After correcting the DEM error, there are deformation, orbital error and atmospheric delays remained in the interval phases. The height-dependent atmospheric delays can be corrected by a quadtree aided joint model, which has been discussed and tested with simulated and real data in Liang, et al. [46]. We recall the method and extend it to simultaneously account for height-dependent atmospheric delays and orbital error. For a given SAR acquisition, the phase ramp due to height-dependent atmospheric delays and orbital error with respect to a reference image is expressed as
ϕ a t m + o r b = k 1 · x + k 2 · y + k 3 · x y + k 4 · h + ϕ 0
where x and y are the rang and azimuth coordinate, respectively. h represents the elevation for SAR pixel, k 1 to k 4 are the coefficients which correlate orbital error and height-dependent atmospheric delay terms to the phase ramps. ϕ 0 is the intercept with respect to the reference point, which can be neglected in a local window. Considering there are J + 1 points and N SAR intervals, the phase component caused by height-dependent atmospheric delays and orbital error is expressed as
Φ a t m + o r b ( J × N ) × 1 = B a t m + o r b ( J × N ) × ( 4 × N ) × P a t m + o r b ( 4 × N ) × 1
where Φ a t m + o r b represents ( J × N ) × 1 vector including phase components caused by height-dependent atmospheric delays and orbital error, P a t m + o r b contains all orbital error and height-dependent atmospheric delay coefficients with respect to the reference SAR acquisition and reference point, B a t m + o r b is the design matrix connecting SAR intervals and acquisitions for the unknown parameters.
Apart from the height-dependent atmospheric delays and orbital error, we model the displacement as
ϕ d e f o = 4 π λ · T · v
where λ is the radar wavelength, T is the temporal baseline of interval phase, v is the deformation rate. There are J + 1 points and N + 1 SAR acquisitions, the phase component contributed from the modelled deformation is expressed as [47],
Φ d e f o ( J × N ) × 1 = B d e f o ( J × N ) × ( 1 × N ) × P d e f o ( 1 × N ) × 1
where Φ d e f o represents ( J × N ) × 1 vector including phase component caused by modelled displacements, P d e f o contains the parameters of deformation rate of all points with respect to the reference point. B d e f o is the design matrix connecting SAR intervals and acquisitions for the deformation parameters. Combining (8) and (10), we derive the joint model as
Φ ( J × N ) × 1 = B × P + ( J × N ) × 1
with
B = [ B a t m + o r b   B d e f o ] P = [ P a t m + o r b   P d e f o ] T
where Φ represents ( J × N ) × 1 vector including all phase components in the joint model, is the phase residual vector. By solving (11), the parameters of height-dependent atmospheric delays, orbital error and deformation rate can be obtained simultaneously. We further subtract the height-dependent atmospheric delays and orbital error from the interval phase maps, so the time-series displacements are directly transformed from the remaining phase component.

4. Results

4.1. Phase Reconstruction and Systematic Error Correction

The improved MTInSAR approach is applied to the ALOS/PALSAR data as detailed in Section 2.2. We use ADI to select 6965 PS points and use mean coherent map to select 82,855 DS points from 105 single-look interferograms. The phase measurements from the selected PS and DS points are combined as coherent observations in interval phase estimation. After rejecting low-quality arcs and removing isolated points, we obtain 14 interval phase maps with 80,422 points. To illustrate the performance of the proposed method on noise reduction, Figure 6 displays four examples of single-look consecutive interferograms before and after phase interval estimation and systematic error correction. From the first row in Figure 6 we can see that the phases in the original single-look interferograms are deteriorated from decorrelation noise. Although the L-band SAR sensor has comparable performance at maintaining coherence in rural area, the temporal decorrelation due to the unfavorable geology and dense vegetation make the interferometric phase noisy and hampers the retrieval of landslide movement. The second and third rows in Figure 6 display the consecutive interferograms in wrapped and unwrapped form after phase estimation from the combined measurements of PSs and DSs. It is clear that the decorrelation noise is effectively filtered, yielding a more coherent phase map for deformation retrieval. The interval phase maps are further processed by correcting topographic error and height-dependent atmospheric delays and orbital error. The comparison between the third and fourth rows in Figure 6 indicates that, besides decorrelation noise, the phases in the interferograms also have contributions from the DEM errors and phase ramps. By subtracting the estimated error phase components, the unexpected phase variations are largely reduced, indicating the effectiveness of systematic error correction in the proposed MTInSAR processing.
After performing interval phase estimation and error mitigation, we convert the remaining phase component into a displacement time series and calculate the deformation rate. The average point density reaches approximately 3251 points/km2. The high-density deformation measurements over the study area help to better identify and analyze the slow-moving landside before the final slope failure.

4.2. Spatial Pattern and Temporal Behavior of Slope Movement

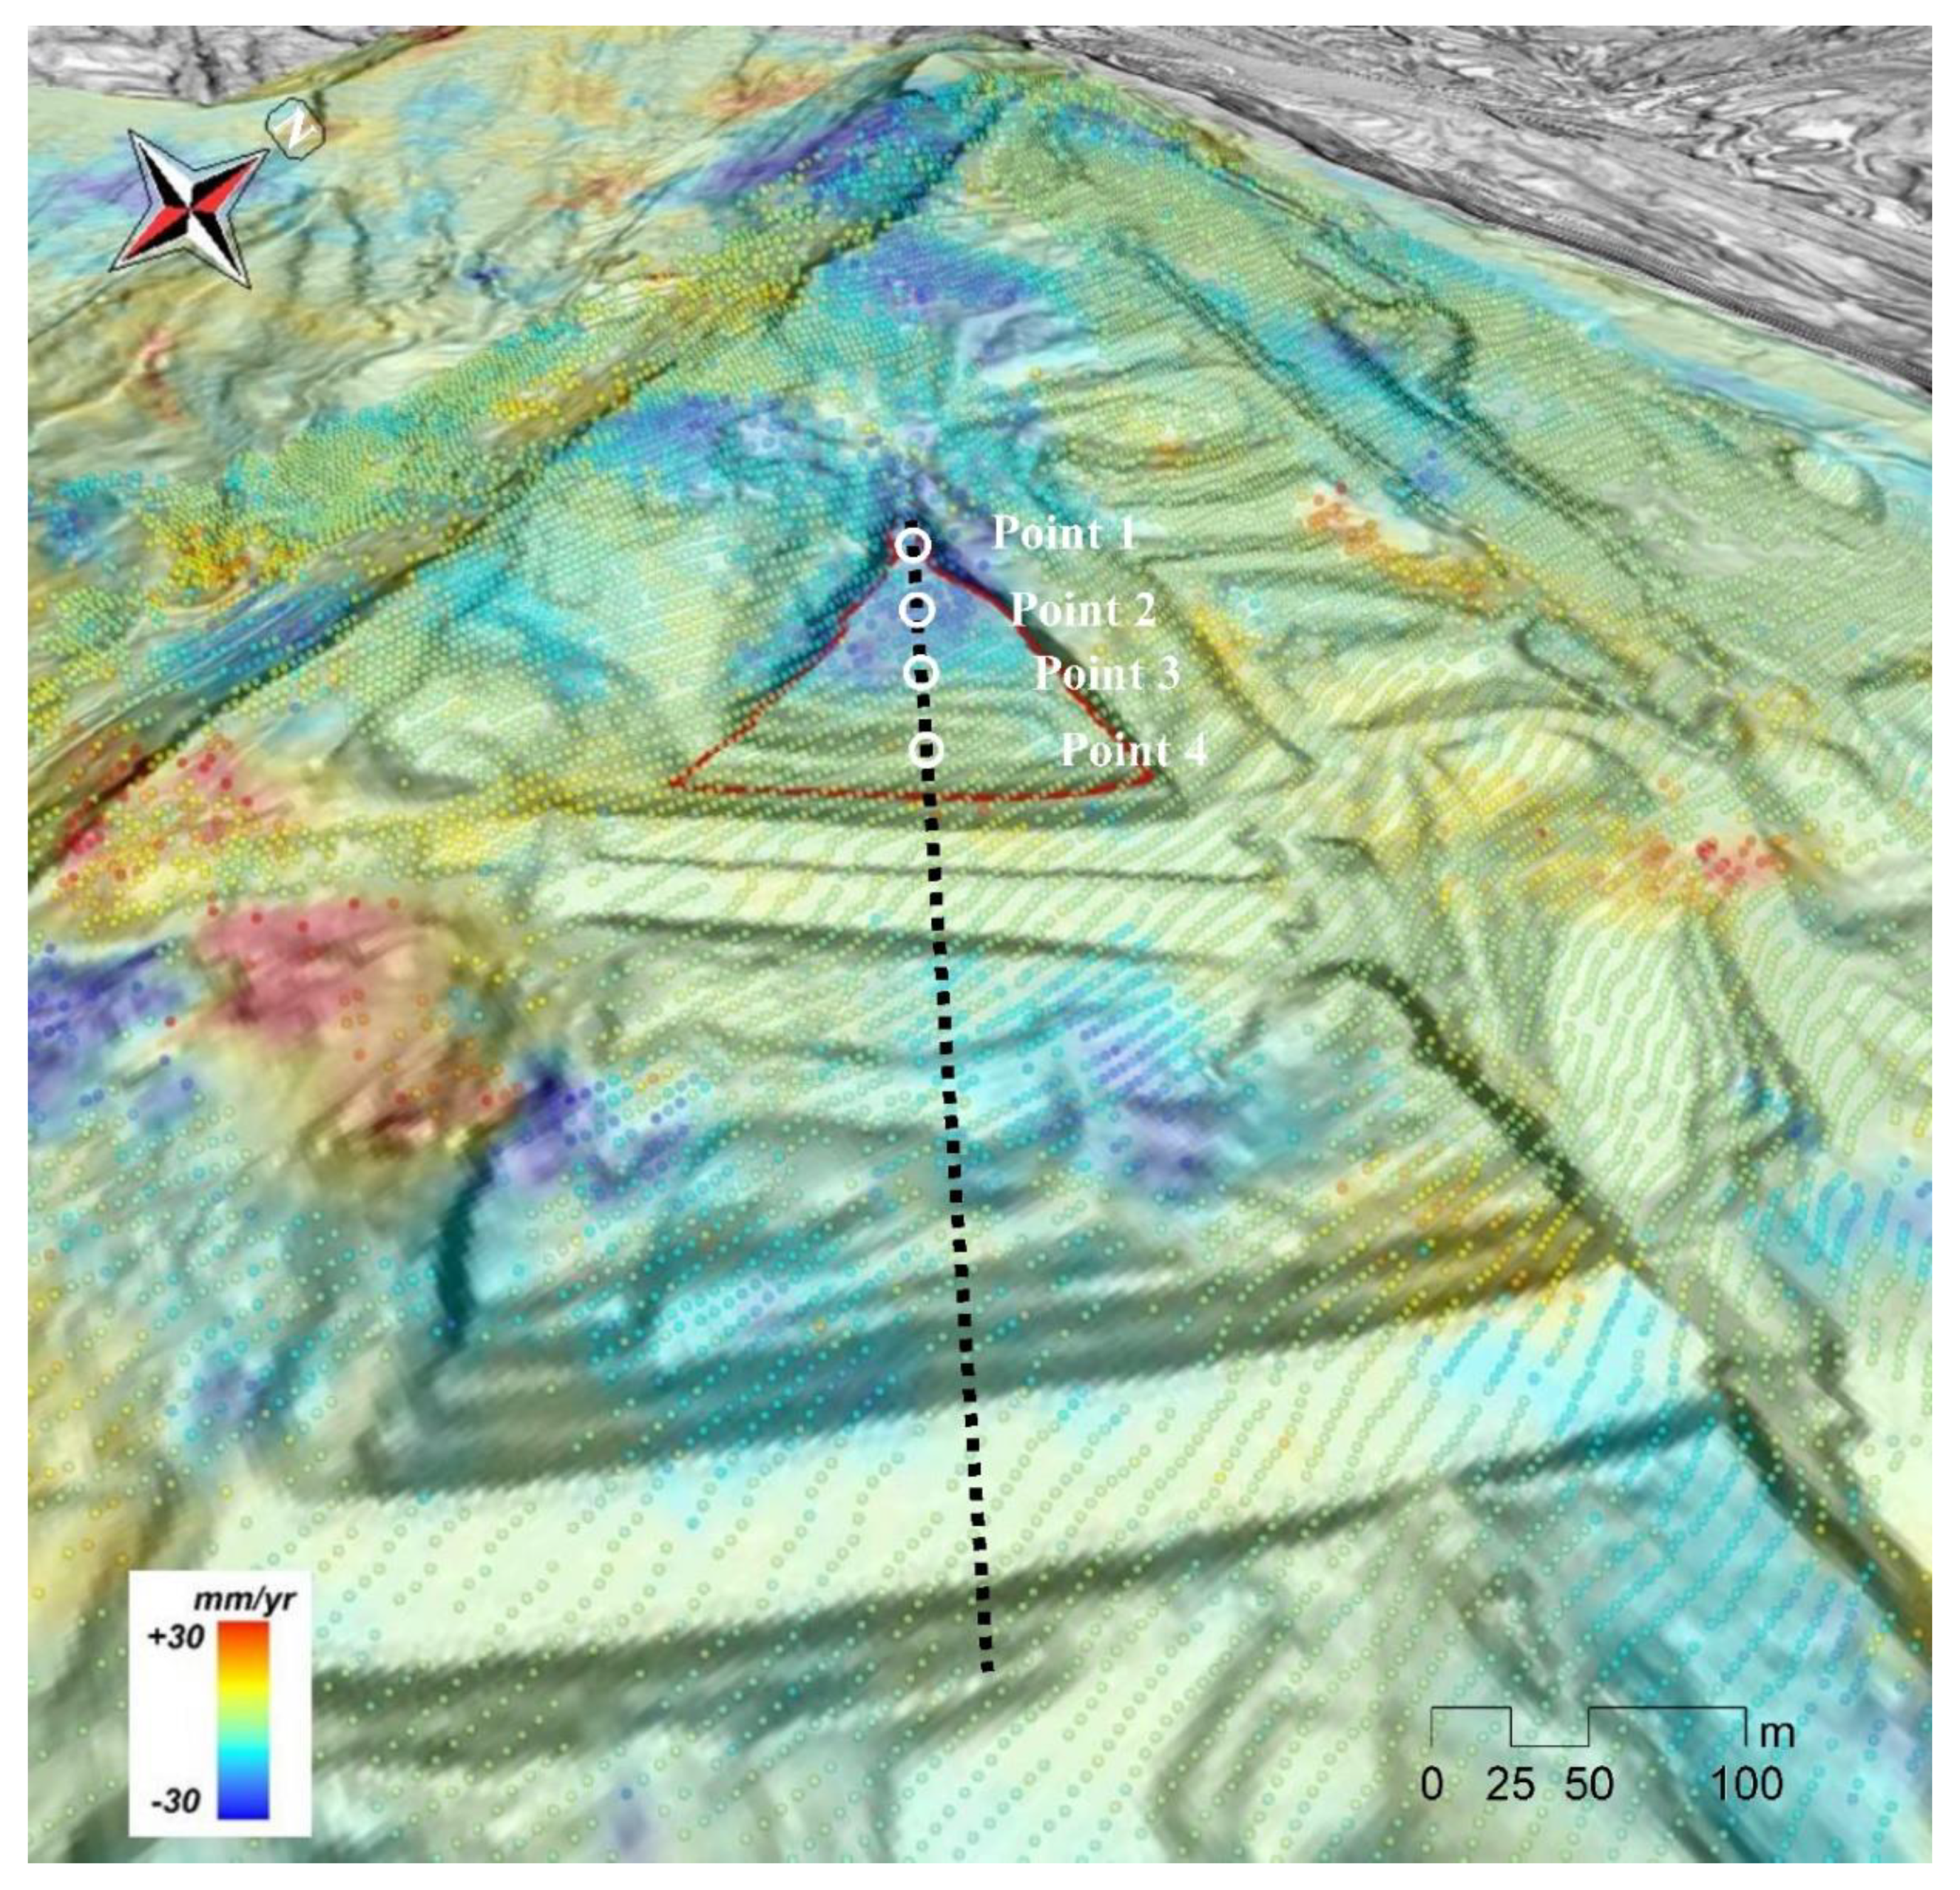
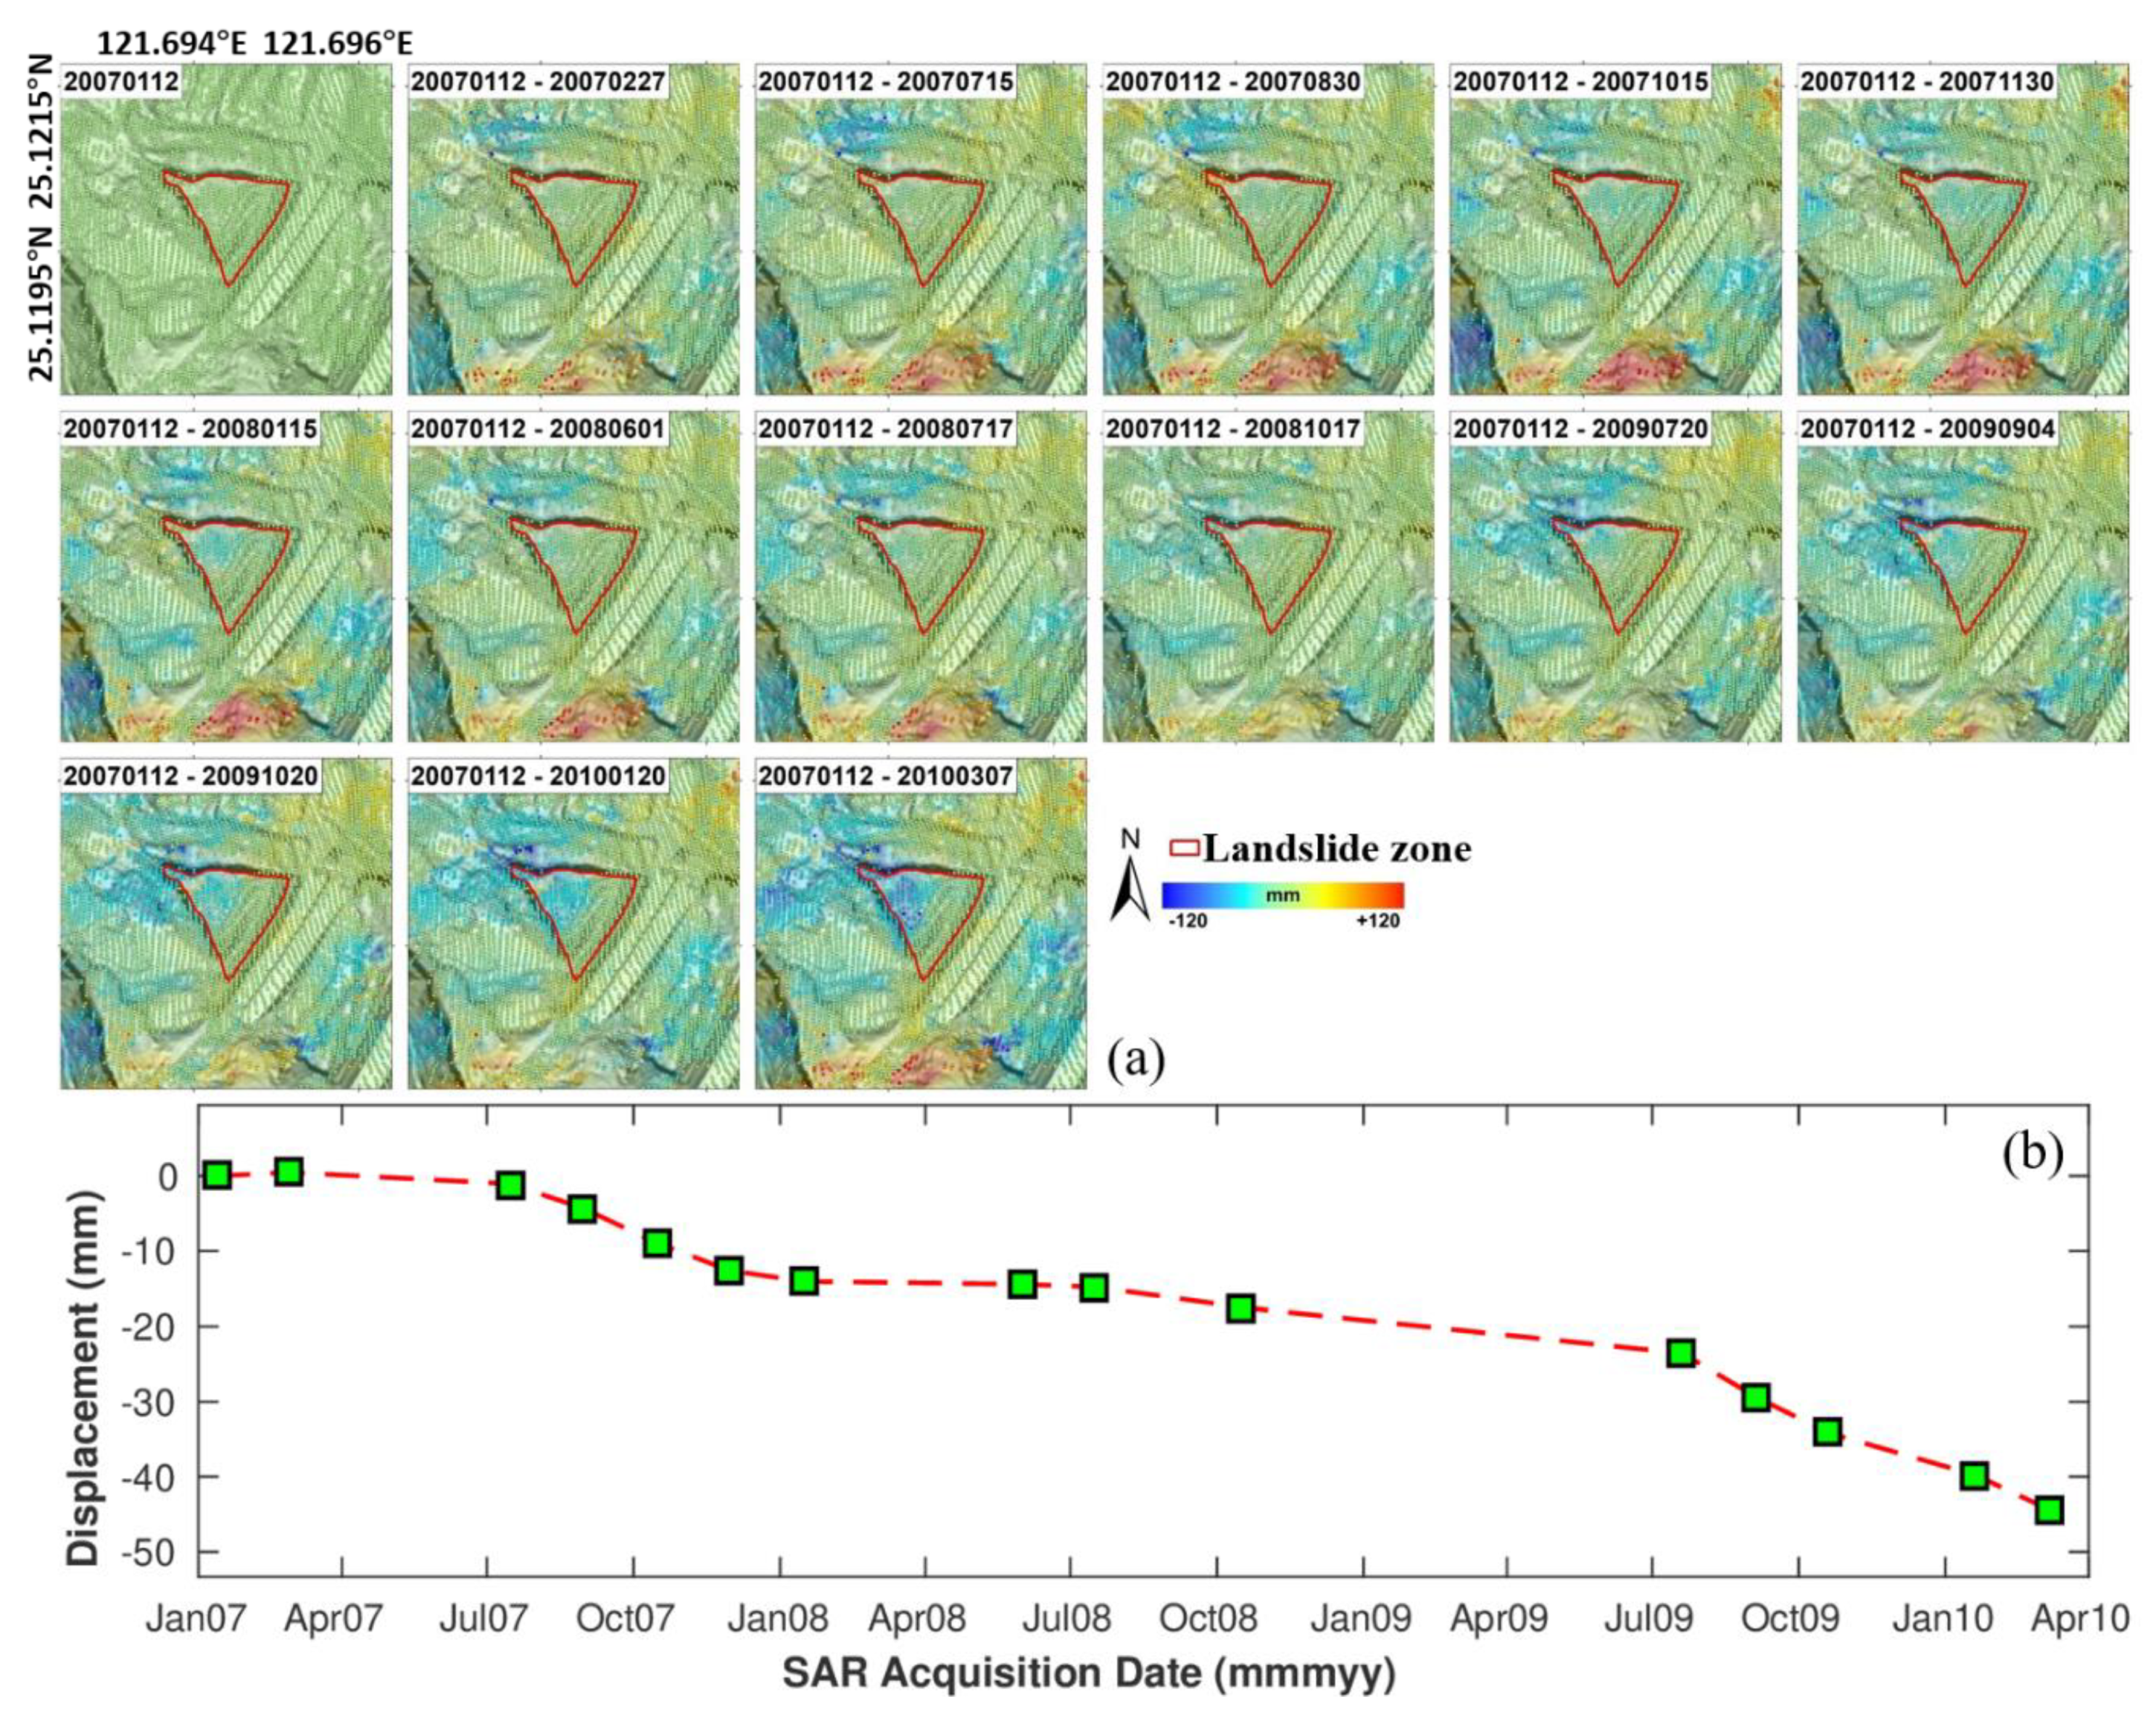
Figure 7 shows the annual deformation rate map of the investigated slope area during the 2007-2010 period. Although the studied slope was covered by dense vegetation (Figure 3), the results show considerable deformation distributed along the slope that subsequently collapsed. The deformation is concentrated on the upper part of the slope, with the average LOS velocity reaching −30mm/year over the investigated period. Given the ascending ALOS imaging geometry and the slope facing an approximately east-southeast direction, the negative LOS displacement i.e., moving away from the satellite, indicates downslope movement. The distribution of downslope movement is consistent with the region that collapsed afterward, which is enclosed by the solid red triangle. Figure 8 shows the time-series LOS displacement maps of the studied slope. It can be observed that there are two sliding acceleration periods, i.e., July 2007 to January 2008, and July 2009 to March 2010, which can possibly be ascribed to the precursor of the slope failure that occurred on 25 April, 2010. Specifically, the larger amplitude downslope movement occurs on the upper part of the slope, and the amplitude is positively correlated with the slope elevation. We also note that, the area on the left side shows positive deformation values. The uplift movement can be explained from two aspects. First, the orientation of the left slope is different from that of the central slope. Or, alternatively, the uplift is caused by the horizontal movement since the InSAR measurements are in the LOS direction.
Figure 9 shows the time series displacements of four selected points in Figure 7. Point 1 and Point 2, located in the upper section with a relatively steep slope, move downwards with mean velocities of −18.6mm/year and −21.3mm/year, respectively. Point 3, located in the middle section of the slope, has a mean downslope velocity of −15.0mm/year. While Point 4 has an overall mean velocity of −0.1mm/year, there is an apparent seasonal oscillation in the time series, possibly as the result of interaction between the slope and the freeway. All the four points show complex temporal behaviors such that the movement cannot be simply scaled through time during the period of observation, indicating the landslide movement was possibly controlled by several factors. Active ground surface deformation identified in the InSAR data can be classified into three types according to ground features before the collapse: first, the primitive forest located on the upper slope, where Point 1 (crown of the slope with obvious tension cracks) and 2 (center of the sliding block) are located; second, the artificial slope, where a hairpin road can be clearly identified in Figure 7; third, the boundary of the primitive forest and artificial slope, where Point 4 (rock anchoring area) is located.

5. Discussion

5.1. Interpretation of the Freeway No. 3 Landslide Movement

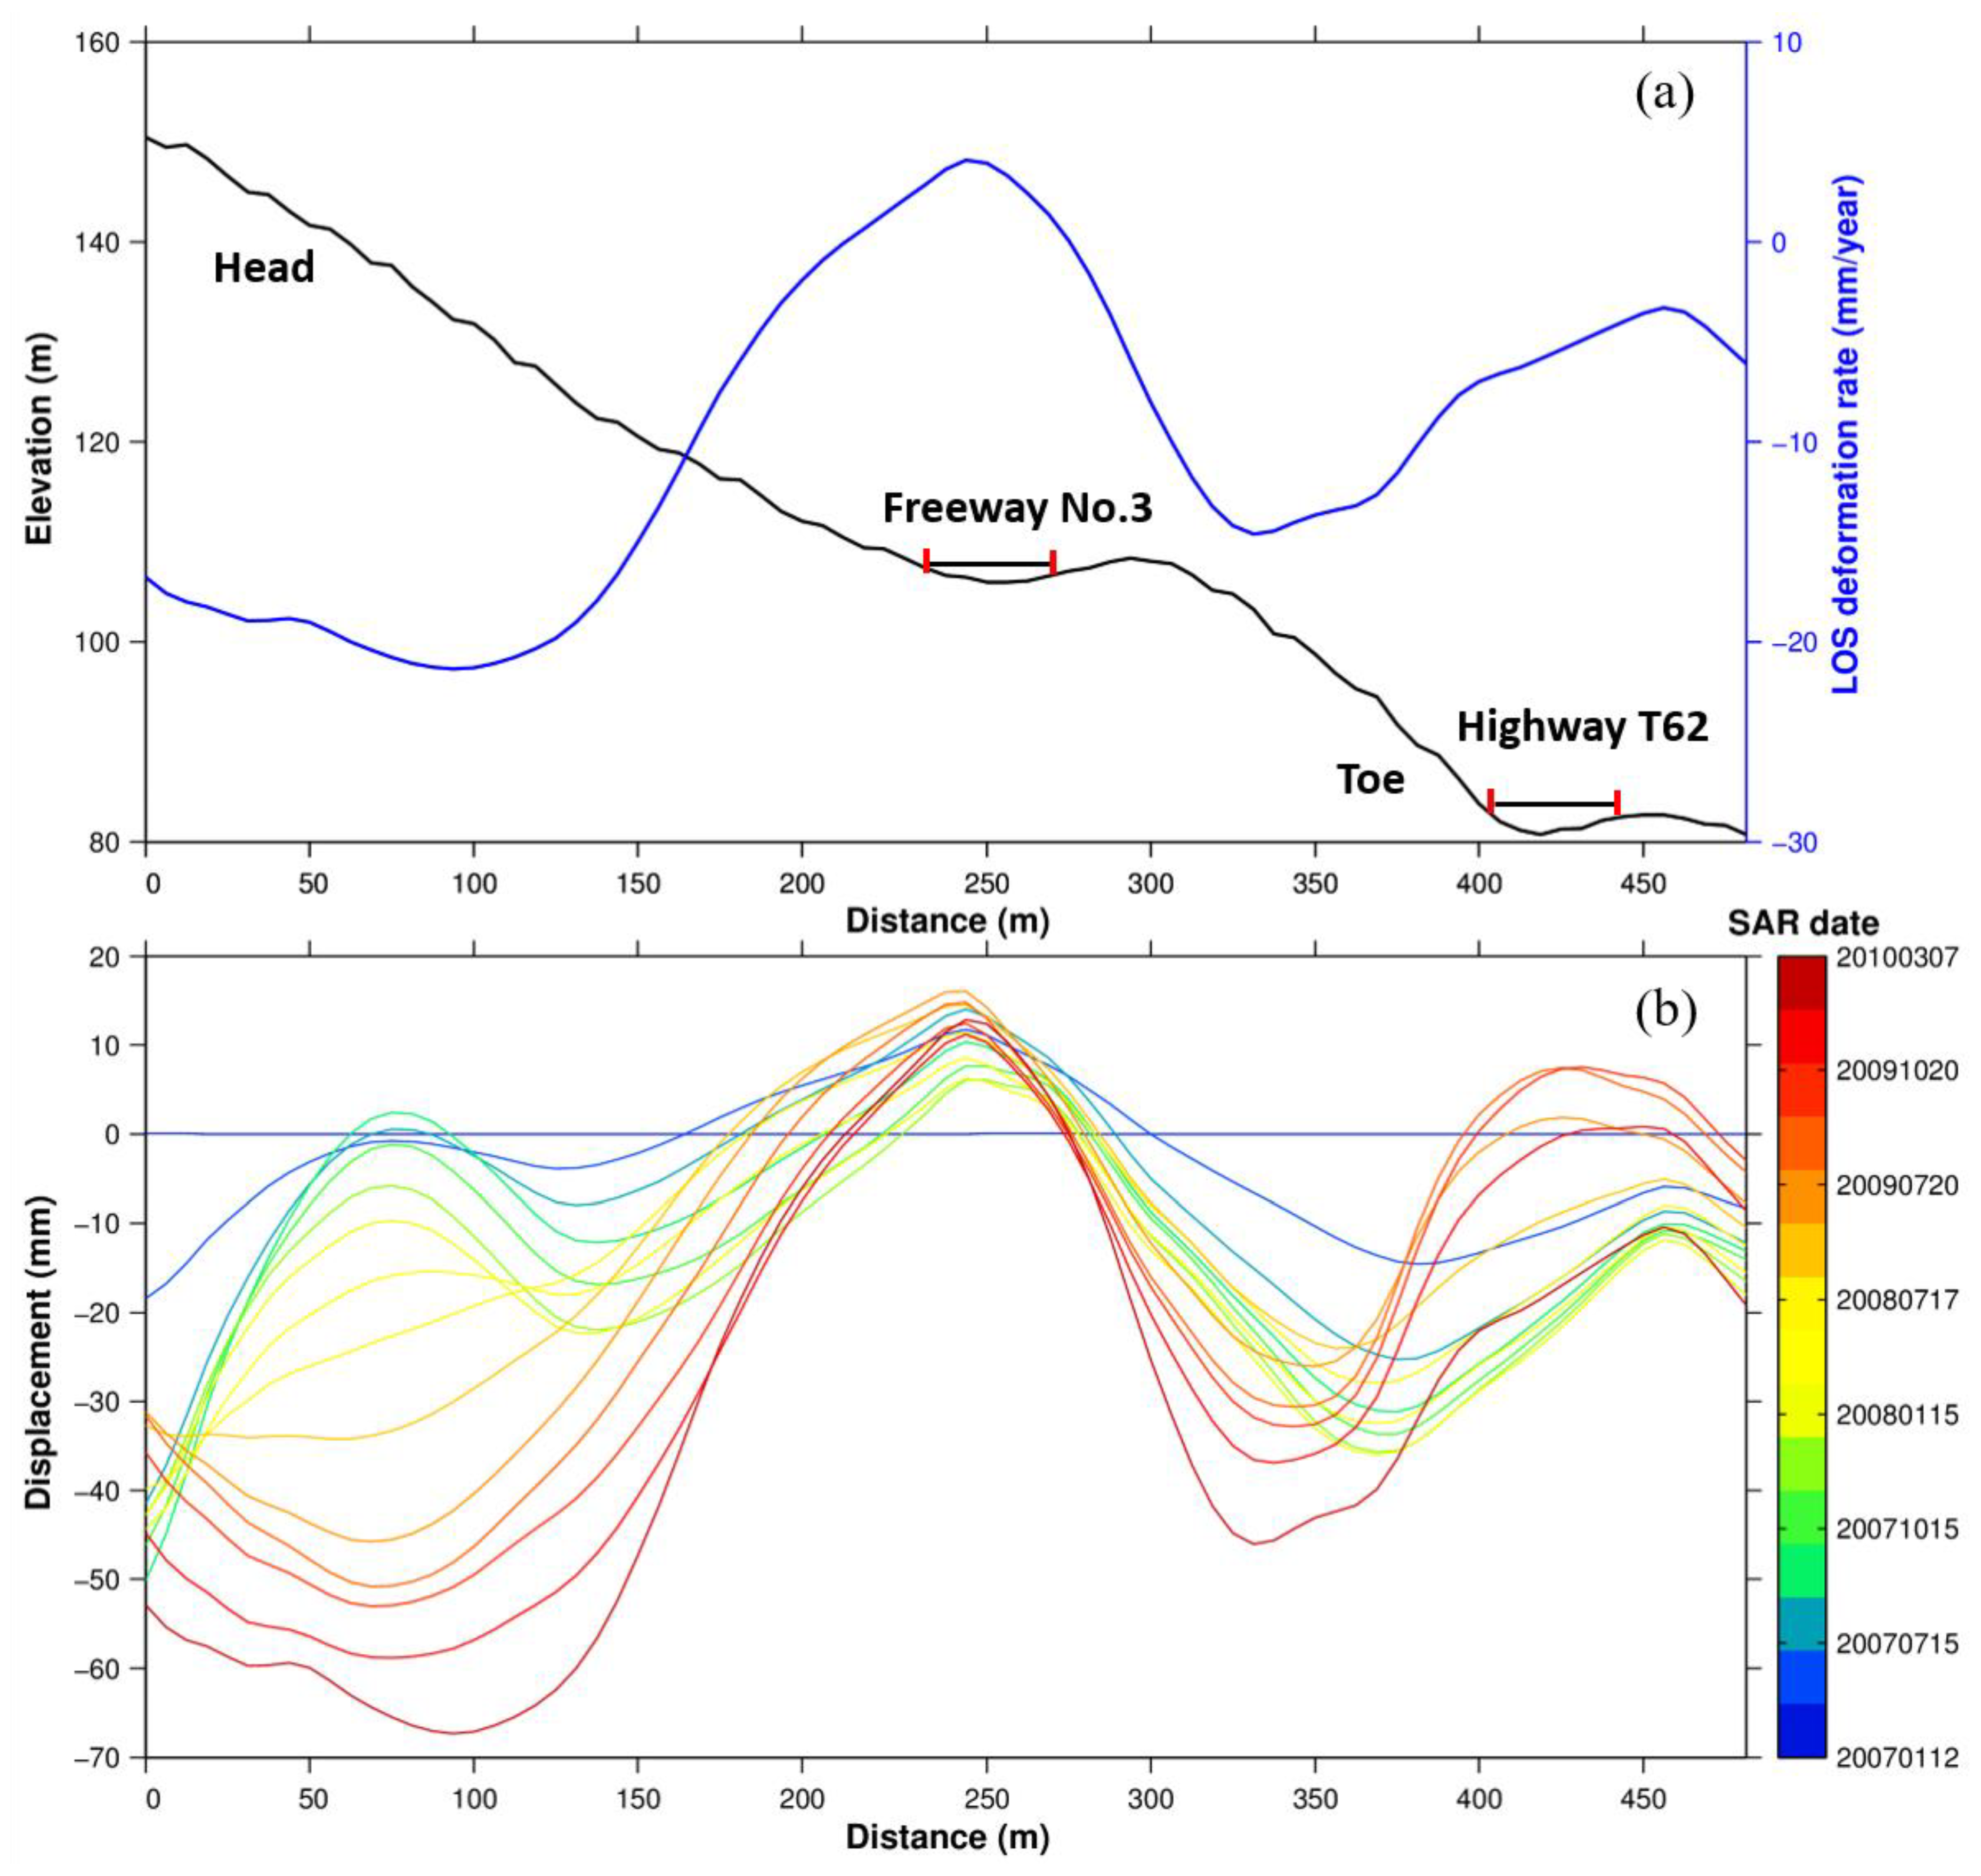
To further visualize the spatial and temporal pattern of the landslide, we extracted the profile from the average deformation rate and the cumulative displacements in the sliding zone. The profile, which is denoted by black dashed line in Figure 7, has a head-to-toe length of approximately 480 m and elevation change of approximately 70 m in the northeast-southwest direction. From Figure 10, we can see that the downslope movement decreases along the slope and even uplift near the road, indicating that the retaining wall of the side slope played a role to restraining the sliding mass. The area with active movement and the highest LOS velocity is located on the upper edge of the side slope, which is between the head scarp at the hilltop and Freeway No. 3 at the base of the slope.
According to the on-site measurement at several different positions, the average strike of the bedding plane is approximately from N10°E to N32°E with a dip angle between 12°SE to 15°SE. On the other hand, the strike of both slopes to either side of the landslide is N33°E, and its bedding plane dip angle is only approximately 10°. This finding not only means that the collapse mode involves a detached block slide along weak planes wherein the dip direction of a weak plane is nearly parallel to the slope surface. It also implies that the failure mechanism was triggered by a translational slide [3,4,31].
The field survey results reveal that the dip slope failure surface was along a shale bedding plane within sandstone and shale interbeds (Figure 2). To the south, the sliding block failed along the upper edge of the first layer of the anchor-reinforced slope, while in the north, the slide began near the base of the first layer of the anchor-reinforced slope. Although exposed slickensides were apparent, no water was extruded from the sliding block or from the edge of sliding zone, and the steel strands from rock anchors were found locally within the region.
Upon examination of the broken rock anchor heads that slid to the top of the hill on the eastern side of the slope, it was found that some steel strands remaining inside the anchor heads were seriously corroded and torn. Because the fractures in these steel strands are mostly corroded and tainted, they are considered old fractures. It is therefore inferred that the said steel strands may have broken a significant amount of time before this incident. The slow downslope movement could be responsible for the gradual process of anchorage loss before the slope collapsed.

5.2. Correlation with Rainfall

It has been well-documented that the ground movement of landslide evolves in response to variation of precipitation [5,6,48]. Infiltration of surface water causes an increase in pore-water pressure and the driving force of slope failure, which in turn decreases the effective normal stress and resisting friction along the shear zone [49,50]. To investigate the temporal correlation between landslide movement and precipitation in this study, we compare precipitation and the displacement time series obtained from our InSAR measurements. We use precipitation data from five surrounding meteorological stations within 15 km of the landslide location and calculate their mean value to use as the estimated rainfall on the studied slope. Then, we calculate the average amount of incremental displacement for each time period from the enclosed landslide region in Figure 7. The correlation between the incremental displacement from InSAR and the precipitation measurements (Figure 11) shows that the landslide has intermittent movement in the time series that correlates with rainfall. It is observed that the study area generally has high rainfall in October and December and the active movement clearly accelerates during these periods. Although the correlation is not perfect, a similar temporal pattern can be found between precipitation and incremental displacement, especially in the period from January 2007 to October 2008. According to the InSAR time-series analysis results, the landslide activity of the slope can be divided into four stages. The first stage is between January and July 2007 with insignificant downward movement. Then, between July 2007 and January 2008, the slope displacement rate obviously increased with a displacement of -15mm. Between January 2008 and July 2008, the slope became stabilized again with insignificant displacement. As ALOS did not capture any image of Taiwan between October 2008 and July 2009, it is difficult to evaluate the slope deformation during this period. Nevertheless, the slope’s overall displacement rate still reached -10 mm between July 2008 and July 2009. Finally, the last stage was between July 2009 and March 2010, where the slope’s overall displacement rate was -20 mm. Comparing with the previous two stages (January to July 2007, and January to July 2007), the overall slope deformation continued in October 2009 during the dry season. The underlying mechanism can be summarized as follows. The permeable and weathered upper layer of sandstone provides favorable condition for the infiltration of rainfall into the lower shear layer, which is relatively impermeable and hampers drainage water. The accumulation of water at the stratigraphic boundary reduces the resisting friction and causes the corrosion of ground anchors. When the force of the sliding rock mass exceeds the supporting force from the rock anchors and resisting friction, the slope is inclined to move downwards, triggering a major landslide.

5.3. Performance of InSAR Technique on Detecting and Monitoring Landslides

In this study, we use 15 ALOS/PALSAR images to generate full combination of 105 interferograms, which provide sufficient observations for the deformation analysis. The following three factors contribute to the improvement of the density and reliability of deformation signal in densely vegetated environments.
  • Coherent point selection: although PS has stable scatterering behavior over long-term periods, the sparse distribution of PS in rural areas compromises the efficiency of landslide displacement retrieval. To increase the density of coherent measurements, not only PS points are included in the processing analysis, but also DS points, which are widely distributed in mountainous regions and correspond to ground targets with high sensitivity to spatial and temporal baselines.
  • Interval phase estimation: the objective of this procedure is to obtain sufficient optimized phase measurements, which involves phase denoising and phase unwrapping. In traditional processing flow, phase denoising and phase unwrapping are carried out separately (e.g., phase denoising is achieved by phase triangulation [33], while phase unwrapping is implemented by minimum cost flow (MCF) [51]). However, the separated processes will introduce extra estimation error due to necessary approximations and presumptions in each step [52]. On the contrary, in this study, we apply an arc-based phase estimation approach to jointly conduct phase denoising and phase unwrapping. The linear formulation via this method ensures the estimation efficiency and quality of the phase optimization.
  • Systematic error correction: Multiple error sources exist in phase measurements despite the implementation of phase optimization. In this study, topographic residual and height-dependent atmospheric delays are the most prominent (Figure 6). The component-based method provides an efficient way to correct the topographic residual without requiring a priori deformation model. Although the joint model is time-consuming, it simultaneously estimates height-dependent atmospheric delays, orbital error and deformation signal, avoiding estimation bias caused by confounding processes [47].
The developed MTInSAR method demonstrates the applicability of InSAR technique in determining landslide boundary and assessing slope instability, especially where ground truth data are scarce. However, some limitations of this method still exist. Firstly, although L-band ALOS\PALSAR data has good performance in the presence of dense vegetation and phase optimization further reduces decoherence noise, it cannot be extended to all types of ground surfaces and SAR sensors, especially for higher frequency band data and areas with rapid surface changes which exceeds the maximum detectable phase range (i.e., 1/4 of the radar wavelength) [27]. Secondly, single track InSAR measurements can only retrieve the movement component along the LOS direction, and it shows low sensitivity to the movement that is perpendicular to the LOS direction. This could be done with the aid of SAR amplitude information [53] or corner reflectors that provide high electromagnetic reflectivity over vegetated slopes. Meanwhile, a higher temporal sampling could increase the chance of capturing more detailed deformation variation and finding the precursor of the failure process. Secondly, single track InSAR measurements can only retrieve the movement component along the LOS direction, and it shows low sensitivity to the movement that is perpendicular to the LOS direction. To remedy the lack of information, exploiting additional assumptions on ground movement or combing ascending and descending tracks could potentially recover the actual slope displacement.

6. Conclusions

An optimized MTInSAR approach based on the integrated use of PSs and DSs has been developed in this study. The approach jointly deals with phase denoising and phase unwrapping, so avoid extra estimation error in each individual step. Systematic errors are corrected step-by-step according to their spatial and temporal characteristics. We apply this approach to analyze the precursor movement of the landslide failure along Freeway No. 3 in northern Taiwan. The analysis results indicate that before the catastrophic landslide failure, variable downslope movement occurred along this dip slope. The spatial and temporal variations in deformation are in good agreement with previous studies from field and laboratory investigations. The temporal behaviors further reveal that the time-series displacement of the slope is correlated with the local precipitation. This study demonstrates the informative and beneficial contribution provided by InSAR technique in landslide research, especially where ground surface is covered by dense vegetation and ground truth data are scarce. One insight from this slope failure analysis is that landslide failure, either along natural or artificial slopes, have long-term signs of subtle movement that can be detected by satellite radar several months before the final collapse. Continuous safety inspection and monitoring using InSAR techniques could be considered as an efficient way to examine the life cycles of such geotechnical structures.

Author Contributions

Conceptualization, H.L., R.-F.C. and X.D.; data curation, H.L. and R.-F.C.; formal analysis, L.Z. and R.-F.C.; investigation, H.L. and R.-F.C.; methodology, H.L., X.L. and L.Z.; resources, K.-L.C., C.-S.W., C.-S.C. and C.-Y.C.; validation, K.-L.C., C.-S.W., C.-S.C. and C.-Y.C.; funding acquisition, X.L., L.Z., R.-F.C., and X.D.; supervision L.Z., R.-F.C. and X.D.; writing—original draft preparation, H.L., X.L., R.-F.C. and L.Z.; writing—review and editing, L.Z. and R.C All authors have read and agreed to the published version of the manuscript.

Funding

The research was funded by the China Postdoctoral Science Foundation (2019M650830), the National Natural Science Foundation of China (No. 41774023), the Research Grants Council (RGC) of the Hong Kong Special Administrative Region (Project Nos. PolyU 152232/17E and 152164/18E), MOST-108-2116-M-034-004- and the CECI Engineering Consultants, Inc. R&D plan 2019 No. 08923.

Acknowledgments

The ALOS PALSAR data used in the study are copyrighted by Japan Aerospace Exploration Agency (Nos. ER2A2N045, ER2A2N063 and 3381).

Conflicts of Interest

The authors declare no conflict of interest.

References

  1. Wasowski, J.; Bovenga, F. Remote Sensing of Landslide Motion with Emphasis on Satellite Multitemporal Interferometry Applications. In Landslide Hazards, Risks and Disasters; Elsevier BV: Amsterdam, The Netherlands, 2015; pp. 345–403. [Google Scholar]
  2. Ochiai, H.; Sammori, T.; Okada, Y. Landslide Experiments on Artificial and Natural Slopes. In Progress in Landslide Science; Springer Science and Business Media LLC: Berlin, Germany, 2007; pp. 209–226. [Google Scholar]
  3. Liao, H.J.; Lee, W.F. Forensic Study on the Dip Slope Failure of Freeway No.3 at Chainage 3.1K. J. Perform. Constr. Facil. 2011, 27, 116–131. [Google Scholar] [CrossRef]
  4. Lee, W.F.; Liao, H.J.; Chang, M.H.; Wang, C.W.; Chi, S.Y.; Lin, C.C. Failure Analysis of a Highway Dip Slope Slide. J. Perform. Constr. Facil. 2013, 27, 116–131. [Google Scholar] [CrossRef]
  5. Sun, Q.; Zhang, L.; Ding, X.; Hu, J.; Li, Z.; Zhu, J. Slope deformation prior to Zhouqu, China landslide from InSAR time series analysis. Remote. Sens. Environ. 2015, 156, 45–57. [Google Scholar] [CrossRef]
  6. Tong, X.; Schmidt, D. Active movement of the Cascade landslide complex in Washington from a coherence-based InSAR time series method. Remote. Sens. Environ. 2016, 186, 405–415. [Google Scholar] [CrossRef]
  7. Dai, K.; Li, Z.; Xu, Q.; Burgmann, R.; Milledge, D.G.; Tomas, R.; Fan, X.; Zhao, C.; Liu, X.; Peng, J.; et al. Entering the Era of Earth Observation-Based Landslide Warning Systems: A Novel and Exciting Framework. IEEE Geosci. Remote. Sens. Mag. 2020, 8, 136–153. [Google Scholar] [CrossRef] [Green Version]
  8. Carlà, T.; Intrieri, E.; Raspini, F.; Bardi, F.; Farina, P.; Ferretti, A.; Colombo, D.; Novali, F.; Casagli, N. Perspectives on the prediction of catastrophic slope failures from satellite InSAR. Sci. Rep. 2019, 9, 14137–14139. [Google Scholar] [CrossRef] [Green Version]
  9. Massonnet, D.; Feigl, K.L. Radar interferometry and its application to changes in the Earth’s surface. Rev. Geophys. 1998, 36, 441–500. [Google Scholar] [CrossRef] [Green Version]
  10. Hanssen, R.F. Radar Interferometry: Data Interpretation and Error Analysis; Earth and Environmental Science Kluwer Academic Publishers: Dordrecht, The Netherlands, 2001; Volume 2, p. 308. [Google Scholar]
  11. Ferretti, A.; Prati, C.; Rocca, F. Permanent scatterers in SAR interferometry. IEEE Trans. Geosci. Remote. Sens. 2001, 39, 8–20. [Google Scholar] [CrossRef]
  12. Hooper, A.; Segall, P.; Zebker, H. Persistent scatterer interferometric synthetic aperture radar for crustal deformation analysis, with application to Volcán Alcedo, Galápagos. J. Geophys. Res. Space Phys. 2007, 112, B07407. [Google Scholar] [CrossRef] [Green Version]
  13. Kampes, B.M. Radar Interferometry: Persistent Scatterer Technique; Springer: Dordrecht The Netherlands, 2006. [Google Scholar]
  14. Costantini, M.; Falco, S.; Malvarosa, F.; Minati, F.; Trillo, F.; Vecchioli, F. Persistent Scatterer Pair Interferometry: Approach and Application to COSMO-SkyMed SAR Data. IEEE J. Sel. Top. Appl. Earth Obs. Remote. Sens. 2014, 7, 2869–2879. [Google Scholar] [CrossRef]
  15. Berardino, P.; Fornaro, G.; Lanari, R.; Sansosti, E. A new algorithm for surface deformation monitoring based on small baseline differential SAR interferograms. IEEE Trans. Geosci. Remote. Sens. 2002, 40, 2375–2383. [Google Scholar] [CrossRef] [Green Version]
  16. Schmidt, D.A.; Bürgmann, R. Time-dependent land uplift and subsidence in the Santa Clara valley, California, from a large interferometric synthetic aperture radar data set. J. Geophys. Res. Space Phys. 2003, 108, 2416. [Google Scholar] [CrossRef] [Green Version]
  17. Lanari, R.; Mora, O.; Manunta, M.; Mallorqui, J.J.; Berardino, P.; Sansosti, E. A small-baseline approach for investigating deformations on full-resolution differential SAR interferograms. IEEE Trans. Geosci. Remote. Sens. 2004, 42, 1377–1386. [Google Scholar] [CrossRef]
  18. Zhang, L.; Lu, Z.; Ding, X.; Jung, H.-S.; Feng, G.; Lee, C.-W. Mapping ground surface deformation using temporarily coherent point SAR interferometry: Application to Los Angeles Basin. Remote. Sens. Environ. 2012, 117, 429–439. [Google Scholar] [CrossRef]
  19. Ma, P.; Lin, H. Robust Detection of Single and Double Persistent Scatterers in Urban Built Environments. IEEE Trans. Geosci. Remote. Sens. 2015, 54, 2124–2139. [Google Scholar] [CrossRef]
  20. Gernhardt, S.; Bamler, R. Deformation monitoring of single buildings using meter-resolution SAR data in PSI. ISPRS J. Photogramm. Remote. Sens. 2012, 73, 68–79. [Google Scholar] [CrossRef]
  21. Fialko, Y. Evidence of fluid-filled upper crust from observations of postseismic deformation due to the 1992Mw7.3 Landers earthquake. J. Geophys. Res. Space Phys. 2004, 109, 08401. [Google Scholar] [CrossRef] [Green Version]
  22. Lu, Z.; Dzurisin, D. InSAR Imaging of Aleutian Volcanoes; Springer Science and Business Media LLC: Berlin, Germany, 2014; pp. 87–345. [Google Scholar]
  23. Gong, W.; Darrow, M.M.; Meyer, F.J.; Daanen, R.P. Reconstructing movement history of frozen debris lobes in northern Alaska using satellite radar interferometry. Remote. Sens. Environ. 2019, 221, 722–740. [Google Scholar] [CrossRef]
  24. Qu, F.; Lu, Z.; Zhang, Q.; Bawden, G.W.; Kim, J.-W.; Zhao, C.; Qu, W. Mapping ground deformation over Houston–Galveston, Texas using multi-temporal InSAR. Remote. Sens. Environ. 2015, 169, 290–306. [Google Scholar] [CrossRef]
  25. Dong, J.; Zhang, L.; Tang, M.; Liao, M.; Xu, Q.; Gong, J.; Ao, M. Mapping landslide surface displacements with time series SAR interferometry by combining persistent and distributed scatterers: A case study of Jiaju landslide in Danba, China. Remote. Sens. Environ. 2018, 205, 180–198. [Google Scholar] [CrossRef]
  26. Dai, K.; Li, Z.; Tomás, R.; Liu, G.; Yu, B.; Wang, X.; Cheng, H.; Chen, J.; Stockamp, J. Monitoring activity at the Daguangbao mega-landslide (China) using Sentinel-1 TOPS time series interferometry. Remote. Sens. Environ. 2016, 186, 501–513. [Google Scholar] [CrossRef] [Green Version]
  27. Wasowski, J.; Bovenga, F. Investigating landslides and unstable slopes with satellite Multi Temporal Interferometry: Current issues and future perspectives. Eng. Geol. 2014, 174, 103–138. [Google Scholar] [CrossRef]
  28. Zhang, L.; Ding, X.; Lu, Z. Ground deformation mapping by fusion of multi-temporal interferometric synthetic aperture radar images: A review. Int. J. Image Data Fusion 2015, 6, 1–25. [Google Scholar] [CrossRef]
  29. Chen, C.-W.; Tung, Y.-S.; Liou, J.-J.; Li, H.-C.; Cheng, C.-T.; Chen, Y.-M.; Oguchi, T. Assessing landslide characteristics in a changing climate in northern Taiwan. Catena 2019, 175, 263–277. [Google Scholar] [CrossRef]
  30. Chen, H.; Dadson, S.; Chi, Y.-G. Recent rainfall-induced landslides and debris flow in northern Taiwan. Geomorphology 2006, 77, 112–125. [Google Scholar] [CrossRef]
  31. Chen, L.-K.; Chen, S.-C.; Ke, M.-C. Investigation of the Freeway No. 3 Landslide in Taiwan. In Engineering Geology for Society and Territory—Volume 2; Springer Science and Business Media LLC: Berlin, Germany, 2015; pp. 2093–2096. [Google Scholar]
  32. Tadono, T.; Ishida, H.; Oda, F.; Naito, S.; Minakawa, K.; Iwamoto, H. Precise Global DEM Generation by ALOS PRISM. ISPRS Ann. Photogramm. Remote. Sens. Spat. Inf. Sci. 2014, 71–76. [Google Scholar] [CrossRef] [Green Version]
  33. Ferretti, A.; Fumagalli, A.; Novali, F.; Prati, C.; Rocca, F.; Rucci, A. A New Algorithm for Processing Interferometric Data-Stacks: SqueeSAR. IEEE Trans. Geosci. Remote. Sens. 2011, 49, 3460–3470. [Google Scholar] [CrossRef]
  34. Wang, Y.; Zhu, X.X.; Bamler, R. Retrieval of phase history parameters from distributed scatterers in urban areas using very high resolution SAR data. ISPRS J. Photogramm. Remote. Sens. 2012, 73, 89–99. [Google Scholar] [CrossRef] [Green Version]
  35. Jiang, M.; Ding, X.; Hanssen, R.F.; Malhotra, R.; Chang, L. Fast Statistically Homogeneous Pixel Selection for Covariance Matrix Estimation for Multitemporal InSAR. IEEE Trans. Geosci. Remote. Sens. 2014, 53, 1213–1224. [Google Scholar] [CrossRef]
  36. González, P.J.; Fernández, J. Error estimation in multitemporal InSAR deformation time series, with application to Lanzarote, Canary Islands. J. Geophys. Res. Space Phys. 2011, 116, B10404. [Google Scholar] [CrossRef] [Green Version]
  37. Zhang, L.; Ding, X.; Lu, Z. Modeling PSInSAR Time Series Without Phase Unwrapping. IEEE Trans. Geosci. Remote. Sens. 2010, 49, 547–556. [Google Scholar] [CrossRef]
  38. Liang, H.; Zhang, L.; Ding, X.; Lu, Z.; Li, X.; Hu, J.; Wu, S. Suppression of Coherence Matrix Bias for Phase Linking and Ambiguity Detection in MTInSAR. IEEE Trans. Geosci. Remote. Sens. 2020, 1–12. [Google Scholar] [CrossRef]
  39. Yang, Y.; Song, L.; Xu, T. Robust estimator for correlated observations based on bifactor equivalent weights. J. Geod. 2002, 76, 353–358. [Google Scholar] [CrossRef]
  40. Samiei-Esfahany, S.; Martins, J.E.; Van Leijen, F.; Hanssen, R.F. Phase Estimation for Distributed Scatterers in InSAR Stacks Using Integer Least Squares Estimation. IEEE Trans. Geosci. Remote. Sens. 2016, 54, 5671–5687. [Google Scholar] [CrossRef] [Green Version]
  41. Andersen, R. Modern Methods for Robust Regression; SAGE Publications: Thousand Oaks, CA, USA, 2008. [Google Scholar] [CrossRef]
  42. Huber, P.J.; Ronchetti, E.M. Robust Statistics; Wiley: New York, NY, USA, 2009. [Google Scholar]
  43. Pepe, A.; Lanari, R. On the Extension of the Minimum Cost Flow Algqorithm for Phase Unwrapping of Multitemporal Differential SAR Interferograms. IEEE Trans. Geosci. Remote. Sens. 2006, 44, 2374–2383. [Google Scholar] [CrossRef]
  44. Du, Y.; Zhang, L.; Feng, G.; Lu, Z.; Sun, Q. On the Accuracy of Topographic Residuals Retrieved by MTInSAR. IEEE Trans. Geosci. Remote. Sens. 2016, 55, 1053–1065. [Google Scholar] [CrossRef]
  45. Liang, H.; Zhang, L.; Lu, Z.; Li, X. Nonparametric Estimation of DEM Error in Multitemporal InSAR. IEEE Trans. Geosci. Remote. Sens. 2019, 57, 10004–10014. [Google Scholar] [CrossRef]
  46. Liang, H.; Zhang, L.; Ding, X.; Lu, Z.; Li, X. Toward Mitigating Stratified Tropospheric Delays in Multitemporal InSAR: A Quadtree Aided Joint Model. IEEE Trans. Geosci. Remote. Sens. 2018, 57, 291–303. [Google Scholar] [CrossRef]
  47. Zhang, L.; Ding, X.; Lu, Z.; Jung, H.-S.; Hu, J.; Feng, G. A Novel Multitemporal InSAR Model for Joint Estimation of Deformation Rates and Orbital Errors. IEEE Trans. Geosci. Remote. Sens. 2013, 52, 3529–3540. [Google Scholar] [CrossRef] [Green Version]
  48. Handwerger, A.L.; Roering, J.J.; Schmidt, D.A. Controls on the seasonal deformation of slow-moving landslides. Earth Planet. Sci. Lett. 2013, 377, 239–247. [Google Scholar] [CrossRef]
  49. Iverson, R.M.; Major, J.J. Rainfall, ground-water flow, and seasonal movement at Minor Creek landslide, northwestern California: Physical interpretation of empirical relations. GSA Bull. 1987, 99, 579. [Google Scholar] [CrossRef]
  50. Fell, R.; Corominas, J.; Bonnard, C.; Cascini, L.; Leroi, E.; Savage, W.Z. Guidelines for landslide susceptibility, hazard and risk zoning for land-use planning. Eng. Geol. 2008, 102, 99–111. [Google Scholar] [CrossRef] [Green Version]
  51. Constantini, M. A novel phase unwrapping method based on network programming. IEEE Trans. Geosci. Remote. Sens. 1998, 36, 813–821. [Google Scholar] [CrossRef]
  52. Chen, R.; Yu, W.; Wang, R.; Liu, G.; Shao, Y. Integrated Denoising and Unwrapping of InSAR Phase Based on Markov Random Fields. IEEE Trans. Geosci. Remote. Sens. 2013, 51, 4473–4485. [Google Scholar] [CrossRef]
  53. Jia, H.; Wang, Y.; Ge, D.; Deng, Y.; Wang, R. Improved offset tracking for predisaster deformation monitoring of the 2018 Jinsha River landslide (Tibet, China). Remote Sens. Environ. 2020, 247. [Google Scholar] [CrossRef]
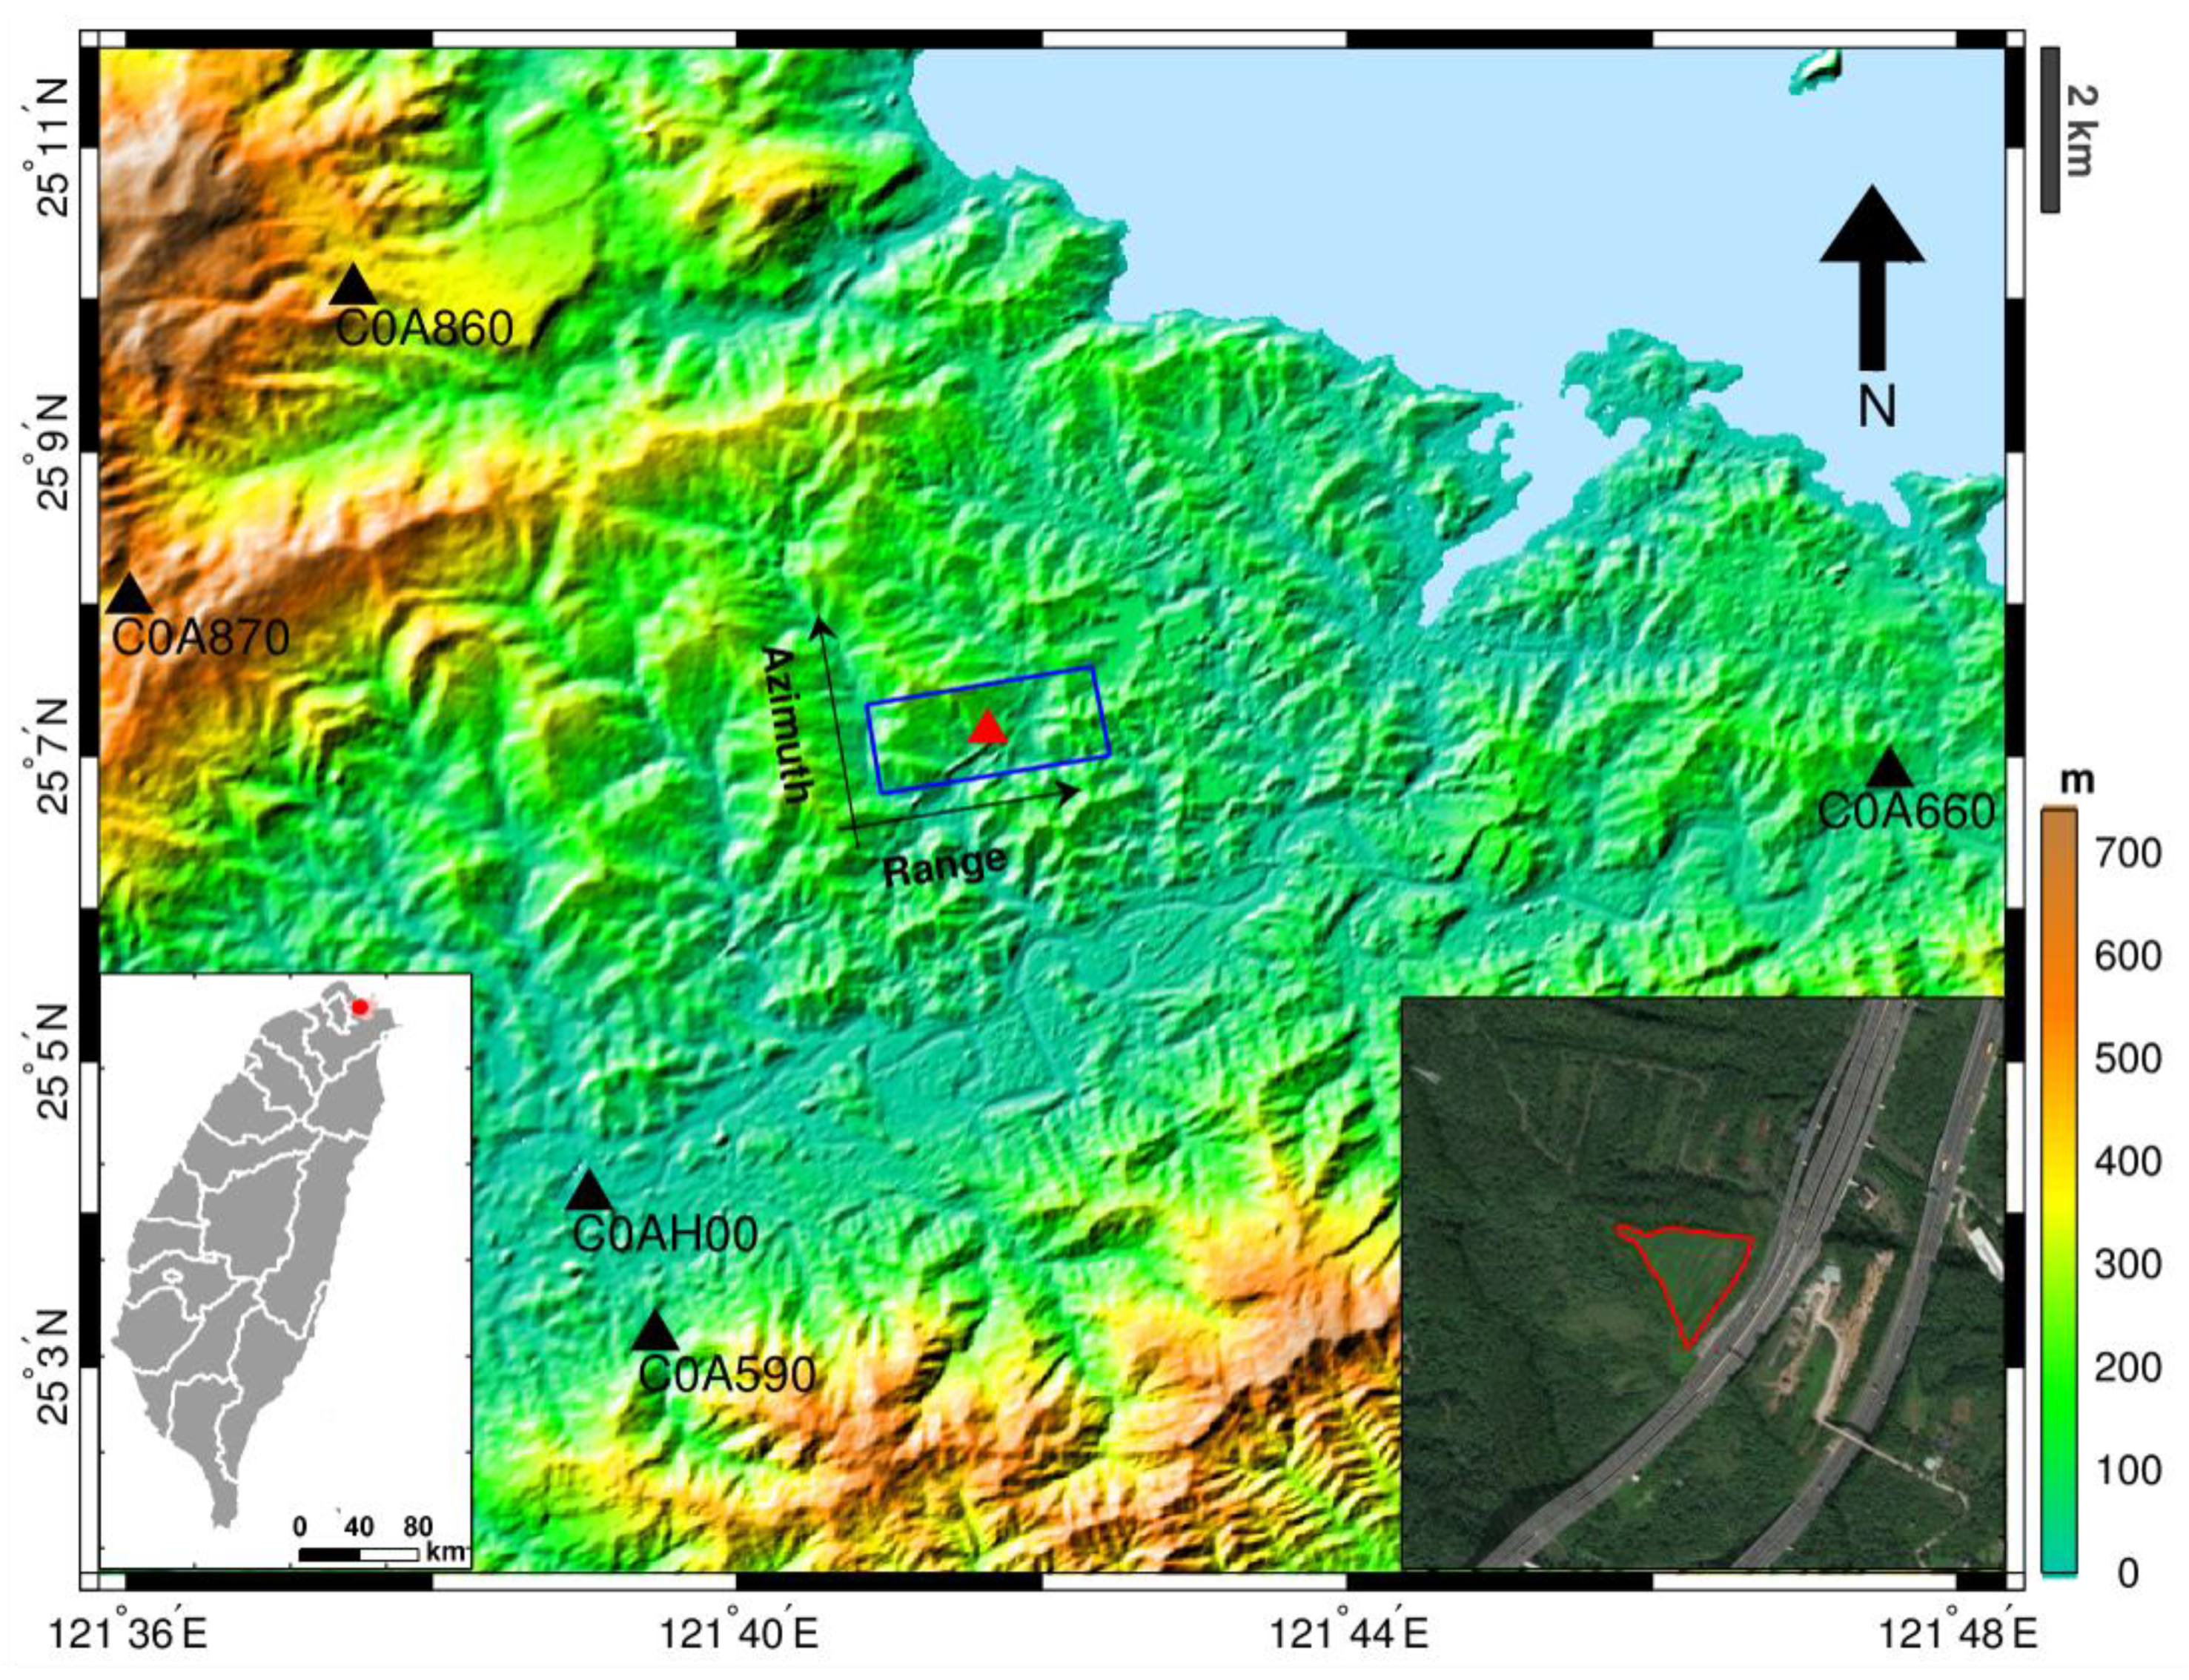
Figure 1. Shaded relief map the study area. The blue solid box represents the study area that is covered by the ascending ALOS/PALSAR dataset. The insert map to the lower left shows the location of Freeway No. 3 in Northern Taiwan. The optical image (acquired by DigitalGlobe on December 18, 2016) to the lower right shows the dense vegetation coverage. The red triangle indicates the location of the collapsed slope. The black triangles represent the meteorological sites that provide the daily precipitation data used in this study.
Remotesensing 12 02403 g001
Figure 2. Engineering geological profile of the artificial side slope after failure. The location of profile is indicated in Figure 7 (Modified from Figure 3 in [4]).
Remotesensing 12 02403 g002
Figure 3. Aerial photos taken from site after landslide. (a) Photo from northeast direction; (b) Failure plane during the removal of debris; (c) Photo from south direction.
Remotesensing 12 02403 g003
Figure 4. Spatial and temporal baselines of the generated interferograms from 105 combinations.
Remotesensing 12 02403 g004
Figure 5. Flowchart of the modified MTInSAR method used in this study. PS refers persistent scatterer; DS refers distributed scatterer; SHP means statistically homogeneous pixel.
Remotesensing 12 02403 g005
Figure 6. Four examples of interval phase estimation and systematic error correction. Four consecutive interferograms are displayed. (a) The first row represents the original single-looked interferograms; (b) The second row represents the consecutive interferograms after interval phase estimation in wrapped form. (c) The third row represents the consecutive interferograms after interval phase estimation in unwrapped form. (d) The fourth row represents the consecutive interferograms in unwrapped form after interval phase estimation and systematic error correction.
Remotesensing 12 02403 g006
Figure 7. Mean LOS deformation velocity map of the artificial side slope over Freeway No. 3 in 3D perspective. The color image and point of deformation is draped on the top of topography. The negative LOS displacement (blue) represents movement away from the satellite and indicates downslope movement. The red solid line outlines the area of landslide. The white circles indicate the location of selected points in (Figure 9). The black dash line marks the location displacement profile shown in Figure 2 and Figure 10.
Remotesensing 12 02403 g007
Figure 8. (a) Time-series displacement map of the artificial side slope along Freeway No. 3. (b) Average amount of cumulative displacement within the enclosed landslide region.
Remotesensing 12 02403 g008
Figure 9. Time-series displacements for four points along the artificial side slope. (a) Point 1. (b) Point 2. (c) Point 3. (d) Point 4.
Remotesensing 12 02403 g009
Figure 10. Profile of the landslide displacement along the artificial side slope. (a) Profile of elevation and mean LOS deformation velocity. (b) Profile of time-series displacement. The location of the profile is indicated in Figure 7.
Remotesensing 12 02403 g010
Figure 11. Comparison of the incremental downslope displacement (blue lines) with the average monthly precipitation (gray histogram).
Remotesensing 12 02403 g011