Article

Multi-Temporal UAV Data and Object-Based Image Analysis (OBIA) for Estimation of Substrate Changes in a Post-Bleaching Scenario on a Maldivian Reef

1
Department of Earth and Environmental Sciences, University of Milano-Bicocca, Piazza della Scienza 4, 20126 Milan, Italy
2
MaRHE Center (Marine Research and High Education Center), Magoodhoo Island, 20217 Faafu Atoll, Maldives
3
Habitat and Benthic Biodiversity Laboratory, Red Sea Research Center, King Abdullah University of Science and Technology (KAUST), 23955-6900 Thuwal, Saudi Arabia
*
Author to whom correspondence should be addressed.
Remote Sens. 2020, 12(13), 2093; https://doi.org/10.3390/rs12132093
Submission received: 12 May 2020 / Revised: 17 June 2020 / Accepted: 25 June 2020 / Published: 30 June 2020
(This article belongs to the Special Issue Advances in Remote Sensing of Coral Reefs)

Abstract

:
Coral reefs are declining worldwide as a result of the effects of multiple natural and anthropogenic stressors, including regional-scale temperature-induced coral bleaching. Such events have caused significant coral mortality, leading to an evident structural collapse of reefs and shifts in associated benthic communities. In this scenario, reasonable mapping techniques and best practices are critical to improving data collection to describe spatial and temporal patterns of coral reefs after a significant bleaching impact. Our study employed the potential of a consumer-grade drone, coupled with structure from motion and object-based image analysis to investigate for the first time a tool to monitor changes in substrate composition and the associated deterioration in reef environments in a Maldivian shallow-water coral reef. Three key substrate types (hard coral, coral rubble and sand) were detected with high accuracy on high-resolution orthomosaics collected from four sub-areas. Multi-temporal acquisition of UAV data allowed us to compare the classified maps over time (February 2017, November 2018) and obtain evidence of the relevant deterioration in structural complexity of flat reef environments that occurred after the 2016 mass bleaching event. We believe that our proposed methodology offers a cost-effective procedure that is well suited to generate maps for the long-term monitoring of changes in substrate type and reef complexity in shallow water.

Graphical Abstract

1. Introduction

Coral reefs are declining worldwide as a result of the effects of multiple natural and anthropogenic stressors, such as increased water temperature, ocean acidification, overfishing and land reclamation [1,2,3]. Among these factors, temperature-induced bleaching events have been reported to cause significant coral mortality in the Indo-Pacific Ocean, with two main destructive events in 1998 and 2016 [4,5,6,7,8].
One of the most critical consequences of a bleaching event is the loss of structural complexity, which seriously affects the ecological functionality of the ecosystem [9]. Biogenic reefs are formed by complex structures built by corals, that support a high diversity and abundance of related organisms, such as fish, mollusks, echinoderms and other invertebrates [10,11,12]. The resulting structural complexity of the reef also absorbs wave energy, preventing or decreasing shoreline erosion [13,14]. Thus, coral mortality reduces the diversity of reef marine organisms and increases erosion of the coastline. A significant loss in structural complexity was reported worldwide as a result of the two major coral bleaching events that took place in 1998 and 2016 [9,15].
Considering the increase in threats and the fragility of these environments, it seems clear that thorough time-series monitoring activities are of high importance. The data collected by remote sensing are the principal source of information that affords a synoptic overview of a vast portion of reefs [16,17]. Studies on the impacts on coral reef environments have commonly adopted satellite images. Free data from Sentinel and Landsat platforms, forming parts of the ESA (European Space Agency) and NASA (National Aeronautics and Space Administration) space programs, provide a great multi-temporal database of satellite imagery [18,19,20,21]. Additional solutions may involve commercial satellites, such as the Planet Dove satellite constellation, which provides daily coverage at 3.7 m resolution [22], or the use of aircraft integrated with sensors, such as LiDAR (light detection and ranging) to detect bottom rugosity [23]. However, the limitations on the use of these data are primarily related to their spatial resolutions (which are not suitable for undertaking studies on benthic communities in selected and small-scale coral reef areas) and secondarily related to adverse environmental and operational conditions that may prevail during surveys, including cloud coverage, high turbidity waters, breaking waves, limited access and costs. Other systems can be used to overcome most of these deficiencies. Low-altitude aerial and unmanned aerial vehicle (UAV) (or drones) surveys can collect data above reefs with a centimetric resolution, and they allow researchers to focus the efforts of data collection only during optimal weather conditions [24,25,26]. Furthermore, in the last several years, UAV platforms have become more affordable, and consumer-grade models have optimized the performance of battery life and camera image sensors [27,28,29].
The use of UAVs to collect data and their processing by applying photogrammetry-based techniques and object-based image analysis (OBIA) classification algorithms increases the speed of monitoring and mapping activities. Moreover, structure from motion (SfM) techniques can be applied to produce digital surface models (DSMs) that can be used to analyze not only the spatial distribution trends of the habitats but also their structural complexity [30]. Indeed, to date, most of the studies on structural complexity have been qualitative [13,15,31], and the majority of the in-field quantitative measurements have been made using the chain-and-type method [32], which is time-intensive and suffers from high variation [33]. Recently, underwater SfM photogrammetry has been used to simplify structural measurements in order to widen the spatial scale of the survey and to increase the resolution of the data [9,34,35,36,37]. However, underwater SfM is a time-consuming process and not suitable for monitoring large areas, thus reducing our understanding of an extensive process, despite the very high-resolution scale [38,39,40]. UAV imagery processed with SfM techniques can provide a low-cost and time-efficient alternative. Nevertheless, even though some authors have reported interesting applications of UAVs to collect imagery and bathymetric information ([24,33] among others), in contrast to in-water photogrammetric procedures (where thorough camera calibration is sufficient to correct the effects of refraction), when light passes between two different media (air and water), refraction causes the water depth to appear shallower and, consequently, the effect produced on data obtained from the application of SfM techniques may differ at each point of every image, causing errors in the accuracy of local horizontal and vertical measurements.
In our work we aimed to develop a new approach for analyzing point clouds, obtained by applying photogrammetric techniques on shallow water UAV imagery collected in the southern part of Faafu Atoll (Maldives). In particular, we acquired shallow-reef high-resolution images using a consumer-grade UAV from a few months after the 2016 bleaching event (February 2017) to two years later (November 2018), in condition of absence of wind, low tide and optimal location of the sun in order to avoid water motion and reflections. We firstly applied OBIA algorithms to automatically classify the orthomosaic map generated by SfM aerial photogrammetry to obtain a time-efficient, high-resolution and a reef-spatial scale monitoring of the change in substrate type, with ground control and assessment of accuracy as local horizontal measurements, thus avoiding the need of using the Digital Terrain Model (DTM) as source of pure bathymetric measurements. In addition we analyzed the complexity of the seafloor expressed by the rugosity index, assuming that the estimated accuracy of the obtained DTM and the OBIA classification can offer also a valid indication of the accuracy of the results obtained from terrain analysis.

2. Materials and Methods

2.1. Study Area

The Republic of Maldives is an archipelago composed of coral reef islands, grouped in a double chain structure in the middle of the Indian Ocean (Figure 1a). The 1192 islands of the archipelagos extend for 860 km from 7° 6′ 35″ N to 0°42′ 24″ S latitude. The Maldives cover an area of about 859,000 km2, but only 227.45 km2 is land area [41]. The majority of the territorial area consists of sea and coral reefs. The islands, generally with a mean elevation of less than 2 m above sea level, can be divided into three groups: inhabited, resort islands and uninhabited [42]. Therefore, coral reef ecosystems are vital for the Maldives in terms of economic income and shoreline protection from erosion. Fisheries and tourism industries are both dependent on the health status of the coral reefs, and numerous ecosystem services/benefits are provided by coral reefs to the local population [43]. However, in the last two decades, anthropogenic and natural impacts and global climate change have increased the threats to the Maldivian reefs. Sea surface temperature (SST) anomalies and the resulting bleaching events are among the main stress factors for the integrity of the coral reefs of the archipelagos [44]. From April to June 2016, the largest bleaching event since 1998 was registered, along with pronounced changes in coral communities in the following months [8]. Furthermore, predation by corallivores, such as the sea stars Acanthaster planci [45] and Culcita spp. [46] and the snail Drupella spp. [47], has exacerbated the effect of the bleaching event, increasing coral mortality and delaying coral recovery. Fieldwork and data collection were carried out in an ocean-facing reef in the southern part of Faafu Atoll (Figure 1b), where Magoodhoo island is located (Figure 1c). The reef rim, with highly transparent water and a maximum depth of 1.5 m, offers optimal conditions for UAV data collection [24,48,49]. Additionally, on the island, the MaRHE Center (http://marhe.unimib.it), a research and high educational center of the University of Milano-Bicocca, has operated since 2009. Therefore, thanks to the numerous research activities carried out by different researchers over time, the ecology and biology of the surrounding coral reefs are well known [46,50,51,52,53].
Our work monitored four selected portions of the entire Magoodhoo reef system, hereafter named Areas 1, 2, 3 and 4 (Figure 1c), from a few months after the bleaching event (February and March 2017) to the end of 2018 (October/November), more than two years later. Logistics reasons bounded the period of field data collection. Area 1 and Area 2 are both parts of the same reef flat area, which includes the reef crest that faces the open ocean to the south. The surveyed reef system is here exposed to the waves and the currents that come from the oceanic channel that separates Faafu and Dhaalu atolls. Area 3 and Area 4 are instead located toward the lagoon and lack a direct connection to the crest. Area 3 is a small subcircular patch reef confined in a minor and sheltered small-scale lagoon system, formed within the reef rim and bounded to the north by a tiny sub-elongated reef representing Area 4. Areas 1 and 2 are subject to very similar environmental conditions because they are included in the same wide geomorphic sector of the reef system, while Areas 3 and 4 represent unique small-scale reef sectors located in an area that is less exposed to ocean currents.

2.2. UAV Data Collection and Field Survey

DJI Phantom 4 was chosen for data acquisition. This consumer-grade UAV is a quadcopter with high sensing characteristics. It is equipped with a 1/2.3″ CMOS camera sensor (12.4 MP) that can collect RGB images with a resolution of 4000 × 3000 pixels and an integrated GPS/GLONASS system. DJI Phantom 4 is lightweight and easy to carry, and it can efficiently fly at low altitudes to obtain good-quality ground-resolution images. Additionally, easy take-off and landing procedures make this UAV a remarkable solution for low-height and short-range surveys. Metadata of the acquired images are recorded in an EXIF (exchangeable image file format) file, which incorporates information such as shutter speed, apertures, ISO (International Organization for Standardization) and GPS (global positioning system) coordinates (x, y and z).
In addition to the UAV surveys, four bionomic transects (i.e., perpendicular to the coastline), each approximately 200 m in length, were examined across the four monitored areas (Figure 1c) in order to identify the composition of the benthic community and validate the remote sensing data.

2.3. Flight Planning

The surveys were designed using DJI GS PRO [54], a flight planner distributed by DJI for use on an iPad device. This application enables detailed planning of all the aspects of the UAV mission: generating flight paths, setting camera parameters and directly checking data acquisition on the iPad display. For all the surveys, we set fixed flight and image acquisition parameters (Table 1).
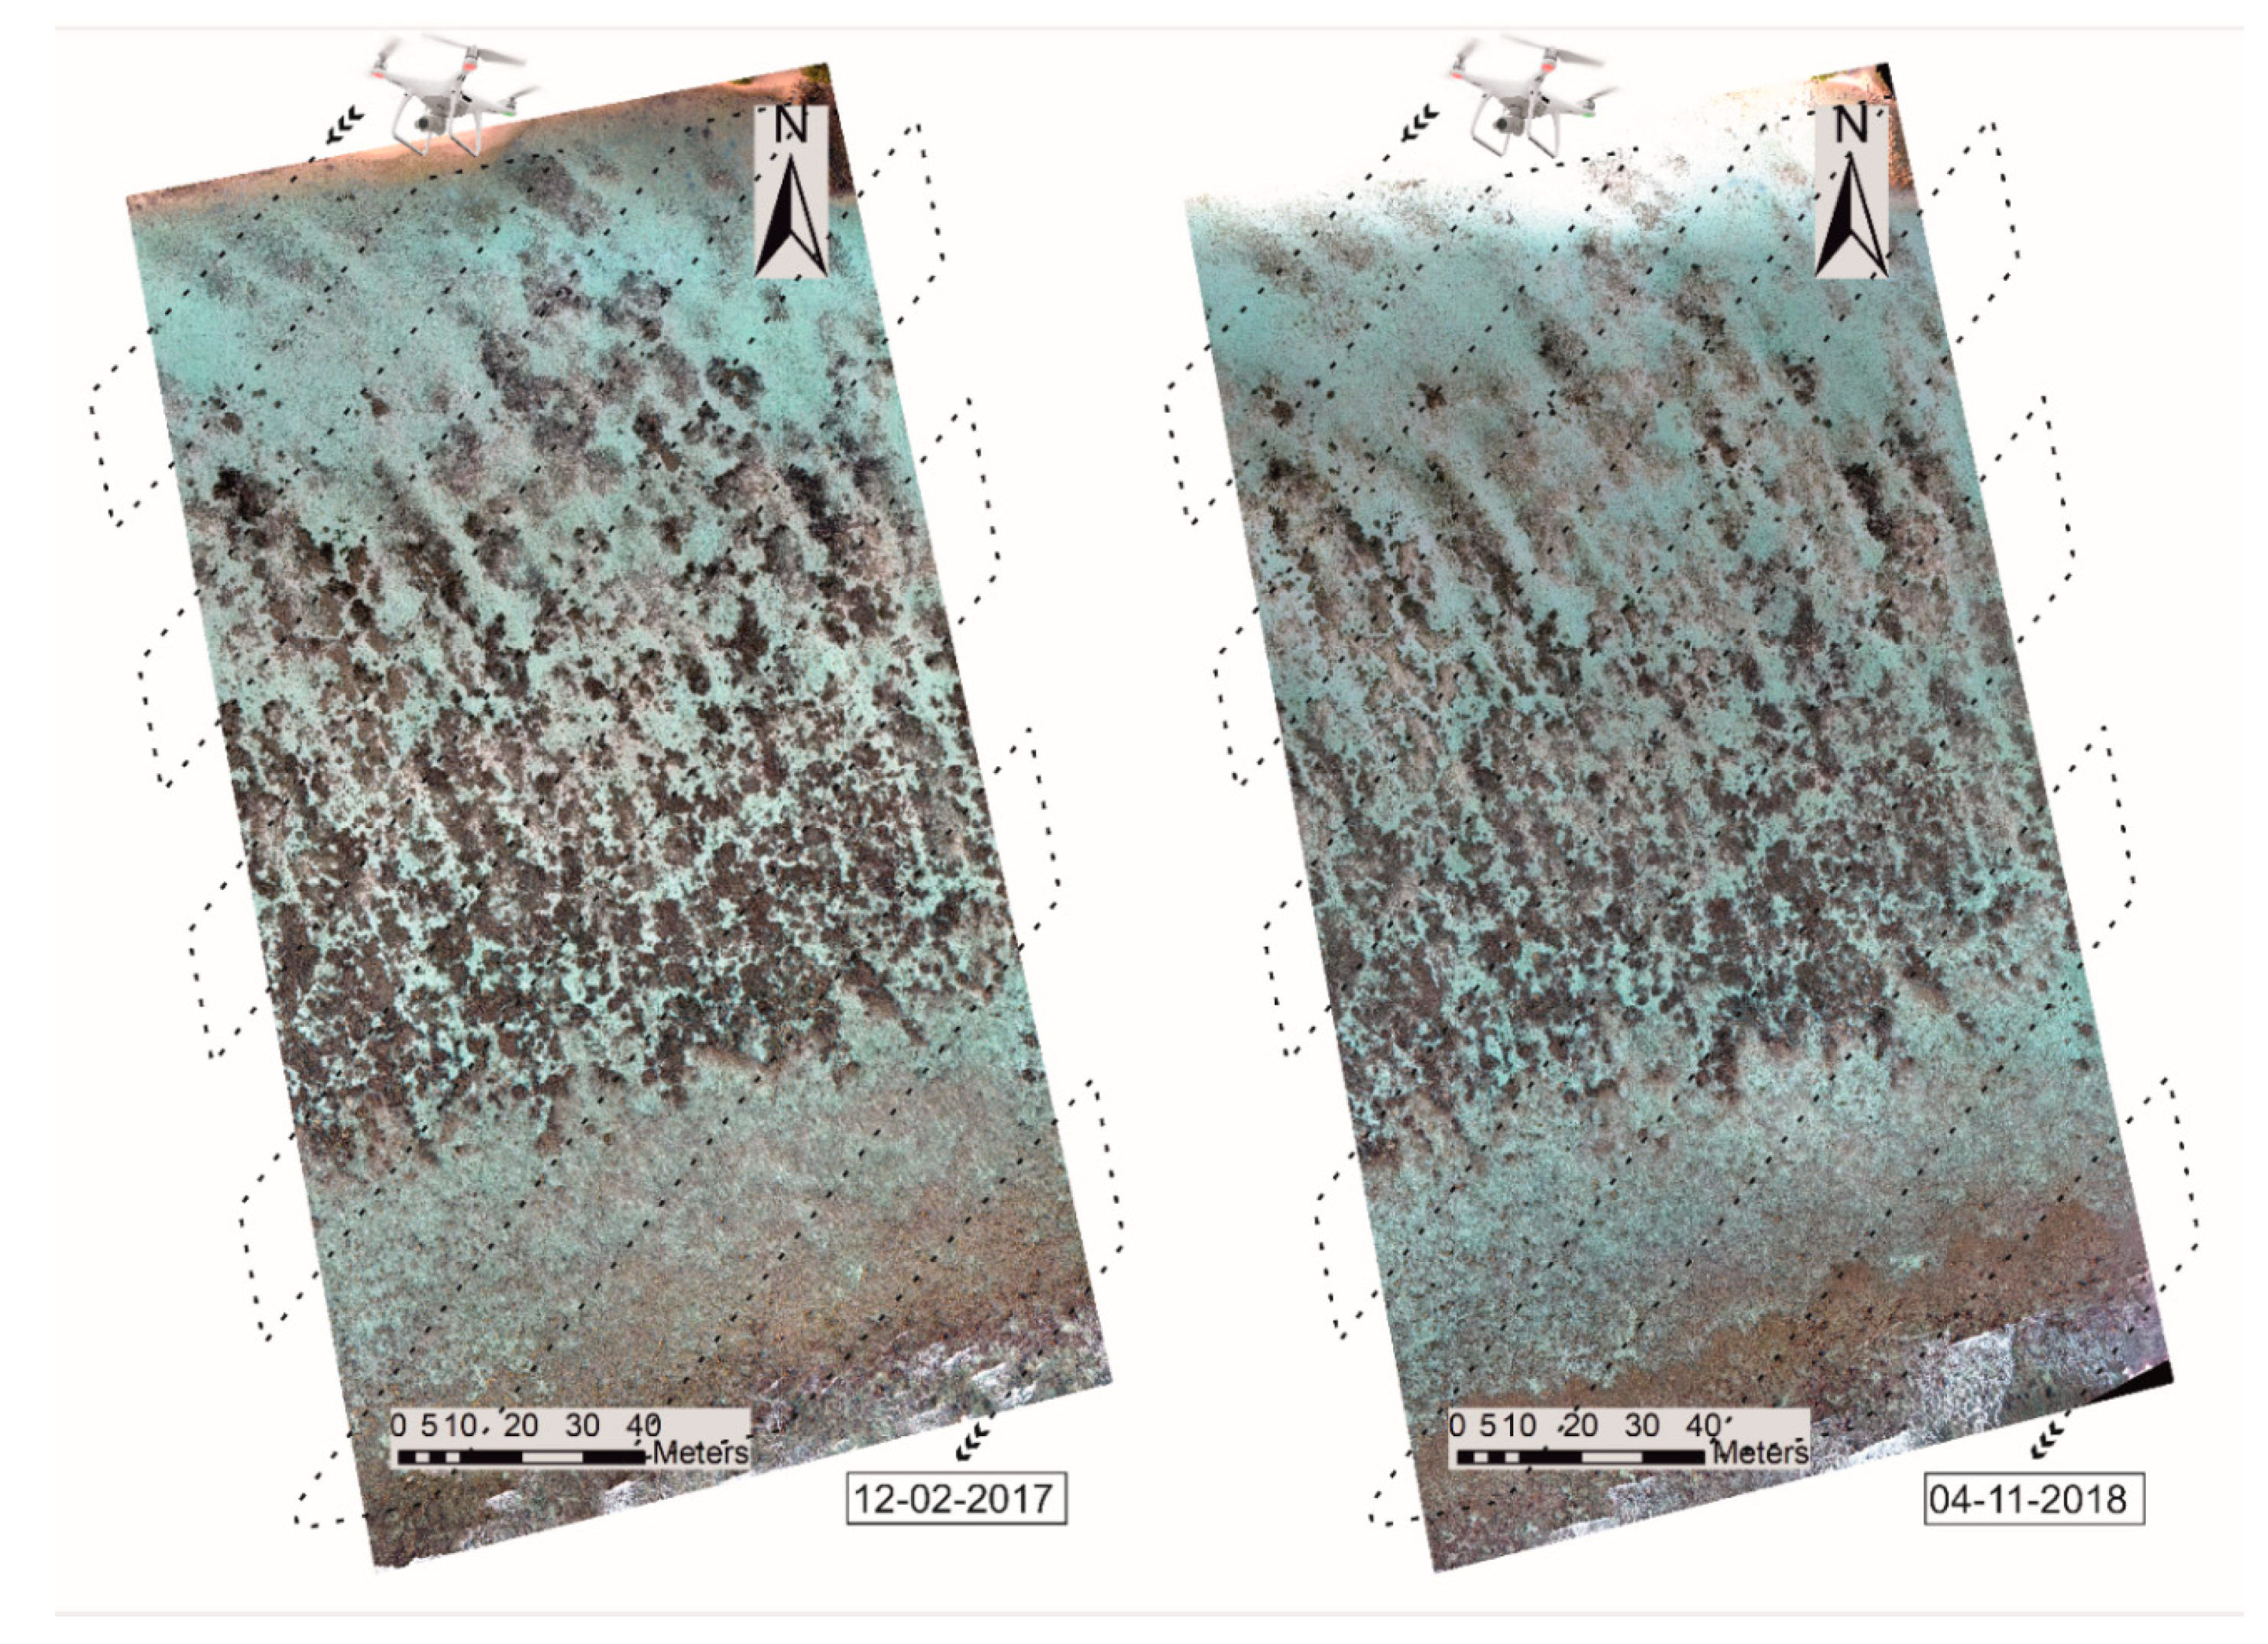
Additionally, in order to collect relevant data for temporal comparison, we selected similar environmental conditions for all surveys. During the 2017 and 2018 surveys (Figure 2), we always flew during low tide to reduce water column effects and with a low sun position in the horizon (half an hour after the sunrise or one hour before the sunset) to avoid the glint effect in images or inconvenient shadows for data processing [24]. Moreover, we chose days with no or little wind (less than 5 m/s) and, consequently, a calm sea state: waves strongly influence the ability to recognize and map benthic communities [49]. Such conditions are common during the dry season (around December to April) and occur irregularly during the wet season (around May to November). The described expedients allowed us to minimize image adjustments during the post-processing and comparison of the output data.

2.4. SfM Processing and Georeferencing

Agisoft Metashape [55], a commercial structure from motion (SfM) software, was used to process UAV images of each area. The software was chosen for the affordable price of the license and its spontaneous workflow, user-friendly interface and excellent quality of the outputs [56]. These features have made it a widely used tool by the scientific community [38,57,58]. The images were processed following four main steps: alignment of the photos using a high-accuracy setting and the creation of a sparse point cloud; then, generation of a dense point cloud with an aggressive filter setting; and finally, creation of a digital terrain model (DTM) from the dense cloud. As final outputs, high-resolution orthomosaics were obtained from the DTM. Processing parameters and output details are provided in Table 1. For additional information on the SfM procedure, see Verhoeven (2011) and Brunier et al. (2016) [59,60].
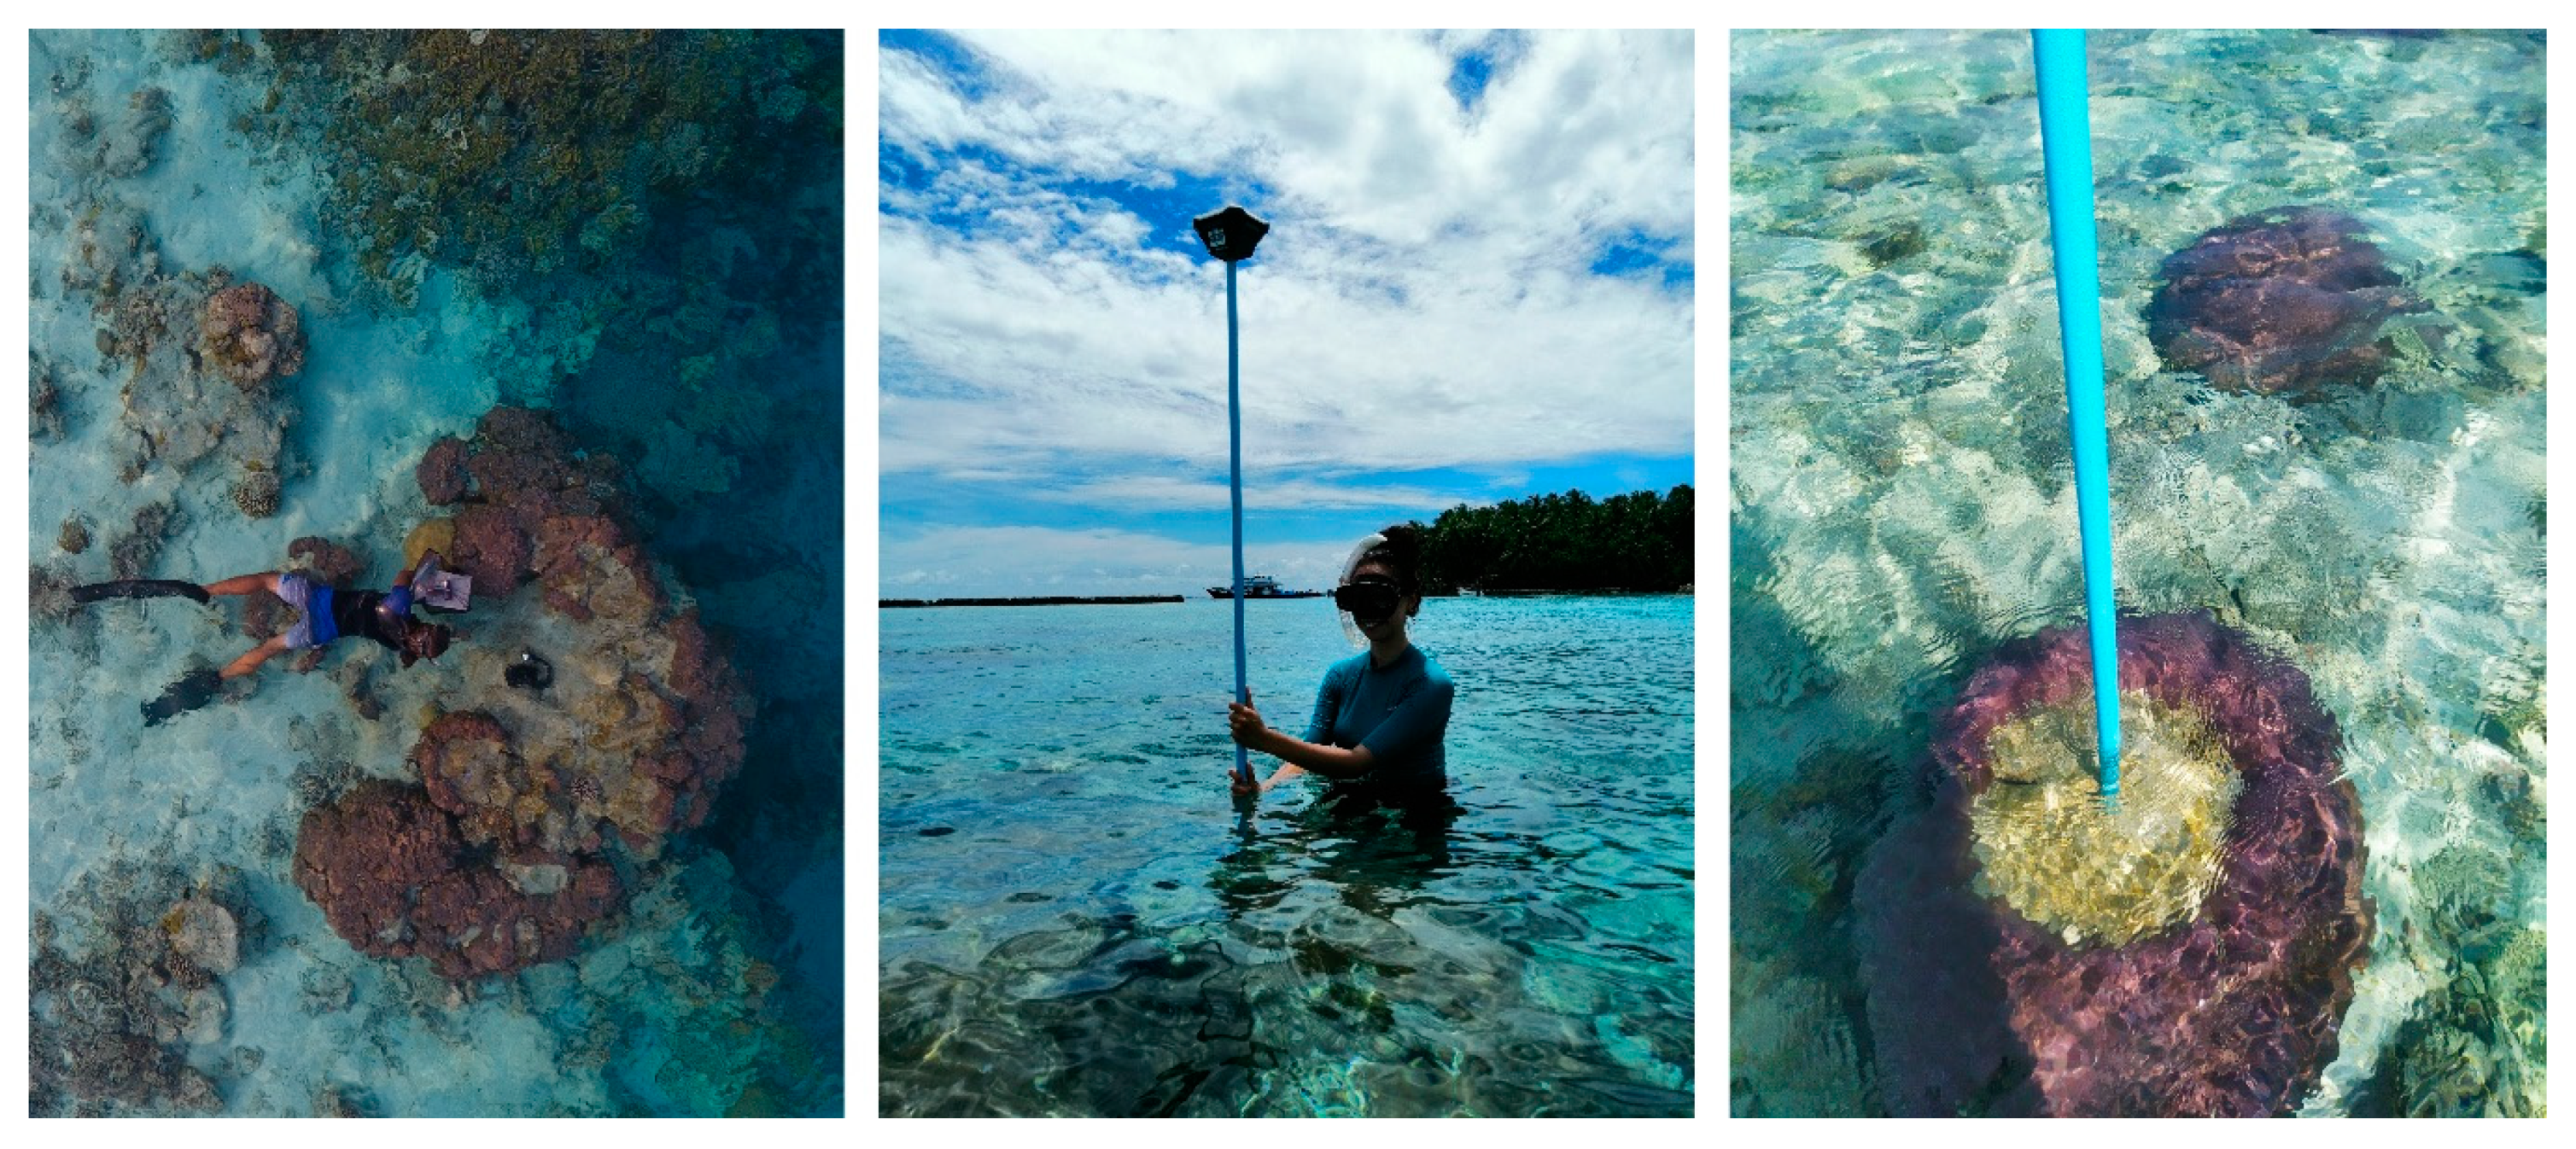
In order to accurately georeference the orthomosaics resulting from SfM processing, we collected ground control points (GCPs) in all the monitored areas. At least eight GCPs per area were identified over structures that were easily visible and detectable in the UAV imagery (Figure 3). Global navigation satellite system (GNSS) coordinates were recorded with Emlid Reach RS© [61], low-cost single-frequency RTK (real-time kinematic) GNSS receivers (a base station and a rover). This GNSS is able to operate in long range radio (LoRa 868/915 MHz) mode, with one receiver working as a base station that sends real-time correction to the second receiver, which acts as a rover [62]. The base station was set in a fixed position for all the surveys, and the position accuracy was calculated using the PPP correction service offered by The Canadian Geodetic Survey of Natural Resources Canada [63]. Considering this single frequency GNSS in PPP base correction, the accuracy of horizontal and vertical components of the collected points is in the order of a few centimeters. After the photo-alignment in Photoscan, markers were placed over the GCPs, and corresponding RTK coordinates were imported. This process allowed us to estimate the XYZ accuracy of the orthomosaics as the root-mean-square error (RMSE).

2.5. OBIA and Classification of High-Resolution Orthomosaics

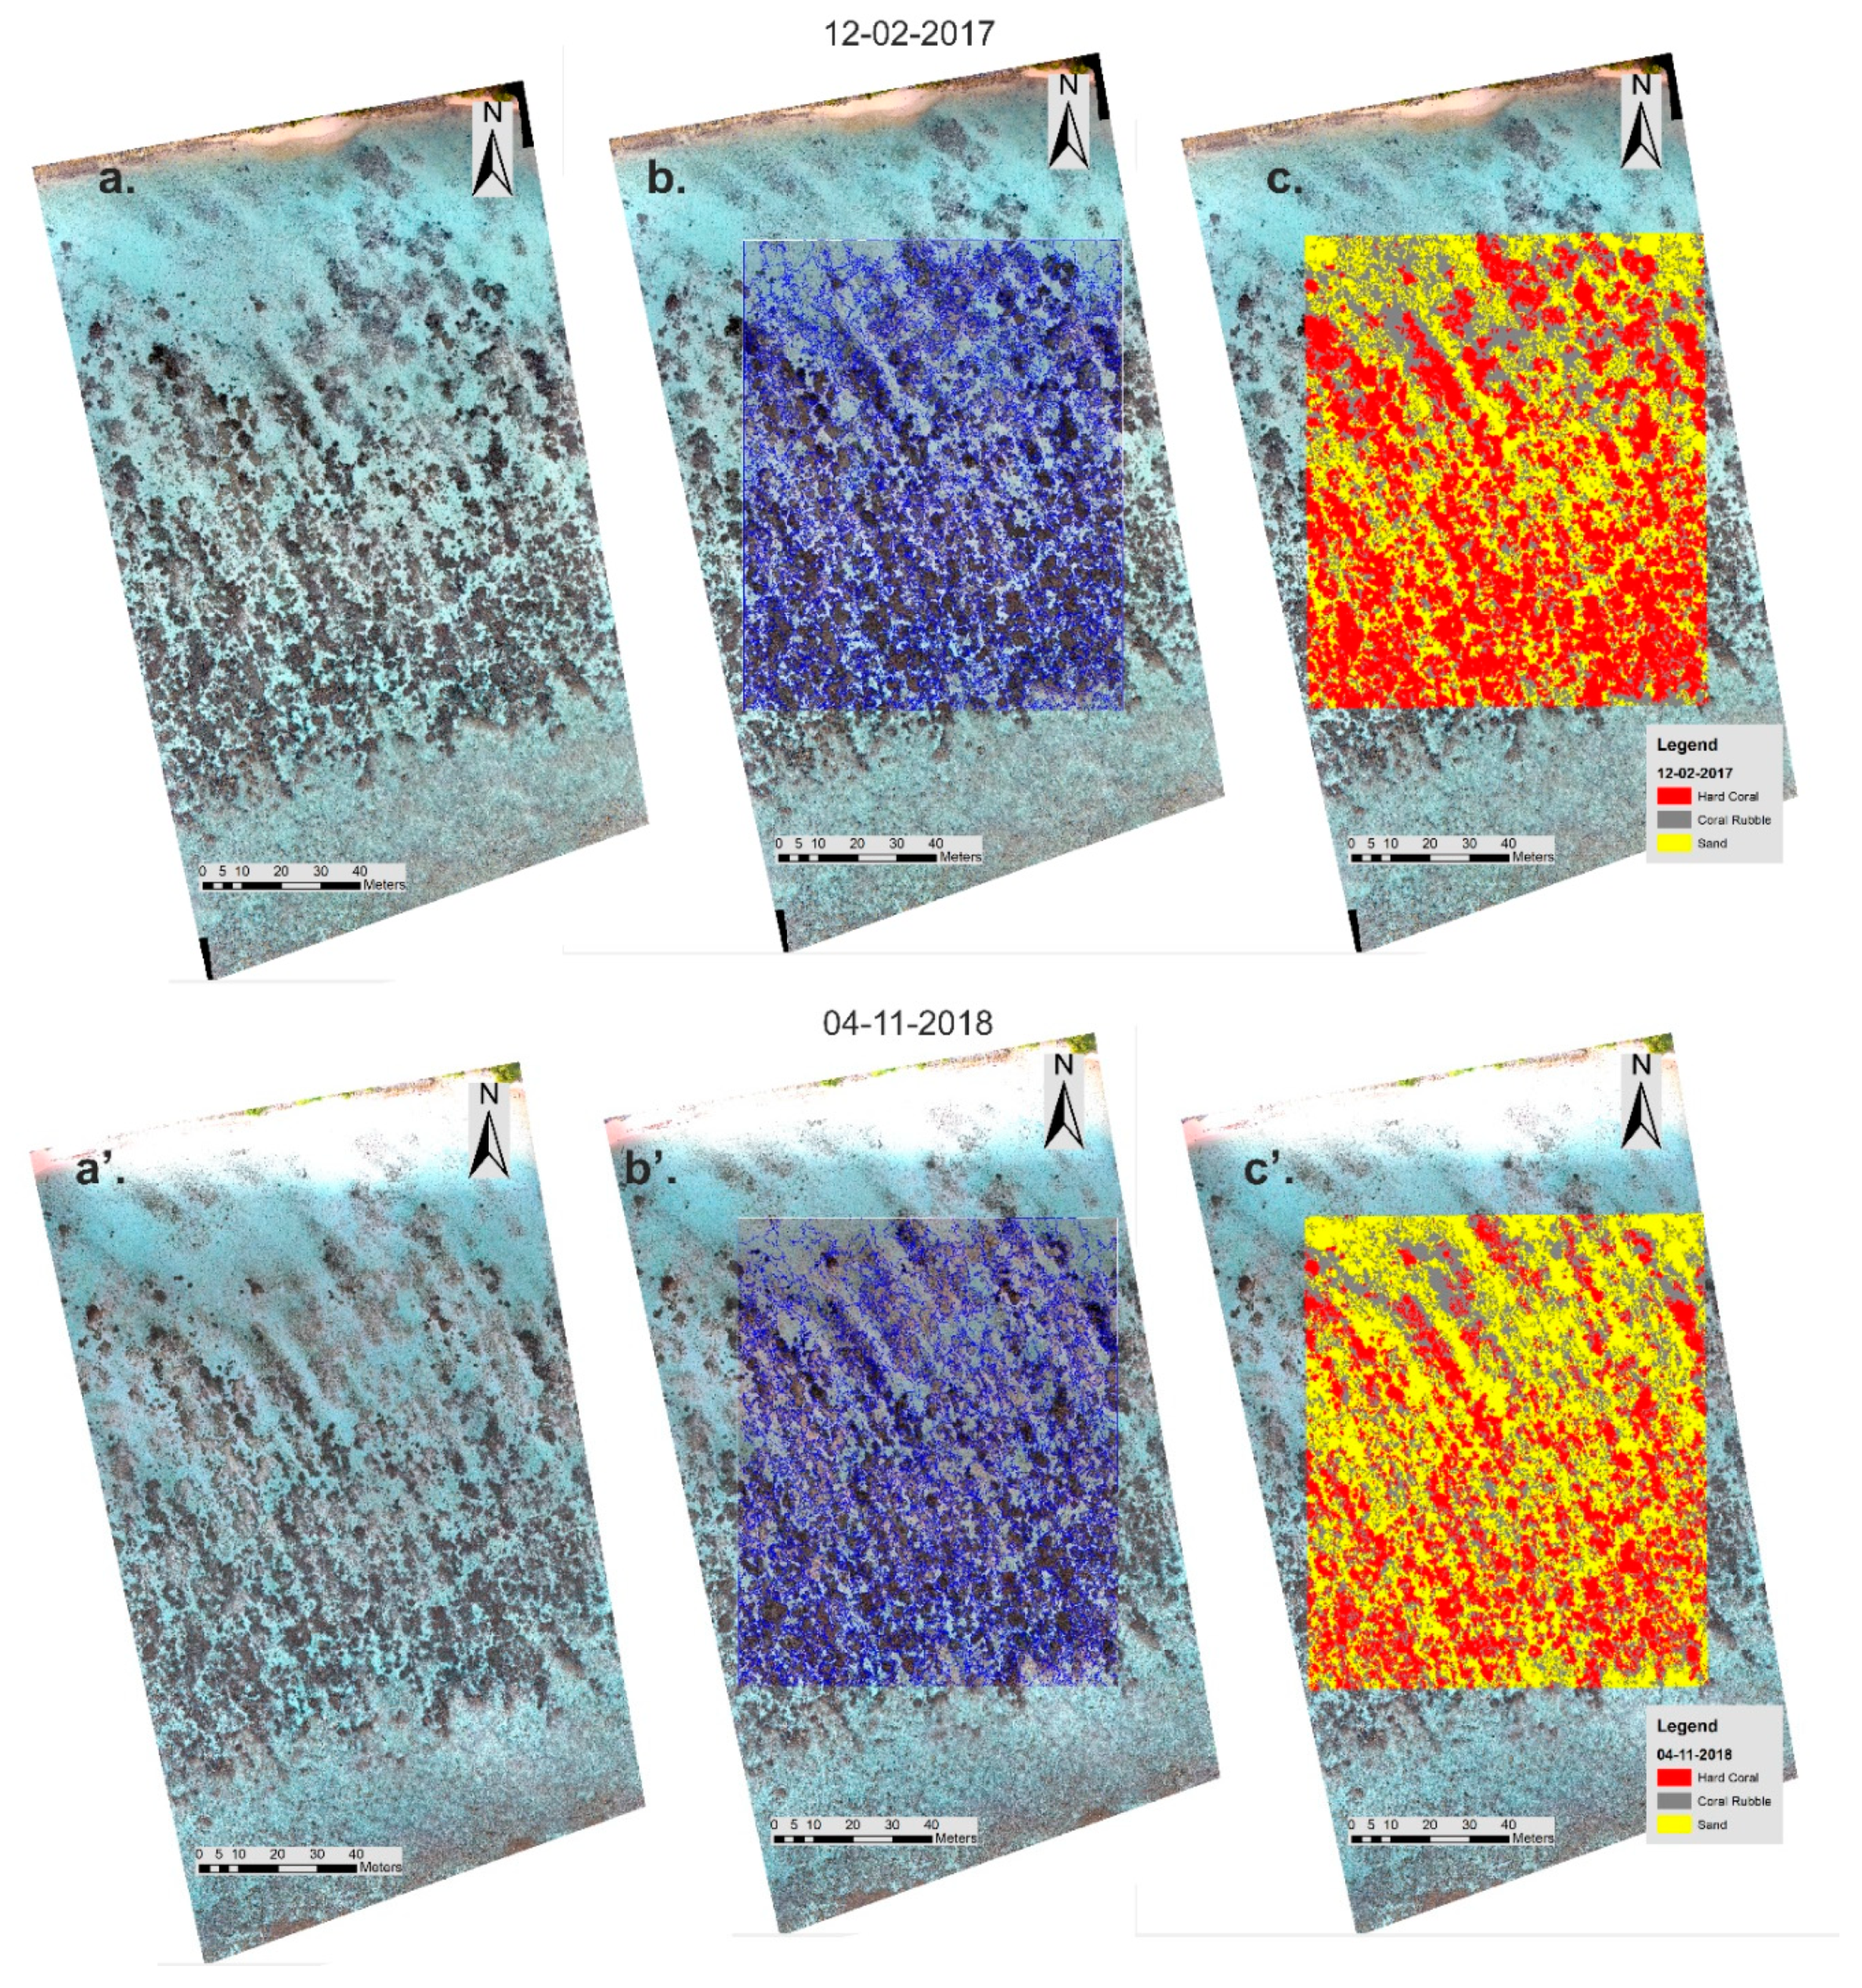
The analysis and classification of the orthomosaics obtained from UAV surveys were performed through Trimble eCognition Developer 9.4 [64]. The use of this software allowed us to carry out a robust image analysis in order to create comparable benthic coverage maps. Analysis (OBIA) algorithms followed the methods described in previous studies for satellite images [65] on satellite images and on UAV data [26]. A multiresolution segmentation algorithm based on homogeneity criteria was applied to the high-resolution orthomosaics (Figure 4b,b’). The image layer weights were set equal for all three bands, and the optimal scale parameter found was 150. For the homogeneity criteria, we established a shape value of 0.1 and compactness of 0.5. After the segmentation process, nearest neighbor classification (a supervised classification technique) was used to select well-defined samples as training areas. The accuracy of the samples was established by bionomic transects collected by snorkelers (Figure 1c). Classification takes advantage of the features calculated for each object, such as the spectral value, but also size, shape, texture and proximity [66]. Using the thresholds between these parameters, we defined a ruleset for the classification algorithms that allowed us to classify and to label the three main substrate types that characterize the four study areas: hard coral (including live and dead corals), sand, and coral rubble (Figure 4c,c’). The sand class was classified on the basis of the spectral difference (mainly in brightness level and band ratio) between coral rubble and hard coral. Instead, hard coral and coral rubble were classified considering the difference in brightness, band ratio, standard deviation, saturation and the form and texture of the segments. Unfortunately, it was not possible to discriminate between dead and alive colonies from only the RGB channels because of the inaccuracy of an analysis based only on visible colors.

2.6. DTM Analysis and Structure Complexity Evaluation

From the derived DTMs of Area 2 and Area 4, we selected two sub-areas far from the edges and close to GCPs. The reason for this is that during the SfM process, a slight broad-scale deformation can be produced that could affect the accuracy of the z value [67]. Moreover, from the visual comparison of the orthomosaics over time (2017 to 2018), we observed an evident change in the substrate composition in both areas. These two aspects make the two selected sub-areas suitable sites to be tested to evaluate our workflow designed to detect changes in structural complexity.
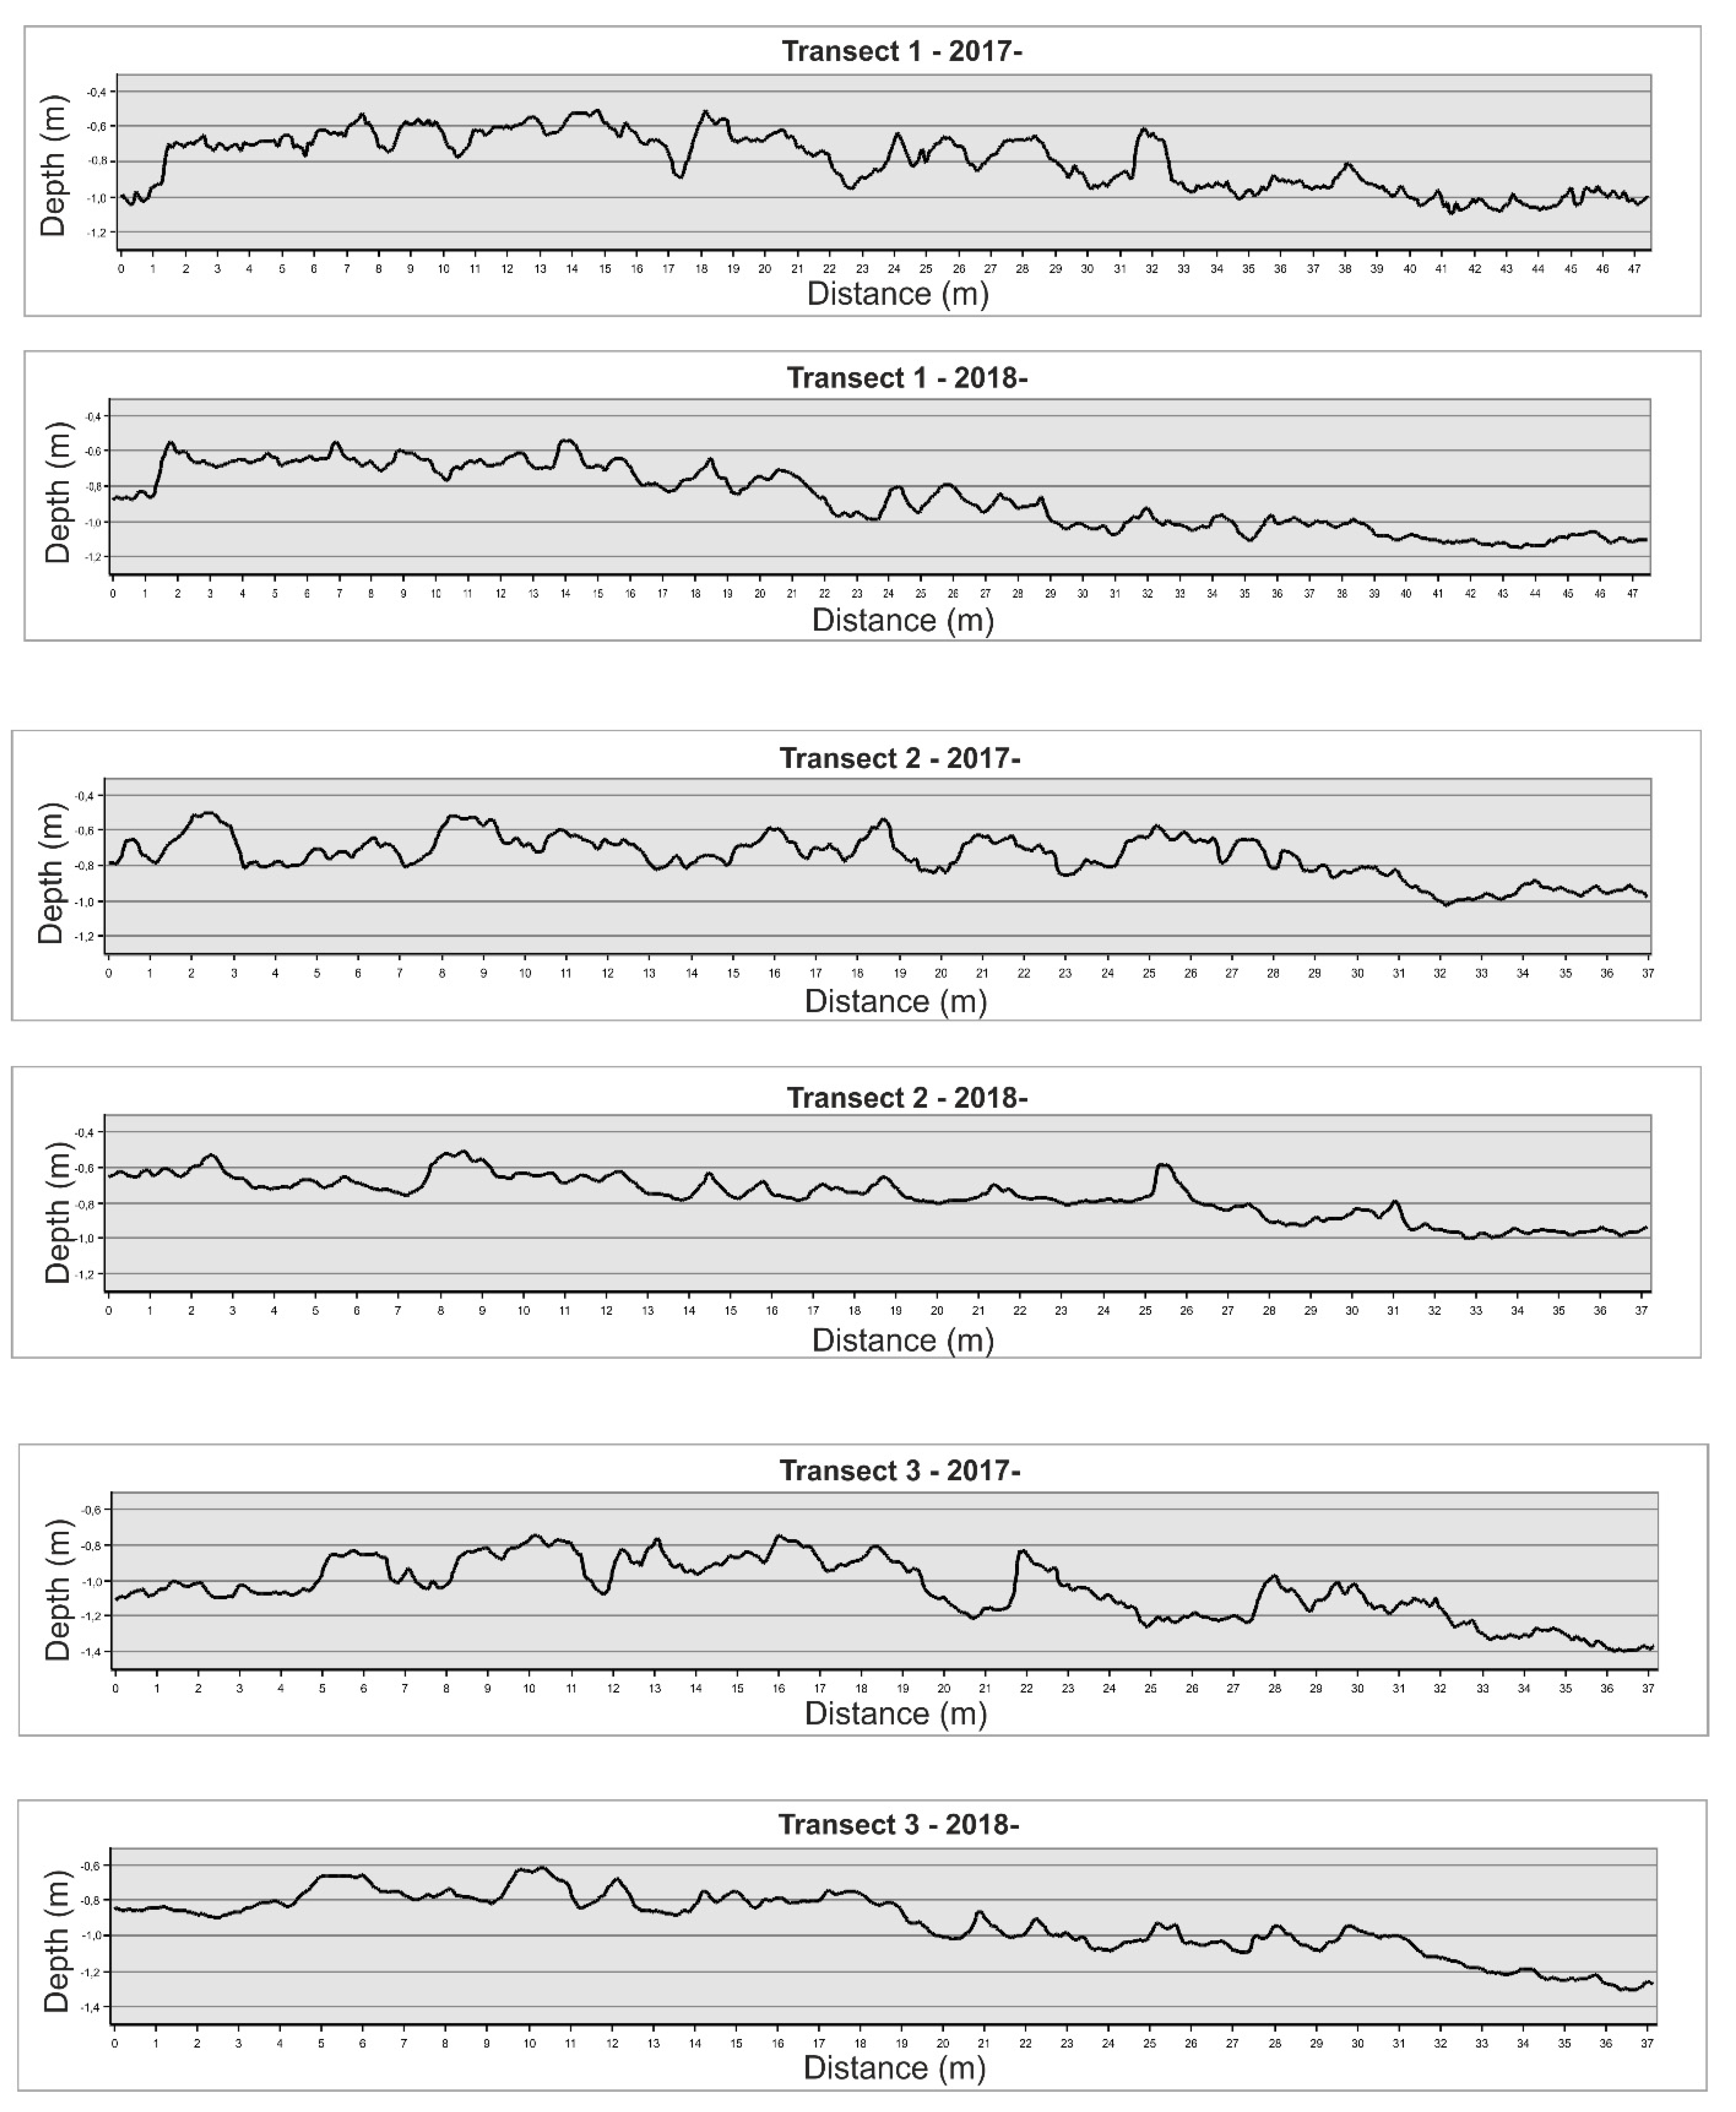
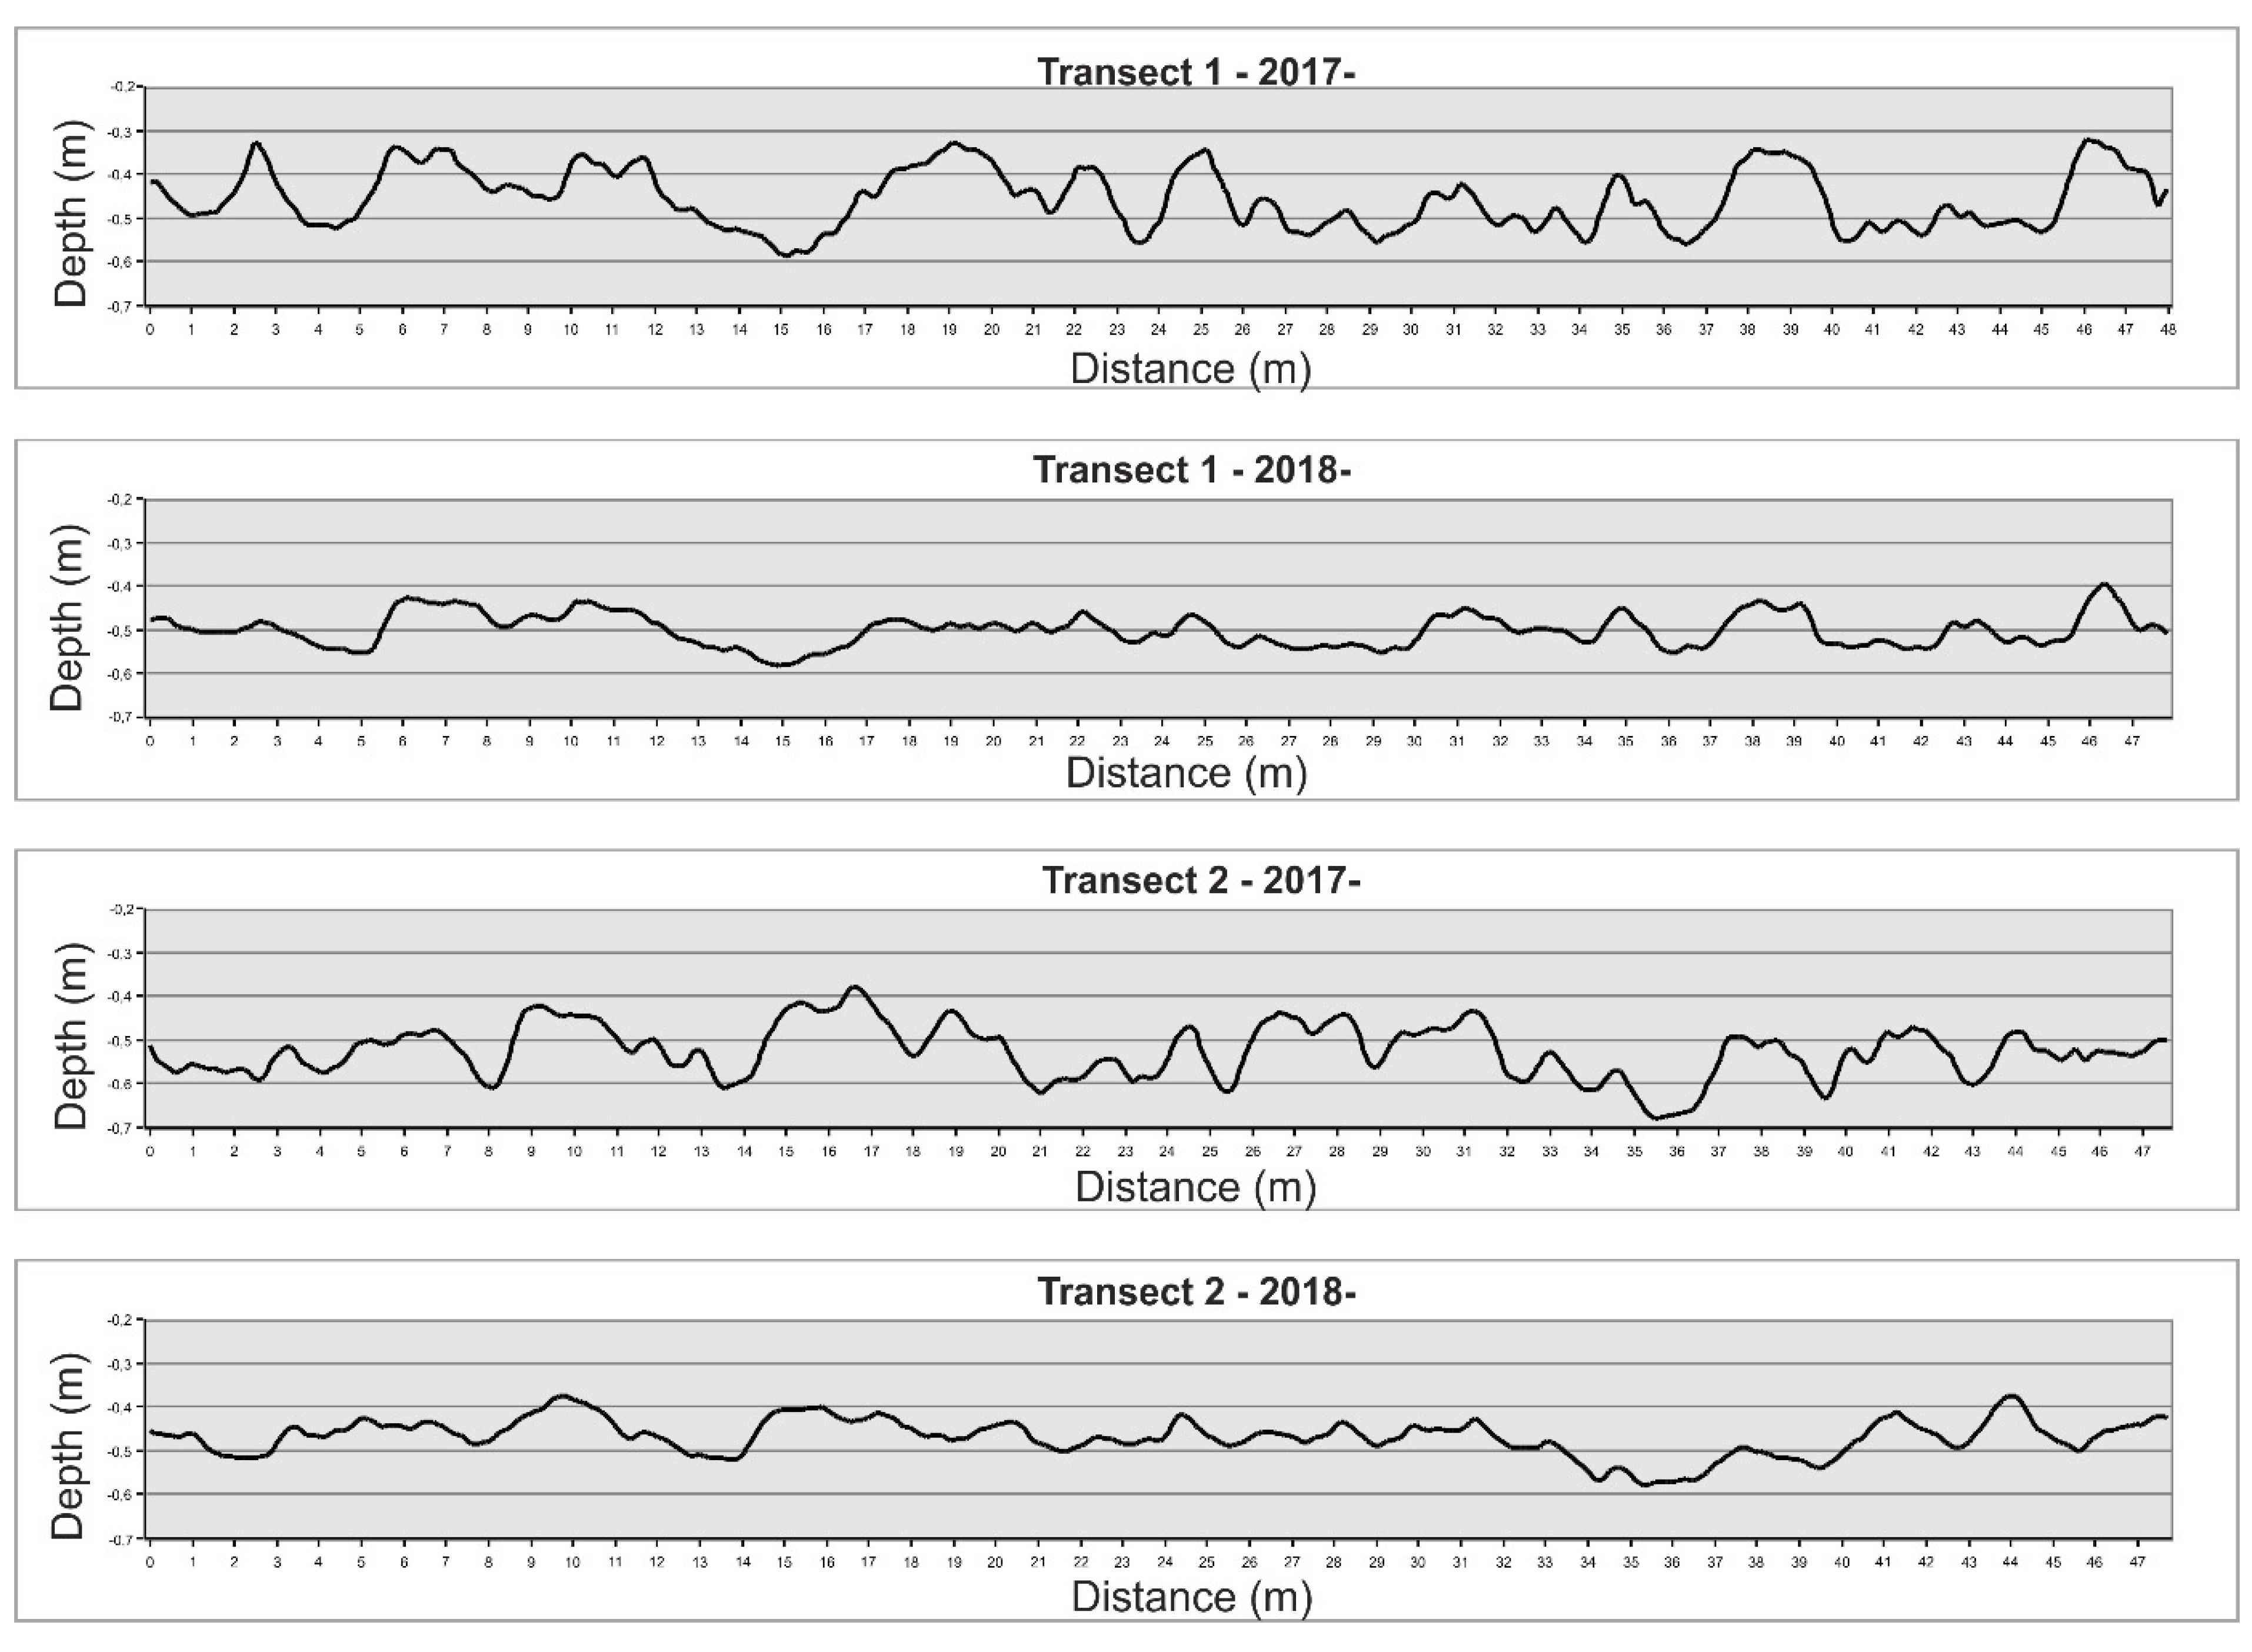
The models were imported in ArcGIS 10.6 and analyzed by using 3D Analyst Tools and applying the benthic terrain modeler (BTM) algorithm (i.e., vector ruggedness measure—[68]). The DTMs were firstly resampled to a uniform resolution of 5 cm/pix (using Resample Tool in ArcGIS 10.6) and then a low-pass filter (3 × 3) was applied. On the processed models, we calculated the linear rugosity and the average slope along five virtual transects and terrain ruggedness over the area around these transects in order to estimate changes in structure complexity between years. The transects were virtually laid parallel to the reef crest and started at randomly selected points within the target area.
The linear rugosity was calculated as the exact distance of a transect, considering changes in vertical surfaces (see Appendix A, Figure A1 and Figure A2), divided by the linear distance [34,69]:
Linear   Rugosity = T r u e   D i s t a n c e   ( 3 D ) L i n e a r   D i s t a n c e   ( 2 D )
The closer that this value is to 1, the flatter the surface is considered to be.
The average slope along the transects was estimated using functional surface algorithms included in 3D analysis tools. Higher slope values indicate a steep area, while small slope values reflect smooth terrain [34,70]. The measure of area ruggedness was obtained using a vector ruggedness measure tool included in BTM. This system of measurement was used to quantify the surface complexity (rugosity) by assessing the 3D dispersion of vectors orthogonal to the surface of the DTM. Vectors orthogonal to each grid cell are decomposed into their x, y, and z components. A resulting vector is estimated within a 3 × 3 cell frame centered on each cell. A zero value indicates a flat terrain, while larger values indicate highly complex areas [9,68].

2.7. Map Accuracy Assessment

Map accuracy was assessed by comparing the outputs with 732 randomly distributed points that proportionally cover all the monitored areas. The points were manually classified, and the accuracy of the maps was evaluated visually using the orthomosaics; this was possible because of the high resolution of the UAV images (1.5 cm/pix), which allowed an on-screen check to be conducted by an expert in coral reefs with good knowledge of the study area [26,71]. Then, the accuracy was evaluated by comparing the outputs with the reference data in a confusion matrix to estimate the user and producer accuracy and the overall accuracy of the maps and to calculate the kappa index [72]. Finally, the benthic cover maps from 2017 and 2018 were compared in ArcGis 10.6 to highlight the differences between the two years and calculate the gain and loss in the three classes.

3. Results

3.1. Map Accuracy

The benthic assemblage maps had an overall accuracy of 79% and a kappa index of 56% (Table 2), values that represent a moderate agreement level, according to Congalton and Green (2008) [72]. Individual classes had a user accuracy of 85% for sand, 66% for coral rubble and 86% for hard coral. The lower accuracy of the coral rubble is mainly due to the absence of precise boundaries between the other two classes. In some areas, the mixture of sand with coral rubble formed a transition zone, which may have led to misclassification. This also applies to the margin between hard coral and rubble. In addition, during the map processing in eCognition, the jagged margins of the segments were smoothed. This process may have created some centimetric imprecision in the boundaries between classes that, in several cases, may have contributed to a reduction in classification accuracy.

3.2. High-Resolution Orthomosaics, Substrate Type Maps and Structural Complexity Variation

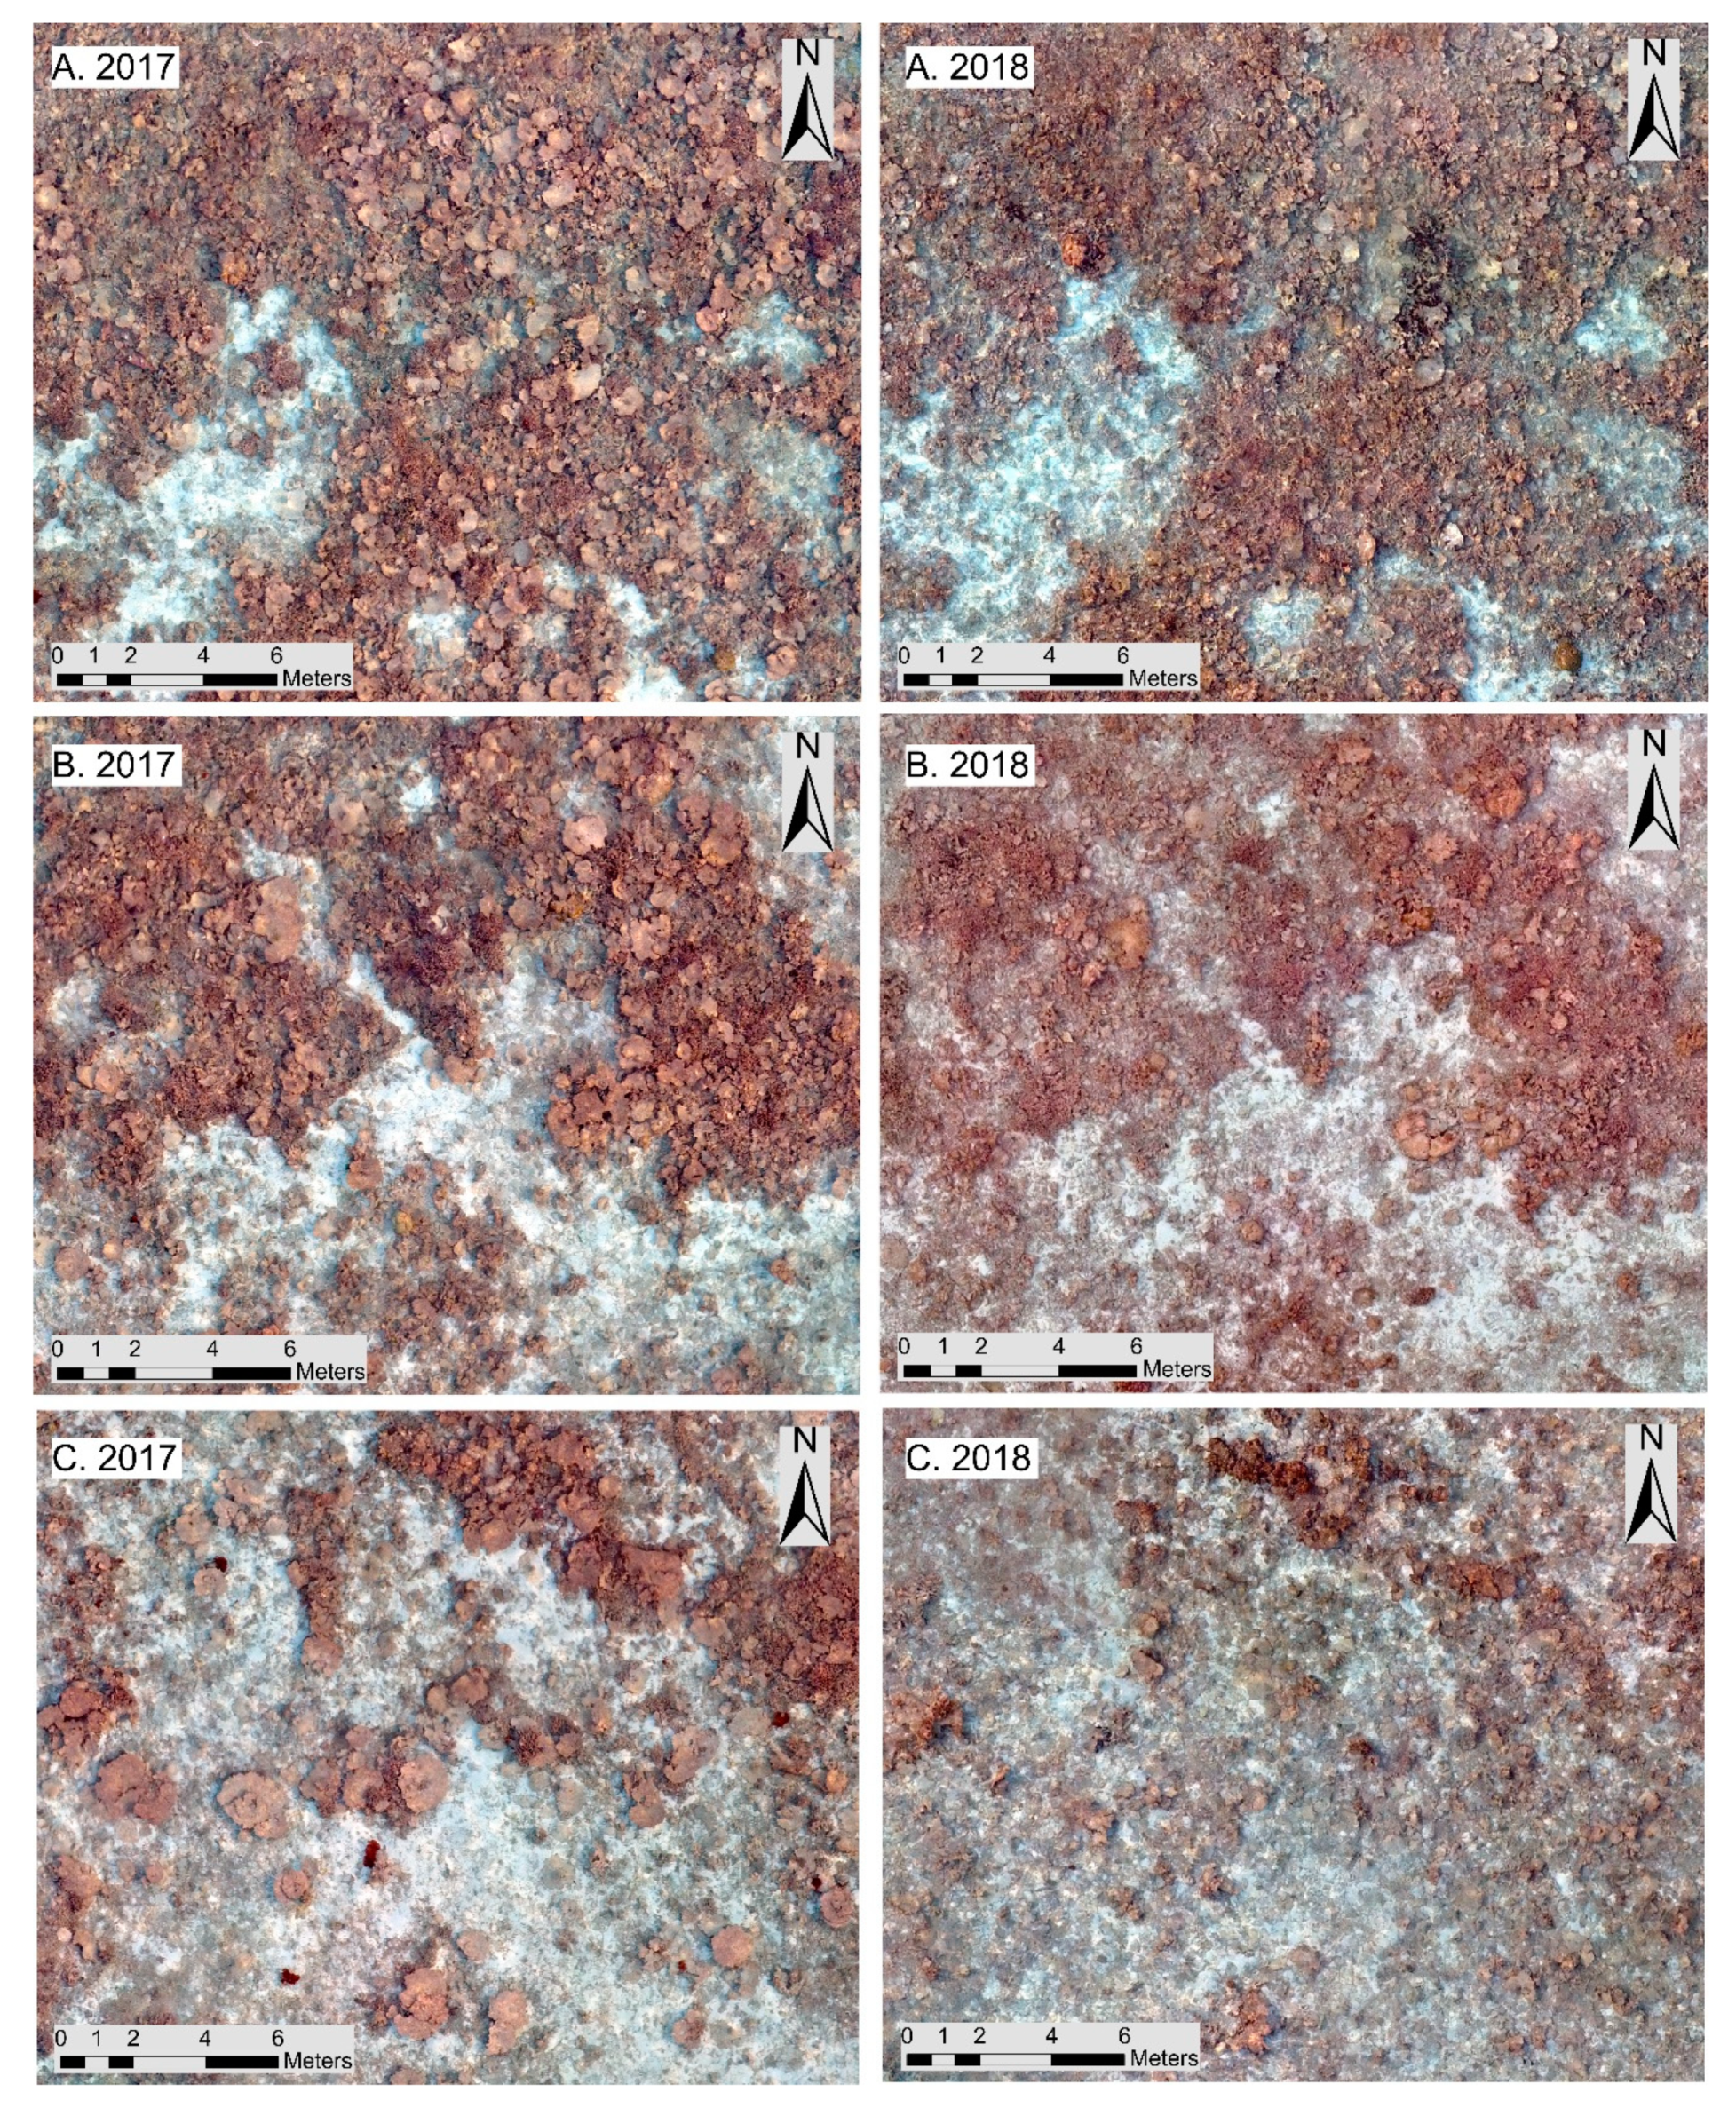
The processing of the UAV images led to the realization of high-resolution orthomosaics (1.5 cm/px) of 16 hectares of shallow-water coral reef environments around the island of Magoodhoo for the years 2017 and 2018. During this process, the average positional accuracy obtained for the models was 0.21 ± 0.09 m RMSE. The achieved detail of the models provides an overview of the dynamic of the benthic communities with low-cost and time-saving surveys. Moreover, the quality of the data highlights the difference in benthic assemblage extension between the two years with a visual on-screen comparison of the orthomosaics (Figure 4a,a’).
The benthic assemblage maps realized from the OBIA analysis define the coverage of hard coral, coral rubble and sand in selected portions of the four monitored areas a few months after the 2016 bleaching events and more than two years later (Figure 4c,c’). The comparison of the maps revealed a general loss in the extent of hard coral framework coverage, precisely 11–15% of the total mapped area, with a total loss of 6119 m2 (Figure 5). Regarding the other two classes, we noticed an increase in coral rubble (a class closely linked to the degradation and fragmentation of the coral colonies) in Area 1, Area 2 and Area 4, the area most affected by the reduction in hard coral.
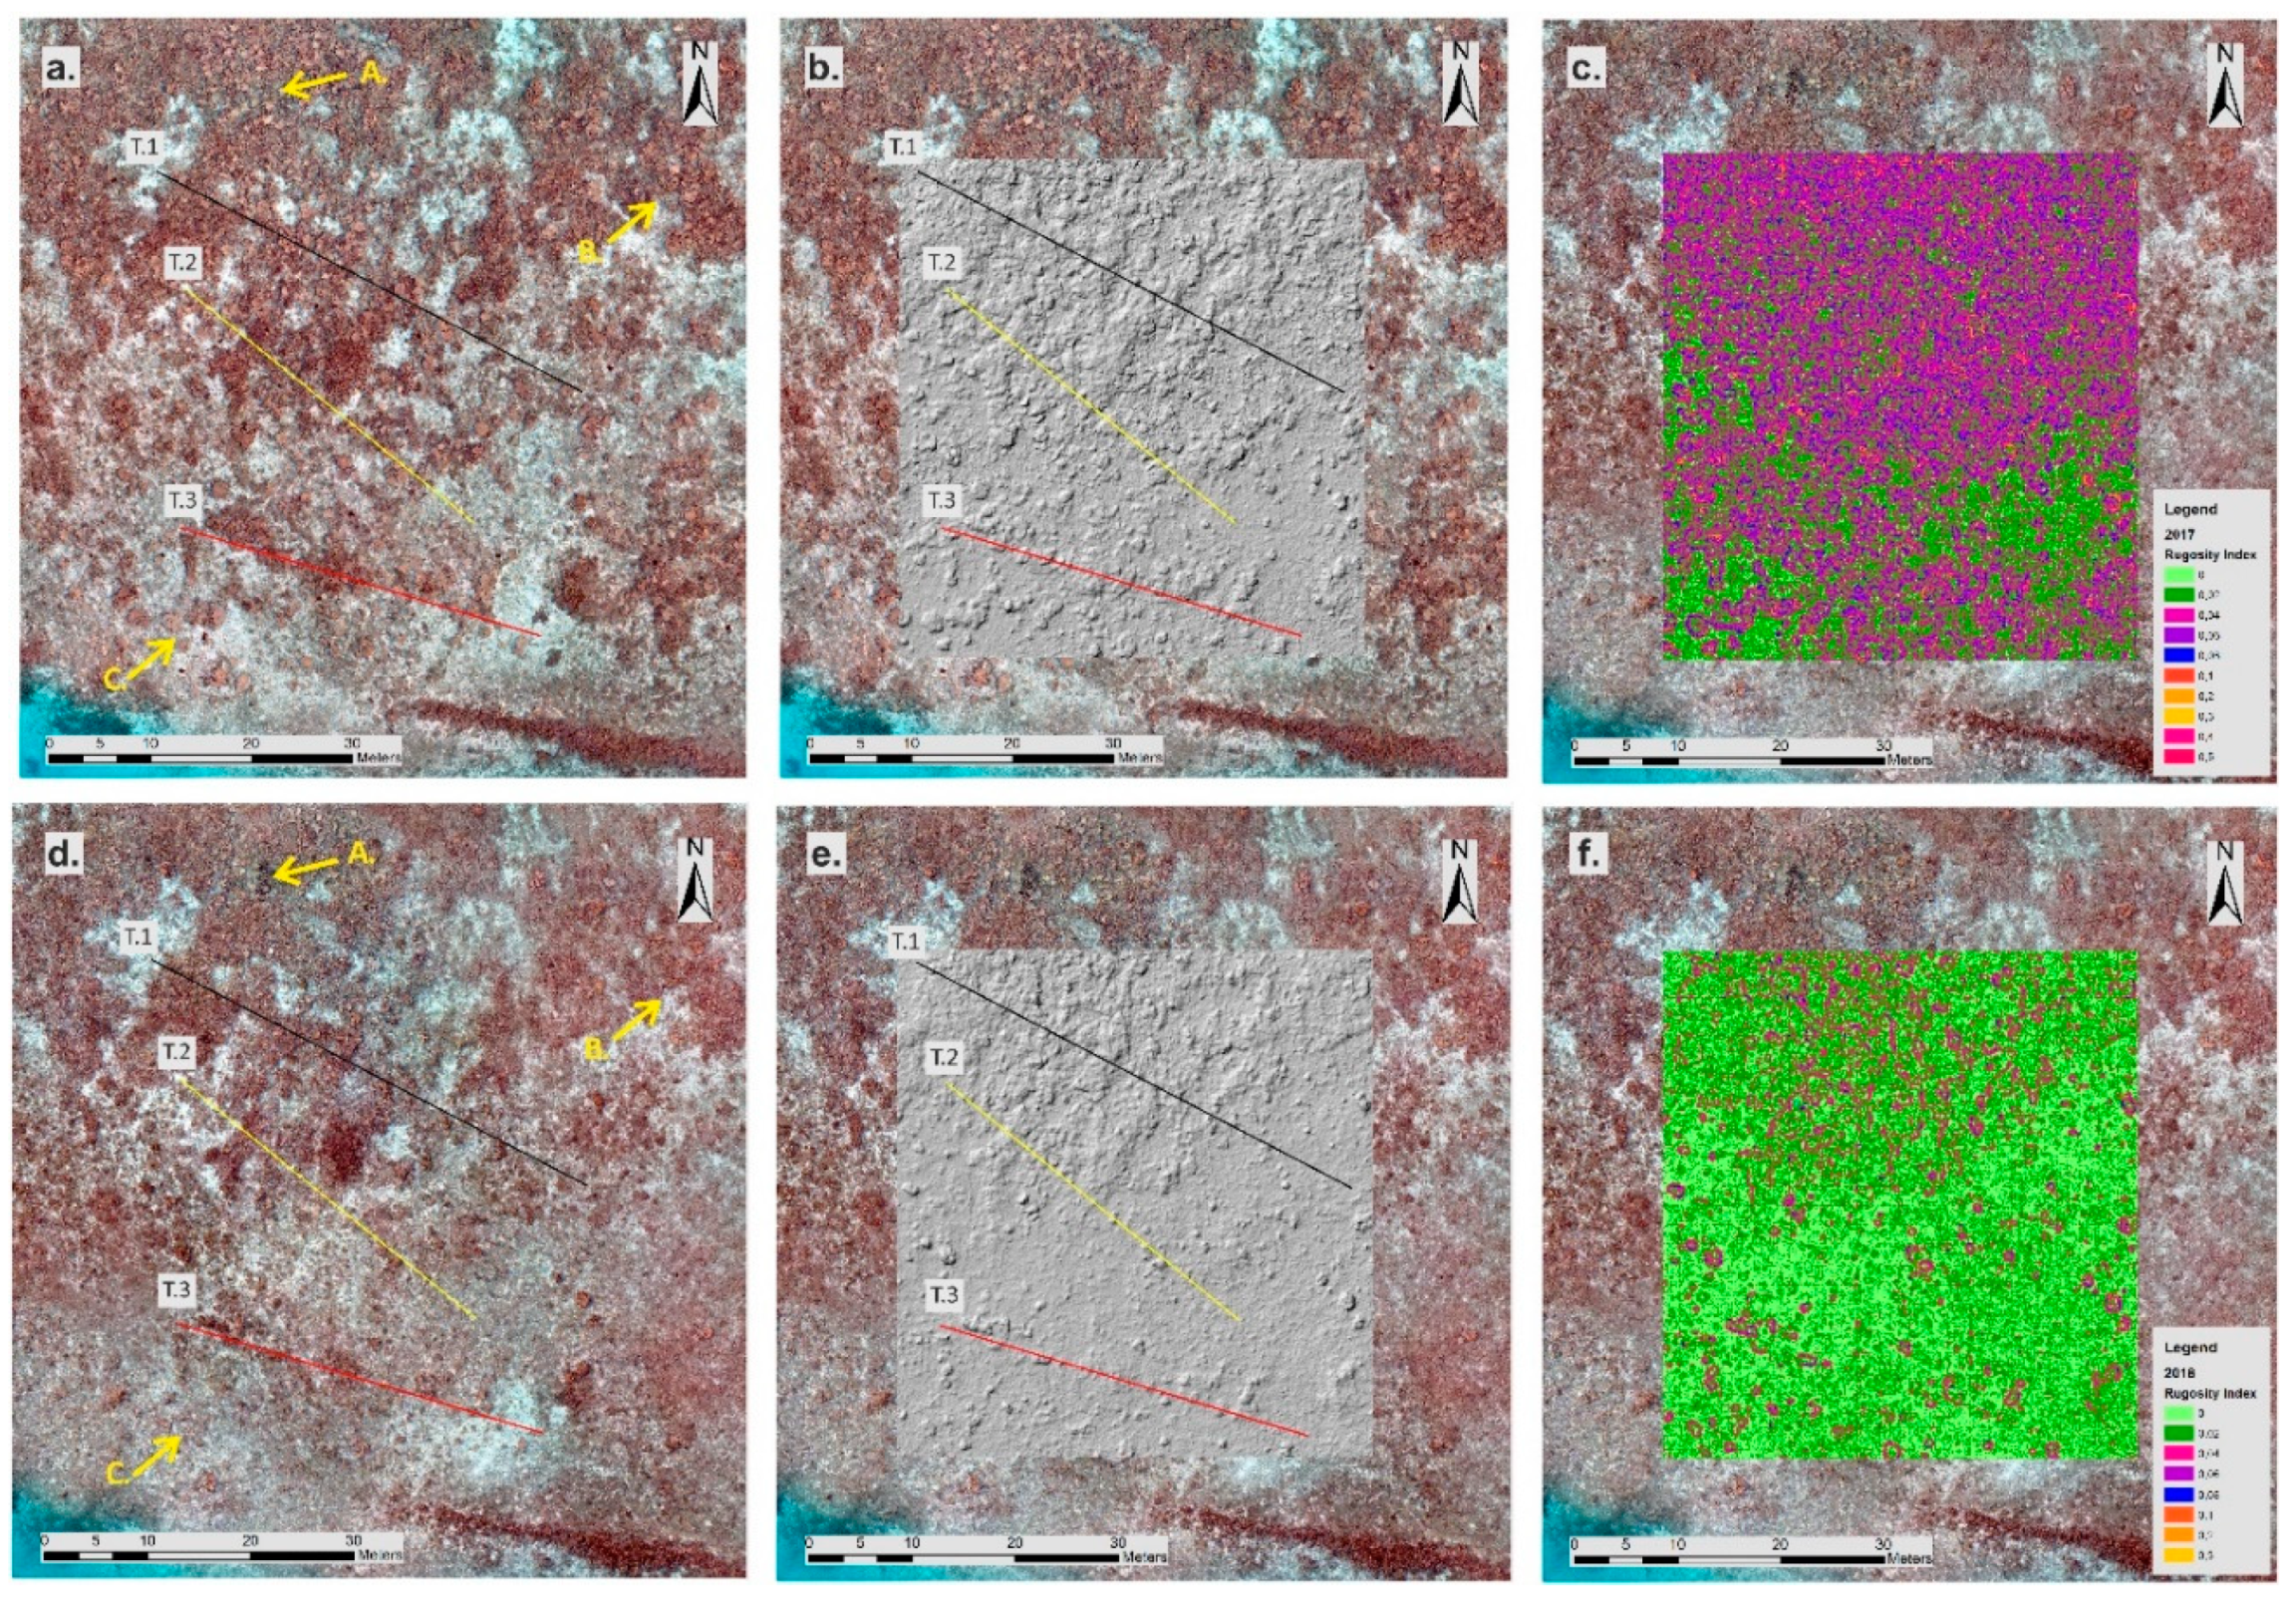
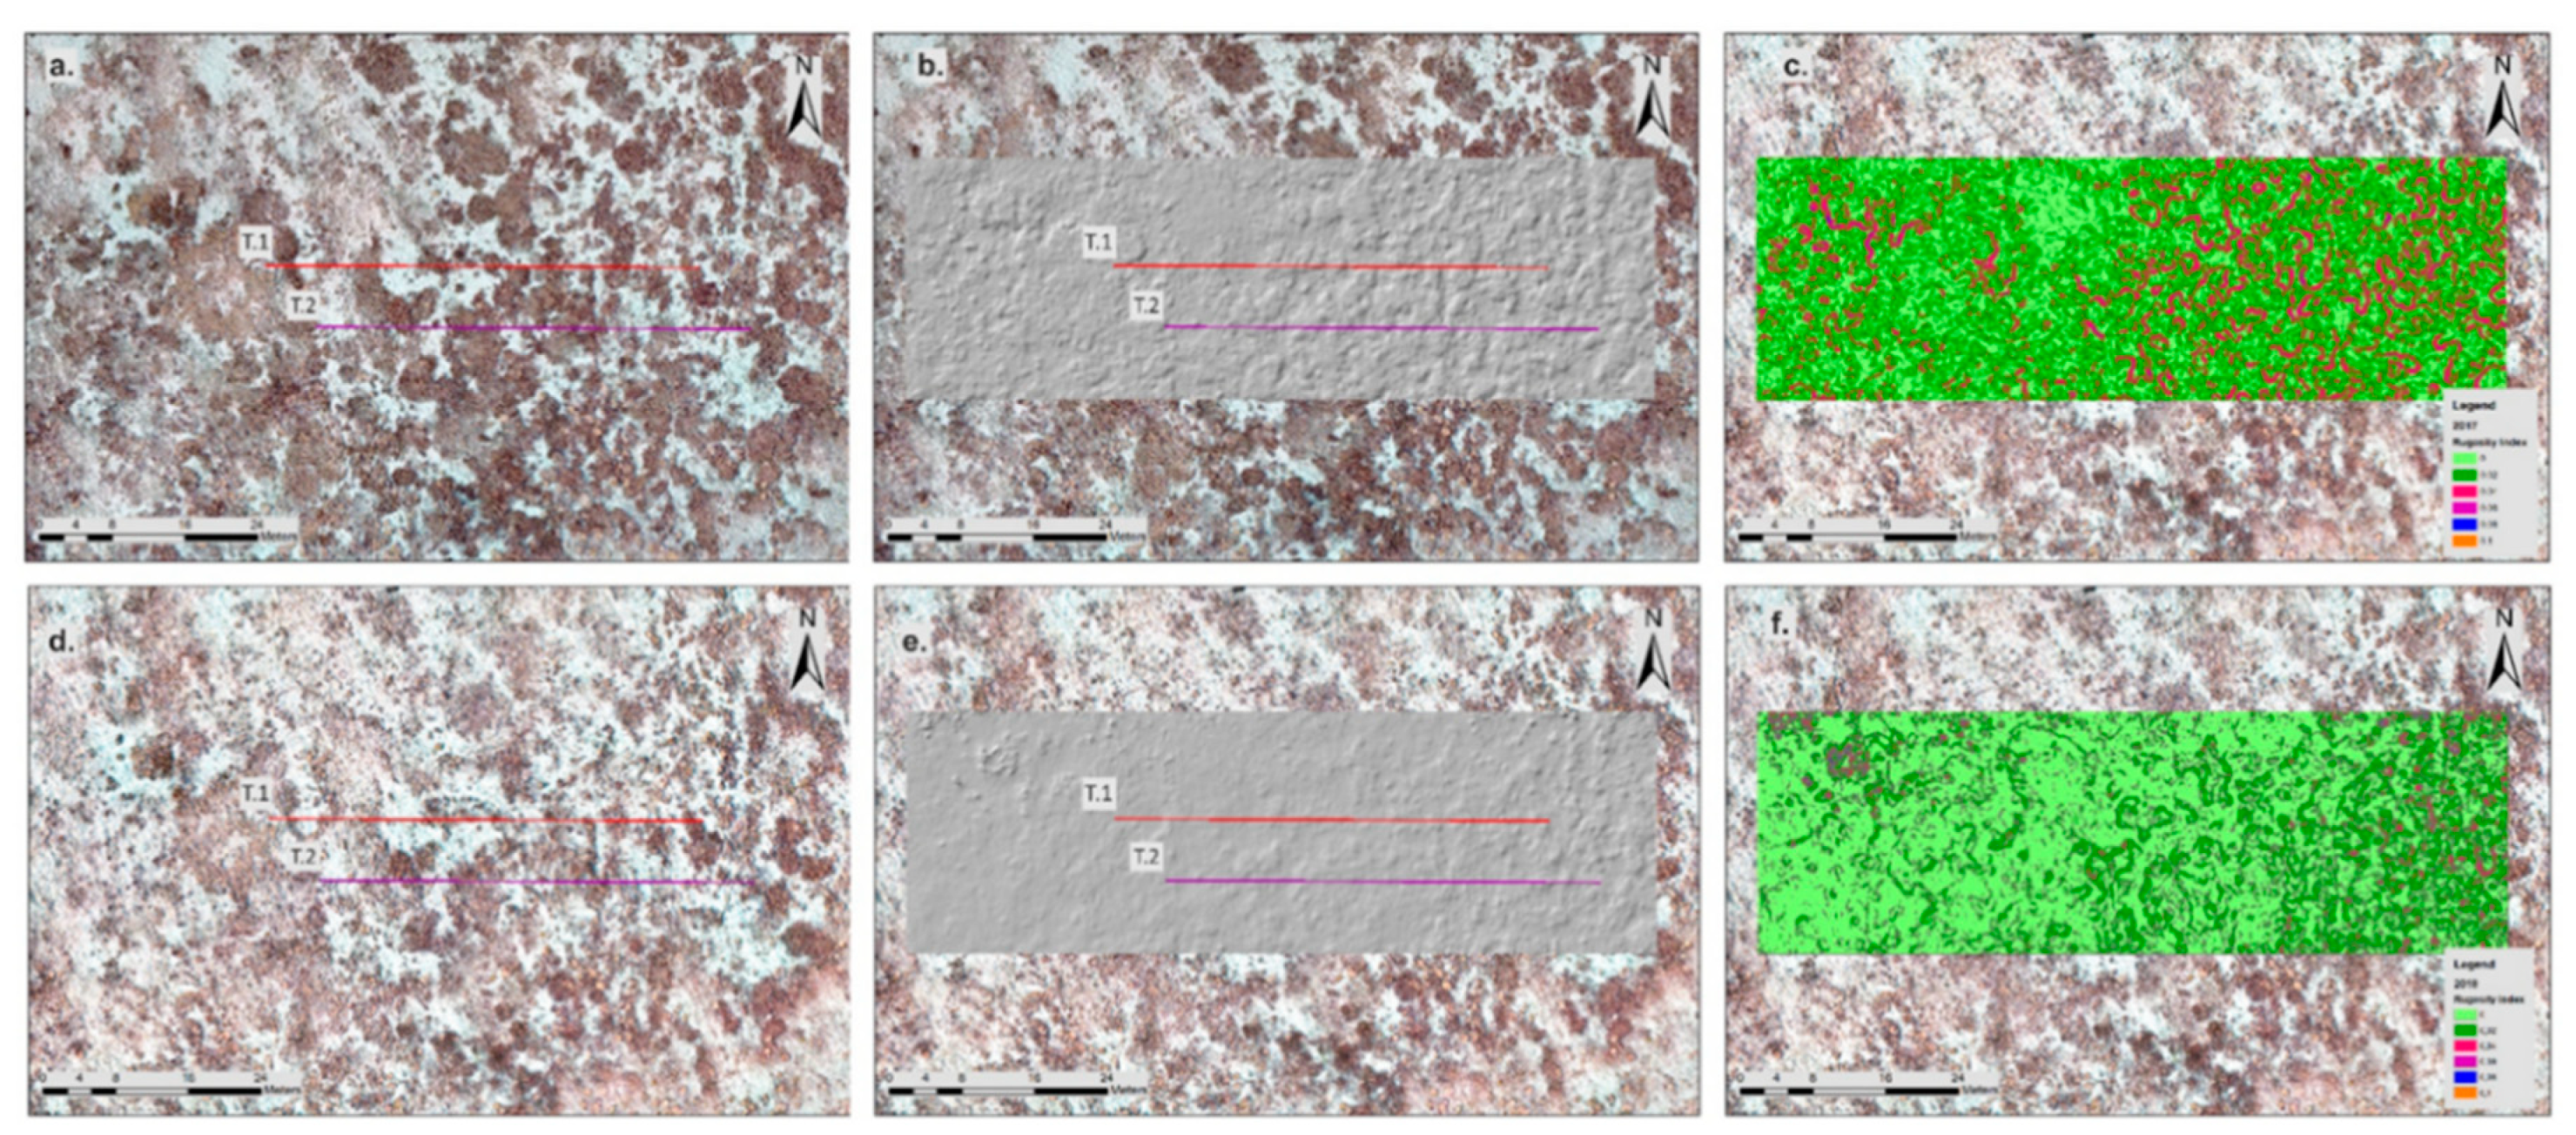
In Figure 6, Figure 7 and Figure 8, changes in substrate type composition can be directly linked to the integrity of the reef system. In particular, the comparison between 2017 and 2018 DTMs (Figure 6b–e and Figure 8b–e) showed a general flattening of the monitored areas with a consequent loss of rugosity (Figure 6c–f and Figure 8c–f). Therefore, both the linear rugosity and average slope values (Table 3 and Table 4), measured along randomly chosen transects over the selected areas, suggest a general deterioration in structural complexity in the 2018 models. The linear rugosity index decreases close to a value of 1, indicating an increase in the extent of flat terrains in all the analyzed transects. Moreover, a reduction in the average slope values is noticeable and confirms the trend between the two years (Table 3 and Table 4).
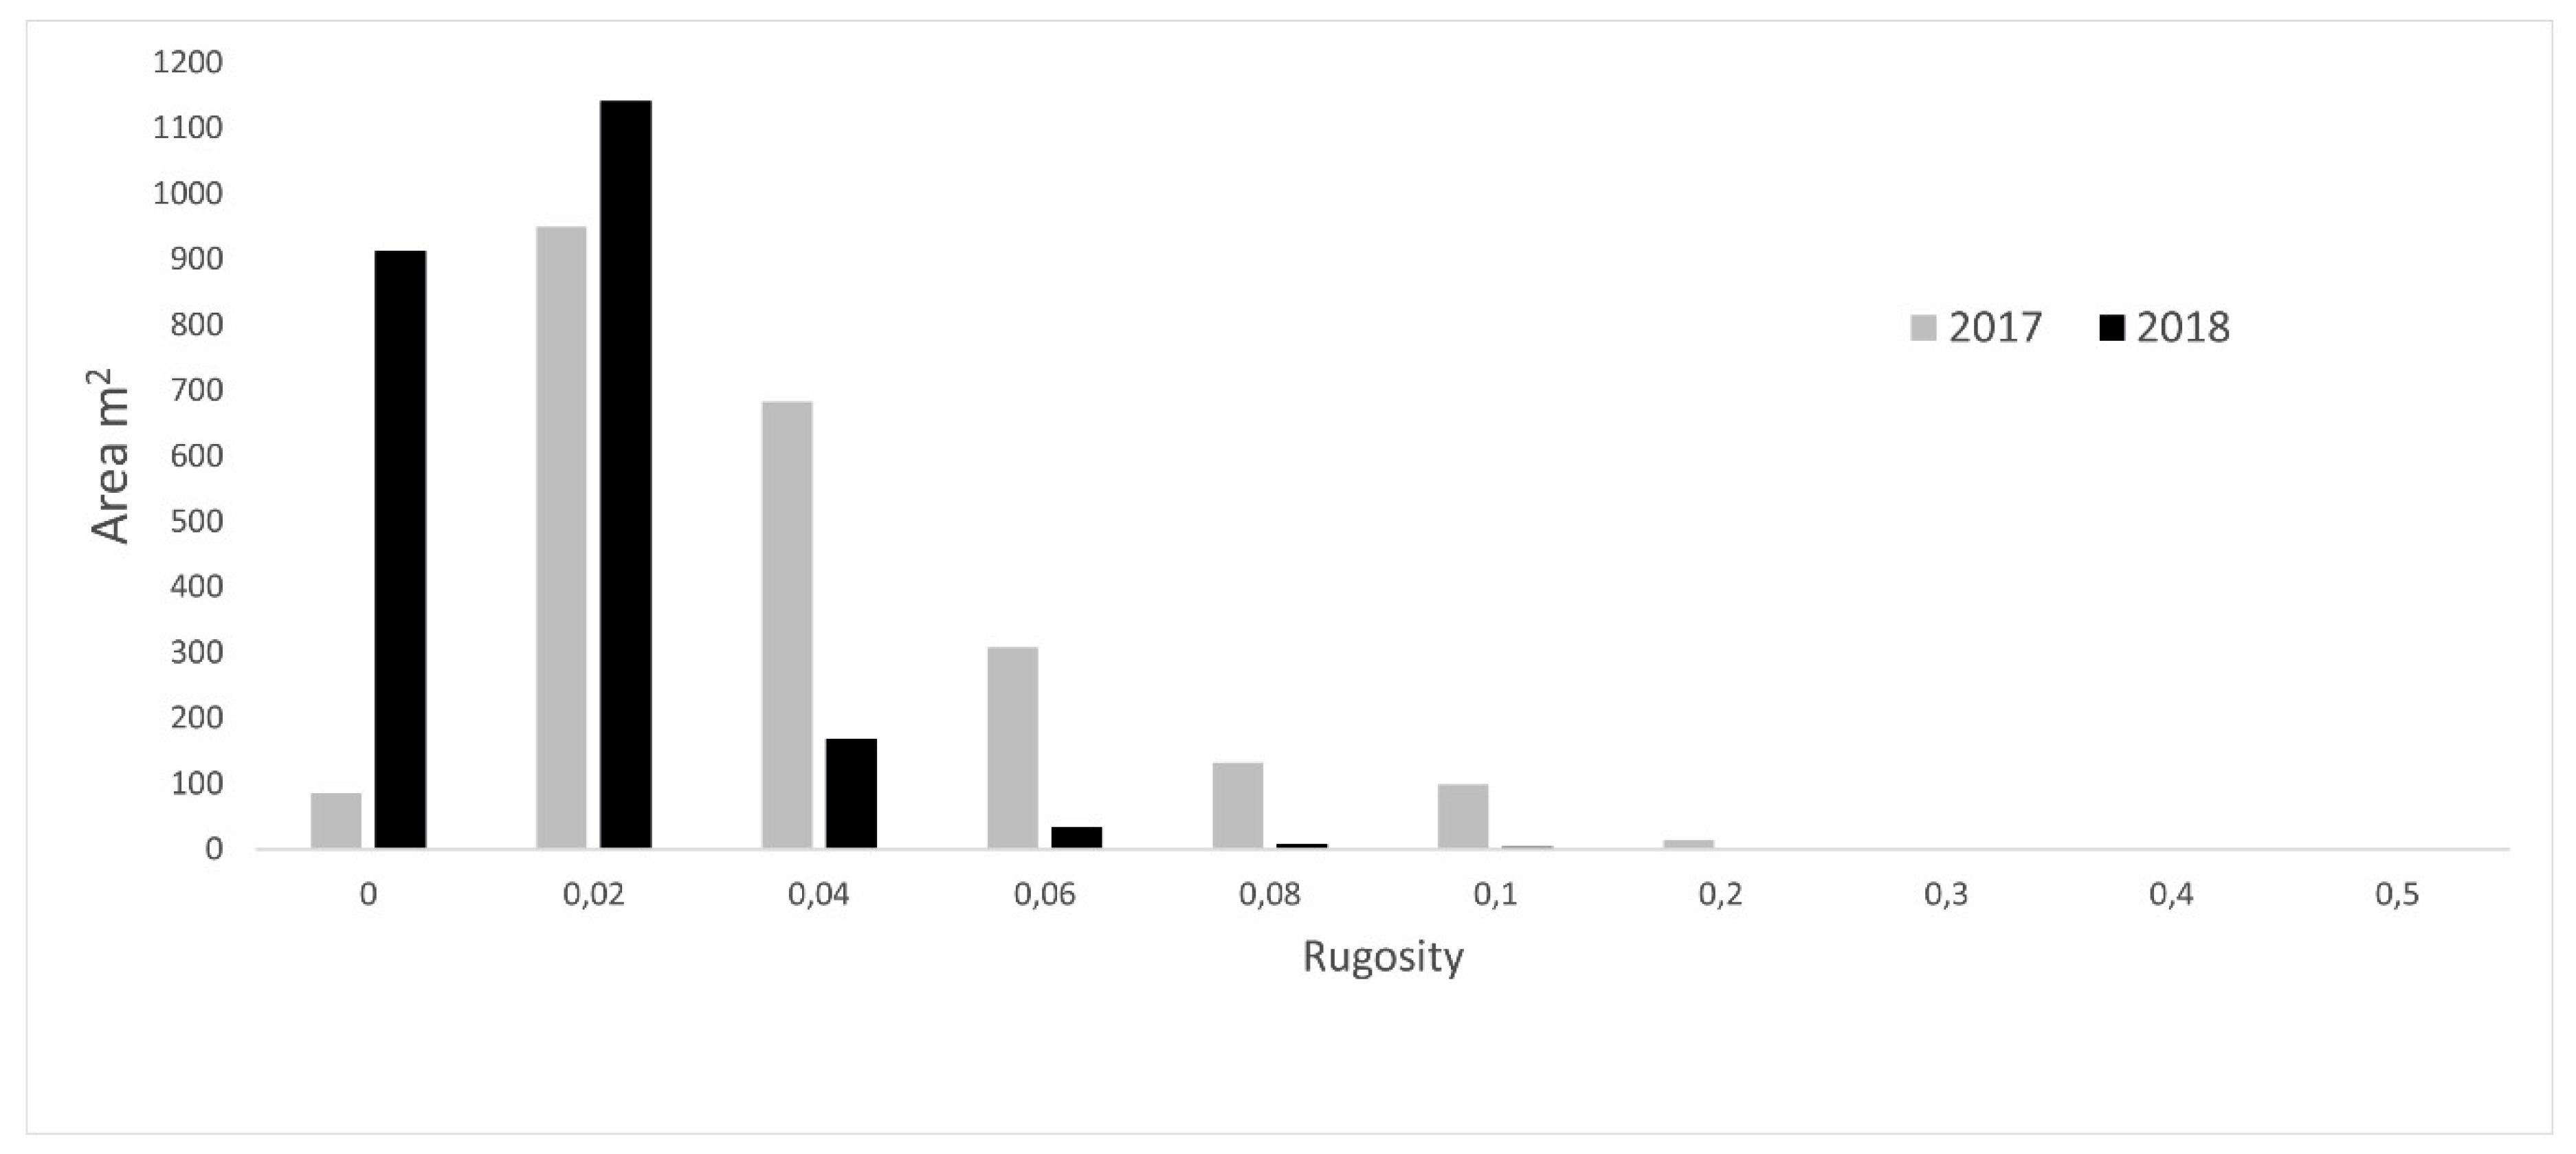
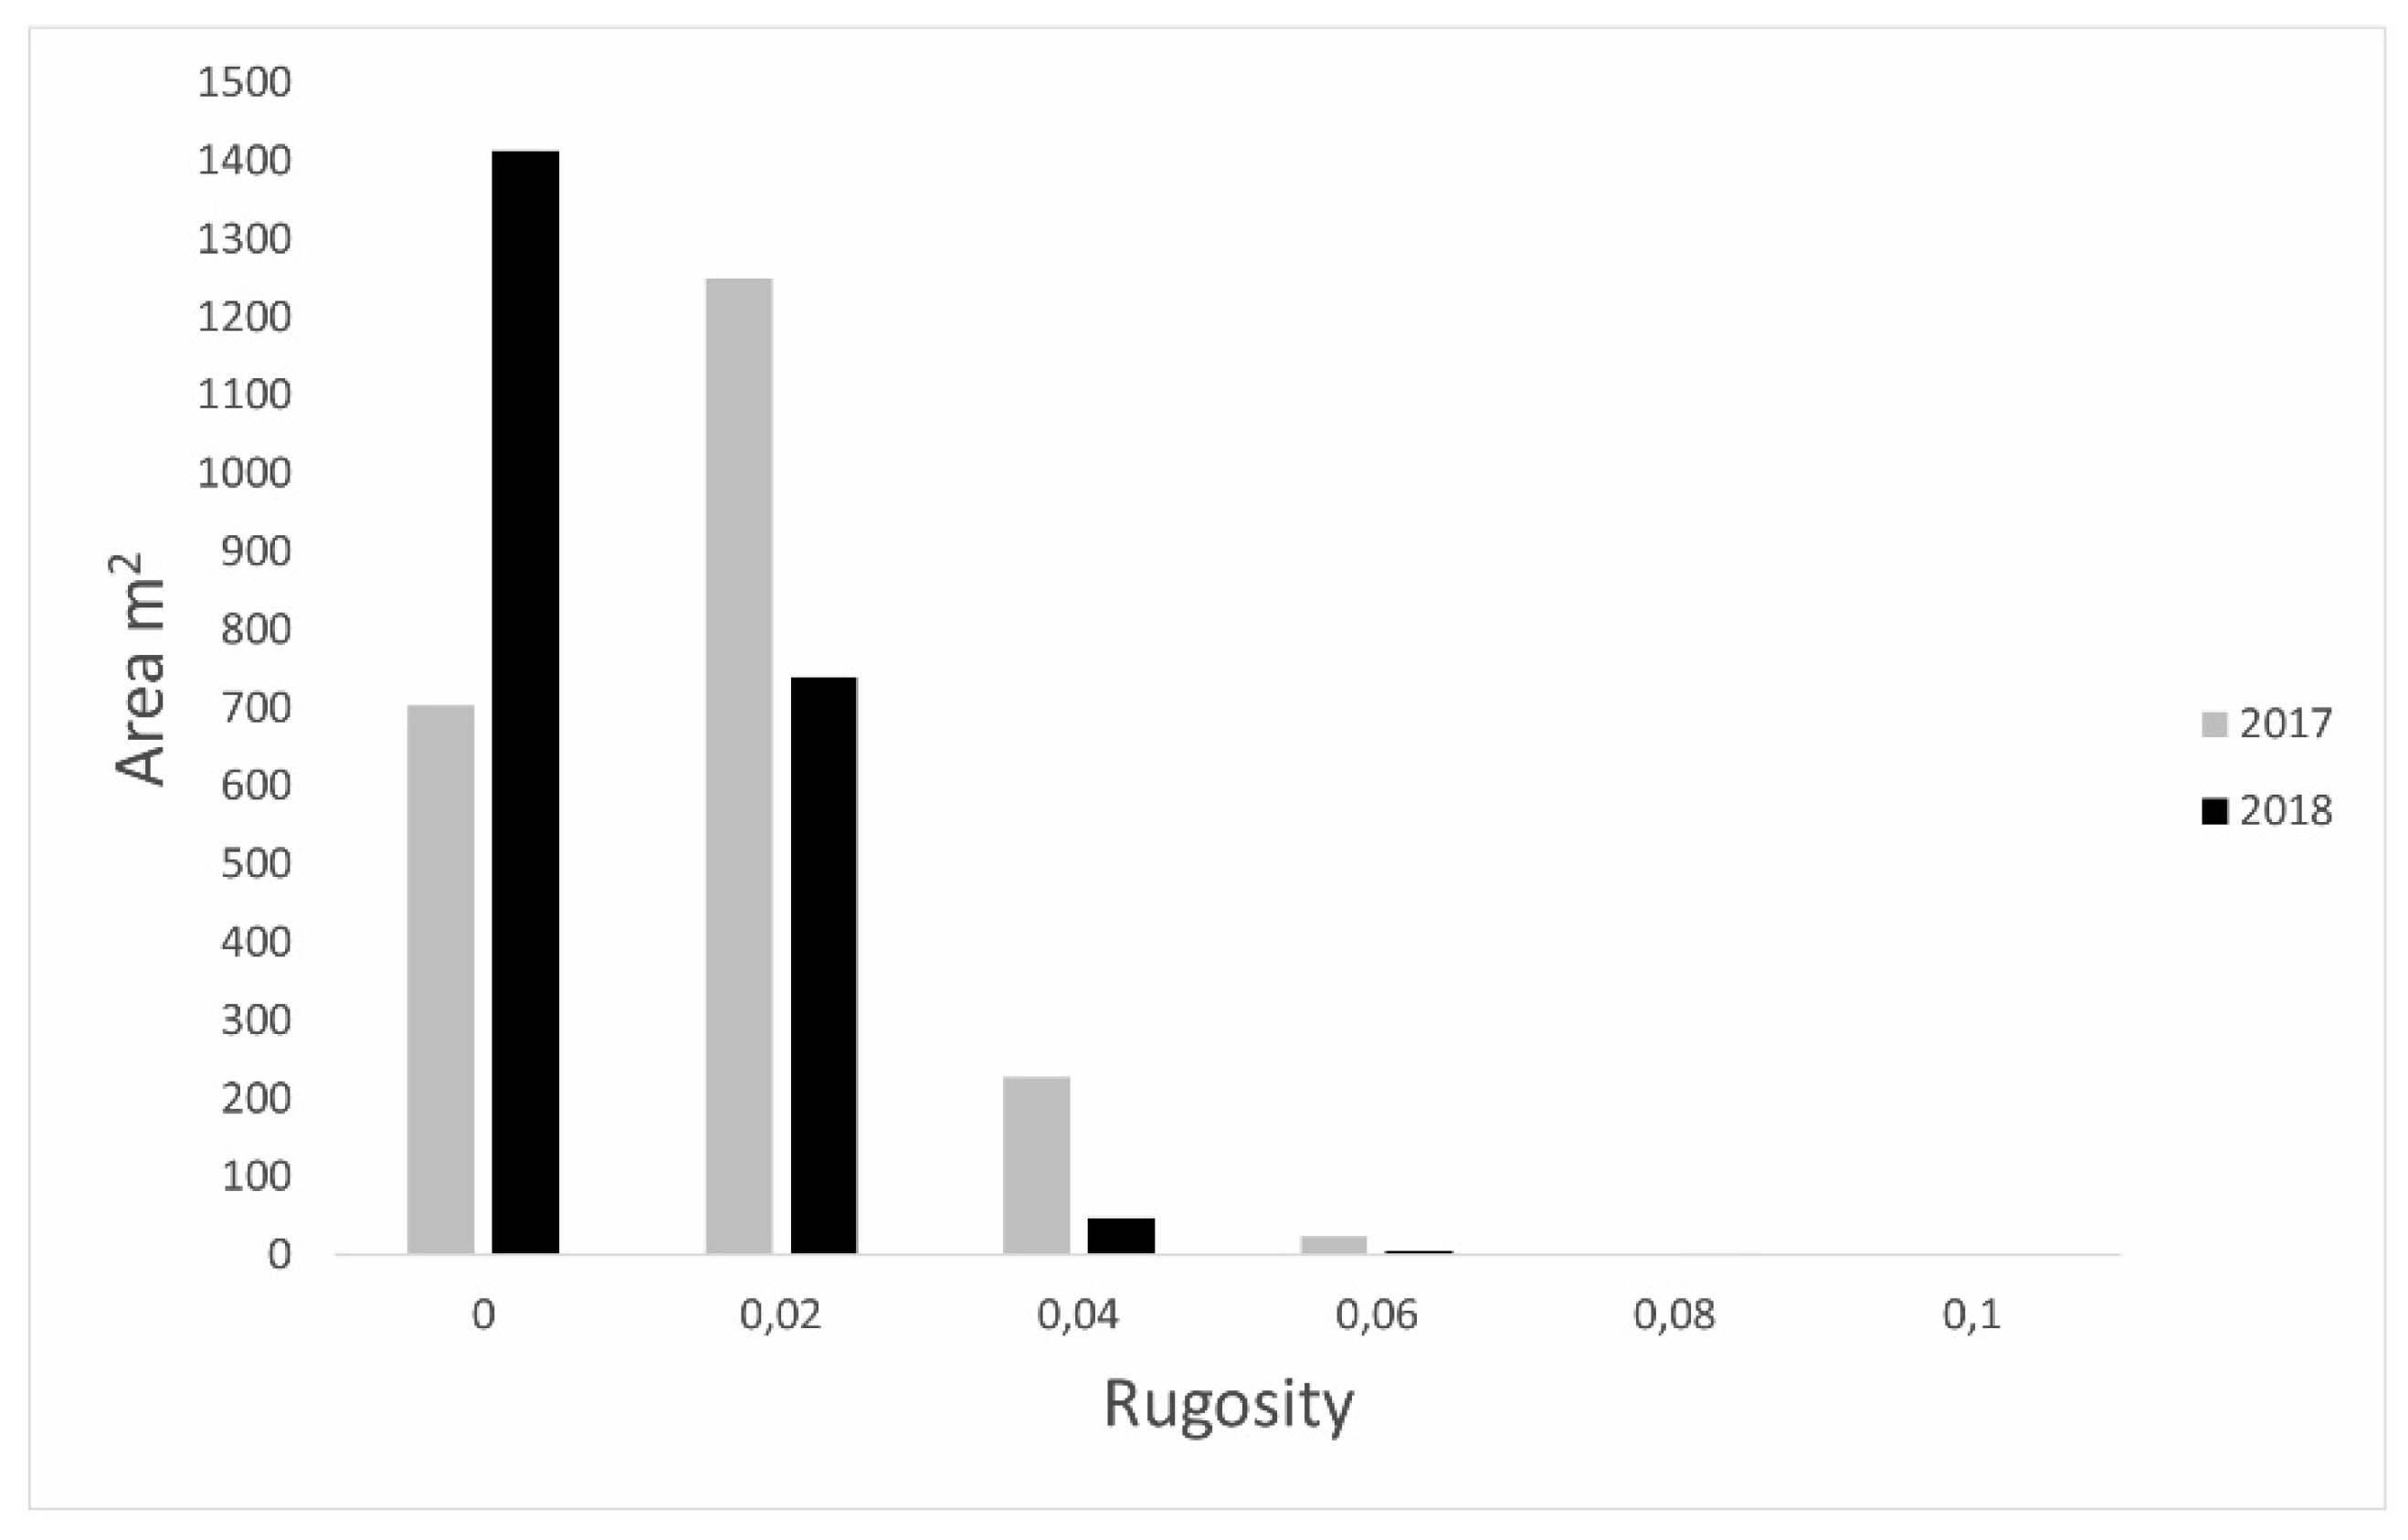
The terrain ruggedness maps, calculated for the areas around the transects (Figure 6c–f and Figure 8c–f), showed a pronounced drop in high ruggedness values. The comparison between 2017 and 2018 highlighted a significant increase in areas with values between 0 and 0.02 (Figure 7 and Figure 9), indicating a progressive reef flattening and an associated extensive decline in the structural complexity. The overall processing times for all the workflow steps, from image acquisition to DTM and structural complexity evaluation, are summarized in Appendix B (Table A1).

4. Discussion

4.1. UAV Surveys and Image Processing

The use of UAV data combined with SfM algorithms has increased in the last several years in different fields of environmental research, such as plastic and marine litter monitoring [73,74], marine habitat mapping [75,76], marine megafauna surveys [76,77,78], coastal geomorphology [79,80], structural geology [58,81] and forestry sciences [71,82]. However, from the first description of the great potential of these coupled techniques in monitoring ecology and geomorphology of the coral reefs by Casella et al. (2016) [24], the studies that have improved this methodology in this field are still few in number [48,83,84].
In our study, we used for the first time UAV images coupled with SfM and OBIA algorithms to monitor and map temporal changes in coral reef benthic assemblages following a mass bleaching event. The high-resolution orthomosaics confirmed the potential of these low-cost and versatile tools for the monitoring of shallow-water reef environments. Consumer-grade UAVs, such as DJI Phantom 4, can take off from the shore or a small boat. This flexibility allows for the easy monitoring of reef structures, such as patch reefs in lagoons, far from the coast. Of course, UAVs cannot be compared to a satellite in terms of spatial cover: satellite imagery analysis can be used to map an entire reef system [22,85,86,87]. However, even if the spatial and temporal resolutions of the satellite sensors have improved in the last decade (Sentinel 2 offers 10 m/pix in visible bands and a revisit time of 5 days), they are not comparable to the centimetric resolution obtained from UAV surveys. This level of detail places the monitoring activities of marine environments with UAVs on a scale that lies between a satellite and a snorkeling/diving survey [24,26].
On the other hand, the main limitations of this type of UAV are the low accuracy of the built-in GPS and the restriction of data analysis to RGB images. Regarding the precision of the GPS, the unmodified geolocation is expected to have an error of up to 3 m [88]. This level of inaccuracy does not permit a comparison of the same area, monitored during two different flights, without precise GCPs. To overcome this limitation, it is possible to use a UAV with an integrated RTK (such as the recent DJI Phantom 4 RTK quadcopter) or georeference the models with RTK GCPs collected in all the areas. Instead, problems in the classification system for high-resolution UAV RGB imagery (e.g., the extensive time spent performing on-screen manual classification) can be overcome with the application of OBIA algorithms. OBIA processing considers not only the spectral information but also the geometrical and spatial relation between pixels or groups of them [89], and this allowed us to manage RGB spatial data with low spectral separation between the classes (e.g., hard coral and coral rubble). Moreover, the use of OBIA helps to speed up the classification process: once the ruleset has been developed, it can be applied to all the orthomosaics that represent the same environments with slight changes in feature parameters.
Another critical factor that may restrict the potential of the UAVs in benthic habitat surveys is the influence of environmental conditions on the water column. Thus, it is essential to monitor weather conditions and oceanographic parameters before the flight. Therefore, we planned the surveys to minimize class misclassification errors, and data acquisition was performed in the same optimal conditions for all the monitored areas in 2017 and 2018.

4.2. Classification and Map Comparison

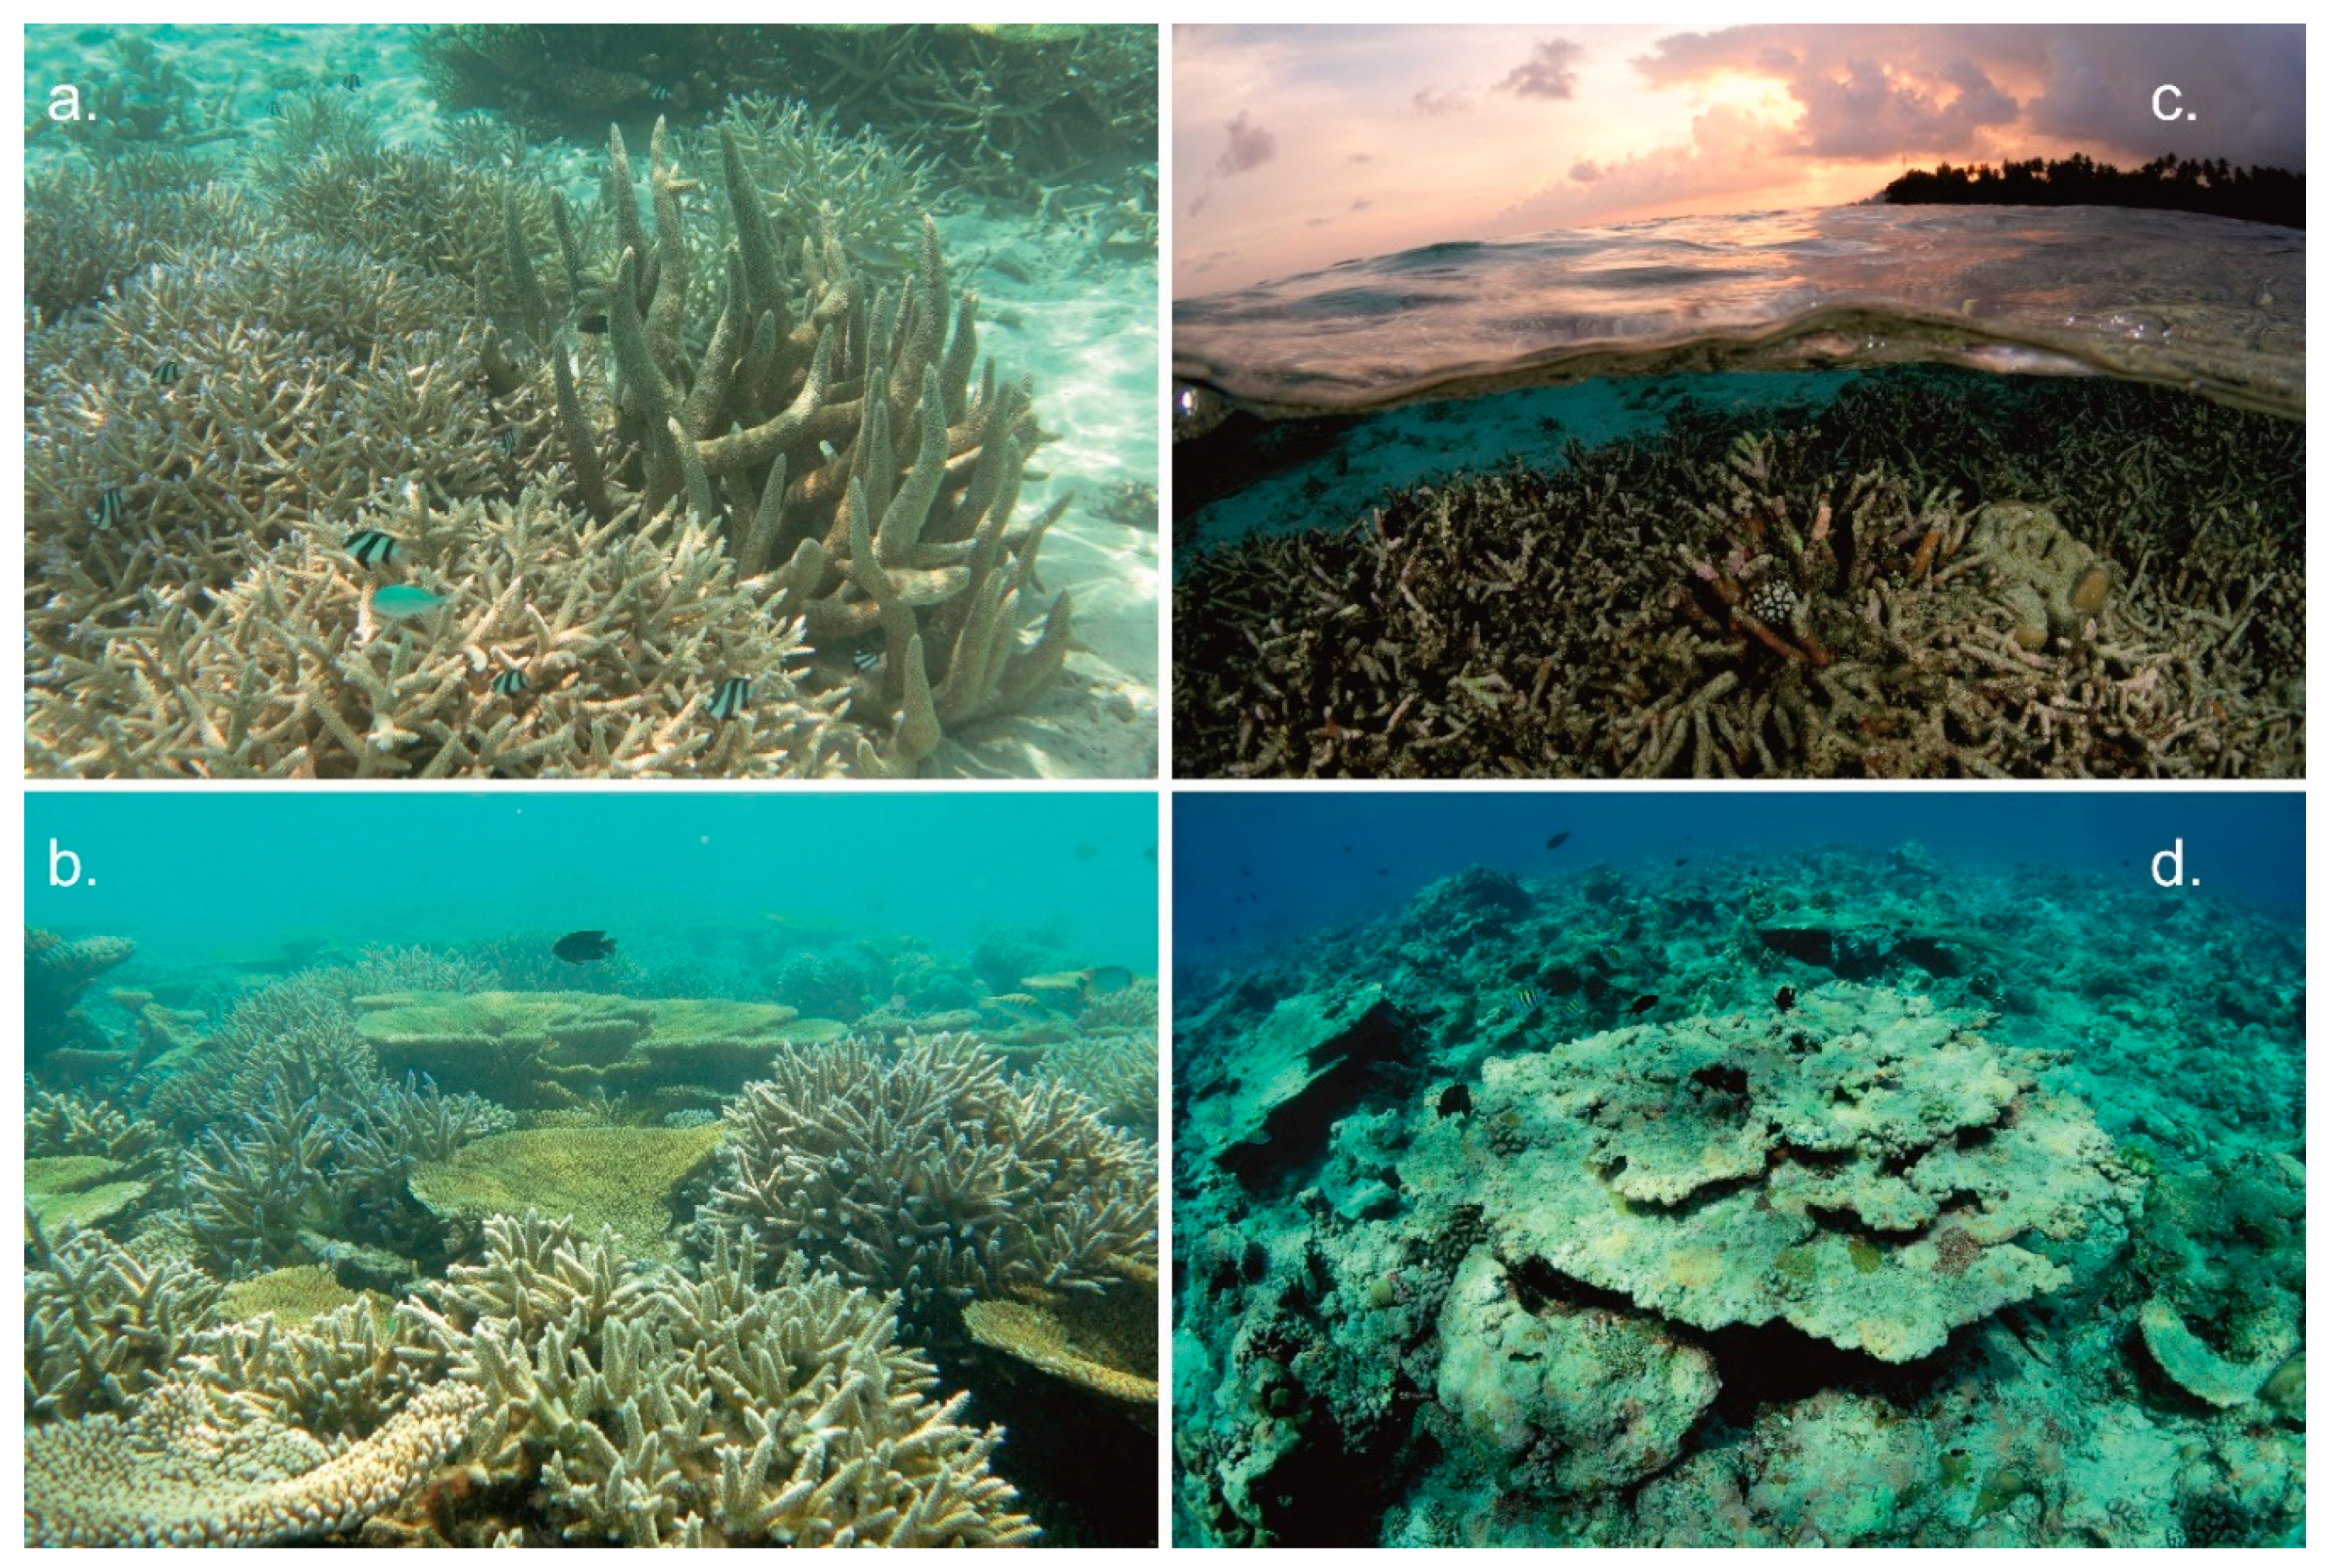
The classification maps produced from the processing of orthomosaics with OBIA had good overall accuracy, 79%, which confirmed the validity of the classification process (Table 2). The workflow adopted allows for the classification of benthic substrate types (sand, coral rubble and hard coral) with higher accuracy than maps realized from free satellite images (Sentinel 2) with the same methodology [65,86]. The maps represent the composition of the substrate that characterizes the surrounding reef rim a few months after the 2016 coral bleaching event and more than two years later. Before the bleaching, the reef flat, the back reef and other minor reefs comprising the reef system of the Magoodhoo island were composed of flourished frameworks (Figure 10a,b) of Acropora spp. colonies (mainly branching but with some tabular) with an increase in massive Porites spp. colonies moving from the shore towards the reef crest. During the bleaching, the most affected corals were tabular and branching Acropora spp., the primary habitat-forming species of shallow reef environments in the Maldives [44]. Mortality rates in this genus reached 80% [90], and signs of colony desegregation were already recorded a few months after the event [91]. The benthic maps (Figure 4b–d) describe an environment in which most of the extension of the hard coral class consists of dead Acropora still in the living position (Figure 10c,d). In addition, this category was composed of 35% dead coral, 51% sand, rubble and other organisms and only 14% live corals [92]. Unfortunately, it was not possible to discriminate the status of corals just from UAV images, so direct snorkeling observations were necessary.
The comparison of the maps between 2017 and 2018 showed a substantial reduction in the hard coral class (Figure 5). The dead colonies gradually lost their structure because of the impairment caused by the action of bioeroders and the mechanical action of currents and waves. Therefore, a shrinking of the coral frameworks was evident in all the monitored areas (Figure 5). Most of the decline was driven by the degradation of branching and tabular colonies that, in some areas, entirely disappeared from the reef (Figure 6a–d and Figure 11). Consequently, an expansion of coral rubble was recorded. The extension of these degraded areas can lead to an increase in algal cover and the formation of unstable substrate unsuitable for coral larvae settlement [93].
In Area 3, the trends of the benthic assemblages, from 2017 to 2108, were slightly different from the other three (Figure 5). This is due to the sheltered position of the reef inside a small lagoon, and the mechanical action of waves and currents on colonies is likely less pronounced. Nevertheless, the general effect observed in all the mapped environments unveiled a significant transformation in substrate type, with a resulting deterioration in the integrity of the hard coral frameworks composing the surveyed reef areas. Rugosity is a crucial ecological factor since biodiversity is strongly correlated with habitat complexity [70,94,95]. The negative variation in this parameter due to the transition from healthy coral reefs to post-bleaching degraded environments can have significant implications on reef-associated organisms such as fish. Moreover, the described changes in the structural complexity of the fore reef can lead to an increase in the rates of coastline erosion as a result of the loss of their coastal protection functions [1,14]. The comparison of selected portions of the DTMs obtained from the SfM workflow let us detect this decline (Figure 6b–d and Figure 8b–d). Linear rugosity and average slope, measured along random virtual transects, showed a decrease between 2017 and 2018 in both indexes (Table 3 and Table 4). These values, which are associated with the analysis of the terrain ruggedness, provide a detailed overview of the variation (Figure 6c–f and Figure 8c–f) and reveal shifts in the substrate type structure.
Unfortunately, we were not able to compare the entirety of point clouds that generated all the DTMs and their terrain ruggedness because of the slight broad-scale geometrical distortion (i.e., doming effect [67,96]) that affected the final DTMs, especially along the edges and at major distances from collected GCPs. For this reason, we had to focus our analysis on a selected portion of the orthomosaics, where we observed that the accuracy of the variability of the topographic surface described by the surface roughness at the scale chosen by our analysis window (3 x 3 pixel) was not affected by the broad-scale error produced by the slight doming effect that could have affected the accuracy of the obtained DTMs. In future studies, this limitation can be overcome with the collection of additional water depth GCPs, at least 12 points regularly distributed over the monitored area, to scale and calibrate the Z value correctly in all the models.

5. Conclusions

Because of the increase in the frequency of extreme heating events driven by climate change, the future of the coral reefs in the Anthropocene is unknown. Estimation of coral recovery after a bleaching event is definitely challenging [1]. In the Maldives, a full recovery from the 2016 mortality could take decades [97,98,99] and might be adversely affected by the increase in coral reef exploitation from fishery activities, tourism and land reclamation [2,42,100]. In this scenario, affordable monitoring techniques and reproducible protocols are essential to improve high-resolution data collection.
Our study demonstrated the enormous potential of UAV data coupled with SfM and OBIA analysis as a tool to monitor shallow-water coral reef assemblages over time. Although with some limitation, our protocol showed that high-resolution imagery collected with UAVs can be efficiently analyzed to monitor changes in substrate type and structural complexity. The spatial resolution achieved from the orthomosaics allowed us to classify benthic community types with good accuracy, and the comparison of the maps over time clearly shows the deterioration of the reef area surveyed, confirmed by the loss in structural complexity that is estimated by the documented variation in terrain ruggedness.
Limitations, such as the difficulty in the calibration of DTMs in order to calculate accurate elevation data over the entire area and over time, could be easily overcome in the future with a better GCP collection strategy and the continuous increase in the efficiency of UAV platforms and cameras to avoid broad-scale errors in the provided DTMs (i.e., the doming effect). However, the maps and the DTMs generated in this work prove that quantitative data can be effectively produced for a long-term and cost-effective monitoring program to check the dynamics of shallow-water coral assemblages in this new human-dominated era.

Author Contributions

Conceptualization, L.F.; data curation, L.F.; formal analysis, L.F. and A.S.; funding acquisition, P.G.; investigation, L.S.; methodology, L.F., L.S. and F.M.; project administration, A.S.; Resources, A.S., C.C. and P.G.; Supervision, P.G.; writing—original draft, L.F. and L.S.; writing—review and editing, A.S., F.M., C.C. and P.G. All authors contributed substantially to the discussion of the results and revision of the manuscript. All authors have read and agreed to the published version of the manuscript.

Funding

This research was funded by MaRHE Center (https://marhe.unimib.it/) which supported in situ data collection and travel grants for L.F. and L.S., and by ULR CoNISMa of Milano-Bicocca (https://marinegeolab.disat.unimib.it/) which provided lab facilities and software licenses for data processing. L.F. and L.S. are funded respectively through a PhD fellowship funded by the University of Milano-Bicocca. F.M. is funded through a post-doctoral fellowship in Earth Sciences by the University of Milano-Bicocca. This article is also an outcome of Project MIUR—Dipartimenti di Eccellenza 2018–2022.

Acknowledgments

The authors are grateful to Magoodhoo island local communities, and Diamonds Thudufushi Resort (PlanHotel Hospitality Group) for the logistic support provided during the fieldwork.

Conflicts of Interest

The authors declare no conflict of interest.

Appendix A

Figure A1. Comparison of terrain profiles along the three transects, T1–T3, in Area 4 (Figure 6) between 2017 and 2018.
Remotesensing 12 02093 g0a1
Figure A2. Comparison of terrain profiles along the two transects, T1 and T2, in Area 2 (Figure 8) between 2017 and 2018.
Remotesensing 12 02093 g0a2

Appendix B

Table A1. Workstation set-up and a summary of the entire workflow time for all the monitored areas. The processing time is closely linked to the configuration of the computer and the number of collected images.
(a)
(a)
Workstation Configuration
WorkstationCPURAM MemoryGPU
Dell XPS 15”Intel® Core™ i7-7700HQ CPU 2.80 GHz32 Gb DDR3 Ram NVIDIA(R) GeForce(R) GTX 1050 Ti with 4 GB GDDR5
CPU: central processing unit; RAM: random access memory; GPU: graphic processing unit
(b)
(b)
DJI Phantom 4 Images Acquisition SfM Processing in Agisoft Photoscan ProOBIA Workflow in eCognition 9.5Maps Comparison and DTM Processing in AgcGis 10.6Overall Processing Time
Aligment1 DTM1Orthomosaic1Multiresolution Segmentation1Selecting Training Areas2Define Statistics2 Nearest Neighbor Classification1 Bentic Assemblages Maps Comparison2Structural Complesity Evaluation2
Processing Time for Area 121 min24 min 122 min1.32 min5.20 min11.06 min≈ 16 min≈ 30 min23 min ≈ 20 min≈ 30 min ≈ 303 min
Processing Time for Area 219 min19 min 98 min1 min3.54 min8.34 min≈ 15 min≈ 30 min 20 min ≈ 20 min≈ 30 min ≈ 263 min
Processing Time for Area 311 min8 min 26 min0.22 min2.05 min3.23 min≈ 10 min≈ 30 min 15 min ≈ 20 min≈ 30 min ≈ 155 min
Processing Time for Area 423 min25 min 142 min2 min9 min28.13 min≈ 20 min≈ 30 min30 min ≈ 20 min≈ 30 min ≈ 360 min
1 Automated Process; 2 Manual Process.

References

  1. Perry, C.T.; Alvarez-Filip, L. Changing geo-ecological functions of coral reefs in the Anthropocene. Funct. Ecol. 2019, 33, 976–988. [Google Scholar] [CrossRef] [Green Version]
  2. Hughes, T.P.; Kerry, J.T.; Baird, A.H.; Connolly, S.R.; Chase, T.J.; Dietzel, A.; Hill, T.; Hoey, A.S.; Hoogenboom, M.O.; Jacobson, M.; et al. Global warming impairs stock–recruitment dynamics of corals. Nature 2019, 568, 387–390. [Google Scholar] [CrossRef] [PubMed]
  3. Fine, M.; Hoegh-Guldberg, O.; Meroz-Fine, E.; Dove, S. Ecological changes over 90 years at Low Isles on the Great Barrier Reef. Nat. Commun. 2019, 10, 4409. [Google Scholar] [CrossRef] [PubMed] [Green Version]
  4. Ateweberhan, M.; McClanahan, T.R. Relationship between historical sea-surface temperature variability and climate change-induced coral mortality in the western Indian Ocean. Mar. Pollut. Bull. 2010. [Google Scholar] [CrossRef]
  5. Cowburn, B.; Moritz, C.; Grimsditch, G.; Solandt, J. Evidence of coral bleaching avoidance, resistance and recovery in the Maldives during the 2016 mass-bleaching event. Mar. Ecol. Prog. Ser. 2019. [Google Scholar] [CrossRef]
  6. Harrison, H.B.; Álvarez-Noriega, M.; Baird, A.H.; Heron, S.F.; MacDonald, C.; Hughes, T.P. Back-to-back coral bleaching events on isolated atolls in the Coral Sea. Coral Reefs 2018. [Google Scholar] [CrossRef]
  7. Weiler, B.A.; Van Leeuwen, T.E.; Stump, K.L. The extent of coral bleaching, disease and mortality for data-deficient reefs in Eleuthera, The Bahamas after the 2014–2017 global bleaching event. Coral Reefs 2019. [Google Scholar] [CrossRef]
  8. Pisapia, C.; Burn, D.; Pratchett, M.S. Changes in the population and community structure of corals during recent disturbances (February 2016–October 2017) on Maldivian coral reefs. Sci. Rep. 2019, 9, 8402. [Google Scholar] [CrossRef]
  9. Magel, J.M.T.; Burns, J.H.R.; Gates, R.D.; Baum, J.K. Effects of bleaching-associated mass coral mortality on reef structural complexity across a gradient of local disturbance. Sci. Rep. 2019, 9, 2512. [Google Scholar] [CrossRef] [Green Version]
  10. Alvarez-Filip, L.; Paddack, M.J.; Collen, B.; Robertson, D.R.; Côté, I.M. Simplification of Caribbean reef-fish assemblages over decades of coral reef degradation. PLoS ONE 2015. [Google Scholar] [CrossRef] [Green Version]
  11. Graham, N.A.J.; Nash, K.L. The importance of structural complexity in coral reef ecosystems. Coral Reefs 2013, 32, 315–326. [Google Scholar] [CrossRef]
  12. Wilson, S.K.; Graham, N.A.J.; Pratchett, M.S.; Jones, G.P.; Polunin, N.V.C. Multiple disturbances and the global degradation of coral reefs: Are reef fishes at risk or resilient? Glob. Chang. Biol. 2006. [Google Scholar] [CrossRef]
  13. Sheppard, C.R.C.; Spalding, M.; Bradshaw, C.; Wilson, S. Erosion vs. recovery of coral reefs after 1998 El Niño: Chagos reefs, Indian Ocean. AMBIO 2002. [Google Scholar] [CrossRef]
  14. Harris, D.L.; Rovere, A.; Casella, E.; Power, H.; Canavesio, R.; Collin, A.; Pomeroy, A.; Webster, J.M.; Parravicini, V. Coral reef structural complexity provides important coastal protection from waves under rising sea levels. Sci. Adv. 2018, 4, 1–7. [Google Scholar] [CrossRef] [Green Version]
  15. Graham, N.A.J.; Wilson, S.K.; Jennings, S.; Polunin, N.V.C.; Bijoux, J.P.; Robinson, J. Dynamic fragility of oceanic coral reef ecosystems. Proc. Natl. Acad. Sci. USA 2006. [Google Scholar] [CrossRef] [Green Version]
  16. Andréfouët, S.; Riegl, B. Remote sensing: A key tool for interdisciplinary assessment of coral reef processes. Coral Reefs 2004, 23, 1–4. [Google Scholar] [CrossRef]
  17. Witze, A. Reefs mapped from above. Nature 2016, 534, 13–14. [Google Scholar] [CrossRef] [Green Version]
  18. Green, E.P.; Mumby, P.J.; Edwards, A.J.; Clark, C.D. A review of remote sensing for the assessment and management of tropical coastal resources. Coast. Manag. 1996. [Google Scholar] [CrossRef]
  19. Mumby, P.J.; Skirving, W.; Strong, A.E.; Hardy, J.T.; LeDrew, E.F.; Hochberg, E.J.; Stumpf, R.P.; David, L.T. Remote sensing of coral reefs and their physical environment. Mar. Pollut. Bull. 2004, 48, 219–228. [Google Scholar] [CrossRef]
  20. Hedley, J.D.; Roelfsema, C.; Brando, V.; Giardino, C.; Kutser, T.; Phinn, S.; Mumby, P.J.; Barrilero, O.; Laporte, J.; Koetz, B. Coral reef applications of Sentinel-2: Coverage, characteristics, bathymetry and benthic mapping with comparison to Landsat 8. Remote Sens. Environ. 2018, 216, 598–614. [Google Scholar] [CrossRef]
  21. Traganos, D.; Aggarwal, B.; Poursanidis, D.; Topouzelis, K.; Chrysoulakis, N.; Reinartz, P. Towards global-scale seagrass mapping and monitoring using Sentinel-2 on Google Earth Engine: The case study of the Aegean and Ionian Seas. Remote Sens. 2018, 10, 1227. [Google Scholar] [CrossRef] [Green Version]
  22. Li, J.; Schill, S.R.; Knapp, D.E.; Asner, G.P. Object-based mapping of coral reef habitats using planet dove satellites. Remote Sens. 2019, 11, 1445. [Google Scholar] [CrossRef] [Green Version]
  23. Wedding, L.M.; Friedlander, A.M.; McGranaghan, M.; Yost, R.S.; Monaco, M.E. Using bathymetric lidar to define nearshore benthic habitat complexity: Implications for management of reef fish assemblages in Hawaii. Remote Sens. Environ. 2008. [Google Scholar] [CrossRef]
  24. Casella, E.; Collin, A.; Harris, D.; Ferse, S.; Bejarano, S.; Parravicini, V.; Hench, J.L.; Rovere, A. Mapping coral reefs using consumer-grade drones and structure from motion photogrammetry techniques. Coral Reefs 2016. [Google Scholar] [CrossRef]
  25. Murfitt, S.L.; Allan, B.M.; Bellgrove, A.; Rattray, A.; Young, M.A.; Ierodiaconou, D. Applications of unmanned aerial vehicles in intertidal reef monitoring. Sci. Rep. 2017, 7, 10259. [Google Scholar] [CrossRef] [PubMed] [Green Version]
  26. Ventura, D.; Bonifazi, A.; Gravina, M.F.; Belluscio, A.; Ardizzone, G. Mapping and classification of ecologically sensitive marine habitats using unmanned aerial vehicle (UAV) imagery and Object-Based Image Analysis (OBIA). Remote Sens. 2018, 10, 1331. [Google Scholar] [CrossRef] [Green Version]
  27. Colomina, I.; Molina, P. Unmanned aerial systems for photogrammetry and remote sensing: A review. ISPRS J. Photogramm. Remote Sens. 2014, 92, 79–97. [Google Scholar] [CrossRef] [Green Version]
  28. Hamylton, S.M. Mapping coral reef environments: A review of historical methods, recent advances and future opportunities. Prog. Phys. Geogr. 2017, 41, 803–833. [Google Scholar] [CrossRef]
  29. Nowak, M.M.; Dziób, K.; Bogawski, P. Unmanned Aerial Vehicles (UAVs) in environmental biology: A review. Eur. J. Ecol. 2019, 4, 56–74. [Google Scholar] [CrossRef]
  30. Calders, K.; Phinn, S.; Ferrari, R.; Leon, J.; Armston, J.; Asner, G.P.; Disney, M. 3D Imaging Insights into Forests and Coral Reefs. Trends Ecol. Evol. 2020, 35, 6–9. [Google Scholar] [CrossRef]
  31. Graham, N.A.J.; Wilson, S.K.; Pratchett, M.S.; Polunin, N.V.C.; Spalding, M.D. Coral mortality versus structural collapse as drivers of corallivorous butterflyfish decline. Biodivers. Conserv. 2009. [Google Scholar] [CrossRef]
  32. Risk, M.J. Fish Diversity on a Coral Reef in the Virgin Islands. Atoll Res. Bull. 1972. [Google Scholar] [CrossRef] [Green Version]
  33. Friedman, A.; Pizarro, O.; Williams, S.B.; Johnson-Roberson, M. Multi-Scale Measures of Rugosity, Slope and Aspect from Benthic Stereo Image Reconstructions. PLoS ONE 2012, 7, e50440. [Google Scholar] [CrossRef]
  34. Burns, J.; Delparte, D.; Gates, R.D.; Takabayashi, M. Integrating structure-from-motion photogrammetry with geospatial software as a novel technique for quantifying 3D ecological characteristics of coral reefs. PeerJ 2015. [Google Scholar] [CrossRef] [PubMed]
  35. Leon, J.X.X.; Roelfsema, C.M.; Saunders, M.I.; Phinn, S.R. Measuring coral reef terrain roughness using ‘Structure-from-Motion’ close-range photogrammetry. Geomorphology 2015, 242, 21–28. [Google Scholar] [CrossRef]
  36. Ferrari, R.; DElparte, D.; Kapono, L.; Belt, M.; Gates, R.D.; Takabayashi, M. Quantifying multiscale habitat structural complexity: A cost-effective framework for underwater 3D modelling. Remote Sens. 2016, 8, 113. [Google Scholar] [CrossRef] [Green Version]
  37. Storlazzi, C.D.; Dartnell, P.; Hatcher, G.A.; Gibbs, A.E. End of the chain? Rugosity and fine-scale bathymetry from existing underwater digital imagery using structure-from-motion (SfM) technology. Coral Reefs 2016. [Google Scholar] [CrossRef]
  38. Burns, J.H.R.; Delparte, D.; Kapono, L.; Belt, M.; Gates, R.D.; Takabayashi, M. Assessing the impact of acute disturbances on the structure and composition of a coral community using innovative 3D reconstruction techniques. Methods Oceanogr. 2016, 16, 49–59. [Google Scholar] [CrossRef] [Green Version]
  39. Couch, C.S.; Burns, J.H.R.; Liu, G.; Steward, K.; Gutlay, T.N.; Kenyon, J.; Eakin, C.M.; Kosaki, R.K. Mass coral bleaching due to unprecedented marine heatwave in Papahānaumokuākea Marine National Monument (Northwestern Hawaiian Islands). PLoS ONE 2017. [Google Scholar] [CrossRef] [Green Version]
  40. Ferrari, R.; Figueira, W.F.; Pratchett, M.S.; Boube, T.; Adam, A.; Kobelkowsky-Vidro, T.; Doo, S.S.; Atwood, T.B.; Byrne, M. 3D photogrammetry quantifies growth and external erosion of individual coral colonies and skeletons. Sci. Rep. 2017. [Google Scholar] [CrossRef]
  41. Naseer, A.; Hatcher, B.G. Inventory of the Maldives? Coral reefs using morphometrics generated from Landsat ETM+ imagery. Coral Reefs 2004, 23, 161–168. [Google Scholar] [CrossRef]
  42. Fallati, L.; Savini, A.; Sterlacchini, S.; Galli, P. Land use and land cover (LULC) of the Republic of the Maldives: First national map and LULC change analysis using remote-sensing data. Environ. Monit. Assess. 2017, 189, 417. [Google Scholar] [CrossRef] [PubMed]
  43. Hicks, F. Ecosystem Services Assessment of North Ari Atoll Ecosystem Services Assessment of North Ari Atoll Tundi Agardy; IUCN: Gland, Switzerland, 2017. [Google Scholar]
  44. Pisapia, C.; Burn, D.; Yoosuf, R.; Najeeb, A.; Anderson, K.D.; Pratchett, M.S. Coral recovery in the central Maldives archipelago since the last major mass-bleaching, in 1998. Sci. Rep. 2016, 6, 34720. [Google Scholar] [CrossRef] [PubMed]
  45. Saponari, L.; Montalbetti, E.; Galli, P.; Strona, G.; Seveso, D.; Dehnert, I.; Montano, S. Monitoring and assessing a 2-year outbreak of the corallivorous seastar Acanthaster planci in Ari Atoll, Republic of Maldives. Environ. Monit. Assess. 2018. [Google Scholar] [CrossRef] [PubMed]
  46. Montalbetti, E.; Saponari, L.; Montano, S.; Maggioni, D.; Dehnert, I.; Galli, P.; Seveso, D. New insights into the ecology and corallivory of Culcita sp. (Echinodermata: Asteroidea) in the Republic of Maldives. Hydrobiologia 2019, 827, 353–365. [Google Scholar] [CrossRef]
  47. Bruckner, A.W.; Coward, G.; Bimson, K.; Rattanawongwan, T. Predation by feeding aggregations of Drupella spp. inhibits the recovery of reefs damaged by a mass bleaching event. Coral Reefs 2017. [Google Scholar] [CrossRef]
  48. Levy, J.; Hunter, C.; Lukacazyk, T.; Franklin, E.C. Assessing the spatial distribution of coral bleaching using small unmanned aerial systems. Coral Reefs 2018. [Google Scholar] [CrossRef] [Green Version]
  49. Doukari, M.; Batsaris, M.; Papakonstantinou, A.; Topouzelis, K. A Protocol for Aerial Survey in Coastal Areas Using UAS. Remote Sens. 2019, 11, 1913. [Google Scholar] [CrossRef] [Green Version]
  50. Montano, S.; Strona, G.; Seveso, D.; Galli, P. First report of coral diseases in the Republic of Maldives. Dis. Aquat. Organ. 2012. [Google Scholar] [CrossRef] [Green Version]
  51. Seveso, D.; Montano, S.; Strona, G.; Orlandi, I.; Galli, P.; Vai, M. The susceptibility of corals to thermal stress by analysing Hsp60 expression. Mar. Environ. Res. 2014. [Google Scholar] [CrossRef]
  52. Montano, S.; Fattorini, S.; Parravicini, V.; Berumen, M.L.; Galli, P.; Maggioni, D.; Arrigoni, R.; Seveso, D.; Strona, G. Corals hosting symbiotic hydrozoans are less susceptible to predation and disease. Proc. R. Soc. B Biol. Sci. 2017. [Google Scholar] [CrossRef] [PubMed] [Green Version]
  53. Saliu, F.; Montano, S.; Garavaglia, M.G.; Lasagni, M.; Seveso, D.; Galli, P. Microplastic and charred microplastic in the Faafu Atoll, Maldives. Mar. Pollut. Bull. 2018, 136, 464–471. [Google Scholar] [CrossRef] [PubMed]
  54. Available online: www.dji.com/it/ground-station-pro (accessed on 18 January 2017).
  55. Available online: www.agisoft.com (accessed on 22 March 2017).
  56. Benassi, F.; Dall’Asta, E.; Diotri, F.; Forlani, G.; Morra di Cella, U.; Roncella, R.; Santise, M. Testing accuracy and repeatability of UAV blocks oriented with gnss-supported aerial triangulation. Remote Sens. 2017, 9, 172. [Google Scholar] [CrossRef] [Green Version]
  57. Cook, K.L. An evaluation of the effectiveness of low-cost UAVs and structure from motion for geomorphic change detection. Geomorphology 2017, 278, 195–208. [Google Scholar] [CrossRef]
  58. Bonali, F.L.; Tibaldi, A.; Marchese, F.; Fallati, L.; Russo, E.; Corselli, C.; Savini, A. UAV-based surveying in volcano-tectonics: An example from the Iceland rift. J. Struct. Geol. 2019, 121, 46–64. [Google Scholar] [CrossRef]
  59. Verhoeven, G. Taking computer vision aloft—Archaeological three-dimensional reconstructions from aerial photographs with photoscan. Archaeol. Prospect. 2011, 18, 67–73. [Google Scholar] [CrossRef]
  60. Brunier, G.; Fleury, J.; Anthony, E.J.; Gardel, A.; Dussouillez, P. Close-range airborne Structure-from-Motion Photogrammetry for high-resolution beach morphometric surveys: Examples from an embayed rotating beach. Geomorphology 2016, 261, 76–88. [Google Scholar] [CrossRef]
  61. Available online: https://emlid.com/reachrs/ (accessed on 8 January 2017).
  62. Hill, A.C.; Limp, F.; Casana, J.; Laugier, E.J.; Williamson, M. A New Era in Spatial Data Recording: Low-Cost GNSS. Adv. Archaeol. Pract. 2019, 7, 169–177. [Google Scholar] [CrossRef] [Green Version]
  63. Available online: https://webapp.geod.nrcan.gc.ca/geod/tools-outils/ppp.php?locale=en (accessed on 22 November 2017).
  64. Available online: http://www.ecognition.com/suite/ecognition-developer (accessed on 3 April 2019).
  65. Roelfsema, C.; Kovacs, E.; Roos, P.; Terzano, D.; Lyons, M.; Phinn, S. Use of a semi-automated object based analysis to map benthic composition, Heron Reef, Southern Great Barrier Reef. Remote Sens. Lett. 2018, 9, 324–333. [Google Scholar] [CrossRef]
  66. Liu, D.; Xia, F. Assessing object-based classification: Advantages and limitations. Remote Sens. Lett. 2010, 1, 187–194. [Google Scholar] [CrossRef]
  67. Naylor, A.K. Island morphology, reef resources, and development paths in the Maldives. Prog. Phys. Geogr. 2015, 39, 728–749. [Google Scholar] [CrossRef]
  68. Sappington, J.M.; Longshore, K.M.; Thompson, D.B. Quantifying Landscape Ruggedness for Animal Habitat Analysis: A Case Study Using Bighorn Sheep in the Mojave Desert. J. Wildl. Manag. 2007, 71, 1419–1426. [Google Scholar] [CrossRef]
  69. Price, D.M.; Robert, K.; Callaway, A.; Lo Iacono, C.; Hall, R.A.; Huvenne, A.A.I. Using 3D photogrammetry from ROV video to quantify cold-water coral reef structural complexity and investigate its influence on biodiversity and community assemblage. Coral Reefs 2019. [Google Scholar] [CrossRef] [Green Version]
  70. Anelli, M.; Juilla, T.; Fallati, L.; Galli, P.; Rossini, M.; Colombo, R. Towards new applications of underwater photogrammetry for investigating coral reef morphology and habitat complexity in the Myeik Archipelago, Myanmar. Geocarto Int. 2017, 6049, 459–472. [Google Scholar] [CrossRef]
  71. Kattenborn, T.; Lopatin, J.; Förster, M.; Braun, A.C.; Fassnacht, F.E. UAV data as alternative to field sampling to map woody invasive species based on combined Sentinel-1 and Sentinel-2 data. Remote Sens. Environ. 2019, 227, 61–73. [Google Scholar] [CrossRef]
  72. Congalton, R.G.; Green, K. Assessing the Accuracy of Remotely Sensed Data. Assess. Accuracy Remote. Sensed Data 2008. [Google Scholar] [CrossRef]
  73. Fallati, L.; Polidori, A.; Salvatore, C.; Saponari, L.; Savini, A.; Galli, P. Anthropogenic Marine Debris assessment with Unmanned Aerial Vehicle imagery and deep learning: A case study along the beaches of the Republic of Maldives. Sci. Total Environ. 2019, 133581. [Google Scholar] [CrossRef]
  74. Martin, C.; Parkes, S.; Zhang, Q.; Zhang, X.; McCabe, M.F.; Duarte, C.M. Use of unmanned aerial vehicles for efficient beach litter monitoring. Mar. Pollut. Bull. 2018, 131, 662–673. [Google Scholar] [CrossRef] [Green Version]
  75. Ventura, D.; Bruno, M.; Jona Lasinio, G.; Belluscio, A.; Ardizzone, G. A low-cost drone based application for identifying and mapping of coastal fish nursery grounds. Estuar. Coast. Shelf Sci. 2016, 171, 85–98. [Google Scholar] [CrossRef]
  76. Papakonstantinou, A.; Topouzelis, K.; Pavlogeorgatos, G. Coastline Zones Identification and 3D Coastal Mapping Using UAV Spatial Data. ISPRS Int. J. Geo-Inf. 2016, 5, 75. [Google Scholar] [CrossRef] [Green Version]
  77. Kiszka, J.J.; Mourier, J.; Gastrich, K.; Heithaus, M.R. Using unmanned aerial vehicles (UAVs) to investigate shark and ray densities in a shallow coral lagoon. Mar. Ecol. Prog. Ser. 2016, 560, 237–242. [Google Scholar] [CrossRef]
  78. Colefax, A.P.; Butcher, P.A.; Kelaher, B.P. The potential for unmanned aerial vehicles (UAVs) to conduct marine fauna surveys in place of manned aircraft. ICES J. Mar. Sci. 2018, 75, 1–8. [Google Scholar] [CrossRef]
  79. Raoult, V.; Tosetto, L.; Williamson, J. Drone-Based High-Resolution Tracking of Aquatic Vertebrates. Drones 2018, 2, 37. [Google Scholar] [CrossRef] [Green Version]
  80. Lowe, M.K.; Adnan, F.A.F.; Hamylton, S.M.; Carvalho, R.C.; Woodroffe, C.D. Assessing Reef-Island Shoreline Change Using UAV-Derived Orthomosaics and Digital Surface Models. Drones 2019, 3, 44. [Google Scholar] [CrossRef] [Green Version]
  81. Laporte-Fauret, Q.; Marieu, V.; Castelle, B.; Michalet, R.; Bujan, S.; Rosebery, D. Low-Cost UAV for high-resolution and large-scale coastal dune change monitoring using photogrammetry. J. Mar. Sci. Eng. 2019, 7, 63. [Google Scholar] [CrossRef] [Green Version]
  82. Tibaldi, A.; Bonali, F.L.; Russo, E.; Fallati, L. Surface deformation and strike-slip faulting controlled by dyking and host rock lithology: A compendium from the Krafla Rift, Iceland. J. Volcanol. Geotherm. Res. 2020, 395, 106835. [Google Scholar] [CrossRef]
  83. Baron, J.; Hill, D.J.; Elmiligi, H. Combining image processing and machine learning to identify invasive plants in high-resolution images. Int. J. Remote Sens. 2018, 39, 5099–5118. [Google Scholar] [CrossRef]
  84. Parsons, M.; Bratanov, D.; Gaston, K.J.; Gonzalez, F. UAVs, hyperspectral remote sensing, and machine learning revolutionising reef monitoring. Sensors 2018, 18, 2026. [Google Scholar] [CrossRef] [Green Version]
  85. Collin, A.; Dubois, S.; James, D.; Houet, T. Improving Intertidal Reef Mapping Using UAV Surface, Red Edge, and Near-Infrared Data. Drones 2019, 3, 67. [Google Scholar] [CrossRef] [Green Version]
  86. Hedley, J.; Roelfsema, C.; Koetz, B.; Phinn, S. Capability of the Sentinel 2 mission for tropical coral reef mapping and coral bleaching detection. Remote Sens. Environ. 2012, 120, 145–155. [Google Scholar] [CrossRef]
  87. Roelfsema, C.; Phinn, S.; Jupiter, S.; Comley, J.; Albert, S. Mapping coral reefs at reef to reef-system scales, 10s-1000s km2, using object-based image analysis. Int. J. Remote Sens. 2013. [Google Scholar] [CrossRef]
  88. Roelfsema, C.; Kovacs, E.; Ortiz, J.C.; Wolff, N.H.; Callaghan, D.; Wettle, M.; Ronan, M.; Hamylton, S.M.; Mumby, P.J.; Phinn, S. Coral reef habitat mapping: A combination of object-based image analysis and ecological modelling. Remote Sens. Environ. 2018, 208, 27–41. [Google Scholar] [CrossRef]
  89. Kalacska, M.; Lucanus, O.; Sousa, L.; Vieira, T.; Arroyo-Mora, J. Freshwater Fish Habitat Complexity Mapping Using Above and Underwater Structure-From-Motion Photogrammetry. Remote Sens. 2018, 10, 1912. [Google Scholar] [CrossRef] [Green Version]
  90. Blaschke, T. Object based image analysis for remote sensing. ISPRS J. Photogramm. Remote Sens. 2010, 65, 2–16. [Google Scholar] [CrossRef] [Green Version]
  91. Marine Research Center. Status of Coral Bleaching in the Maldives; Marine Research Center: Malé, Maldives, 2016; pp. 47 pages. [Google Scholar]
  92. Saponari, L.; Dehnert, I.; Galli, P.; Montano, S. Assessing population collapse of Drupella spp. (Mollusca: Gastropoda) in the shallow reef after a catastrophic bleaching event in the Republic of Maldives. Under Rev. 2020. [Google Scholar]
  93. Perry, C.T.; Morgan, K.M. Bleaching drives collapse in reef carbonate budgets and reef growth potential on southern Maldives reefs. Sci. Rep. 2017, 7, 40581. [Google Scholar] [CrossRef] [Green Version]
  94. Roth, F.; Saalmann, F.; Thomson, T.; Coker, D.J.; Villalobos, R.; Jones, B.H.; Wild, C.; Carvalho, S. Coral reef degradation affects the potential for reef recovery after disturbance. Mar. Environ. Res. 2018, 142, 48–58. [Google Scholar] [CrossRef]
  95. Newman, S.P.; Meesters, E.H.; Dryden, C.S.; Williams, S.M.; Sanchez, C.; Mumby, P.J.; Polunin, N.V.C. Reef flattening effects on total richness and species responses in the Caribbean. J. Anim. Ecol. 2015, 84, 1678–1689. [Google Scholar] [CrossRef]
  96. James, R.M.; Robson, S. Mitigating systematic error in topographic models derived from UAV and ground-based image networks. Earth Surf. Process. Landf. 2014, 39, 1413–1420. [Google Scholar] [CrossRef] [Green Version]
  97. Hughes, T.P.; Anderson, K.D.; Connolly, S.R.; Heron, S.F.; Kerry, J.T.; Lough, J.M.; Barid, A.H.; Baum, J.K.; Berumen, M.L.; Bridge, T.C.; et al. Spatial and temporal patterns of mass bleaching of corals in the Anthropocene. Science 2018, 359, 80–83. [Google Scholar] [CrossRef] [Green Version]
  98. Gilmour, J.P.; Smith, L.D.; Heyward, A.J.; Baird, A.H.; Pratchett, M.S. Recovery of an isolated coral reef system following severe disturbance. Science 2013. [Google Scholar] [CrossRef] [PubMed]
  99. Graham, N.A.J.; Nash, K.L.; Kool, J.T. Coral reef recovery dynamics in a changing world. Coral Reefs 2011. [Google Scholar] [CrossRef]
  100. Aslam, M.; Kench, P.S. Reef island dynamics and mechanisms of change in Huvadhoo Atoll, Republic of Maldives, Indian Ocean. Anthropocene 2017, 18, 57–68. [Google Scholar] [CrossRef]
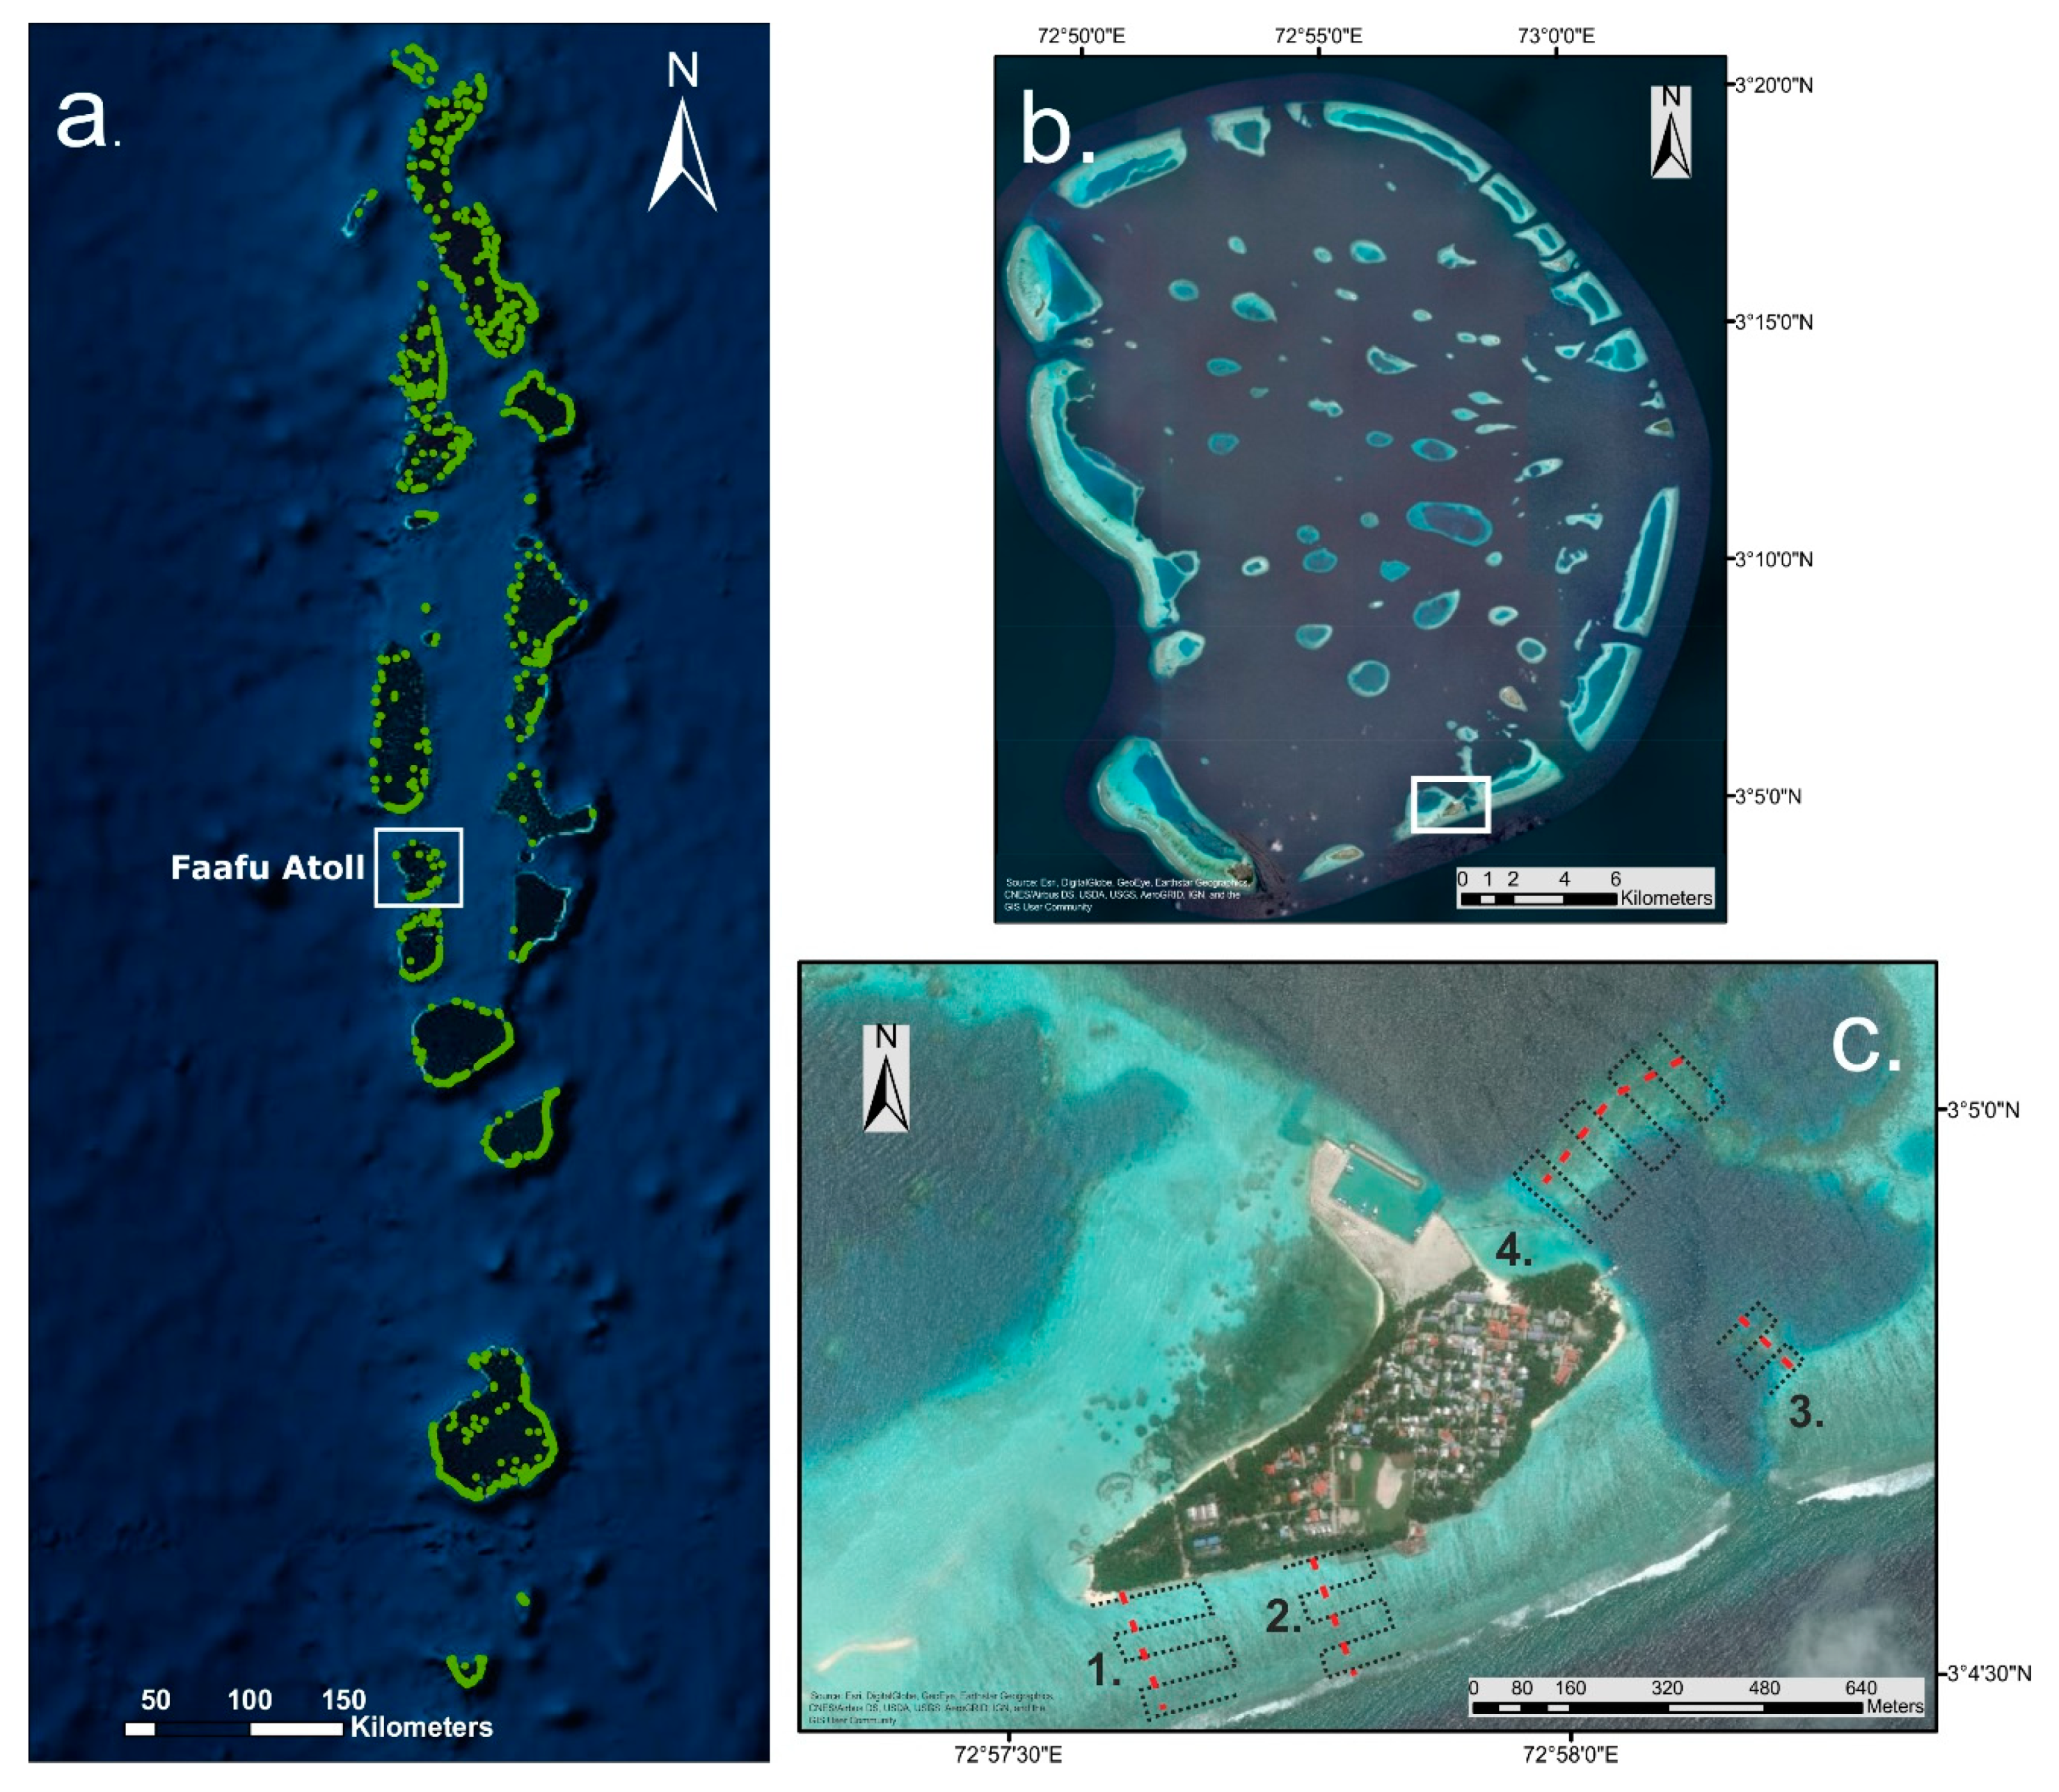
Figure 1. (a) Geographic location of the study area, Republic of Maldives; (b) Faafu Atoll. (c) The four monitored reef areas around Magoodhoo island: black dotted lines indicate the approximate extent of the UAV-surveyed areas and the flight paths; red dashed lines indicate the snorkeling transects.
Remotesensing 12 02093 g001
Figure 2. Example of UAV flight paths over Area 2 in 2017 and 2018. The surveys were carried out with similar environmental conditions: low tide, little wind and during the late afternoon (one hour before the sunset).
Remotesensing 12 02093 g002
Figure 3. Identification of suitable ground control point features over easily recognizable structures from drone images.
Remotesensing 12 02093 g003
Figure 4. Examples of results obtained from the application of the OBIA workflow in Area 2. High-resolution orthomosaics of Area 2 (a,a’) over time. Image segmentation output (b,b’) and classification of substrate type (c,c’) in February 2017 and November 2018.
Remotesensing 12 02093 g004
Figure 5. The extent of detected substrates in the monitored areas between years.
Remotesensing 12 02093 g005
Figure 6. A portion of orthomosaic and DTM of Area 4 monitored in February 2017 (ac) and November 2018 (df). Hillshade DTM comparison (b–e) highlights an overall flattening of the area due to the destruction of coral colonies, mainly Acropora table colonies, indicated by the yellow arrows (for a close-range view, see Figure 11. Colored lines in (ad) and (be) represent selected transects in which linear rugosity and average slope have been computed (see the text for an explanation and Table 3). (c,f) Images representing the rugosity maps of the area around transects.
Remotesensing 12 02093 g006
Figure 7. The histogram describes the temporal change (from 2017 to 2018) in the extent of areas with the same rugosity index in the selected portion of Area 4 (Figure 6).
Remotesensing 12 02093 g007
Figure 8. A portion of the orthomosaic and DTM of Area 2 monitored in February 2017 (ac) and November 2018 (df). Colored lines in (ad) and (be) represent selected transects in which linear rugosity and average slope have been computed (see the text for an explanation and Table 4). (c,f) Images representing the rugosity maps of the area around the transects.
Remotesensing 12 02093 g008
Figure 9. The histogram describes the temporal change (from 2017 to 2018) in the extent of areas with the same rugosity index in the selected portion of Area 2 (Figure 8).
Remotesensing 12 02093 g009
Figure 10. (a,b) Underwater pictures of branching and tabular Acropora spp. colonies taken before bleaching (February 2016) on the reef flat of Magoodhoo. (c,d) Dead branching and tabular corals still in the living position in the same areas a few months after the bleaching event (February 2017).
Remotesensing 12 02093 g010
Figure 11. Close-range view of the three zones indicated with yellow arrows (A–C) in Figure 6.
Remotesensing 12 02093 g011
Table 1. UAV survey periods and flight acquisition parameters and SfM processing specifications for selected areas.
20172018
AREA 1AREA 2 AREA 3AREA 4AREA 1AREA 2 AREA 3AREA 4
UAV Images AcquisitionFlying Date11-Feb12-Feb05-Feb18-Feb04-Nov14-Oct05-Nov
Flying Altitude35 m35 m
Frontal Overlap85%85%
Lateral Overlap75%75%
Speed2.2 m/s2.2 m/s
Shutter Interval2.0 s2.0 s
Image Resolution1.5 cm/px1.5 cm/px
Covered Area4.98 Ha4.46 Ha1.20 Ha5.37 Ha5.52 Ha4.38 Ha1.49 Ha5.39 Ha
Images Numbers 495431123662550425186664
SfM ProcessingAlignment and Dense Cloud processing accuracy HighHigh
Dense Cloud Points87,138,68056,885,92712,412,45596,498,90789,836,99854,737,64415,038,04096,149,457
DTM Resolution cm/pix2.94 3.16 2.97 2.86 3.08 3.17 3.1 2.9
Ortomosaic Resolution cm/pix1.49 1.58 1.431.361.541.581.55 1.45
Table 2. Confusion matrix and accuracy index for the classified maps.
Accuracy Table
Control Reference
Benthic maps Hard CoralCoral RubbleSandTotalUser Accuracy (%)Producer Accuracy (%)
Hard Coral34939214098586
Coral Rubble 52169352566678
Sand 2758678651
Total403215114732
Overall AccuracyKappa Index
79% 0.56
Table 3. Variation in linear rugosity and average slope between years along the transects T1, T2 and T3 in Area 4 (Figure 6).
Linear Distance (m)True Distance (m)Linear RugosityAverage Slope
T.1 201747,39549,422104223,878
T.1 201847,39548,189101613,941
T.2 201736,68238,014103621,763
T.2 201836,68237,219101412,939
T.3 201737,08338,406103521,407
T.3 201837,08337,684101513,756
Table 4. Variation in linear rugosity and average slope between years along the transects T1 and T2 in Area 2 (Figure 8).
Linear Distance (m)True Distance (m)Linear RugosityAverage Slope
T.1 201747,70548,05710079647
T.1 201847,70547,80910024908
T.2 201747,70548,00410068815
T.2 201847,70547,80110025078