Article

Coral Bleaching Detection in the Hawaiian Islands Using Spatio-Temporal Standardized Bottom Reflectance and Planet Dove Satellites

Center for Global Discovery and Conservation Science (GDCS), Arizona State University, Tempe, AZ 85281, USA
*
Author to whom correspondence should be addressed.
Remote Sens. 2020, 12(19), 3219; https://doi.org/10.3390/rs12193219
Submission received: 25 August 2020 / Revised: 22 September 2020 / Accepted: 1 October 2020 / Published: 2 October 2020
(This article belongs to the Special Issue Advances in Remote Sensing of Coral Reefs)

Abstract

:
We present a new method for the detection of coral bleaching using satellite time-series data. While the detection of coral bleaching from satellite imagery is difficult due to the low signal-to-noise ratio of benthic reflectance, we overcame this difficulty using three approaches: 1) specialized pre-processing developed for Planet Dove satellites, 2) a time-series approach for determining baseline reflectance statistics, and 3) a regional filter based on a preexisting map of live coral. The time-series was divided into a baseline period (April-July 2019), when no coral bleaching was known to have taken place, and a bleaching period (August 2019-present), when the bleaching was known to have occurred based on field data. The identification of the bleaching period allowed the computation of a Standardized Bottom Reflectance (SBR) for each region. SBR transforms the weekly bottom reflectance into a value relative to the baseline reflectance distribution statistics, increasing the sensitivity to bleaching detection. We tested three scales of the temporal smoothing of the SBR (weekly, cumulative average, and three-week moving average). Our field verification of coral bleaching throughout the main Hawaiian Islands showed that the cumulative average and three-week moving average smoothing detected the highest proportion of coral bleaching locations, correctly identifying 11 and 10 out of 18 locations, respectively. However, the three-week moving average provided a better sensitivity in coral bleaching detection, with a performance increase of at least one standard deviation, which helps define the confidence level of a detected bleaching event.

Graphical Abstract

1. Introduction

Coral reefs are some of the most diverse and valuable ecosystems on the planet. They provide key ecosystem services such as fisheries, tourism, and cultural practices [1,2]. However, coral reefs are experiencing rapid changes from increased bleaching events due to the changing climate. Bleaching at small, local scales (10–1000 m2) has been reported for almost a century [3]. Nevertheless, in recent years coral bleaching, along with marine ecosystem change, is becoming a global-scale problem [4,5,6,7]. The Intergovernmental Panel on Climate Change (IPCC) estimates that 90–99% of global coral reefs will be affected by ocean warming and acidification by 2050 [8].
The dominant cause of coral bleaching is marine heatwaves [9]. Corals also bleach in response to additional stressors, such as pollution and unfavorable light conditions [9,10,11]. Monitoring coral bleaching is a difficult task, where approaches using self-contained underwater breathing apparatus (SCUBA) or aircraft surveys are costly to acquire at larger spatial scales [12]. To address the detection of coral bleaching on a global scale, satellite observations at a high spatial and temporal resolution are urgently needed to complement field surveys. High-resolution satellite imagery have been used in the coastal [13,14,15] and marine ecosystems [16,17,18], and, in recent years, remote sensing has also shown great potential for coral reef ecosystem studies [19,20]. The Allen Coral Atlas [21] project initiated an approach to map and monitor coral reefs with ~130 high spatial resolution (4.77 m) Planet Dove satellites. The project is producing a globally consistent set of maps and a monitoring system for most of the world’s shallow (<10 meters depth) coral reefs, catalyzing more effective conservation and restoration of reefs worldwide. Part of the project has focused on developing a monitoring system for coral reefs using weekly Planet Dove satellite imagery.
Coral bleaching can be detected by comparing multiple satellite images over time, indicated by coral pixels that become brighter over time. The goal of using Planet Dove satellite data is thus to detect these brighter pixels—defined as anomalies—across a highly varying set of conditions and multiple Planet Dove satellite sensors. The main challenge for detecting coral bleaching with satellite imagery is the difficulty of separating faint brightness changes from multiple sources of noise—namely, underlying instrument signal-to-noise ratios, performance variation among Planet Dove satellite sensors, and fluctuations in atmospheric and illumination conditions. All the additional noise can add up to shifts in reflectance values that are larger than the expected changes due to bleaching, leading to the under- and over-detection of bleaching. Algorithms intended to find anomalous pixels need to overcome these challenges.
The algorithms commonly used for change detection include unsupervised learning [22], machine learning, and object-based change detection [23,24]. These techniques are mostly based on bi-temporal analysis, taking one image-pair at a time. These approaches do not take advantage of the rich temporal information contained in the weekly Planet Dove satellites. Time series analysis has been developed in recent years for shallow-water remote sensing [25,26,27] and ecosystem monitoring [26,28,29]. However, bleaching signals may not be consistently detectable, rendering the methods less reliable for performing trend analysis. In addition, the spectral information is limited in the marine environment, as only certain spectral bands can penetrate the ocean to a 10 m depth [30]. These fully automatic and semi-automatic methods typically require data with much higher signal-to-noise ratios, lower inter-sensor variations, and better spectral information. Unfortunately, data of this quality are not available at the needed spatial and temporal resolution.
The main objective of this study was to detect bleaching locations identified in the field using Planet Dove satellites. To achieve this objective, we developed a methodology to consistently detect the bleaching events at multiple time periods. Our main research question is, can we leverage high temporal resolution data, such as Planet Dove satellite imagery, to help capture the frequency of appearance of bleaching events? If yes, through what approach can we achieve the best overall detectability and sensitivity for bleaching detection? To answer these questions, we use a statistical approach leveraging the high temporal resolution data available with Planet Dove satellite imagery. We introduce a coral bleaching probability index—the Standardized Bottom Reflectance (SBR)—to measure the coral bleaching probability based on multi-temporal statistics obtained from the baseline period Planet Dove observations to help in defining subsequent reflectance anomalies. The method was originally developed by Xu et al. [31] to detect anomalies in the remote sensing data for agricultural drought, and this study is applying knowledge gained in agriculture to reefs for coral bleaching detection. To improve the sensitivity to bleaching detection, we tested three different temporal smoothing approaches to best detect the coral bleaching signal from the Planet Dove satellites.

2. Materials and Methods

Our general methodology for bleaching detection can be broken into three phases: 1) data collection and pre-processing, 2) the creation of Standardized Bottom Reflectance (SBR) using the computation of statistical distribution in the bottom reflectance observed in the baseline period, and 3) the testing of three temporal smoothing approaches for SBR after the beginning of the coral bleaching period against the distribution computed from phase two to define brightness anomalies indicating probable bleaching. We tested this methodology against field observations of coral bleaching (Figure 1).
To establish a baseline signal against which to measure the bleaching events, we separated the time series data into a baseline period and a bleaching period. The date of separation between these periods was determined through National Oceanic and Atmospheric Administration (NOAA) Coral Reef Watch Daily Global 5 km Satellite Sea Surface Temperature [33] and confirmed in the field. From the baseline period, we compute the Baseline Reflectance Distribution (BRD) to define the expected variation in the bottom reflectance and transform the subsequent bottom reflectance values into Standardized Bottom Reflectance (SBR) using this BRD, enabling the more accurate detection of coral bleaching. To reduce the detection of bleaching in non-coral regions, we also incorporated a preexisting mask delineating the location and extent of live corals prior to a bleaching event [32]. Finally, we tested three different temporal smoothing approaches to best isolate the coral bleaching signal from the Planet Dove satellites (Figure 2).

2.1. Data Collection and Pre-Processing

The satellite images, also called quads, were weekly mosaic images collected from Planet Dove satellites. Each scene is defined as a single strip image. Each quad typically consists of four to five scenes captured within the same week. Each Planet Dove satellite has a 4.77 m spatial resolution, four spectral bands (blue, green, red, and near-infrared), and a 16-bit radiometric resolution [34]. Each quad mosaic has a standard size of 4096x4096 pixels (19.54 by 19.54 km). The weekly mosaics were downloaded for each Planet Dove quad with a coastal intersection of one of the eight main Hawaiian islands (between 154°47’12’’ W and 160°16’24’’ W degrees longitude and 18°52’14’’ N and 22°16’09’’ N degrees latitude) for the period 29 April 2019, through to 24 February 2020 (Figure 3). For each downloaded mosaic quad dataset, we followed a standard processing protocol [30,35]. This procedure included cloud masking, waterbody retrieval, sunglint removal, depth calculation, bottom reflectance estimation, and the filtering of orbital direction. In addition, to improve the bleaching detectability and reduce the computation time, relevant pixels were selected based on a previously generated map of live coral [32].
For each scene collected by the Planet Dove satellites, a series of standard steps are taken to transform the Planet Dove satellite imagery to surface reflectance, including top-of-atmosphere radiance correction, flat field correction, and orthorectification [36]. Finally, we used the 6S model to create the apparent surface reflectance for each scene [37,38]. From these processed surface reflectance scenes, the weekly mosaics were created as a combination of the best scenes during the week. For this, Planet used the “best scene on top” rule. This approach stamps the entire scene into the mosaic instead of individual pixels. Planet further used the corresponding Landsat surface reflectance data to normalize the surface reflectance products to bring consistency to the reflectance values in the mosaicked image.
To remove the residual clouds and cloud shadows from the Planet Dove mosaic quads, we created an automated cloud-masking algorithm to mask out these areas. To identify residual clouds, we created cloud-free Landsat-8 surface reflectance mosaics for the blue, green, and red bands using the Landsat-8 annual imagery from 2014 to 2019. For each Planet Dove satellite image, we calculated the Euclidean distance in the three spectral bands between the Landsat-8 and the Planet Dove satellite imagery. Any pixels with a Euclidean distance greater than 8% reflectance from the cloud-free Landsat-8 reference image were masked out. Because the reflectance of the water surface is so low, we included an additional criterion to identify areas shadowed by clouds in the Planet Dove satellite data. This criterion masked any pixel for which the Planet Dove reflectance had a lower reflectance value by more than 50% of the average standard deviation of the Landsat-8 blue, green, and red surface reflectance bands (i.e., the three bands taken together). The combination of these criteria helped us to remove pixels in the imagery that were contaminated with clouds and cloud shadow.
The surface reflectance data includes the path radiance through seawater and therefore must be corrected for coral bleaching detection. The corrections we applied to the surface reflectance include water column corrections, sunglint removal, and depth calculation to generate the bottom reflectance estimation. The detailed algorithm can be found in Li et al. [39]. The bottom reflectance data are limited to the green band due to the physical limit of sunlight penetration. Longer wavelengths such as red are absorbed at a shallower depth, and shorter wavelengths such as blue are scattered by water. Therefore, only the green band is good for coral bleaching detection in shallow water (5–10 m).
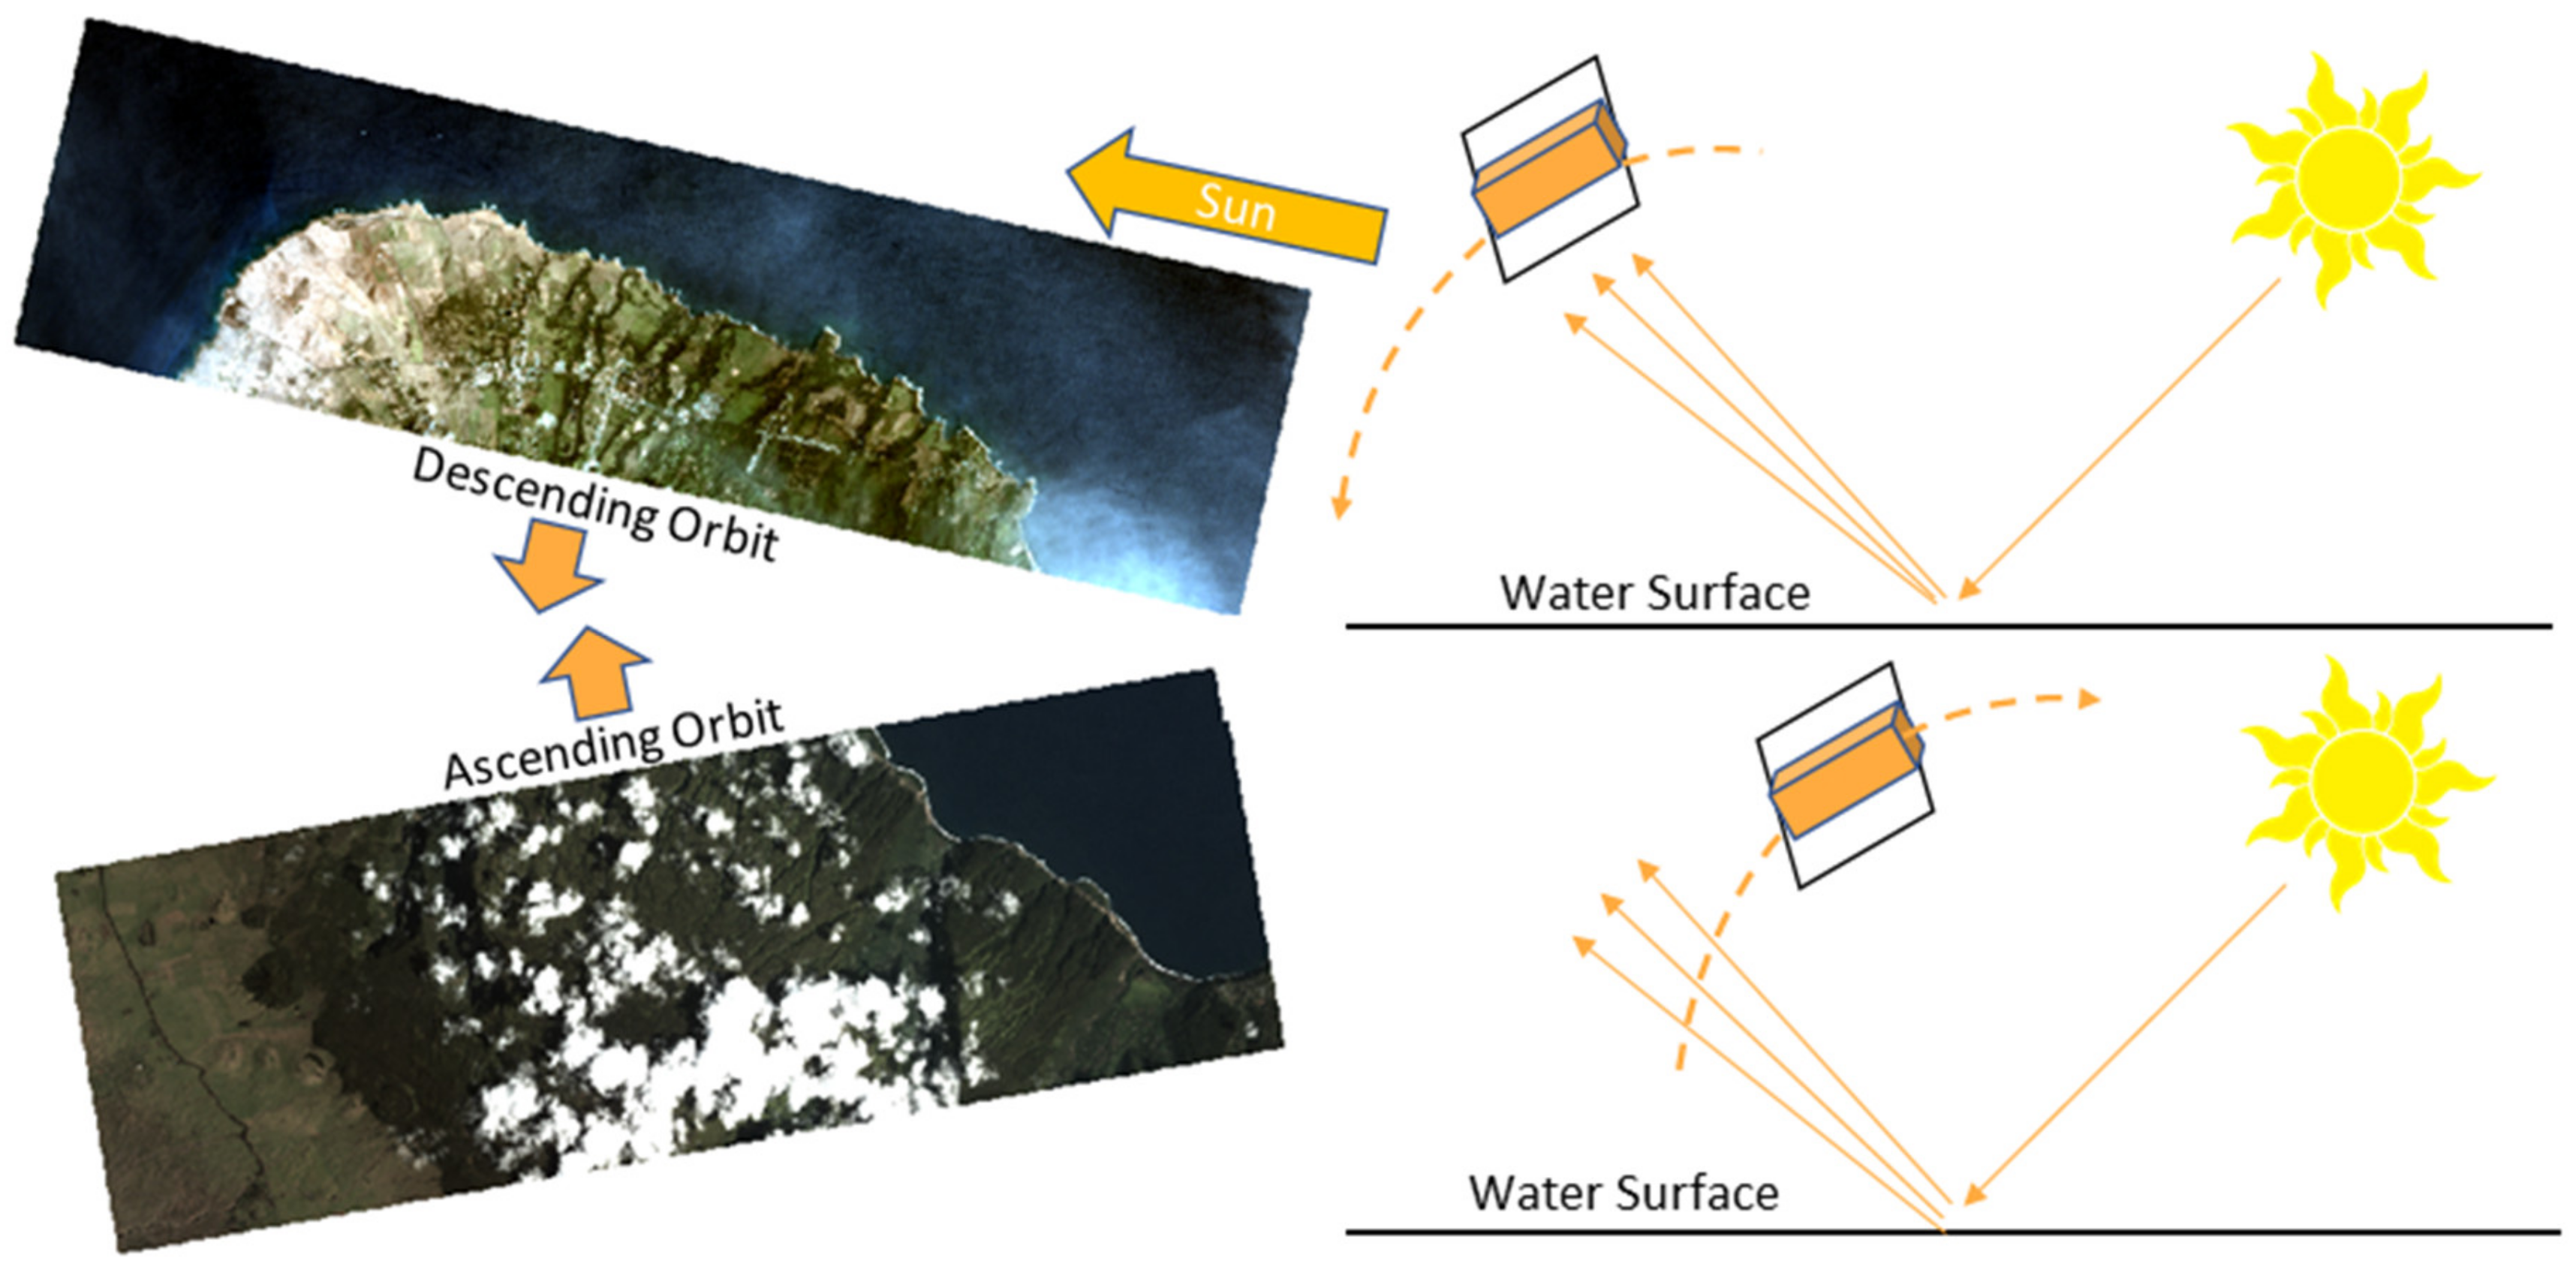
Multi-temporal images are affected by the differences introduced by the acquisition conditions (e.g., atmospheric conditions and acquisition system) [22]. The multi-sensor weekly mosaicked quads provided by Planet Dove satellites will have spectral and geometric shifts due to the differences between the sensors (e.g., the view angle) and the acquisition conditions (e.g., the cloud cover, shadows, sunglint, direct reflectance). We found that a large difference in image quality occurred between satellites in ascending versus descending orbit, particularly with respect to the amount of sunglint affecting the pixel brightness. As a result, the weekly mosaicked quads were manually selected for the orbit (ascending or descending) that produced the least amount of glint. Separating the usage of orbits helped us to reduce the variation caused by sunglint (Figure 4).
Finally, the non-coral regions were masked out based on a live coral map previously produced by data from the Global Airborne Observatory (GAO) [32]. GAO live coral maps were used to clip the Planet Dove weekly data to only live coral regions for further coral reef mapping and data analysis. The GAO includes a high-fidelity visible-to-shortwave infrared (VSWIR) imaging spectrometer (380–2510 nm), a dual-laser waveform light detection and ranging (LiDAR) scanner, and a high spatial resolution visible-to-near infrared (VNIR) imaging spectrometer (365–1052 nm) [32,35]. The GAO flight mission for the creation of the live coral map was carried out across the Hawaiian Islands from 2 to 21 January 2019 [32], well before the warming period began.

2.2. Baseline Reflectance Distribution

A basic feature of our method is the separation of the satellite data time series into a “baseline” period and a “bleaching” period. This separation allows for the better identification of anomalous pixels during the bleaching period. We chose the baseline period of April–July 2019, prior to sea surface temperature warming. With each weekly quad of the bleaching period, the pixels with the highest brightness when compared to the baseline bottom reflectance were those that we deemed most likely to be experiencing bleaching.
The BRD is defined for each pixel within a quad as a normal distribution with the mean and standard deviation determined with the sample mean, μ ̂ 0 , and the sample standard deviation, σ ^ 0, respectively, of the bottom reflectance values observed for the given pixel during the baseline period. From this BRD, we calculated Standardized Bottom Reflectance (SBR) as a relative measure of the coral bleaching period bottom reflectance value, 𝑟, using the standardization equation:
S B R = r μ ̂ 0 σ ^ 0 .
The SBR can use any temporal designation a user defines as the r value (i.e. hourly/daily/weekly/monthly/annually). The SBR quantifies the individual pixel brightness relative to the baseline average in terms of standard deviations from the mean, yielding values typically between -5 and 5. The higher the SBR, the lower probability that the bottom reflectance value is expected to happen under a normal condition and, therefore, the higher the probability a pixel with a high SBR has of being a real coral bleaching.

2.3. Test of Three Temporal Windows for SBR

The weekly Planet Dove satellite imagery has an extremely low bottom reflectance for some field observations weeks (Table A1), indicating a low signal-to-noise ratio during these weeks. Due to this reason, bleaching signals were not consistently detectable when applying SBR directly to the weekly Planet Dove data. Removing this dark imagery will render limited weeks. To best isolate the coral bleaching signal and detect the spatial and temporal dynamics of the coral bleaching signals from the Planet Dove satellites, we tested three approaches to finding the best temporal window over the bleaching period:
(1)
A weekly window, where the SBR is computed individually for each week i during the bleaching period.
r = ri.
(2)
A cumulative average, where the SBR is computed from the average bottom reflectance of each week j from the start of the bleaching period until the current week i. For example, if we examine the week of November 25, we get an average of August through November 25.
r = j = 1 i r j i .
(3)
A three-week moving average of the observation week i, the week prior, and the week after.
r = j = i 1 i + 1 r j 3 .

2.4. Verification

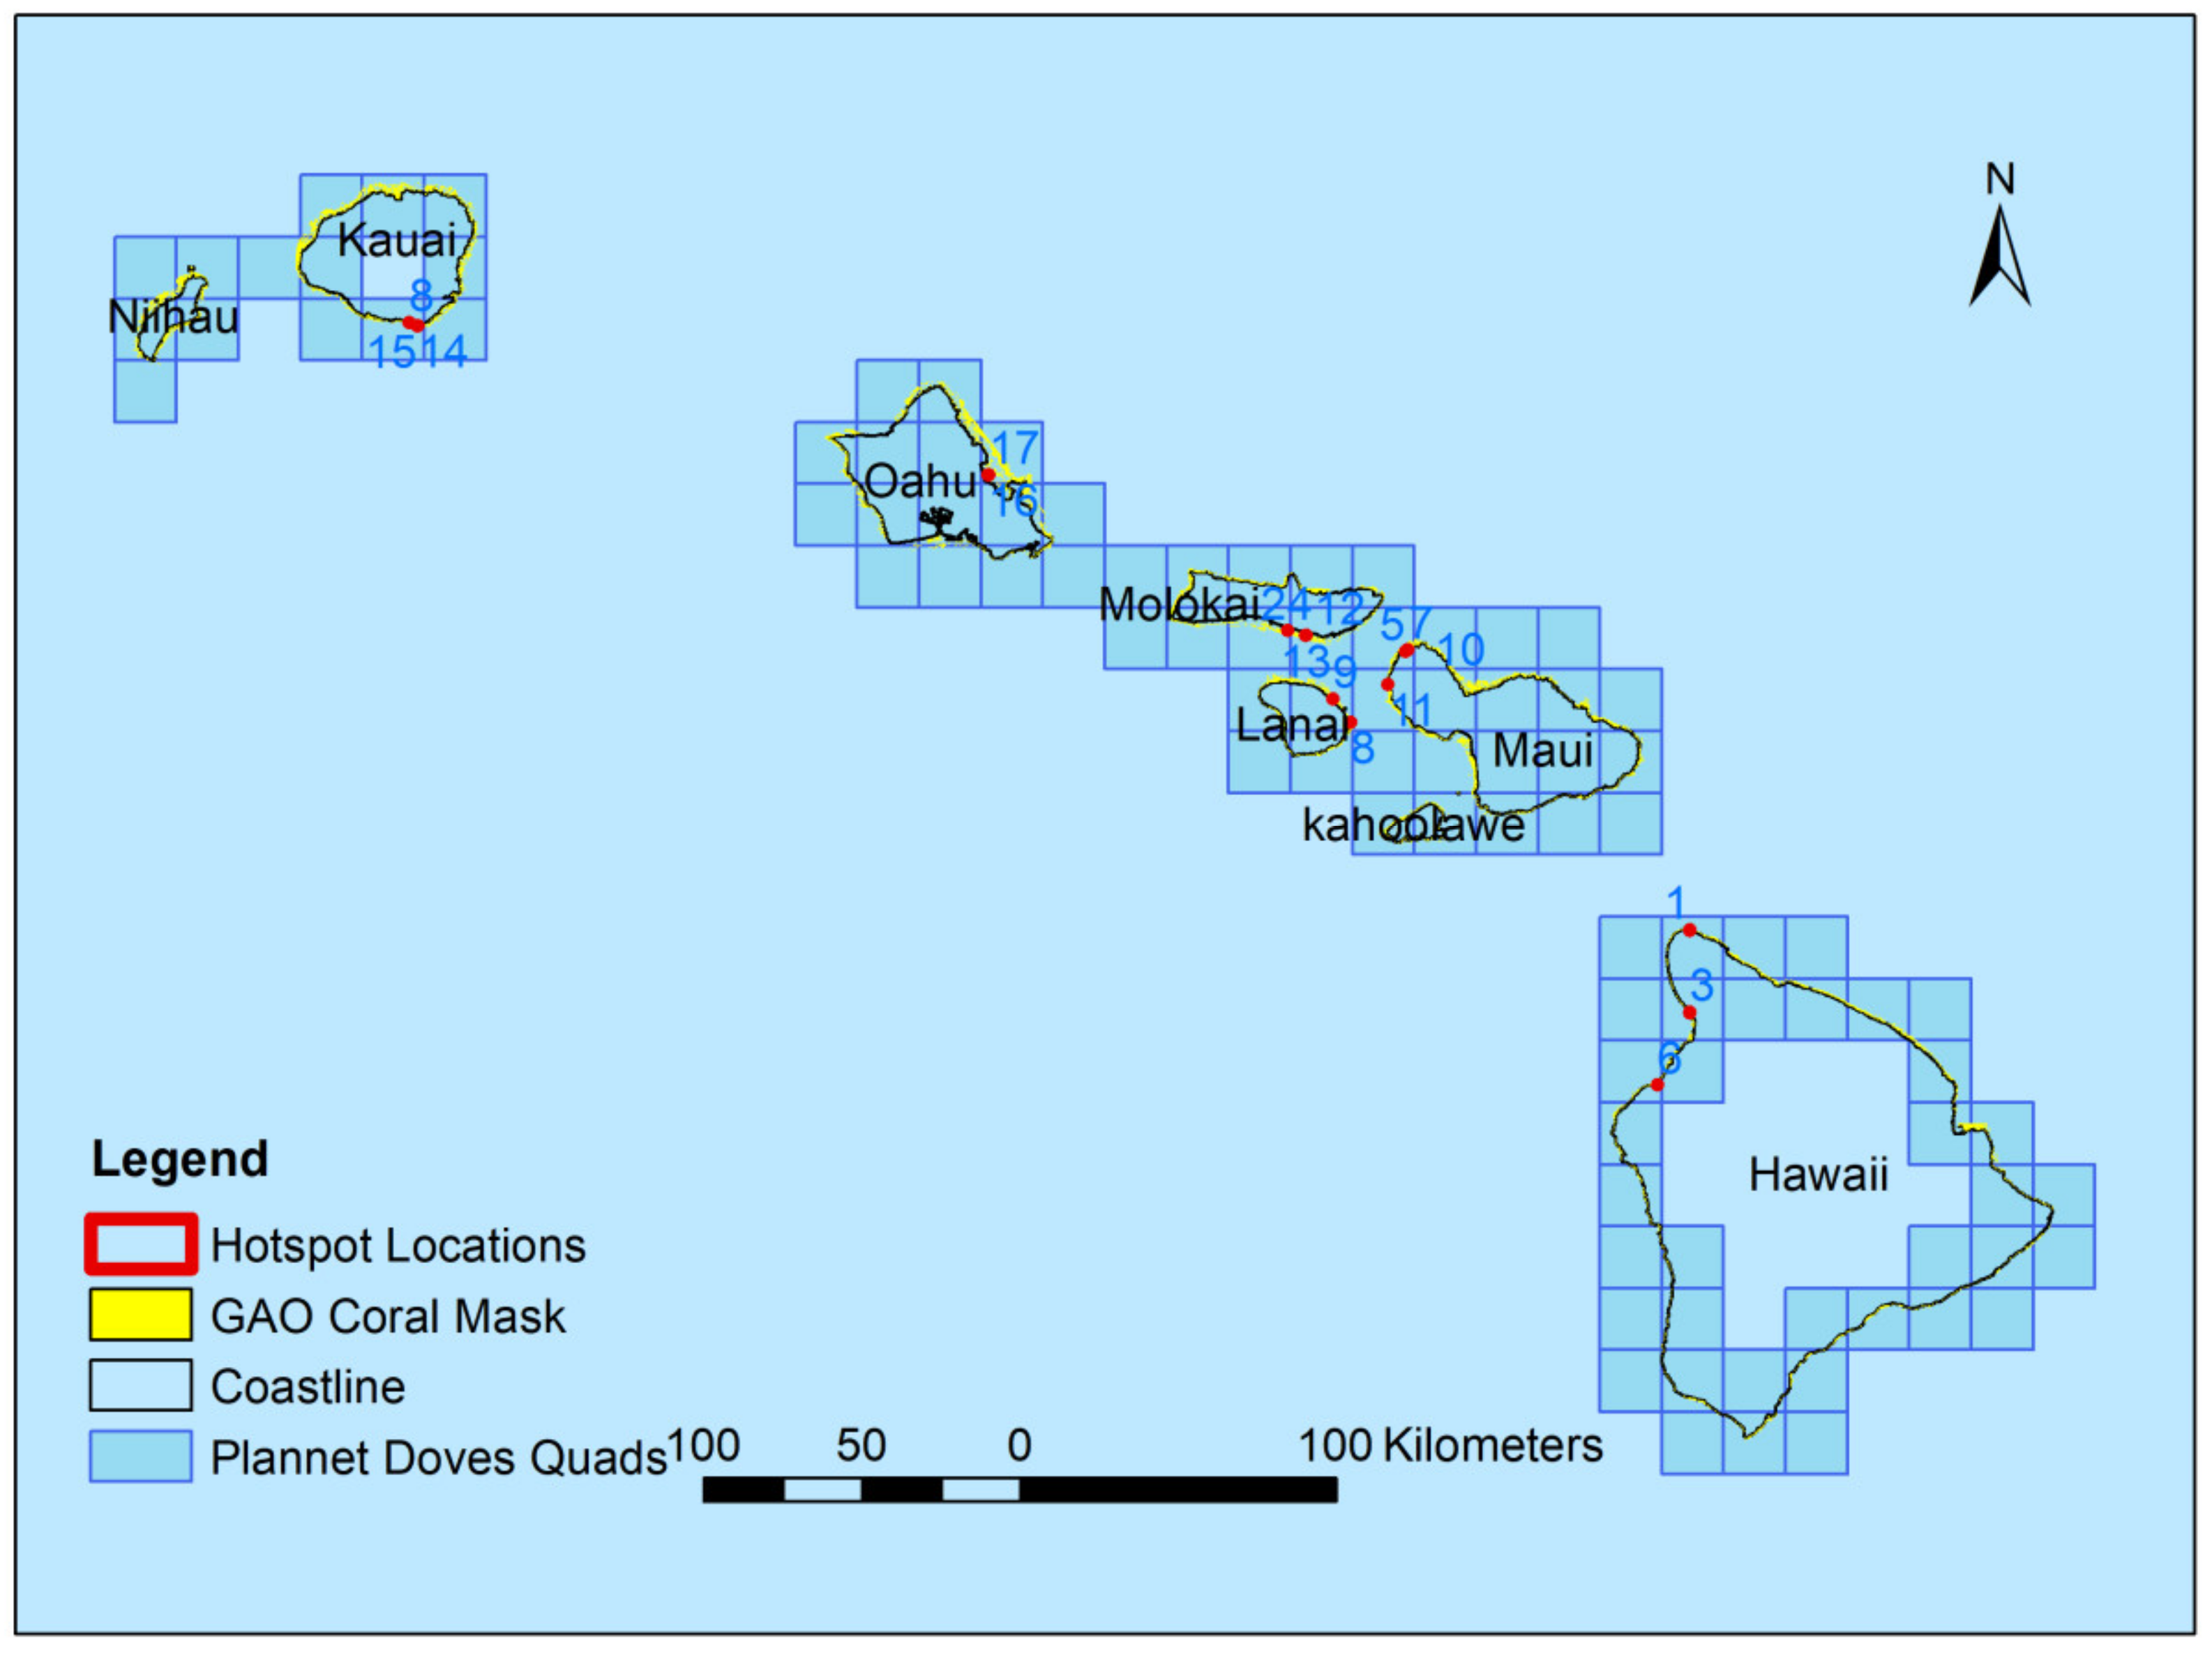
Bleaching detections were verified using field data from 18 locations (Table 1). We collected the georeferenced field observations of coral cover and bleached coral between October and November 2019. These values were used to calculate the average bleached percent of coral present along 25 m transects. Because high-precision GPS location information was not available for the locations, values were used to represent the bleaching severity of the general location (~20 m diameter circle), as shown in Figure 3.
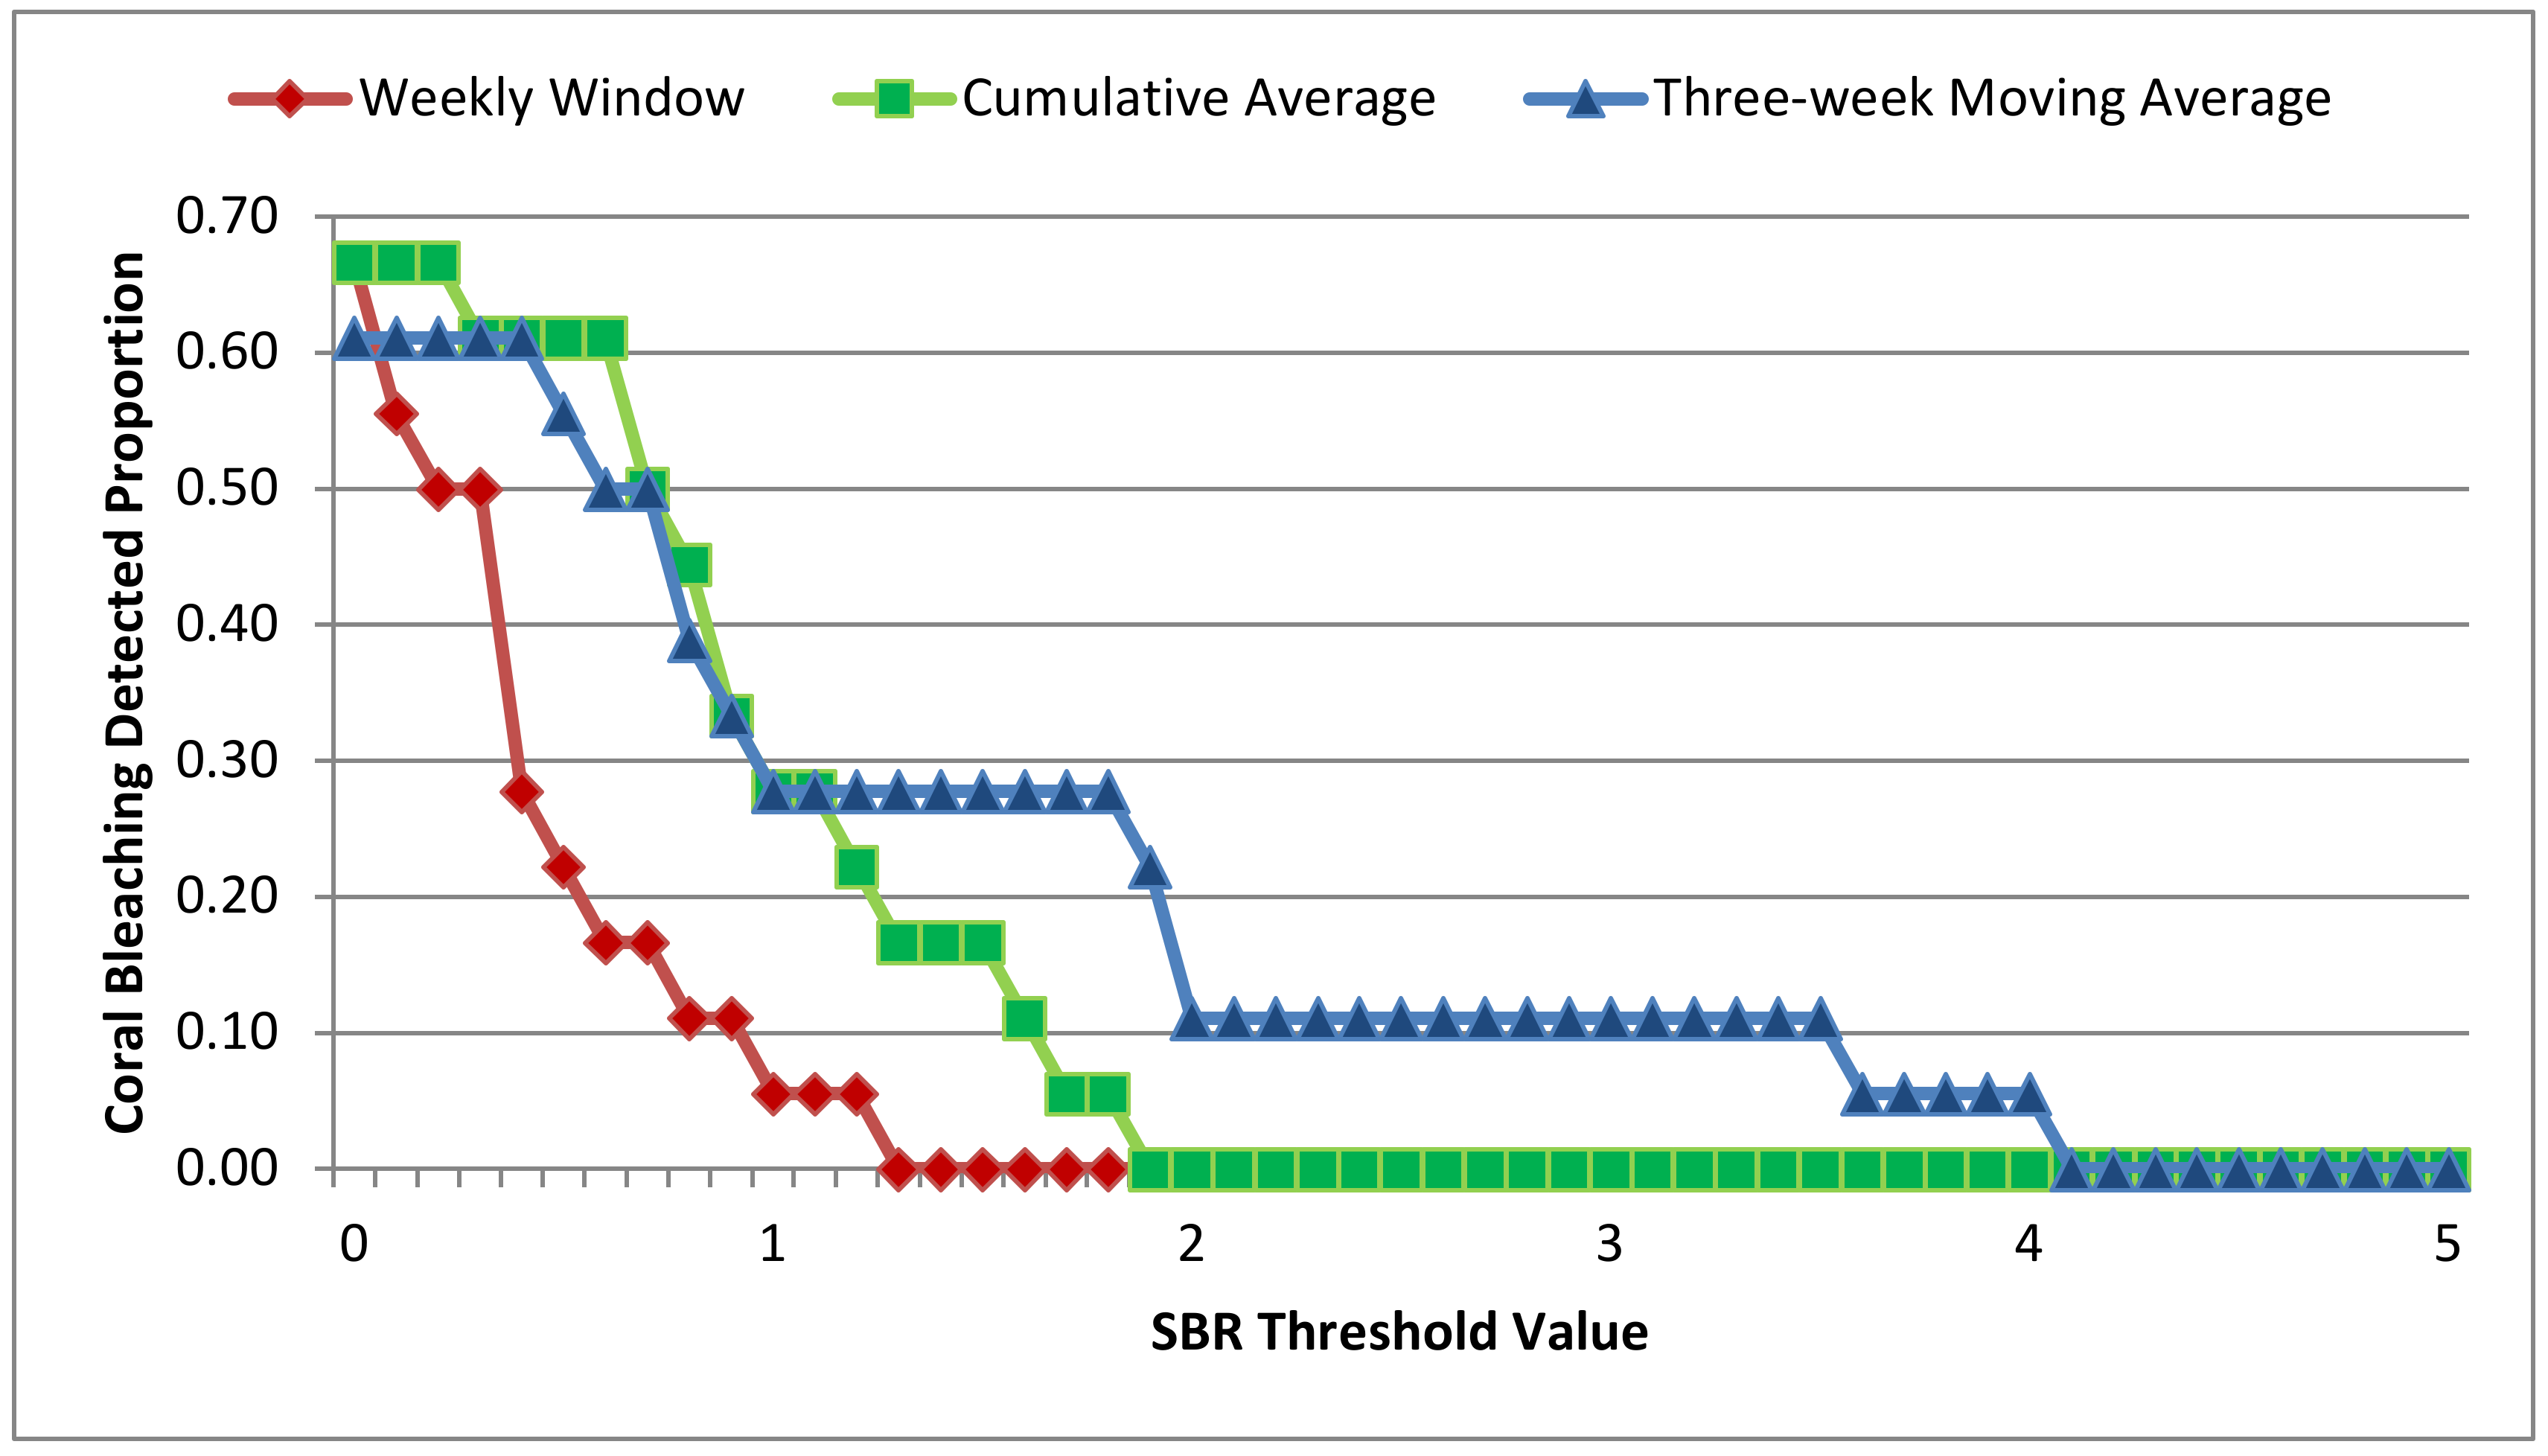
To minimize the temporal offset of bleaching persistence, SBR was computed for the week that the field verification was performed at each location. To verify the detectability and sensitivity for each location, we varied the SBR value at which a pixel would be classified as bleaching, defined as the SBR threshold, from 0 to 5. We disregard the negative SBR values due to their low probability associated with the real bleaching event. At each potential threshold, we checked each of the three SBR approaches inside each coral bleaching location identified in the field to see if any approach was able to detect the bleaching locations (yielding a high SBR value). By recording the number of detected coral bleaching locations at each SBR threshold value, we assessed the difference in sensitivity across the three approaches for the detection of bleaching.

3. Results

3.1. Overall Detectability of Coral Bleaching Locations

The SBR results indicate a deviation from the historical baseline period average at the coral bleaching locations for the weeks when field surveys were completed. Statistically, the SBR threshold of 1 is the initial criterion we used for coral bleaching detection, because when the SBRs are outside one standard deviation of the historical average, the signal is anomalous and therefore detectable. Through experimental comparison, we found that with an SBR threshold between 0.5 and 1, we detected the majority of the bleaching events that were confirmed in the field. Therefore, we reduced the threshold and set an SBR of 0.5 as our lower threshold for coral bleaching detection. As pixels with a larger SBR are associated with a high probability of real coral bleaching, this transformation also provided us with statistical evidence to define the coral bleaching significance.
Figure 5 showed that the overall number of coral bleaching locations detected from the SBR decreased with increases in the threshold value. When the SBR threshold value was below 1.1, the cumulative SBR detected the largest proportion of coral bleaching, while when it was above 1.1 the three-week SBR detected the largest proportion.
The three approaches adopted for SBR development yielded different performances. Out of the 18 bleaching locations, 4 of the weekly SBRs aligned with bleaching recorded in the field using the threshold value of 0.5. Out of the 18 bleaching locations, 11 of the cumulative SBRs aligned with bleaching recorded in the field, and 10 of the three-week average SBRs aligned with bleaching recorded in the field. Table 2 lists the detectable locations from the three approaches. The overall detectability values for the three approaches are 23.5%, 66.1%, and 55.6%, respectively.

3.2. SBR Sensitivity for Detecting the Bleaching Events

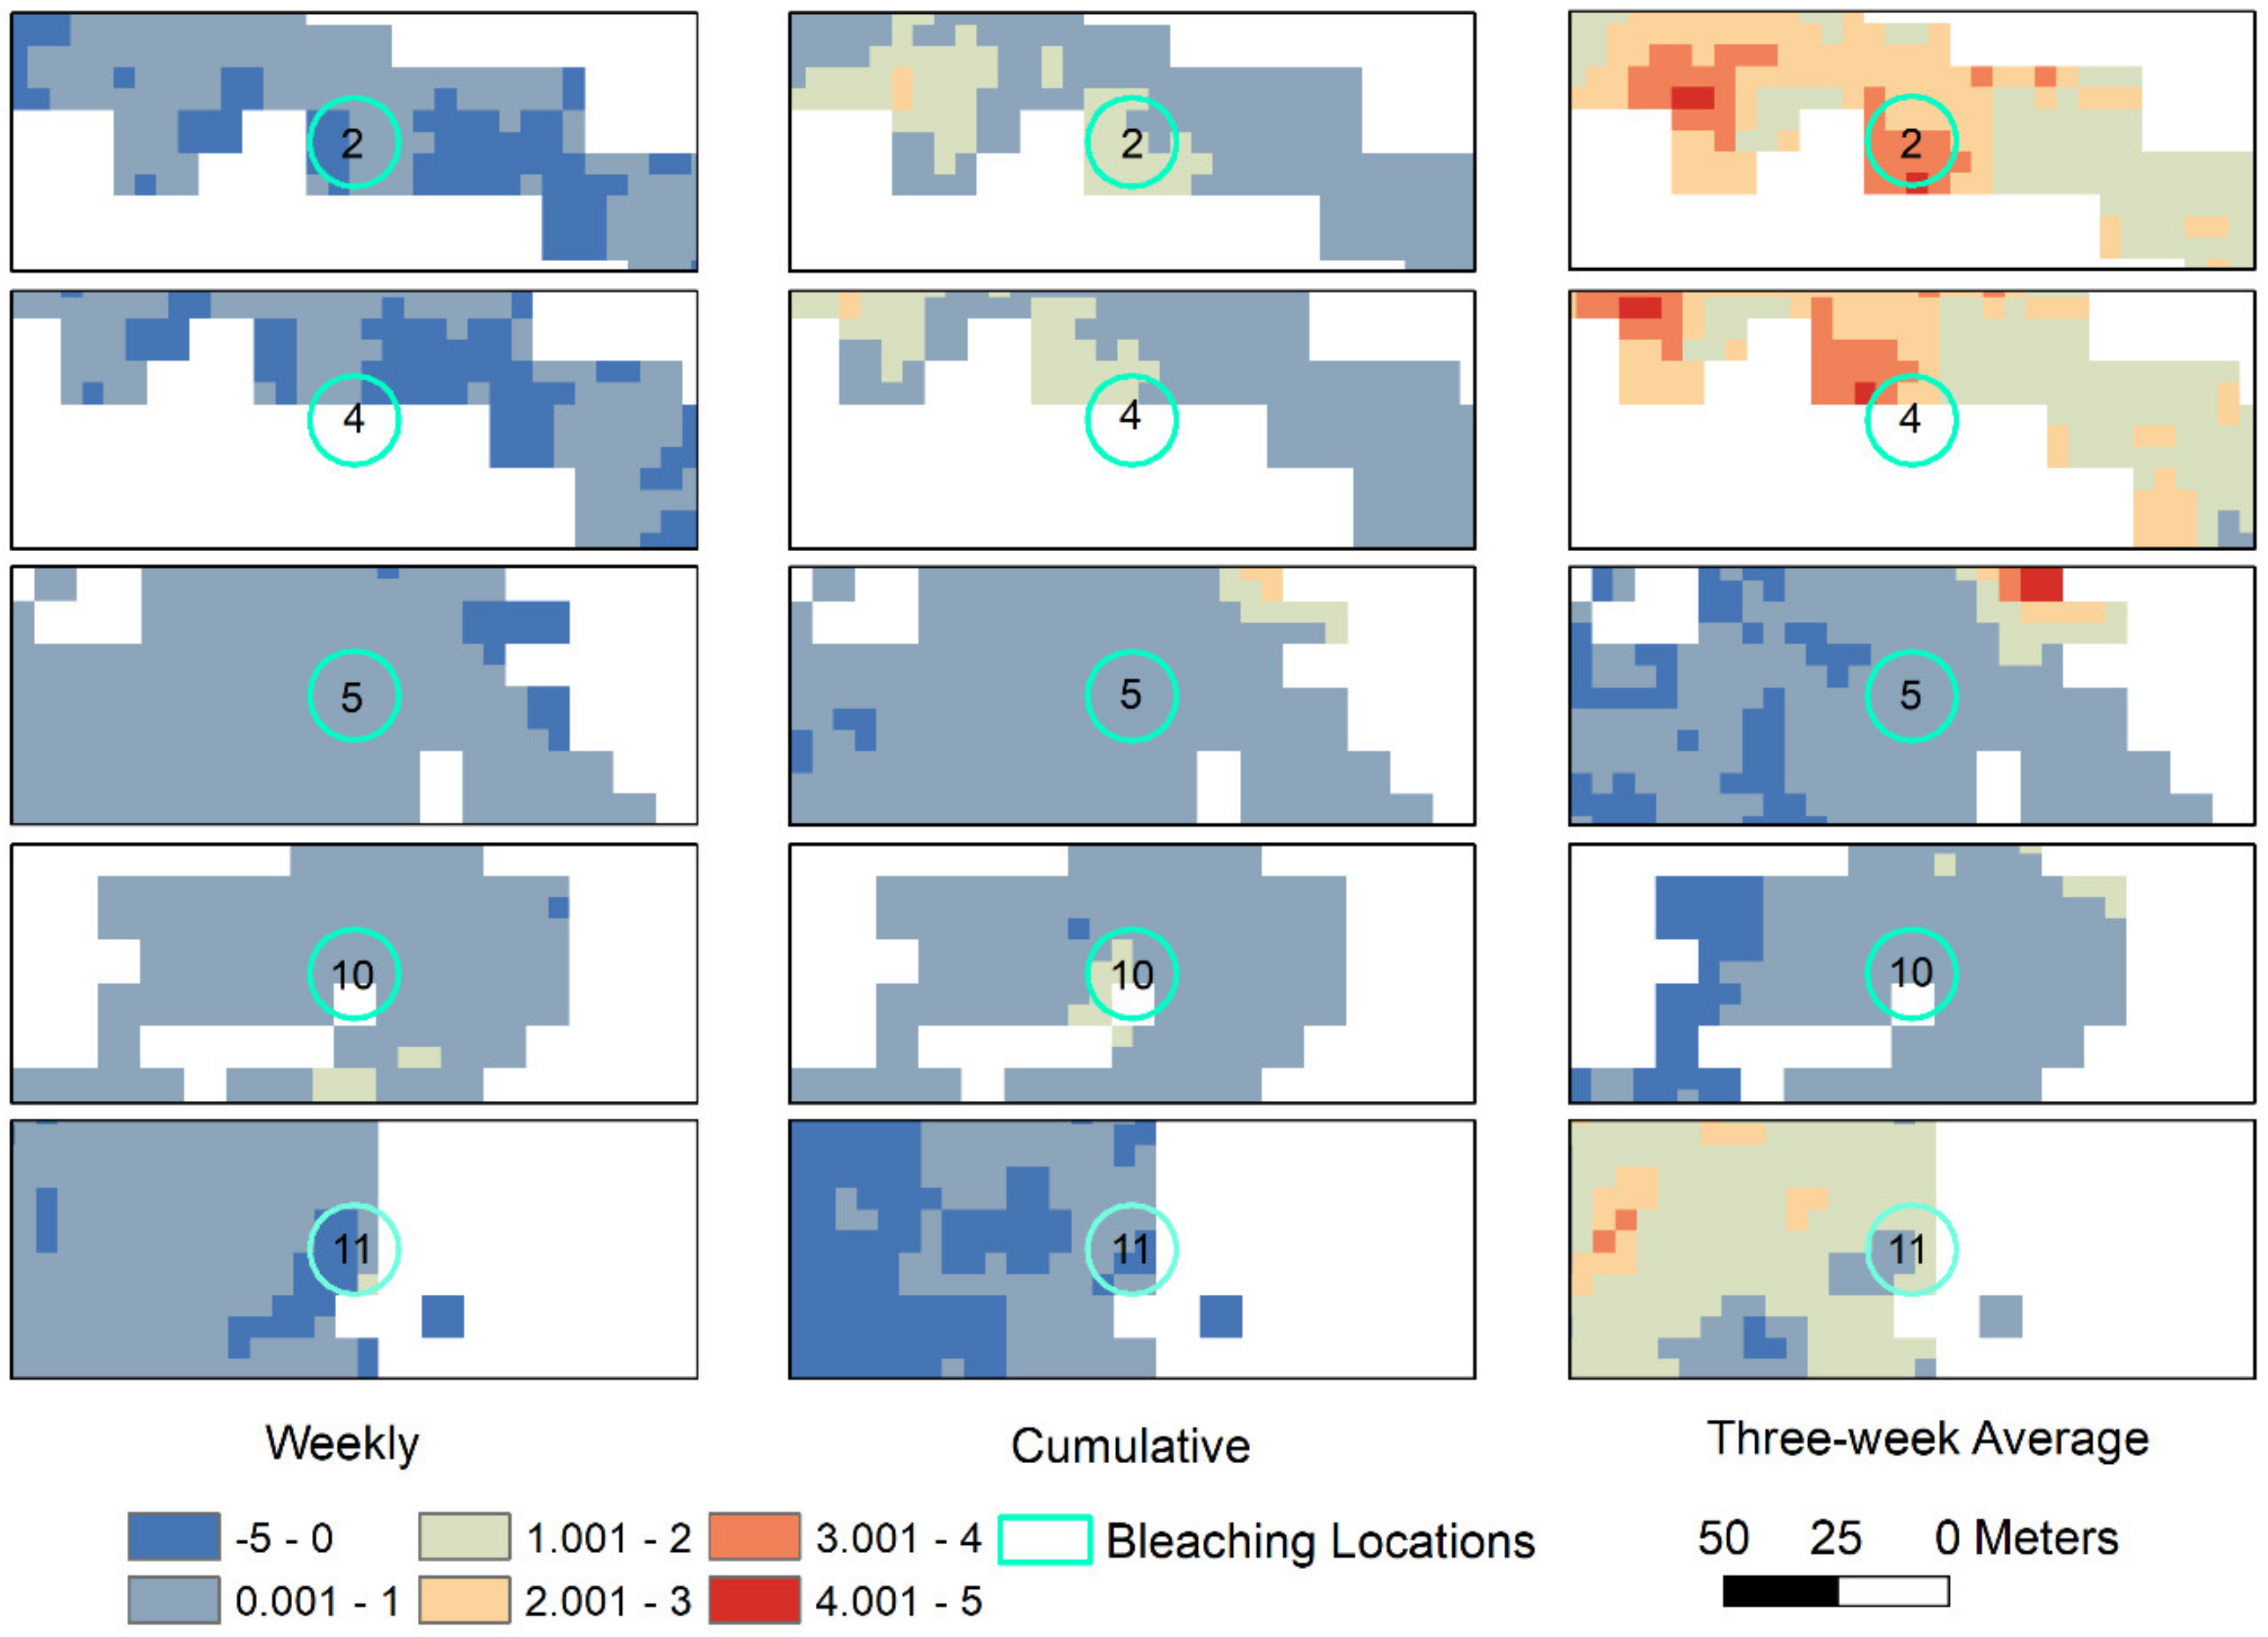
We selected five bleaching locations for closer inspection, each of which met two criteria: 1) the SBRs for these locations were above 0.5 by at least two of the three SBR approaches, and 2) they contained no negative SBR maximum values amongst the three approaches (Figure 6). The weekly SBRs (left column of Figure 6) shown here ranged from 0 to 1.282, except for the bleaching locations 2, 4, and 11, which had weekly SBRs of below 0, darker than the average bottom reflectance during the baseline period. This was determined to be due to extra-dark mosaics from the weeks of field surveys—i.e., the week of 11 to 18 November 2019, for both locations (Table A1). Locations 5 and 10 showed generally positive SBR values inside the circles, and locations 5 and 10 showed that some pixels within the circles range between 0.5 and 1, above the threshold value of 0.5. Given that these five locations were known bleaching locations based on the field data, the performance of SBR based on the weekly data was unsatisfactory.
The cumulative SBR (the middle column) generally ranged from 0 to 2, with the only exception that some pixels had negative SBR values inside the circle of location 11. Locations 2, 4, and 10 showed that the SBR values generally range from 0.001 to 1, or 1.001 to 2. Compared with the weekly SBR, the cumulative SBR provided a higher sensitivity to the bleaching within the circular locations.
The three-week average SBR (the right column) generally ranged from 0 to 5. Locations 11 had values ranging from 0 to 2. A few of the locations—e.g., 2 and 4—had even higher values, ranging between 2.001 and 5. Compared with the weekly SBR, the three-week average SBR provided the highest sensitivity to bleaching events.
Field observations showed that the extent of coral bleaching at the locations varied highly across spatial dimensions, and the number of pixels with a high SBR value at each bleaching location varied along a similar scale. A visual assessment of the SBR maps for each of the coral bleaching locations shows that detection was rarely limited to a single pixel for each bleaching location. Instead, clusters of multiple pixels around each location had SBR values close to the maximum pixel value that was used for detection. The number of high-value pixels also varied by the SBR aggregation method, with clusters typically smaller in the weekly maps and larger in the cumulative and three-week SBR maps.

4. Discussion

Our SBR-based methodology was able to detect coral bleaching locations from temporal changes in pixel brightness in the Planet Dove satellite imagery. The success rate of coral beaching detection was higher than that of other approaches we tried, such as statistics-based anomaly detection (IQR and median absolute deviation), specialized anomaly detection packages (anomalize, AnomalyDetection, and Changepoint), time-series analysis packages (Prophet and ARIMA), machine learning-based unsupervised learning approaches (one-class SVM and Isolation Forest), and open source software (TimeSat). Based on our work, those algorithms commonly used for change detection—e.g., machine learning—were not able to detect coral bleaching events. The median-based methods did not handle the time-series data well. The anomaly detection and time series packages supported time-series data; however, due to the noise in the data, the results yielded the largest type I and type II errors for local-scale coral bleaching event detection. The machine learning approach performed similarly to the time-series packages that we tested. When the imagery appeared to be brighter for certain weeks, the machine learning approach, as well as the anomaly detection and time series packages falsely detected “bleaching” signals for that week of imagery. Per our experimentation, these methods typically require “cleaner” data that can provide better spectral information and less noise to detect the changes [22,40], which are not available in our case.
We found that the data pre-processing was very important. Specifying the use of the ascending/descending satellite orbits for the time series that produced the least amount of glint significantly improved the signal-to-noise ratio. Despite the ability for Planet Dove satellites to provide high spatial resolution imagery at an unprecedented frequency, its signal-to-noise characteristics, radiometric performance, and cross-sensor consistency underperform many traditional space agencies-based operational missions. Time-varying atmospheric influences significantly impair the quality of the derived surface reflectance, while time-varying water influences (i.e., sunglint, water column, etc.) impair the utility of the bottom reflectance for reliably inferring actual changes in the ocean. Further work needs to be done to create a more consistent baseline.
Using coral bleaching locations identified in the field for verification, the three SBR approaches strongly differed in their performances for detecting bleaching. The cumulative average SBR detected the most number of bleaching events, followed by the three-week average SBR. The cumulative and the three-week moving average approaches both average data over several weeks. Thus, poor-quality weeks can be ignored and valid pixels averaged to maintain an enhanced signal-to-noise ratio, improving the performance of coral bleaching detection. Conversely, the weekly SBR detected the least number of bleaching events. The weekly mosaics had a higher chance of missing values due to being masked out by clouds. Although a standard protocol had been thoroughly adopted to generate the best data quality from the Planet Dove satellite imagery, the image quality varied with time, causing under-calibrated bottom reflectance data for certain weeks. Moreover, as the overall detectability improves with a decreased threshold, the false positive is assumed to also increase as well. However, we want to emphasize that the false positives are less of a concern, because sites can be checked in the field and filtered in other ways to reduce the problems associated with the false positive rate. For this research, we are interested in finding whether there is a signal to identify bleached areas. More field data needs to be collected in the future study to assess the false positives and false negatives detected with our methodology.
The three SBR approaches also varied in their sensitivity for detecting bleaching events. The three-week moving average approach provided better sensitivity for coral bleaching detection with a performance increase of at least one standard deviation. In contrast, the weekly and cumulative approaches used too little and too much averaging, respectively, to overcome data noise, and the sensitivity of the bleaching detection underperforms the three-week average approach. Because bleaching tends to be based on the amount of time that corals are subject to high-temperature anomalies, the latency between heating onset and bleaching detection can be one to several weeks.
The proportion of bleached corals from the field surveys had little observable relationship with the detectability of individual sites. In this research, percent information (i.e., the percent of bleached vs. unbleached) was provided for each bleaching location coordinate. We assumed that the high percentage of bleached coral may be associated with a high probability of coral bleaching (i.e., high SBR) detected from the Planet Dove satellite imagery. However, the results did not support this assumption. For example, location 11 represented a true bleaching event in the field, while the SBR scores at this location were among the highest, its average bleaching percent observed in the field was not among the highest (23 %, Table 1). Similarly, some bleaching locations with a high bleaching percent—e.g., locations 1 and 3—were not detected by the SBR methodology. While this is likely to be related to the low bottom reflectance values (Table A1), it should be noted that the percent of bleached coral measured in the field was independent of the live coral cover. Thus, a highly bleached sight might not result in a significant increase in brightness in the Planet Dove imagery if the initial coral cover was low. These locations can be used as a guide for improving the monitoring system and the coral bleaching detection algorithms.

5. Conclusions

(1)
For the goal of detecting the locations in the coral bleaching events, it is critical to set a threshold of how high a bottom reflectance is needed to represent a coral bleaching event. The SBR method we used is based on simple distributional statistics, and provides a feasible approach to obtain a deterministic value for the pixel brightness changes expected in coral bleaching events. The temporal moving window played an important role in reducing the noise and, thus, enhancing the signal-to-noise ratio by taking multiple images in the bleaching period. This essential transformation reduced susceptibility to the time-varying influences on the data and therefore improved the performance for coral bleaching detection.
(2)
With the Planet Dove satellite data, the cumulative SBR and three-week average SBR were able to detect the coral bleaching locations identified in the field. The two temporally averaged SBR approaches further reduced the susceptibility to frame-frame variation during the bleaching period. We found that the cumulative approach could detect the highest proportion of coral bleaching locations, while the three-week average SBR performed nearly as well for detecting coral bleaching locations. However, the cumulative approach over-averaged the data, and therefore the sensitivity of the bleaching detection was not as significant as the three-week average approach.
Further research is needed to improve SBR techniques by considering the persistence (frequency of appearance) of the bleaching events, create a flexible algorithm for defining the baseline and bleaching period, and further assess the sensitivity and specificity of the method on a global spatial scale.

Author Contributions

Y.X. led the study and drafted the paper. N.R.V. and D.E.K. provided technical analysis, programming, and edited the paper. C.B. and R.E.M. did the field work. J.L. provided the programming and comments on the paper. S.A.F. edited the paper. G.P.A. led the study. All the authors contributed to writing the paper. All authors have read and agreed to the published version of the manuscript.

Funding

This research was funded by Paul G. Allenʻs Vulcan Inc. (contract 141) and the Lenfest Ocean Program (grant 32718).

Acknowledgments

This project was supported by Vulcan Inc. and the Lenfest Ocean Program. Satellite imagery were provided by Planet Inc., and computing resources were supported by Arizona State University.

Conflicts of Interest

The authors declare no conflict of interest.

Appendix A

Table A1. Average bottom reflectance for the locations identified in the field. Bottom reflectance values were multiplied by 10,000 to improve readability. Bold rows indicate the field survey week. We calculated the average bottom reflectance (rb) value for the whole quad as well as for the coral regions defined by the Global Airborne Observatory (GAO). Negative rb values show the pixels or the whole quad are dark, indicating low signal-to-noise ratio of bottom reflectance.
Locations 2 and 4 (Planet Dove quad L15-0130E-1146N)
WeekAverage rb for the Whole QuadAverage rb for Coral Regions Define by the GAO
21 October 2019 to 28 October 201996.40-878.72
28 October 2019 to 04 November 201964.02-730.02
04 November 2019 to 11 November 2019434.51-146.72
11 November 2019 to 18 November 2019332.45-218.42
18 November 2019 to 25 November 2019318.34-386.23
25 November 2019 to 02 December 2019161.53-626.55
Locations 5 and 10 (Planet Dove quad L15-0132E-1146N)
Week Average rb for the Whole QuadAverage rb for Coral Regions Define by the GAO
21 October 2019 to 28 October 2019-680.07-662.52
28 October 2019 to 04 November 2019-394.89-290.99
04 November 2019 to 11 November 2019-895.58-1513.47
11 November 2019 to 18 November 2019-314.39-392.45
18 November 2019 to 25 November 2019-186.68-402.37
25 November 2019 to 02 December 2019475.52338.59
Locations for 11 (Planet Dove quad L15-0132E-1145N)
Week Average rb for the Whole QuadAverage rb for Coral Regions Define by the GAO
21 October 2019 to 28 October 2019-456.35-281.73
28 October 2019 to 04 November 2019431.70-163.27
04 November 2019 to 11 November 2019-960.76-51.54
11 November 2019 to 18 November 2019-632.15-290.47
18 November 2019 to 25 November 2019-790.94643.48
25 November 2019 to 02 December 2019-875.62146.68
Locations 18 (Planet Dove quad L15-0116E-1151N)
Week Average rb for the Whole QuadAverage rb for Coral Regions Define by the GAO
21 October 2019 to 28 October 2019-23.59188.58
28 October 2019 to 04 November 2019423.79400.24
04 November 2019 to 11 November 2019-383.441.47
11 November 2019 to 18 November 2019-1300.36-1030.24
18 November 2019 to 25 November 2019-1748.58-1859.88
25 November 2019 to 02 December 2019-608.75-477.89
Location 1 (Planet Dove quad L15-0137E-1141N)
Week Average rb for the Whole QuadAverage rb for Coral Regions Define by the GAO
21 October 2019 to 28 October 2019-547.49-513.25
28 October 2019 to 04 November 2019-298.84-201.47
04 November 2019 to 11 November 2019-632.89-438.36
11 November 2019 to 18 November 2019-817.84-756.81
18 November 2019 to 25 November 2019-542.56-511.68
25 November 2019 to 02 December 2019181.5572.28
Location 3 (Planet Dove quad L15-0137E-1140N)
Week Average rb for the Whole QuadAverage rb for Coral Regions Define by the GAO
21 October 2019 to 28 October 2019-1158.43-534.49
28 October 2019 to 04 November 2019-1197.39-528.27
04 November 2019 to 11 November 2019-1725.19-877.68
11 November 2019 to 18 November 2019-1754.35-895.11
18 November 2019 to 25 November 2019-1078.23-478.80
25 November 2019 to 02 December 2019-20.77284.14
Location 16 and 17 (Planet Dove quad L15-0126E-1149N)
Week Average rb for the Whole QuadAverage rb for Coral Regions Define by the GAO
21 October 2019 to 28 October 2019172.05-342.25
28 October 2019 to 04 November 2019274.19-95.60
04 November 2019 to 11 November 2019-133.69-610.10
11 November 2019 to 18 November 2019189.42-453.87
18 November 2019 to 25 November 2019806.59312.72
25 November 2019 to 02 December 2019550.1112.15
Locations 8 (Planet Dove quad L15-0131E-1145N)
Week Average rb for the Whole QuadAverage rb for Coral Regions Define by the GAO
21 October 2019 to 28 October 2019-506.56-477.14
28 October 2019 to 04 November 2019-173.06-87.74
04 November 2019 to 11 November 2019-286.13-258.22
11 November 2019 to 18 November 2019-192.93-144.63
18 November 2019 to 25 November 2019367.06501.89
25 November 2019 to 02 December 2019127.52110.54
Locations 13 (Planet Dove quad L15-0131E-1146N)
Week Average rb for the Whole QuadAverage rb for Coral Regions Define by the GAO
21 October 2019 to 28 October 2019219.5357.16
28 October 2019 to 04 November 2019422.59110.45
04 November 2019 to 11 November 2019578.90449.79
11 November 2019 to 18 November 2019466.32308.84
18 November 2019 to 25 November 2019662.05432.10
25 November 2019 to 02 December 20191039.51720.43
Location 6 (Planet Dove quad L15-0136E-1139N)
Week Average rb for the Whole QuadAverage rb for Coral Regions Define by the GAO
21 October 2019 to 28 October 2019-895.76-224.52
28 October 2019 to 04 November 2019-931.16-104.35
04 November 2019 to 11 November 2019-472.10237.34
11 November 2019 to 18 November 2019-522.85157.46
18 November 2019 to 25 November 2019-422.14195.03
25 November 2019 to 02 December 2019-426.70189.22

References

  1. Bellwood, D.R.; Hughes, T.P.; Folke, C.; Nyström, M. Confronting the coral reef crisis. Nature 2004, 429, 827–833. [Google Scholar] [CrossRef]
  2. Moberg, F.; Folke, C. Ecological goods and services of coral reef ecosystems. Ecol. Econ. 1999, 29, 215–233. [Google Scholar] [CrossRef]
  3. Hoegh-Guldberg, O. Likely ecological impacts of global warming and climate change on the Great Barrier Reef by 2050 and beyond. Qld. Land Resour. Trib. Rep. Brisb. Aust. 2007. [Google Scholar]
  4. Lesser, M.P. Coral Bleaching: Causes and Mechanisms. In Coral Reefs: An Ecosystem in Transition; Springer: Dordrecht, The Netherlands, 2011; pp. 405–419. [Google Scholar]
  5. Donner, S.D.; Skirving, W.J.; Little, C.M.; Oppenheimer, M.; Hoegh-Guldberg, O. Global assessment of coral bleaching and required rates of adaptation under climate change. Glob. Chang. Biol. 2005, 11, 2251–2265. [Google Scholar] [CrossRef]
  6. Barange, M.; Merino, G.; Blanchard, J.; Scholtens, J.; Harle, J.; Allison, E.; Allen, J.; Holt, J.; Jennings, S. Impacts of climate change on marine ecosystem production in societies dependent on fisheries. Nat. Clim. Chang. 2014, 4, 211–216. [Google Scholar] [CrossRef]
  7. Griffiths, J.R.; Kadin, M.; Nascimento, F.J.; Tamelander, T.; Törnroos, A.; Bonaglia, S.; Bonsdorff, E.; Brüchert, V.; Gårdmark, A.; Järnström, M. The importance of benthic–pelagic coupling for marine ecosystem functioning in a changing world. Glob. Chang. Biol. 2017, 23, 2179–2196. [Google Scholar] [CrossRef] [Green Version]
  8. Kwiatkowski, L.; Cox, P.; Halloran, P.R.; Mumby, P.J.; Wiltshire, A.J. Coral bleaching under unconventional scenarios of climate warming and ocean acidification. Nat. Clim. Chang. 2015, 5, 777–781. [Google Scholar] [CrossRef]
  9. Hoegh-Guldberg, O. Climate change, coral bleaching and the future of the world’s coral reefs. Mar. Freshw. Res. 1999, 50, 839–866. [Google Scholar] [CrossRef] [Green Version]
  10. Earle, S.A. Sea Change: A Message of the Oceans; Ballantine Books: New York, NY, USA, 1996. [Google Scholar]
  11. Brown, B.E. Coral bleaching: Causes and consequences. Coral Reefs 1997, 16, S129–S138. [Google Scholar] [CrossRef]
  12. Burke, L.M.; Reytar, K.; Spalding, M.; Perry, A. Reefs at Risk Revisited; World Resources Institute: Washington, DC, USA, 2017. [Google Scholar]
  13. Maglione, P.; Parente, C.; Vallario, A. Coastline extraction using high resolution WorldView-2 satellite imagery. Eur. J. Remote Sens. 2014, 47, 685–699. [Google Scholar] [CrossRef]
  14. Specht, M.; Specht, C.; Lewicka, O.; Makar, A.; Burdziakowski, P.; Dąbrowski, P. Study on the Coastline Evolution in Sopot (2008–2018) Based on Landsat Satellite Imagery. J. Mar. Sci. Eng. 2020, 8, 464. [Google Scholar] [CrossRef]
  15. Wang, X.; Liu, Y.; Ling, F.; Liu, Y.; Fang, F. Spatio-Temporal Change Detection of Ningbo Coastline Using Landsat Time-Series Images during 1976–2015. ISPRS Int. J. Geo Inf. 2017, 6, 68. [Google Scholar] [CrossRef] [Green Version]
  16. Torres-Pérez, J.L.; Guild, L.S.; Armstrong, R.A. Hyperspectral Distinction of Two Caribbean Shallow-Water Corals Based on Their Pigments and Corresponding Reflectance. Remote Sens. 2012, 4, 3813–3832. [Google Scholar] [CrossRef] [Green Version]
  17. Chauvaud, S.; Bouchon, C.; Maniere, R. Remote sensing techniques adapted to high resolution mapping of tropical coastal marine ecosystems (coral reefs, seagrass beds and mangrove). Int. J. Remote Sens. 1998, 19, 3625–3639. [Google Scholar] [CrossRef]
  18. Thompson, D.R.; Hochberg, E.J.; Asner, G.P.; Green, R.O.; Knapp, D.E.; Gao, B.-C.; Garcia, R.; Gierach, M.; Lee, Z.; Maritorena, S.; et al. Airborne mapping of benthic reflectance spectra with Bayesian linear mixtures. Remote Sens. Environ. 2017, 200, 18–30. [Google Scholar] [CrossRef]
  19. Asner, G.P.; Martin, R.E.; Mascaro, J. Coral reef atoll assessment in the South China Sea using Planet Dove satellites. Remote Sens. Ecol. Conserv. 2017, 3, 57–65. [Google Scholar] [CrossRef]
  20. Foo, S.A.; Asner, G.P. Scaling Up Coral Reef Restoration Using Remote Sensing Technology. Front. Mar. Sci. 2019, 6. [Google Scholar] [CrossRef] [Green Version]
  21. Allen Coral Atlas. Available online: https://allencoralatlas.org/ (accessed on 1 May 2020).
  22. Solano-Correa, Y.T.; Bovolo, F.; Bruzzone, L. An Approach for Unsupervised Change Detection in Multitemporal VHR Images Acquired by Different Multispectral Sensors. Remote Sens. 2018, 10, 533. [Google Scholar] [CrossRef] [Green Version]
  23. Lv, Z.; Liu, T.; Wan, Y.; Benediktsson, J.A.; Zhang, X. Post-Processing Approach for Refining Raw Land Cover Change Detection of Very High-Resolution Remote Sensing Images. Remote Sens. 2018, 10, 472. [Google Scholar] [CrossRef] [Green Version]
  24. Wang, X.; Liu, S.; Du, P.; Liang, H.; Xia, J.; Li, Y. Object-Based Change Detection in Urban Areas from High Spatial Resolution Images Based on Multiple Features and Ensemble Learning. Remote Sens. 2018, 10, 276. [Google Scholar] [CrossRef] [Green Version]
  25. Lyons, M.B.; Roelfsema, C.M.; Phinn, S.R. Towards understanding temporal and spatial dynamics of seagrass landscapes using time-series remote sensing. Estuar. Coast. Shelf Sci. 2013, 120, 42–53. [Google Scholar] [CrossRef]
  26. Palandro, D.A.; Andréfouët, S.; Hu, C.; Hallock, P.; Müller-Karger, F.E.; Dustan, P.; Callahan, M.K.; Kranenburg, C.; Beaver, C.R. Quantification of two decades of shallow-water coral reef habitat decline in the Florida Keys National Marine Sanctuary using Landsat data (1984–2002). Remote Sens. Environ. 2008, 112, 3388–3399. [Google Scholar] [CrossRef]
  27. Hunter, P.D.; Tyler, A.N.; Willby, N.J.; Gilvear, D.J. The spatial dynamics of vertical migration by Microcystis aeruginosa in a eutrophic shallow lake: A case study using high spatial resolution time-series airborne remote sensing. Limnol. Oceanogr. 2008, 53, 2391–2406. [Google Scholar] [CrossRef]
  28. Chen, L.; Jin, Z.; Michishita, R.; Cai, J.; Yue, T.; Chen, B.; Xu, B. Dynamic monitoring of wetland cover changes using time-series remote sensing imagery. Ecol. Inform. 2014, 24, 17–26. [Google Scholar] [CrossRef]
  29. Evangelista, P.H.; Stohlgren, T.J.; Morisette, J.T.; Kumar, S. Mapping Invasive Tamarisk (Tamarix): A Comparison of Single-Scene and Time-Series Analyses of Remotely Sensed Data. Remote Sens. 2009, 1, 519–533. [Google Scholar] [CrossRef] [Green Version]
  30. Li, J.; Knapp, D.E.; Schill, S.R.; Roelfsema, C.; Phinn, S.; Silman, M.; Mascaro, J.; Asner, G.P. Adaptive bathymetry estimation for shallow coastal waters using Planet Dove satellites. Remote Sens. Environ. 2019, 232, 111302. [Google Scholar] [CrossRef]
  31. Xu, Y.; Wang, L.; Ross, K.W.; Liu, C.; Berry, K. Standardized Soil Moisture Index for Drought Monitoring Based on Soil Moisture Active Passive Observations and 36 Years of North American Land Data Assimilation System Data: A Case Study in the Southeast United States. Remote Sens. 2018, 10, 301. [Google Scholar] [CrossRef] [Green Version]
  32. Asner, G.P.; Vaughn, N.R.; Heckler, J.; Knapp, D.E.; Balzotti, C.; Shafron, E.; Martin, R.E.; Neilson, B.J.; Gove, J.M. Large-scale spectroscopic mapping of live corals to guide reef conservation. Proc. Natl. Acad. Sci. submitted.
  33. NOAA Coral Reef Watch. NOAA Coral Reef Watch Version 3.1 Daily Global 5-km Satellite Coral Bleaching Degree Heating Week Product, 3 June 2013–2 June 2014. 2018, Updated Daily. Available online: https://coralreefwatch.noaa.gov/satellite/hdf/index.php (accessed on 31 December 2019).
  34. Planet Team. Planet Application Program Interface: In Space for Life on Earth, Planet Labs: San Fransisco, CA, USA, 2017; 40.
  35. Asner, G.P.; Knapp, D.E.; Boardman, J.; Green, R.O.; Kennedy-Bowdoin, T.; Eastwood, M.; Martin, R.E.; Anderson, C.; Field, C.B. Carnegie Airborne Observatory-2: Increasing science data dimensionality via high-fidelity multi-sensor fusion. Remote Sens. Environ. 2012, 124, 454–465. [Google Scholar] [CrossRef]
  36. Allen Coral Atlas Planet Satellite Imagery. Available online: https://allencoralatlas.org/methods/ (accessed on 1 May 2020).
  37. Kotchenova, S.Y.; Vermote, E.F.; Matarrese, R.; Klemm, J.F.J. Validation of a vector version of the 6S radiative transfer code for atmospheric correction of satellite data. Part I: Path radiance. Appl. Opt. 2006, 45, 6762–6774. [Google Scholar] [CrossRef] [Green Version]
  38. Kotchenova, S.Y.; Vermote, E.F. Validation of a vector version of the 6S radiative transfer code for atmospheric correction of satellite data. Part II. Homogeneous Lambertian and anisotropic surfaces. Appl. Opt. 2007, 46, 4455–4464. [Google Scholar] [CrossRef] [PubMed] [Green Version]
  39. Li, J.; Fabina, N.S.; Knapp, D.E.; Asner, G.P. The Sensitivity of Multi-spectral Satellite Sensors to Benthic Habitat Change. Remote Sens. 2020, 12, 532. [Google Scholar] [CrossRef] [Green Version]
  40. Qi, L.; Lee, Z.; Hu, C.; Wang, M. Requirement of minimal signal-to-noise ratios of ocean color sensors and uncertainties of ocean color products. J. Geophys. Res. Ocean. 2017, 122, 2595–2611. [Google Scholar] [CrossRef]
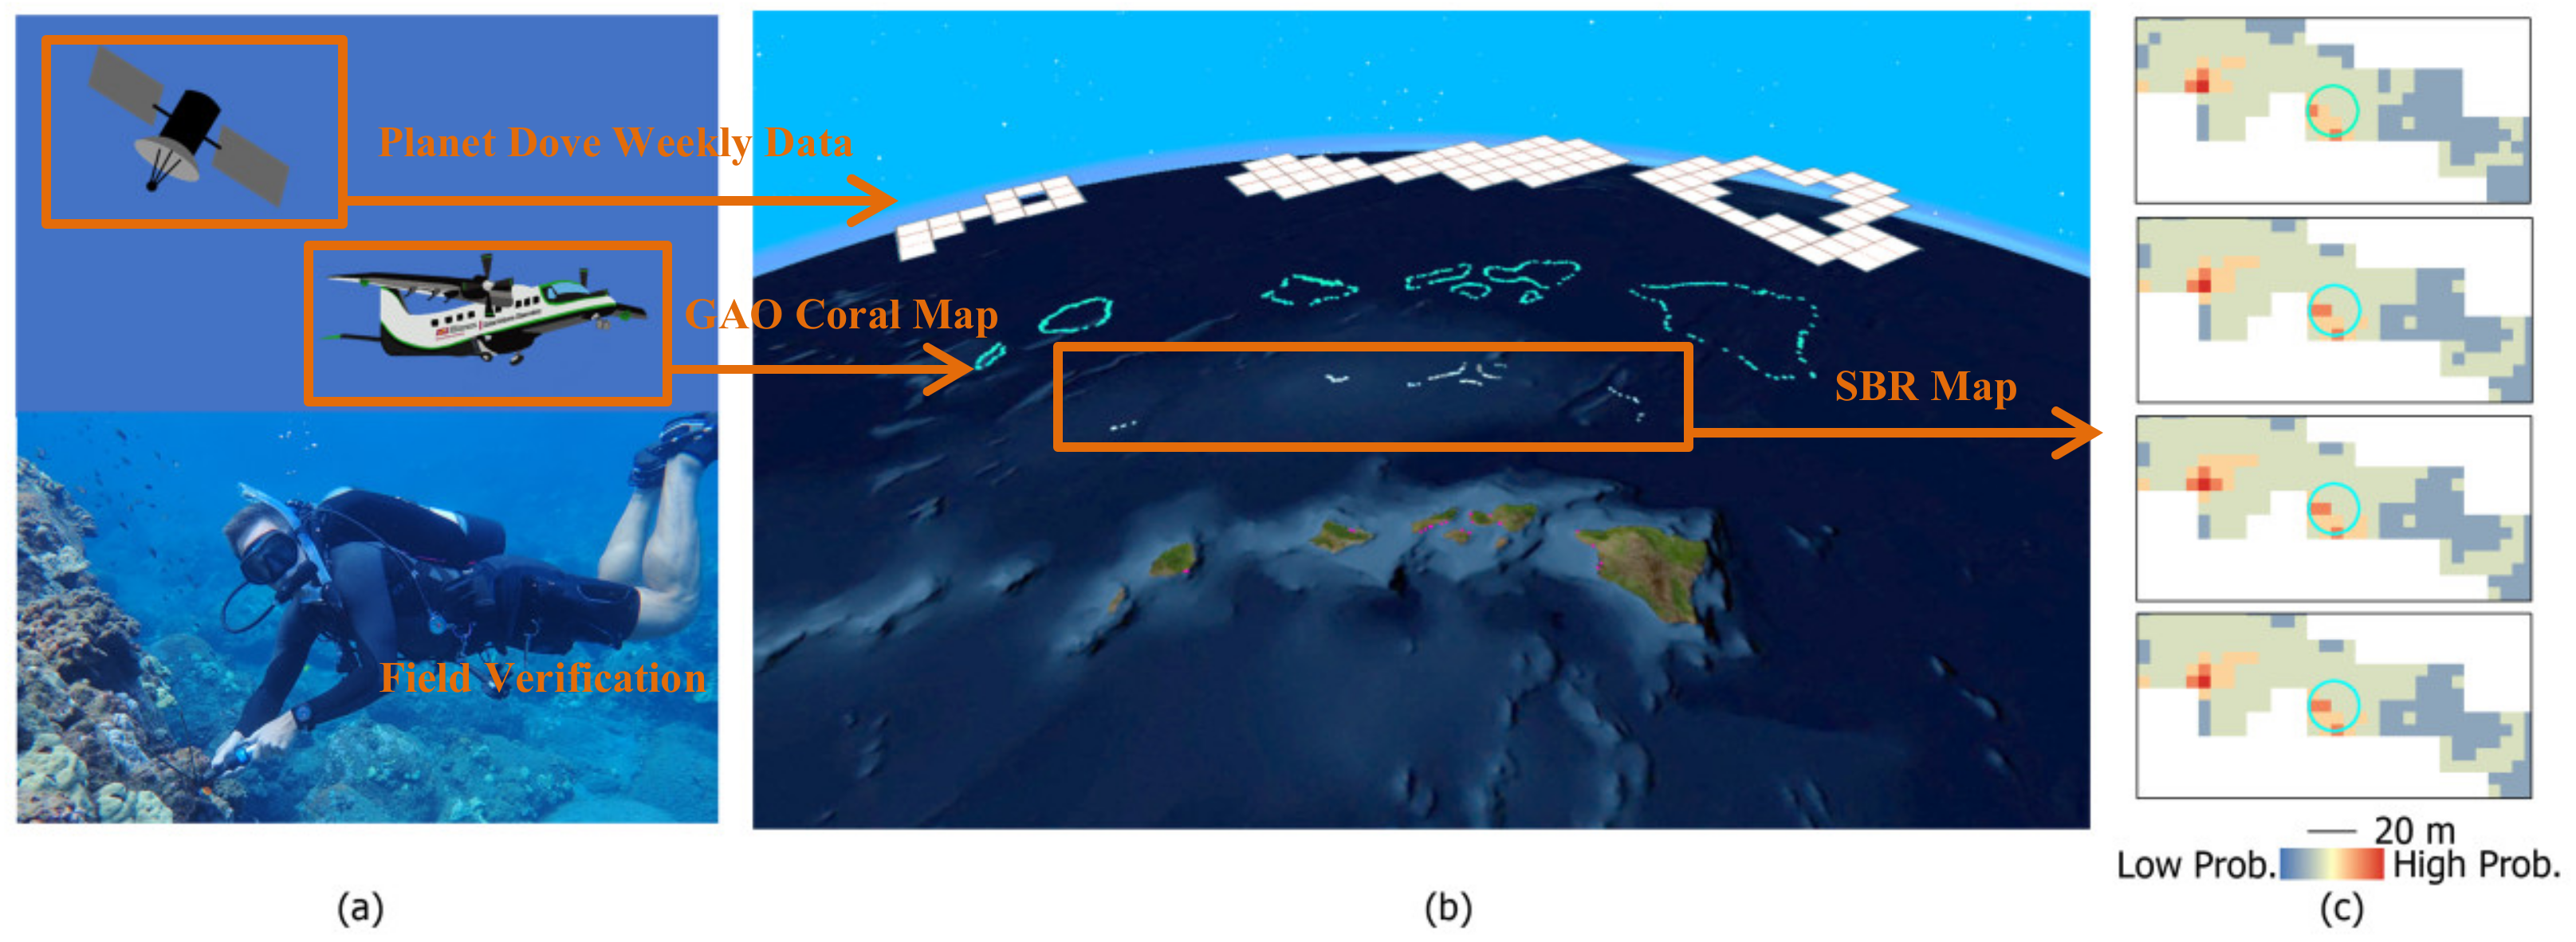
Figure 1. General methodology for bleaching detection. (a) Techniques used for coral bleaching detection. (b) We used a combination of Planet Dove satellite time series data for coral regions defined from a coral map produced by the Global Airborne Observatory (GAO) [32] to calculate the Standardized Bottom Reflectance (SBR), an index to detect and measure the probability and persistence of coral bleaching. We validated this methodology with diver surveys of coral bleaching. (c) This methodology creates an SBR map, where red regions indicate a high probability of bleaching. Figure 1a upper right: satellite (credit: unknown author licensed under CC BY-SA). Upper left: Global Airborne Observatory (credit: Victoria Vandekop). Lower panel: diver surveying bleached coral (credit: Roberta Martin).
Remotesensing 12 03219 g001
Figure 2. Flow diagram of the research design.
Remotesensing 12 03219 g002
Figure 3. Coverage of the Planet Dove satellite data and the coral bleaching locations collected from field surveys. Planet Dove quads are shown in dark blue colors.
Remotesensing 12 03219 g003
Figure 4. The ascending versus descending orbits perform differently with respect to the amount of sunglint affecting pixel brightness. Separating the usage of orbits helped to reduce the variation caused by sunglint.
Remotesensing 12 03219 g004
Figure 5. Response of detectability under multiple Standardized Bottom Reflectance (SBR) threshold values (data show the maximum SBR pixel value extracted within each location circle).
Remotesensing 12 03219 g005
Figure 6. Selected bleaching locations for comparisons among weekly, cumulative average, and three-week average Standardized Bottom Reflectance (Location 2 and 4, Molokai; Location 5, 10, 11, Maui).
Remotesensing 12 03219 g006
Table 1. Coral bleaching locations collected in the field.
Bleaching Location IDDateIslandBleached Percent of Coral (%)
19 November 2019Hawaii79
216 November 2019Molokai64
39 November 2019Hawaii56
416 November 2019Molokai39
513 November 2019Maui39
629 October 2019Hawaii37
713 November 2019Maui33
814 November 2019Lanai30
914 November 2019Lanai30
1013 November 2019Maui29
1113 November 2019Maui23
1216 November 2019Molokai22
1316 November 2019Molokai16
1415 November 2019Kauai15
1515 November 2019Kauai13
1615 November 2019Oahu12
1715 November 2019Oahu11
1815 November 2019Kauai8
Table 2. SBR values calculated for locations used to verify bleaching. Bold font shows the detectable locations out of all 18 locations (with SBRs of above 0.5).
Bleaching Location IDDateWeekly WindowCumulative AverageThree-Week Moving Average
19 November 2019-0.47281.2073-0.674
216 November 20190.40031.86734.0749
39 November 2019-1.09290.9955-1.2163
416 November 20190.3961.53373.5447
513 November 20190.57960.63410.711
629 October 2019-0.51840.80161.8702
713 November 20190.37961.1460.4246
814 November 20190.3667-0.40891.9066
914 November 20190.9061-0.7780.9881
1013 November 20190.70841.64230.8612
1113 November 20191.21850.22361.9949
1216 November 20190.1767-0.05480.776
1316 November 2019-0.0044-0.0710.5855
1415 November 2019-0.0839-0.6213-1.1263
1515 November 20190.0721-0.54-1.1583
1615 November 20190.32240.7325-0.1811
1715 November 20190.09470.899-0.0779
1815 November 2019data missing0.6689-0.2641
Proportion of Detectable Locations to the 18 Locations 4/1711/1810/18