Review

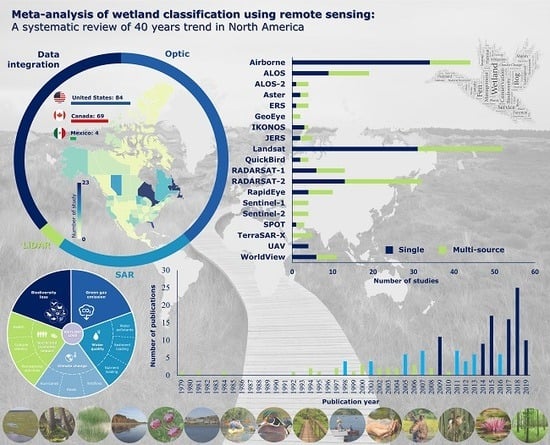
Meta-Analysis of Wetland Classification Using Remote Sensing: A Systematic Review of a 40-Year Trend in North America

1
C-CORE, 1 Morrissey Rd, St. John’s, NL A1B 3X5, Canada
2
Department of Electrical and Computer Engineering, Memorial University of Newfoundland, St. John’s, NL A1B 3X5, Canada
3
Environmental Resources Engineering, College of Environmental Science and Forestry, State University of New York, New York, NY 13210, USA
4
The Canada Centre for Mapping and Earth Observation, Ottawa, ON K1S 5K2, Canada
5
Institut National de la Recherche Scientifique (INRS), Centre Eau Terre Environnement, Quebec City, QC G1K 9A9, Canada
6
SharedGeo, 1360 University Ave., West, Suite 455, St. Paul, MN 55104-4086, USA
7
U.S. Fish and Wildlife Service, National Wetlands Inventory, Falls Church, VA 22041, USA
*
Author to whom correspondence should be addressed.
Remote Sens. 2020, 12(11), 1882; https://doi.org/10.3390/rs12111882
Submission received: 13 May 2020 / Revised: 4 June 2020 / Accepted: 4 June 2020 / Published: 10 June 2020
(This article belongs to the Section Environmental Remote Sensing)

Abstract

:
North America is covered in 2.5 million km2 of wetlands, which is the remainder of an estimated 56% of wetlands lost since the 1700s. This loss has resulted in a decrease in important habitat and services of great ecological, economic, and recreational benefits to humankind. To better manage these ecosystems, since the 1970s, wetlands in North America have been classified with increasing regularity using remote sensing technology. Since then, optimal methods for wetland classification by numerous researchers have been examined, assessed, modified, and established. Over the past several decades, a large number of studies have investigated the effects of different remote sensing factors, such as data type, spatial resolution, feature selection, classification methods, and other parameters of interest on wetland classification in North America. However, the results of these studies have not yet been synthesized to determine best practices and to establish avenues for future research. This paper reviews the last 40 years of research and development on North American wetland classification through remote sensing methods. A meta-analysis of 157 relevant articles published since 1980 summarizes trends in 23 parameters, including publication, year, study location, application of specific sensors, and classification methods. This paper also examines is the relationship between several remote sensing parameters (e.g., spatial resolution and type of data) and resulting overall accuracies. Finally, this paper discusses the future of remote sensing of wetlands in North America with regard to upcoming technologies and sensors. Given the increasing importance and vulnerability of wetland ecosystems under the climate change influences, this paper aims to provide a comprehensive review in support of the continued, improved, and novel applications of remote sensing for wetland mapping across North America and to provide a fundamental knowledge base for future studies in this field.

Graphical Abstract

1. Introduction

An estimated 56% of North American wetlands have been lost since the 1700s, with the greatest loss occurring during the 20th and 21st centuries largely as a result of land-use change [1]. Altough the rate of wetland loss has slowed in recent decades [2], it remains an ongoing issue, exacerbated by a changing climate [1,3,4]. Impacts of land-use change and climate change (and the interaction between both) have resulted in wetlands becoming the most threatened ecosystem on the planet [5]. Thus, an effective tool is needed for the accurate and efficient monitoring and management of these threatened ecosystems. Remote sensing is a relatively recent (in the context of wetland loss) development that allows for improved wetland monitoring and management by providing information on the what, where, and extent of wetlands at the landscape scale [6]. Classification of wetlands via remote sensing methods produce maps and inventories, which act as baseline datasets for further applications, including the development of national and regional wetland policies, identification of wetlands for restoration or protection, assessment of wetland services, and examination of both historical and future trends [7,8,9]. The Ramsar Convention on Wetlands has emphasized the importance of national wetland inventories produced via remote sensing [10], and many countries have dedicated much research toward developing and refining related methods. Over the last 40 years, many effective and efficient remote-sensing based methods have been developed and tested for optimal classification and mapping of North American wetland ecosystems.
According to [11], wetlands are areas of the landscape where there is a presence of permanent or seasonal waters, vegetation adapted to wetness, and permanently or seasonally saturated soils. Wetlands manifest in a variety of forms with different vegetation composition, degree of wetness, and size. Other colloquial terms for wetlands include, among others, bog, fen, swamp, marsh, mire, moor, and muskeg. Wetlands manifest in a variety of forms with different vegetation composition, degree of wetness, and size. The variety inherent to wetlands can be seen in examples such as mangrove swamps, mossy bogs, lagoons and estuaries, and temporary, seasonal pools, to name only a few. There are several wetland classification guides available attempting to describe and categorize this variation based on geography, biology, ecology, hydrology, geomorphology characteristics, and even political boundaries [12,13]. These classification systems can provide a reference for the development of wetland-related remote sensing methodologies and help to simplify the diversity present in wetland habitats.
Importantly, wetlands provide valuable ecosystem services to humans via natural wetland functioning [14]. These services include, but are not limited to, flood amelioration water filtration, habitat, biodiversity, and recreation [15,16,17]. Different kinds of wetlands provide different functions and services at different rates [18,19]. It is the loss of such services that, in part, triggered efforts to better protect these ecosystems in North America when hunters noted a decrease in waterfowl [20]. A major wetland service of recent interest is the ability of these ecosystems to store and release carbon. Wetlands produce and sequester greenhouse gases (nitrous oxide, carbon dioxide, and methane) via their natural biogeochemical processes and thus have the potential to influence and be influenced by a changing global climate [3]. As a result, wetlands, and information relating to type, extent, and location play an important role in discussions and models relating to climate change [21]. Damages to and the loss of wetlands impact the ability of these ecosystems to provide their valuable services, resulting in a multitude of ecological and socioeconomic issues, some of which are listed in Figure 1.
A little more than half of the world’s wetlands have been lost since the turn of the 18th century, with loss occurring on all continents, though at different rates [1], making wetlands amongst the most endangered ecosystems on the planet. Historical rates of loss were greatest in Europe and North America, though this loss has slowed but not stopped in the 20th and 21st century [1]. Currently, North America is covered by approximately 249 million hectares of wetlands, representing one-third of the globe’s total wetland coverage [22]. There are an estimated 127 million hectares of wetlands in Canada, 114.6 million in the United States of America (U.S.A.), and 1.6 million wetlands along the Mexico coast including an estimated 1,600,000 ha of estuarine and marine wetlands, and numerous inland wetlands, including floodplains, flooded forests, palm thickets, and other palustrine, riparian, and lacustrine wetlands [22]. Each country has initiated and participates in multiple wetland protection and conservation initiatives and has developed national wetland policies. These initiatives have been partially supported through the development of nation-wide wetland maps by the U.S.A. in the form of the National Wetlands Inventory (NWI) and Canada in the form of the Canadian Wetland Inventory (CWI). The creation and maintenance of these large-scale inventories are made possible via the availability and development of remote sensing imagery and methods [23,24].
Published research relating to wetland classification via remote sensing originates from all continents, though the publishing is often dominated by one or a few countries, including the People’s Republic of China (PRC) [25,26,27,28], Canada [29,30,31], and the U.S.A. [32,33,34]. Less publications come from Europe [35,36], South America [37,38,39,40], Africa [41,42], and Oceania [43,44]. Globally, recent research trends include a focus on deep learning methods [45,46], vegetation mapping [45,46,47,48,49], and applications of low and medium spatial resolution imagery [38,42,47,50,51] and hyperspectral imagery [28]. Very few reviews relating to country- or continent-based trends in the publication of wetland classification research exist [39,41,52]. Additionally, a number of bibliometric analyses of remote sensing in general have been published [53,54,55]. Notably, none such reviews exist for North America, which is one of the leading continents in the production of wetland classification-related research.
Wetland classification in North America using aerial- or satellite-based remotely sensed imagery has been carried out in one form or another since at least the 1950s and 1960s [56,57], although these efforts often focused only on a small number of wetlands. Prior to the widespread availability of remotely sensed imagery, the classification and mapping of wetlands was largely conducted at small scales through the use of questionnaires, soil surveys, field campaigns, and topographic maps [58,59]. The possibility of classifying all the wetlands in a region at that time was nigh impossible given the resource requirements, human error potential, weather and landscape restrictions, and the ever-changing nature of wetlands. The availability of satellite and aerial photo technology was an important development in wetland management as it allowed for a resource-efficient and repeatable method for wetland mapping. This development allowed for mapping the location of wetlands at national and regional scales, and the elucidation of wetland classes. Since the 1970s, research relating to wetland classification via remotely sensed imagery has increased, and today, methods for capturing the diversity of North American wetlands are frequently published today.
The majority of Canadian wetland classification studies were conducted within the province Ontario starting in 1979 [60]. Topics covered by the various Ontario-based studies includes applications of multi-temporal imagery [61,62,63], evaluation of Synthetic Aperture Radar (SAR) features [61,64,65,66,67,68], object-based image analysis [69,70,71], Light Detection And Ranging (LiDAR) integration [72,73], applications of hyperspectral imagery [74], and evaluation of the recently launched RADARSAT Constellation Mission (RCM) for wetland mapping [75]. After Ontario, the next greatest concentration of wetlands research in Canada is located in Newfoundland and Labrador, starting in 2017. Research has focused on the integration of SAR and optical data [76,77], integrations of SAR and Interferometric SAR (InSAR) features [78,79,80], feature selection [29,81,82], feature optimization [83,84], object-based image analysis [29,85], RCM compact polarimetry [86,87], machine learning methods [29,78,83,85], deep learning models [76,77,88,89], and Geo-big data analysis [52,90].
Similar to Canada, there are many US states lacking peer-reviewed wetland classification research. Many of these states are located in the central U.S.A. including Arizona and Utah among others. Notably, these states contain a relatively small number of wetlands, which is largely a result of the relatively dry climate. For example, wetlands cover only an estimated 0.5% of the land area in Arizona [91] and 1–2% of Utah [92]. However, the wetlands in these states are ecologically significant, perhaps even more so given their limited coverage. Other states, including Pennsylvania and New Jersey, are also lacking in peer-reviewed wetland classification research, despite a significant wetland presence. Notably, the wetlands in these states have been mapped by the National Wetlands Inventory, unlike portions of Alaska, which is currently the only U.S.A. state that has not yet been fully mapped by the NWI [93].
The overarching goal of this review is to provide readers with the “big picture” of the current status and general trends in remote sensing classification of wetlands in North America over the past 40 years by conducting a meta-analysis of the results of existing wetland studies. Various wetland-remote sensing reviews currently exist, including general reviews [94,95,96], reviews relating to challenges [97], specific methods and strategies [98,99], and reviews of related work at large geographical scales such as east East Africa [41] and South America [39]. However, outside of these examples, there is a lack of review and meta-analysis for most continents, including North America (herein considered Canada, U.S.A., and Mexico). Continental-scale analysis such as this is important given that wetlands do not function only at regional and country scales. For example, endangered waterfowl, migrate and occupy wetlands across countries and large wetland complexes exist in multiple countries at once, such as the prairie pothole region crossing Canadian and U.S.A. boarders and coastal wetlands along the Gulf of Mexico. As such, a meta-analysis such as this will prove beneficial given the extensive presence of wetlands on the continent [22], increasing interest in wetlands and wetland functions, particularly in the context of climate change [3], an increasing publication trend relating to wetland classification on the continent, and the increasing availability of spatial data and processing software. Accordingly, the main objectives of this study are to (1) discuss various North American wetland classification systems that may be applied in the context of wetland remote sensing; (2) determine trends and briefly summarize the scientific advances in remote sensing of wetlands in North America; (3) document the development and application of remote sensing technologies for wetland classification, mapping, and monitoring over the past 40 years; (4) provide guidelines for prospective users; (5) identify research gaps and discuss future prospects of mapping wetlands via remote sensing specifically within a North American context, and (6) provide the first meta-analysis of wetland classification work in North America.

2. North American Wetland Classification Systems

In order to classify wetlands using remote sensing methods, a system defining the wetland’s types according to user requirements and purpose should be established. Typically, such systems have previously been developed for the purpose of grouping wetlands on the basis of biotic, abiotic, and/or managerial characteristics. Importantly, the selection of an appropriate wetland classification system will define input and output data to remote sensing methods and will have a large impact on the final product. The choice of classification system will depend on several factors, including the original purpose of the wetland classification system, the availability of remote sensing data, and the ability to produce testing and training data.
Defining differences and similarities amongst wetlands is not a straightforward process given the ecological variability and transitional nature of these habitats [100,101,102]. Simply, wetlands can be grouped as a class versus dry upland. However, this grouping runs into difficulties when one considers the diversity of wetland habitats, some of which can have different vegetation structure, water presence, and morphology. Figure 2 demonstrates four ecosystems that are considered to be wetlands, each having different vegetation structure and hydrology. Consider sprawling peatlands dominated by blankets of moss, a densely treed wetland, or a bed of thin reeds emerging from the edge of a riverbank. Another issue arises as a result of the transitional nature of wetland ecosystems. Wetland boundaries are not visible as obvious lines of demarcation in the landscape, but rather, one wetland habitat may gradually transition into another wetland habitat or into upland (i.e., non-wetland or deep-water habitat; see Figure 3). Not only are wetland boundaries inherently blurry, but they are often indefinite and can change over time, over seasons or during differing weather conditions [103,104]. For example, some wetlands may be completely flooded or dried out during spring versus summer. Additionally, wetland vegetation may appear full, lush and vibrant green during some seasons, but brown, wilted, and de-leafed during others. A final issue arises as a result of the difficulty related to separating wetland habitats from the hydrological systems with which they are associated and determining where a wetland starts and ends [105,106]. Wetlands do not exist as units isolated from the surrounding environment, and they instead are connected to other wetlands and waterbodies within a watershed via surface and sub-surface water flow. As a result, these habitats share between them nutrients, fauna, and other chemicals. All of these issues and more make wetland classification a difficult challenge, which requires making trade-offs in terms of detail in exchange for comprehensiveness, ease of use, and application.
These issues can partially be addressed by producing a hierarchical wetland classification system, which groups wetlands into defined groups on the basis of hydrology, geomorphology, vegetation structure, managerial characteristics, etc. Several North American classification systems exist. These systems include methods that are relevant at continental, provincial, state, or regional scales, or at the scale of a single wetland. The majority of these classification systems have been developed by national or provincial organizations for the purposes of improving the management of wetlands or for better understanding wetland ecology. Some classification systems are designed to encompass all wetlands found within a designated area and some are designed only to better describe specific wetland types found within a given area. A number of international, national, and regional classification systems are applicable in a North American context. The Ramsar Convention on Wetlands developed the Ramsar Classification System for Wetland Type for identifying and classifying wetlands of importance at an international level [107]. Each country belonging to the convention, including Canada, the U.S.A., Mexico, and several other territories in North America are required to identify and designate wetlands of importance using this system. The Ramsar Convention Classification describes wetlands first in terms of three broad wetland habitats and further divides them into 40 classes based on hydrological, geomorphological, chemical, or biological factors. This classification system includes artificial wetlands as a broad wetland habitat.
In an attempt to better classify wetlands across multiple regions, [108] classified wetlands at a global scale on the basis of geomorphic characteristics, including landform and hydroperiod, rather than vegetation. The purpose was to make this classification applicable to all inland wetlands across the globe; however, it does not consider marine, estuarine, or deltaic wetland systems. This system defines five landform types and four water permanence types, resulting in a total of 13 main wetland types. There are a number of additional descriptor terms, which may explain salinity, geometry, size, scale, and vegetation. Various national wetland classification systems have been developed to describe all wetlands within some North American countries. These systems are often touted as being the standard by which all wetlands in the country can be classified, particularly for applications in the development of national wetland inventories [2,24]. Of note, some of these systems have been applied outside of their country of origin, in particular, the system developed by [12]. This system has been one of the most widely applied classification systems [101] and has also been used as a reference for development of many classification systems including the Ramsar Classification System [107] and the Mexican wetland classification system [109].
The Cowardin Classification System was developed in 1979 for the purpose of inventorying wetlands and deep-water habitats in the U.S.A. [12]. This classification system has been applied by the National Wetlands Inventory (NWI) conducted by the United States Fish and Wildlife Service [2]. The NWI contains five major systems, each divided into subsystems and each subsystem is further split into classes. Such a classification hierarchy is defined based on the influence of similar hydrologic, geomorphologic, chemical, or biological factors (see Figure 4).
In Canada, the Canadian Wetland Classification System (CWCS), last updated in 1997 by the National Wetlands Working Group, was designed to provide a uniform framework for the description of wetlands across Canada [13]. This system classifies wetlands into five broad classes based on morphology, hydrology, hydrochemistry, plant communities and structure, and soils and sediment characteristics. Each of these five classes is further divided into form and sub-forms based on surface form, soil characteristics, and location in the landscape. These forms can be further described in terms of Wetland Type, which is determined based on dominant vegetation physiognomy (see Figure 5). The Canadian Wetland Inventory initiative suggests that contributing inventories should be carried out using this classification system [24].
A Hydrogeomorphic Classification for Wetlands is another commonly used wetland classification system applied at a national level in the U.S.A. The purpose of this system is to classify wetlands on the basis of abiotic hydrologic and geomorphic controls, both of which are largely responsible for maintaining wetland functionality [110]. This classification system focuses on abiotic characteristics of wetlands and is unlike other classification systems (e.g., [12]), which put a greater focus on species composition and structure. This system is most applicable for classifying wetlands based on their potential function, and it is often used to assess the provision of ecosystem services.
In Mexico, a wetland classification system was proposed by [109]. This classification system was developed via a comparative analysis of 18 global inventory systems, but the final classification was largely based on the Ramsar Convention [107], Cowardin [12], and the Semeniuk and Semeniuk (1995) classification systems [108]. The resulting hierarchical system describes three domains, five systems, eight subsystems, and 26 classes (17 of which are natural and 9 of which are artificial). Please refer to Figure 6 for the proposed Mexican system.
There are a number of niche classification systems that have been developed to classify wetlands at the provincial, state, or regional scales. In Canada, the provinces of Alberta and British Columbia have developed their own classification systems designed to address wetland types and managerial issues specific to the province [111,112]. Many of these classification systems are compatible with the national CWCS. A classification system has also been developed by Ducks Unlimited Canada for the Boreal Plains Ecozone [113] in Canada, which includes parts of the provinces of Manitoba, Saskatchewan, and Alberta and defines five major and nine minor classes. This system was designed for resource managers to identify wetlands. Other classifications focus on wetland vegetation structure, composition, and zonation and typically focus on a single wetland habitat or unit. For example, [114] describes Atlantic Canadian peatland vegetation in terms of four plant alliances, which are in turn described in terms of 10 plant associations. [115] describe prairie pond and lake vegetation in terms of seven zones characterized on the basis of the assemblage of plant species.
The application of various remote sensing methods, including data type and classification algorithm, will largely depend on the wetland classes of interest, which are often derived from wetland classification systems previously discussed. For example, if vegetation is a key feature of a wetland class of interest, then the inclusion of LiDAR-derived elevation may be particularly useful, or if the water regime of wetlands is of interest, then a multi-temporal approach is likely necessary. Most North American wetland mapping efforts define wetlands based on the classification systems as listed above, or using a derivative of these systems. Use of these systems also allow wetland classification products to better support managerial and conservational efforts, as they provide a standard to facilitate data exchange (relating to the how much, where, and what kind) across jurisdictional and organizational boundaries. It should be noted that even when applying these classification systems in the field, it can sometimes be difficult to determine which class a wetland belongs to, depending on the level of depth of field work being conducted. For example, some classes of peatland (bog and nutritionally poor fen) can have very similar vegetation structure, and it may be differentiated via the assessment of both above- and below-ground water sources, which is often beyond the budget, time, or scope of many field campaigns. Additionally, some wetlands occur in the landscape not as a single easily definable class but as a complex mix of the characteristics of various classes, sometimes referred to as a wetland complex, making these wetlands difficult to accurately classify in the field. Such issues when ground-truthing wetlands must be considered when conducting wetland classification using remote sensing techniques as any inaccuracies present in the ground-truth data will be carried into the resulting wetland maps.

3. Methods

3.1. Data Collection

To prepare for this review, a query was systematically developed to search Thomson Reuters Web of Science and Google Scholar for English language articles, review articles, book chapters and conference papers. Then, Preferred Reporting Items for Systematic Reviews and Meta-Analyses (PRISMA) were applied for study selection [116]. The search was structured based on the following basic query: “remote* sens*” AND “wetland*” AND “map*”, with variations on each key term included via the OR operator (see Table 1). These terms included different types of remote sensing imagery (optical, hyperspectral, aerial photos, etc.), different types of wetlands (bog, fen, palustrine, etc.), and various methods- and purpose-related terms (classification, identification, discrimination, etc.). Although efforts were made to ensure all relevant articles were collected, some articles may not be. It must also be noted that much operational wetland mapping done across North America is not reported in peer-reviewed literature and as a result are not captured in this search.
This resulted in a total of 1392 journal papers, review articles, book chapters, and conference papers. See Figure 7 for a visualization of the most common terms present in North American wetland classification studies. To identify research findings and to keep a controllable workload, only those publications that applied remote sensing methods, with study areas located in North America, and that had been published within a 40-year period between 1980 and 2019 were selected for further analysis. After assessing the study areas of each of the 1392 publications, a total of 238 publications remained. From these, only those publications with titles and abstracts related to wetland classification using remote sensing were selected for final review. In the end, 157 papers were selected to collect data for further meta-analysis below. A summary of the literature search can be seen in Figure 8.

3.2. Data

For our systematic review, a database with 22 fields was designed based on the analysis of the 157 publications (see Table 2). This database was also used to perform a comparative meta-analysis and other quantitative statistical analyses. The database includes general literature identification fields such as title, publication, and author, as well as specific fields related to wetland mapping, including study area location, sensor, processing unit, and classifier. Next, both qualitative and quantitative information were obtained from these publications. Specifically, the final database with 157 records and 20 fields provided the foundation for further meta-analysis and the systematic review in this paper.
In addition to the general information that was directly extracted from target studies, this review paper investigated the effect of different parameters on wetland classification results, including (1) data type, (2) sensor type and spatial resolution of images used, (3) number of features extracted from remote sensing data, (4) number of classes in final product, (5) classification approaches, (6) minimum processing unit, and (7) different strategies that have been considered for a classification of remote sensing data such as pixel- versus object-based approaches and single-date versus multi-temporal image analysis.

4. Results

Based on the in-depth review of 157 publications on wetland mapping in North America, relevant data were extracted via the approach outlined in the previous section. In this section, the results of the meta-analysis, which is useful for documenting the scope, range, geographic location, trend, and history of wetland mapping in North America, are presented.

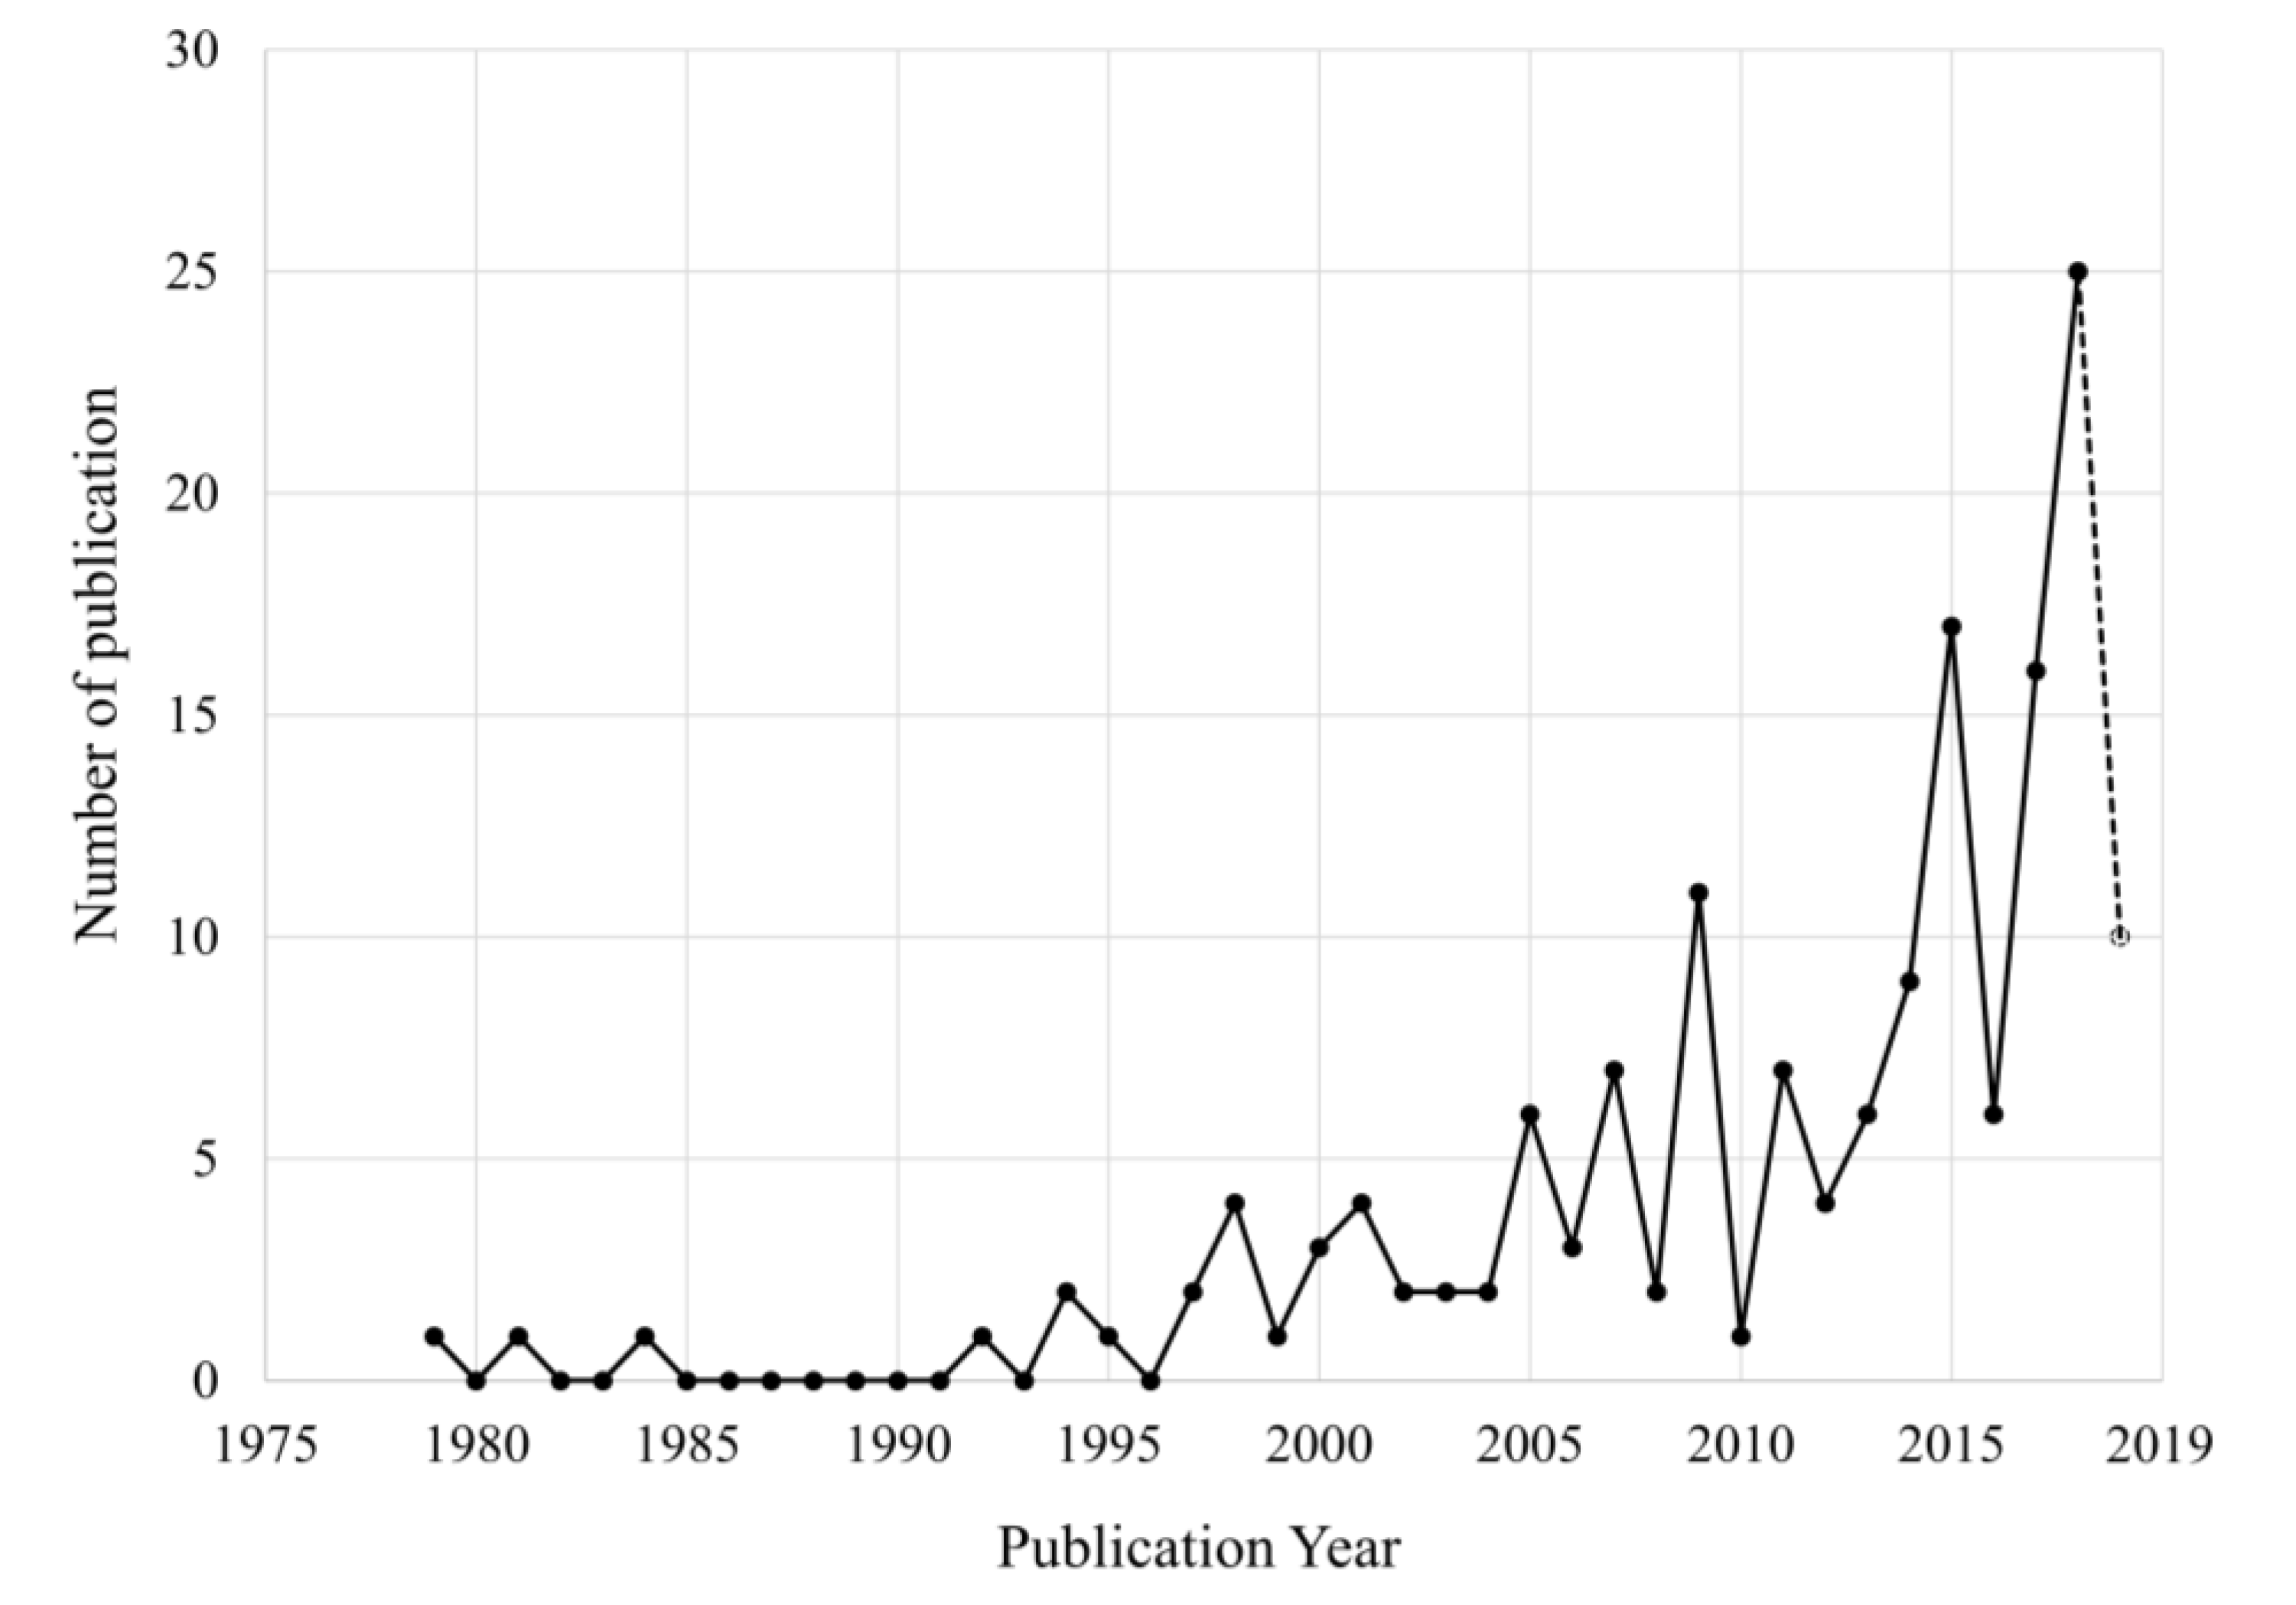
4.1. General Characteristics of Studies

The distribution of study areas throughout North America can be seen in Figure 9. Note that the map does not include two large-scale studies [52,117] that mapped Canadian wetlands at a national scale. The Canadian province of Ontario is the location of the greatest number of wetland classification studies (23), followed by the Canadian province of Newfoundland and Labrador (20) and the state of Florida within the U.S.A. (16). The Canadian provinces of Nunavut and British Columbia, roughly half of the states in the U.S.A., and all but two Mexican states were not included in any of the publications analyzed as part of this study. Figure 9 shows the average overall accuracy reported by the studies within various states and provinces. Note that the value of the overall accuracy reports the efficacy of remotely sensed classification results and the standard for communicating the success of remote sensing methodologies. The highest overall accuracies were achieved in Texas, Oklahoma, Iowa, Michigan, Ohio, and New Brunswick. Some studies did not report on overall accuracy, and as a result, they are not visualized in Figure 9. Common study areas include the prairie pothole region [118,119,120,121,122,123] and the Great Lakes, which are both located across the U.S.A. and Canadian border [30,61,63,71,76,124,125,126,127,128,129,130], the Mer Bleue Bog in eastern Ontario, Canada [65,66,67,68,73,127,131], the everglades in southern Florida, U.S.A. [131,132,133,134,135,136,137], and various other coastal areas along the Gulf of Mexico [34,127,138,139,140,141,142,143]. For further discussion of these results, please refer to Section 5.1, Section 5.2, and Section 5.3.
Among 157 articles, 18 were conference-related journals, and 139 were published in peer-reviewed journals. Almost 80% of the scientific papers were published in one of these four journals: Canadian Journal of Remote Sensing (CJRS; 24 papers), Wetlands (19 papers), Remote Sensing (RS; 18 papers), and International Journal of Remote Sensing (IJRS; 17 papers). Eleven journals contained only one of the 139 scientific papers and are not shown in Figure 10. Almost half of the all the Canadian-centered studies (69) were published in CJRS and RS, and half of the all of the U.S.A.-based studies (84) were published in Wetlands, IJRS, RS, and Photogrammetric Engineering and Remote Sensing (PERS). The two Mexico-centered papers were published in Remote Sensing of Environment (RSE) and Ecological Society of America.
More than half of the Canadian studies applied the CWCS directly or derivatively. The most common classification system used in U.S.A.-based studies was the Cowardin system, and many of these studies used data collected by the U.S.A. National Wetlands Inventory, for which the Cowardin system is the standard. Other wetland classifications applied, though much less frequently, include the Alberta Wetland Classification System, wetland’s zonal classification (high marsh, low marsh), wetland vegetation species (cattails, phragmites, etc.), wetland vegetation physiognomy (herbaceous, woody, shrub, tree), and a singular wetland class versus upland. The most commonly occurring wetland class in these studies was marsh (roughly 68 times, which includes marsh zonal and vegetation classifications), bog (roughly 45 times), swamp, fen, wetland, shallow-water, emergent, shrub, forested, and scrub-shrub. The least common wetland classes included mangroves, mudflats, and tidal flats. Refer to Section 5.4 for more discussion relating to wetland classification systems.
Figure 11 shows yearly trends in wetland publications. The number of studies focusing on wetland classification in North America has significantly increased over the last 40 years. A small number of papers were published in the early 1980s as well as between 1990 and 1996, although none were published from 1985 to 1990. Starting in 1996, papers were published every year until the present, following an increasing trend. After 2010, almost two-thirds of the total 157 papers were published, and 2018 was the year with the most papers published, at 25 total papers.

4.2. Wetland Classification and Data Type

Remote sensing data provide several advantages for wetland classification, including spatial coverage, repeatability, visualization of inaccessible areas, and time- and cost-efficiency. Early remote sensing studies have commonly used passive multi-spectral optical data. However, this type of Earth observation data is ineffective under cloudy or low-light conditions. Therefore, active sensors such as Synthetic Aperture Radar (SAR) have recently been introduced as valuable data sources for wetland mapping. SAR sensors include RADARSAT-1 and RADARSAT -2, JERS, ALOS and ALOS-2, and TerrSAR-X.
Of the three common data types applied in wetland classification studies (see Figure 12) in North America, most studies used a single data type of optical (61 studies) or radar (33 studies), or dual combinations of optical and radar (22 studies), or optical and elevation data (17 studies). A total of 14 studies used a triple combination of optical, radar, and elevation data. Elevation data only and the combination of radar and elevation were the least commonly applied data types, at 6 and 4 studies, respectively.
As shown in Figure 13, the median overall accuracy of the various data types and data type combinations (Figure 12) all achieve results greater than 80%. The lowest median overall accuracy is achieved by radar data only, and the highest median overall accuracy is achieved by the triple combination of optical, radar, and light detection and ranging (LiDAR) studies using radar only achieved the greatest range of results, from 97% overall accuracy to 61%. All data types with the exception of the radar + LiDAR combination achieved overall accuracies greater than 95%. For more discussion relating to data types used in wetland classification, refer to Section 5.7 and related sub-sections.

4.3. Wetland Classification and Sensor Type

In 157 North America wetland classification studies, 19 types of sensors were used, all of which are illustrated in Figure 14. Landsat followed by airborne platforms and RADARSAT-2 are the most commonly used sensors. Least common sensors include GeoEye and SPOT. All studies using Unmanned Aerial Vehicle (UAV) sensor data apply it alone, unlike the studies using Sentinel-1, Sentinel-2, and GeoEye sensors which, based on the results of this review, only use them in combination with multiple other sensor data sources. All other sensors are applied in both single-and multi-source contexts.
Figure 15 shows the overall accuracies of 17 of 19 sensors. GeoEye and SPOT sensors were excluded here because they were applied in less than three studies. In general, the sensors show a diverse range of median overall accuracies. ALOS-2, RapidEye, and TerraSAR-X have the highest median overall accuracies, followed by ALOS-1, ASTER, RADARSAT-2, and WorldView. The sensors with the lowest median overall accuracies include ERS, IKONOS, JERS, and RADARSAT-1. UAV and TerraSAR-X delivered the greatest range of results, while Sentinel-1 and -2 provided the smallest range.

4.4. Wetland Classification and Spatial Resolution

Spatial resolution is a measure of the smallest object resolved by the sensor, and it is typically expressed as pixel size. Accordingly, remote sensing data are categorized into three main classes based on spatial resolution: high (<4 m), medium (4 m to 30 m), and low spatial resolution (>30 m). Figure 16 shows the median overall accuracies obtained by studies using high, medium, and low resolution. As expected, the potential for achieving higher overall accuracies increases with spatial resolution. Additionally, studies applying lower resolution imagery produced a greater range of overall accuracies versus studies using medium resolution imagery, which produced a greater range of overall accuracies versus studies applying higher resolution imagery. However, it should be taken into consideration that a greater number of studies used lower resolution imagery versus high and medium resolutions.

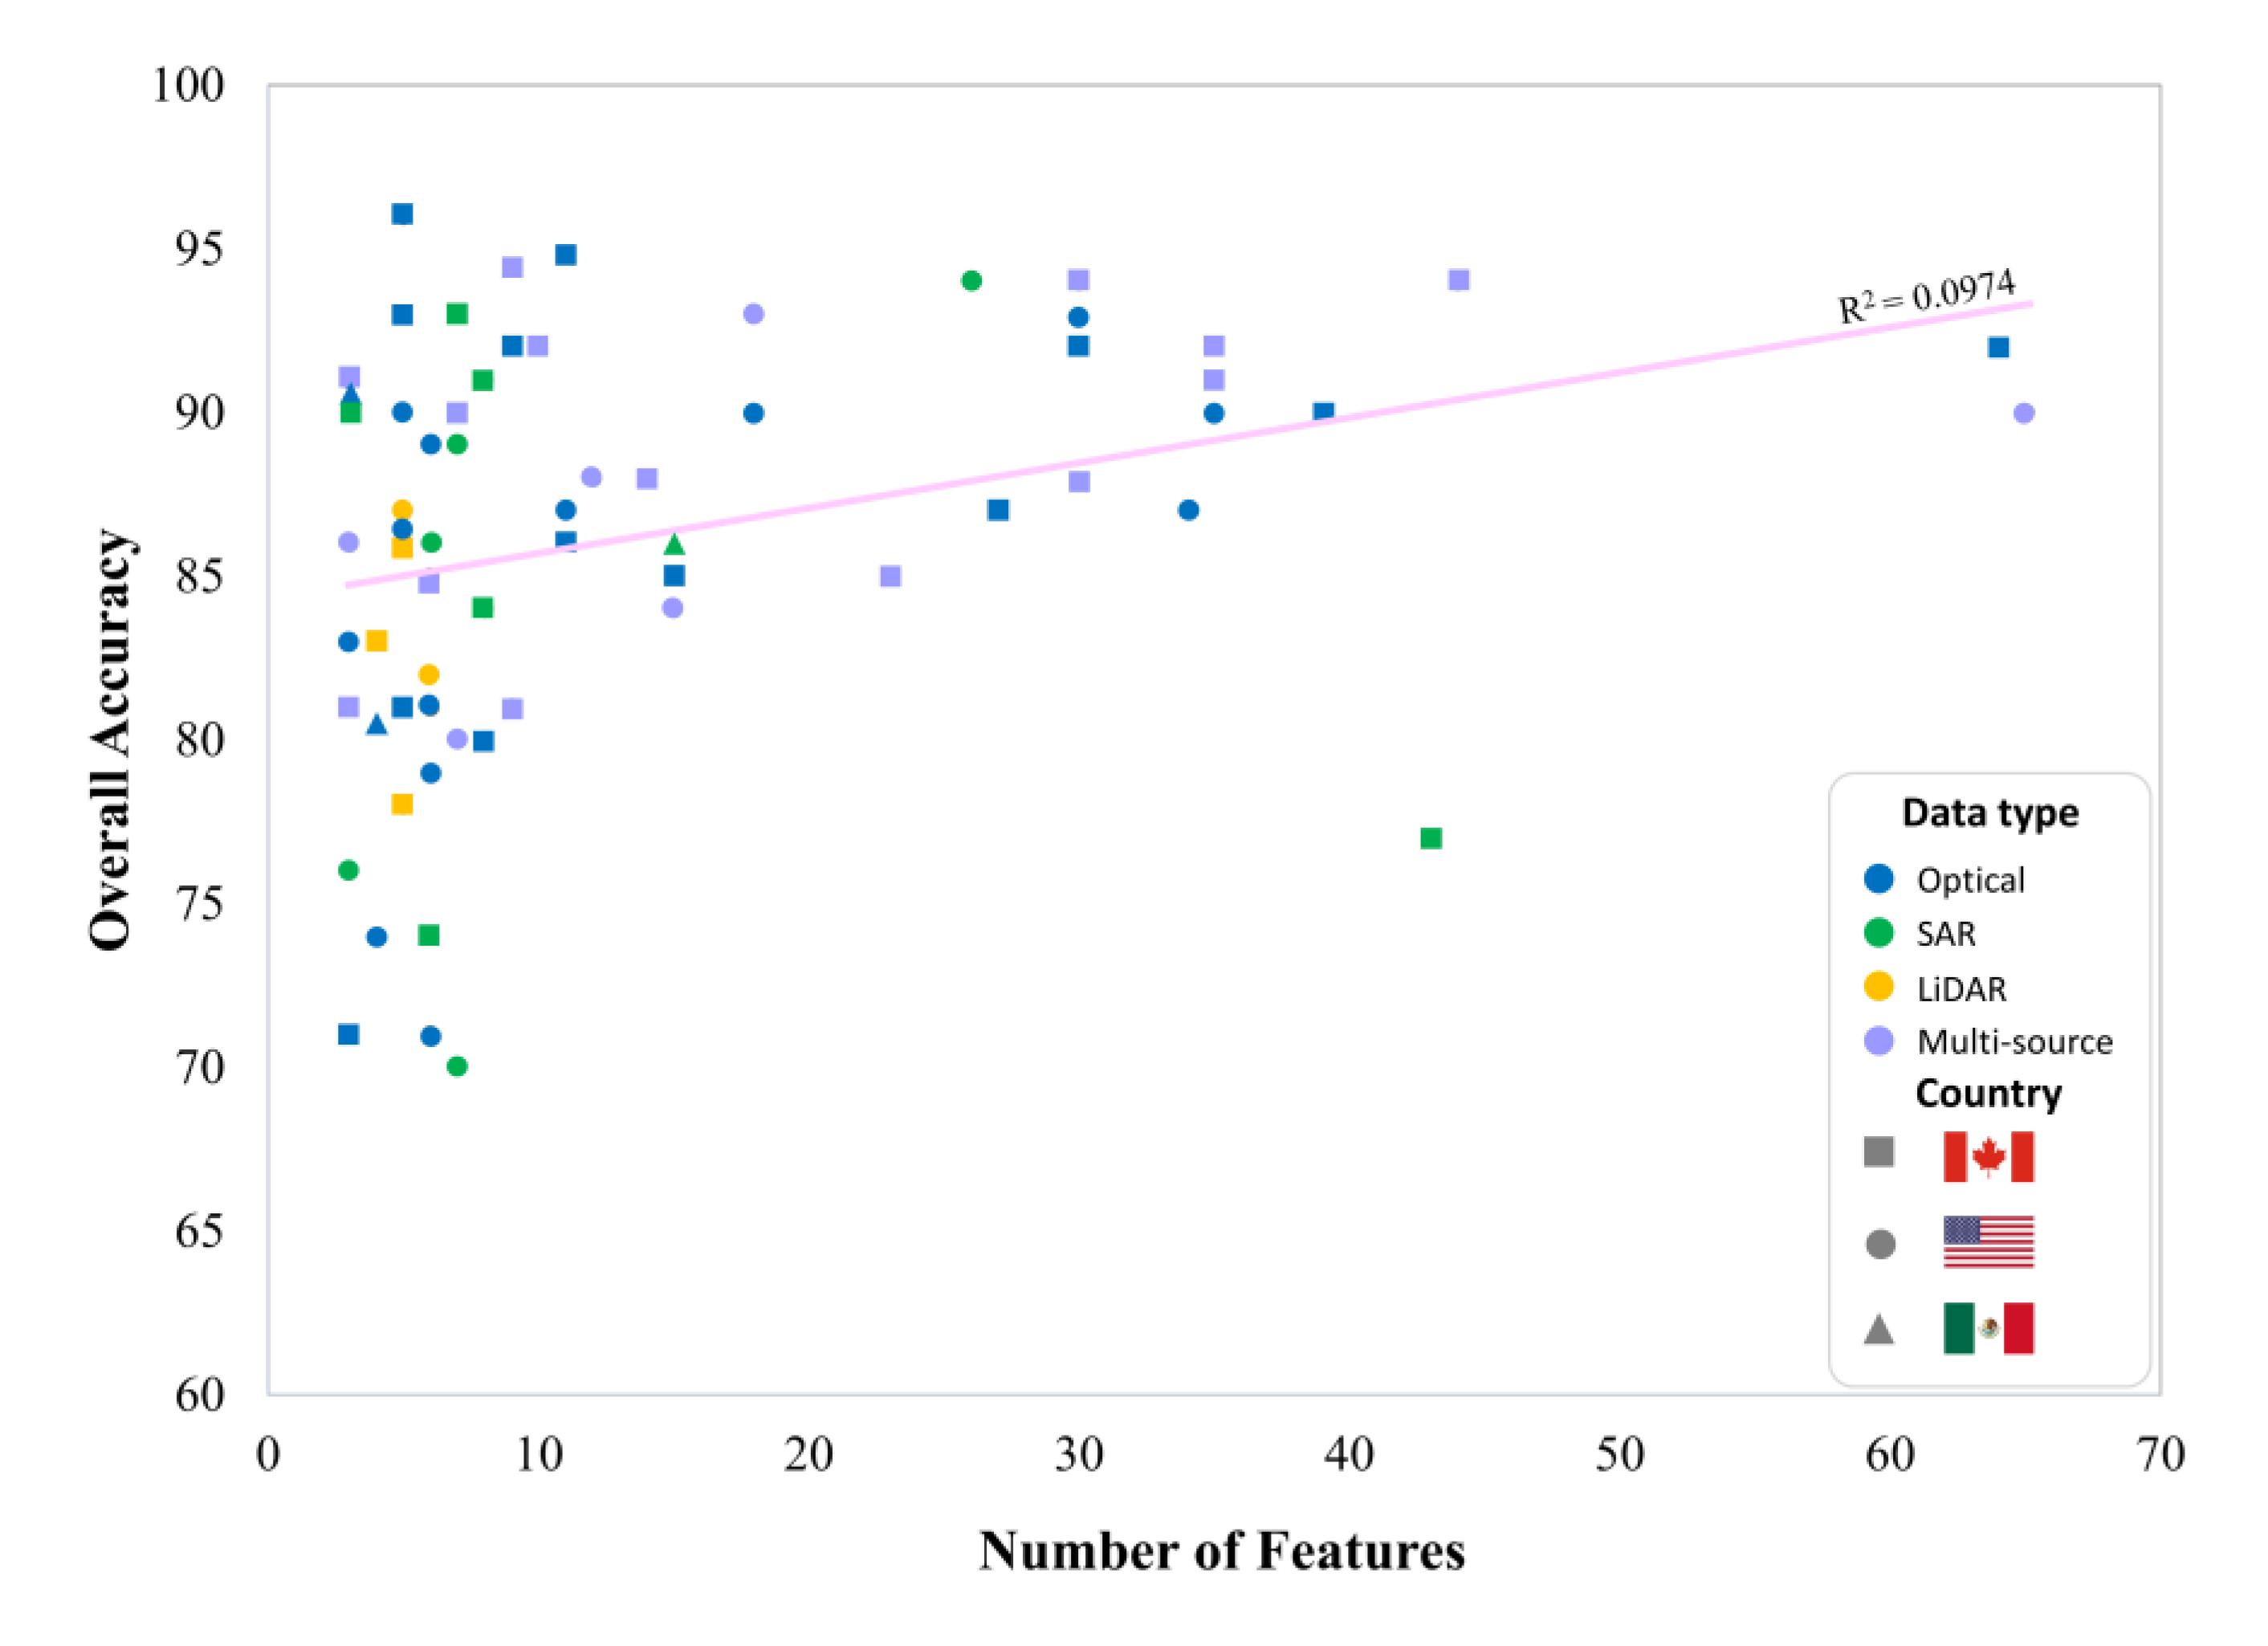
4.5. Wetland Classification and Number of Features

Traditional wetland classification methods only applied the original bands provided by remote sensing data, including the red, blue, green, and near-infrared among others. However, extracting various features (various measurable properties of the image) from these bands, including but not limited to band ratios, indices, textural and statistical characteristics and others, and incorporating them into the classification algorithm has been shown to improve classification accuracy. Figure 17 presents the correlation of overall accuracy and number of features used in wetland classification. In general, there is a positive trend, meaning that as the number of features increases, the overall accuracy increases. However, note that this trend is skewed because of the limited number of studies with a very large number of features. The cluster of studies located on the left side of Figure 17 shows that most studies applying 10 or fewer features produced overall accuracies ranging from 70% to 95%. Moving along the figure to the right, there is a trend showing that an increase in the number of features between 10 and 70 generally results in increasing overall accuracy.

4.6. Wetland Classification and Number of Classes

The availability of high spatial and spectral resolution remote sensing data as well as high-performance computing resources allows remote sensing experts to distinguish wetland classes that are more similar to one another. It is not surprising that discriminating wetland from non-wetland classes using remote sensing data is often easier than distinguish similar wetland types, such as bog and fen. Figure 18 shows the correlation of overall accuracy and the number of classes in the final output. As seen, there is not a clear relationship between the number of classes and resulted overall accuracy (R2 = 0.0070). However, most studies applied classification to distinguish the lower number of classes.

4.7. Wetland Classification and Classification Methods

The main objective of wetland classification based on remote sensing imagery is typically to answer the following questions: (1) Where are wetlands located? (2) What kinds of wetlands are present? (3) What number and area of wetlands are present? As such, different classification methods have been proposed for wetland classification over the years. Specifically, these classification approaches use spectral and/or spatial information represented by pixels or objects in the image to categorize each individual pixel into different wetland types.
A total of 17 classification methods were used across the 157 wetland classification studies. Figure 19 shows the median classification accuracies for 11 of these methods. Six of these methods were excluded here, as they were applied in less than three studies. There was a range in the median overall accuracy for each classification method. Convolution Neural Network (CNN) had a median overall accuracy of 95%, followed by Random Forest (RF), Support Vector Machine (SVM), Classification And Regression Trees (CART), and Decision Tree (DT). Maximum Likelihood Classification (MLC) had the lowest median overall accuracy, (slightly over 70%) and K-Nearest Neighbor (KNN) had the next lowest median overall accuracy (slightly below 75%).

4.8. Different Strategies for Wetland Classification

In order to improve the result of wetland classification, and depending on the availability of high spectral and spatial resolution and multi-temporal remote sensing data, different classification scenarios can be defined such as object-based and multi-temporal image classification. In object-oriented methods, the geometrical, textural, and contextual information of wetland classes are included along with spectral content, which is otherwise the only content available in pixel-based methods. Multi-temporal data are another important source of information that often improves wetland classification results compared to single-date image classification.
Figure 20 shows the overall accuracy of four general wetland classification strategies: pixel-based versus object-based and single-date versus multi-temporal imagery. Object-based classification and multi-temporal imagery both exhibited greater overall accuracies than pixel-based and single-date, respectively. Additionally, pixel-based and single-date strategies had a greater range of over accuracy results and included the lowest overall accuracies.
In addition, the Mann-Whitney U-test [144] was employed to determine the statistically significant differences between various classification scenarios in this study. The Mann-Whitney U-test is a non-parametric test that allows two sample groups to be compared without making the assumption on samples distribution. The Mann-Whitney U-test revealed that the difference between the median of pixel-based and object-based image analysis was statistically significant (p = 0.00374 < 0.05). However, the p-value for the Mann-Whitney U-test of single-date and multi-temporal data is 0.1936, which is not statistically different.

5. Discussion

This systematic review demonstrates that there are a large number of wetland classification studies in North America using various remote sensing data and tools. Generally, the main purpose of a majority of these studies was to find an optimum data set and algorithm for determining the spatial distribution of different wetland classes.

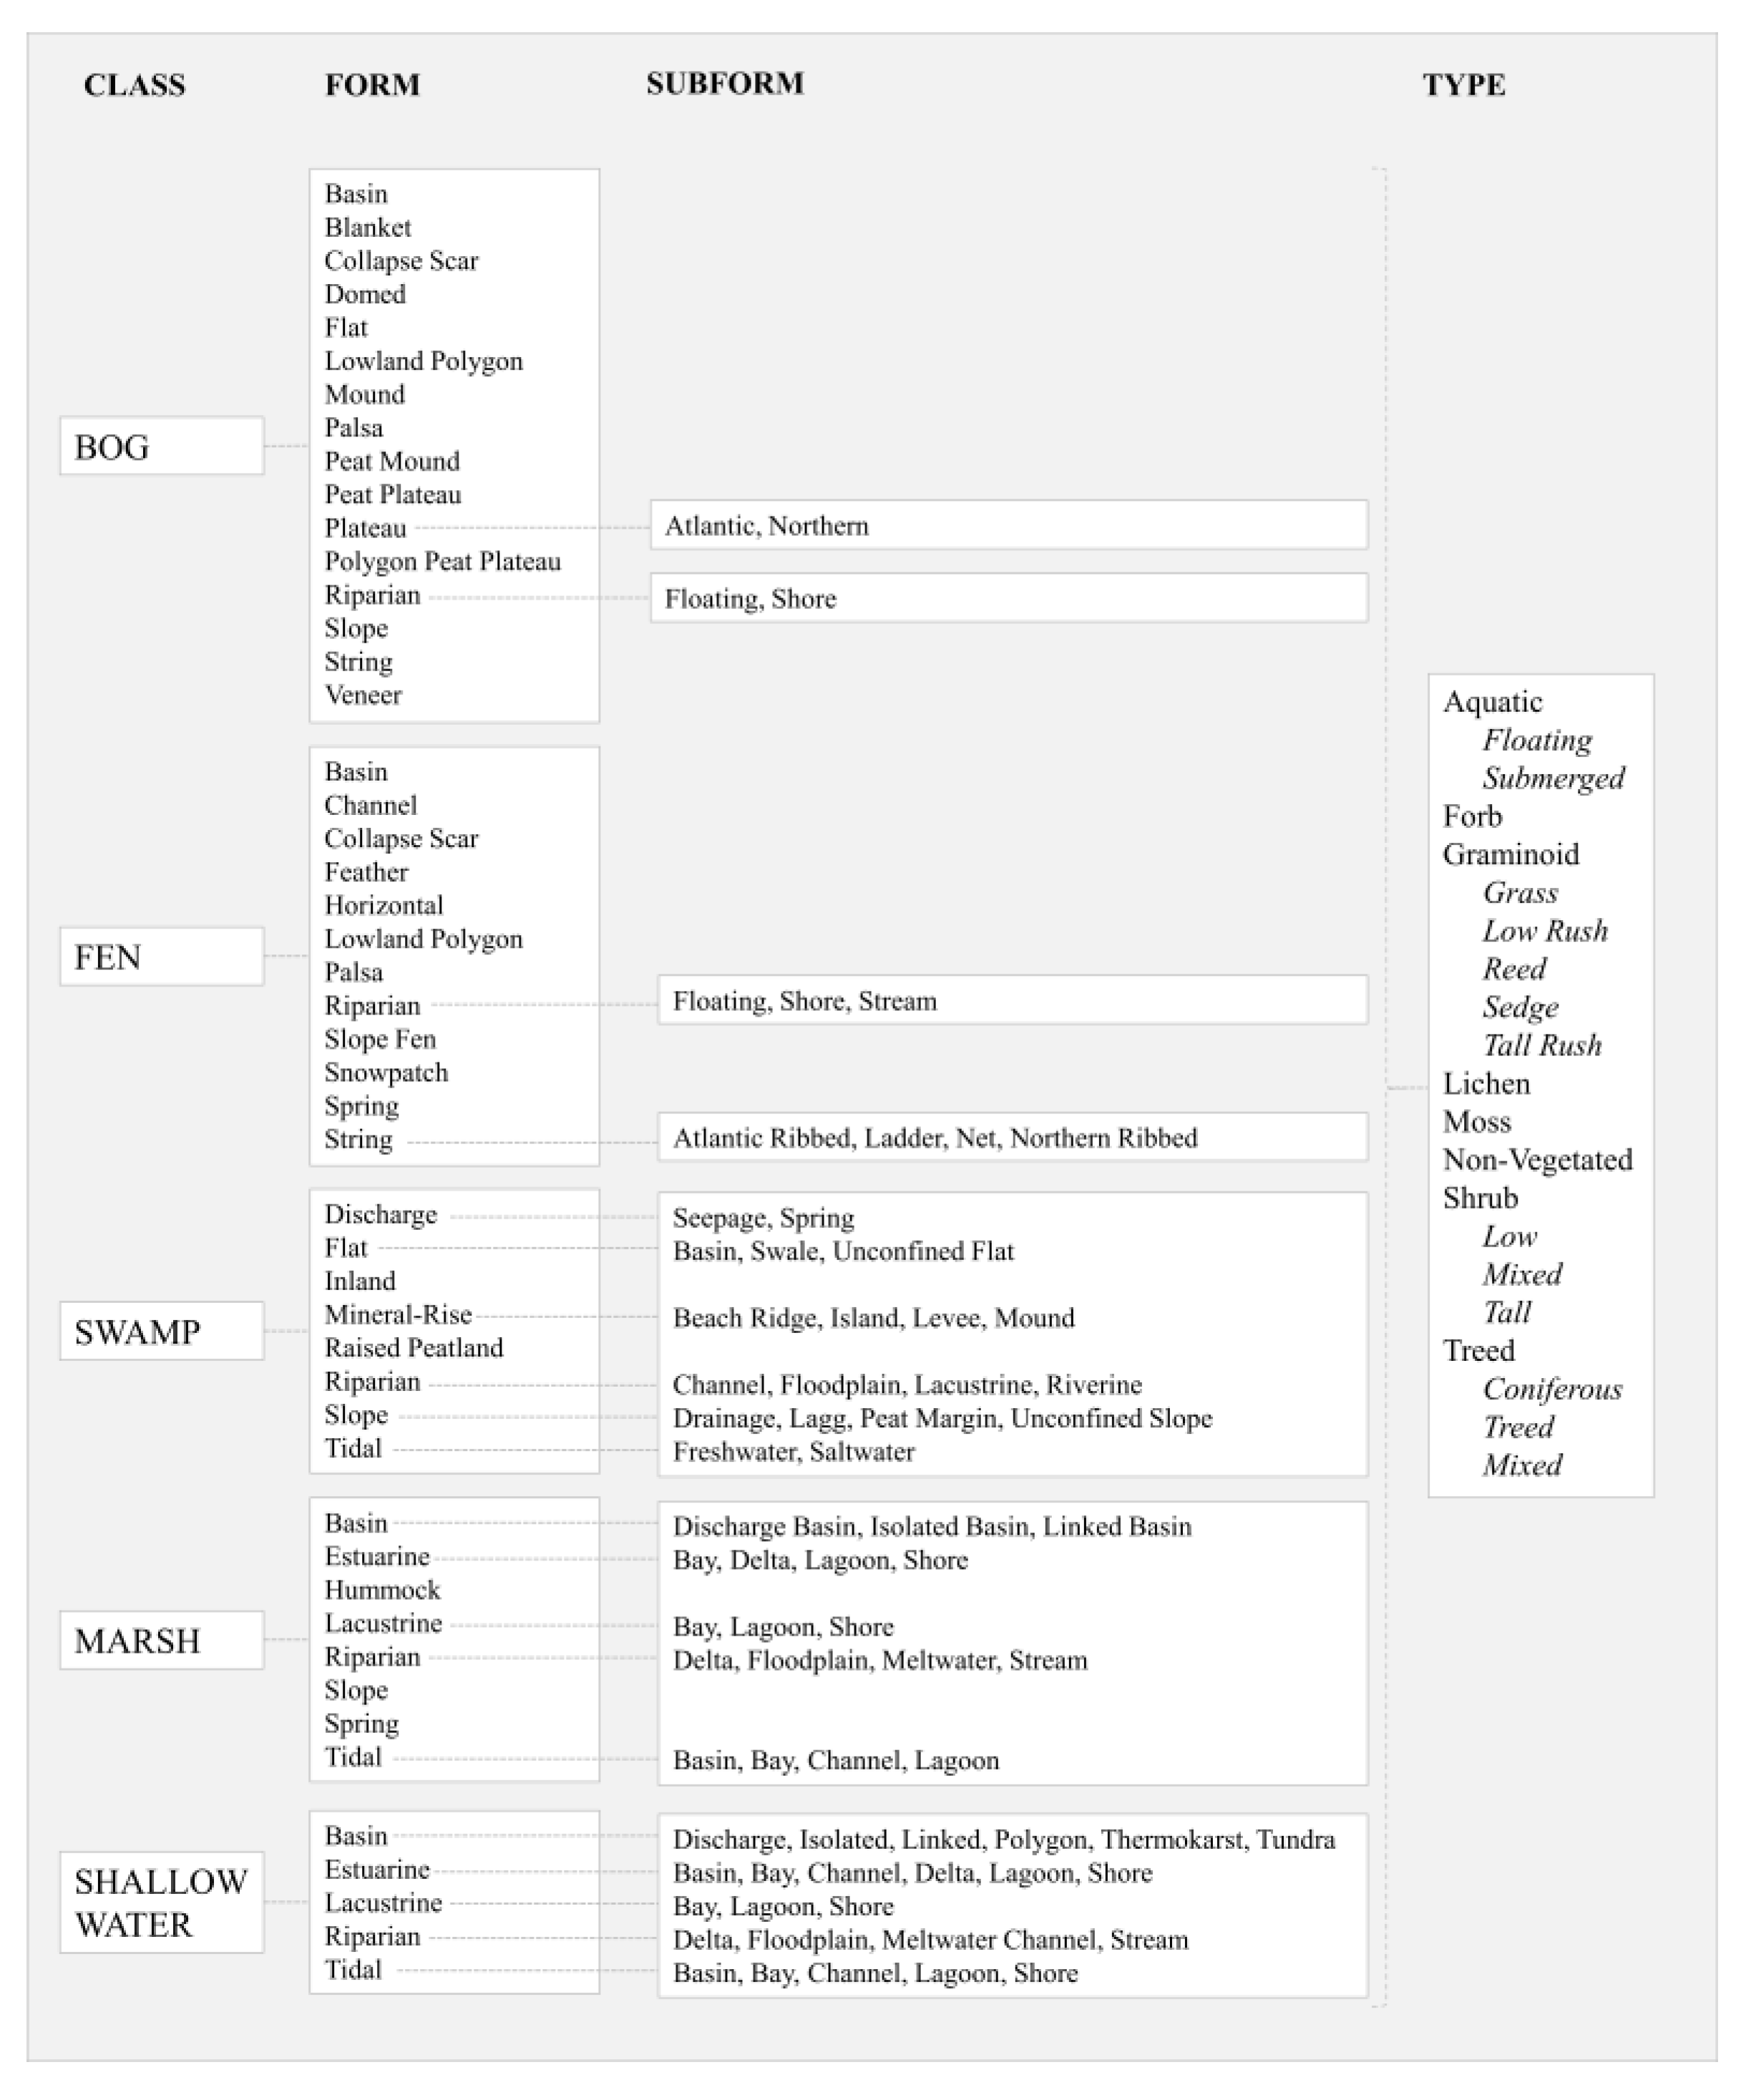
5.1. Wetland Classification in Canada

Various research in Canadian provinces have illustrated the capability of remote sensing data and tools for wetland classification [29,61,62,69,73,75,117,145,146,147,148]. However, there are a number of Canadian provinces where novel peer-reviewed wetland classification remains to be implemented, taking into account the provinces ecology, geomorphology, and anthropogenic landscape. For example, the Canadian Arctic has no peer-reviewed relevant research conducted within its borders. Though only covering an estimated 3–5% of the Canadian Arctic, wetlands here are ecologically important and are currently undergoing what is projected to be significant ecological impacts. Conducting relevant wetland research in the Canadian Arctic would contribute greatly to an increasing knowledge of Arctic wetlands and provide a basis for better addressing growing problems because of an increasing global temperature.

5.2. Wetland Classification in the U.S.A.

Florida has a total of 16 wetland classification studies, the greatest in the U.S.A., followed by seven studies in Minnesota. All of the studies captured by this meta-analysis, which applied UAV imagery, were conducted in Florida, a majority of which were focused on the everglades. UAV imagery was used in a number of contexts, including implementation of machine-learning [135], deep learning [149], object-based analysis [150], and the delineation of wetland vegetation communities [137]. Other Florida-based studies include applications of Landsat [33,138,151,152,153], high-resolution satellite imagery [142,151,154], and the evaluation of SAR features [34,131,133]. Topics of study in Minnesota include analysis of training data impacts [155], integration of LiDAR [121,156], and integration of optical, SAR, and elevation data [157,158,159,160].

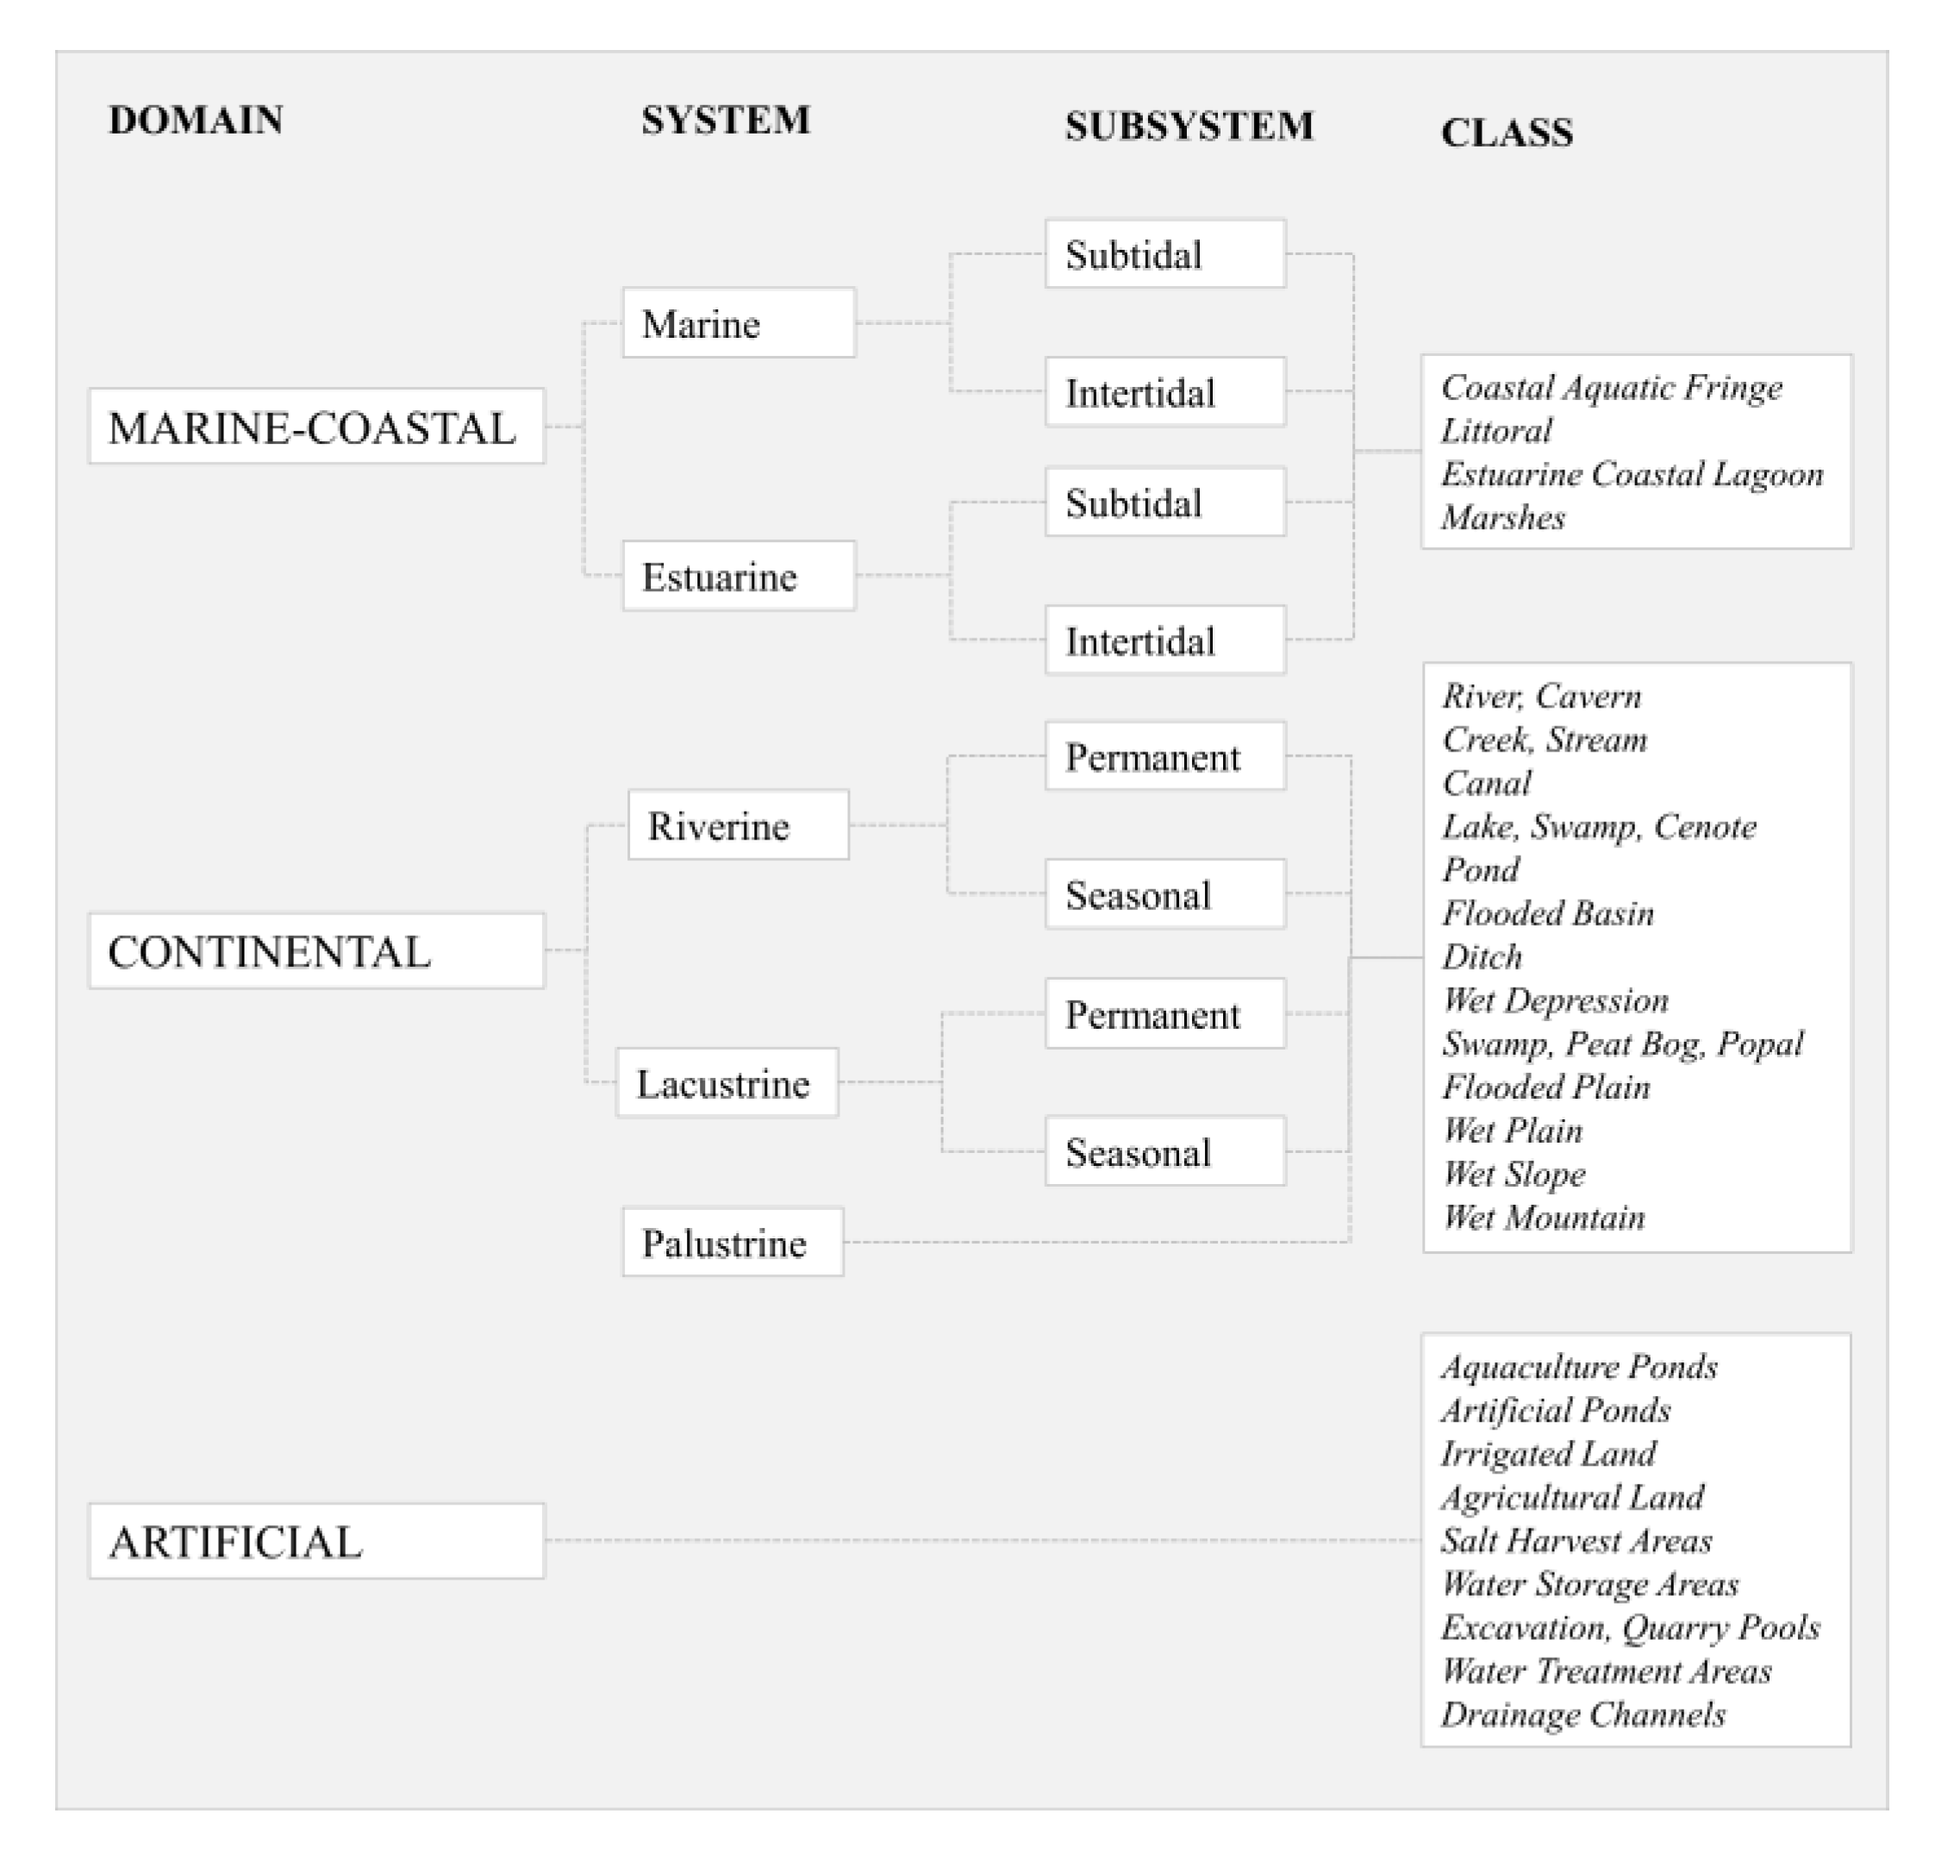
5.3. Wetland Classification in Mexico

Very few peer-reviewed wetland classification studies have been conducted in Mexico. Pope et al. [161] mapped wetlands using Landsat TM images in Chiapas Mexico to understand the population dynamics of malaria-carrying mosquitos and [162] used RADARSAT-1 data to classify marsh wetlands in Tamaulipas. Most recently, [163] used Landsat Enhanced Thematic Mapper imagery and aerial photos to map wetland vegetation and assess ecosystem functions and services in the Colorado River delta. The general lack of research in this country proves to be a notable knowledge gap given that Mexico contains wetlands of great ecological and economic importance [164,165]. More classification studies conducted here could provide essential information on these valuable ecosystems and perhaps aid in improving related protection-related policies.

5.4. Application of Wetland Classification Systems

Many of the studies reviewed by this meta-analysis defined wetland classes using previously designed wetland classification systems, including the CWCS in Canada and the Cowardin system in the U.S.A. However, differences in terms and definitions across classification systems makes it difficult to compare research results across countries and sometimes even across provinces or states. For example, the Cowardin system defines classes based largely on association with larger hydrological systems (i.e., lakes, rivers estuaries and oceans). This differs from the CWCS, which defines five wetland classes based largely focused on vegetation composition. For example, a wetland classified as a bog and a wetland classified as a fen, using the CWCS, may both be referred to as a palustrine system dominated by moss and lichen using the Cowardin system.
Although differences between the classification systems are understandable given different purposes and funding levels, it makes it difficult to obtain a cohesive understanding of wetlands at a continental or global level. A necessary next step to not only promote continental-scale wetland management and conservation, but to improve the results of wetland classification using remote sensing across North America would be to devise a classification system that consolidates the country-based systems. Future efforts could be dedicated toward producing a classification system applicable at a continental scale. This would allow for greater ease in comparing and tracking wetland resources across country boundaries. It would also allow for the assessment of wetlands at a grander scale, which is important given the global scale of human-related impacts, such as climate change, on wetlands.

5.5. Reference Data

Of the reviewed studies, the description of the procurement and/or production of reference (e.g., training or calibration/validation) data were varied, and as a result, it was difficult to assess trends and perform comparisons. This is in contrast to the description of other remote sensing data, such as imagery, which is often described in a standardized way in terms of resolution, date of procurement, preprocessing, etc. However, this discrepancy is understandable given that reference data are not as simple to obtain and may be collected from multiple sources that applied different data collection standards. For example, some reference data may have been visually interpreted from imagery, and other data may have been collected during field campaigns. Similarly, data collection may have been originally been carried out for non-remote sensing purposes. Parameters of interest in descriptions of wetland classification reference data include classes of interest, collection date, spatial scale, how the data were collected, how the data were prepared or modified, how much data in total and per class, methods for division into testing and training groups for validation, and the spatial independence of the data.
Many studies described how reference data obtained from previously developed datasets, such as the NWI, were altered to better meet research purposes, such as checking to ensure that the data was up to date when using recent imagery, etc. [166]. However, fewer studies described how field-collected ground-truth data were suitably transformed for input into a remote sensing methodology. Commonly absent as well were descriptions on how reference data were divided into testing and training groups in supervised classification studies. It is important that information on the development and processing of reference data be well communicated in a research publication because any issues present in the reference data can propagate throughout the methodology, ultimately being reflected in the classification results and reported accuracy of the dataset.

5.6. Wetland Classification Methods

Early wetland mapping studies in North America widely applied unsupervised clustering, such as K-means [161], ISODATA [167] and C-mean [168], as well as supervised approaches, such as Maximum Likelihood Classifier (MLC) [169,170]. This is largely because these classifiers were commonly available at that time [171]. The next generation of well-known classifiers used in wetland mapping included decision tree-based classifiers [65,172,173,174,175], Artificial Neural Network (ANN) [176,177,178], Support Vector Machine (SVM) [179,180], and later Random Forest (RF) [29,30,172]. Since these classifiers are non-parametric, they do not need input data to be normally distributed. This is especially beneficial when various sources of input data (e.g., spectral, geometrical, textural, and vegetation indices) are incorporated into the classification scheme to improve the accuracy of classification. Significant improvements were later observed when object-based classification was introduced as not only spectral but spatial and contextual features. [61,72,133,152,155,157,181,182,183,184,185]. Recent studies examined the ability of deep learning models and, in particular, the Convolutional Neural Network (CNN) to improve the accuracy of wetland classification [76,186,187]. Generally, CNN models are more common in remote sensing applications than are other deep learning methods such stacked autoencoder (SAE) and deep belief network (DBN). This is because CNNs have the capability to maintain spatial relationships in different processing levels, as spatial filtering takes place in each layer without flattening data to a vector form [77]. In contrast, the spatial relationship between neighboring pixels is flattened and concatenated to spectral data in the first part of the model. Although spatial information is incorporated in these models, the spatial relationship between pixels is lost in a vector form. Table 3 presents the most cited papers that studied wetland mapping in North America based on the number of citations, which are standardized to reflect elapsed time since publication. As seen, RF and CNN received more attention among other classification methods for wetland mapping in North America.

5.7. Data Types for Wetland Classification

Remote sensing platforms can be categorized as ground, airborne, or satellite based. Ground-based platforms include UAVs, while airborne include aerial photography, airborne SAR, and LiDAR. Satellite platforms include many space-borne sensors such as Landsat. UAVs are the least commonly used platforms in North American wetland classification studies. They have only been applied in four of the 157 studies reviewed, which are all located in Florida. UAV imagery has the benefit of being high in spatial resolution; however, some drawbacks include its cost and coverage. UAV is best used when classifying wetlands in a small area or when classifying wetland vegetation down to the level of growth form or species [135,137]. UAV has limited applicability at regional scales. Although it has recently become feasible for UAV sensors to acquire data using multi-spectral and hyperspectral sensors, most of the commonly used UAVs are limited to three, or at best, four spectral bands (visible and NIR). This relatively low spectral resolution, as well as the limited inclusion of bands outside the visible portion of the electromagnetic spectrum, restricts the utility of UAV data. Importantly, UAVs can play an important role in the collection of reference data particularly in areas where ground access to a wetland site is difficult.
Compared to other types of remote sensing platforms, satellite-based platforms are most commonly used for wetland classification, specifically optical satellite data. This is in large part because optical satellite imagery has been available since the 1970s, and it has recently been available made available to the public for free (e.g., Landsat and Sentinel data). Moreover, much optical imagery requires less preprocessing than other data types such as radar or LiDAR, thus requiring less technical expertise to apply. Additionally, processing software packages (either commercial or open access ones) for optical imagery are more widely available than SAR or LiDAR processing software.

5.7.1. Optical Data for Wetland Classification

Optical sensors collect imagery in the visible, near-infrared, shortwave infrared, and thermal-infrared regions of the electromagnetic spectrum [96]. Previous studies demonstrated the relatively low contribution of visible bands for discriminating wetland classes, as these classes are visually very similar in the context of the wetland vegetation [70,76,77,187]. However, the near-infrared band proved to be a different case. Mutanga in [192] carefully examined WorldView-2 spectral bands to determine their relevance for wetland mapping and demonstrated that the near-infrared band could be more useful for wetland vegetation mapping due to the high reflectance of green vegetation at that wavelength [192]. They also reported that a red-edge band, which is located between the red and near-infrared bands, is important for wetland studies. However, this band is not available in all optical sensors. The red-edge band was found to be sensitive to biochemical and biophysical characteristics of wetland vegetation. Additionally, water deficiency in vegetation biomass can be captured using the red-edge band [192]. Imagery collected in the shortwave-infrared region of the electromagnetic spectrum showed high sensitivity to soil and vegetation moisture and, as such, they could be useful for wetland studies. Overall, the low spatial resolution of optical data collected in the thermal-infrared region makes it less useful for wetland studies [187].
The most frequently applied optical imagery in North American wetland classification studies by far is obtained via Landsat sensors. This is to be expected, given that Landsat imagery is freely available and has a large historical database, allowing for the easy application of a multi-temporal methodology. Although far less common than Landsat, Sentinel-2 imagery also provides a free optical data source, but at a higher resolution (10 m versus the Landsat 30 m). Importantly, Sentinel-2 provides additional bands, including Red-Edge, which are effective in wetland mapping (discussed above). Studies using Landsat imagery have a median overall accuracy of above 85% which is comparable to studies that applied Sentinel-2 (see Figure 14). However, studies that applied Sentinel-2 imagery seem to have a greater chance of obtaining higher accuracies versus those applying Landsat imagery, although much fewer studies used Sentinel imagery, as it only been available since 2015.
Within the peer-reviewed literature, high spatial resolution optical satellite data, provided by sensors such as WorldView and GeoEye, are less commonly applied in wetland classification studies compared to lower spatial resolution data, such as Landsat. This is likely due to the higher cost and reduced availability of the higher spatial resolution datasets. However, studies applying these high-resolution data can obtain, on average, higher overall accuracies. For example, Campbell and Wang in 2019, classified salt marsh wetland vegetation at a resolution of 1 meter using a combination of Worldview-2, Worldview-3, and LiDAR data, obtaining an accuracy of 92.75% [182]. McCarthy et al. (2015) also examined the applicability of high-resolution multi-spectral optical imagery (WorldView-2) for wetland mapping in two regions of interest in Tampa Bay Florida, USA. As such, they reported that the multi-spectral bands of WorldView-2 (2 m) achieved a 36% improvement in overall accuracy compared to 30 m Landsat-8 [154]. Note that most high-resolution studies tend to focus on wetland vegetation classes versus broad wetland classes, as this type of data is capable of capturing detail down to the level of plant functional groups.

5.7.2. SAR Data for Wetland Classification

Optical sensors fail to map wetlands under certain conditions (e.g., a cloudy day) and are insensitive to the physical characteristics of vegetation. As a result, wetland classification studies using SAR data have become increasingly prominent in North America, particularly in Canada. Based on the results of this review paper, SAR sensors appeared approximately 15% more frequently in Canadian wetland studies than in the U.S.A.. This is likely due in part to the fact that RADARSAT is a Canadian satellite series, and these data are often easier or less expensive to obtain by Canadian scientists. This pattern may also be partially explained by the fact that SAR data can be collected regardless of solar illumination, and much of Canada lacks daylight during part of the year. The advantages of SAR sensors, such as collecting data in all weather conditions as well as penetrating through cloud and the vegetation canopy, make them a unique source of data for wetland classification [193]. Wavelength, polarization, and incidence angle are the main characteristics of SAR sensors, and these features determine the backscattering response of different wetland types. To date, most SAR satellites have operated in X-, C-, and L-bands with wavelengths of approximately 3.1, 5.6, and 23.5 cm, respectively. Data collected by X-band TerraSAR-X, C-band ERS, RADARSAT, and Sentinel-1, as well as L-band JERS and ALOS PALSAR has been widely used in wetland mapping studies in North America (see Figure 13). Among 73 studies that used SAR data, C-band was the most frequently used band (66%) followed by L (19%) and X (5%). Notably, the most common source of SAR data in North American wetland classification studies comes from the RADARSAT-2 sensor (see Figure 13), which was launched in 2007. Other commonly applied SAR sensors include ALOS PALSAR-1 and RADARSAT-1 [32,141,194,195].
Several studies have demonstrated that L-band is more appropriate for mapping forested wetlands, while C-band is preferred for classifying herbaceous wetlands [160,172,195]. This is attributed to the longer wavelength of the L-band signal compared to the C-band signal, making it advantageous for woody wetlands. Overall, most studies have reported the superiority of L-band compared to C or X, although a few studies have demonstrated that C-band SAR data could be useful in leaf-off and low biomass conditions [196,197,198]. This fact illustrates that the selection of an appropriate SAR frequency to map different wetland types presumably depends on several factors, such as plant structure and phenology. Nevertheless, the integration of multiple wavelengths in wetland studies typically results in significant improvements in classification results, as reported by [29]. In particular, that study proposed a novel hierarchical classification scheme and compared the capability of different SAR wavelengths for wetland mapping. Several classification scenarios were designed based on data collected from X-band TerraSAR-X, C-band RADARSAT-2, and L-band ALOS-2 sensors. The results demonstrated that the synergistic use of multi-frequency data is advantageous compared to single-source data.
Another characteristic of SAR data that plays a vital role in wetland mapping is polarization. The relationship between the type of scattering mechanism of wetland classes (specular, double-bounce, and volume) and polarization is complicated. As reported by several studies, HH is the most appropriate polarization channel for wetland mapping [96,118]. Notably, the HH polarization is more sensitive to double-bounce scattering occurring within wetland vegetation with vertical structure, such as freshwater marshes and swamp forest. In particular, the HH polarized signal is better able to distinguish wetland vegetation from water under calm water conditions [145,189]. This is because HH is less sensitive to waves created from wind; thus, open water results in less scattering in HH compared to VV and HV. Consequently, HH produces the greatest backscattering differences between wetland vegetation and water [199]. Although VV polarization is not as effective as HH polarization for mapping flooded vegetation, it is useful for mapping herbaceous wetlands (e.g., bog) in their early stages of development, especially low and sparsely vegetated areas. Cross-polarized channels (HV and VH) are more sensitive to the structure of vegetation, and they occur due to the volume scattering inside the vegetation canopy that tends to depolarize the signal and has been shown to be effective for discriminating herbaceous from woody wetlands [196].
Recent studies mostly focused on the application of multi-polarization SAR data for wetland mapping because a single polarized signal is less useful for discriminating complex wetland classes. Importantly, multi-polarized SAR data often allow for the application of advanced polarimetric decomposition techniques, which are of particular interest for discriminating complex wetland classes. These decomposition parameters increase the accuracy of wetland classification by incorporating more information about the scattering behaviors of different wetland types into the classifier [190,200]. Several studies demonstrated the capability of different decomposition methods, including Cloud and Pottier [201], Freeman-Durden [202], Van Zyl [203], Yamaguchi [204], An-Yang [205], and H&W [206] for wetland mapping. For example, Brisco et al. [118] compared the capability of different decomposition methods, including Cloude and Pottier, Freeman-Durden, Pauli, and Van Zyl, and they found that Freeman-Durden was the most effective decomposition approach for delineating wetland land-cover types. Similarly, [190] studied the ability of different decomposition approaches, namely Cloude and Pottier, Freeman-Durden, Van Zyl, An-yang, and Yamaguchi decompositions to discriminate complex wetland classes. This study found that Yamaguchi decomposition parameters were the most important features for wetland landcover mapping among others. They reported that the superiority of Yamaguchi decomposition compared to Freeman-Durden decomposition is because of the existing man-made structure in the study area.
The scattering behavior of different wetland types also varies with incidence angle. Overall, relatively steep incidence angles are preferred for mapping flooded vegetation given their deeper penetration depth [118,206,207]. Moderate incidence angles could also be useful when the imagery is collected with high spatial resolution. Marti-Cardona in [208] examined the effect of different incidence angles for wetland mapping using 43 ASAR images of Doñana wetland in Spain [208]. They concluded that steep to mid-incidence angles were appropriate for wetland mapping in an area with high elevation. Intermediate incidence angles were the most suitable for distinguishing bare soil from deep water in the marshland areas. Shallow incidence angles were suggested for accurate wetland delineation during growing seasons in medium elevation zones. Nevertheless, the application of images close in time with varying incidence angles was found to be optimum for wetland mapping [208]. This is in agreement with the results of [75], who reported that single-date and single-incidence angle SAR data could not accurately classify all wetland types. Despite the results of previous studies, the effect of different incidence angles for wetland studies under different environmental conditions needs to be further studied in order to reach a more decisive conclusion.

5.7.3. Optical and SAR Data Integration for Wetland Classification

The fusion of optical with SAR data has been of interest to wetland classification studies since the mid-1990s, following the availability of multiple SAR sensors, including JERS-1 and RADARSAT-1. In general, overall accuracy is higher in cases of the integration of optical and SAR data than in cases where either are used alone (Figure 12). This is to be expected, given that both SAR and optical sensors are capable of capturing different types of information related to the spectral and physical attributes of wetlands. In turn, this allows for improved wetland class discrimination. Additionally, the ability of SAR to penetrate cloud cover can allow for increased multi-temporal ability versus optical alone.
Many studies have found that a fusion of optical and SAR can effectively discriminate between classes that have typically proven difficult to separate using multi-spectral information exclusively. Franklin et al. [145], for example, demonstrated that a fusion of Landsat-8 and RADARSAT-2 data in an object-based classification resulted in better producers’ accuracies for bog peatlands and fen peatlands than either data type alone. Bog and fen have been shown to be difficult to discriminate due to their ecological similarities, and the inclusion of SAR data may improve bog/fen discrimination results.

5.7.4. Elevation Data for Wetland Classification

Low-resolution digital elevation models (DEM) have been used in several wetland studies [147,209,210]. Many studies use lower resolution DEMs because they are relatively inexpensive or freely available, as is the case with the Canadian DEM or the USGS National Elevation Dataset, which are available nationally at resolutions between 10 and 30 m (and 3 m in some regions of the US). However, an increasing number of studies are applying the higher-resolution LiDAR data, although it can be more costly. LiDAR is capable of providing three-dimensional information on the Earth’s surface by measuring return signals from different surfaces at resolutions as high as 10 cm. From LiDAR data, a number of elevation- and structure-related features of wetlands can be captured. Notably, LiDAR can penetrate the vegetation canopy and allows for the characterization of wetland vegetation structure, which is much less feasible using optical satellite imagery or when using SAR in high-biomass areas [211]. Several studies have examined and applied LiDAR data to wetland classification [123,127,146,212,213,214,215]. Millard and Richardson (2015) for example, classified peatland wetlands using various LiDAR derivatives [73]. Through a variable reduction analysis, 15 of 32 LiDAR derivatives were selected via Random Forest as the most important variables for peatland classification. These variables included maximum vegetation height, vegetation density, and elevation, among others. Lang et al. [216] investigated several LiDAR-derived metrics including topographic wetness indices and normalized relief among others to determine which were most effective for mapping forested wetlands. Their results supported the hypothesis that LiDAR derivatives are effective in improving wetland mapping predictive power and that the utility of different derivatives is largely controlled by geomorphology, lithology, weather, and anthropogenic alteration. Although LiDAR derivatives are often used to identify areas where wetlands are likely to occur, studies also commonly use DEM-derived masks of relatively high slope areas to reduce errors of commission in portions of the study area where wetlands are not likely to occur.
A less common, but often highly effective use of LiDAR, is based not on the timing of LiDAR signal return (i.e., elevation) but the strength of LiDAR returns. Along with information on elevation, LiDAR intensity is also often provided to users. Although these data are often largely uncalibrated, they can provide critical information regarding inundation status below the plant canopy [217]. This information is particularly helpful when mapping forested wetlands, which are the most common wetland type in the U.S.A., but they are also among the most challenging to detect. Although this information is not commonly available for large areas of North America, it can be used to enhance the accuracy of products with a much broader spatial extent through the calibration/validation of satellite derived products [218,219,220].

5.7.5. Multi-Source Data for Wetland Classification

The fusion of LiDAR with optical and SAR can produce the best overall accuracies compared to any data type alone or any other combination of data types. The results of this review show that studies using fusion data sets, including optical, SAR and LiDAR are comparable to the best results using any data type alone (Figure 12). The inclusion of LiDAR derivatives improved the overall accuracy results of a number of studies, including that of Franklin and Ahmed (2017), where the addition of a number of derivatives from 1 m LiDAR data produced an overall accuracy of 91% which was almost a 10% increase compared to the use of RADARSAT-2 and Landsat-8 data alone, and an improvement of about 5% over the fusion of both RADARSAT-2 and Landsat-8 [145]. The inclusion of LiDAR derivatives such as roughness, surface relief ratio, potential wetness, and various topographic indices specifically helped to improve the separability of bog and fen and swamp and upland, and the top five variables for separating each wetland class were composed of at least one feature from each data type. Jahncke et al. (2018) stated that the LiDAR DEM-derived data was the most important input into their wetland classification, explaining that topography largely controls the distribution of water and, in turn, largely controls the location of wetlands [213]. Additional considerations need to be made when using a multi-source approach, which requires the resampling of imagery spatial resolution to allow for image-to-image registration. Overall, there appears to be a weak negative relationship between spatial resolution and overall accuracy. As spatial resolution decreases, the overall accuracy increases.
Wetlands are dynamic features that can change in terms of inundation and soil saturation extent and vegetation phenology/composition within the span of months. This has made wetlands one of the more difficult landscape features to map. Traditionally, wetlands were often mapped using a single date of aerial photography. Although expert knowledge was often used to help infer average conditions, this could be challenging. However, more recently, the availability of numerous sensors and data types has allowed the dynamic nature of wetlands to be better represented through the use of data fusion and time-series methods. As discussed above, optical, SAR, and elevation data are all uniquely capable of capturing various traits of wetlands that are beneficial for wetland class discrimination and delineation. Ignoring one of these features may affect the possibility of adequately distinguishing wetland classes.
Datasets of interest for future research include Sentinel-1 and -2, LiDAR, and the RADARSAT Constellation Mission. Sentinel’s SAR and optical imagery, available since 2014 and 2015, represent a comparatively understudied source of free remote sensing data that offers a moderately high resolution at 10 m and a band that captures spectral information at the red edge, which has frequently been cited as an important feature for wetland classification [192]. Few studies have already examined the applicability of Sentinel data in wetland classification with successful results [146,148,221,222]. Given that only five of the studies captured in this review employ the use of Sentinel-1 or -2 data, these sensors represent a potential area of future wetland classification research. Similarly, although the data is not always freely available, the application of LiDAR in wetland studies is relatively understudied, occurring in only 13 studies captured in this review. Many of these studies emphasize the importance of LiDAR derivatives in their classifications. Currently, there are a number of sources of LiDAR data for the U.S.A., including Open Topography and USGS Earth Explorer, although coverage is patchy. Although LiDAR is a beneficial source of information for wetland classification, it is not likely that LiDAR data will be available for all of North America in the near future. Other potential sources of high-quality elevation data may be found via the upcoming EarthDEM [223], the development of which is based on methods previously used to produce high-resolution terrain DEMs for the arctic with resolutions varying between 2 and 5m. Finally, the RADARSAT Constellation Mission, launched in June 2019, offers C-band SAR, compact polarimetry as a polarization option, and a short 4-day revisit cycle, providing coverage over Canada with 350 km swaths. These studies [30,87,224] previously demonstrated the successful potential of RCM data for mapping.
Given the increasing availability of higher spatial resolution data, the increasing scale of coverage, and advancements in computing capabilities and speed, the last two years have seen research applying remote sensing methodology and cloud computing to the classification of wetlands at the scale of entire provinces and countries. For example, [148] recently produced a province-wide inventory map of wetlands in Newfoundland and Labrador using Sentinel-1 SAR data, Sentinel-2 optical imagery, and a Random Forest classification implemented in the Google Earth Engine (GEE). Additionally, Campbell and Wang in [225] demonstrated that GEE can effectively be used to assess changes in wetlands over large geographical areas and over long periods of time, as GEE allows for the effective and efficient use of large numbers of images. These studies represent a recent shift toward generating on-demand, large-scale classification maps, which were not previously possible given the difficulty of collecting, storing and processing large amounts of remotely sensed data. It is likely that additional wetland classifications will be implemented using cloud computing platforms, such as the GEE, in the future. Cloud computing represents an important area of future research [226]. To date, all land-cover mapping studies, including wetland mapping, have used machine learning algorithms to classify satellite imagery in GEE. In September 2019, Google announced a new integration of GEE with Google Cloud’s AI platform that allows remote sensing researchers to use deep learning models directly on GEE data. This platform builds a potential road to investigate the capability of deep learning models (e.g., Fully Convolutional Networks) for mapping wetlands on large scales.

6. Conclusions

This study was motivated by the popularity of wetland classification using remotely sensed data in North America, and it should support the advancement of wetland classification methods. It is important that the scientific community assesses historical methodological trends before deciding which approaches to pursue in the future. This article facilitates this analysis. However, the impact of classification on wetland conservation, restoration, and other important societal endeavors can also be magnified by considering application requirements and the logistical limitations of operational mapping programs when developing classification protocols. For example, some airborne imagery may not be widely available, and some protocols may be impractical to implement at the regional, yet alone national or continental scale. Furthermore, methods may work well at one study site, but not another. This broader perspective can also help guide the development of classification protocols.
This study produced a database with general and specific fields related to wetland classification generated from a meta-analysis of 157 scientific publications producing during the past 40 years. Several conclusions can be drawn from these data as follows:
  • The number of published North American wetland classification studies has been on the rise since the mid-1990s. This trend is expected to continue, given the increasing availability of quality remote sensing data, the launch of new remote sensing platforms, increases in computing capability, and increasing interest in wetlands in the context of climate change research.
  • Many locations in the U.S.A., Canada, and particularly Mexico offer novel locations for wetlands classification research. In particular, within the U.S.A. and Canada, areas that contain a lower density of wetlands and are further away from population centers have been mapped less frequently.
  • Landsat and RADARSAT-2 are the most commonly used optical and SAR datasets, respectively. This is likely partially due to their relatively long history and low/no cost availability.
  • Unsurprisingly, high correlation was observed between spatial resolution and wetland classification overall accuracy. This demonstrates that the higher spatial resolution of remote sensing imagery may increase the overall accuracy of wetland mapping, at least until some minimum threshold of resolution is met.
  • Object-based and multi-temporal image analyses provide a distinct advantage for wetland classification compared to pixel-based and single date image analysis. However, it should also be noted that object-based analysis can be challenging to employ at the national or continental scale.
  • Among different classification methods, CNN as a deep learning model, as well as RF and SVM, as machine learning algorithms are the most successful classifiers for wetland mapping.
  • Better overall accuracy is obtained when applying a fusion of data types, including optical, SAR, and elevation data versus using any of these data types alone.
  • Wetland classification studies in North America using Sentinel-1 and Sentinel-2 optical imagery is sparse despite being freely available, providing 10 m resolution and a red-edge band important for wetland classification. More research using these data are suggested. Similarly, LiDAR-derived elevation data provide high spatial-resolution information on elevation, which is an important contributor to wetland formation, but it is understudied compared to other data types. Therefore, more research using LiDAR is suggested.
  • Google Earth Engine offers an integrative platform for wetland classification via remote sensing. The very recent ability to apply deep learning models has opened up new possibilities for large-scale wetland classification research.
  • This review has demonstrated that much of Mexico and large parts of the U.S.A. and Canada have not had significant wetland classification efforts completed using remote sensing approaches. As the number of satellites continues to increase and data are made more widely available, there is the potential for more studies to be completed in these areas. Addressing these geographical gaps would facilitate continental-scale wetland analysis, which may be of particular help to migratory bird management and climate change research.
  • Wetland classification through remote sensing technology at a continental scale is indeed feasible given the development of machine learning algorithms and big data. This classification may be facilitated by the development of a continental-scale wetland classification system.
  • The future of wetland classification in North America will likely focus on the application of multi-sensor, multi-temporal data available via cloud-based applications, including GEE and Amazon Web Services (AWS).

Author Contributions

Conceptualization, M.M., F.M.; Formal Analysis, M.M.; Data Collection, M.M., J.E.G., F.M.; Writing—Original Draft Preparation, M.M., J.E.G., F.M.; Writing—Review & Editing, M.M., J.E.G., F.M., B.S., B.B., S.H., E.G., B.H., and M.L.; Visualization, M.M., J.E.G.; Supervision, M.M.; Project Administration, M.M.; Funding Acquisition, M.M. All authors have read and agreed to the published version of the manuscript.

Funding

This research was funded by Natural Resources Canada under Grant (NRCan-3000694092) to M. Mahdianpari.

Conflicts of Interest

The authors declare no conflict of interest. The findings and conclusions in this article are those of the author(s) and do not necessarily represent the views of the U.S. Fish and Wildlife Service.

References

  1. Davidson, N.C. How much wetland has the world lost? Long-term and recent trends in global wetland area. Mar. Freshw. Res. 2014, 65, 934. [Google Scholar] [CrossRef]
  2. Dahl, T.E. Status and Trends of Wetlands in the Conterminous United States 2004 to 2009; Department of the Interior; Fish and Wildlife Service: Washington, DC, USA, 2011; 108p.
  3. Moomaw, W.R.; Chmura, G.L.; Davies, G.T.; Finlayson, C.M.; Middleton, B.A.; Natali, S.M.; Perry, J.E.; Roulet, N.; Sutton-Grier, A.E. Wetlands in a changing climate: Science, policy and management. Wetlands 2018, 38, 183–205. [Google Scholar] [CrossRef] [Green Version]
  4. Serran, J.N.; Creed, I.F.; Ameli, A.A.; Aldred, D.A. Estimating rates of wetland loss using power-law functions. Wetlands 2018, 38, 109–120. [Google Scholar] [CrossRef]
  5. Holland, R.A.; Darwall, W.R.T.; Smith, K.G. Conservation priorities for freshwater biodiversity: The Key Biodiversity Area approach refined and tested for continental Africa. Biol. Conserv. 2012, 148, 167–179. [Google Scholar] [CrossRef]
  6. Davidson, N.C.; Finlayson, C.M. Earth Observation for wetland inventory, assessment and monitoring. Aquat. Conserv. Mar. Freshw. Ecosyst. 2007, 17, 219–228. [Google Scholar] [CrossRef]
  7. Fickas, K.C.; Cohen, W.B.; Yang, Z. Landsat-based monitoring of annual wetland change in the Willamette Valley of Oregon, USA from 1972 to 2012. Wetl. Ecol. Manag. 2016, 24, 73–92. [Google Scholar] [CrossRef]
  8. MacKay, H.; Finlayson, C.M.; Fernández-Prieto, D.; Davidson, N.; Pritchard, D.; Rebelo, L.-M. The role of Earth Observation (EO) technologies in supporting implementation of the Ramsar Convention on Wetlands. J. Environ. Manag. 2009, 90, 2234–2242. [Google Scholar] [CrossRef]
  9. Varin, M.; Théau, J.; Fournier, R.A. Mapping ecosystem services provided by wetlands at multiple spatiotemporal scales: A case study in Quebec, Canada. J. Environ. Manag. 2019, 246, 334–344. [Google Scholar] [CrossRef] [PubMed]
  10. Ramsar Convention Secretariat Wetland inventory: A Ramsar framework for wetland inventory and ecological character description. In Ramsar Handbooks for the Wise Use of Wetlands, 4th ed.; Ramsar Convention Secretariat: Gland, Switzerland, 2010; Volume 15.
  11. Mitsch, W.J.; Gosselink, J.G. The value of wetlands: Importance of scale and landscape setting. Ecol. Econ. 2000, 35, 25–33. [Google Scholar] [CrossRef]
  12. Cowardin, L.M.; Carter, V.; Golet, F.C.; Laroe, E.T. Classification of wetlands and deepwater habitats of the United States. In Water Encyclopedia; Lehr, J.H., Keeley, J., Eds.; John Wiley & Sons, Inc.: Hoboken, NJ, USA, 1979; p. sw2162. ISBN 978-0-471-47844-7. [Google Scholar]
  13. National Wetlands Working Group. The Canadian Wetland Classification System; Wetlands Research Branch, University of Waterloo: Waterloo, ON, Canada, 1997; ISBN 978-0-662-25857-5. [Google Scholar]
  14. De Groot, D.; Brander, L.; Finlayson, C.M. Wetland ecosystem services. In The Wetlands Book: Structure and Function, Management and Methods; Springer Netherlands: Dordrecht, The Netherlands, 2018. [Google Scholar]
  15. Colvin, S.A.R.; Sullivan, S.M.P.; Shirey, P.D.; Colvin, R.W.; Winemiller, K.O.; Hughes, R.M.; Fausch, K.D.; Infante, D.M.; Olden, J.D.; Bestgen, K.R.; et al. Headwater streams and wetlands are critical for sustaining fish, fisheries, and ecosystem services. Fisheries 2019, 44, 73–91. [Google Scholar] [CrossRef]
  16. Martinez-Guerra, E.; Castillo-Valenzuela, J.; Gude, V.G. Wetlands for wastewater treatment. Water Environ. Res. 2018, 90, 1537–1562. [Google Scholar] [CrossRef] [Green Version]
  17. Tozer, D.C.; Steele, O.; Gloutney, M. Multispecies benefits of wetland conservation for marsh birds, frogs, and species at risk. J. Environ. Manag. 2018, 212, 160–168. [Google Scholar] [CrossRef]
  18. Kelleway, J.J.; Cavanaugh, K.; Rogers, K.; Feller, I.C.; Ens, E.; Doughty, C.; Saintilan, N. Review of the ecosystem service implications of mangrove encroachment into salt marshes. Glob Chang. Biol. 2017, 23, 3967–3983. [Google Scholar] [CrossRef] [PubMed]
  19. Whitfield, S.; Reed, M.; Thomson, K.; Christie, M.; Stringer, L.C.; Quinn, C.H.; Anderson, R.; Moxey, A.; Hubacek, K. Managing peatland ecosystem services: Current UK policy and future challenges in a changing world. Scott. Geogr. J. 2011, 1–22. [Google Scholar] [CrossRef]
  20. Melinchuk, R. Ducks Unlimited’s landscape approach to habitat conservation. Landsc. Urban Plan. 1995, 32, 211–217. [Google Scholar] [CrossRef]
  21. Erwin, K.L. Wetlands and global climate change: The role of wetland restoration in a changing world. Wetl. Ecol. Manag. 2009, 17, 71–84. [Google Scholar] [CrossRef]
  22. Mitsch, W.J.; Bernal, B.; Nahlik, A.M.; Mander, Ü.; Zhang, L.; Anderson, C.J.; Jørgensen, S.E.; Brix, H. Wetlands, carbon, and climate change. Landsc. Ecol. 2013, 28, 583–597. [Google Scholar] [CrossRef]
  23. Cowardin, L.M.; Myers, V.I. Remote sensing for identification and classification of wetland vegetation. J. Wildl. Manag. 1974, 38, 308. [Google Scholar] [CrossRef]
  24. Fournier, R.A.; Grenier, M.; Lavoie, A.; Hélie, R. Towards a strategy to implement the Canadian Wetland Inventory using satellite remote sensing. Can. J. Remote Sens. 2007, 33, 16. [Google Scholar] [CrossRef]
  25. Han, X.; Chen, X.; Feng, L. Four decades of winter wetland changes in Poyang Lake based on Landsat observations between 1973 and 2013. Remote Sens. Environ. 2015, 156, 426–437. [Google Scholar] [CrossRef]
  26. Mao, D.; Wang, Z.; Du, B.; Li, L.; Tian, Y.; Jia, M.; Zeng, Y.; Song, K.; Jiang, M.; Wang, Y. National wetland mapping in China: A new product resulting from object-based and hierarchical classification of Landsat 8 OLI images. ISPRS J. Photogramm. Remote Sens. 2020, 164, 11–25. [Google Scholar] [CrossRef]
  27. Michishita, R.; Jiang, Z.; Gong, P.; Xu, B. Bi-scale analysis of multitemporal land cover fractions for wetland vegetation mapping. ISPRS J. Photogramm. Remote Sens. 2012, 72, 1–15. [Google Scholar] [CrossRef]
  28. Zhu, X.; Hou, Y.; Weng, Q.; Chen, L. Integrating UAV optical imagery and LiDAR data for assessing the spatial relationship between mangrove and inundation across a subtropical estuarine wetland. ISPRS J. Photogramm. Remote Sens. 2019, 149, 146–156. [Google Scholar] [CrossRef]
  29. Mahdianpari, M.; Salehi, B.; Mohammadimanesh, F.; Motagh, M. Random forest wetland classification using ALOS-2 L-band, RADARSAT-2 C-band, and TerraSAR-X imagery. ISPRS J. Photogramm. Remote Sens. 2017, 130, 13–31. [Google Scholar] [CrossRef]
  30. White, L.; Millard, K.; Banks, S.; Richardson, M.; Pasher, J.; Duffe, J. Moving to the RADARSAT constellation mission: Comparing synthesized compact polarimetry and dual polarimetry data with fully polarimetric RADARSAT-2 data for image classification of peatlands. Remote Sens. 2017, 9, 573. [Google Scholar] [CrossRef] [Green Version]
  31. Millard, K.; Richardson, M. On the importance of training data sample selection in random forest image classification: A case study in peatland ecosystem mapping. Remote Sens. 2015, 7, 8489–8515. [Google Scholar] [CrossRef] [Green Version]
  32. Hu, S.; Gabriel, A.O.; Bodensteiner, L.R. Inventory and characterization of wetland habitat on the Winnebago upper pool lakes, Wisconsin, USA: An integrated multimedia-gis approach. Wetlands 2003, 23, 82–94. [Google Scholar] [CrossRef]
  33. Frohn, R.C.; Autrey, B.C.; Lane, C.R.; Reif, M. Segmentation and object-oriented classification of wetlands in a karst Florida landscape using multi-season Landsat-7 ETM+ imagery. Int. J. Remote Sens. 2011, 32, 1471–1489. [Google Scholar] [CrossRef]
  34. Kasischke, E.S.; Bourgeau-Chavez, L.L. Monitoring south florida wetlands using ERS-1 SAR imagery. Photogramm. Eng. Remote Sens. 1997, 63, 281–291. [Google Scholar]
  35. Betbeder, J.; Rapinel, S.; Corgne, S.; Pottier, E.; Hubert-Moy, L. TerraSAR-X dual-pol time-series for mapping of wetland vegetation. ISPRS J. Photogramm. Remote Sens. 2015, 107, 90–98. [Google Scholar] [CrossRef] [Green Version]
  36. Lane, C.; Liu, H.; Autrey, B.; Anenkhonov, O.; Chepinoga, V.; Wu, Q. Improved wetland classification using eight-band high resolution satellite imagery and a hybrid approach. Remote Sens. 2014, 6, 12187–12216. [Google Scholar] [CrossRef] [Green Version]
  37. Adam, E.; Mutanga, O. Spectral discrimination of papyrus vegetation (Cyperus papyrus L.) in swamp wetlands using field spectrometry. ISPRS J. Photogramm. Remote Sens. 2009, 64, 612–620. [Google Scholar] [CrossRef]
  38. Araya-López, R.A.; Lopatin, J.; Fassnacht, F.E.; Hernández, H.J. Monitoring Andean high altitude wetlands in central Chile with seasonal optical data: A comparison between Worldview-2 and Sentinel-2 imagery. ISPRS J. Photogramm. Remote Sens. 2018, 145, 213–224. [Google Scholar] [CrossRef]
  39. Kandus, P.; Minotti, P.G.; Morandeira, N.M.; Grimson, R.; Trilla, G.G.; Gonzalez, E.B.; Martin, L.S.; Gayol, M.P. Remote Sensing of wetlands in South America: Status and challenges. Int. J. Remote Sens. 2018, 39, 993–1016. [Google Scholar] [CrossRef]
  40. Ricaurte, L.F.; Jokela, J.; Siqueira, A.; Núñez-Avellaneda, M.; Marin, C.; Velázquez-Valencia, A.; Wantzen, K.M. Wetland habitat diversity in the amazonian piedmont of Colombia. Wetlands 2012, 32, 1189–1202. [Google Scholar] [CrossRef] [Green Version]
  41. Amler, E.; Schmidt, M.; Menz, G. Definitions and mapping of east African wetlands: A review. Remote Sens. 2015, 7, 5256–5282. [Google Scholar] [CrossRef] [Green Version]
  42. Van Deventer, H.; Cho, M.A.; Mutanga, O. Multi-season RapidEye imagery improves the classification of wetland and dryland communities in a subtropical coastal region. ISPRS J. Photogramm. Remote Sens. 2019, 157, 171–187. [Google Scholar] [CrossRef]
  43. Ausseil, A.-G.E.; Lindsay Chadderton, W.; Gerbeaux, P.; Theo Stephens, R.T.; Leathwick, J.R. Applying systematic conservation planning principles to palustrine and inland saline wetlands of New Zealand: Wetlands systematic conservation planning. Freshw. Biol. 2011, 56, 142–161. [Google Scholar] [CrossRef]
  44. Tulbure, M.G.; Broich, M. Spatiotemporal dynamic of surface water bodies using Landsat time-series data from 1999 to 2011. ISPRS J. Photogramm. Remote Sens. 2013, 79, 44–52. [Google Scholar] [CrossRef]
  45. He, Z.; He, D.; Mei, X.; Hu, S. Wetland Classification Based on a New Efficient Generative Adversarial Network and Jilin-1 Satellite Image. Remote Sens. 2019, 11, 2455. [Google Scholar] [CrossRef] [Green Version]
  46. Meng, X.; Zhang, S.; Zang, S. Lake Wetland Classification Based on an SVM-CNN Composite Classifier and High-resolution Images Using Wudalianchi as an Example. J. Coast. Res. 2019, 93, 153. [Google Scholar] [CrossRef]
  47. Chen, B.; Chen, L.; Huang, B.; Michishita, R.; Xu, B. Dynamic monitoring of the Poyang Lake wetland by integrating Landsat and MODIS observations. ISPRS J. Photogramm. Remote Sens. 2018, 139, 75–87. [Google Scholar] [CrossRef]
  48. Hou, X.; Feng, L.; Chen, X.; Zhang, Y. Dynamics of the wetland vegetation in large lakes of the Yangtze Plain in response to both fertilizer consumption and climatic changes. ISPRS J. Photogramm. Remote Sens. 2018, 141, 148–160. [Google Scholar] [CrossRef]
  49. Song, R.; Lin, H.; Wang, G.; Yan, E.; Ye, Z. Improving Selection of Spectral Variables for Vegetation Classification of East Dongting Lake, China, Using a Gaofen-1 Image. Remote Sens. 2017, 10, 50. [Google Scholar] [CrossRef] [Green Version]
  50. Kaplan, G.; Avdan, U. Evaluating the utilization of the red edge and radar bands from sentinel sensors for wetland classification. Catena 2019, 178, 109–119. [Google Scholar] [CrossRef]
  51. Wang, X.; Gao, X.; Zhang, Y.; Fei, X.; Chen, Z.; Wang, J.; Zhang, Y.; Lu, X.; Zhao, H. Land-cover classification of coastal wetlands using the rf algorithm for worldview-2 and landsat 8 images. Remote Sens. 2019, 11, 1927. [Google Scholar] [CrossRef] [Green Version]
  52. Mahdianpari, M.; Salehi, B.; Mohammadimanesh, F.; Brisco, B.; Homayouni, S.; Gill, E.; DeLancey, E.R.; Bourgeau-Chavez, L. Big data for a big country: The first generation of Canadian wetland inventory map at a spatial resolution of 10-m using sentinel-1 and sentinel-2 data on the Google Earth Engine cloud computing platform: Mégadonnées pour un grand pays: La première carte d’inventaire des zones humides du Canada à une résolution de 10 m à l’aide des données Sentinel-1 et Sentinel-2 sur la plate-forme informatique en nuage de Google Earth EngineTM. Can. J. Remote Sens. 2020, 46, 1–19. [Google Scholar]
  53. Duan, P.; Wang, Y.; Yin, P. Remote sensing applications in monitoring of protected areas: A bibliometric analysis. Remote Sens. 2020, 12, 772. [Google Scholar] [CrossRef] [Green Version]
  54. Zhang, Y.; Thenkabail, P.S.; Wang, P. A bibliometric profile of the remote sensing open access journal published by MDPI between 2009 and 2018. Remote Sens. 2019, 11, 91. [Google Scholar] [CrossRef] [Green Version]
  55. Zhuang, Y.; Liu, X.; Nguyen, T.; He, Q.; Hong, S. Global remote sensing research trends during 1991–2010: A bibliometric analysis. Scientometrics 2013, 96, 203–219. [Google Scholar] [CrossRef]
  56. Cameron, H.L. The use of Aerial photography in seaweed surveys. Photogramm. Eng. 1950, 16, 493–501. [Google Scholar]
  57. Lukens, J.E. Color aerial photography for aquatic vegetation surveys. Remote Sens. Environ. 1968, 5, 441–446. [Google Scholar]
  58. Shaw, S.P.; Fredine, C.G. Wetlands of the United States: Their extent and their value to waterfowl and other wildlife. US. Fish Wildl. Serv. Circ. 1956, 39, 1–67. [Google Scholar]
  59. Wilen, B.O. The U.S. Fish and wildlife service’s national wetlands inventory. Biol. Rep. 1980, 90, 9–19. [Google Scholar]
  60. Cowell, D.W.; Wickware, G.M.; Sims, R.A. Ecological land classification of the hudson bay lowland coastal zone, Ontario. In Proceedings of the 2nd Meeting Canadian Committee Ecological Land Classification, Ottawa, ON, Canada; 1979; pp. 165–175. [Google Scholar]
  61. Bourgeau-Chavez, L.; Endres, S.; Battaglia, M.; Miller, M.; Banda, E.; Laubach, Z.; Higman, P.; Chow-Fraser, P.; Marcaccio, J. Development of a bi-national great lakes coastal wetland and land use map using three-season palsar and landsat imagery. Remote Sens. 2015, 7, 8655–8682. [Google Scholar] [CrossRef] [Green Version]
  62. Dabboor, M.; Banks, S.; White, L.; Brisco, B.; Behnamian, A.; Chen, Z.; Murnaghan, K. Comparison of compact and fully polarimetric SAR for multitemporal wetland monitoring. IEEE J. Sel. Top. Appl. Earth Obs. Remote Sens. 2019, 12, 1417–1430. [Google Scholar] [CrossRef]
  63. Wang, J.; Shang, J.; Brisco, B.; Brown, R.J. Evaluation of multidate ERS-1 and multispectral landsat imagery for wetland detection in Southern Ontario. Can. J. Remote Sens. 1998, 24, 60–68. [Google Scholar] [CrossRef]
  64. Arzandeh, S.; Wang, J. Texture evaluation of RADARSAT imagery for wetland mapping. Can. J. Remote Sens. 2002, 28, 14. [Google Scholar] [CrossRef]
  65. Baghdadi, N.; Bernier, M.; Gauthier, R.; Neeson, I. Evaluation of C-band SAR data for wetlands mapping. Int. J. Remote Sens. 2001, 22, 71–88. [Google Scholar] [CrossRef]
  66. Li, J.; Chen, W.; Touzi, R. Optimum RADARSAT-1 configurations for wetlands discrimination: A case study of the Mer Bleue peat bog. Can. J. Remote Sens. 2007, 33, 10. [Google Scholar] [CrossRef]
  67. Touzi, R.; Deschamps, A.; Rother, G. Phase of target scattering for wetland characterization using polarimetric C-Band SAR. IEEE Trans. Geosci. Remote Sens. 2009, 47, 3241–3261. [Google Scholar] [CrossRef]
  68. Touzi, R.; Deschamps, A.; Rother, G. Wetland characterization using polarimetric RADARSAT-2 capability. Can. J. Remote Sens. 2007, 33, 12. [Google Scholar] [CrossRef]
  69. Dingle Robertson, L.; King, D.J.; Davies, C. Object-based image analysis of optical and radar variables for wetland evaluation. Int. J. Remote Sens. 2015, 36, 5811–5841. [Google Scholar] [CrossRef]
  70. Mui, A.; He, Y.; Weng, Q. An object-based approach to delineate wetlands across landscapes of varied disturbance with high spatial resolution satellite imagery. ISPRS J. Photogramm. Remote Sens. 2015, 109, 30–46. [Google Scholar] [CrossRef] [Green Version]
  71. Rokitnicki-Wojcik, D.; Wei, A.; Chow-Fraser, P. Transferability of object-based rule sets for mapping coastal high marsh habitat among different regions in Georgian Bay, Canada. Wetl. Ecol. Manag. 2011, 19, 223–236. [Google Scholar] [CrossRef]
  72. Franklin, S.E.; Ahmed, O.S. Object-based wetland characterization using radarsat-2 quad-polarimetric SAR data, landsat-8 OLI imagery, and airborne lidar-derived geomorphometric variables. Photogramm. Eng. Remote Sens. 2017, 83, 27–36. [Google Scholar] [CrossRef]
  73. Millard, K.; Richardson, M. Wetland mapping with LiDAR derivatives, SAR polarimetric decompositions, and LiDAR-SAR fusion using a random forest classifier. Can. J. Remote Sens. 2013, 39, 290–307. [Google Scholar] [CrossRef]
  74. Jollineau, M.Y.; Howarth, P.J. Mapping an inland wetland complex using hyperspectral imagery. Int. J. Remote Sens. 2008, 29, 3609–3631. [Google Scholar] [CrossRef]
  75. Banks, S.; White, L.; Behnamian, A.; Chen, Z.; Montpetit, B.; Brisco, B.; Pasher, J.; Duffe, J. Wetland classification with multi-angle/temporal SAR using random forests. Remote Sens. 2019, 11, 670. [Google Scholar] [CrossRef] [Green Version]
  76. Rezaee, M.; Mahdianpari, M.; Zhang, Y.; Salehi, B. Deep Convolutional Neural Network for Complex Wetland Classification Using Optical Remote Sensing Imagery. IEEE J. Sel. Top. Appl. Earth Obs. Remote Sens. 2018, 11, 3030–3039. [Google Scholar] [CrossRef]
  77. Mahdianpari, M.; Salehi, B.; Rezaee, M.; Mohammadimanesh, F.; Zhang, Y. Very deep convolutional neural networks for complex land cover mapping using multispectral remote sensing imagery. Remote Sens. 2018, 10, 1119. [Google Scholar] [CrossRef] [Green Version]
  78. Mohammadimanesh, F.; Salehi, B.; Mahdianpari, M.; Brisco, B.; Motagh, M. Multi-temporal, multi-frequency, and multi-polarization coherence and SAR backscatter analysis of wetlands. ISPRS J. Photogramm. Remote Sens. 2018, 142, 78–93. [Google Scholar] [CrossRef]
  79. Mohammadimanesh, F.; Salehi, B.; Mahdianpari, M. Synthetic Aperture Radar (SAR) coherence and backscatter analyses of wetlands. In Proceedings of the AGU Fall Meeting Abstracts, Washington, DC, USA, 10–14 December 2018. [Google Scholar]
  80. Mohammadimanesh, F.; Salehi, B.; Mahdianpari, M.; Brisco, B.; Motagh, M. Wetland water level monitoring using interferometric Synthetic Aperture Radar (In SAR): A review. Can. J. Remote Sens. 2018, 1–16. [Google Scholar] [CrossRef]
  81. Mahdianpari, M.; Salehi, B.; Mohammadimanesh, F.; Brisco, B.; Mahdavi, S.; Amani, M.; Granger, J.E. Fisher Linear Discriminant Analysis of coherency matrix for wetland classification using PolSAR imagery. Remote Sens. Environ. 2018, 206, 300–317. [Google Scholar] [CrossRef]
  82. Mahdianpari, M.; Salehi, B.; Mohammadimanesh, F. The effect of PolSAR image de-speckling on wetland classification: Introducing a new adaptive method. Can. J. Remote Sens. 2017, 43, 485–503. [Google Scholar] [CrossRef]
  83. Mohammadimanesh, F.; Salehi, B.; Mahdianpari, M.; Motagh, M.; Brisco, B. An efficient feature optimization for wetland mapping by synergistic use of SAR intensity, interferometry, and polarimetry data. Int. J. Appl. Earth Obs. Geoinf. 2018, 73, 450–462. [Google Scholar] [CrossRef]
  84. Mohammadimanesh, F.; Salehi, B.; Mahdianpari, M.; Homayouni, S. Unsupervised wishart classfication of wetlands in Newfoundland, Canada using polsar data based on fisher linear discriminant analysis. Int. Arch. Photogramm. Remote Sens. Spat. Inf. Sci. 2016, 41, 305. [Google Scholar] [CrossRef]
  85. Mohammadimanesh, F.; Salehi, B.; Mahdianpari, M.; Motagh, M. A new hierarchical object-based classification algorithm for wetland mapping in Newfoundland, Canada. In Proceedings of the IGARSS 2018-2018 IEEE International Geoscience and Remote Sensing Symposium, Valencia, Spain, 22–27 July 2018; pp. 9233–9236. [Google Scholar]
  86. Mahdianpari, M.; Salehi, B.; Mohammadimanesh, F.; Brisco, B. An assessment of simulated compact polarimetric SAR data for wetland classification using random Forest algorithm. Can. J. Remote Sens. 2017, 43, 468–484. [Google Scholar] [CrossRef]
  87. Mohammadimanesh, F.; Salehi, B.; Mahdianpari, M.; Brisco, B.; Gill, E. Full and simulated compact polarimetry sar responses to canadian wetlands: Separability analysis and classification. Remote Sens. 2019, 11, 516. [Google Scholar] [CrossRef] [Green Version]
  88. Sun, W.; Wang, R. Fully Convolutional Networks for semantic segmentation of very high resolution remotely sensed images combined with DSM. IEEE Geosci. Remote Sens. Lett. 2018, 15, 474–478. [Google Scholar] [CrossRef]
  89. DeLancey, E.R.; Simms, J.F.; Mahdianpari, M.; Brisco, B.; Mahoney, C.; Kariyeva, J. Comparing Deep Learning and Shallow Learning for Large-Scale Wetland Classification in Alberta, Canada. Remote Sens. 2020, 12, 2. [Google Scholar] [CrossRef] [Green Version]
  90. Salehi, B.; Mahdianpari, M.; Mohammadimanesh, F.; Brisco, B. Wetland Inventory of Canada using Satellite Earth Observation Data and Google Earth Engine Cloud. In Proceedings of the AGU Fall Meeting 2019, San Francisco, CA, USA, 9–13 December 2019. [Google Scholar]
  91. Dick, J.; Blok, E.; Bon, K.; Kirchner, B.; Dahl, T.; Bergeson, M.; Miner, J. A system for mapping riparian areas in the western United States. US. Fish Wildl. Serv. 2009, 4–43. [Google Scholar]
  92. Stephens, D.W.; Gerner, L.J. National water summary wetland resources: Utah. US. Geol. Surv. Water Supply 1996, 375–380. [Google Scholar]
  93. Flagstad, L.; Steer, A.; Boucher, T.; Aisu, M.; Lema, P. Wetlands across Alaska: Statewide wetland map and assessment of rare wetland ecosystems. Alsk. Nat. Herit. Program. 2018, 10–150. [Google Scholar]
  94. Guo, M.; Li, J.; Sheng, C.; Xu, J.; Wu, L. A Review of Wetland Remote Sensing. Sensors 2017, 17, 777. [Google Scholar] [CrossRef] [Green Version]
  95. Lang, M.; Bourgeau-Chavez, L.; Tiner, R.; Klemas, V. Advances in remotely sensed data and techniques for wetland mapping and monitoring. In Remote Sensing of Wetlands; Tiner, R., Lang, M., Klemas, V., Eds.; CRC Press: Boca Raton, FL, USA, 2015; pp. 79–116. ISBN 978-1-4822-3735-1. [Google Scholar]
  96. Ozesmi, S.L.; Bauer, M.E. Satellite remote sensing of wetlands. Wetl. Ecol. Manag. 2002, 10, 381–402. [Google Scholar] [CrossRef]
  97. Gallant, A. The Challenges of Remote Monitoring of Wetlands. Remote Sens. 2015, 7, 10938–10950. [Google Scholar] [CrossRef] [Green Version]
  98. Tsyganskaya, V.; Martinis, S.; Marzahn, P.; Ludwig, R. SAR-based detection of flooded vegetation—A review of characteristics and approaches. Int. J. Remote Sens. 2018, 39, 2255–2293. [Google Scholar] [CrossRef]
  99. Wohlfart, C.; Winkler, K.; Wendleder, A.; Roth, A. TerraSAR-X and wetlands: A review. Remote Sens. 2018, 10, 916. [Google Scholar] [CrossRef] [Green Version]
  100. Cowardin, L.M. Some Conceptual and Semantic Problems in Wetland Classification and Inventory. Wildl. Soc. Bull. 1982, 10, 5. [Google Scholar]
  101. Finlayson, C.M.; van der Valk, A.G. Wetland classification and inventory: A summary. Vegetatio 1995, 118, 8. [Google Scholar] [CrossRef]
  102. Gerbeaux, P.; Finlayson, C.M.; van Dam, A.A. Wetland Classification: Overview. In The Wetland Book: I: Structure and Function, Management and Methods; Finlayson, C.M., Everard, M., Irvine, K., McInnes, R.J., Middleton, B.A., Van Dam, A.A., Davidson, N.C., Eds.; Springer Netherlands: Dordrecht, The Netherlands, 2016; pp. 1–8. ISBN 978-94-007-6172-8. [Google Scholar]
  103. Zedler, P.H. Vernal pools and the concept of “isolated wetlands”. Wetlands 2003, 23, 597–607. [Google Scholar] [CrossRef]
  104. Calhoun, A.J.K.; Mushet, D.M.; Bell, K.P.; Boix, D.; Fitzsimons, J.A.; Isselin-Nondedeu, F. Temporary wetlands: Challenges and solutions to conserving a ‘disappearing’ ecosystem. Biol. Conserv. 2017, 211, 3–11. [Google Scholar] [CrossRef]
  105. Ameli, A.A.; Creed, I.F. Quantifying hydrologic connectivity of wetlands to surface water systems. Hydrol. Earth Syst. Sci. 2017, 21, 1791–1808. [Google Scholar] [CrossRef] [Green Version]
  106. Leibowitz, S.G.; Wigington, P.J.; Schofield, K.A.; Alexander, L.C.; Vanderhoof, M.K.; Golden, H.E. Connectivity of Streams and Wetlands to Downstream Waters: An Integrated Systems Framework. J. Am. Water Resour Assoc. 2018, 54, 298–322. [Google Scholar] [CrossRef]
  107. Ramsar Convention Secretariat. The Ramsar Convention Manual: A Guide to the Convention on Wetlands (Ramsar, Iran, 1971), 6th ed.; Ramsar Convention Secretariat: Gland, Switzerland, 2013. [Google Scholar]
  108. Semeniuk, C.A.; Semeniuk, V. A geomorphic approach to global classification for inland wetlands. In Classification and Inventory of the World’s Wetlands; Finlayson, C.M., Van der Valk, A.G., Eds.; Springer Netherlands: Dordrecht, The Netherlands, 1995; pp. 103–124. ISBN 978-94-010-4190-4. [Google Scholar]
  109. Berlanga-Robles, C.A.; Ruiz-Luna, A.; de la Espino, G.L. Classification system of the wetlands of Mexico. In Investigaciones Geograficas, Boletin Instituto de Geografia; Universidad Nacional, Autonoma de Mexico: Mexico city, Mexico, 2008. [Google Scholar]
  110. Brinson, M.M. A Hydrogeomorphic Classification for Wetlands; East Carolina University: Greenville, NC, USA, 1993. [Google Scholar]
  111. MacKenzie, W.H.; Moran, J.R. Wetlands of British Columbia: A Guide to Identification; Land management handbook; British Columbia, Ministry of Forests, Forest Science Program: Victoria, BC, USA, 2004; ISBN 978-0-7726-5066-5.
  112. Alberta Environment and sustainable resource development. In Alberta Wetland Classification System; Water Policy Branch, Policy and Planning Division: Edmonton, AB, Canada, 2015; pp. 1–40. ISBN 978-1-4601-2258-7.
  113. Ducks Unlimited Canada. Boreal Wetland Classes in the Boreal Plains Ecozone of Canada: Field Guide; Ducks Unlimited Canada: Stonewall, MB, Canada, 2014; ISBN 978-0-9812303-2-0. [Google Scholar]
  114. Wells, E.D. Classification of peatland vegetation in Atlantic Canada. J. Veg. Sci. 1996, 7, 847–878. [Google Scholar] [CrossRef]
  115. Stewart, R.E.; Kantrud, H.A. Classification of Natural Ponds and Lakes in the Glaciated Prairie Region; Bureau of port Fisheries and Wildlife: Washington, DC, USA, 1971.
  116. Moher, D.; Liberati, A.; Tetzlaff, J.; Altman, D.G. Preferred Reporting Items for Systematic Reviews and Meta-Analyses: The PRISMA Statement. PLoS Med. 2009, 6, 6. [Google Scholar] [CrossRef] [Green Version]
  117. Wulder, M.A.; Li, Z.; Campbell, E.M.; White, J.C.; Hobart, G.; Hermosilla, T.; Coops, N.C. A National Assessment ofWetland Status and Trends for Canada’s Forested Ecosystems Using 33 Years of Earth Observation Satellite Data. Remote Sens. 2018, 10, 1623. [Google Scholar] [CrossRef] [Green Version]
  118. Brisco, B.; Kapfer, M.; Hirose, T.; Tedford, B.; Liu, J. Evaluation of C-band polarization diversity and polarimetry for wetland mapping. Can. J. Remote Sens. 2011, 37, 82–92. [Google Scholar] [CrossRef]
  119. Lawrence, R.; Hurst, R.; Weaver, T.; Aspinall, R. Mapping Prairie Pothole Communities with Multitemporal Ikonos Satellite Imagery. Photogramm. Eng. Remote Sens. 2006, 72, 169–174. [Google Scholar] [CrossRef] [Green Version]
  120. Phillips, R.L.; Beeri, O.; DeKeyser, E.S. Remote wetland assessment for Missouri Coteau prairie glacial basins. Wetlands 2005, 25, 335–349. [Google Scholar] [CrossRef]
  121. Rampi, L.P.; Knight, J.F.; Pelletier, K.C. Wetland Mapping in the Upper Midwest United States. Photogramm. Eng. Remote Sens. 2014, 80, 439–448. [Google Scholar] [CrossRef]
  122. Sethre, P.R.; Rundquist, B.C.; Todhunter, P.E. Remote detection of prairie pothole ponds in the Devils Lake basin, North Dakota. GISci. Remote Sens. 2005, 42, 277–296. [Google Scholar] [CrossRef]
  123. Wu, Q.; Lane, C.R. Delineation and Quantification of Wetland Depressions in the Prairie Pothole Region of North Dakota. Wetlands 2016, 36, 215–227. [Google Scholar] [CrossRef]
  124. Becker, B.L.; Lusch, D.P.; Qi, J. A classification-based assessment of the optimal spectral and spatial resolutions for Great Lakes coastal wetland imagery. Remote Sens. Environ. 2007, 108, 111–120. [Google Scholar] [CrossRef]
  125. Becker, B.L.; Lusch, D.P.; Qi, J. Identifying optimal spectral bands from in situ measurements of Great Lakes coastal wetlands using second-derivative analysis. Remote Sens. Environ. 2005, 97, 238–248. [Google Scholar] [CrossRef]
  126. Bourgeau-Chavez, L.L.; Riordan, K.; Miller, N.; Nowels, M.; Powell, R. Remotely monitoring great lakes coastal wetlands with multi-sensor, multi-temporal SAR and multi-spectral data. In Proceedings of the IGARSS 2008–2008 IEEE International Geoscience and Remote Sensing Symposium, Boston, MA, USA, 7–11 July 2008; pp. I-428–I-429. [Google Scholar]
  127. Cook, B.D.; Bolstad, P.V.; Næsset, E.; Anderson, R.S.; Garrigues, S.; Morisette, J.T.; Nickeson, J.; Davis, K.J. Using LiDAR and quickbird data to model plant production and quantify uncertainties associated with wetland detection and land cover generalizations. Remote Sens. Environ. 2009, 113, 2366–2379. [Google Scholar] [CrossRef]
  128. Midwood, J.D.; Chow-Fraser, P. Mapping Floating and Emergent Aquatic Vegetation in Coastal Wetlands of Eastern Georgian Bay, Lake Huron, Canada. Wetlands 2010, 30, 1141–1152. [Google Scholar] [CrossRef]
  129. Torbick, N.; Becker, B. Evaluating Principal Components Analysis for Identifying Optimal Bands Using Wetland Hyperspectral Measurements From the Great Lakes, USA. Remote Sens. 2009, 1, 408–417. [Google Scholar] [CrossRef] [Green Version]
  130. Wolter, P.T.; Johnston, C.A.; Niemi, G.J. Mapping submergent aquatic vegetation in the US Great Lakes using Quickbird satellite data. Int. J. Remote Sens. 2005, 26, 5255–5274. [Google Scholar] [CrossRef]
  131. Brisco, B.; Murnaghan, K.; Wdowinski, S.; Hong, S.-H. Evaluation of RADARSAT-2 Acquisition Modes for Wetland Monitoring Applications. Can. J. Remote Sens. 2015, 41, 431–439. [Google Scholar] [CrossRef]
  132. Hirano, A.; Madden, M.; Welch, R. Hyperspectral image data for mapping wetland vegetation. Wetlands 2003, 23, 436–448. [Google Scholar] [CrossRef]
  133. Hong, S.-H.; Kim, H.-O.; Wdowinski, S.; Feliciano, E. Evaluation of Polarimetric SAR Decomposition for Classifying Wetland Vegetation Types. Remote Sens. 2015, 7, 8563–8585. [Google Scholar] [CrossRef] [Green Version]
  134. Jensen, J.R.; Rutchey, K.; Koch, M.S.; Narumalani, S. Inland Wetland Change Detection in the Everglades Water Conservation Area 2A Using a Time Series of Normalized Remotely Sensed Data. Photogramm. Eng. Remote Sens. 1995, 61, 199–209. [Google Scholar]
  135. Szantoi, Z.; Escobedo, F.J.; Abd-Elrahman, A.; Pearlstine, L.; Dewitt, B.; Smith, S. Classifying spatially heterogeneous wetland communities using machine learning algorithms and spectral and textural features. Environ. Monit. Assess. 2015, 187, 262. [Google Scholar] [CrossRef]
  136. Zhang, C.; Xie, Z.; Selch, D. Fusing lidar and digital aerial photography for object-based forest mapping in the Florida Everglades. GISci. Remote Sens. 2013, 50, 562–573. [Google Scholar] [CrossRef]
  137. Zweig, C.L.; Burgess, M.A.; Percival, H.F.; Kitchens, W.M. Use of Unmanned Aircraft Systems to Delineate Fine-Scale Wetland Vegetation Communities. Wetlands 2015, 35, 303–309. [Google Scholar] [CrossRef]
  138. Craig, J.C.; Jordan, J.D.; Brown, M.T. Wetland Quality Assessment using landsat imagery and GIS. In Proceedings of the Bridging the Gap; American Society of Civil Engineers: The Rosen Plaza Hotel, Orlando, FL, USA, 2001; pp. 1–12. [Google Scholar]
  139. Enwright, N.; Forbes, M.G.; Doyle, R.D.; Hunter, B.; Forbes, W. Using Geographic Information Systems (GIS) to inventory coastal prairie wetlands along the upper gulf coast, Texas. Wetlands 2011, 31, 687–697. [Google Scholar] [CrossRef]
  140. Frohn, R.C.; Reif, M.; Lane, C.; Autrey, B. Satellite remote sensing of isolated wetlands using object-oriented classification of Landsat-7 data. Wetlands 2009, 29, 931–941. [Google Scholar] [CrossRef]
  141. Kwoun, O.; Lu, Z. Multi-temporal RADARSAT-1 and ERS Backscattering Signatures of Coastal Wetlands in Southeastern Louisiana. Photogramm. Eng. Remote Sens. 2009, 75, 607–617. [Google Scholar] [CrossRef]
  142. McCarthy, M.J.; Radabaugh, K.R.; Moyer, R.P.; Muller-Karger, F.E. Enabling efficient, large-scale high-spatial resolution wetland mapping using satellites. Remote Sens. Environ. 2018, 208, 189–201. [Google Scholar] [CrossRef]
  143. Yang, C.; Everitt, J.H.; Fletcher, R.S.; Jensen, R.R.; Mausel, P.W. Evaluating AISA + Hyperspectral Imagery for Mapping Black Mangrove along the South Texas Gulf Coast. Photogramm. Eng. Remote Sens. 2009, 75, 425–435. [Google Scholar] [CrossRef] [Green Version]
  144. Ruxton, G.D. The unequal variance t-test is an underused alternative to Student’s t-test and the Mann–Whitney U test. Behav. Ecol. 2006, 17, 688–690. [Google Scholar] [CrossRef]
  145. Franklin, S.E.; Skeries, E.M.; Stefanuk, M.A.; Ahmed, O.S. Wetland classification using Radarsat-2 SAR quad-polarization and Landsat-8 OLI spectral response data: A case study in the Hudson Bay Lowlands Ecoregion. Int. J. Remote Sens. 2018, 39, 1615–1627. [Google Scholar] [CrossRef]
  146. Hird, J.; DeLancey, E.; McDermid, G.; Kariyeva, J. Google Earth Engine, Open-Access Satellite Data, and Machine Learning in Support of Large-Area Probabilistic Wetland Mapping. Remote Sens. 2017, 9, 1315. [Google Scholar] [CrossRef] [Green Version]
  147. Li, J.; Chen, W. A rule-based method for mapping Canada’s wetlands using optical, radar and DEM data. Int. J. Remote Sens. 2005, 26, 5051–5069. [Google Scholar] [CrossRef]
  148. Mahdianpari, M.; Salehi, B.; Mohammadimanesh, F.; Homayouni, S.; Gill, E. The First Wetland Inventory Map of Newfoundland at a Spatial Resolution of 10 m Using Sentinel-1 and Sentinel-2 Data on the Google Earth Engine Cloud Computing Platform. Remote Sens. 2018, 11, 43. [Google Scholar] [CrossRef] [Green Version]
  149. Liu, T.; Abd-Elrahman, A. Deep convolutional neural network training enrichment using multi-view object-based analysis of Unmanned Aerial systems imagery for wetlands classification. ISPRS J. Photogramm. Remote Sens. 2018, 139, 154–170. [Google Scholar] [CrossRef]
  150. Liu, T.; Abd-Elrahman, A.; Dewitt, B.; Smith, S.; Morton, J.; Wilhelm, V.L. Evaluating the potential of multi-view data extraction from small Unmanned Aerial Systems (UASs) for object-based classification for Wetland land covers. GISci. Remote Sens. 2019, 56, 130–159. [Google Scholar] [CrossRef]
  151. Frohn, R.C.; D’Amico, E.; Lane, C.; Autrey, B.; Rhodus, J.; Liu, H. Multi-temporal Sub-pixel Landsat ETM+ Classification of Isolated Wetlands in Cuyahoga County, Ohio, USA. Wetlands 2012, 32, 289–299. [Google Scholar] [CrossRef]
  152. Reif, M.; Frohn, R.C.; Lane, C.R.; Autrey, B. Mapping Isolated Wetlands in a Karst Landscape: GIS and Remote Sensing Methods. GISci. Remote Sens. 2009, 46, 187–211. [Google Scholar] [CrossRef]
  153. Zhang, Y.; Lu, D.; Yang, B.; Sun, C.; Sun, M. Coastal wetland vegetation classification with a Landsat Thematic Mapper image. Int. J. Remote Sens. 2011, 32, 545–561. [Google Scholar] [CrossRef]
  154. McCarthy, M.J.; Merton, E.J.; Muller-Karger, F.E. Improved coastal wetland mapping using very-high 2-meter spatial resolution imagery. Int. J. Appl. Earth Obs. Geoinf. 2015, 40, 11–18. [Google Scholar] [CrossRef]
  155. Corcoran, J.; Knight, J.; Gallant, A. Influence of Multi-Source and Multi-Temporal Remotely Sensed and Ancillary Data on the Accuracy of Random Forest Classification of Wetlands in Northern Minnesota. Remote Sens. 2013, 5, 3212–3238. [Google Scholar] [CrossRef] [Green Version]
  156. Knight, J.F.; Tolcser, B.P.; Corcoran, J.M.; Rampi, L.P. The Effects of Data Selection and Thematic Detail on the Accuracy of High Spatial Resolution Wetland Classifications. Photogramm. Eng. Remote Sens. 2013, 79, 613–623. [Google Scholar] [CrossRef]
  157. Corcoran, J.; Knight, J.; Pelletier, K.; Rampi, L.; Wang, Y. The Effects of Point or Polygon Based Training Data on RandomForest Classification Accuracy of Wetlands. Remote Sens. 2015, 7, 4002–4025. [Google Scholar] [CrossRef] [Green Version]
  158. Corcoran, J.; Knight, J.; Brisco, B.; Kaya, S.; Cull, A.; Murnaghan, K. The integration of optical, topographic, and radar data for wetland mapping in northern Minnesota. Can. J. Remote Sens. 2012, 37, 19. [Google Scholar] [CrossRef]
  159. Kloiber, S.M.; Norris, D.J.; Bergman, A.L. Minnesota wetland inventory: User guide and Summary Statistics. Minn. Dep. Nat. Resour. 2019, 1–66. [Google Scholar]
  160. Kloiber, S.M.; Macleod, R.D.; Smith, A.J.; Knight, J.F.; Huberty, B.J. A Semi-Automated, Multi-Source Data Fusion Update of a Wetland Inventory for East-Central Minnesota, USA. Wetlands 2015, 35, 335–348. [Google Scholar] [CrossRef]
  161. Pope, K.O.; Rejmankova, E.; Savage, H.M.; Arredondo-Jimenez, J.I.; Rodriguez, M.H.; Roberts, D.R. Remote Sensing of Tropical Wetlands for Malaria Control in Chiapas, Mexico. Ecol. Appl. 1994, 4, 81–90. [Google Scholar] [CrossRef]
  162. Rio, J.N.R.; Lozano-García, D.F. Spatial Filtering of Radar Data (RADARSAT) for Wetlands (Brackish Marshes) Classification. Remote Sens. Environ. 2000, 73, 143–151. [Google Scholar] [CrossRef]
  163. Nagler, P.L.; Glenn, E.P.; Hinojosa-Huerta, O. Synthesis of ground and remote sensing data for monitoring ecosystem functions in the Colorado River Delta, Mexico. Remote Sens. Environ. 2009, 113, 1473–1485. [Google Scholar] [CrossRef]
  164. Camacho-Valdez, V.; Ruiz-Luna, A.; Ghermandi, A.; Nunes, P.A.L.D. Valuation of ecosystem services provided by coastal wetlands in northwest Mexico. Ocean Coast. Manag. 2013, 78, 1–11. [Google Scholar] [CrossRef]
  165. Díaz-Gallegos, J.R.; Acosta-Velázquez, J.; Teresa, M.; Cruz, I.; Vázquez-Lule, A.; Troche, C.; Uribe, A.; Ressl, R.; Jiménez, R. The Mangrove Forests of Mexico: Transformation, Conservation and Threats. In Frontiers in Biodiversity Studies, 1st ed.; Chapter 15; Thangadurai, D., Busso, C.A., Abarca, L.G.A., Jayabalan, S., Eds.; I.K International Pvt: New Delhi, India, 2011; pp. 1–32. [Google Scholar]
  166. Maxwell, A.E.; Warner, T.A.; Strager, M.P. Predicting palustrine wetland probability using random forest machine learning and digital elevation data-derived terrain variables. Photogram. Eng. Rem. Sens. 2016, 82, 437–447. [Google Scholar] [CrossRef]
  167. Sader, S.A.; Ahl, D.; Liou, W.-S. Accuracy of landsat-TM and GIS rule-based methods for forest wetland classification in Maine. Remote Sens. Environ. 1995, 53, 133–144. [Google Scholar] [CrossRef]
  168. Chiu, W.-Y.; Couloigner, I. Modified fuzzy c-means classification technique for mapping vague wetlands using landsat ETM+ imagery. Hydrol. Process. 2006, 20, 3623–3634. [Google Scholar] [CrossRef]
  169. Gosselin, G.; Touzi, R.; Cavayas, F. Polarimetric Radarsat-2 wetland classification using the Touzi decomposition: Case of the Lac Saint-Pierre Ramsar wetland. Can. J. Remote. Sens. 2014, 36, 17. [Google Scholar] [CrossRef]
  170. Scarpace, F.L. Wetland Mapping from Digitized Aerial Photography. Photogramm. Eng. 1981, 10, 829–838. [Google Scholar]
  171. Lu, D.; Weng, Q. A survey of image classification methods and techniques for improving classification performance. Int. J. Remote Sens. 2007, 28, 823–870. [Google Scholar] [CrossRef]
  172. Bourgeau-Chavez, L.L.; Endres, S.; Powell, R.; Battaglia, M.J.; Benscoter, B.; Turetsky, M.; Kasischke, E.S.; Banda, E. Mapping boreal peatland ecosystem types from multitemporal radar and optical satellite imagery. Can. J. For. Res. 2017, 47, 545–559. [Google Scholar] [CrossRef]
  173. Bourgeau-Chavez, L.L.; Kasischke, E.S.; Brunzell, S.M.; Mudd, J.P.; Smith, K.B.; Frick, A.L. Analysis of space-borne SAR data for wetland mapping in Virginia riparian ecosystems. Int. J. Remote Sens. 2001, 22, 3665–3687. [Google Scholar] [CrossRef]
  174. Sun, C.; Fagherazzi, S.; Liu, Y. Classification mapping of salt marsh vegetation by flexible monthly NDVI time-series using Landsat imagery. Estuar. Coast. Shelf Sci. 2018, 213, 61–80. [Google Scholar] [CrossRef]
  175. Xu, H.; Hodgson, M.E.; Piovan, S.E.; Tufford, D.L. The potential of using LiDAR and color-infrared aerial imagery for palustrine wetland typology and change. GISci. Remote Sens. 2018, 55, 477–501. [Google Scholar] [CrossRef]
  176. Augusteijn, M.F.; Warrender, C.E. Wetland classification using optical and radar data and neural network classification. Int. J. Remote Sens. 1998, 19, 1545–1560. [Google Scholar] [CrossRef]
  177. Ghedira, H.; Bernier, M.; Ouarda, T.B.M.J. Application of neural networks for wetland classification in RADARSAT SAR imagery. IEEE Int. Geosci. Remote Sens. Symp. 2002, 2, 675–677. [Google Scholar]
  178. Morris, J.T.; Porter, D.; Neet, M.; Noble, P.A.; Schmidt, L.; Lapine, L.A.; Jensen, J.R. Integrating LIDAR elevation data, multi-spectral imagery and neural network modelling for marsh characterization. Int. J. Remote Sens. 2005, 26, 5221–5234. [Google Scholar] [CrossRef]
  179. Carle, M.V.; Wang, L.; Sasser, C.E. Mapping freshwater marsh species distributions using WorldView-2 high-resolution multispectral satellite imagery. Int. J. Remote Sens. 2014, 35, 4698–4716. [Google Scholar] [CrossRef]
  180. Merchant, M.A.; Adams, J.R.; Berg, A.A.; Baltzer, J.L.; Quinton, W.L.; Chasmer, L.E. Contributions of C-Band SAR Data and polarimetric decompositions to subarctic boreal peatland mapping. IEEE J. Sel. Top. Appl. Earth Obs. Remote Sens. 2017, 10, 1467–1482. [Google Scholar] [CrossRef]
  181. Ballanti, L.; Byrd, K.; Woo, I.; Ellings, C. Remote Sensing for Wetland Mapping and Historical Change Detection at the Nisqually River Delta. Sustainability 2017, 9, 1919. [Google Scholar] [CrossRef] [Green Version]
  182. Campbell, A.; Wang, Y. High Spatial Resolution Remote Sensing for Salt Marsh Mapping and Change Analysis at Fire Island National Seashore. Remote Sens. 2019, 11, 1107. [Google Scholar] [CrossRef] [Green Version]
  183. Clewley, D.; Whitcomb, J.; Moghaddam, M.; McDonald, K.; Chapman, B.; Bunting, P. Evaluation of ALOS PALSAR data for high-resolution mapping of vegetated wetlands in Alaska. Remote Sens. 2015, 7, 7272–7297. [Google Scholar] [CrossRef] [Green Version]
  184. Dissanska, M.; Bernier, M.; Payette, S. Object-based classification of very high resolution panchromatic images for evaluating recent change in the structure of patterned peatlands. Can. J. Remote Sens. 2009, 35, 27. [Google Scholar] [CrossRef]
  185. Grenier, M.; Labrecque, S.; Garneau, M.; Tremblay, A. Object-based classification of a SPOT-4 image for mapping wetlands in the context of greenhouse gases emissions: The case of the Eastmain region, Québec, Canada. Can. J. Remote Sens. 2008, 34, 16. [Google Scholar] [CrossRef]
  186. Mohammadimanesh, F.; Salehi, B.; Mahdianpari, M.; Gill, E.; Molinier, M. A new fully convolutional neural network for semantic segmentation of polarimetric SAR imagery in complex land cover ecosystem. ISPRS J. Photogramm. Remote Sens. 2019, 151, 223–236. [Google Scholar] [CrossRef]
  187. Pouliot, D.; Latifovic, R.; Pasher, J.; Duffe, J. Assessment of Convolution Neural Networks for Wetland Mapping with Landsat in the Central Canadian Boreal Forest Region. Remote Sens. 2019, 11, 772. [Google Scholar] [CrossRef] [Green Version]
  188. White, L.; Brisco, B.; Dabboor, M.; Schmitt, A.; Pratt, A. A Collection of SAR Methodologies for Monitoring Wetlands. Remote Sens. 2015, 7, 7615–7645. [Google Scholar] [CrossRef] [Green Version]
  189. Zomer, R.J.; Trabucco, A.; Ustin, S.L. Building spectral libraries for wetlands land cover classification and hyperspectral remote sensing. J. Environ. Manag. 2009, 90, 2170–2177. [Google Scholar] [CrossRef]
  190. Baker, C.; Lawrence, R.; Montagne, C.; Patten, D. Mapping wetlands and riparian areas using Landsat ETM+ imagery and decision-tree-based models. Wetlands 2006, 26, 465–474. [Google Scholar] [CrossRef]
  191. Töyrä, J.; Pietroniro, A. Towards operational monitoring of a northern wetland using geomatics-based techniques. Remote Sens. Environ. 2005, 97, 174–191. [Google Scholar] [CrossRef]
  192. Mutanga, O.; Adam, E.; Cho, M.A. High density biomass estimation for wetland vegetation using WorldView-2 imagery and random forest regression algorithm. Int. J. Appl. Earth Obs. Geoinf. 2012, 18, 399–406. [Google Scholar] [CrossRef]
  193. Mahdianpari, M.; Motagh, M.; Akbari, V.; Mohammadimanesh, F.; Salehi, B. A Gaussian random field model for de-speckling of multi-polarized Synthetic Aperture Radar data. Adv. Space Res. 2019, 64, 64–78. [Google Scholar] [CrossRef]
  194. Pistolesi, L.I.; Ni-Meister, W.; McDonald, K.C. Mapping wetlands in the Hudson Highlands ecoregion with ALOS PALSAR: An effort to identify potential swamp forest habitat for golden-winged warblers. Wetl. Ecol. Manag. 2015, 23, 95–112. [Google Scholar] [CrossRef]
  195. Racine, M.-J.; Bernier, M.; Ouarda, T. Evaluation of RADARSAT-1 images acquired in fine mode for the study of boreal peatlands: A case study in James Bay, Canada. Can. J. Remote Sens. 2005, 31, 18. [Google Scholar] [CrossRef]
  196. Henderson, F.M.; Lewis, A.J. Radar detection of wetland ecosystems: A review. Int. J. Remote Sens. 2008, 29, 5809–5835. [Google Scholar] [CrossRef]
  197. Lang, M.W.; Kasischke, E.S.; Prince, S.D.; Pittman, K.W. Assessment of C-band synthetic aperture radar data for mapping and monitoring Coastal Plain forested wetlands in the Mid-Atlantic Region, U.S.A. Remote Sens. Environ. 2008, 112, 4120–4130. [Google Scholar] [CrossRef]
  198. Lang, M.W.; Kasischke, E.S. Using C-Band Synthetic Aperture Radar Data to Monitor Forested Wetland Hydrology in Maryland’s Coastal Plain, USA. IEEE Trans. Geosci. Remote Sens. 2008, 46, 535–546. [Google Scholar] [CrossRef]
  199. Scheuchl, B.; Flett, D.; Caves, R.; Cumming, I. Potential of RADARSAT-2 data for operational sea ice monitoring. Can. J. Remote Sens. 2004, 30, 14. [Google Scholar] [CrossRef]
  200. Touzi, R.; Omari, K.; Sleep, B.; Jiao, X. Scattered and Received Wave Polarization Optimization for Enhanced Peatland Classification and Fire Damage Assessment Using Polarimetric PALSAR. IEEE J. Sel. Top. Appl. Earth Obs. Remote Sens. 2018, 11, 4452–4477. [Google Scholar] [CrossRef]
  201. Cloude, S.R.; Pottier, E. An entropy based classification scheme for land applications of polarimetric SAR. IEEE Trans. Geosci. Remote Sens. 1997, 35, 68–78. [Google Scholar] [CrossRef]
  202. Freeman, A.; Durden, S.L. A three-component scattering model for polarimetric SAR data. IEEE Trans. Geosci. Remote Sens. 1998, 36, 963–973. [Google Scholar] [CrossRef] [Green Version]
  203. van Zyl, J.J.; Arii, M.; Kim, Y. Model-Based Decomposition of Polarimetric SAR Covariance Matrices Constrained for Nonnegative Eigenvalues. IEEE Trans. Geosci. Remote Sens. 2011, 49, 3452–3459. [Google Scholar] [CrossRef]
  204. Yamaguchi, Y.; Moriyama, T.; Ishido, M.; Yamada, H. Four-component scattering model for polarimetric SAR image decomposition. IEEE Trans. Geosci. Remote Sens. 2005, 43, 1699–1706. [Google Scholar] [CrossRef]
  205. An, W.; Xie, C.; Yuan, X.; Cui, Y.; Yang, J. Four-Component decomposition of polarimetric sar images with deorientation. IEEE Geosci. Remote Sens. Lett. 2011, 8, 1090–1094. [Google Scholar] [CrossRef]
  206. Hong, S.-H.; Wdowinski, S. Double-Bounce Component in Cross-Polarimetric SAR from a New Scattering Target Decomposition. IEEE Trans. Geosci. Remote Sens. 2014, 52, 3039–3051. [Google Scholar] [CrossRef]
  207. Lang, M.; Townsend, P.; Kasischke, E. Influence of incidence angle on detecting flooded forests using C-HH synthetic aperture radar data. Remote Sens. Environ. 2008, 112, 3898–3907. [Google Scholar] [CrossRef]
  208. Marti-Cardona, B.; Lopez-Martinez, C.; Dolz-Ripolles, J.; Bladè-Castellet, E. ASAR polarimetric, multi-incidence angle and multitemporal characterization of Doñana wetlands for flood extent monitoring. Remote Sens. Environ. 2010, 114, 2802–2815. [Google Scholar] [CrossRef]
  209. Blanchette, M.; Rousseau, A.N.; Poulin, M. Mapping wetlands and land cover change with landsat archives: The added value of geomorphologic data: Cartographie de la dynamique spatio-temporelle des milieux humides à partir d’archives Landsat: La valeur ajoutée de données géomorphologiques. Can. J. Remote Sens. 2018, 44, 337–356. [Google Scholar] [CrossRef]
  210. Whitcomb, J.; Moghaddam, M.; McDonald, K.; Podest, E.; Chapman, B. Decadal change in northern wetlands based on differential analysis of JERS and PALSAR data. IEEE Int. Geosci. Remote Sens. Symp. 2009, 3, 951–954. [Google Scholar]
  211. Wang, J.; Liu, Z.; Yu, H.; Li, F. Mapping spartina alterniflora biomass using lidar and hyperspectral data. Remote Sens. 2017, 9, 589. [Google Scholar] [CrossRef] [Green Version]
  212. Chasmer, L.; Hopkinson, C.; Montgomery, J.; Petrone, R. A Physically Based Terrain Morphology and Vegetation Structural Classification for Wetlands of the Boreal Plains, Alberta, Canada. Can. J. Remote Sens. 2016, 42, 521–540. [Google Scholar] [CrossRef]
  213. Jahncke, R.; Leblon, B.; Bush, P.; LaRocque, A. Mapping wetlands in Nova Scotia with multi-beam RADARSAT-2 Polarimetric SAR, optical satellite imagery, and Lidar data. Int. J. Appl. Earth Obs. Geoinf. 2018, 68, 139–156. [Google Scholar] [CrossRef]
  214. Maxa, M.; Bolstad, P. Mapping northern wetlands with high resolution satellite images and LiDAR. Wetlands 2009, 29, 248–260. [Google Scholar] [CrossRef]
  215. Pietroniro, A.; Toyra, J. A multi-sensor remote sensing approach for monitoring large wetland complexes in northern Canada. In Proceedings of the IEEE International Geoscience and Remote Sensing Symposium, Toronto, ON, Canada, 24–28 June 2002. [Google Scholar]
  216. Lang, M.; McCarty, G.; Oesterling, R.; Yeo, I.-Y. Topographic Metrics for Improved Mapping of Forested Wetlands. Wetlands 2013, 33, 141–155. [Google Scholar] [CrossRef]
  217. Lang, M.W.; McCarty, G.W. Lidar intensity for improved detection of inundation below the forest canopy. Wetlands 2009, 29, 1166–1178. [Google Scholar] [CrossRef]
  218. DeVries, B.; Huang, C.; Lang, M.; Jones, J.; Huang, W.; Creed, I.; Carroll, M. Automated Quantification of Surface Water Inundation in Wetlands Using Optical Satellite Imagery. Remote Sens. 2017, 9, 807. [Google Scholar] [CrossRef] [Green Version]
  219. Huang, C.; Peng, Y.; Lang, M.; Yeo, I.-Y.; McCarty, G. Wetland inundation mapping and change monitoring using Landsat and airborne LiDAR data. Remote Sens. Environ. 2014, 141, 231–242. [Google Scholar] [CrossRef]
  220. Jin, H.; Huang, C.; Lang, M.W.; Yeo, I.-Y.; Stehman, S.V. Monitoring of wetland inundation dynamics in the Delmarva Peninsula using Landsat time-series imagery from 1985 to 2011. Remote Sens. Environ. 2017, 190, 26–41. [Google Scholar] [CrossRef] [Green Version]
  221. Mahdianpari, M.; Rezaee, M.; Zhang, Y.; Salehi, B. Wetland classification using deep convolutional neural network. IEEE Int. Geosci. Remote Sens. Symp. 2018, 9249–9252. [Google Scholar]
  222. Merchant, M.A.; Warren, R.K.; Edwards, R.; Kenyon, J.K. An Object-Based Assessment of Multi-Wavelength SAR, Optical Imagery and Topographical Datasets for Operational Wetland Mapping in Boreal Yukon, Canada. Can. J. Remote Sens. 2019, 45, 308–332. [Google Scholar] [CrossRef]
  223. Polar Geospatial Center. Blue Waters Extended to Produce Global Topography: High-Resolution Digital Elevation Models of the Entire Earth. Available online: https://www.pgc.umn.edu/news/blue-waters-extended-to-produce-global-topography/ (accessed on 13 May 2020).
  224. Brisco, B.; Li, K.; Tedford, B.; Charbonneau, F.; Yun, S.; Murnaghan, K. Compact polarimetry assessment for rice and wetland mapping. Int. J. Remote Sens. 2013, 34, 1949–1964. [Google Scholar] [CrossRef] [Green Version]
  225. Campbell, A.D.; Wang, Y. Salt marsh monitoring along the mid-Atlantic coast by Google Earth Engine enabled time series. PLoS ONE 2020, 15, e0229605. [Google Scholar] [CrossRef] [PubMed] [Green Version]
  226. Tamiminia, H.; Salehi, B.; Mahdianpari, M.; Quackenbush, L.; Adeli, S.; Brisco, B. Google Earth Engine for geo-big data applications: A meta-analysis and systematic review. ISPRS J. Photogramm. Remote Sens. 2020, 164, 152–170. [Google Scholar] [CrossRef]
Figure 1. Ecological and socioeconomic impacts of wetland loss.
Remotesensing 12 01882 g001
Figure 2. Various wetlands in Newfoundland and Labrador, Canada. From top left to bottom right: marsh wetland, swamp wetland, shallow-water wetland, bog wetland.
Remotesensing 12 01882 g002
Figure 3. A fen (a), marsh (b), and open-water (c) wetland transition near Conne River, Newfoundland and Labrador, Canada.
Remotesensing 12 01882 g003
Figure 4. Cowardin Wetland Classification System.
Remotesensing 12 01882 g004
Figure 5. Canadian Wetland Classification System.
Remotesensing 12 01882 g005
Figure 6. Mexican Wetland Classification System proposed by [111] (translation).
Remotesensing 12 01882 g006
Figure 7. Tag cloud showing the highest frequency terms in North American wetland classification papers. The larger the text, the more frequently the word appeared in the wetland classification papers.
Remotesensing 12 01882 g007
Figure 8. Flowchart demonstrating the selection of studies.
Remotesensing 12 01882 g008
Figure 9. Average overall accuracy (colors) and the number of studies (numbers) in North American provinces, states, and regions.
Remotesensing 12 01882 g009
Figure 10. Number of wetland classification papers published per journal (only those journals that have published 2 or greater papers are included).
Remotesensing 12 01882 g010
Figure 11. Number and time trend in the publication of wetland classification papers since 1975 to 2019 (September).
Remotesensing 12 01882 g011
Figure 12. Type(s) of data used in wetland classification studies.
Remotesensing 12 01882 g012
Figure 13. Overall accuracy of various data types.
Remotesensing 12 01882 g013
Figure 14. Application of various sensors in wetland classification studies. The green bar represents the number of studies that use only the data from a single sensor. The red bar represents the number of studies that use the data from a sensor in combination with other data sources.
Remotesensing 12 01882 g014
Figure 15. Overall accuracy of various sensors.
Remotesensing 12 01882 g015
Figure 16. Correlation of overall accuracy and spatial resolution.
Remotesensing 12 01882 g016
Figure 17. Correlation of overall accuracy and number of features.
Remotesensing 12 01882 g017
Figure 18. Correlation of overall accuracy and number of wetland classes in the final map.
Remotesensing 12 01882 g018
Figure 19. Overall accuracy of various classification methods.
Remotesensing 12 01882 g019
Figure 20. Overall accuracy of pixel-based vs, object-based classification and single-date vs. multi-temporal imagery. The red bar represents the median overall accuracy per classification strategy.
Remotesensing 12 01882 g020
Table 1. Search query design (DEM: Digital Elevation Model, LiDAR: Light Detection And Ranging, SAR: Synthetic Aperture Radar, UAV: Unmanned Aerial Vehicle).
--------------------------------------------------- AND --------------------------------------------------
ABC
------------------ OR ----------------wetlandclassif*remote*sens
bogmap*satellite image*
fenidentif*aerial photo*
marshdiscriminat*UAV
swampmonitor*optical
peatlandobject-basedRadar
flooded vegetationpixel-basedSAR
salt marsh*object-orientedmultispectral
temperate peatland*invento*hyperspectral
land*cover LiDAR
DEM
Table 2. Twenty-two attributes used for the meta-analysis database of wetland mapping in North America.
#AttributeTypeCategories
1 TitleFree text
2 AuthorsFree text
3 Publication yearFree text
4 Paper type Classes Article; Conference
5 Citation Numeric
6 Research institute Free text
7 Study area Free text Provinces; States
8Data type Classes Optical; Radar; LiDAR
9 Sensor Classes Landsat; RADARSAT; WorldView; Satellite Pour l’Observation de la Terre (SPOT); GeoEye; Advanced Spaceborne Thermal Emission and Reflection Radiometer (ASTER); Others
10Temporal scopeClassesSingle Date; Multi Temporal
11 Sampling strategy Classes Stratified random sampling; simple random sampling;
Others; Not Available
12 Processing unit Classes Pixel, Object
13 Extracted feature Classes Original bands; Normalized Difference Vegetation Index (NDVI); Normalized Difference Water Index (NDWI); Soil-adjusted Vegetation Index (SAVI); Synthetic-Aperture Radar (SAR) intensities; Total backscattering power (SPAN); Others
14 Number of extracted features Numeric
15 Classification method Classes Supervised, Unsupervised
16 Classifier Classes Support-Vector Machine (SVM); Random Forest (RF); Convolution Neural Network (CNN); Decision Tree (DT); (Maximum Liklihood Classification (MLC); Iterative Self-Organizing Data Analysis Technique Algorithm (ISODATA); Thresholding; Spectral Angle Mapper (SAM); Mahalanobis distance; Others; NA
17 Distinguished wetland types Numeric
18 Evaluation indices Classes Overall Accuracy; User’s Accuracy; Producer’s accuracy; Kappa coefficient; F1-Score; Not Available
19 Overall accuracy Numeric
20 Map resolution Numeric
21Study area sizeNumeric
22Classification systemClassesCowardin, Canadian Wetland Classification System; Zonal; Species; Functional Group; Others; Not Available
Table 3. Wetland classification articles ranked by number of citations normalized by years (as of 18 September 2019).
RankAverage Number of Citations per YearClassifierFirst Author-Year [Reference]
132Random Forest (RF)Millard-2015 [31]
223Random Forest (RF)Mahdianpari-2017 [29]
322Convolutional Neural Networks (CNN)Mahdianpari-2018 [78]
418ThresholdingWhite-2015 [188]
517Spectral Angle Mapper (SAM)Zomer-2009 [189]
617Decision Tree (DT)Baker-2006 [190]
714Random Forest (RF)Mahdianpari-2018 [81]
814Convolutional Neural Networks (CNN)Rezaee-2018 [76]
913Random Forest (RF)Corcoran-2013 [155]
1012Mahalanobis DistanceTöyrä-2005 [191]

