Abstract
The rapid developments in the field of digital aerial photogrammetry (DAP) in recent years have increased interest in the application of DAP data for extracting three-dimensional (3D) models of forest canopies. This technology, however, still requires further investigation to confirm its reliability in estimating forest attributes in complex forest conditions. The main purpose of this study was to evaluate the accuracy of tree height estimation based on a crown height model (CHM) generated from the difference between a DAP-derived digital surface model (DSM) and an airborne laser scanning (ALS)-derived digital terrain model (DTM). The tree heights determined based on the DAP-CHM were compared with ground-based measurements and heights obtained using ALS data only (ALS-CHM). Moreover, tree- and stand-related factors were examined to evaluate the potential influence on the obtained discrepancies between ALS- and DAP-derived heights. The obtained results indicate that the differences between the means of field-measured heights and DAP-derived heights were statistically significant. The root mean square error (RMSE) calculated in the comparison of field heights and DAP-derived heights was 1.68 m (7.34%). The results obtained for the CHM generated using only ALS data produced slightly lower errors, with RMSE = 1.25 m (5.46%) on average. Both ALS and DAP displayed the tendency to underestimate tree heights compared to those measured in the field; however, DAP produced a higher bias (1.26 m) than ALS (0.88 m). Nevertheless, DAP heights were highly correlated with the heights measured in the field (R2 = 0.95) and ALS-derived heights (R2 = 0.97). Tree species and height difference (the difference between the reference tree height and mean tree height in a sample plot) had the greatest influence on the differences between ALS- and DAP-derived heights. Our study confirms that a CHM computed based on the difference between a DAP-derived DSM and an ALS-derived DTM can be successfully used to measure the height of trees in the upper canopy layer.
1. Introduction
The implementation of sustainable forest management requires reliable, accurate and up-to-date information on forest ecosystems [1,2]. Information on forest resources plays a crucial role in decision-making processes and forest management planning, including at the strategic level (long-term planning) and in the case of operational forestry (silvicultural treatments, harvesting plans, etc.) [3]. Typically, such information reflects the size, quantity and condition of forest resources and is provided as a result of forest inventories [4]. However, the characteristics, size and complexity of forest ecosystems make data collection in forests challenging; thus, traditional, ground-based measurements are often considered laborious, time consuming and expensive [5]. The high demand for accurate and up-to-date information and the constant goal of cost reduction have resulted in a growing interest in alternatives to ground-based forest inventory methods that are effective, precise and objective [6,7,8,9,10].
The ability to characterize the forest canopy structure through the application of three-dimensional information has revolutionized environmental studies and inventories of forest resources [11]. Since the late 1990s, when airborne laser scanning (ALS) data were first introduced for forestry applications, researchers emphasized the great potential of 3-D data for the direct mapping of the structural features of trees and forest stands [12,13,14,15,16]. In subsequent years, ALS attracted enormous interest among foresters around the world, and an increasing number of studies demonstrated that ALS can provide reliable information on the forest structure; therefore, the future of ALS methods in the field of forestry looked very promising [17,18,19,20,21,22]. The applications of 3D point clouds and their derivative 2.5D products (digital terrain models (DTMs) and digital surface models (DSMs)) include the detection of single trees [23], estimation of stem densities [24], determination of tree height [13,25], definition of species compositions [26,27], estimation of tree/stand volumes [28,29], estimation of the aboveground biomass [30,31], and estimation of subcanopy solar radiation [32]. Due to the noninvasiveness, speed of data acquisition, automated computational processes and high accuracy of LiDAR systems, ALS data have been increasingly used in large-scale forest inventories [33,34,35]. Moreover, tests performed in Nordic countries, such as Norway, Sweden and Finland, have verified that 3D data captured through ALS technology can be the main data source for forest management inventories (FMIs) [36,37].
The popularity of LiDAR 3D point clouds in a multitude of applications has resulted in a significant increase in interest in alternative methods of creating three-dimensional models of forest canopies [9,11,38]. One such technique that is currently experiencing a revival (mainly due to data digitization and technological progress) is image stereomatching, which is the process of reproducing 3D information from a set of two-dimensional overlapping photos taken from different viewing directions but depicting the same object [39,40,41]. Specialized photogrammetric software allows for the automatic generation of 3D point clouds based on high-resolution digital aerial photographs with appropriate along-track and across-track overlap [42]. The stereomatching process can also be successfully used to create DSMs [43,44,45,46,47,48]. 3D point clouds and DSMs obtained on the basis of stereomatching using high-resolution aerial imagery have already proven their usefulness for determining many features of trees and stands, including the tree height [49], basal area [40], and timber volume [50]. Moreover, the aforementioned studies claimed that the accuracy of stereophotogrammetric measurements is comparable to that of the results obtained through ALS-based methods. Therefore, the 3D data obtained as a result of processing high-resolution aerial images are considered a very promising alternative to LiDAR sources of information on the forest structure [11,50].
Although the 3D canopy models generated by DAP and ALS methods have similar properties [51], it should be emphasized that there are some fundamental differences between those two sources of 3D information that may affect the quality of derivative products and their potential application [11,52]. Obviously, the main difference concerns the technology (type of sensors) and the data recording method; photogrammetry is a passive remote sensing (RS) technique (records reflected light), and ALS is an active RS technique (emits its own light). LiDAR technology can be used for the direct collection of 3D data and measurements of the vertical structure of vegetation [52], while stereomatching techniques require sophisticated image processing methods to generate 3D models. Moreover, laser beams are capable of penetrating canopy cover and thus enabling the generation of high-quality DTMs [53] and measurements of subcanopy vegetation (located under the canopy envelope) [54]. The application of image-derived point clouds is limited to characterizing only the upper canopy (objects visible from the air) [55]. The production of high-quality DTMs and CHMs in forested areas is challenging, as is collecting measurements of subcanopy and understory vegetation. The data acquisition process and flight mission plan also greatly differ. Photogrammetric flight missions are more sensitive to weather and lighting conditions; precipitation, clouds, fog, smog and solar illumination are considered important factors that affect image data acquisition. Occlusions or shadows in the forest canopy may have a considerable impact on the quality of the image-matching process [9]. It is important to note, however, that photogrammetric flight missions may be performed at higher altitudes than those in ALS, and the aircraft can fly faster, which provides the possibility to collect information about the same area in a much shorter time than in the case of ALS [41,56]; therefore, the data acquisition costs are lower for DAP than for ALS. Currently, due to developments in the field of digital photography, the automation of image processing methods and significant reductions in the cost of acquiring “from the air” imagery (easy to access the technology needed for aerial imagery acquisition, e.g., unmanned aerial vehicle (UAV) systems), processing digital aerial imagery to generate 3D point clouds is no longer an immense challenge.
One of the most important features of trees and stands that can be determined based on three-dimensional forest models is the height of the trees [57]. Tree height is considered fundamental tree information and is crucial for forest planning and management [13,58]. Tree height is also a key variable for estimating the stem volume [19,28,59], aboveground biomass [30] and site productive capacity [60]. The height of a tree can also provide valuable information about the health condition of the corresponding forest stand [61]. Tree height is also one of the most common tree features measured in the field [62]. Quick and accurate measurements of tree height have always been a priority for foresters [63], which is why tree height determination on the basis of 3D models has been the subject of many studies and analyses [13,20,25,51]. The CHMs generated from ALS data or DAP data have proven to be reliable sources of information about the height of trees and stands [56,64,65,66,67]. Most of the aforementioned studies reported very strong relationships between the heights measured in the field and those determined on the basis of CHM. Sibona et al. [68] and Ganz et al. [69] observed that the tree heights derived from high-quality RS data may be even closer to the real tree height (measurements of felled trees) than conventional (indirect) field measurements.
The vast majority of research in this area, however, is limited to homogeneous stands dominated by conifers and with relatively simple structures [38,70,71]. The usefulness of image-derived and ALS-derived CHMs for determining the height of trees in structurally diverse multispecies stands has been less often addressed. Moreover, many tests were conducted in well-managed forests, which, as noted by Bohlin et al. [70] and Holopainen et al. [9], may have a positive influence on the accuracy of forest attribute estimation based on RS data. As suggested by White et al. [11], comparative studies of DAP and ALS methods in more complex forests must be performed. A number of studies have noted that DAP methods must be further evaluated to assess the accuracy of these methods for different forest types [47,71,72,73].
In this study, we attempt to fill this research gap by performing comparative DAP and ALS tests involving tree height estimation performed at the single-tree level in the diverse multispecies stands of Białowieża National Park. The main aim of this study is to verify the accuracy of tree height determination based on 3D models obtained from two different sources (ALS and DAP) and to compare the results with heights of trees measured in the field. The analysis was performed at the single-tree level. Moreover, tree- and stand-related factors were examined to evaluate their potential effects on the obtained discrepancies between ALS- and DAP-derived heights. The study examined 843 trees representing 7 major forest-forming tree species in the temperate zone.
2. Materials and Methods
2.1. Study Area
Białowieża National Park (BNP) is located in northeastern Poland (on the border between Poland and Belarus) (Figure 1); it was established in 1921. The total area of BNP is approximately 10,500 ha. The park protects the most valuable and best-preserved fragment of the Białowieża Forest Complex (UNESCO World Heritage Site). The terrain is relatively flat (144–176 m a.s.l. based on ALS data). The climate is defined as subcontinental. According to Pierzgalski et al. [74], the average annual precipitation is 633 mm, and the mean annual temperature is 6.8 °C (from long-term meteorological observations: 1955–2001).
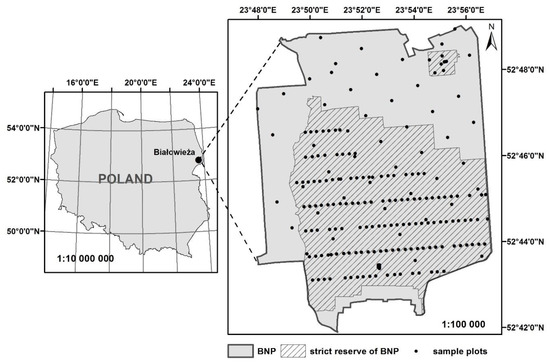
Figure 1.
Location of Białowieża National Park (BNP) and sample plots.
BNP is a diverse forest area composed of multispecies and multistory stands of various ages [75]. The most common tree species in the strict reserve of BNP are oak, hornbeam, lime, spruce, alder, birch, pine and maple [76]. The characteristic forest site types are mesic and moist broadleaved forests (over 50% of all habitats) dominated by oak, lime and hornbeam [77].
2.2. Field-Based Measurements
The field data were collected in the leaf-on season in 2015. For the purposes of the study, data from 198 circular (r = 12.62 m) sample plots established as a part of the Life+ ForBioSensing project were used. Tree height measurements were obtained using an ultrasonic hypsometer VERTEX IV (Haglöf Sweden AB). A clinometer was used in accordance with the guidelines specified by the manufacturer. Height measurements were obtained by experienced observers, always from a position with good visibility for the top of the tree and at a distance equal to or greater than half of the pre-estimated height of the tree. The transponder was placed directly under the treetop at a height of 1.30 m. In addition, the spatial location of each tree in the sample plot was recorded in accordance with the methodology described by Mielcarek et al. [67].
The study considered the tree height measurements of 843 trees representing 7 important temperate zone forest-forming species: Norway spruce (Picea abies L.), Scots pine (Pinus silvestris L.), oak (Quercus spp.), European hornbeam (Carpinus betulus L.), birch (Betula spp.), lime (Tilia spp.), and alder (Alnus spp.). The detailed distribution and characteristics of the measured trees are presented in Figure 2.
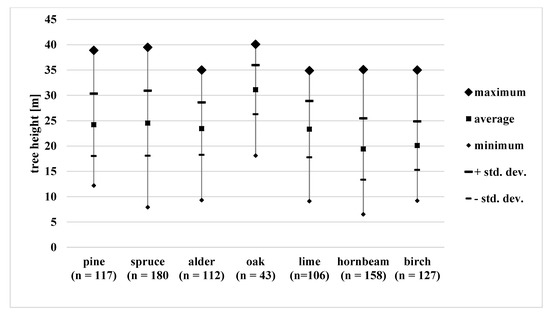
Figure 2.
Descriptive statistics of trees measured in the field.
2.3. Remote Sensing Data Acquisition
Both flight missions (ALS and photogrammetric) were performed at the same time: between 2 July and 5 July 2015. The LiDAR dataset was collected using a Riegl LMS-Q680i scanner (full-waveform) installed on the Vulcanair P-68 Observer platform. The average point density was 7 pts/m2. The horizontal and vertical accuracies of the point clouds were ≤ 0.20 m and ≤ 0.15 m, respectively (Table 1).

Table 1.
Airborne laser scanning (ALS) vs. aerial imagery—comparison of data acquisition parameters.
The aerial images (4-band: RGB and NIR) were acquired using the UltraCam Eagle system at an altitude of 3040 m (above ground level (AGL)), and the minimal solar elevation angle was 20°. The ground sampling distance (GSD) was 0.20 m. The minimum along-track and across-track overlap percentages of images were 90% and 40%, respectively. Visibility during the flight mission was very good, which allowed us to obtain high-quality images.
2.4. ALS Data Processing
The DTM was generated in TerraSolid Software using an ALS-derived point cloud. A raster with a resolution of 0.50 m was interpolated by employing the triangular irregular network (TIN) method. In this process, only the ground-classified LiDAR points (2nd ASPRS LAS class) registered as last returns were applied. The accuracy of the generated DTM was evaluated using 93 ground-measured GPS (RTK) control points, and the root mean square error (RMSE) = 0.12 m.
The DSM was computed in LasTools Software by applying the las2dem tool. LiDAR points registered as first returns were triangulated (Delaunay triangulation) into TINs and interpolated to a grid of resolution of 0.5 m. Finally, a crown height model (CHM) with a 0.5 m resolution was generated by subtraction of DSM and DTM.
2.5. Image Data Processing
Aerial imagery processing steps for 3D point cloud production were performed in AgiSoft PhotoScan Professional (Version 1.2.6) software (Agisoft, Russia). A total of 243 aerial photographs of BNP were used in the study. The workflow of image data processing consisted of 2 main steps: (i) image alignment (aerial triangulation with bundle block adjustment) and (ii) the production of the dense point cloud. The images provided by the flight mission contractor were geopositioned; nevertheless, the geopositioning results were refined using the GCPs. Due to the relatively low number (11) GCPs measured in the field and uneven distribution (mostly at the edges of the study area; no points in the center of the area) of GCPs, 26 manual tie points were additionally digitized from the images and used in the process of block adjustment. The image alignment procedure was performed with a high accuracy setting. An accuracy assessment of the aerial triangulation process was performed using cross-validation based on the leave-one-out method (Table 2). A dense point cloud was generated from a set of photos oriented using all GCPs as control points. To obtain detailed and precise geometric relations, the following reconstruction options were set: the reconstruction quality was high, and depth filtering mode was disabled. The average point cloud density reached 15 points/m2.
Table 2.
The accuracy of aerial triangulation [m].
The dense point cloud obtained as a result of aerial imagery processing was exported into LAS file format. The DSM (resolution of 0.5 m) was produced with a method similar to that used for the ALS-derived DSM. Point cloud processing was conducted in LasTools Software. A crown height model (CHM) with a 0.5 m resolution was also obtained as a result of subtraction of DAP-derived DSM and ALS-derived DTM.
2.6. Tree Height Estimation
The process of determining tree heights based on RS data was divided into 3 main stages: (i) tree segmentation, which included the vectorization of tree crowns based on the ALS-derived CHM; (ii) combining field data with segments and verifying the accuracy of data joining; and (iii) calculating statistics for selected segments of the generated CHMs (ALS- and image-derived models). Each of these steps is briefly described below.
- i.
- The first stage of determining the height of trees based on CHMs involved delineating tree crowns (tree segmentation). Individual trees were detected using the CHM generated based on ALS data. The applied segmentation method was described in detail by Stereńczak et al. [78]. The obtained data processing result was in the form of a vector layer representing the ranges of tree crowns; this information was used in subsequent stages to determine the heights of trees and perform data analysis.
- ii.
- The next stage included the processing of field data and assigning the field-collected information (tree height and species) to polygons, which represented the crowns of trees generated in the segmentation process. Based on precise information about the locations of trees measured in the field, a point layer illustrating the location of each tree in the sample plot was generated. In the next step, the layer was linked (spatially joined) to segments representing tree crowns. Then, the matching accuracy was verified to eliminate errors related to oversegmentation or undersegmentation that could cause mismatch between field measurements and measurements based on RS data. The evaluation consisted of a visual assessment of the quality of the segmentation process and verification of the tree species assigned to the segment based on high-resolution aerial photographs and field data. Each segment was manually checked. In subsequent steps, only the segments for which tree-to-tree comparisons of RS-based height estimates and direct field-based measurements was possible were selected.
- iii.
- In the final step, statistics for selected segments were calculated based on the CHMs generated from ALS data and aerial photos. The height of the highest pixel in the CHM model within a given segment was considered the tree height determined based on RS data. The heights were determined in a similar way for both CHMs (ALS and image-derived CHMs). The tree heights calculated from RS data were then compared with the heights measured in the field.
2.7. Statistical Analysis
Statistical analyses were aimed at (a) assessing the accuracy of RS methods in relation to ground-based measurements, (b) obtaining a detailed analysis of the discrepancies between ALS- and DAP-derived heights, and (c) determining the most important factors related to the differences between DAP and ALS. For most of the analysis, the results were divided based on species to illustrate the differences among the results for individual species.
2.7.1. Accuracy Assessment of RS Tree Height Estimation Methods
First, the DAP- and ALS-derived tree heights were compared to field-surveyed values and analyzed. Descriptive statistics were calculated for the heights obtained with 3 methods. Next, a paired sample t-test was applied to determine whether the mean heights obtained by field surveys, the ALS method and the DAP method were significantly different. Furthermore, a linear regression analysis was applied to obtain the degree of the association between ALS- and DAP-derived heights and those from field surveys. The coefficient of determination R2 was calculated to evaluate the goodness of fit of the prediction model. The data were analyzed using STATISTICA 10 at the level of significance of 0.05. Furthermore, the accuracy of determining the height of trees based on RS methods in relation to ground measurements (treated as reference data) was tested. The accuracy assessment was performed by calculating the bias and Root Mean Square Error (RMSE). Errors were computed according to the following formulas:
where n is the number of observations (trees), is the field-measured tree height for observation i, and is the height measured using RS-based methods for observation i.
2.7.2. Analysis of Differences Between ALS- and DAP-Derived Tree Heights
In subsequent stages of the analysis, the differences between the heights determined using DAP and ALS were examined. In general, statistical tests similar to those employed in the comparison of RS methods with field surveys were used, including a t-test, linear regression analysis and difference assessment based on the Root Mean Squared Difference (RMSD) and Mean Difference (MD). The RMSD and MD for ALS versus DAP comparisons were computed in a similar way as the RMSE (1) and bias (2), respectively.
In the final step, a machine learning technique with boosted regression trees (BRTs; [79]) was used to determine the most important stand- and tree-related factors that influenced the discrepancies between ALS- and DAP-derived heights. BRTs can fit complex nonlinear relationships, automatically account for interaction effects among predictors, and process different types of response data [79]. The general objective of the BRT statistical technique is to compute a sequence of simple trees, where each successive tree is built from the predicted residuals of the preceding tree. BRT models reflect how well each model explains the observed data (training data correlation) and how well excluded data can be predicted (CV correlation). Relative importance values were generated for all predictors (totaling 100% for all the included variables) to indicate each variable’s relative contribution to the model [79,80]. The overall fitted function in a BRT model is obtained using partial dependence functions that demonstrate the effect of a variable after accounting for the average effect of all other variables in the model [79].
The BRT analysis was performed separately for two dependent variables: the difference (d; the result of subtracting the ALS- and DAP-derived tree heights [m]) and absolute difference (|d|, the absolute value of the difference (d) [m]). The tree- and plot-related variables considered in both BRT analyses are presented in Table 3.
Table 3.
Variables considered in the boosted regression trees (BRT) analysis.
Models were implemented in R version 3.0.3 [81] using the gbm package [82,83] with a Gaussian response distribution and 10-fold cross-validation. Each model was defined with a tree complexity (number of nodes) of 3, a learning rate of 0.005, and a 0.50 bag fraction (proportion of data selected in each step).
3. Results
3.1. Accuracy of ALS and DAP as Tree Height Estimation Methods
In Table 4, an overview of the descriptive statistics of the tree height measured by DAP, ALS and the field-based survey is presented. The distribution of measured heights varies across the species; according to the field data, the smallest measured tree was hornbeam (h = 6.50 m), and the tallest was oak (h = 40.10 m). It is worth noting, however, that the differences between the minimum and maximum heights measured in the field and RS-derived heights are relatively high; moreover, the trees representing the highest and lowest trees are different for different measurement methods. The analysis of average heights obtained based on ALS and DAP data indicates that both RS methods of tree height estimation tend to underestimate tree heights in comparison to the field-surveyed values; such a tendency was observed for each tree species.
Table 4.
Descriptive statistics of tree heights obtained for different measurement methods.
The t-test analysis provided strong evidence that the differences between the field and RS-based height measurements are statistically significant (p < 0.05). The obtained MDs are 1.26 m (field measurement vs. DAP-derived heights) and 0.89 m (field measurements vs. ALS-derived heights).
Generally, the errors (both RMSE and bias) associated with the ALS-CHM are smaller than the errors produced by the DAP-CHM (Table 5). The RMSEs calculated for all trees were 1.25 m and 1.68 m for field vs. ALS and field vs. DAP values, respectively. The highest RMSE for both RS methods compared to the field survey values was observed for oak (RMSE = 1.98 m for ALS-derived heights, and RMSE = 2.53 m for DAP-derived heights). An analysis of the bias indicated that the heights estimated based on RS data, including both ALS-derived heights (bias = 0.89 m) and DAP-derived heights (bias = 1.26 m), were underestimated in comparison to field measurements.
Table 5.
Errors (RMSE and bias) and differences (RMSD and MD) obtained for the applied methods of height estimation (divided by species).
The results of the regression analysis clearly indicate that the tree heights determined based on both CHM models are strongly correlated with the heights measured in the field. The coefficients of determination obtained for all the trees considered in the study were 0.97 (field-measured heights vs. ALS-derived heights) and 0.95 (field-measured heights vs. DAP-derived heights) (Figure 3). The species-specific analysis revealed that the correlation between field measurements and RS-derived heights was lowest for oaks (R2 = 0.92 for ALS-CHM and R2 = 0.91 for DAP-CHM) (Table 6). The strongest correlation was observed for spruce (R2 = 0.98 for ALS-derived heights) and pine in the case of DAP-derived heights (R2 = 0.96).
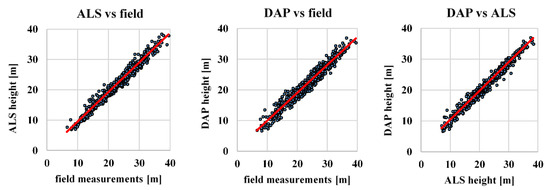
Figure 3.
The correspondence between the tree heights derived from ALS, DAP and field measurements.
Table 6.
Regression analysis of the tree heights derived from all methods applied in this study.
3.2. Differences in Tree Heights Estimated Based on DAP and ALS and the Factors that Influence These Differences
The analysis of the MD between ALS and DAP values indicated that the DAP-derived heights are underestimated in comparison to the ALS-derived heights by 0.38 m on average. Although the MD between tree heights computed with these RS methods is relatively low, the t-test confirmed that the difference between the means of the DAP- and ALS-derived heights is statistically significant (p < 0.05). The MDs between the ALS and DAP heights for the species studied ranged from -0.14 m (hornbeam) to 1.05 m (spruce, Table 5). Generally, the average differences between the RS-derived tree heights for deciduous trees were much lower than those for coniferous trees (MDs between ALS- and DAP-derived heights were 0.19 m and 0.82 m, respectively, for deciduous and coniferous trees). The correspondence between DAP-derived heights and ALS-derived heights is very high at R2 = 0.97 (for all the trees considered in this study). The strongest correlation between the RS methods was observed for pine (R2 = 0.99), and the lowest correlation was observed for birch (R2 = 0.95).
The results of BRT modeling for the difference (d) and absolute difference (|d|) between ALS- and DAP-derived heights using tree-related and plot-related parameters are presented in Table 7. The models accurately explained 69% of the randomly selected input data (and predicted 53–56% of the excluded data).
Table 7.
Relative contributions (%) of different variables to discrepancies (d—difference; |d|—absolute difference) between ALS- and DAP-derived heights according to BRT analysis for all BRT models.
The BRT analysis confirmed that both responses depend mostly on the tree species and the height difference (computed as a result of subtracting the reference tree height and mean height of trees located on the plot), with relative importance levels of approximately 25% and 25–32%, respectively. The remaining factors were not significant predictors, with relative contributions of less than 10% for both BRT models.
An analysis of the partial residuals of the BRT model revealed that the greatest differences between ALS- and DAP-derived heights were found for plots in which the mean plot height was much higher (or lower) than the height of the measured trees (Figure 4). The DAP-derived heights of trees growing in the vicinity of trees much higher than the measured tree were overestimated, and tall trees growing in a low neighborhood may be underestimated in relation to the ALS measurements (Figure 4). The smallest absolute differences between the RS methods were observed in cases where the mean plot height and measured tree height were similar (Figure 5). In addition, the discrepancies between DAP and ALS vary based on the tree species. The highest difference was observed for spruce.
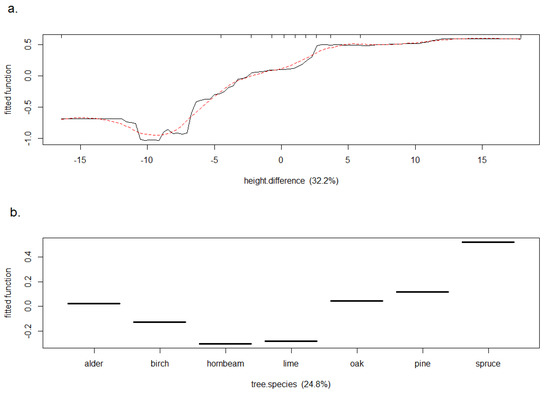
Figure 4.
Partial dependency plots for the BRT model illustrating the relationship between the difference between ALS and DAP heights and height difference (a) and tree species (b). Percentages represent the relative contributions of the predictors to the BRT model. The fitted function (y-axis) reflects the effect of the predictors on the difference between the ALS and DAP heights after all other predictors are averaged. Each tick mark at the top of the graph represents a 10th percentile of the data.
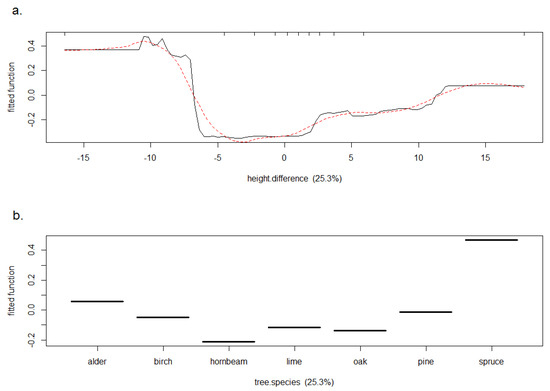
Figure 5.
Partial dependency plots for the BRT model illustrating the relationship between the absolute value of the difference between the ALS and DAP heights and the height difference (a) and tree species (b). Percentages represent the relative contributions of the predictors to the BRT model. The fitted function (y-axis) shows the effect of the predictors on the absolute value of the difference between the ALS and DAP heights after all other predictors are averaged. The tick marks represent a 10th percentile of the data.
Figure 6 shows the pairwise interactions among the most important determinants for the difference d. It is clearly visible that the linear correlation is the strongest for spruce (R = 0.53). In addition to spruce, the correlations are also statistically significant for alder (R = 0.44), pine (R = 0.38) and lime (R = 0.37). In the case of the remaining species (oak, birch and hornbeam), no linear relationship was found between the differences in heights obtained for both RS methods and the height of the surrounding trees in a given plot.
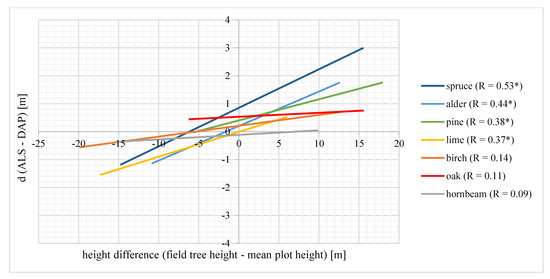
Figure 6.
Interactive effect of the height difference (field tree height—mean plot tree height) and tree species based on a BRT analysis of the discrepancies between the ALS and DAP heights. Statistically significant correlations (p < 0.05) are marked with asterisks (*).
4. Discussion
Generally, the results of our study confirm the statements presented by the authors of previous studies; notably, DAP-derived DSMs normalized using LiDAR-extracted DTMs can be successfully applied in the estimation of tree heights in the upper canopy layer [38,47,70]. The DAP-derived tree heights were strongly correlated with field measurements (R2 = 0.95). This result is in agreement with the results of other studies, which also reported a strong relationship between DAP-derived heights and field measurements [38,51,84]. The ALS-derived heights exhibited a slightly better correlation with ground-based measurements (R2 = 0.97), which is consistent with other authors’ findings [85,86]. Although the differences between the mean field-measured heights and DAP-derived heights were statistically significant, the obtained accuracy (RMSD = 7.34%) may be considered satisfactory; however, the ALS method yielded better results, with RMSD = 5.46% for ALS heights versus those from field surveys. Both methods provide results that meet the accuracy criteria for ground methods. Previous studies conducted by Scandinavian scientists reported similar errors for DAP as a source of information on tree height. Nurminen et al. [71] achieved RMSE values of 6.55% for the mean height. Bohlin et al. [70] reported an error (RMSE) of 8.8% for DAP-derived heights and concluded that for forest management planning, DAP may yield higher accuracy in forest attribute estimation than would commonly used data. The obtained results also showed a very strong association between DAP- and ALS-derived heights, with a high correlation coefficient of R2 = 0.97. Similar observations were noted by the authors of other studies that compared DAP and ALS methods in the context of forest variable estimation [7,11].
The detailed species-related analysis revealed that oak displayed the highest height errors for both the ALS and DAP methods when compared to the field-surveyed values. However, the low accuracies obtained for the oak may be influenced by the ground-based measurements. Considering the biophysical characteristics of oaks (very extensive, complex, and irregular crowns) and the study area specifics (a very diverse, old, multilayered, species-rich, and unmanaged forest complex), some difficulties in field-based tree height measurements may have arisen [67]. Wang et al. [87] noted that the accuracy of field-based tree height measurements is more unstable in complex forest stands than in simple forest stands. Field tree height measurements for species of trees characterized by extensive crowns (without a clear apex) may be problematic, as discussed by Mielcarek et al. [67]. Luoma et al. [62] noted that the limited visibility of tree tops and inability to clearly identify the highest point of the tree may affect conventional tree height measurements, especially in dense forest stands. Furthermore, as claimed by Stereńczak et al. [88], the accuracy of the ground-based tree height measurements (compared to the tree length after felling) may vary by species. According to their findings the mean absolute error obtained for oak (0.65 m) was much higher than that for other tested species. Moreover, out of the eight species tested, oak was the only species for which the field-measured heights were overestimated, when compared to the tree length after felling [88]. Other studies reported that ground-based tree height measurements may overestimate the heights of tall trees [61,87], which may influence the results for oak obtained in this study; notably, the average height of oaks considered in our study was 31.13 m. The results of the abovementioned studies are interesting in the context of our study, as they may explain the relatively low accuracy obtained for oak. Noting the tendency to underestimate tree heights in the case of RS data-based methods and the potential overestimation of oak heights in field surveys, it is highly probable that the errors in the case of oak could be inflated.
The direct comparison of both RS methods showed that the differences between ALS- and DAP-derived heights vary regarding to the tree species; this result was confirmed by the BRT analysis, which indicated that the effect of tree species on the difference between ALS and DAP heights is very high. This finding is consistent with those of Halbritter [89], who stated that tree- and stand-related factors (e.g., the species mixture, size and spatial distribution of trees) may affect the stereomatching quality. Korpela and Anttila [90] also indicated that the dominant tree species may influence the accuracy of measurements based on DAP data. We observed that the largest discrepancy in results occurred for spruce trees, and the DAP-derived heights were underestimated compared to the ALS-derived heights by approximately 1 m on average. The tendency of DAP to understate the height of trees in the case of the coniferous species was also noted by Heurich [91], who described a case in which the tops of tall conifers were not considered by DAP. Korpela [90] and Miller et al. [72] also reported that conifers, due to their elongated crown shapes, may be troublesome for stereomatching algorithms and lead to the underestimation of tree heights. Generally, an image-derived 3D model was found to be smoother than the ALS equivalent and struggled to reproduce tree tops, especially in the case of tree species such as spruce with conical crown shapes and clearly exposed tops. Hese and Lehmann [92] suggested that the DAP-derived DSM is not suitable for height measurements of conifers because the image-matching algorithms fail to precisely rebuild the spruce stand surface (a laser method performed much better). Næsset [84] also noted that the image-matching results for deciduous tree species may be better than those for coniferous trees due to their smooth crown shape—precise reproduction of conifers may be problematic for image matching algorithms. Our study confirms this finding to some extent because the average differences we noted among the RS-derived tree heights for deciduous trees were much lower than those for coniferous trees (MDs between ALS- and DAP-derived heights were 0.19 m and 0.82 m, respectively, for deciduous and coniferous trees). The smoothing effect caused by the stereomatching procedure and the related factors were discussed by St-Onge and Vega [49]. Both methods of estimating the tree height based on RS data had a tendency to underestimate the height of trees in relation to field-measured heights, with similar findings reported by other authors [84,91]. However, all the results indicate that although slightly worse results were obtained for DAP-CHM, both methods are suitable for the precise measurement of all the tree species analyzed in this work.
Overall, we found that the heights of trees in the immediate vicinity of a measured tree had a significant impact on the differences between DAP and ALS. The height difference obtained as a result of subtracting the height of a specific tree measured in the field from the average height of the trees located in a plot turned out to be the most important factor related to the differences between DAP and ALS. The DAP-derived heights for trees surrounded by much higher trees are generally overestimated, and the heights of trees that significantly exceed the average plot height are often underestimated. The lowest differences between DAP and ALS-derived heights were noted for trees growing in plots characterized by a relatively homogeneous height structure, where the heights of the trees in the immediate vicinity of a measured tree did not differ significantly from the height of the measured tree. This finding agrees with the results of Miller et al. [72], who suggested that the canopy nonuniformity and large height variations in canopy models may affect the accuracy of tree height estimation using DAP data. Notably, one of the reasons for this result is the above-described smoothing effect in the case of DAP, which results in the removal of tree tops, as described by Heurich et al. [91], and the poor representation of the shapes of trees growing in gaps. Moreover, poor crown lighting, shadows, occlusions, and the immediate proximity of much taller objects can cause the reproduction of the shapes of trees growing in gaps to be highly disturbed. The investigation performed by Korpella and Anttila [90] showed that stereomatching fails to accurately reproduce the canopy surface in forest stands with gaps. St-Onge [51] found that height variations for the ALS-derived CHM are larger than those for DAP-derived tree heights, which may indicate that tree tops and small gaps are better reproduced by ALS data. It should be noted, however, that even if small changes in canopy height models are not well reconstructed by DAP, the mean tree height (e.g., at the plot level) is precisely predicted [49], so the smoothing issue does not eliminate DAP as an effective method of tree height estimation. However, considering the above conclusions, caution is advised when applying DAP methods to measure the height of trees in the case of multispecies stands with various vertical structures, even though the overall results obtained in this study are satisfactory.
Undoubtedly, the use of 3D information derived from aerial photographs in forest canopy structure research has great potential. It should be noted, however, that there are some significant limitations to this method resulting from both the technology itself (passive sensors, which record reflected light) and the specificity of the forest environment (the complexity of the forest canopy). The main problem noted by many scientists is the inability to penetrate the upper layer of the stand; specifically, image-derived point clouds can provide reliable information about the outer canopy envelope only [11,93]. In the case of complex multistory stands, this limitation may result in the inability to generate an accurate high-resolution DTM. Thus, this issue is considered a significant limitation because DTM is used to normalize 3D data and therefore has a direct impact on the accuracy of forest inventory attribute estimation, especially with respect to the height of trees. Such an accurate high-resolution DTM for heavily vegetated forested areas can be extracted from ALS data [94]; thus, solutions based on image-based DSM standardization using an ALS-derived DTM are common [51,70]. In theory, the use of image-based points is therefore limited to forest areas scanned by ALS [11], which is a significant limitation. On the other hand, we need to highlight that nowadays, many countries have available ALS data from various surveys (national campaigns, research projects, etc.) performed in the past [51]; thus, obtaining a high-resolution DTM should not be a problem in many cases. Moreover, as noted by Hala et al. [46] and McRoberts [95], DTMs are considered relatively constant. The terrain topography in most forested areas does not change much and frequent over the time; thus, it is highly probable that DTMs will remain reliable for a long time [47,51]. Notwithstanding, it is advisable to check carefully if the terrain topography has not changed significantly over time due to factors such as erosion before performing an analysis [96]. In addition, some studies have focused on the estimation of forest-growing stock using DAP data without high-resolution DTMs, the results of which are very promising [97].
The lack of ability to penetrate the upper layer of the stand, however, is not only a problem for the extraction of accurate DTMs but also for the detection and measurement of trees growing below the upper stand canopy [45]. Such a limitation means that the use of image-derived 3D information is often limited to use in single-story stands; in other cases (e.g., multistory stands), one should be aware that the vegetation growth data under the canopy envelope are often incomplete or lacking. Therefore, in practice, image-derived 3D models are a source of reliable information about the forest canopy, but only with respect to the upper layer of the stand.
Regarding the limitations of imaging technology, we must emphasize that the weather and light conditions are important factors that may affect the image quality and subsequent use. Photogrammetric flight missions are dependent on weather and light conditions; precipitation, clouds, fog, smog and solar illumination are considered important factors that influence image data acquisition. Occlusions or shadows in the forest canopy may have a considerable impact on the quality of the image-matching process [9] and consequently affect the precision of measurements made on the basis of DAP-derived CHMs. ALS technology is less sensitive to weather (only heavy precipitation and wind are limiters) and light conditions (theoretically, it can be used regardless of the time of the day and even at night) than is DAP technology.
A very important factor in favor of using aerial photographs for the three-dimensional reproduction models of forest canopies is the lower cost of data acquisition compared to that for ALS data [91]. Photogrammetric flight missions can be performed at higher altitudes than ALS missions, and the aircraft can fly faster, which provides the possibility to collect information over the same area in a much shorter time than that in the case of ALS [41,56]. It has been estimated that the costs of obtaining image data are approximately 1/3 to ½ of the cost associated with acquiring ALS data [11]. Moreover, high-resolution aerial imagery is often captured cyclically by national or regional agencies, thereby reducing the acquisition cost of imagery and increasing the potential for further applications in forest inventories [41]. In Scandinavian countries, aerial imagery is collected regularly at relatively short intervals, such as every 5 years [57]; therefore, DAP provides a reliable, cost-effective data source for predicting and regularly updating forest resource information [38]. Additionally, inventories of relatively small forest areas (e.g., 1–10 km2) are not cost effective based on ALS methods. In such cases, UAV systems have worked well in recent years [98]. The broad availability of hardware and software, increased computational capabilities of computers and relatively low costs of purchasing drone equipment have made the use of UAVs to obtain image information about forests very common [99,100]. Such data, assuming adequate photo coverage and resolution, can be successfully used to generate three-dimensional forest models, e.g., CHMs [101]. The 3D data obtained as a result of UAV image processing can provide a reliable source of information on the forest structure and have an accuracy level similar to that of ALS data for forest attribute estimation [85].
Generally, each technology has pros and cons; however, it should be noted that the two technologies discussed in this paper may be complementary to a large extent, and their combination can have a positive impact on the quality and accuracy of derived products [52]. The best example of combining ALS and DAP data is the normalization process of DSMs. In this case, a high-quality DTM model is needed because the accuracy of measurements based on image-derived CHMs largely depends on the quality of the DTM used for normalization [41]. As noted, obtaining a high-quality DTM of a forested area is often impossible to obtain with image-matching methods; however, with an increasing number of countries currently being covered by ALS data, the availability of high-resolution LiDAR DTMs has increased significantly [9]. The application of ALS derived DTM in the process of DAP-DSM normalization positively affect the quality of the CHM and as a result, the measurements of tree features are more reliable. It should be noted that high-resolution aerial imagery is often captured cyclically and at relatively short intervals (e.g., every 5 years in Scandinavian countries [57]), which means that DAP provides the opportunity to update ALS-derived DSMs and obtain current information on the vertical canopy structure, which can be used in operational forestry (e.g., for inventories of forest resources). Furthermore, high-resolution digital aerial imagery can be used for the visual evaluation of stands (e.g., recognition of tree species and interpretation of health conditions), which is challenging or highly limited using ALS-derived products [11]. Adding the spectral information to the ALS point cloud yields a complete product and increases the potential for use in environmental analyses [27,70,102]. Considering certain aspects related to the development of DAP technology, the relatively low costs of airborne image data acquisition (compared to those of ALS), the high frequency of data acquisition and data availability (e.g., with the use of UAVs), it is highly probable that methods of extracting point clouds from photos will be developed, and their use in operational forestry will likely become widespread in the future.
5. Conclusions
The obtained results indicate that the image-derived DSM normalized using ALS extracted DTM, can be successfully used in the estimation of tree heights in the upper layer of a forest stand at a single tree level. The DAP-derived tree heights were strongly correlated with the heights measured in the field and ALS-derived heights. The tree height information provided by DAP-CHM was achieved with an accuracy similar to that obtained from ALS data. It has to be highlighted, however, that the tree heights measured based on ALS data exhibited slightly higher correlations with field-surveyed data and produced better accuracies than did DAP data. Both ALS and DAP displayed the tendency to underestimate tree heights compared to those measured in the field.
The DAP-derived CHM was found to be smoother than the ALS equivalent, which results in the worse reproduction of tree tops and the poorer representation of the shapes of trees growing in gaps. Tall conifers characterized by conical crown shapes and clearly exposed tops, such as spruce, may have significantly underestimated heights compared to those in field surveys and ALS data. Moreover, when applying DAP data to estimate the heights of trees at the single-tree level, significant differences in height between a specific tree and those in the immediate vicinity may affect the measurement accuracy. The heights of trees in the vicinity of much taller trees are often overestimated, and the heights of tall trees that grow in low neighborhoods can be underestimated when compared to ALS-derived heights and field measurements.
Although the future of DAP technology as a source of 3D forest information looks very promising, it should be emphasized that currently, this 3D data extraction method is not able to fully replace ALS technology, mainly due to limitations related to the inability to penetrate the upper layer of forest stands. DAP provides 3D point clouds that are generally suitable for DSM generation only—the production of high-resolution DEMs in forested areas and obtaining measurements of subcanopy and understory vegetation are challenging, limited or impossible. Finally, the tree heights measured based on ALS data exhibited higher correlations with field-surveyed data and produced slightly better accuracies than DAP data did. This research has confirmed, however, that DAP can be a cost-effective and reliable data source for updating a height information related to the upper canopy layer in areas where high-resolution DTMs are available.
Author Contributions
Conceptualization, M.M., K.S.; methodology, M.M., K.S.; statistical analysis, A.K., M.M.; investigation, M.M.; writing—original draft preparation, M.M.; writing—review and editing, M.M., A.K., K.S.; visualization, M.M.; supervision, M.M., K.S.; funding, K.S.; All authors have read and agreed to the published version of the manuscript.
Funding
This work was financially supported by the Project LIFE+ ForBioSensing PL Comprehensive monitoring of stand dynamics in Białowieża Forest supported with remote sensing techniques is co-funded by European Commision Life+ program (contract number LIFE13 ENV/PL/000048) and The National Fund for Environmental Protection and Water Management in Poland (contract number 485/2014/WN10/OP-NM-LF/D).
Acknowledgments
Authors would like to thank Łukasz Jełowicki for his assistance in DAP data processing.
Conflicts of Interest
The authors declare no conflict of interest.
References
- Wilkie, M.L.; Holmgren, P.; Castaneda, F. Sustainable Forest Management and the Ecosystem Approach: Two Concepts, One Goal; Forest Management Working Paper; FAO: Rome, Italy, 2003. [Google Scholar]
- Holopainen, M.; Vastaranta, M.; Hyyppä, J. Outlook for the Next Generation’s Precision Forestry in Finland. Forests 2014, 5, 1682–1694. [Google Scholar] [CrossRef]
- Wulder, M.A.; Bater, C.W.; Coops, N.C.; Hilker, T.; White, J.C. The role of LiDAR in sustainable forest management. For. Chron. 2008, 84, 807–826. [Google Scholar] [CrossRef]
- Kangas, A.; Maltamo, M. Forest Inventory: Methodology and Applications; Springer Science & Business Media: New York, NY, USA, 2006; ISBN 978-1-4020-4381-9. [Google Scholar]
- Fournier, R.; Mailly, D.; Walter, J.-M.; Soudani, K. Indirect Measurement of Forest Canopy Structure from In Situ Optical Sensors; Springer: New York, NY, USA, 2003; pp. 77–113. ISBN 978-1-4613-5014-9. [Google Scholar]
- Maltamo, M.; Packalén, P.; Peuhkurinen, J.; Suvanto, A.; Pesonen, A.; Hyyppä, J. Experiences and possibilities of ALS based forest inventory in Finland. In Proceedings of the ISPRS Workshop on Laser Scanning, Espoo, Finland, 12–14 September 2007; pp. 12–14. [Google Scholar]
- Vastaranta, M.; Holopainen, M.; Yu, X.; Haapanen, R.; Melkas, T.; Hyyppä, J.; Hyyppä, H. Individual tree detection and area-based approach in retrieval of forest inventory characteristics from low-pulse airborne laser scanning data. Photogramm. J. Finl. 2011, 22, 1–13. [Google Scholar]
- White, J.C.; Wulder, M.A.; Varhola, A.; Vastaranta, M.; Coops, N.C.; Cook, B.D.; Pitt, D.; Woods, M. A best practices guide for generating forest inventory attributes from airborne laser scanning data using an area-based approach. For. Chron. 2013, 89, 722–723. [Google Scholar] [CrossRef]
- Holopainen, M.; Vastaranta, M.; Karjalainen, M.; Karila, K.; Kaasalainen, S.; Honkavaara, E.; Hyyppa, J. Forest Inventory Attribute Estimation Using Airborne Laser Scanning, Aerial Stereo Imagery, Radargrammetry and Interferometry-Finnish Experiences of the 3D Techniques. ISPRS Ann. Photogramm. Remote Sens. Spatial Inf. Sci. 2015, II-3/W4, 63–69. [Google Scholar] [CrossRef]
- Goodbody, T.R.; Coops, N.C.; Marshall, P.L.; Tompalski, P.; Crawford, P. Unmanned aerial systems for precision forest inventory purposes: A review and case study. For. Chron. 2017, 93, 71–81. [Google Scholar] [CrossRef]
- White, J.C.; Wulder, M.A.; Vastaranta, M.; Coops, N.C.; Pitt, D.; Woods, M. The utility of image-based point clouds for forest inventory: A comparison with airborne laser scanning. Forests 2013, 4, 518–536. [Google Scholar] [CrossRef]
- Naesset, E. Estimating timber volume of forest stands using airborne laser scanner data. Remote Sens. Environ. 1997, 61, 246–253. [Google Scholar] [CrossRef]
- Næsset, E. Determination of mean tree height of forest stands using airborne laser scanner data. ISPRS J. Photogramm. Remote Sens. 1997, 52, 49–56. [Google Scholar] [CrossRef]
- Nelson, R. Modeling forest canopy heights: The effects of canopy shape. Remote Sens. Environ. 1997, 60, 327–334. [Google Scholar] [CrossRef]
- Magnussen, S.; Boudewyn, P. Derivations of stand heights from airborne laser scanner data with canopy-based quantile estimators. Can. J. For. Res. 1998, 28, 1016–1031. [Google Scholar] [CrossRef]
- Hyyppa, J. Detecting and estimating attributes for single trees using laser scanner. Photogramm. J. Finl. 1999, 16, 27–42. [Google Scholar]
- Baltsavias, E.P. Airborne laser scanning: Existing systems and firms and other resources. ISPRS J. Photogramm. Remote Sens. 1999, 54, 164–198. [Google Scholar] [CrossRef]
- Lefsky, M.A.; Cohen, W.B.; Acker, S.A.; Parker, G.G.; Spies, T.A.; Harding, D. Lidar remote sensing of the canopy structure and biophysical properties of Douglas-fir western hemlock forests. Remote Sens. Environ. 1999, 70, 339–361. [Google Scholar] [CrossRef]
- St-Onge, B.A. Estimating individual tree heights of the boreal forest using airborne laser altimetry and digital videography. Int. Arch. Photogramm. Remote Sens. 1999, 32, W14. [Google Scholar]
- Magnussen, S.; Eggermont, P.; LaRiccia, V.N. Recovering tree heights from airborne laser scanner data. For. Sci. 1999, 45, 407–422. [Google Scholar]
- Means, J.E.; Acker, S.A.; Fitt, B.J.; Renslow, M.; Emerson, L.; Hendrix, C.J. Predicting forest stand characteristics with airborne scanning lidar. Photogramm. Eng. Remote Sens. 2000, 66, 1367–1372. [Google Scholar]
- Lim, K. Estimation of individual tree heights using LiDAR remote sensing. In Proceedings of the Twenty-Third Annual Canadian Symposium on Remote Sensing, Quebec, QC, Canada, 20–24 August 2001. [Google Scholar]
- Koch, B.; Heyder, U.; Weinacker, H. Detection of individual tree crowns in airborne lidar data. Photogramm. Eng. Remote Sens. 2006, 72, 357–363. [Google Scholar] [CrossRef]
- Hall, S.A.; Burke, I.C.; Box, D.O.; Kaufmann, M.R.; Stoker, J.M. Estimating stand structure using discrete-return lidar: An example from low density, fire prone ponderosa pine forests. For. Ecol. Manag. 2005, 208, 189–209. [Google Scholar] [CrossRef]
- Persson, A.; Holmgren, J.; Soderman, U. Detecting and measuring individual trees using an airborne laser scanner. Photogramm. Eng. Remote Sens. 2002, 68, 925–932. [Google Scholar]
- Holmgren, J.; Persson, A. Identifying species of individual trees using airborne laser scanner. Remote Sens. Environ. 2004, 90, 415–423. [Google Scholar] [CrossRef]
- Kamińska, A.; Lisiewicz, M.; Stereńczak, K.; Kraszewski, B.; Sadkowski, R. Species-related single dead tree detection using multi-temporal ALS data and CIR imagery. Remote Sens. Environ. 2018, 219, 31–43. [Google Scholar] [CrossRef]
- Maltamo, M.; Eerikäinen, K.; Pitkänen, J.; Hyyppä, J.; Vehmas, M. Estimation of timber volume and stem density based on scanning laser altimetry and expected tree size distribution functions. Remote Sens. Environ. 2004, 90, 319–330. [Google Scholar] [CrossRef]
- Hyyppä, J.; Yu, X.; Hyyppä, H.; Maltamo, M. Methods of airborne laser scanning for forest information extraction. In Proceedings of the Workshop on 3D Remote Sensing in Forestry, Vienna, Austria, 14–15 February 2006; pp. 14–15. [Google Scholar]
- Lim, K.S.; Treitz, P.M. Estimation of above ground forest biomass from airborne discrete return laser scanner data using canopy-based quantile estimators. Scand. J. For. Res. 2004, 19, 558–570. [Google Scholar] [CrossRef]
- Popescu, S.C. Estimating biomass of individual pine trees using airborne lidar. Biomass Bioenergy 2007, 31, 646–655. [Google Scholar] [CrossRef]
- Olpenda, A.S.; Stereńczak, K.; Będkowski, K. Estimation of sub-canopy solar radiation from LiDAR discrete returns in mixed temporal forest of Białowieża, Poland. Int. J. Appl. Earth Obs. Geoinf. 2019, 79, 116–132. [Google Scholar] [CrossRef]
- Næsset, E. Airborne laser scanning as a method in operational forest inventory: Status of accuracy assessments accomplished in Scandinavia. Scand. J. For. Res. 2007, 22, 433–442. [Google Scholar] [CrossRef]
- Hyyppä, J.; Hyyppä, H.; Leckie, D.; Gougeon, F.; Yu, X.; Maltamo, M. Review of methods of small-footprint airborne laser scanning for extracting forest inventory data in boreal forests. Int. J. Remote Sens. 2008, 29, 1339–1366. [Google Scholar] [CrossRef]
- Breidenbach, J.; Næsset, E.; Lien, V.; Gobakken, T.; Solberg, S. Prediction of species specific forest inventory attributes using a nonparametric semi-individual tree crown approach based on fused airborne laser scanning and multispectral data. Remote Sens. Environ. 2010, 114, 911–924. [Google Scholar] [CrossRef]
- Nilsson, M.; Nordkvist, K.; Jonzén, J.; Lindgren, N.; Axensten, P.; Wallerman, J.; Egberth, M.; Larsson, S.; Nilsson, L.; Eriksson, J.; et al. A nationwide forest attribute map of Sweden predicted using airborne laser scanning data and field data from the National Forest Inventory. Remote Sens. Environ. 2017, 194, 447–454. [Google Scholar] [CrossRef]
- Kangas, A.; Astrup, R.; Breidenbach, J.; Fridman, J.; Gobakken, T.; Korhonen, K.T.; Maltamo, M.; Nilsson, M.; Nord-Larsen, T.; Næsset, E.; et al. Remote sensing and forest inventories in Nordic countries—Roadmap for the future. Scand. J. For. Res. 2018, 33, 397–412. [Google Scholar] [CrossRef]
- Vastaranta, M.; Wulder, M.A.; White, J.C.; Pekkarinen, A.; Tuominen, S.; Ginzler, C.; Kankare, V.; Holopainen, M.; Hyyppä, J.; Hyyppä, H. Airborne laser scanning and digital stereo imagery measures of forest structure: Comparative results and implications to forest mapping and inventory update. Can. J. Remote Sens. 2013, 39, 382–395. [Google Scholar] [CrossRef]
- Rahlf, J.; Breidenbach, J.; Solberg, S.; Næsset, E.; Astrup, R. Comparison of four types of 3D data for timber volume estimation. Remote Sens. Environ. 2014, 155, 325–333. [Google Scholar] [CrossRef]
- White, J.; Stepper, C.; Tompalski, P.; Coops, N.; Wulder, M. Comparing ALS and image-based point cloud metrics and modelled forest inventory attributes in a complex coastal forest environment. Forests 2015, 6, 3704–3732. [Google Scholar] [CrossRef]
- Goodbody, T.R.; Coops, N.C.; White, J.C. Digital Aerial Photogrammetry for Updating Area-Based Forest Inventories: A Review of Opportunities, Challenges, and Future Directions. Curr. For. Rep. 2019, 5, 55–75. [Google Scholar] [CrossRef]
- Leberl, F.; Irschara, A.; Pock, T.; Meixner, P.; Gruber, M.; Scholz, S.; Wiechert, A. Point Clouds: Lidar versus 3D Vision. Photogramm. Eng. 2010, 76, 1123–1134. [Google Scholar] [CrossRef]
- Baltsavias, E.; Gruen, A.; Eisenbeiss, H.; Zhang, L.; Waser, L.T. High-quality image matching and automated generation of 3D tree models. Int. J. Remote Sens. 2008, 29, 1243–1259. [Google Scholar] [CrossRef]
- Waser, L.T.; Baltsavias, E.; Ecker, K.; Eisenbeiss, H.; Feldmeyer-Christe, E.; Ginzler, C.; Küchler, M.; Zhang, L. Assessing changes of forest area and shrub encroachment in a mire ecosystem using digital surface models and CIR aerial images. Remote Sens. Environ. 2008, 112, 1956–1968. [Google Scholar] [CrossRef]
- Hirschmugl, M. Derivation of Forest Parameters from UltracamD Data. Ph.D. Thesis, Graz University of Technology, Graz, Austria, 2008. [Google Scholar]
- Haala, N. Comeback of digital image matching. Photogramm. Week 2009, 9, 289–301. [Google Scholar]
- Järnstedt, J.; Pekkarinen, A.; Tuominen, S.; Ginzler, C.; Holopainen, M.; Viitala, R. Forest variable estimation using a high-resolution digital surface model. ISPRS J. Photogramm. Remote Sens. 2012, 74, 78–84. [Google Scholar] [CrossRef]
- Straub, C.; Stepper, C. Using Digital Aerial Photogrammetry and the Random Forest Approach to Model Forest Inventory Attributes in Beech- and Spruce-Dominated Central European Forests. Available online: https://www.ingentaconnect.com/content/schweiz/pfg/2016/00002016/00000003/art00001 (accessed on 26 November 2019).
- St-Onge, B.; Véga, C. Combining Stereo-Photogrammetry and Lidar to Map Forest Canopy Height. 2003. Available online: https://www.researchgate.net/publication/242073042_COMBINING_STEREOPHOTOGRAMMETRY_AND_LIDAR_TO_MAP_FOREST_CANOPY_HEIGHT (accessed on 26 May 2020).
- Straub, C.; Stepper, C.; Seitz, R.; Waser, L.T. Potential of UltraCamX stereo images for estimating timber volume and basal area at the plot level in mixed European forests. Can. J. Res. 2013, 43, 731–741. [Google Scholar] [CrossRef]
- St-Onge, B.; Vega, C.; Fournier, R.A.; Hu, Y. Mapping canopy height using a combination of digital stereo-photogrammetry and lidar. Int. J. Remote Sens. 2008, 29, 3343–3364. [Google Scholar] [CrossRef]
- Baltsavias, E. A comparison between photogrammetry and laser scanning. ISPRS J. Photogramm. Remote Sens. 1999, 54, 83–94. [Google Scholar] [CrossRef]
- Petzold, B.; Reiss, P.; Stössel, W. Laser scanning—Surveying and mapping agencies are using a new technique for the derivation of digital terrain models. ISPRS J. Photogramm. Remote Sens. 1999, 54, 95–104. [Google Scholar] [CrossRef]
- Hill, R.A.; Broughton, R.K. Mapping the understorey of deciduous woodland from leaf-on and leaf-off airborne LiDAR data: A case study in lowland Britain. ISPRS J. Photogramm. Remote Sens. 2009, 64, 223–233. [Google Scholar] [CrossRef]
- Nuijten, R.J.G.; Coops, N.C.; Goodbody, T.R.H.; Pelletier, G. Examining the Multi-Seasonal Consistency of Individual Tree Segmentation on Deciduous Stands Using Digital Aerial Photogrammetry (DAP) and Unmanned Aerial Systems (UAS). Remote Sens. 2019, 11, 739. [Google Scholar] [CrossRef]
- St-Onge, B.; Audet, F.-A.; Bégin, J. Characterizing the Height Structure and Composition of a Boreal Forest Using an Individual Tree Crown Approach Applied to Photogrammetric Point Clouds. Forests 2015, 6, 3899–3922. [Google Scholar] [CrossRef]
- Gobakken, T.; Bollandsås, O.M.; Næsset, E. Comparing biophysical forest characteristics estimated from photogrammetric matching of aerial images and airborne laser scanning data. Scand. J. For. Res. 2015, 30, 73–86. [Google Scholar] [CrossRef]
- Božić, M.; Čavlović, J.; Lukić, N.; Teslak, K.; Kos, D. Efficiency of ultrasonic Vertex III hypsometer compared to the most commonly used hypsometers in Croatian forestry. Croat. J. For. Eng. J. Theory Appl. For. Eng. 2005, 26, 91–99. [Google Scholar]
- Holmgren, J. Prediction of tree height, basal area and stem volume in forest stands using airborne laser scanning. Scand. J. For. Res. 2004, 19, 543–553. [Google Scholar] [CrossRef]
- Panagiotidis, D.; Abdollahnejad, A.; Surovỳ, P.; Chiteculo, V. Determining tree height and crown diameter from high-resolution UAV imagery. Int. J. Remote Sens. 2017, 38, 2392–2410. [Google Scholar] [CrossRef]
- Vaglio Laurin, G.; Ding, J.; Disney, M.; Bartholomeus, H.; Herold, M.; Papale, D.; Valentini, R. Tree height in tropical forest as measured by different ground, proximal, and remote sensing instruments, and impacts on above ground biomass estimates. Int. J. Appl. Earth Obs. Geoinf. 2019, 82, 101899. [Google Scholar] [CrossRef]
- Luoma, V.; Saarinen, N.; Wulder, M.; White, J.; Vastaranta, M.; Holopainen, M.; Hyyppä, J. Assessing precision in conventional field measurements of individual tree attributes. Forests 2017, 8, 38. [Google Scholar] [CrossRef]
- Bragg, D.C. Accurately Measuring the Height of (Real) Forest Trees. J. For. 2014, 112, 51–54. [Google Scholar] [CrossRef]
- Popescu, S.C.; Wynne, R.H.; Nelson, R.F. Estimating plot-level tree heights with lidar: Local filtering with a canopy-height based variable window size. Comput. Electron. Agric. 2002, 37, 71–95. [Google Scholar] [CrossRef]
- Holmgren, J.; Nilsson, M.; Olsson, H. Estimation of Tree Height and Stem Volume on Plots Using Airborne Laser Scanning. For. Sci. 2003, 49, 419–428. [Google Scholar] [CrossRef]
- Kwak, D.-A.; Lee, W.-K.; Lee, J.-H.; Biging, G.S.; Gong, P. Detection of individual trees and estimation of tree height using LiDAR data. J. For. Res. 2007, 12, 425–434. [Google Scholar] [CrossRef]
- Mielcarek, M.; Stereńczak, K.; Khosravipour, A. Testing and evaluating different LiDAR-derived canopy height model generation methods for tree height estimation. Int. J. Appl. Earth Obs. Geoinf. 2018, 71, 132–143. [Google Scholar] [CrossRef]
- Sibona, E.; Vitali, A.; Meloni, F.; Caffo, L.; Dotta, A.; Lingua, E.; Motta, R.; Garbarino, M. Direct Measurement of Tree Height Provides Different Results on the Assessment of LiDAR Accuracy. Forests 2017, 8, 7. [Google Scholar] [CrossRef]
- Ganz, S.; Käber, Y.; Adler, P. Measuring Tree Height with Remote Sensing—A Comparison of Photogrammetric and LiDAR Data with Different Field Measurements. Forests 2019, 10, 694. [Google Scholar] [CrossRef]
- Bohlin, J.; Wallerman, J.; Fransson, J.E.; Olsson, H. Species-specific forest variable estimation using non-parametric modeling of multi-spectral photogrammetric point cloud data. Int. Soc. Photogramm. Remote Sens. 2012, XXXIX-B8, 387–391. [Google Scholar] [CrossRef]
- Nurminen, K.; Karjalainen, M.; Yu, X.; Hyyppä, J.; Honkavaara, E. Performance of dense digital surface models based on image matching in the estimation of plot-level forest variables. ISPRS J. Photogramm. Remote Sens. 2013, 83, 104–115. [Google Scholar] [CrossRef]
- Miller, D.R.; Quine, C.P.; Hadley, W. An investigation of the potential of digital photogrammetry to provide measurements of forest characteristics and abiotic damage. For. Ecol. Manag. 2000, 135, 279–288. [Google Scholar] [CrossRef]
- Balenović, I.; Simic Milas, A.; Marjanović, H. A Comparison of Stand-Level Volume Estimates from Image-Based Canopy Height Models of Different Spatial Resolutions. Remote Sens. 2017, 9, 205. [Google Scholar] [CrossRef]
- Pierzgalski, E.; Boczoń, A.; Tyszka, J. Zmienność opadów i położenia wód gruntowych w Białowieskim Parku Narodowym. Kosmos 2002, 4, 415–425. [Google Scholar]
- Tomiałojć, L.; Wesołowski, T. Diversity of the Białowieża Forest avifauna in space and time. J. Ornithol. 2004, 145, 81–92. [Google Scholar] [CrossRef]
- Jędrzejewski, W.; Jędrzejewska, B.; Okarma, H.; Ruprecht, A.L. Wolf predation and snow cover as mortality factors in the ungulate community of the Bialowieża National Park, Poland. Oecologia 1992, 90, 27–36. [Google Scholar] [CrossRef]
- Keczyński, A. Lasy Rezerwatu Ścisłego Białowieskiego Parku Narodowego; Białowieski Park Narodowy: Białowieża, Poland, 2017; ISBN 978-83-64513-12-1. [Google Scholar]
- Stereńczak, K.; Kraszewski, B.; Mielcarek, M.; Piasecka, Ż. Inventory of standing dead trees in the surroundings of communication routes—The contribution of remote sensing to potential risk assessments. For. Ecol. Manag. 2017, 402, 76–91. [Google Scholar] [CrossRef]
- Elith, J.; Leathwick, J.R.; Hastie, T. A working guide to boosted regression trees. J. Anim. Ecol. 2008, 77, 802–813. [Google Scholar] [CrossRef]
- Mezei, P.; Grodzki, W.; Blaženec, M.; Škvarenina, J.; Brandýsová, V.; Jakuš, R. Host and site factors affecting tree mortality caused by the spruce bark beetle ( Ips typographus ) in mountainous conditions. For. Ecol. Manag. 2014, 331, 196–207. [Google Scholar] [CrossRef]
- R Development Core Team. The R Project for Statistical Computing; R Development Core Team: Vienna, Australia, 2019. [Google Scholar]
- Ridgeway, G. Generalized Boosted Models: A Guide to the gbm Package. Documentation on the R Package ‘gbm’, version 1.6-3. Upadate 2007, 1, 2017. [Google Scholar]
- Elith, J.; Leathwick, J. Boosted Regression Trees for Ecological Modeling. R Documentation. Available online: https://cran.r-project.org/web/packages/dismo/vignettes/brt.pdf (accessed on 2 February 2020).
- Næsset, E. Determination of Mean Tree Height of Forest Stands by Digital Photogrammetry. Scand. J. For. Res. 2002, 17, 446–459. [Google Scholar] [CrossRef]
- Wallace, L.; Lucieer, A.; Malenovský, Z.; Turner, D.; Vopěnka, P. Assessment of Forest Structure Using Two UAV Techniques: A Comparison of Airborne Laser Scanning and Structure from Motion (SfM) Point Clouds. Forests 2016, 7, 62. [Google Scholar] [CrossRef]
- Moe, K.T.; Owari, T.; Furuya, N.; Hiroshima, T. Comparing Individual Tree Height Information Derived from Field Surveys, LiDAR and UAV-DAP for High-Value Timber Species in Northern Japan. Forests 2020, 11, 223. [Google Scholar] [CrossRef]
- Wang, Y.; Lehtomäki, M.; Liang, X.; Pyörälä, J.; Kukko, A.; Jaakkola, A.; Liu, J.; Feng, Z.; Chen, R.; Hyyppä, J. Is field-measured tree height as reliable as believed—A comparison study of tree height estimates from field measurement, airborne laser scanning and terrestrial laser scanning in a boreal forest. ISPRS J. Photogramm. Remote Sens. 2019, 147, 132–145. [Google Scholar] [CrossRef]
- Stereńczak, K.; Mielcarek, M.; Wertz, B.; Bronisz, K.; Zajączkowski, G.; Jagodziński, A.M.; Ochał, W.; Skorupski, M. Factors influencing the accuracy of ground-based tree-height measurements for major European tree species. J. Environ. Manag. 2019, 231, 1284–1292. [Google Scholar] [CrossRef]
- Halbritter, K. Remote Sensing for Quantifying Structural Diversity in Forests for Forest Biodiversity Assessment; The Research Program BEAR: Indicators for Monitoring and Evaluation of Forest Biodiversity in Europe, BEAR (European Union Project) Tech. Rep. No. 6; European Union: Brussels, Belgium, 2000; Available online: https://www.nna.niedersachsen.de/download/101825/B99-S2_Forests_in_Focus_Biodiversity_-_Treasures_in_the_World_s_Forests.pdf (accessed on 10 February 2020).
- Korpela, I.; Anttila, P. Appraisal of the mean height of trees by means of image matching of digitised aerial photographs. Photogramm. J. Finl. 2004, 19, 23–36. [Google Scholar]
- Heurich, M.; Schadeck, S.; Weinacker, H.; Krzystek, P. Forest parameter deriviation from DTM/DSM generated from lidar and digital modular camera (DMC). In Proceedings of the XX ISPRS Congress, Istanbul, Turkey, 12–23 July 2004. [Google Scholar]
- Hese, S.; Lehmann, F. Comparison of Digital Stand Surface Models of HRSC-A (High Resolution Stereo Camera-Airborne) and Laser Scanner for Forest Stand Characteristics; ISPRS: Amsterdam, The Netherlands, 2000; Volume 33, Part B7/2, pp. 525–532. Available online: https://pdfs.semanticscholar.org/9dfa/15a761ab33eeecd324ea079b896741b465f5.pdf?_ga=2.243792517.1278116803.1590915032-617531384.1588429633 (accessed on 10 February 2020).
- Tompalski, P.; White, J.C.; Coops, N.C.; Wulder, M.A. Quantifying the contribution of spectral metrics derived from digital aerial photogrammetry to area-based models of forest inventory attributes. Remote Sens. Environ. 2019, 234, 111434. [Google Scholar] [CrossRef]
- Reutebuch, S.E.; McGaughey, R.J.; Andersen, H.-E.; Carson, W.W. Accuracy of a high-resolution lidar terrain model under a conifer forest canopy. Can. J. Remote Sens. 2003, 29, 527–535. [Google Scholar] [CrossRef]
- McRoberts, R.E.; Chen, Q.; Gormanson, D.D.; Walters, B.F. The shelf-life of airborne laser scanning data for enhancing forest inventory inferences. Remote Sens. Environ. 2018, 206, 254–259. [Google Scholar] [CrossRef]
- Véga, C.; St-Onge, B. Height growth reconstruction of a boreal forest canopy over a period of 58 years using a combination of photogrammetric and lidar models. Remote Sens. Environ. 2008, 112, 1784–1794. [Google Scholar] [CrossRef]
- Giannetti, F.; Chirici, G.; Gobakken, T.; Næsset, E.; Travaglini, D.; Puliti, S. A new approach with DTM-independent metrics for forest growing stock prediction using UAV photogrammetric data. Remote Sens. Environ. 2018, 213, 195–205. [Google Scholar] [CrossRef]
- Puliti, S.; Ørka, H.O.; Gobakken, T.; Næsset, E. Inventory of small forest areas using an unmanned aerial system. Remote Sens. 2015, 7, 9632–9654. [Google Scholar] [CrossRef]
- Iglhaut, J.; Cabo, C.; Puliti, S.; Piermattei, L.; O’Connor, J.; Rosette, J. Structure from Motion Photogrammetry in Forestry: A Review. Curr. Rep. 2019, 5, 155–168. [Google Scholar] [CrossRef]
- Tang, L.; Shao, G. Drone remote sensing for forestry research and practices. J. For. Res. 2015, 26, 791–797. [Google Scholar] [CrossRef]
- Dempewolf, J.; Nagol, J.; Hein, S.; Thiel, C.; Zimmermann, R. Measurement of within-season tree height growth in a mixed forest stand using UAV imagery. Forests 2017, 8, 231. [Google Scholar] [CrossRef]
- Puliti, S.; Gobakken, T.; Ørka, H.O.; Næsset, E. Assessing 3D point clouds from aerial photographs for species-specific forest inventories. Scand. J. For. Res. 2017, 32, 68–79. [Google Scholar] [CrossRef]
© 2020 by the authors. Licensee MDPI, Basel, Switzerland. This article is an open access article distributed under the terms and conditions of the Creative Commons Attribution (CC BY) license (http://creativecommons.org/licenses/by/4.0/).