Article

Thunderstorm Classification Functions Based on Instability Indices and GNSS IWV for the Sofia Plain

by
Guergana Guerova
1,*,
Tsvetelina Dimitrova
2 and
Stefan Georgiev
1,2
1
Sofia University “St. Kliment Ohridski”, Physics Faculty, Department of Meteorology and Geophysics, 1164 Sofia, Bulgaria
2
Directorate of Operational and Technical Services, Hail Suppression Agency, 1606 Sofia, Bulgaria
*
Author to whom correspondence should be addressed.
Remote Sens. 2019, 11(24), 2988; https://doi.org/10.3390/rs11242988
Submission received: 31 October 2019 / Revised: 4 December 2019 / Accepted: 10 December 2019 / Published: 12 December 2019
(This article belongs to the Special Issue Convective and Volcanic Clouds (CVC))

Abstract

:
Bulgaria is a country with a high frequency of hail and thunderstorms from May to September. For the May–September 2010–2015 period, statistical regression analysis was applied to identify predictors/classification functions that contribute skills to thunderstorm forecasting in the Sofia plain. The functions are based on (1) instability indices computed from radiosonde data from Sofia station F1, and (2) combination of instability indices and Integrated Water Vapor (IWV), derived from the Global Navigation Satellite System (GNSS) station Sofia-Plana, F2. Analysis of the probability of detection and the false alarm ratio scores showed the superiority of the F2 classification function, with the best performance in May, followed by June and September. F1 and F2 scores were computed for independent data samples in the period 2017–2018 and confirmed the findings for the 2010–2015 period. Analysis of IWV and lightning flash rates for a multicell and supercell thunderstorm in June and July 2014 showed that the monthly IWV thresholds are reached 14.5 and 3.5 hours before the thunderstorm, respectively. The supercell IWV peak registered 40 min before the thunderstorm, followed by a local IWV minimum corresponding to a peak in the flash rate. In both cases, an increase of IWV during severe hail was registered, which is likely related to the hydrometeor contribution to GNSS path delay. The results of this study will be integrated into the Bulgarian Integrated NowCAsting tool for thunderstorm forecasting in the warm/convective season.

Graphical Abstract

1. Introduction

Bulgaria is a country with a high frequency of thunderstorms during the warm part of the year, from April to September. A pan-European study of thunderstorm climatology [1] reported that the regions with the highest frequency are (1) the central Mediterranean, (2) the Alps, (3) the Balkan Peninsula, and (4) the Carpathians. The annual peak of thunderstorm activity is in July and August in northern, eastern, and central Europe, and in May and June for western and southeastern Europe. Trend analysis of the mean annual number of days with thunderstorms since 1979 indicates an increase in southeastern Europe. Stations in southeastern Europe, Belgrade, Bucharest, and Sofia, share similar features, with well-defined peaks in the summertime and a rapid increase in April/May, and a decrease in October. For Sofia, the highest in Europe, the mean annual number of days with thunderstorms and severe thunderstorms has been reported, respectively, at 44 and 13 days. Severe thunderstorms are defined in [1], based on (1) radiosonde data: (a) mixed-layer convective available potential energy (CAPE > 150 J/kg) and convective inhibition (CIN > 275 J/kg), and (b) deep-layer shear combined with CAPE (WMAXSHEAR > 400 m2/s2); (2) Global Atmospheric reanalysis (ERA-Interim): (a) mixed-layer CAPE > 150 J/kg, (b) convective precipitation >0.075 mm/h, mixed-layer WMAXSHEAR > 400 m2/s2. Ref. [2] reports that west Bulgaria is the region with the highest frequency of thunderstorms, but also severe weather events, including hailstorms, torrential precipitation, and severe convectively-induced wind storms. A recent study by [3] reported on three supercell storms which developed over western Bulgaria on 8 July 2014, with hail stone sizes of up to 10 cm, strong wind gusts, and torrential rain. The Doppler radar data revealed the existence of a mesocyclone, meso-anticyclone, microburst, and a three-body scatter signature. Ref. [4] conducted a study over 155 days with precipitation in southern Bulgaria from May to September 2002–2006, with separation into two samples: (1) days with frontal convective clouds, and (2) days with free convection. It was reported that for days with hail, the mean values and the thresholds of instability indices Convective Available Potential Energy (CAPE) and Lifted Index (LI) were similar to the values determined for thunderstorm development in other regions of Europe. However, it was concluded that neither the instability indices nor the environmental parameters (temperature and pressure at Lifted Condensation Level) were able to differentiate the precipitation type. Similar results are reported from other authors [5,6,7,8,9]. Their studies showed that instability indices alone are not able to predict the probability of thunderstorm development satisfactorily. Furthermore, the universally determined threshold values are often unsatisfactory for different geographical areas with specific meteorological conditions. For these reasons, Refs. [7,8,9] propose new local threshold values, and a combination of different instability indices and atmospheric parameters.
A review [10], covering the application of ground-based Global Navigation Satellite Systems (GNSS) for studying water vapor field evolution, concluded that there is “clear evidence of the benefits that GNSS can bring to the monitoring of severe weather events”. A study in Portugal [11] reported that: (1) the temporal variation of GNSS derived Integrated Water Vapor (IWV) correlated with rainfall, and (2) can be used for the detection of heavy rain. A recent study [12] focused on the short-term forecast of intense rainfall using a neural network approach, and integration of IWV with meteorological data. Reported was an improvement in intense rainfall event detection and a reduction of the number of false-positive alarms, with a good classification score varying from 63% up to 72%, and a false positive rate of 21%. Reported was also a very high hit rate for the rain versus no rain detection and close to zero false alarms. Ref. [13] proposes a method for retrieving two indices for the degree of inhomogeneity of water vapor using the GNSS carrier phase. The first index describes the spatial variation of Water Vapor Concentration (WVC), while the second indicates higher-order Water Vapor Inhomogeneity (WVI). The horizontal scales of the indices are about 60 km and 2–3 km, respectively. The indices were applied over Japan for August 2011, and their monthly averaged values indicated: (1) distinct diurnal variation in the mountainous region of central Honshu, and (2) coincidence with the diurnal variation in precipitation frequencies in the area. The relations between the indices and precipitation indicate that the WVI is strongly correlated with intense rainfall than IWV. IWV was found to be more strongly related to precipitation lower than 10 mm/h. The spatiotemporal variations of WVC and WVI were studied for a thunderstorm on 11 August 2011 for the Tokyo area, and both were found to increase ahead of the initiation of convective precipitation [13]. Ref. [14] investigated the relationships between intense rainfall and the convergence of surface winds and WVC for heavy-rainfall cases in July–August 2011–2013. It was reported that: (1) the peak of surface wind convergence was observed 10–30 min before the heavy rainfall, (2) convergence continued to increase for approximately 30 min prior to the convergence peak time, and (3) an increase of WVC coincided with an increase in wind convergence. Thus [14] concluded that it would be possible to predict rapidly and accurately the occurrence of heavy rainfall by monitoring the temporal variations and the distributions of surface wind and WVC by a high-density observation network, like the one in the Tokyo region. Ref. [15] studied the relation between the high-frequency IWV (1 min) and intense rainfall events in Brazil, in the November–December 2011 period. A sharp IWV increase, or “jump”, was found before intense rainfall and believed to be associated with water vapor convergence, the continued formation of cloud condensate, and precipitation particles. A wavelet correlation analysis showed oscillations in the IWV time series correlated with the intense rainfall events. These oscillations are on scales related to periods of approximately 32 to 64 min (associated with IWV jumps), and 16 to 34 min (associated with positive IWV pulses). The IWV time-derivative histogram before the rainfall event revealed different distributions influenced by positive IWV pulses (derivative >9.5 kg/m2/hr) for higher intensity and extension events.
Reported in [16] is a severe flood, caused by intense rainfall, in Colorado, USA, from 9 to 16 September 2013. Analysis of IWV for the 10-year period showed that in 2013: (1) the seasonal IWV maximum extended into early September, and (2) the September monthly mean IWV exceeded the 99th percentile of climatology with a value 25% higher than the 40-year climatology. Prior to the flood, a rapid increase in IWV was found from 22 to 32 kg/m2, and remained around 30 kg/m2 for the entire event. The IWV frequency distribution in September was typically normal, while in 2013, a bimodal distribution was found with above-average IWV from 1 to 15 September, and much drier conditions from 16 to 30 September. The positive IWV anomaly during the flood was found to be a result of large-scale moisture transport from the Tropical Eastern Pacific and the Gulf of Mexico [16]. The potential of high-frequency IWV (5 and 15 min) in combination with weather radar reflectivity was exploited by [17] for a derecho event in Poland on 11 August 2017. Reported is a strong agreement between the IWV and the rate of IWV change spatial maps and radar reflectivity, with the maximum values of reflectivity and precipitation coinciding with the maximum IWV values. In addition, the GNSS derived gradients converged toward the maximum values of reflectivity. Ref. [18] presented an H2O alert system for Belgium using GNSS derived horizontal gradients of the water vapor content to detect small scale structures of the troposphere for a rainfall event on 28–29 June 2005. The alert was based on a dry/wet contrast in a 30 min time window before the initiation of a convective system. Validation of the alert system with precipitation by weather radar and satellite-derived cloud top temperature gave a score of about 80%. Ref. [19] reports on an extensive observing period in May–June 2013, with heavy rain and floods in the Czech Republic and the catchment area of the Danube river in central Europe, and the northern part of the Alps. GNSS derived gradients were found to be significantly higher compared to the one derived from Numerical Weather Prediction (NWP) models. GNSS tropospheric products were found to provide more detailed structures in the atmosphere than the NWP models were able to capture.
This manuscript aims to exploit the synergy between GNSS derived IWV and instability indices, to obtain a GNSS-based product tailored for thunderstorm analysis and nowcasting in the Sofia plain. In Section 2 the GNSS derived IWV dataset is presented, as well as the instability indices and statistical analysis. The classification function scores for thunderstorm forecasting in the May–September 2010–2018 period are discussed in Section 3.1, and two case studies of supercell and multicell thunderstorms are presented in Section 3.2. Discussion and conclusions are in Section 4 and Section 5, respectively.

2. Datasets and Method

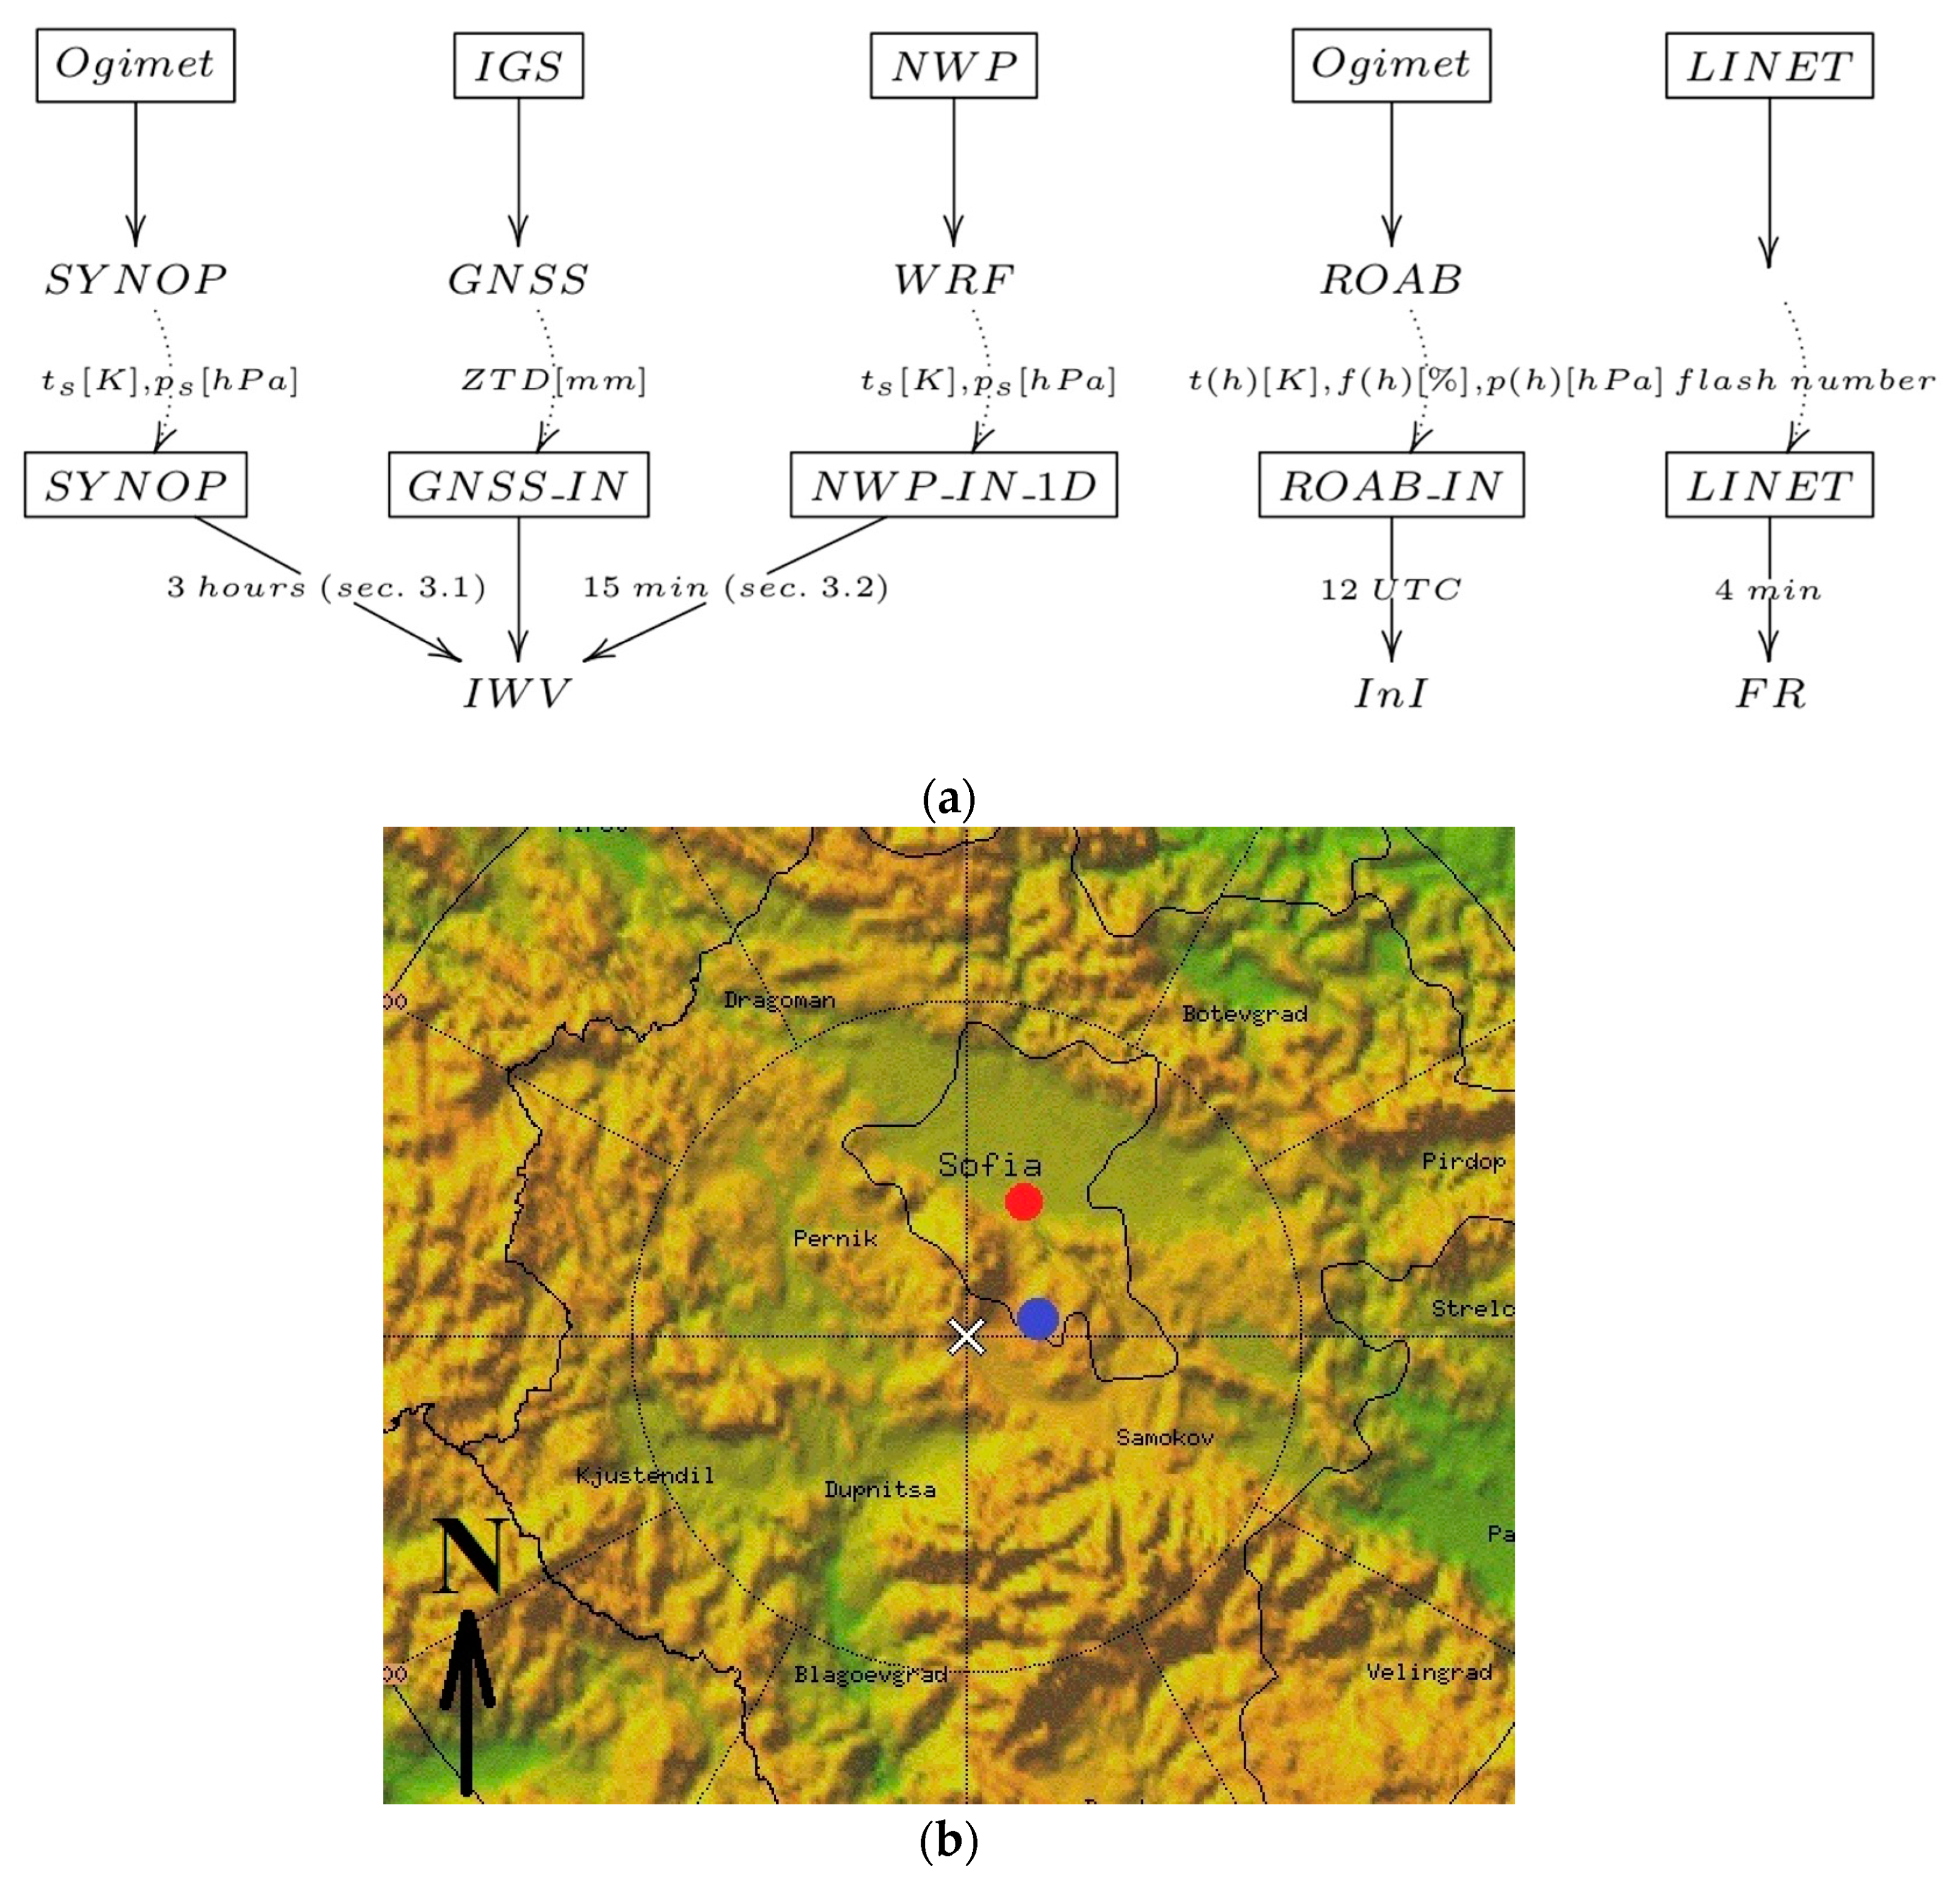
2.1. Observation Datasets

The data used in this manuscript are from Sofia University Atmospheric Data Archive (SUADA). SUADA [20] was developed in 2012 as a regional database aiming to facilitate the use of GNSS tropospheric products for meteorological and climatic studies in Bulgaria and southeastern Europe. The archived observations include: (1) GNSS, (2) surface synoptic observations (SYNOP), and (3) upper-air sounding (ROAB). Also archived in SUADA are numerical simulations with the Weather Research and Forecasting (WRF) NWP model. A schematic presentation of the SUADA dataflow used in this manuscript is presented in Figure 1a, with a detailed description of each data source given below.

2.1.1. GNSS Tropospheric Products—SOFI Station

The GNSS tropospheric products from stations Sofia-Plana (SOFI, altitude 1164 m asl.) are provided by the International GNSS Service (IGS). The tropospheric products for SOFI (blue dot on Figure 1b) are from IGS Final Troposphere estimates produced with Bernese GPS Software 5.0 (up to 2017) and 5.2 (from day 29 of year 2017) [21], using precise point positioning [22]. The IGS processing strategy [23] has the following setup: (1) IGS Final satellite orbits/clocks earth orientation parameters, (2) 7° elevation cut-off angle, (3) Global mapping function (GMF), hydrostatic and wet mapping functions [24], (4) 27 h data arc, (5) 5 min data rate, and (6) relative a-priori sigmas; for Zenith Total Delay (ZTD) 1 mm and for gradients 0.1 mm. The tropospheric product from GNSS processing used in this work is ZTD. To derive IWV, the surface pressure (ps, (hPa)) and temperature (ts, (K)) were used. Zenith Wet Delay and IWV are calculated following [25,26]
ZWD = ZTD − 0.0022768 ps/(1 − 0.00266 cos (2 ϑ − 0.00028 h)),
IWV = ZWD (106/((k3/Tm + k’2) Rv)),
Tm = 70.2 + 0.72 ts,
where k’2 = (17±10) (K/hPa), k3 = (3.776±0.004)105 (K2/hPa) are constants [27], Rv = 461.51 (J/(kg K)) is the gas constant for water vapor, Tm (K) is the weighted mean atmospheric temperature, h (km) is the height, and ϑ is the latitude variation of the gravitational acceleration. The used surface pressure and temperature are from (1) SYNOP observations with temporal resolution of 3 hours for calculating IWV, analyzed in Section 3.1, and (2) WRF simulations with temporal resolution 15 minutes for calculating IWV analyzed in Section 3.2.
The pressure difference between the GNSS and SYNOP station altitude was calculated using the polytropic barometric formula [28]
p s   =   p m   ( t t     L   ( H g     H m ) ) ( g   M / R   L ) ,
where ps is the pressure at the GNSS station altitude, pm is the pressure at SYNOP station altitude/WRF grid point, t (K) is the temperature in SYNOP station/WRF grid point, L (6.5 (K/km)) is tropospheric lapse rate, Hm (km) is the altitude of the SYNOP station/WRF grid point, Hg (km) is the altitude of the GNSS station, g is the gravitational acceleration, M (g/mol) is the molar mass of air and R ((Nm)/(mol K)) is the universal gas constant.
WRF version 3.7.1 [29] was used to derive GNSS IWV with a temporal resolution 15 min. The WRF inner domain covers Bulgaria, and has a horizontal resolution of 2 km and 45 vertical levels. The simulations were conducted using the following parametrizations schemes: (1) Unified Noah land-surface model for the land surface [30], (2) Yonsei University scheme for the planetary boundary layer [31], (3) Lin scheme for the microphysics [32], and (4) Rapid Radiative Transfer Model for long/short-wave radiation [33]. Initial and boundary conditions are from the Global Forecasting System NWP model.

2.1.2. Surface, Upper-Air and Lightning Observations at Sofia

The surface synoptic observations of (1) 2 m air temperature (ts), (2) pressure (ps), and (3) weather type, at station Sofia (595 m asl.), were collected manually by the National Institute of Meteorology and Hydrology (NIMH), at 00, 03, 06, 09, 12, 15, 18, and 21 UTC. In Figure 1b, the position of station Sofia is marked with a red dot. To compute the instability indices, the radiosonde (ROAB) profiles from Sofia station at 12 UTC were used. The instability indices used in discriminant analysis, their formula, and the reference are given in Table 1. In addition, the environmental parameter, temperature, at Lifted Condensation Level (TLCL) was calculated. Lightning data, including the observed time and location in latitude and longitude of cloud to groundstrokes, were from the European lightning detection network (LINET) [34,35]. The flash rate was calculated as the number of flashes per 4 min (FR/4min).
In Table 1, (1) V850 and V500 are the 850 and 500 hPa wind speeds (kn), (2) D850 and D700 are dewpoint (C) at 850 and 700 hPa, (3) Tlp(850hPa) is temperature (C) at 500 hPa of a parcel lifted from 850 hPa, (4) Tlp(fcs surface) is 500 hPa temperature (C) of a lifted parcel with the average pressure, temperature, and dewpoint of the layer 500 m above the surface (subscripted FCS surface), and (5) Tp is the temperature of a parcel from the lowest 500 m of the atmosphere, raised dry adiabatically to the Lifted Condensation Level (LCL), and moist adiabatically thereafter; Te is the temperature of the environment, Δ z is an incremental depth, and (6) U is vector difference between 0–6 km mean wind speed and 0–0.5 km mean wind speed. Subscript lp denotes a value associated with a lifted parcel [42].

2.2. Statistical Analysis

Days from May to September 2010–2015 with available IWV data were included in the statistical analysis. Based on SYNOP data, the days were divided manually into two samples: (1) no thunderstorm group (NTH), including 350 days with no thunderstorm occurrence over Sofia region and, (2) thunderstorm group (TH), including 248 days with thunderstorms having formed and developed over the Sofia region. The environmental conditions (instability indices and IWV) for the days from both groups were analyzed. The basic statistics, median, mean, and 10, 25, 75, and 90 percentiles of IWV, and Instability Indices (InI), were estimated separately for NTH and TH groups. A F-test, with a confidence level of 0.05, was applied to determine the statistically significant difference between the groups. The standard discriminant analysis, using StatSoft [43], was applied to obtain the critical values (threshold) of the IWV that separate the days into two groups, for NTH and TH. Stepwise discriminant analysis [43] was used to search for classification functions F(TH, NTH) that determine the case type (NTH or TH), based on: (1) instability indices F1(InI), and (2) instability indices and IWV of F2(IWV,InI). The values of F(TH, NTH) ≥ 0 classified the case as a thunderstorm. The stepwise forward procedure was performed to evaluate at each step, which of the analyzed variables contributed most to the discrimination between groups. The standard criteria (p-level, Wilk’s lambda) were used as an indication of the statistical significance of a model built by stepwise discriminant analysis. Classification functions are determined separately for each month and in addition to the period from May–September. The following four skill scores were calculated for the classification functions
(1) Probability of detection (POD) [44]:
POD = THC/(THC+THI)
(2) False alarm ratio (FAR) [44]:
FAR = NTHI/(THC+NTHI)
(3) Critical Success Index (CSI) [44]:
CSI = THC/(THC+THI+NTHI)
(4) True Skill Statistic (TSS) [45]:
TSS = THC/(THC+THI) – NTHI/(NTHI+NTHC)
where (1) THC is the number of correctly classified thunderstorm days, (2) THI is the number of incorrectly classified thunderstorm days, (3) NTHC is the number of correctly classified no-thunderstorm days, and (4) NTHI is the number of incorrectly classified no-thunderstorm days. The ability for the classification function to predict the day type NHT and TH was tested using an independent data sample with 61 TH and 77 NTH days, from May to September 2017–2018.

3. Results

3.1. Classification Functions for Thunderstorm Forecasting

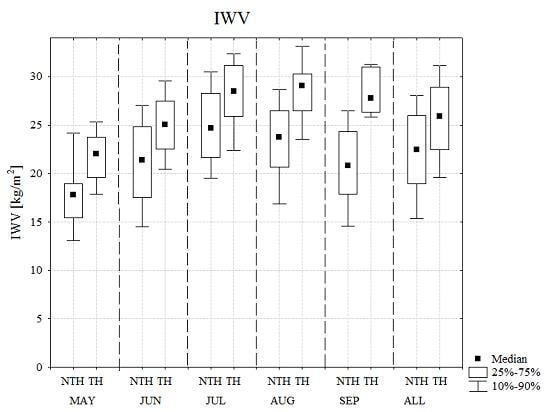
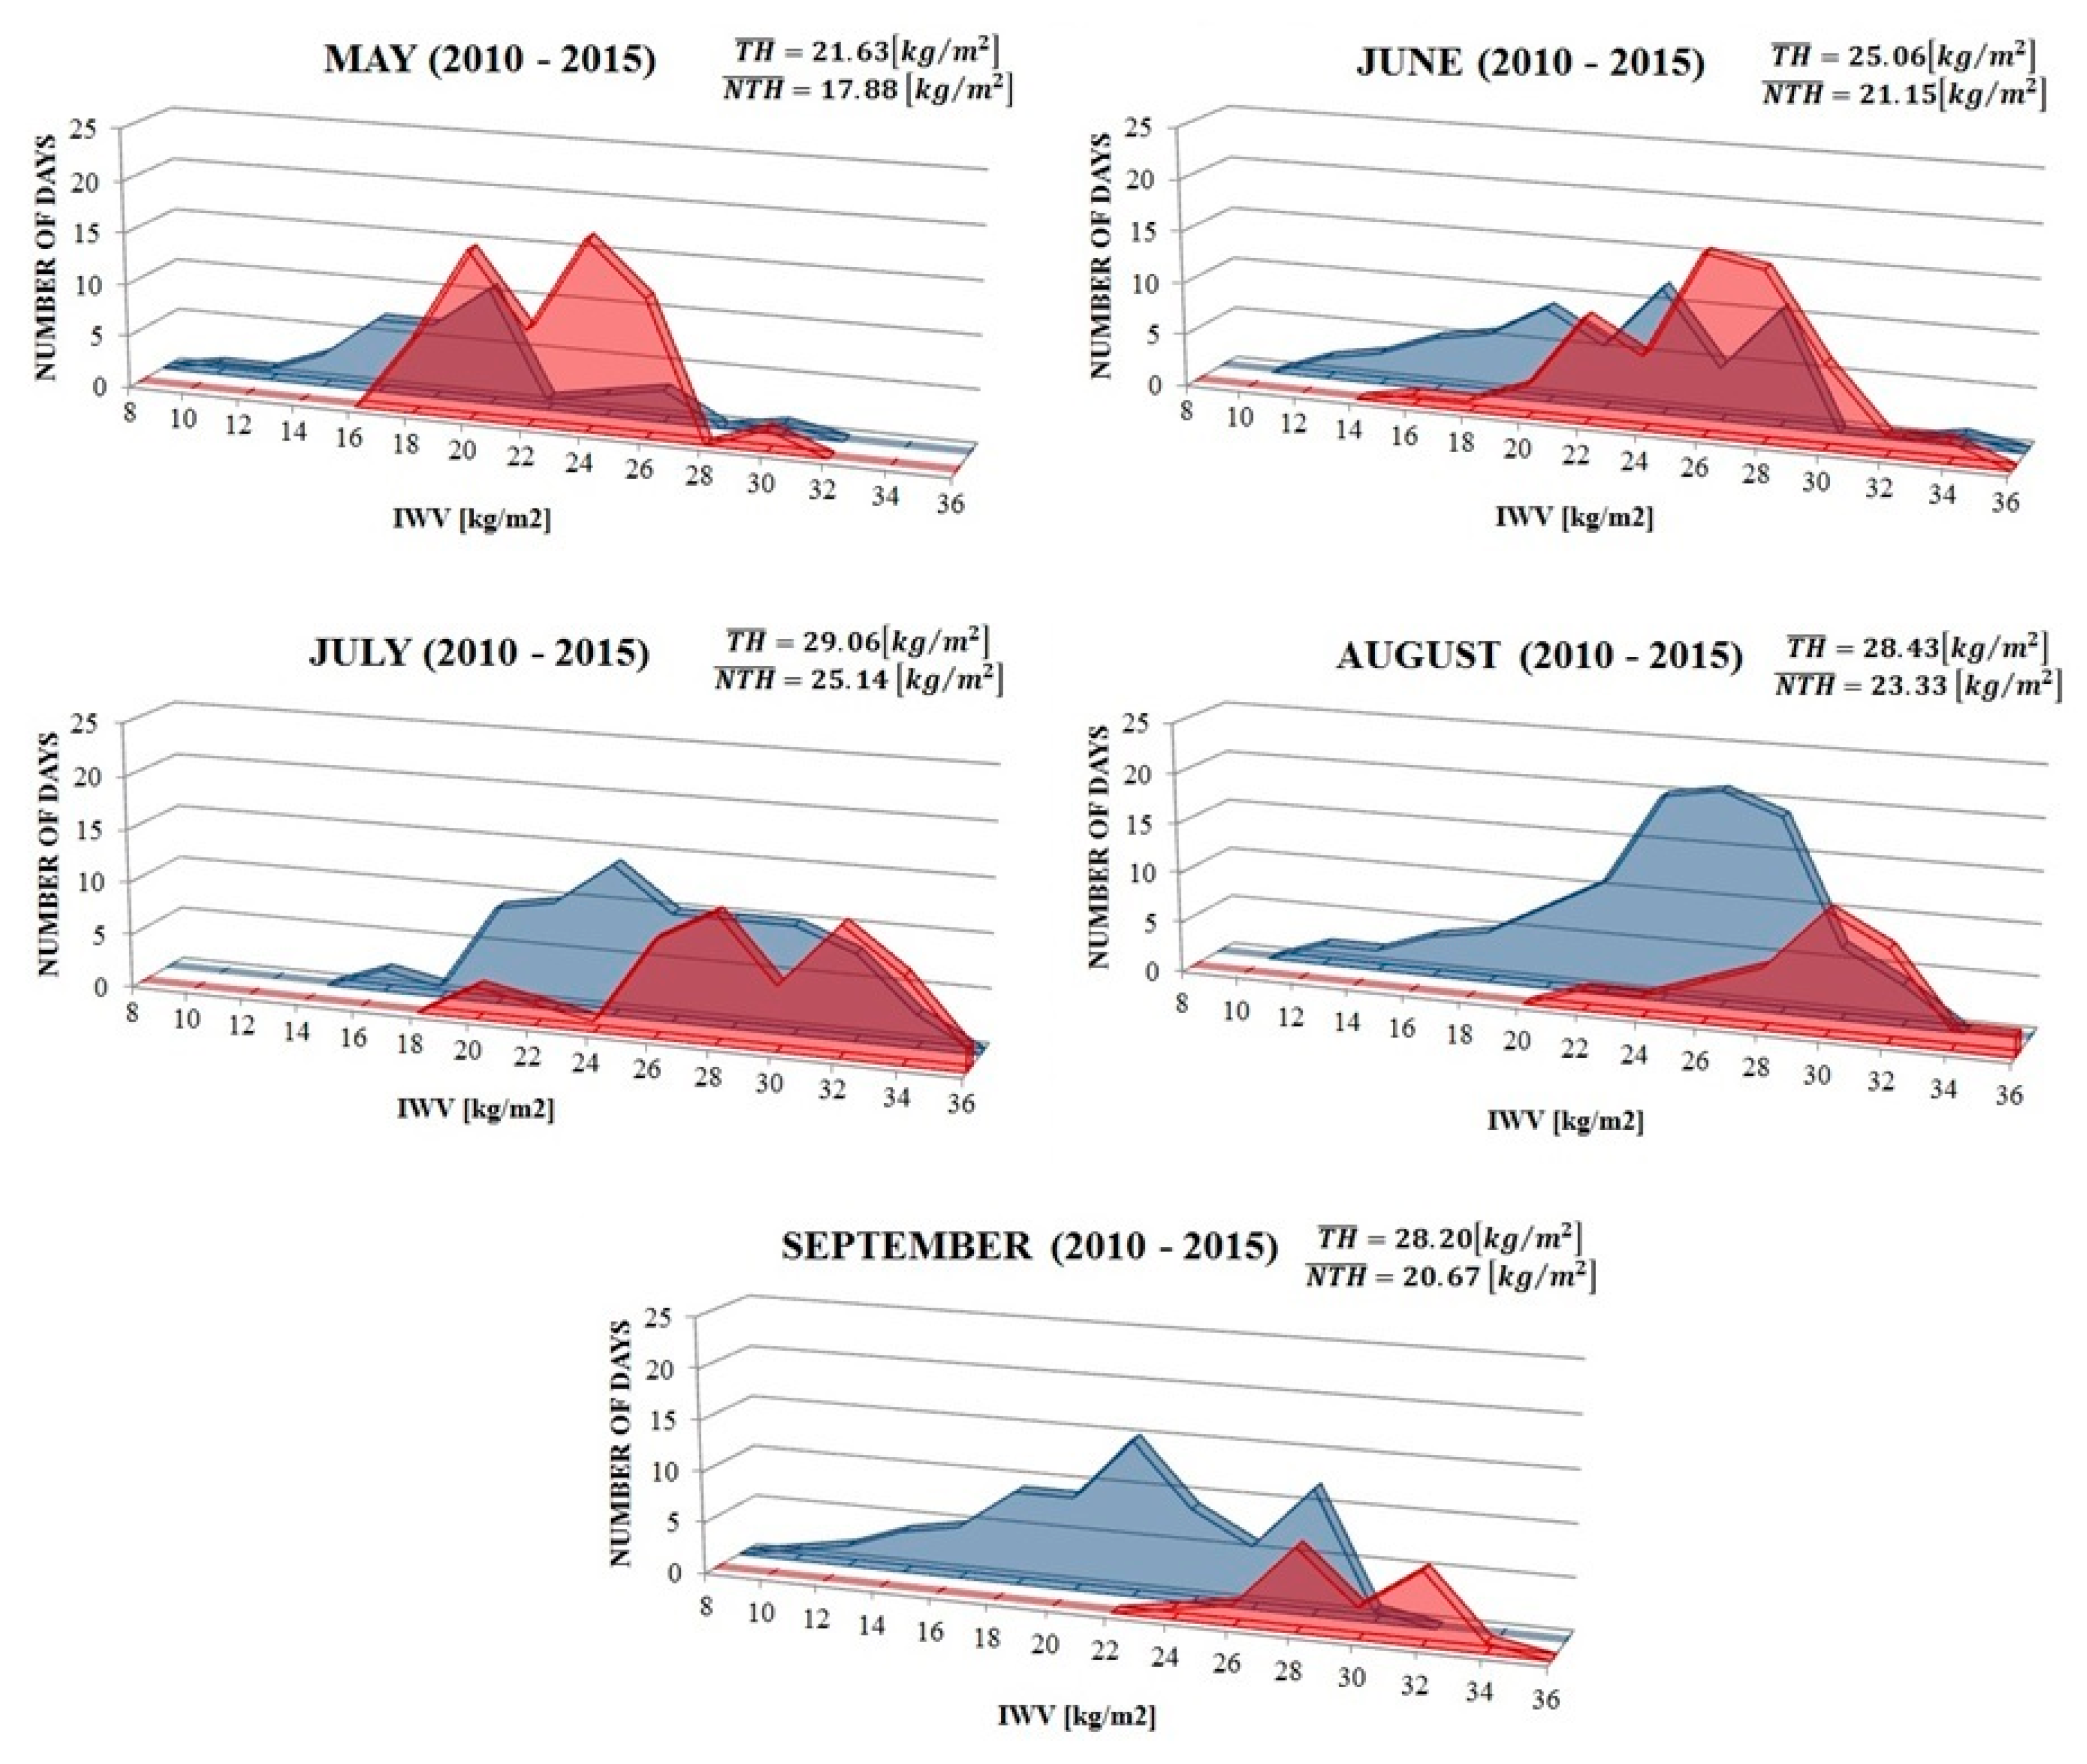
3.1.1. IWV Threshold for TH and NTH Days 2010–2015

In this study, the IWV threshold values are calculated for the thunderstorm season from May to September 2010–2015. As seen in Figure 2, there is a good separation between TH and NTH groups. IWV for TH group (red color) is characterized with higher values than the NTH group (blue color). There is a difference between the mean values (Figure 2) and median values (Figure 3) of IWV for both groups. The analysis shows that the biggest difference is in September. For NTH and TH days, the mean values are 20.67 and 28.20 kg/m2, respectively, and 20.83 and 27.78 kg/m2 for the median, respectively. For the other months, the differences: 1) mean IWV TH minus IWV NTH and 2) median IWV TH minus IWV NTH are about 4 kg/m2. In May, maximum daily values of IWV higher than 20 kg/m2 are registered in only 19% of NTH days and in 65% of TH days (Table 2, line 2). In June, the maximum daily IWV values higher than 24 kg/m2 are registered in 28% of all NTH days and in 68% of TH days. Similar results are obtained for July and August (Table 2). In September, 82% of NTH days have maximum daily IWV up to 26 kg/m2, while for 86% of TH days, the registered maximum values are higher than 26 kg/m2. The results are confirmed by the F-test, which shows that there is a significant difference in the maximum IWV registered on TH and NTH days.
Based on preliminary statistical analysis, corresponding monthly threshold values were computed (Table 3). In all months, the percentage of correctly classified TH days was more than 65%. The highest number of correctly classified TH days was in August and September, with POD values of 0.79 and 0.91, respectively. The percentage of correctly classified NTH days were 87% in May and 69% in June. For July and September, the FAR values were above 0.40 and the highest FAR of 0.51 was in August. Thus, it should be noted that based on IWV, only a large number of false alarms are expected. An IWV threshold for the May–September period was also computed, and it was 23.5 kg/m2. For this threshold, 67% of TH were correctly classified, but the false alarm was very high 45% (Table 3).

3.1.2. Classification Functions May–September 2010–2015

The results presented in Section 3.1.1 provoked further investigation of IWV application in thunderstorm forecasting. To improve the forecasting ability, instability indices CAPE, BRN, LI, K, TT, SHI, SWEAT, and environmental parameters TLCL were included in the analysis. Stepwise discriminant analysis was applied to derive two classification functions based on (1) instability indices (F1), and (2) instability indices in combination with IWV (F2). In Table 4 the classification functions F1 and F2 that provide the best separation between TH and NTH days are shown. It should be noted that CAPE and BRN were not selected by the stepwise discriminant analysis and consequently, they were not included in the classification functions F1 and F2. Detailed investigation of CAPE values for the selected period showed no separation between TH and NTH days (not shown). For the monthly classification function F1, the following indices were chosen by forward stepwise analysis: (1) May—K, LI and SWEAT, (2) June—K, TT, SHI, and SWEAT, (3) July—K, TT, SHI, TLCL, and LI, (4) August—SHI, LI SWEAT, K, and TT, and (5) September—SWEAT, K, SHI, LI, and TT. It should be noted that in four months, the K, TT, and LI indices were selected, and in three months, the SWEAT and SHI indices were selected. For the monthly F2 the chosen indices were: (1) May—SHI, TT, and K, (2) June—SHI, K, TT and TLCL, (3) July—SHI, LI, K, TT and TLCL, (4) August—TT, SHI and SWEAT and (5) September—SHI, SWEAT, K, and TT. For F2 in five months, the SHI and TT indices were selected, and in three months the K index was selected. Interestingly, the indices selected for the monthly F1 and F2 differed. The F-test analysis showed that only the K index and IWV had statistically significant values for TH and NTH days.
In Figure 4, skill scores for F1(InI) and F2(IWV,InI) from May to September 2010–2015 are presented. The F1 POD score (light blue bars) was in the range of 0.75–0.89, with the lowest value being seen in August, and the highest in July. The F2 POD scope (dark blue bars) is in the range of 0.83–0.94, with the lowest value in August and the highest in June. The comparison between F1 and F2 monthly POD scores gave an advantage to F2, with the largest improvement of 10% in September, followed by June and August (8%), and May and July (4%). Comparison of the FAR score gave a range of 0.22–0.56 and 0.13–0.39 for F1 and F2, respectively. The largest reduction in the false alarm ratio was is in September (29%), followed by May (9%) and August (5%). In July, the FAR score of F2 was worse, with −4% compared to F1. Analysis of the POD and FAR score gave the best performance of the F2 function for May with a POD score of 0.89 and a FAR of 0.13, followed by June with a POD score of 0.94 and a FAR of 0.24, and September with a POD score of 0.91 and a FAR of 0.27. These results are expected, and directly linked to discussed in Section 3.1.1; good separation between IWV values for the TH and NTH days for those months. As seen in Figure 4 for July and August, both F1 and F2 functions had a false alarm ratio above 0.3. This is likely related to one side having the lower number of TH days, and the largest range of IWV overlap for TH and NTH days (see Figure 2). A visual inspection of CSI and TSS scores showed that they are higher for F2 for all months, with the largest increase in September, by 28 and 31% for CSI and TSS, respectively. For July, both CSI and TSS scores for F1 and F2 were very close.
In order to facilitate the operational forecasting of convection development, a classification function valid for the May to September period was also computed (Table 4, line 7). The obtained skill scores for F2 are a POD score of 0.90, a FAR of 0.29, a CSI of 0.66 and a TSS of 0.64 (Figure 4, bottom right). These scores were worse than the monthly F2 scores for May, June, and September. Thus, it can be concluded that it is recommended to use monthly functions for operational forecasting.

3.1.3. Verification of Classification Functions for May–September 2017–2018

For the independent sample period, May-September 2017–2018, the monthly skill scores were calculated for the F1 and F2 functions (Figure 5). For this period, the F1 POD score (light blue bars) was in the range of 0.55–1.0 with the lowest value in June, and highest in September. The F2 POD scope (dark blue bars) was in the range of 0.73–1.0 with the lowest value in July, and highest in August and September. The comparison between F1 and F2 monthly POD scores gave an advantage to F2, with the largest improvement of 35% in June, followed by 25% in August and 5% in May. The monthly FAR score was in the range of 0.21–0.50 and 0.08–0.43, for F1 and F2, respectively. The largest reduction of the false alarm ratio was 40% in July, followed by 25% in September, 12% in August, and 11% in May. Combined analysis of the POD and FAR scores gave the best performance to the F2 function for September, with a POD score of 1.0 and a FAR of 0.25, followed by June with a POD score of 0.90 and a FAR of 0.25, and May with a POD score of 0.95 and a FAR of 0.28. This result confirms that May, June, and September were the months with the best scores. The CSI and TSS scores were higher for F2 for all months, with the largest increases in July, by 29% and 35% for CSI and TSS, respectively, followed by August with 19% and 36%, for CSI and TSS, respectively. The values for the skill scores had higher variation in the 2017–2018 sample compared to the 2010–2015 sample, which is linked to the smaller sample size. However, the verification of the classification functions with an independent data sample confirmed the superiority of the classification function based on a combination of IWV and instability indices.

3.2. Case Studies—Supercell & Multicell Thunderstorm

3.2.1. Multicell Thunderstorm—18 June 2014

On 18 June, the weather in Sofia was determined by a fast-moving cold front going from the west to the east of Bulgaria. As a result, a severe multicell thunderstorms developed with heavy hail and rainfall over the Sofia plain. The hailstone sizes were bigger than 2.5 cm in diameter. Using the SOFI GNSS station, a continuous measurement of IWV during the multicell event was made (Figure 6). The results from Figure 6 show that there was a strong increase of IWV (blue line in Figure 6) on the day before the thunderstorm, from 1700 to 2345 UTC. The observed increase was more than 8 kg/m2 and at 2345 UTC, the IWV reached its peak of 28.54 kg/m2. At 2040 UTC on 17 June, the IWV reached the calculated monthly threshold value of 23.09 kg/m2 (dashed blue line in Figure 6) obtained in Section 3.1.1, and the process was correctly classified as TH. After reaching the threshold value, IWV had a small increase and decrease but is still maintaining high values. The IWV had high values for more than 10 hours, and could be considered as a sign for the potential of thunderstorm initiation. Visual inspection of the flash rate in the multicell thunderstorm shows an increase from 1048 to 1252 UTC. The first strong flash rate peak (red bars in Figure 6) was at 1252 UTC reaching 18 flashes per 4 min. The flash rate peaked at 1252 UTC, shortly before the severe hail fall registered on the ground. Between 1200 and 1300 UTC IWV values increased with 3 kg/m2 (about 10%). For the same period, ZTD increased by 16 mm, and pressure dropped by 1 hPa (not shown). The pressure decrease can explain up to 1 kg/m2 of the IWV increase, with the remaining being likely related to the hydrometeor contribution to the GNSS path delay [46]. Ref. [19] reported a maximum contribution of hydrometeors of up to 17 mm ZWD, corresponding to a 3 kg/m2 increase of IWV on 23 June 2013 extreme weather events.

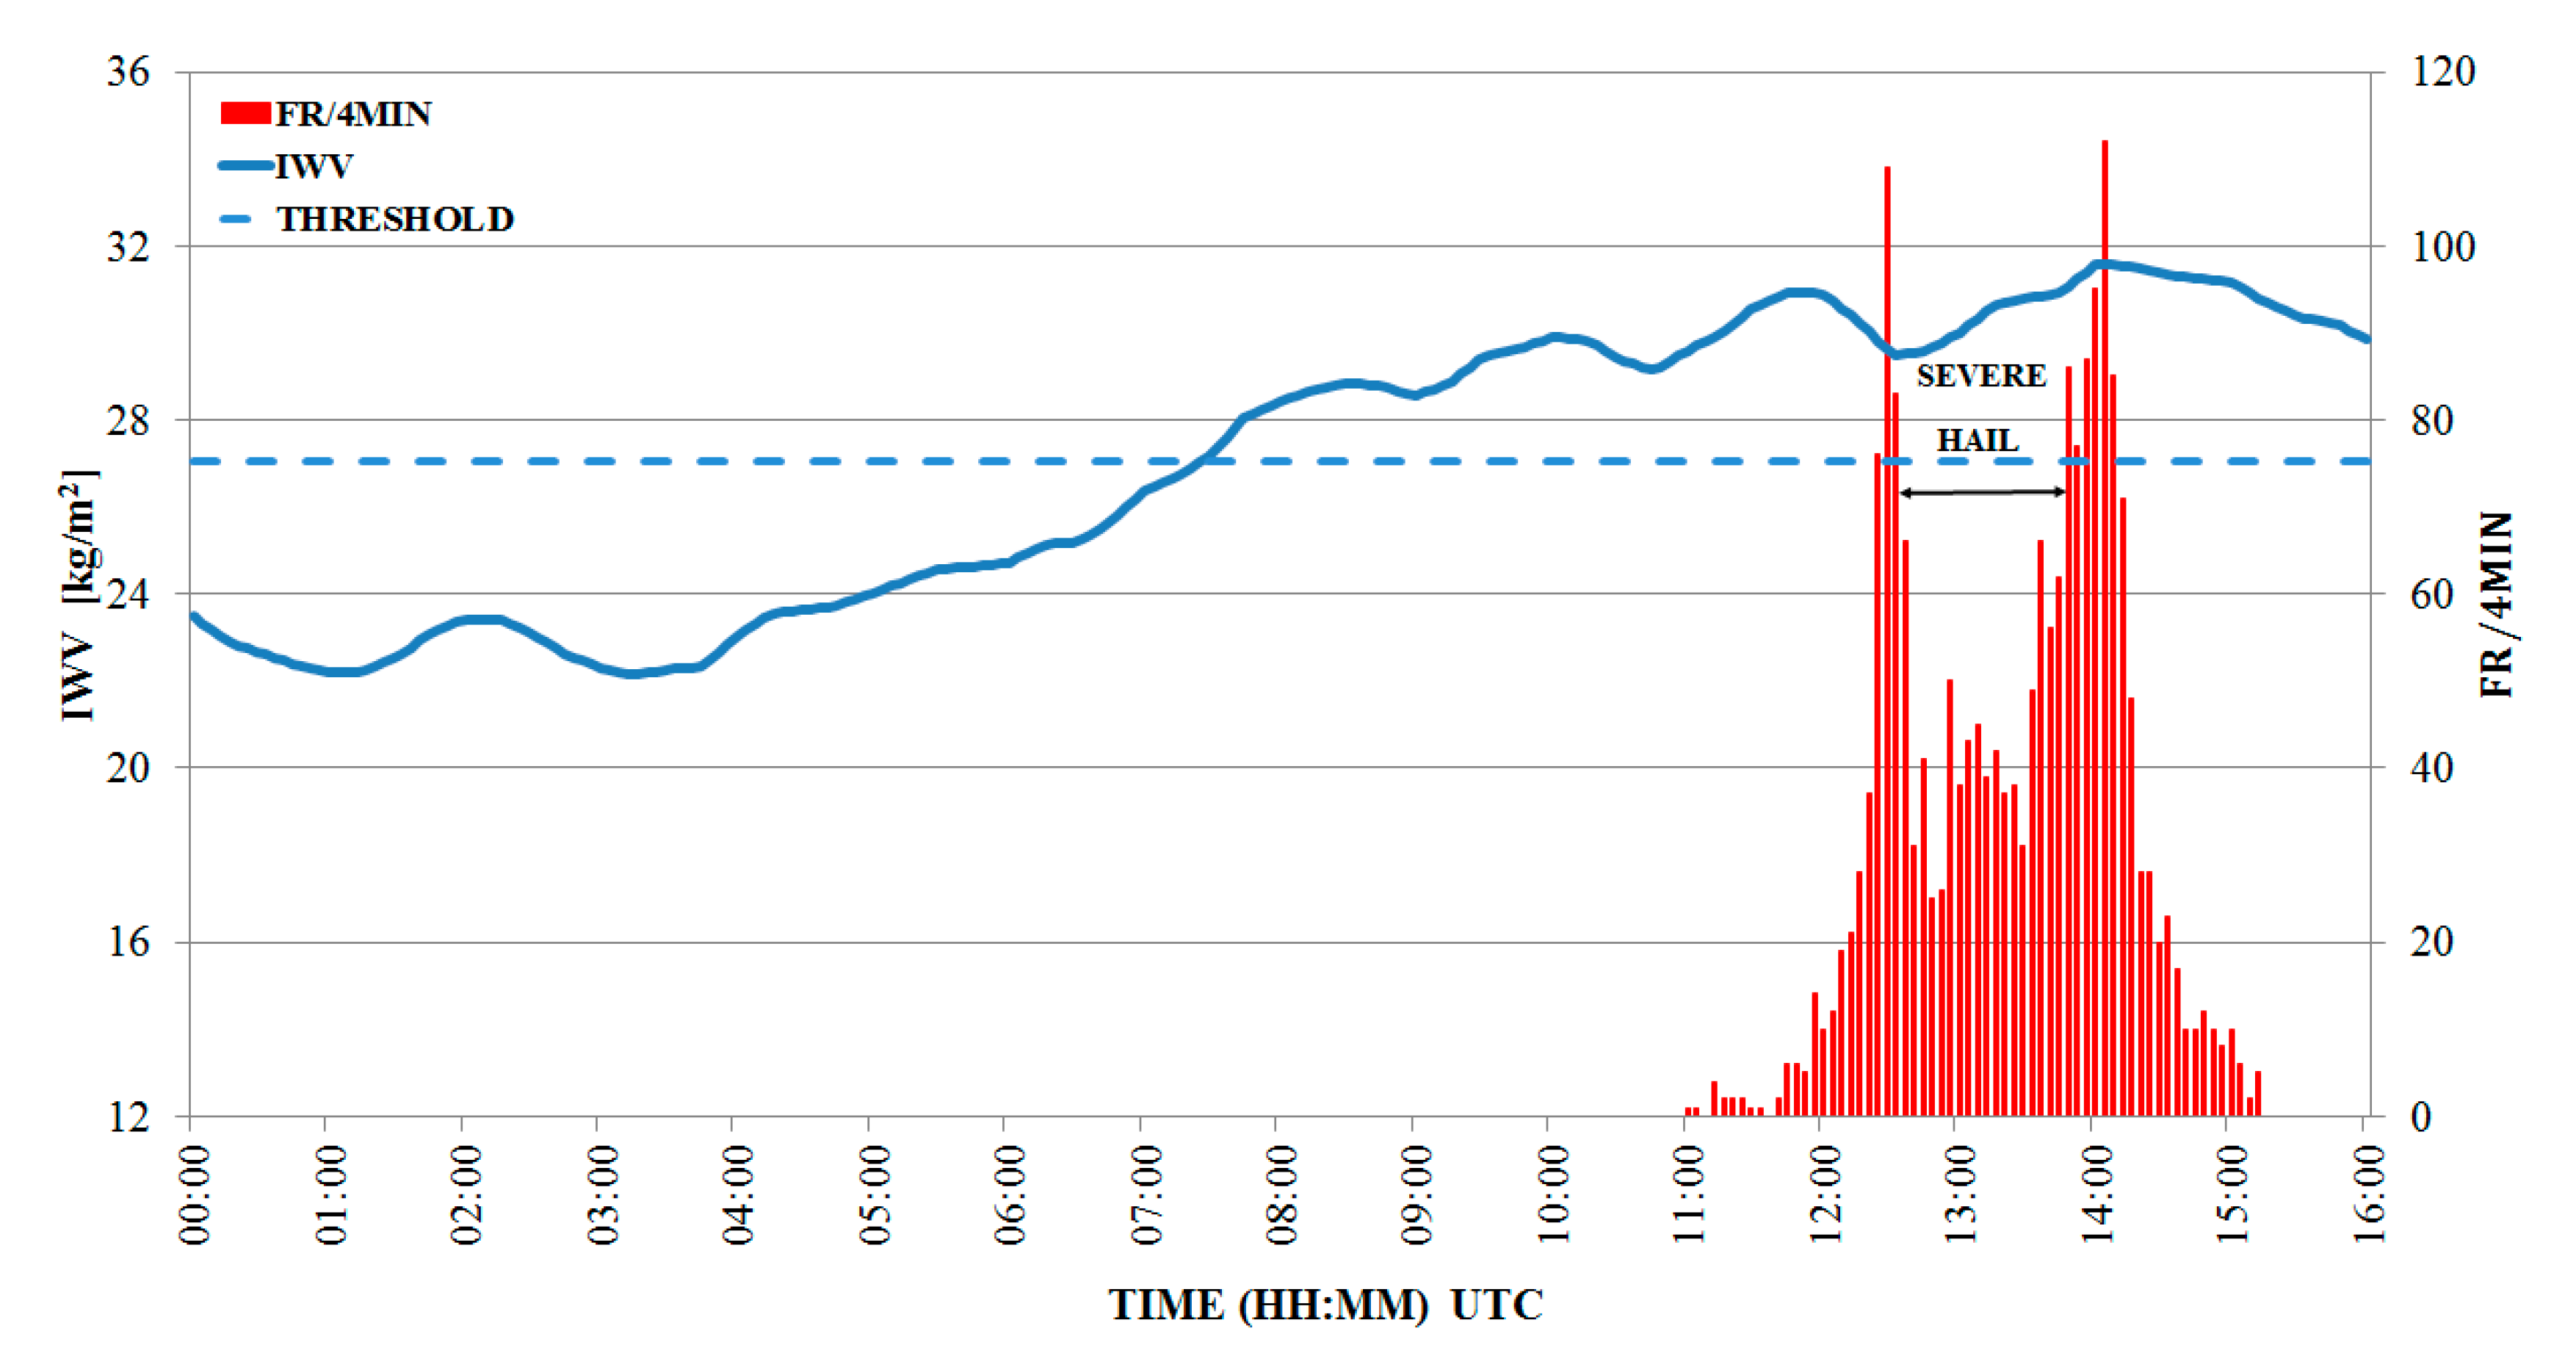
3.2.2. Supercell Thunderstorm—8 July 2014

On 8 July 2014, a supercell storm developed over the Sofia plain [3]. The temporal variability of IWV, presented in Figure 7, showed a continuous increase before the supercell detection. The observed increase from 0400 to 1100 UTC was more than 7 kg/m2. At 0728 UTC, i.e., 3.5 hours before the first lightning detection, the IWV values reached the monthly threshold of 27.05 kg/m2 (dashed blue line in Figure 7), and the process was correctly classified as TH. After reaching the monthly threshold values, the IWV continued to increase. Visual inspection of the flash rate of the supercell showed an increase from 1100 to 1228 UTC. The flash rate peaked at 1228 UTC, reaching 109 flashes per 4 min. Between 1100 and 1228 UTC, the IWV peaked at 29 kg/m2, and then had a small decrease. The peak of IWV was detected 40 min before the first flash rate peak. After the IWV and flash rate peaked, a heavy hail fall was registered on the ground. The hailstone sizes were larger than 10 cm in diameter and produced major infrastructure loss. It could be seen that during the severe hail fall, the flash rate decreased. After the hail, the IWV values continued to maintain high values above 29 kg/m2. The second flash rate peak, with 112 flashes per 4 min, was detected 4 min after the IWV peak of 31.56 kg/m2. After the second flash rate and IWV peaks, the cell started to dissipate. IWV values remained high with the storm dissipation.

4. Discussion

The forecasting of thunderstorm formation and development is a major challenge in operational meteorology, and is associated with large economic losses. The hail and thunderstorm on 8 July 2014 in Sofia was estimated to cost over 123 million EUR in insured losses over 2 hours [47]. In this work, the added value of combining the instability indices with GNSS-IWV has been demonstrated for thunderstorm days in the warm part of the year from May to September, for the Sofia plains region. The results clearly indicate improvement of POD, FAR, CSI, and TSS scores for a classification function, combining instability indices and IWV for the 2010–2015 period. Furthermore, the performance of the classification function was tested on an independent sample and its effectiveness was confirmed. The results were confirmed by the F-test, which showed that there was a significant difference in the maximum IWV, for TH and NTH days. This is an encouraging result, and suggests that the proposed function can be used as guidance in diagnosing thunderstorms in the Sofia plains region. The limitation of this function is its local validity for the Sofia region. However, the obtained quantitative monthly threshold for thunderstorm development could be useful guidance for operational meteorology. In particular, the proposed statistical approach can be applied to the instability of indices and IWV computed from high-resolution mesoscale NWP models like WRF. However, despite the improved topography representation, the current state-of-the-art mesoscale models underperform in regions with complex topography, and during thunder and hailstorm events. One of the reasons is the lack of observations with high temporal and spatial resolution, representing the local environment. Despite the GNSS derived IWV having a temporal resolution of 15 minutes, its interpretation for the two case studies in 2014 was a challenge. As shown by other studies, IWV accumulation is one of the ingredients for thunderstorm formation. However, matching surface observations with high temporal and spatial resolution is a major limitation of this study. Thus, we were not able to offer a conclusive indicator for individual thunderstorm and IWV development, as found by studies in other regions and continents. However, a recently deployed network in Bulgaria is designed to provide collocated GNSS and surface observations with high temporal resolution, and will overcome this limitation. Since May 2019, 12 GNSS and meteorological stations have been processed as a part of the BalkanMed Real-time severe weather service (BeRTISS) project [48]. The results of this study will be used to improve the thunderstorm forecast in the warm season, and will be included in the Bulgarian Integrated NowCAsting tool.

5. Conclusions

Thunderstorm climatology shows that Sofia has the highest mean annual number of days with thunderstorms and severe thunderstorms across Europe. The thunderstorm activity in the Sofia plain starts with a rapid increase in April/May and decreases in October; thus, this study covers the thunderstorm period from May to September 2010–2015. For the days with thunderstorms (TH) and no thunderstorms (NTH), monthly threshold values of IWV were computed, and a good separation between the two groups was found. Based on IWV alone, the highest probability of detection score obtained was 0.91 but it was associated with a high false alarm ratio of 0.45. Thus, as a next step, stepwise discriminant analysis was applied to derive classification functions using 1) instability indices (F1), and 2) instability indices in combination with IWV (F2). The F-test analysis showed that only the K index and IWV have statistically significant values for TH and NTH days. A comparison between F1 and F2 monthly probability of detection scores gave an advantage to F2, with the largest improvement of 10% in September, followed by June and August with 8%. The largest reduction in the false alarm ratio score was in September, followed by May and August. Analysis of both POD and FAR scores gave the best performance for May, followed by June and September 2010–2015. Evaluation of the monthly classification functions was carried out using an independent sample period of 2017–2018. Combined analysis of the probability of detection and false alarm ratio scores gave the best performance for September, followed by June and May. This result confirmed the finding from the first sample period, that for May, June and September, the best scopes are obtained by the classification function combining IWV and instability indices. The IWV and lightning flash rates for two case studies of a multicell thunderstorm on 18 June 2014 and a supercell thunderstorm on 8 July 2014, were analyzed. Both thunderstorms were classified as TH based on the monthly threshold values of IWV for June and July. IWV reached a monthly threshold of 14.5 and 3.5 hours before the thunderstorm started.

Author Contributions

Conceptualization, G.G. and T.D.; methodology, T.D.; software, T.D.; validation, G.G., T.D. and S.G.; writing—original draft preparation, G.G.; writing—review and editing, S.G. and T.D.; visualization, G.G., T.D., and S.G.

Funding

This research was funded by the BeRTISS project (BMP1/2.2/2163/2017) of the Transnational Cooperation Programme Interreg V-B “Balkan-Mediterranean 2014–2020”, co-financed by the European Union (the European Regional Development Fund—ERDF), and National Funds of the participating countries.

Acknowledgments

The authors are grateful to LINET for providing lightning data. The IGS U.S. Naval Observatorydata center provided the ZTD data for station SOFI.

Conflicts of Interest

The authors declare no conflict of interest. The funders had no role in the design of the study; in the collection, analyses, interpretation of data, in the writing of the manuscript, or in the decision to publish the results.

References

  1. Taszarek, M.; Allen, J.; Púčik, T.; Groenemeijer, P.; Czernecki, B.; Kolendowicz, L.; Lagouvardos, K.; Kotroni, V.; Schulz, W. A climatology of thunderstorms across Europe from a synthesis of multiple data sources. J. Clim. 2019, 32, 1813–1837. [Google Scholar] [CrossRef]
  2. Bocheva, L.; Simeonov, P.; Marinova, T. Variations of thunderstorm activity in non mountainous regions of Bulgaria (1961–2010). BJMH 2013, 18, 38–47. [Google Scholar]
  3. Bocheva, L.; Dimitrova, T.; Penchev, R.; Gospodinov, I.; Simeonov, P. Severe convective supercell outbreak over western Bulgaria on July 8 2014. Idojaras 2018, 122, 177–203. [Google Scholar] [CrossRef] [Green Version]
  4. Dimitrova, T.; Mitzeva, R.; Savtchenko, A. Environmental conditions responsible for the type of precipitation in summer convective storms over Bulgaria. Atmos. Res. 2009, 93, 30–38. [Google Scholar] [CrossRef]
  5. Kunz, M. The skill of convective parameters and indices to predict isolated and severe thunderstorms. Nat. Hazards Earth Syst. Sci. 2007, 7, 327–342. [Google Scholar] [CrossRef] [Green Version]
  6. Jacovides, C.P.; Yonetani, T. An evaluation of stability indices for thunderstorm prediction in Greater Cyprus. Weather Forecas. 1990, 5, 559–569. [Google Scholar] [CrossRef]
  7. Ukkonen, P.; Manzato, A.; Mäkelä, A. Evaluation of thunderstorm predictors for Finland using reanalyses and neural networks. J. Appl. Meteorol. Climatol. 2017, 56, 2335–2352. [Google Scholar] [CrossRef]
  8. Huntrieser, H.; Schiesser, H.H.; Schmid, W.; Waldvogel, A. Comparison of Traditional and Newly Developed Thunderstorm Indices for Switzerland. Weather Forecast. 1997, 12, 108–125. [Google Scholar] [CrossRef]
  9. Markova, B.; Dimitrova, T.S.; Kadiyska, N.; Mitzeva, R. Stability indices and wind shear for forecasting severe storm type over Bulgaria. In Proceedings of the 9th European Conference on Severe Storms, Pula, Croatia, 18–22 September 2017. [Google Scholar]
  10. Guerova, G.; Jones, J.; Douša, J.; Dick, G.; Haan, S.D.; Pottiaux, E.; Bock, O.; Pacione, R.; Elgered, G.; Vedel, H.; et al. Review of the state of the art and future prospects of the ground-based GNSS meteorology in Europe. Atmos. Meas. Tech. 2016, 9, 5385–5406. [Google Scholar] [CrossRef] [Green Version]
  11. Benevides, P.; Catalao, J.; Miranda, P.M.A. On the inclusion of GPS precipitable water vapour in the nowcasting of rainfall. Nat. Hazards Earth Syst. Sci. 2015, 15, 2605–2616. [Google Scholar] [CrossRef] [Green Version]
  12. Benevides, P.; Catalao, J.; Nico, G. Neural Network Approach to Forecast Hourly Intense Rainfall Using GNSS Precipitable Water Vapor and Meteorological Sensors. Remote Sens. 2019, 11, 966. [Google Scholar] [CrossRef] [Green Version]
  13. Shoji, Y. Retrieval of water vapor inhomogeneity using the Japanese nationwide GPS array and its potential for prediction of convective precipitation. J. Meteorol. Soc. Jpn. 2013, 91, 43–62. [Google Scholar] [CrossRef] [Green Version]
  14. Seto, Y.; Yokoyama, H.; Nakatani, T.; Ando, H.; Tsunematsu, N.; Shoji, Y.; Kusunoki, K.; Nakayama, M.; Saitoh, Y.; Takahashi, H. Relationships among Rainfall Distribution, Surface Wind, and Precipitable Water Vapor during Heavy Rainfall in Central Tokyo in Summer. J. Meteorol. Soc. Jpn. 2018, 96A, 35–49. [Google Scholar] [CrossRef] [Green Version]
  15. Sapucci, L.F.; Machado, L.A.; de Souza, E.M.; Campos, T.B. Global Positioning System precipitable water vapour (GPS-PWV) jumps before intense rain events: A potential application to nowcasting. Meteorol. Appl. 2019, 26, 49–63. [Google Scholar] [CrossRef] [Green Version]
  16. Huelsing, H.K.; Wang, J.; Mears, C.; Braun, J.J. Precipitable water characteristics during the 2013 Colorado flood using ground-based GPS measurements. Atmos. Meas. Tech. 2017, 10, 4055–4066. [Google Scholar] [CrossRef] [Green Version]
  17. Nykiel, G.; Figurski, M.; Baldysz, Z. Analysis of GNSS sensed precipitable water vapour and tropospheric gradients during the derecho event in Poland of 11th August 2017. J. Atmos. Sol. Terr. Phys. 2019, 193, 105082. [Google Scholar] [CrossRef]
  18. Brenot, H.; Neméghaire, J.; Delobbe, L.; Clerbaux, N.; De Meutter, P.; Deckmyn, A.; Delcloo, A.; Frappez, L.; Van Roozendael, M. Preliminary signs of the initiation of deep convection by GNSS. Atmos. Chem. Phys. 2013, 13, 5425–5449. [Google Scholar] [CrossRef] [Green Version]
  19. Douša, J.; Dick, G.; Kačmařík, M.; Brožková, R.; Zus, F.; Brenot, H.; Stoycheva, A.; Möller, G.; Kaplon, J. Benchmark campaign and case study episode in central Europe for development and assessment of advanced GNSS tropospheric models and products. Atmos. Meas. Tech. 2016, 9, 2989–3008. [Google Scholar] [CrossRef] [Green Version]
  20. Guerova, G.; Simeonov, T.S.; Yordanova, N. The Sofia University Atmospheric Data Archive (SUADA). Atmos. Meas. Tech. 2014, 7, 2683–2694. [Google Scholar] [CrossRef] [Green Version]
  21. Beutler, G.; Bock, H.; Dach, R.; Fridez, P.; Gäde, A.; Hugentobler, U.P.; Jäggi, A.; Meindl, M.; Mervart, L.; Prange, L.; et al. Bernese GPS software Version 5.0; Astronomical Institute, University of Bern: Bern, Switzerland, 2007. [Google Scholar]
  22. Zumberge, J.F.; Heflin, M.B.; Jefferson, D.C.; Watkins, M.M.; Webb, F.H. Precise point positioning for the efficient and robust analysis of GPS data from large networks. J. Geophys. Res. Solid Earth 1997, 102, 5005–5017. [Google Scholar] [CrossRef] [Green Version]
  23. Byram, S. IGS Final Troposphere Product Update. In Proceedings of the IGS Workshop 2017, Paris, France, 3–7 July 2017; Available online: http://www.igs.org/assets/pdf/W2017-PS04-03%20-%20Byram.pdf (accessed on 11 December 2019).
  24. Bohm, J.; Niell, A.; Tregoning, P.; Schuh, H. Global mapping function (GMF): A new empirical mapping function based on numerical weather model data. Geophys. Res. Lett. 2006, 33. [Google Scholar] [CrossRef] [Green Version]
  25. Davis, J.; Herring, T.; Shapiro, I.; Rogers, A.; Elgered, G. Geodesy by radio interferometry: Effects of atmospheric modeling errors on estimates of baseline length. Radio Sci. 1985, 20, 1593–1607. [Google Scholar] [CrossRef]
  26. Bevis, M.; Businger, S.; Herring, T.A.; Rocken, C.; Anthes, R.A.; Ware, R.H. GPS Meteorology: Remote sensing of atmospheric water vapour using the Global Positioning System. J. Geophys. Res. 1992, 97, 15787–15801. [Google Scholar] [CrossRef]
  27. Thayer, G.D. An improved equation for the radio refractive index of air. Radio Sci. 1974, 9, 803–807. [Google Scholar] [CrossRef]
  28. Sissenwine, N.; Dubin, M.; Wexler, H. The US standard atmosphere, 1962. J. Geophys. Res. 1962, 67, 3627–3630. [Google Scholar] [CrossRef]
  29. Skamarock, W.C.; Klemp, J.; Dudhia, J.; Gill, D.O.; Barker, D.M.; Duda, M.G.; Huang, X.Y.; Wang, W.; Powers, J. A Description of the Advanced Research WRF Version 3. Available online: https://opensky.ucar.edu/islandora/object/technotes%3A500/datastream/PDF/view (accessed on 1 December 2019).
  30. Chen, F.; Mitchell, K.; Schaake, J.; Xue, Y.; Pan, H.-L.; Koren, V.; Duan, Q.Y.; Ek, M.; Betts, A. Modeling of land surface evaporation by four schemes and comparison with FIFE observations. J. Geophys. Res. 1996, 101, 7251–7268. [Google Scholar] [CrossRef] [Green Version]
  31. Hong, S.-Y.; Noh, Y.; Dudhia, J. A new vertical diffusion package with an explicit treatment of entrainment processes. Mon. Weather Rev. 2006, 134, 2318–2341. [Google Scholar] [CrossRef] [Green Version]
  32. Lin, Y.; Colle, B.A. A new bulk microphysical scheme that includes riming intensity and temperature-dependent ice characteristics. Mon. Weather Rev. 2011, 139, 1013–1035. [Google Scholar] [CrossRef]
  33. Mlawer, E.J.; Taubman, S.J.; Brown, P.D.; Iacono, M.J.; Clough, S.A. Radiative transfer for inhomogeneous atmospheres: RRTM, validated correlated-k model for the longwave. J. Geophys. Res. Atmos. 1997, 102, 16663–16682. [Google Scholar] [CrossRef] [Green Version]
  34. Betz, H.-D.; Schmidt, K.; Oettinger, P.; Wirz, M. Lightning detection with 3-D discrimination of intracloud and cloud-to-ground discharges. Geophys. Res. Lett. 2004, 31. [Google Scholar] [CrossRef]
  35. Betz, H.D.; Schmidt, K.; Laroche, P.; Blanchet, P.; Oettinger, W.P.; Defer, E.; Dziewit, Z.; Konarski, J. LINET-An international lightning detection network in Europe. Atmos. Res. 2009, 91, 564–573. [Google Scholar] [CrossRef]
  36. Miller, R.C. Notes on analysis and severe storm forecasting procedures of the Air Force Global Weather Central. AWS 1972, 200, 190. [Google Scholar]
  37. Showalter, A.K. A stability index for forecasting thunderstorms. Bull. Am. Meteorol. Soc. 1947, 34, 250–252. [Google Scholar] [CrossRef] [Green Version]
  38. Galway, J.G. The lifted index as a predictor of latent instability. Bull. Am. Meteorol. Soc. 1956, 43, 528–529. [Google Scholar] [CrossRef] [Green Version]
  39. George, J.J. Weather Forecasting for Aeronautics; Academic Press: Cambridge, MA, USA, 1960; p. 673. [Google Scholar]
  40. Glickman, T.S. (Ed.) Glossary of Meteorology, 2nd ed.; American Meteorological Society: Boston, MA, USA, 2000; p. 855. [Google Scholar]
  41. Weisman, M.L.; Klemp, J.B. The dependence of numerically simulated convective storms on vertical wind shear and buoyancy. Mon. Weather Rev. 1982, 110, 504–520. [Google Scholar] [CrossRef]
  42. Doswell III, C.A.; Schultz, D.M. On the use of indices and parameters in forecasting severe storms. E J. Sev. Storms Meteorol. 2006, 1, 1–22. [Google Scholar]
  43. StatSoft Inc. STATISTICA (Data Analysis Software System), 6th ed.; Tulsa, OK, USA, 2001; p. 150. Available online: www.statsoft.com (accessed on 11 December 2019).
  44. Donaldson, R.J.; Dyer, R.M.; Kraus, M.J. Objective evaluator of techniques for predicting severe weather events. Bull. Am. Meteorol. Soc. 1975, 56, 755. [Google Scholar]
  45. Hanssen, A.W.; Kuipers, W.J.A. On the Relationship Between the Frequency of Rain and Various Meteorological Parameters: (with Reference to the Problem Ob Objective Forecasting). Staatsdrukkerij-en Uitgeverijbedrijf 1965, 65, 2–15. [Google Scholar]
  46. Brenot, H.; Ducrocq, V.; Walpersdorf, A.; Champollion, C.; Caumont, O. GPS zenith delay sensitivity evaluated from high-resolution numerical weather prediction simulations of the 8–9 September 2002 flash flood over southeastern France. J. Geophys. Res. Atmos. 2006, 111, D15. [Google Scholar] [CrossRef] [Green Version]
  47. Viktor, E.; Reese, S.; Zimmerli, P. Hail losses under microscope—Comparing losses from three major hail events of the recent past. In Proceedings of the 8th ECSS, Wiener Neustadt, Austria, 14–18 September 2015; Available online: http://www.meetingorganizer.copernicus.org/ECSS2015/ECSS2015-19.pdf (accessed on 11 December 2019).
  48. Haralambous, H.; Oikonomou, C.; Pikridas, C.; Guerova, G.; Dimitrova, T.; Lagouvardos, K.; Kotroni, V.; Tymvios, F. BeRTISS project: Balkan-Mediterranean real-time severe weather service. In Proceedings of the Sixth International Conference on Remote Sensing and Geoinformation of the Environment, Paphos, Cyprus, 26–29 March 2018; Volume 10773, p. 1077313. [Google Scholar]
Figure 1. (a) Schematic presentation of data flow. (b) Map of Sofia with marked position of Global Navigation Satellite System (GNSS) station SOFI-Plana (SOFI, blue dot) and synoptic and radiosonde Sofia station (red dot).
Remotesensing 11 02988 g001
Figure 2. IWV values for TH (red color) and NTH days (blue color) from May (top left) to September (bottom center) 2010–2015.
Remotesensing 11 02988 g002
Figure 3. Box and whisker plot of IWV median (black square) and 10, 25, 75, and 90 percentiles for TH and NTH days, from May to September 2010–2015.
Remotesensing 11 02988 g003
Figure 4. Monthly POD, FAR, Critical Success Index (CSI), and True Skill Statistic (TSS) scores for F1 (light blue) and F2 (dark blue), from May (upper left) to September (bottom left) 2010–2015. The scores for the May–September 2010–2015 period are on the bottom right figure.
Remotesensing 11 02988 g004
Figure 5. Monthly POD, FAR, CSI, and TSS scores for F1 (light blue) and F2 (dark blue), from May (upper left) to September (bottom left) 2017–2018. The scores for the May–September 2017–2018 period are on the bottom right figure.
Remotesensing 11 02988 g005
Figure 6. Time series of IWV from station SOFI (blue line) and lightning flash rate (red bars) for Sofia multicell thunderstorm on 18 June 2014. The black left-right arrow marks the time with hail fall. The monthly IWV threshold is indicated with the dashed blue line.
Remotesensing 11 02988 g006
Figure 7. Time series of IWV from station SOFI (blue line) and lightning flash rate (red bars) for Sofia supercell thunderstorm on 8 July 2014. The black left-right arrow marks the time with hail fall. The monthly IWV threshold is indicated with the dashed blue line.
Remotesensing 11 02988 g007
Table 1. List of instability indices. Column: (1) abbreviation and name, (2) formula, and (3) reference.
Index Abbreviation
Full Name
FormulaReference
SWEAT
Severe Weather Threat Index
20(TT −49) + 12 D850 + 2 V850 + V500 + 125 (sin ( Δ V 500-850) + 0.2))[36]
SHI
Showalter Index
T500 − Tlp(850hPa) [37]
LI
Lifted Index
Tlp(fcs surface) −T500[38]
K
K Index
(T850 − T500) + D850 - (T700 − D700)[39]
CAPE
Convective Available Potential Energy
g T p   T e T e   Δ z [40]
TT
Total Totals Index
(T850 − T500) + (D850 − T500)[36]
BRN
Bulk Richardson Number
C A P E 1 2   U 2 [41]
Table 2. Maximum daily Integrated Water Vapor (IWV) value (column 2) and corresponding fraction of the days that registered no thunderstorm (NTH) (column 3) and thunderstorm (TH) (column 4), for the selected month (column 1).
MonthIWV
(kg/m2)
NTH Days
(% of All NTH days)
TH Days
(% of All TH days)
May >201965
June >242868
July>282851
August>281164
September>261886
Table 3. Monthly threshold of IWV (column 2), Probability of Detection (POD) (column 3), and False Alarm Ratio (FAR) values (column 4).
MonthIWV [kg/m2]PODFAR
May 19.680.690.13
June 23.090.750.31
July27.050.690.44
August25.600.790.51
September24.550.910.46
May–September23.500.670.45
Table 4. Monthly classification functions were based on (1) instability indices (InI) (column 2)—F1, and (2) instability indices and IWV (column 3)—F2. The last line presents the F1 and F2 functions for the May–September 2010–2015 period.
MonthF1 (InI)F2 (IWV,InI)
May 0.15×K + 0.32×LI + 0.01×SWEAT − 5.3550.54×IWV + 1.36×SHI + 0.74×TT + 0.07*K − 51.16
June 0.11×K + 0.57×TT + 0.97×SHI + 0.01×SWEAT − 33.350.16×IWV + 1.24×SHI + 0.08×K + 0.75×TT + 0.24×TLCL − 110.97
July0.06×K + 0.80×TT + 0.79×SHI + 0.34×TLCL + 0.44×LI − 136.170.16×IWV + 0.45×SHI + 0.27×LI + 0.02×K + 0.58×TT + 0.16×TLCL − 78.34
August1.43×SHI – 0.34×LI + 0.03×SWEAT – 0.01×K + 0.77×TT – 40.920.28×IWV + 0.99×TT + 1.72×SHI + 0.03×SWEAT – 59.33
September0.03×SWEAT + 0.06×K + 1.35×SHI -0.59×LI +0.40×TT – 26.120.83×IWV + 1.48×SHI + 0.01×SWEAT – 0.06K + 0.64×TT - 52.54
May–September0.63×TT + 0.05×K + 0.74×SHI + 0.21×TLCL + 0.01×SWEAT + 0.32×LI – 92.120. 24×IWV + 0.85×TT + 1.44SHI + 0.01×SWEAT + 0.11×TLCL + 0.02×K – 81.57

