1. Introduction
The new generation geostationary (GEO) remote sensors (GOES ABI, Himawari AHI, FY4 AGRI, and MTG-I FCI) provide unprecedented high-frequency observations at 5–15-minute intervals. With similar spatial/spectral design to MODIS Terra/Aqua and S-NPP VIIRS, these geostationary remote sensors offer a unique data source to monitor the land surface at a high temporal resolution. For each geostationary sensor observed pixel, the satellite viewing angle is fixed, but its solar illumination angle varies continuously. This multi-angular observation capability is another advantage of the GEO sensor over the low earth orbit (LEO) satellite (e.g., MODIS and VIIRS). The Advanced Himawari Imager (AHI) aboard on the Himawari-8 and -9 is the first GEO sensor in operational stage among the new generation GEO remote sensors [
1,
2,
3].
Himawari-8 AHI is a geostationary meteorological sensor. It is a state-of-the-art 16-band radiometer, with spectral bands covering visible, near-infrared, and infrared portions of the electromagnetic spectrum [
4,
5]. Of the 16 spectral bands, it carries six solar reflective bands (B01, B02, B03, B04, B05, and B06) that could be used for the observation of the land surface with spatial resolution 500 m for the red (B3), 1 km for visible-near infrared (B1, B2, and B4), and 2 km for short-wave infrared bands (B5 and B6). These six solar reflective bands closely mimic the spectral characteristics of the NASA EOS flagship MODIS Terra/Aqua. Cross-calibration studies of the Himawari-8 AHI with LEO sensors show that the radiometric accuracy and stability of AHI is compatible with MODIS and VIIRS [
5,
6,
7]. Abovementioned spectral and radiometric characteristics of AHI make producing high-frequency MODIS-like land products from Himawari-8 AHI possible.
Starting from 2017, the NASA GeoNEX team (
https://www.nasa.gov/geonex) at the NASA Ames Research Center has collaborated with scientists around the world to develop the GeoNEX processing pipeline on the NASA Pleiades supercomputer, as well as public cloud platforms (e.g., Amazon Web Services, AWS). Adapted Multi-Angle Implementation of Atmospheric Correction (MAIAC) algorithm is integrated in the GeoNEX pipeline for the generation of the AHI land SR product. The version of MAIAC is adapted from NASA’s MODIS heritage—MAIAC for MCD19 products. MAIAC has been in development for more than 10 years [
8,
9,
10,
11,
12,
13,
14,
15,
16] and has been highly evaluated by previous studies [
7,
8,
9,
10,
11,
12,
13,
14,
15,
16,
17,
18,
19,
20,
21].
The adapted MAIAC algorithm makes use of gridded, multi-angle, and time series AHI observations to detect clouds, perform aerosol retrievals, and determine land SR. The goal of this paper is to provide an overview of the GeoNEX Himawari-8 AHI SR product, along with a comparison between Himawar-8 AHI and MODIS Terra/Aqua SR products (i.e., MCD19A1). Quality assurance of the first Himawari-8 AHI SR product is discussed.
2. Data
2.1. Preprocessing of Advanced Himawari Imager Data
The current version of GeoNEX was developed to generate automatic land SR and higher-level land products from Himawari Standard Data (HSD). There are around 94 GB of raw HSD data generated by the Himawari-8 AHI per day. Before producing the Himawari-8 AHI surface reflectance product (HM08_AHI12), the HSD has to be preprocessed into Top-of-Atmosphere (TOA) reflectance (HM08_AHI05). This step includes radiometric calibration and georeference. It creates 120-GB Himawari-8 AHI TOA reflectance data (HM08_AHI05) each day. For the user’s convenience, a standalone utility tool was developed by the GeoNEX team to accomplish the preprocessing step. We used Python and the Geospatial Data Abstraction Library (GDAL) for this tool, where GDAL handled map projection conversion, raster pixel resampling, and raster calculation, and Python made the utility tool ready for parallel and cross platform computing.
The preprocessing started by gridding the received HSD scans, georeferencing the full disk images with geographic projection, cropping a 120° by 120° process domain (E84°–W156°, N60°–S60°), and splitting them into tiles (
Figure 1). Each tile covers 6° by 6°, including 360,000 pixels with a spatial resolution of 0.01°. The gridding process places HSD scans into tile cells of fixed latitude–longitude coordinates. This fixed grid system was perfectly suitable for the MAIAC algorithm for aerosol retrievals and atmospheric correction (AC). It allowed MAIAC to observe the same earth surface location over cumulative time with varied solar illuminations, making it easier to separate atmospheric and earth surface contributions and characterize the anisotropic surface reflectance.
2.2. The Himawari-8 AHI Surface Reflectance Product
The Himawari-8 AHI surface reflectance product (HM08_AHI12) has been produced and released with provisional status to the general public from July 2015 onward (
https://www.nasa.gov/geonex). The HM08_AHI12 continues to be qualitatively assessed by the NASA Earth Exchange team, including efforts for time series analysis, comparisons with MODIS Terra/Aqua SR products, and AERONET-based validation of aerosol retrieval.
HM08_AHI12 is among the Himawari-8 AHI Level 2 0.01° (1 km at equator) land products (including vegetation indices, fire, and gross primary productivity, etc.) from the GeoNEX pipeline. All of the Himawari-8 AHI land products are provided in geographic projection with standard tiles representing 6° by 6° on the Earth (
Figure 1).
The HM08_AHI12 provides three standard products in HDF-EOS2 format for each of the 122 land tiles on the domain (
Figure 1). The atmospheric property product (HM08_AHI12A) supplied an aerosol optical depth (AOD) at 0.47µm and 0.55µm. The retrieved AOD corresponds to AHI blue band B01 (0.47µm) and the Green band (0.55µm) value computed based on the regional aerosol model used in the retrievals. This mid-visible value is provided for the convenience of use by the modelers and general users and to facilitate comparisons with the standard aerosol products other sensors reporting AOD at 0.55 µm. The second product (HM08_AHI12B) is a spectral surface reflectance (AHI bands 1-6), or bidirectional reflectance factor (BRF). The third product (HM08_AHI12C) provides estimated spectral BRDF kernel weights for the Ross-Thick Li-Sparse (RTLS) bidirectional reflectance distribution factor (BRDF) model [
22,
23,
24,
25]. By applying BRDF kernels and BRDF parameters (kernel weights), users could reconstruct the surface BRDF or perform geometric normalization of BRFs to a desired or fixed sun-view geometry [
12].
Each HM08_AHI12 product included quality assurance (QA) information providing per-pixel quality information on the usability and usefulness of the HM08_AHI12 for any particular science application.
2.3. Himawari-8 AHI Daytime Composite
Himawari-8 AHI scans full disk in every 10 minutes. It generates 144 full disk images each day. We generated Himawari-8 AHI daytime composite by screening valid pixels (clear-sky with lower solar zenith angle) from these 144 full disk images.
First, three image stacks (surface reflectance, cloud mask, solar zenith angle) were created by extracting corresponding layers from HM08_AHI12 data. The surface reflectance image stack included 144 observations, where each observation had six solar reflective bands. There were 144 layers in each cloud mask and solar zenith image stack. Each cloud mask and solar zenith layer corresponded one of the 144 surface reflectance layers. The cloud mask was part of the quality assurance information of HM08_AHI12. Per-pixel solar zenith angles were calculated during the process of HM08_AHI12.
Second, we used cloud mask image stack to screen corresponding surface reflectance layers and mask out any cloud contaminated pixels.
Theoretically, solar zenith angles less than 90° mean the pixel was observed during the daytime. We used a threshold of 65° to screen daytime pixels. Within the daytime observed pixels, only SR values corresponding to the lowest solar zenith angles were kept as final composites.
2.4. Data for Comparison
The MODIS Terra and Aqua C6 daily surface reflectance data (MCD19A1) was used as a reference dataset to quantify the radiometric performance of MAIAC derived geostationary SR product, HM08_AHI12. The reference dataset represents the latest version of MODIS MAIAC Collection 6 land SR product [
25] and is publicly available from NASA EOSDIS LP DAAC (
https://earthdata.nasa.gov/eosdis/daacs/lpdaac). MCD19A1 is a MODIS Terra and Aqua-combined MAIAC land surface BRF [
25], where MAIACTBRF is for Terra and MAIACABRF is for Aqua. Since MCD19A1 is derived from the MAIAC algorithm, it is suitable to use in comparison with a MAIAC-derived Himawari-8 AHI SR product. Currently, validation at stage 2 has been achieved for MAIACTBRF and MAIACABRF [
17,
18,
19,
20,
21,
25]. MODIS landcover (MCD12Q1) was also used in this study to identify vegetation pixels. The locations of three validation sites with homogeneous vegetation covers (i.e., grasslands, savannas, and shrublands) were determined from MCD12Q1 data.
We preprocessed the MODIS data to match the HM08_AHI12 spatial resolutions and reporting dates. Spatially, the MODIS data were re-projected as a geographic (latitude/longitude) projection and were then resampled to 0.01° by 0.01° resolution.
3. Atmospheric Correction Algorithm
The MAIAC algorithm was originally developed for MODIS to retrieve aerosol and perform atmospheric correction over the land surface [
8,
9,
10,
11,
12,
13]. However, the underlying physical idea behind MAIAC, utilizing the time series analysis and the minimum reflectance method, makes it more suitable for the processing of geostationary satellite imagery. The Himawari-8 AHI acquires observations at 10-minute intervals, which provides the MAIAC algorithm with daily multi-angle observations, helping to achieve a good quality of cloud detection, aerosol retrievals, and atmospheric correction over land, including dark vegetation and bright deserts.
The semi-empirical RTLS [
22,
23,
24] model provides the boundary condition or the MAIAC radiative transfer model [
25]. It is represented as a weighted sum of three components (e.g., isotropic, geometric-optical, and volume scattering, Equation (1)).
The two geometric functions (kernels),
and
, describe different shapes as a function of viewing and illumination geometry (𝜃,𝜐,𝜙 - cosine of solar zenith, cosine of viewing zenith, and cosine of relative azimuth angles) and do not depend on the surface type or atmospheric conditions. The kernel
is derived from the volume scattering radiative transfer models [
26] and kernel
comes from geometric-optical modeling of discrete crown vegetation canopy with shadows [
27].
The adapted MAIAC algorithm uses up to 80 AHI observations (up to 2-3 days), to find the best fit kernel weights.
The selection of the Equation (1) stated radiative transfer model was based on extensive MODIS applications [
14,
15,
16]. The kernel combination of Equation (1) was applied in the operational MODIS Reflectance/AOD/BRDF/albedo and BRDF/albedo algorithms [
28]. Since 2011, MAIAC-derived MODIS products have been extensively tested and validated by the land and air quality communities [
17,
18,
19,
20,
21]. The operational MODIS Collection 6 MAIAC dataset (MCD19 suite of products) was publicly released in May of 2018. The MCD19 data record includes daily SR (MCD19A1), Aerosol Optical Depth (MCD19A2), and eight-day BRDF/Albedo (MCD19A3) naturally gap-filled (MCD19A3) products [
25]. The GeoNEX pipeline for the MAIAC Himawari-8 AHI closely mimics the MODIS MCD19 convention. In near future, we plan to adapt the MAIAC algorithm to other geostationary sensors (e.g., GEOS-R ABI).
A separate paper under preparation will discuss the details of perspective consistent global land products from geostationary sensors. Using the adapted MAIAC Algorithm, HM08_AHI05 in every 0.01° grid cell was processed into HM08_AHI12.
4. Methodology for Comparison
4.1. Ray-Matching Method
We used the ray-matching method to select collocated pixel pairs from HM08_AHI12 and the reference MODIS data. The ray-matching method is a straightforward tool to match pixels from GEO and LEO sensors for comparison [
6,
29,
30]. The method relies on precise spatially and view geometry collocated target pixels to reduce the atmosphere and BRDF impact.
In this paper, we used the ray-matching method to locate the near-simultaneous (within 5 min) observations from both Himawari-8 AHI and MODIS Terra/Aqua SR products, and limit the sun/view zenith angle difference between AHI and Terra/Aqua to less than 0.01 for the cosine of zenith angle.
After the collocated pixel pairs were selected through the ray-matching method, QA flags (
Table 1) from the corresponding products were then applied to mask out poor-quality pixels. Only the land pixels with clear sky from both AHI and MODIS SR products were kept for further analysis.
Both HM08_AHI12 and MCD19A1 data use 16-bit unsigned integer to represent status QA, where bits 0–2 are cloud mask, bits 3–4 are land/water/snow/ice mask, bits 5–7 are adjacency mask, bit 8 is AOD level, and bit 9 is algorithm initialize status [
8]. For each selected pixel pair, there are two corresponding arrays which record its QA information. We grouped the pixel pair with “clear sky” if both HM08_AHI12 and MCD19A1 QA flags met the criteria shown in
Table 1.
4.2. Spectral Band Adjustment
Himawari-8 AHI and MODIS Terra/Aqua showed differences in terms of the relative spectral responses (RSRs) that need to be adjusted in order to conduct cross-comparison. Spectral band adjustment factors (SBAFs, Equation (2),
Table 2) were applied to the selected Himawari-8 AHI pixels. The SBAFs, derived from the Scanning Imaging Absorption spectrometer for Atmospheric CHartographY (SCIAMACHY [
31,
32]), were used in this study. SCIAMACHY covered continuous spectral range of 0.24–1.75 µm. Since Himawari-8 AHI B06 (at 2.3 µm) was out of the spectral range of SCIAMACHY, the SBAF was set to 1.0 for AHI B6 (
Table 2). The SBAF calculator is a web enabled tool, developed and maintained by the NASA Clouds and the Earth’s Radiant Energy System (CERES) geostationary calibration team (
https://www-pm.larc.nasa.gov/cgi-bin/site/showdoc?mnemonic=SBAF).
5. Results and Discussion
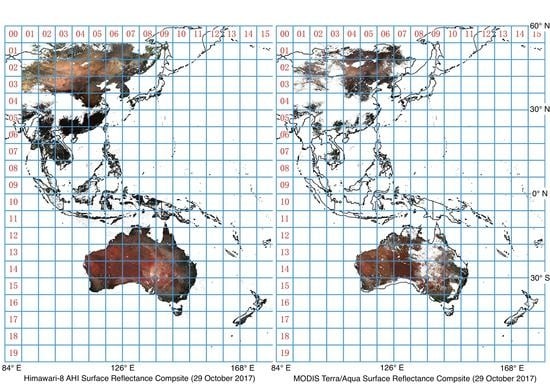
5.1. Spatial Pattern
Figure 2 shows an example of one daytime composite (29 October 2017) of the 0.01° Himawari-8 AHI SR data and combined MODIS Terra/Aqua SR over the AHI process domain (122 land tiles). A total of 72 Himawari-8 AHI daytime observations were sensed, while MODIS Terra and Aqua (with multiple daytime swaths) only sensed the same area once on the same day, respectively.
MODIS Terra/Aqua SR retrievals are frequently affected by clouds an aerosol contamination. The Terra and Aqua composite showed that MODIS had lower clear-sky pixel retrieval than Himawari-8 AHI. As evident in
Figure 2, the MODIS Terra/Aqua (right panel) atmospherically corrected SR products had a large amount of missing data (blank land pixels), primarily due to clouds and aerosol at the time of the MODIS Terra/Aqua overpass. Meanwhile, the Himawari-8 AHI daily SR composite showed elegant properties. The AHI SR pixels filled the land surface smoothly across the process domain (
Figure 2 left panel).
There were 35% more valid land SR pixels obtained by Himawari-8 AHI when compared to MODIS Terra and Aqua combined during the day of 29 October 2017. For the tropical lands (
Figure 2, 10°S to 10°N), high-frequency Himawari-8 AHI data allowed us to view 44.7% tropical lands, while MODIS Terra/Aqua combined only captured 3.08% tropical land pixels on the same day.
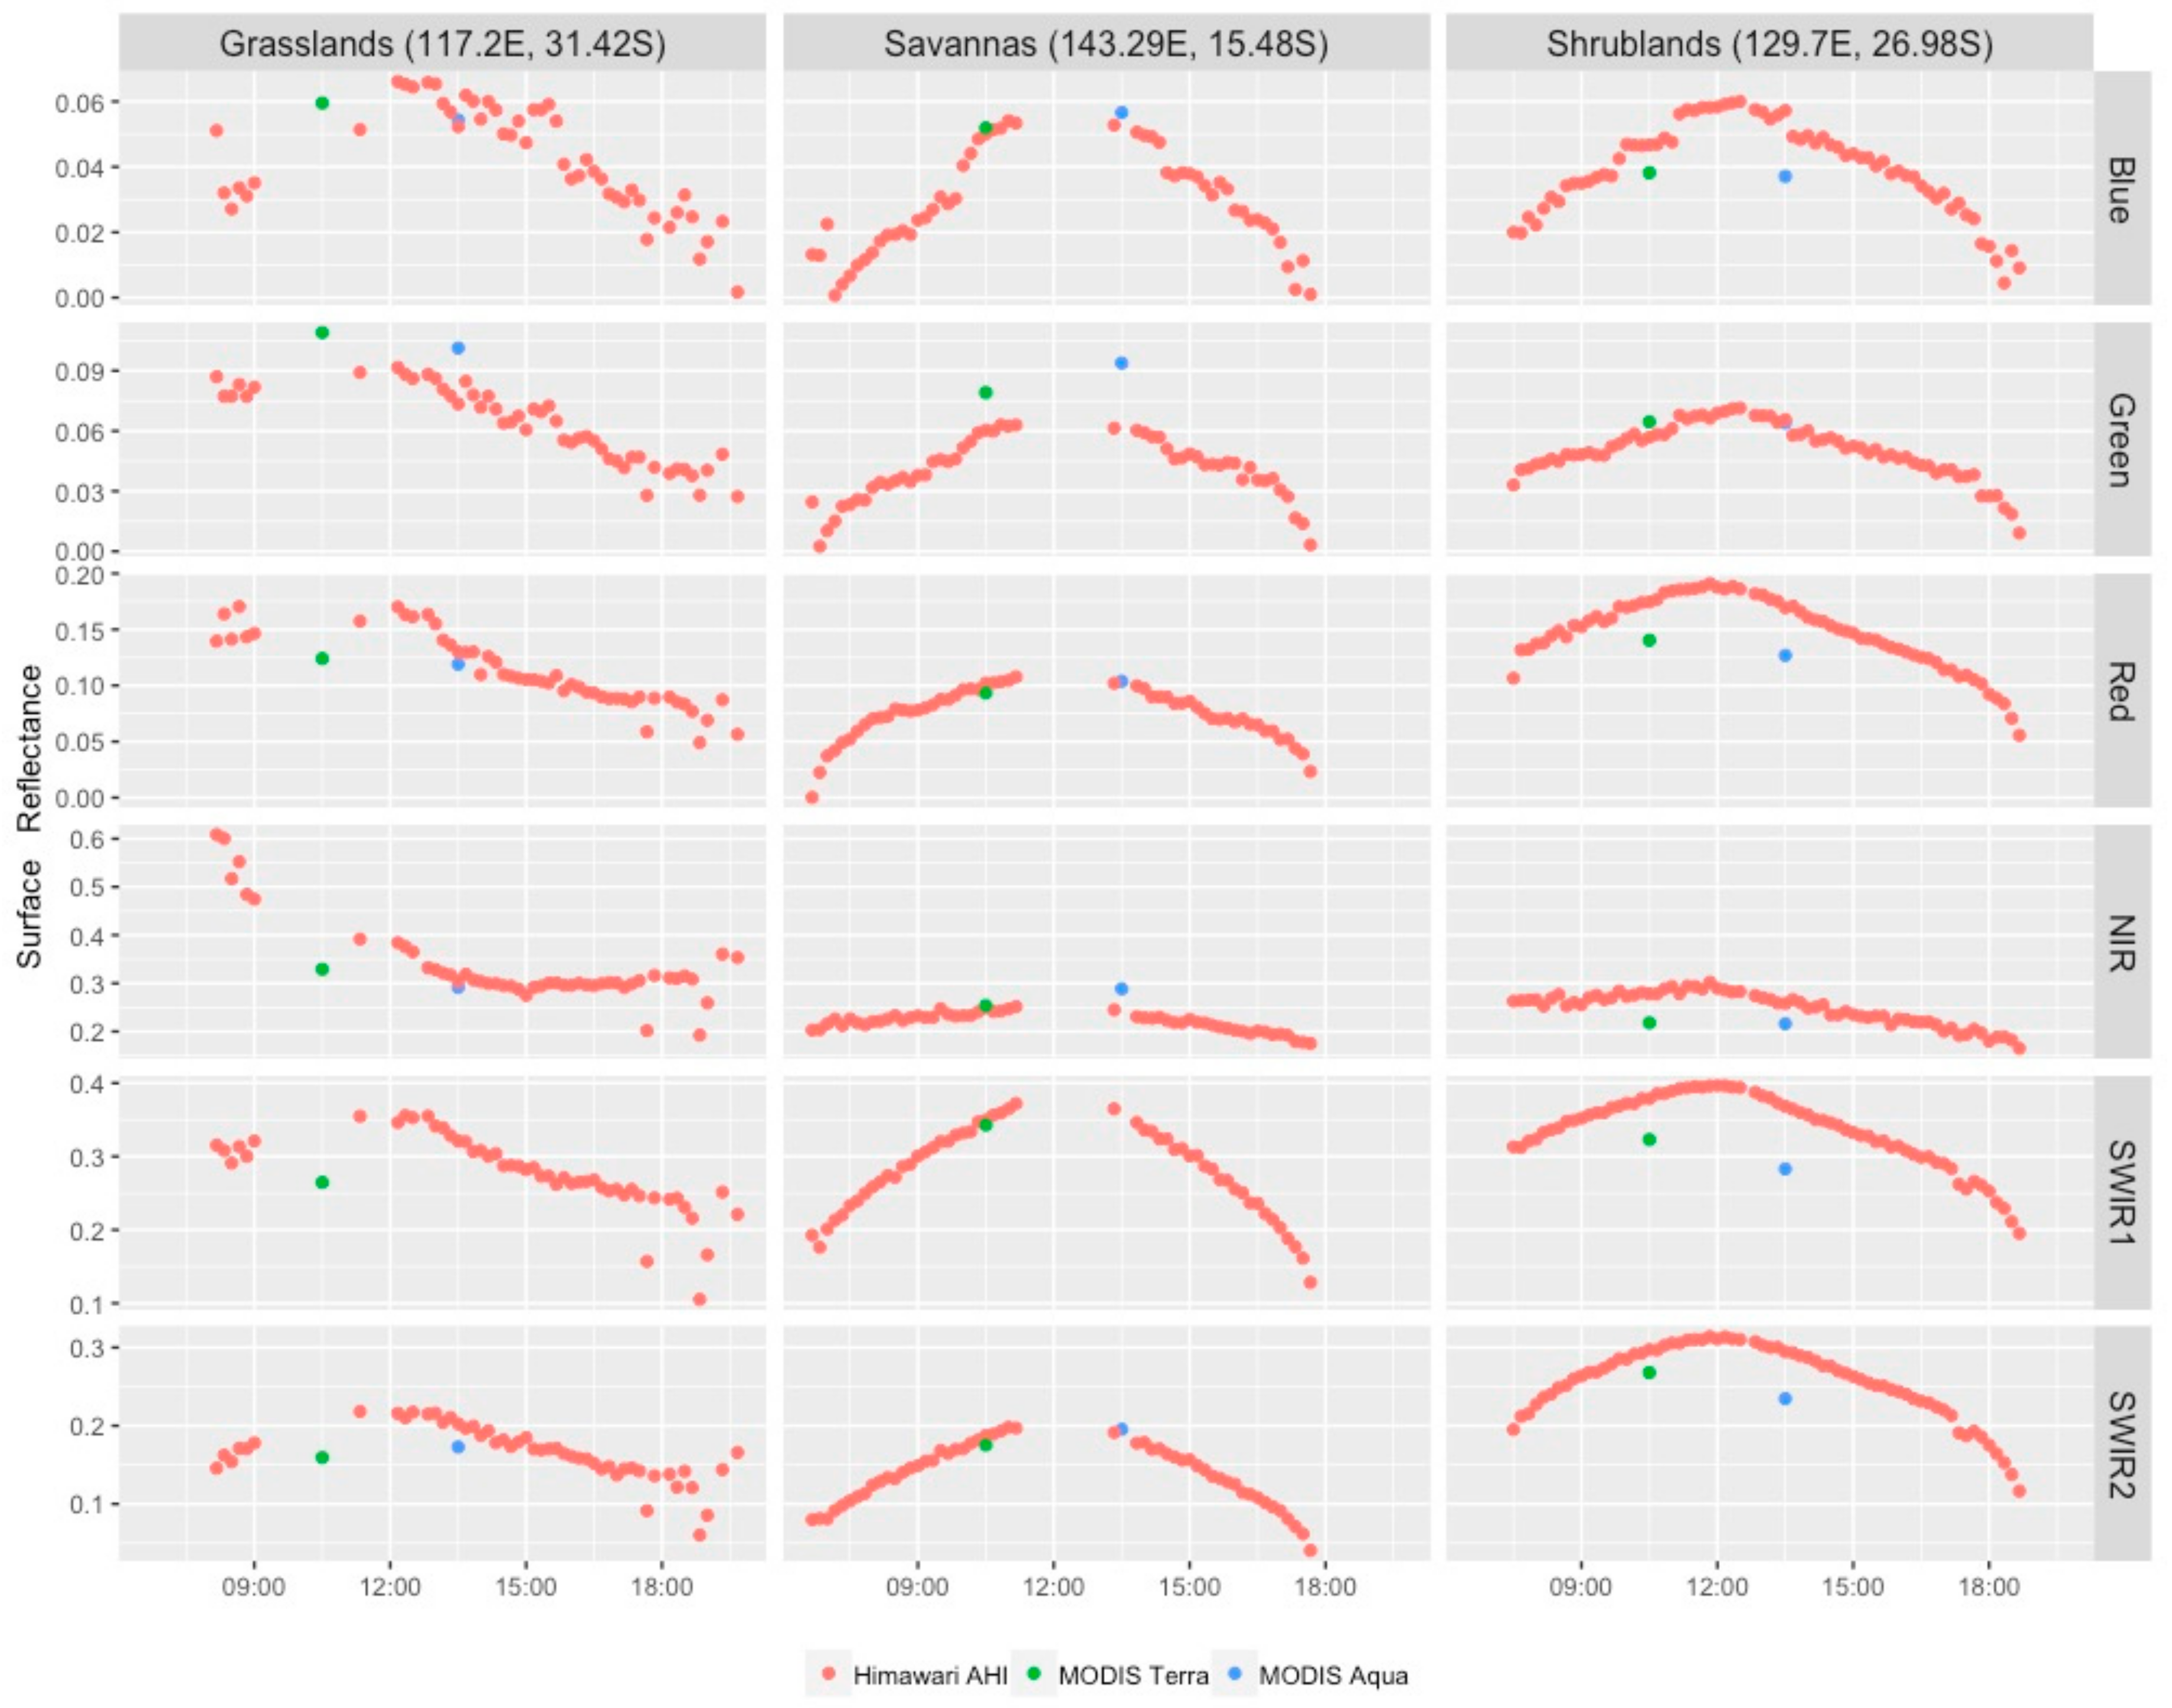
5.2. Evaluation of Himawari-8 AHI SR over Vegetation Sites
Although MODIS Terra/Aqua can synchronously observe earth surface with sufficient accuracy, it can only scan once or twice (Terra and Aqua combine) each day, which is far from the demand of current terrestrial ecology studies. For example, in order to characterize and quantify the evolution of carbon sources, sinks, and fluxes, researchers need regional, and even global, diurnal dynamics of ecosystem carbon, evapotranspiration, and energy flux with high frequency. The new generation of GEO satellites meet this need perfectly. One year (2017) of cloud-free pixels over three predetermined vegetation sites were extracted from Himawari-8 and MODIS SR products. These pixels were not screened by the ray-matching method because the vegetation site locations did not meet the exact requirements of the ray-matching method. The numbers of the clear-sky SR retrievals over these sites are listed in
Table 3. There were much more valid SR pixels retrieved from Himawari-8 AHI data than the MODIS Terra and Aqua data combined (
Table 3).
Density plots of the one-year vegetation SR values indicate that there was bias between Himawari-8 AHI and MODIS SR data, even when SBAFs were applied (
Figure 3). We noted that the bias for blue (AHI B1, Terra/Aqua B3) and green (AHI B2, Terra/Aqua B4) bands was more negative, while bias for the rest of the bands was more positive. The Himawari-8 AHI and MODIS Terra/Aqua bias offset varied, with the green band showing −0.02 and the NIR (AHI B4, Terra/Aqua B2) band showing +0.03. A recent study by Yu and Wu also noted similar bias for TOA reflectance between Himawari-8 AHI and S-NPP VIIRS [
6]. Diurnal cycles of meteorological variables and sun zenith/azimuth angle changes might be the main contributors to the bias between Himawari-8 AHI and MODIS SR. We used ray-matching screened pixels to remove the diurnal variability of aerosols and clouds in next section to further examine the possible discrepancy between Himawari-8 AHI and MODIS Terra/Aqua SR data.
More about the Himawari-8 AHI diurnal observations can be learned from
Figure 4. Data from one day in
Figure 4 showed that 10-minute intervals captured details of vegetation biophysical variations over daylight time. Since the viewing angles (both zenith and azimuth) of Himawiari-8 AHI are fixed and atmospheric effects are corrected through MAIAC algorithm, the sun zenith and azimuth angle changes are the main factors driving the variation of AHI surface reflectance. The continuous Himawari-8 AHI observations revealed how the vegetation reacted to diurnal solar radiation (
Figure 4).
There were differences between the Himawari-8 AHI and MODIS SR values (
Figure 4). Understanding and quantifying Himawari-8 AHI SR variations are critical to making Himawari-8 AHI an Analysis Ready Data (ARD). First, the SR differences at 10:30 and 13:30 varied over different landcovers (
Figure 4). SR differences between the Himawari-8 AHI and MODIS were larger over shrublands. However, differences were very small over savannas. Different landcover may also contribute the diurnal variation of Himawari-8 AHI SR. For example, SR variation over grasslands was greater than that of over the other vegetation types. Lower sun zenith may also play an important role for the SR diurnal variation. Increased uncertainty can be observed from Himawari-8 AHI diurnal observations during the early morning and afternoon (
Figure 4).
5.3. Ray-matching Screened Pixels
We compared atmospherically corrected Himawari-8 AHI and MODIS SR products with the pixels selected through the ray-matching method. The QA flags in
Table 1 were applied to the selected pixel pairs. We grouped the final pixel pairs into morning/afternoon comparisons (
Table 4), and the differences are presented in
Table 5. The pixel by pixel scatterplots are shown in
Figure 5.
Overall, across the solar reflective bands, variations of Himwawri-8 AHI SR values were lower than its MODIS counterpart (
Table 4). This sign shows the radiometric stability of Himawari-8 AHI. For the selected pixels sensed during the morning period (around 10:30 a.m. local time), the reflectance variations were much higher than those sensed during the afternoon (around 1:30 p.m. local time). This tendency can be observed across all band comparisons (
Table 4).
Table 5 shows that SR discrepancies of blue and green bands between Himawari-8 AHI and MODIS Terra/Aqua were around or over 20%. The Himawari-8 AHI blue SR was significantly higher than the MODIS reflectance during both the morning and afternoon periods, while the green band showed opposite results (
Table 5). The surface reflectance differed slightly in the NIR, red, SWIR1, and SWIR2 bands, with the relative difference between –5.98% and 2.69% during the morning period, and–8.32% and 6.03% during the afternoon period (
Table 5). The large discrepancies of the AHI blue and green SR values with Terra/Aqua can be explained by AHI’s large solar illumination angles during the early morning and late afternoon. Diurnal plots in the previous section (
Figure 4) showed the diurnal surface reflectance variations. AHI’s SR values acquired at early morning and late afternoon were much lower than the SRs retrieved during noon. Accordingly, AHI’s SR values acquired at early morning and late afternoon were much lower than the MODIS Terra/Aqua observations.
As shown in the scatterplots (
Figure 5), there were strong linear relationships between the Himawari-8 AHI and the corresponding MODIS Terra/Aqua SR products. Pixel by pixel comparisons showed that better correlations (correlation coefficient greater than 0.7, p-value <2.2e-16) were achieved across the six solar reflective bands, except the afternoon comparisons of the blue and green bands. The correlation coefficients of the blue and green bands were 0.54 and 0.46 during afternoon observations, respectively. The red and NIR bands yielded best correlation coefficients (0.94 and 0.99, p-value:<2.2e-16) during morning observations, while the correlation coefficients were lower during afternoon observations (0.81 and 0.83, respectively).
6. Conclusions
The purpose of this study was to introduce GeoNEX pipeline for the next generation of geostationary sensors and to assess the performance of its first land product from the Himawari-8 AHI (HM08_AHI12). The HM08_AHI12 was derived from Himawari-8 AHI daylight time observations with 10-min intervals. An adapted MAIAC algorithm was used for the atmospheric correction of Himawari-8 AHI data. The data quality of the HM08_AHI12 was critical to the success of GeoNEX process pipeline, since all the downstream products directly/indirectly depend on HM08_AHI12. The adapted MAIAC algorithm used in GeoNEX was based on the well-established heritage from MODIS mission, which made HM08_AHI12 compatible to MODIS data (MCD19A1). Our analysis showed that the Himawari-8 AHI acquired 35% more valid land pixels than that of the MODIS Terra/Aqua combine. For tropical land remote sensing, Himawari-8 AHI could retrieve even more (greater than 40%) valid land pixels. The performance of the HM08_AHI12 demonstrates huge advantages of GEO over LEO satellites to land remote sensing. There were discrepancies between the Himawari-8 AHI and MODIS Terra/Aqua SR products. The differences varied band to band and were highly related to solar illumination conditions. Our results showed that the Himawari-8 AHI blue and green bands are problematic. The SR values of the Himwawari-8 AHI blue and green bands were significantly impacted by the illumination conditions. The performance of short-wave infrared bands (SWIR1 and SWIR2) was better than that of blue and green bands. Fortunately, the two vegetation bands (red and NIR) of the Himawari-8 AHI were in well-agreement with their counterpart of the MODIS Terra/Aqua. The correlation coefficients of the red and NIR bands were 0.94 and 0.99, respectively. A new version of adapted MAIAC algorithm for geostationary sensor GOES-R ABI is under development. Further evaluation of the Himawari-8 AHI SR product will be conducted when Himawari-8 AHI and GOES-R ABI are combined into a consistent high-frequency land product.
Author Contributions
S.L., W.W., R.N. conceived the main idea, designed the experiments and prepared the manuscript. H.H, J.X, and T.V helped data curation. J.Y., L.Q., K.I., A.L, and Y.W. reviewed and edited the manuscript.
Funding
S.L. and J.Y. are supported by Guizhou Education University under grants to National Key Research program of China (No. 2016YFC0502300), scientific research project of major agricultural industries in Guizhou province (No.KY[2019]007). W.W, H.H, J.X., T.V., and R.N. are supported by the National Aeronautics and Space Administration (NASA) under grants to NASA Earth Exchange (NEX). Y.W. and A.L. are funded by NASA Science for Terra, Aqua, and SNPP (17-TASNPP17-0116) and additionally supported by the NASA GeoCAPE program.
Acknowledgments
The authors would like to thank the anonymous reviewers for their valuable comments to improve the paper quality. The authors would like to thank: Center for Environmental Remote Sensing (CEReS), Chiba University, Japan for making Himawari-8 AHI data available; the NASA/MODIS Land Discipline Groups for sharing the MODIS LAND data.
Conflicts of Interest
The authors declare no conflict of interest. The funders had no role in the design of the study; in the collection, analyses, or interpretation of data; in the writing of the manuscript, or in the decision to publish the results.
References
- Bessho, K.; Date, K.; Hayashi, M.; Ikeda, A.; Imai, T.; Inoue, H.; Kumagai, Y.; Miyakawa, T.; Murata, H.; Ohno, T. An introduction to Himawari-8/9—Japan’s new-generationgeostationary meteorological satellites. J. Meteorol. Soc. Jpn. 2016, 94, 151–183. [Google Scholar] [CrossRef] [Green Version]
- Kurihara, Y.; Murakami, H.; Kachi, M. Sea surface temperature from the new Japa-nese geostationary meteorological Himawari-8 satellite. Geophys. Res. Lett. 2016, 43, 1234–1240. [Google Scholar] [CrossRef] [Green Version]
- JMA (Japan Meteorological Agency). JMA/MSC: Himawari-8/9. Japan Meteorological Agency 2019. Available online: www.data.jma.go.jp/mscweb/en/himawari89 (accessed on 8 May 2019).
- Da, C. Preliminary assessment of the Advanced Himawari Imager (AHI) measurement onboard Himawari-8 geostationary satellite. Remote Sens. Lett. 2015, 6, 637–646. [Google Scholar] [CrossRef]
- Qin, Y.; McVicar, T.R. Spectral band unification and inter-calibration of Himawari AHI with MODIS and VIIRS: Constructing virtual dual-view remote sensors from geostationary and low-Earth-orbiting sensors. Remote Sens. Environ. 2018, 209, 540–550. [Google Scholar] [CrossRef]
- Yu, F.F.; Wu, X.Q. Radiometric inter-calibration between Himawari-8 AHI and SNPP VIIRS for the solar reflective bands. Remote Sens. 2016, 8, 165. [Google Scholar] [CrossRef] [Green Version]
- Liang, X.; Ignatov, A.; Kramar, M.; Yu, F. Preliminary Inter-Comparison between AHI, VIIRS and MODIS Clear-Sky Ocean Radiances for Accurate SST Retrievals. Remote Sens. 2016, 8, 203. [Google Scholar] [CrossRef] [Green Version]
- Lyapustin, A.; Wang, Y. MAIAC—Multi-Angle Implementation of Atmospheric Correction for MODIS: Algorithm Theoretical Basis Document, v1.0, 78. 2008. Available online: https://neptune.gsfc.nasa.gov/bsb/index.php?section=101 (accessed on 22 October 2019).
- Lyapustin, A.; Wang, Y. The time series technique for aerosol retrievals over land from MODIS. In Satellite Aerosol Remote Sensing Over Land; Kokhanovky, A., de Leeuw, G., Eds.; Springer Praxis: Berlin/Heidelberg, Germany, 2009; pp. 69–99. [Google Scholar] [CrossRef]
- Lyapustin, A.; Martonchik, J.; Wang, Y.; Laszlo, I.; Korkin, S. Multi-Angle Implementation of Atmospheric Correction (MAIAC): Part 1. Radiative Transfer Basis and Look-Up Tables. J. Geophys. Res. 2011, 116. [Google Scholar] [CrossRef]
- Lyapustin, A.; Wang, Y.; Laszlo, I.; Kahn, R.; Korkin, S.; Remer, L.; Levy, R.; Reid, J.S. MultiAngle Implementation of Atmospheric Correction (MAIAC): Part 2. Aerosol Algorithm. J. Geophys. Res. 2011, 116. [Google Scholar] [CrossRef]
- Lyapustin, A.; Wang, Y.; Laszlo, I.; Hilker, T.; Hall, F.; Sellers, P.; Tucker, J.; Korkin, S. Multi-Angle Implementation of 5 Atmospheric Correction for MODIS (MAIAC). 3: Atmospheric Correction. Remote Sens. Environ. 2012, 127, 385–393. [Google Scholar] [CrossRef]
- Lyapustin, A.I.; Korkin, S.; Wang, Y.; Quayle, B.; Laszlo, I. Discrimination of biomass burning smoke and clouds in MAIAC algorithm. Atmos. Chem. Phys. 2012, 12, 9679–9686. [Google Scholar] [CrossRef] [Green Version]
- Lyapustin, A.I.; Wang, Y. MCD19A1 MODIS/Terra+Aqua Land Surface BRF Daily L2G Global 500 m and 1 km SIN Grid V006 [Data Set]; NASA EOSDIS Land Processes DAAC: Sioux Falls, SD, USA, 2018. [CrossRef]
- Lyapustin, A.I.; Wang, Y. MCD19A2 MODIS/Terra+Aqua Land Aerosol Optical Depth Daily L2G Global 1 km SIN Grid V006 [Data Set]; NASA EOSDIS Land Processes DAAC: Sioux Falls, SD, USA, 2018. [CrossRef]
- Lyapustin, A.I.; Wang, Y. MCD19A3 MODIS/Terra+Aqua BRDF Model Parameters 8-Day L3 Global 1 km SIN Grid V006 [Data Set]; NASA EOSDIS Land Processes DAAC: Sioux Falls, SD, USA, 2018. [CrossRef]
- Hilker, T.; Lyapustin, A.I.; Tucker, C.J.; Sellers, P.J.; Hall, F.G.; Wang, Y. Remote Sensing of Tropical Ecosystems: Atmospheric Correction and Cloud Masking Matter. Remote Sens. Environ. 2012. [Google Scholar] [CrossRef] [Green Version]
- Hilker, T.; Lyapustin, A.I.; Tucker, C.J.; Hall, F.G.; Myneni, R.B.; Wang, Y.; Bi, J.; Moura, Y.M.; Sellers, P.J. Vegetation dynamics and rainfall sensitivity of the Amazon. Proc. Natl. Acad. Sci. USA 2014, 111, 16041–16046. [Google Scholar] [CrossRef] [PubMed] [Green Version]
- Hilker, T.; Lyapustin, A.I.; Wang, Y.; Hall, F.G.; Tucker, C.J.; Sellers, P.J. On the measurability of change in Amazon vegetation from MODIS. Remote Sens. Environ. 2015, 166, 233–242. [Google Scholar] [CrossRef]
- Martins, V.S.; Lyapustin, A.; de Carvalho, L.A.S.; Barbosa, C.C.F.; Novo, E.M.L.M. Validation of high-resolution MAIAC aerosol product over South America. J. Geophys. Res. Atmos. 2017, 122. [Google Scholar] [CrossRef]
- Superczynski, S.; Kondragunta, S.; Lyapustin, A. Evaluiation of the Multi-Angle Implementation of Atmospheric Correction (MAIAC) Aerosol Algorithm through Intercomparison with VIIRS Aerosol Products and AERONET. J. Geophys. Res. Atmos. 2017, 122, 3005–3022. [Google Scholar] [CrossRef] [Green Version]
- Wanner, W.; Li, X.; Strahler, A.H. On the derivation of kernels for kernel-driven models of bi-directional reflectance. J. Geophys. Res. 1995, 100, 21077–21090. [Google Scholar] [CrossRef]
- Roujean, J.L.; Leroy, M.; Deschamps, P.Y. A bi-directional reflectance model of the Earth’s surface for the correction of remote sensing data. J. Geophys. Res. 1992, 97, 20455–20468. [Google Scholar] [CrossRef]
- Lucht, W.; Schaaf, C.B.; Strahler, A.H. An algorithm for the retrieval of albedo from space using semiempirical BRDF models. IEEE Trans. Geosci. Remote Sens. 2000, 38, 977–998. [Google Scholar] [CrossRef] [Green Version]
- Lyapustin, A.; Wang, Y.; Korkin, S.; Huang, D. MODIS Collection 6 MAIAC Algorithm. Atmos. Meas. Tech. 2018, 11, 5741–5765. [Google Scholar] [CrossRef] [Green Version]
- Ross, J.K. The Radiation Regime and Architecture of Plant Stands; Dr. W. Junk Publishers: Boston, UK, 1981; p. 392. [Google Scholar]
- Li, X.; Strahler, A.H. Geometric-optical bidirectional reflectance modeling of the discrete crown vegetation canopy: Effect of crown shape and mutual shadowing. IEEE Trans. Geosci. Remote Sens. 1992, 30, 276–292. [Google Scholar] [CrossRef]
- Schaaf, C.; Gao, F.; Strahler, A.H.; Lucht, W.; Li, X.; Tsang, T.; Strugnell, N.C.; Zhang, X.; Jin, Y.; Muller, J.P.; et al. First operational BRDF, albedo nadir reflectance products from MODIS. Remote Sens. Environ. 2002, 83, 135–148. [Google Scholar] [CrossRef] [Green Version]
- Doelling, D.; Minnis, P.; Nguyen, L. Calibration comparison between SEVERI, MODIS and GOES data. In Proceedings of the 2004 MSG RAOWorkshop, Salzburg, Austria, 6–10 September 2004. [Google Scholar]
- Hewison, T.J.; Wu, X.; Yu, F.; Tahara, Y.; Hu, X.; Kim, D.; Koenig, M. GSICS Inter-Calibration of Infrared Channels of Geostationary Imagers Using Metop/IASI. IEEE Trans. Geosci. Remote Sens. 2013, 51, 1160–1170. [Google Scholar] [CrossRef]
- Scarino, B.; Doelling, D.; Minnis, P.; Gopalan, A.; Chee, T.; Bhatt, R.; Lukashin, C.; Haney, C. A web-based tool for calculating spectral band difference adjustment factors derived from SCIAMACHY hyper-spectral data. IEEE Trans. Geosci. Remote Sens. 2016, 54, 2529–2542. [Google Scholar] [CrossRef]
- Bovensmann, H.; Burrows, J.P.; Buchwitz, M.; Frerick, J.; Noël, S.; Rozanov, V.V.; Chance, K.V.; Goede, A.P.H. SCIAMACHY: Mission objectives and measurement modes. J. Atmos. Sci. 1999, 56, 127–150. [Google Scholar] [CrossRef] [Green Version]
© 2019 by the authors. Licensee MDPI, Basel, Switzerland. This article is an open access article distributed under the terms and conditions of the Creative Commons Attribution (CC BY) license (http://creativecommons.org/licenses/by/4.0/).