Abstract
Gravity waves (GWs) generated in the lower atmosphere can propagate upwards to ionospheric height. In this study, we investigated the correlation between ionospheric GWs detected by Global Navigation Satellite System (GNSS)-derived total electron content data and thunderstorm events recorded by a local lightning-detection network in the low-latitude region of Southern China during a four-year period, from 2014 to 2017. Ionospheric GWs were detected on both thunderstorm and non-thunderstorm days. Daytime ionospheric GW activity on high-thunderstorm days showed a similar convex-function-like diurnal variation to thunderstorm activity, which is different to the concave-function-like pattern on non-thunderstorm days. Daytime ionospheric GW activity on low-thunderstorm days showed an approximately linear rising trend and was of a larger magnitude than that of high-thunderstorm days, suggesting it may be mixed by non-thunderstorm origins. Night-time enhancement of ionospheric GW activity was observed on thunderstorm days but not on non-thunderstorm days. Furthermore, ionospheric GW activity on thunderstorm days showed a positive correlation to solar activity. These findings can effectively distinguish thunderstorm-related ionospheric GWs from those of non-thunderstorm origins and provide more comprehensive knowledge of thunderstorm–ionosphere coupling in low-latitude areas.
1. Introduction
Gravity waves (GWs) are a crucial part of the dynamics process of the atmosphere [1]. GWs influence the distribution of atmospheric winds and temperature by transferring energy and momentum between different atmospheric layers [2,3]. When they propagate upwards to ionospheric height and interact with ionospheric plasma, the plasma density is perturbed (electron density is also changed on the basis of the charge conservation law) and generates so-called ionospheric disturbances [4,5]. Here, we call the GW signals of ionospheric disturbances ionospheric GWs. Studies have shown that various origins, including solid earth events, such as earthquakes and tsunamis [6,7,8,9], and tropospheric weather events, such as typhoons, penetrative convections, and jet streams [10,11,12], can trigger GWs and propagate upwards to ionospheric height.
Thunderstorms, as a kind of commonly occurring tropospheric weather event, have attracted the focus of scientific communities associated with the generation and distribution of ionospheric GWs. Pierce and Coroniti [13] first associated GWs with thunderstorm–ionosphere coupling in the 1960s. In recent decades, with the development of ionospheric detection technologies, especially the high spatial and temporal resolution of the Global Navigation Satellite System’s (GNSS) total electron content (TEC) data, many thunderstorm-related ionospheric GWs have been reported. Thunderstorm-related ionospheric GWs were reported at different altitudes in the D [14,15,16] and F regions [17,18,19], and at different latitudes, including both middle-latitude [20,21] and low-latitude [22] areas.
Most reported studies on thunderstorm-related ionospheric GWs are based on single or several cases. In order to better understand the correlation between ionospheric GWs and thunderstorm events, a statistical study using large amounts of data is necessary. Lay et al. [23] performed three months of statistical research comparing ionospheric GWs observed by GNSS TEC with Next Generation Weather Radar thunderstorm measurements in the middle-latitude Great Plains of the United States. They indicated that the disturbed coverage and amplitude of ionospheric GWs scaled with thunderstorm activity, both high and low activities. In addition, Lay [24] employed a similar method to a low-latitude area in South America and concluded that thunderstorms can exert a noticeable effect on the coverage and magnitude of ionospheric GWs. Statistical studies with several months of data by Lay et al. [23] and Lay [24] showed a correlation between ionospheric GWs and thunderstorm events. However, more long-term data, not only on thunderstorm days (high thunderstorms and low thunderstorms) but also on non-thunderstorm days, should be analyzed to strengthen this correlation, especially in low-latitude areas, due to complex plasma dynamics. In addition, the study area in the low latitudes of the northern hemisphere was not involved.
In this study, we investigated the correlation between ionospheric GWs and thunderstorm events in the low latitudes of the northern hemisphere using four-year GNSS TEC data and thunderstorm data from Southern China. According to a local lightning-detection network, this area has tremendous thunderstorm events in spring and summer.
2. Data and Methods
2.1. Data
Thunderstorm and GNSS data from 2014 to 2017 were employed in the study. According to the solar-flux index, 2014 was a high activity year and 2017 was a low activity year (https://www.swpc.noaa.gov/). Thunderstorm data were detected by a local lightning-detection network that we developed and established in Southern China (magenta points in Figure 1a). The lightning-detection network can provide the location and magnitude of thunderstorm activity. The GNSS observation data with a 30 s sampling were collected from the public website of the Hong Kong Geodetic Survey Services (https://www.geodetic.gov.hk/; red points in Figure 1b). Here, multi-system GNSS data, including Global Positioning System (GPS) and GLObal NAvigation Satellite System (GLONASS), were employed to increase data coverage. BeiDou System (BDS) data have been available since 2016 and were not used in this study to maintain data-coverage consistency across all years [25,26]. Considering that the distance between adjacent stations was only about 8–15 km, only three stations, HKKT, HKNP, and HKOH, located in the north, west, and east of the network, were selected. The study area is located in the low latitudes of the northern hemisphere, from 106° to 122° East, and 14° to 30° North (red rectangle in Figure 1a), which was selected according to data coverage.
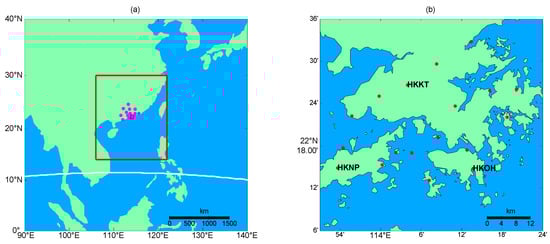
Figure 1.
(a) Locations of the lightning network (magenta points) and Global Navigation Satellite System (GNSS) network (black rectangle). The white line shows the magnetic equator. The red rectangle indicates the study area. (b) Large-scale map for locations of the GNSS network (red points). Three stations— HKKT, HKNP, and HKOH, were employed in this study.
2.2. Methods
The ionospheric TEC series was calculated by the geometry-free combination of dual-frequency GNSS carrier phases for each satellite–receiver pair [27]. The cut-off elevation angle was set as 20° for each satellite–receiver pair. A single-layer model in Schaer [28] with a height of 350 km was used to compute the ionospheric pierce point position. We employed the second-order center difference method to eliminate the background trend in the TEC series and extracted the ionospheric disturbance series [29].
The amplitude of a wave with period T is multiplied by 4sin4(πτ/T) after the difference process, where τ represents the difference step [30]. The amplitude ratio factor can serve as a band-pass filter. Setting τ = 5 min is suitable for the detection of ionospheric GWs, because the amplitude of a wave with a period scope 6.6–20 min is amplified (ratio factor is larger than 1). The unit of TEC and dTEC is TEC unit (TECU); 1 TECU = 1016 el/m2. Here, an amplitude threshold of 0.15 TECU was chosen for ionospheric GWs according to noise level (generally less than 0.1 TECU). Note that the 2τ time-period data at the beginning and end of each arc are missing in the difference process.
A method described by Lay et al. [23] was employed in the statistical analysis. The study area was gridded onto a 0.5° × 0.5° longitude–latitude grid, and the time interval was set to 30 min. Thunderstorm coverage and ionospheric GW coverage during each 30 min time period were recorded. We used the effective grid counts to represent the coverage. If a grid cell surpassed 3 lightning stroke counts, then that cell was effective [24]; if a grid cell surpassed the amplitude threshold of ionospheric GWs, then that cell was effective. Furthermore, the maximum amplitude of each effective grid cell for ionospheric GWs during each 30 min time period was also recorded, and the average maximum amplitudes of the effective grid cells during each 30 min time period were computed (Figure 2). In the following, we use “coverage” and “amplitude” to simply represent the recorded parameters.
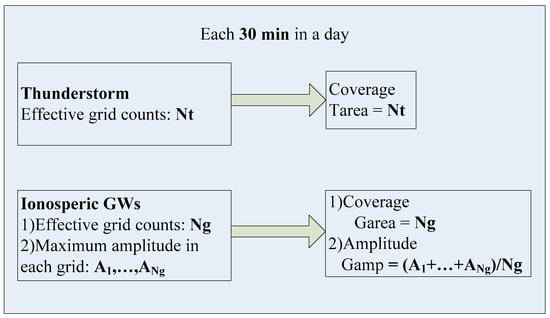
Figure 2.
Diagram for the computation of statistical parameters.
In the study area, the plasma bubble occurs frequently, especially at night, and could significantly change the amplitude and distribution coverage of ionospheric GWs [31]. We therefore eliminated days with a plasma bubble. In addition, days with high geomagnetic activity (kp > 4) were excluded.
3. Results
Figure 3 presents an example of thunderstorm stroke counts per hour recorded by the local lightning network and ionospheric dTEC series observed by the GNSS station, HKKT, in 2014 (other years had similar results). Days with a plasma bubble or high geomagnetic activity were not plotted. As shown in Figure 3, thunderstorm events mainly occurred from March to September, while ionospheric GWs were detected in all months. This means that there are frequently occurring ionospheric GWs triggered by non-thunderstorm origins. In the following analysis, days of each year were divided into high-thunderstorm (HS, daily maximum number of effective grid cells ≥20), low-thunderstorm (LS, daily maximum number of effective grid cells <20 and >0), and non-thunderstorm (NS, the number of effective grid cells is zero) days. Table 1 lists the effective number of HS, LS, and NS days in each year.
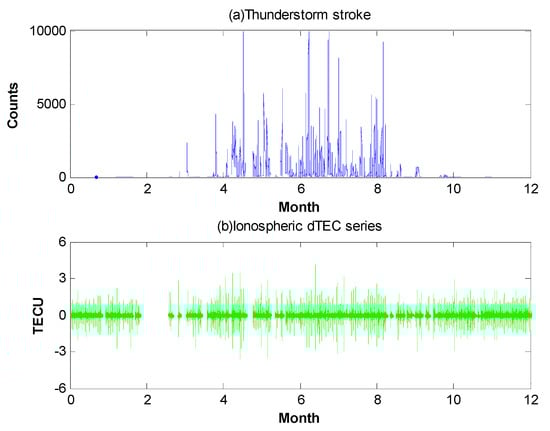
Figure 3.
(a) Thunderstorm stroke counts recorded by a local lightning network in 2014; (b) ionospheric dTEC series observed by the GNSS station, HKKT, in 2014.

Table 1.
Effective numbers of high-thunderstorm (HS), low-thunderstorm (LS), and non-thunderstorm (NS) days in each year.
We compared the diurnal averages of thunderstorm activity (coverage) on HS and LS days to the diurnal averages of ionospheric GW activity (amplitude and coverage) on HS, LS, and NS days for each year. Diurnally averaged results are shown in Figure 4. Thunderstorm activity and ionospheric GW activity in different circumstances were all plotted in one figure for quantitative comparison. The left vertical axis represents thunderstorm activity (blue line with points for HS and dark green line for LS); the right vertical axis indicates ionospheric GW activity (bold red, cyan, and magenta lines for HS, LS, and NS days, respectively) in each panel. The top two panels (Figure 4a,b) show the diurnally averaged thunderstorm coverage (Tarea) versus ionospheric GW amplitude (Gamp), and thunderstorm coverage versus ionospheric GW coverage (Garea), in 2014, respectively. The next two panels (Figure 4c,d) show the same plots in 2015. The next two panels (Figure 4e,f) show the same plots in 2016. The bottom two panels (Figure 4g,h) show the same plots in 2017. The average coverage of ionospheric GWs on all days during the first and last 30 min time periods was significantly smaller than that of adjacent time periods (Figure 4b,d,f,h). This is due to data missing for 20 min by the second-order center difference method.
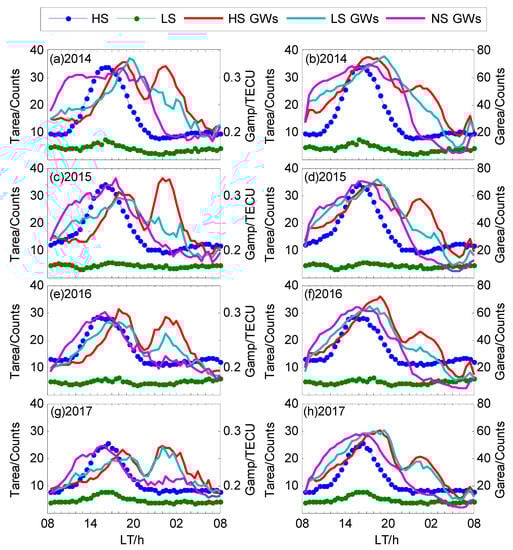
Figure 4.
Diurnal averages of thunderstorm activity and ionospheric gravity wave (GW) activity from 2014 to 2017. The line with points represents thunderstorm activity (blue for HS and dark green for LS). The bold line represents ionospheric GW activity (red for HS, cyan for LS, and magenta for NS). (a) Thunderstorm coverage versus ionospheric GW amplitude in 2014; (b) thunderstorm coverage versus ionospheric GW coverage in 2014; (c) thunderstorm coverage versus ionospheric GW amplitude in 2015; (d) thunderstorm coverage versus ionospheric GW coverage in 2015; (e) thunderstorm coverage versus ionospheric GW amplitude in 2016; (f) thunderstorm coverage versus ionospheric GW coverage in 2016; (g) thunderstorm coverage versus ionospheric GW amplitude in 2017; (h) thunderstorm coverage versus ionospheric GW coverage in 2017.
As shown in Figure 4, thunderstorm activity presented an obvious diurnal variation on HS days for each year. Thunderstorm coverage slowly increased at the beginning, began to accelerate at about 11:00 LT (local time), and peaked at around 15:00–17:00 LT. From there, it began to decline with an approximately symmetric pattern. The diurnal variation curve is like a convex function. Thunderstorm activity on LS days showed a similar diurnal pattern to that of HS days, although coverage was very low. It was apparent that ionospheric GW activity also presented a diurnal variation on all days for each year.
The amplitude of ionospheric GWs showed diurnal variation with two significant crests on HS days (four left panels in Figure 4). It presented a similar convex-function-like pattern to thunderstorm coverage in the rising phase at daytime. The first crest was at around 18:00–19:00 LT, which had an approximate 2–3 h delay compared to that of thunderstorm coverage. At about 21:00–22:00 LT, the ionospheric GW amplitude rose again and reached the second crest at around 00:00–01:00 LT. After the time of the crest, it began to decline, with a trough at dawn. Coverage of ionospheric GWs showed a similar diurnal variation pattern to that of amplitude on HS days (four right panels in Figure 4).
The diurnal variation pattern of ionospheric GW activity on NS days, including amplitude (four left panels in Figure 4) and coverage (four right panels in Figure 4), was different to that of thunderstorm activity. It increased quickly at the beginning and slowed down at about 11:00 LT, with an unobvious crest at around 16:00–18:00 LT, which was like a concave function. At night-time, ionospheric GW activity on NS days did not show night-time enhancement and kept declining until dawn. Due to a lack of night-time enhancement, the magnitude of ionospheric GW activity on NS days was significantly smaller than that of HS and LS days.
Ionospheric GW activity on LS days did not present a convex-function-like pattern at daytime but had a similar variation at night-time, compared to ionospheric GW activity on HS days. The daytime rising pattern on LS days took the approximate shape of a line, especially for coverage (four right panels in Figure 4). Amplitude in 2014 and 2015 was a mixture of concave and convex functions (Figure 4a,c). Generally, it seemed to be a mixed effect, by the convex-function-like pattern of HS days and the concave-function-like variation pattern of NS days. Interestingly, the quantitative values of the ionospheric GW activity could further support the existence of a mixed effect. As shown in Figure 4, the magnitude of ionospheric GW amplitude and coverage on NS days was larger than that of HS days at daytime. The magnitude of ionospheric GW amplitude and coverage on LS days was essentially between the magnitude of ionospheric GW activity on NS days and the magnitude of ionospheric GW on HS days. At night-time, the amplitude of ionospheric GWs on LS days had a similar enhancement to that of HS days, although the magnitude was smaller. Coverage on LS days in 2014 and 2015 did not have an observable crest, but the magnitude was enhanced during this time according to the variation trend.
To compare the annual variation of thunderstorm activity and ionospheric GW activity, we replotted Figure 4 and put each activity during the four years into one figure. The corresponding results are shown in Figure 5. Different colors in all panels distinguish the years. The top two panels (Figure 5a,b) show the diurnally averaged thunderstorm coverage on HS and LS days, respectively. Figure 5c presents the diurnally averaged amplitude of ionospheric GWs on HS days, and Figure 5d presents the diurnally averaged coverage of ionospheric GWs on HS days. The next two panels (Figure 5e,f) show the same plots for ionospheric GWs on LS days. The bottom two panels (Figure 5g,h) show the same plots for ionospheric GWs on NS days.
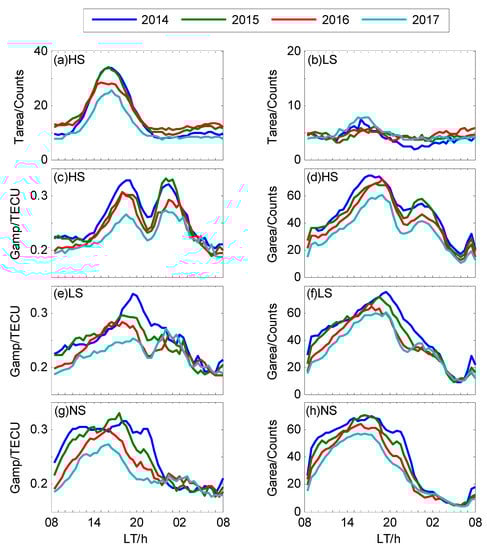
Figure 5.
Annual variation of diurnal averages of thunderstorm activity and ionospheric GW activity. (a) Thunderstorm coverage on HS days; (b) thunderstorm coverage on LS days; (c) ionospheric GW magnitude on HS days; (d) ionospheric GW coverage on HS days; (e) ionospheric GW magnitude on LS days; (f) ionospheric GW coverage on LS days; (g) ionospheric GW magnitude on NS days; (h) ionospheric GW coverage on NS days.
As seen in Figure 5, the magnitude of thunderstorm activity and ionospheric GW activity varied each year. The magnitude of thunderstorm activity on HS days, especially during the daytime, is positively related to solar activity (Figure 5a). This correlation is unapparent on LS days (Figure 5b), which can be attributed to daytime classification. The magnitude of ionospheric GW activity on HS days has a significant positive correlation with solar activity during nearly all times of the day (Figure 5c). For example, the magnitude of ionospheric GWs at night-time in 2016 (low solar activity) was lower than that of 2014 and 2015 (high solar activity), although the magnitude of thunderstorm activity reverses (Figure 5a). In addition, the magnitude of ionospheric GW activity on LS days had an approximately positive correlation to solar activity, although there was no apparent correlation to thunderstorm activity (Figure 5e,f). This solar activity correlation was also suitable for ionospheric GW activity on NS days (Figure 5g,h).
4. Discussion
Daytime ionospheric GW activity on HS days showed a similar convex-function-like diurnal variation pattern to thunderstorm activity, with a 2–3 h delay in crest time. Theoretical research shows that GWs generated in the lower atmosphere need one to several hours (depending on period and speed) to propagate upwards to an ionospheric height of 350 km [32]. As such, a 2–3 h delay between ionospheric GW activity and thunderstorm activity is reasonable. In addition, ionospheric GW activity on NS days showed a concave-function-like variation pattern, especially in the rising phase, compared to that of thunderstorm activity. The above results provide evidence that daytime ionospheric GW activity on HS days is triggered by thunderstorm activity.
Daytime ionospheric GW activity on LS days presents an approximately linear diurnal variation before the time of the crest, which is different to that of HS days. Furthermore, the magnitude of ionospheric GW activity (amplitude and coverage) on LS days is generally larger than that of HS days. The difference in background TEC is unlikely to cause abnormal phenomena when LS days have more significant ionospheric GW activity than HS days in the daytime. Both HS activity and LS activity occur in spring and summer (Figure 3a), so background TEC is not significantly different. In addition, normal results at night-time can support this explanation. Considering the magnitude and diurnal variation patterns of ionospheric GW activity on NS days, it is very likely that multiple origins, including thunderstorm activity and non-thunderstorm activity, trigger ionospheric GWs on LS days. Thunderstorm-related GWs are mixed with non-thunderstorm-related GWs, and the original variation pattern is changed.
The diurnal variation of daytime ionospheric GW activity on LS days in this study area is different to that of South America in the southern hemisphere, as reported by Lay [24]. According to Lay [24], the diurnal variation pattern on LS days is similar to that on HS days, and the magnitude of the former is always smaller than that of the latter. These distinct results may be attributed to the different study areas and employed data. Ionospheric GW activity may show differences based on longitudinal differences between the southern region of China and South America, even though both are in low latitudes. In addition, only 11 days were used by Lay to calculate the diurnal averages of thunderstorm activity on LS days [24], while over 50 days in each year were used in this study (Table 1). Non-thunderstorm events during the 11 LS days in Lay’s study [24] could have been unnoticeable, so the original variation pattern was preserved.
Night-time enhancement of ionospheric GW activity on both HS and LS days seems to be related to thunderstorm activity because it only occurs on thunderstorm days and is correlated with the magnitude of thunderstorm activity. The night-time enhancement of ionospheric GW activity on thunderstorm days was also reported in other areas, including low-latitude areas in South America [24] and the Great Plains in the United States, which is a middle-latitude area of the northern hemisphere [18]. These observed results are conducive to intensifying the relationship between night-time enhancement of ionospheric GW activity and thunderstorm activity. The mechanism for night-time enhancement is still unclear at present. One possible cause is thunderstorm-induced Perkins instability [33], a common factor in triggering medium-scale ionospheric disturbances at night. In addition, electric changes produced by lightning discharges could be a factor in the anomaly [34].
The variation of ionospheric GW activity on both HS and LS days showed a positive correlation to solar activity. This is in line with the fact that ionospheric TEC is high in a high solar activity year and vice versa, and the magnitude of ionospheric GWs is proportional to background TEC [5]. Furthermore, thunderstorm activity had a positive correlation with solar activity. Thus, it is the combined action of solar and thunderstorm activity that drives the variations in ionospheric GWs.
5. Conclusions
In this study, we investigated the amplitude and coverage of thunderstorm-related ionospheric GWs above the low latitude of the northern hemisphere using GNSS ionospheric TEC and lightning data observed in Southern China from the high solar activity year of 2014 to the low solar activity year of 2017. Compared to previous studies, the statistical analysis of long-term data in this study provided support for the correlation between thunderstorm events and ionospheric GWs. Furthermore, the observed results show that the diurnal variations of daytime ionospheric GW activity on LS days in this study area are different to those on HS days. It is very likely that thunderstorm-induced ionospheric GWs are mixed with other non-thunderstorm activity on LS days. Ionospheric GW activity on thunderstorm days shows a positive correlation to solar activity, which can be attributed to the combined action of solar and thunderstorm activity. These findings provide more comprehensive knowledge about thunderstorm–ionosphere coupling in low-latitude areas. In the future, more work is needed to discuss the night-time enhancement mechanism of thunderstorm-related ionospheric GWs and the mixed effect of ionospheric GWs on LS days in other study areas. In addition, more GNSS satellites, including BDS and Galileo, could be employed to further increase data coverage for more reliable results.
Author Contributions
L.T. led the writing of the manuscript and contributed to data analysis and research design. W.C. supervised this study, contributed to the research design, and served as the corresponding author. M.C. contributed to data processing. O.-P.L. contributed to manuscript editing.
Funding
This research was funded by National Natural Science Foundation of China (Grant number 41804021), Natural Science Foundation of Guangdong Province (Grant number 2017A030310242), National Key Research and Development Program of China (grant number No. 2016YFB0501803) and the Hong Kong RGC Joint Research Scheme (E-PolyU501/16).
Acknowledgments
The GNSS data used in this study are provided by the Geodetic Survey Section of Survey and Mapping Office in Hong Kong.
Conflicts of Interest
The authors declare no conflict of interest.
References
- Nappo, C.J. An Introduction to Atmospheric Gravity Waves; Academic Press: San Diego, CA, USA, 2002. [Google Scholar]
- Medeiros, A.F.; Taylor, M.J.; Takahashi, H.; Batista, P.P.; Gobbi, D. An investigation of gravity wave activity in the low-latitude upper mesosphere: Propagation direction and wind filtering. J. Geophys. Res. Atmos. 2003, 108. [Google Scholar] [CrossRef]
- Nakamura, T.; Aono, T.; Tsuda, T.; Admiranto, A.G.; Achmad, E. Mesospheric gravity waves over a tropical convective region observed by OH airglow imaging in Indonesia. Geophys. Res. Lett. 2003, 30. [Google Scholar] [CrossRef]
- Hines, C.O. Internal atmospheric gravity waves at ionospheric heights. Can. J. Phys. 1960, 38, 1441–1481. [Google Scholar] [CrossRef]
- Hooke, W.H. Ionospheric irregularities produced by internal atmospheric gravity waves. J. Atmos. Terr. Phys. 1968, 30, 795–823. [Google Scholar] [CrossRef]
- Rolland, L.M.; Lognonné, P.; Astafyeva, E.; Kherani, E.A.; Kobayashi, N.; Mann, M.; Munekane, H. The resonant response of the ionosphere imaged after the 2011 off the Pacific coast of Tohoku Earthquake. Earth Planets Space 2011, 63, 853–857. [Google Scholar] [CrossRef]
- Savastano, G.; Komjathy, A.; Verkhoglyadova, O.; Mazzoni, A.; Crespi, M.; Wei, Y.; Mannucci, A.J. Real-Time Detection of Tsunami Ionospheric Disturbances with a Stand-Alone GNSS Receiver: A Preliminary Feasibility Demonstration. Sci. Rep.-UK 2017, 7, 46607. [Google Scholar] [CrossRef]
- Rakoto, V.; Lognonné, P.; Roll, L.; Coïsson, P. Tsunami wave height estimation from GPS-derived ionospheric data. J. Geophys. Res. Space Phys. 2018, 123, 4329–4348. [Google Scholar] [CrossRef]
- Tang, L.; Li, Z.; Zhou, B. Large-area tsunami signatures in ionosphere observed by GPS TEC after the 2011 Tohoku earthquake. GPS Solut. 2018, 22, 93. [Google Scholar] [CrossRef]
- Chou, M.Y.; Lin, C.H.; Yue, J.; Tsai, H.F.; Sun, Y.Y.; Liu, J.Y.; Chen, C.H. Concentric traveling ionosphere disturbances triggered by Super Typhoon Meranti (2016). Geophys. Res. Lett. 2017, 44, 1219–1226. [Google Scholar] [CrossRef]
- Stull, R.B. Internal gravity waves generated by penetrative convection. J. Atmos. Sci. 1976, 33, 1279–1286. [Google Scholar] [CrossRef]
- Plougonven, R.; Zhang, F. Internal gravity waves from atmospheric jets and fronts. Rev. Geophys. 2014, 52, 33–76. [Google Scholar] [CrossRef]
- Pierce, A.D.; Coroniti, S.C. A mechanism for the generation of acoustic-gravity waves during thunderstorm formation. Nature 1966, 210, 1209. [Google Scholar] [CrossRef]
- Yue, J.; Vadas, S.L.; She, C.Y.; Nakamura, T.; Reising, S.C.; Liu, H.L.; Stamus, P.; Krueger, D.A.; Lyons, W.; Li, T. Concentric gravity waves in the mesosphere generated by deep convective plumes in the lower atmosphere near Fort Collins, Colorado. J. Geophys. Res. Atmos. 2009, 114. [Google Scholar] [CrossRef]
- Lay, E.H.; Shao, X.M. Multi-station probing of thunderstorm-generated D-layer fluctuations by using time-domain lightning waveforms. Geophys. Res. Lett. 2011, 38. [Google Scholar] [CrossRef]
- Chou, C.C.; Dai, J.; Kuo, C.L.; Huang, T.Y. Simultaneous observations of storm-generated sprite and gravity wave over Bangladesh. J. Geophys. Res. Space Phys. 2016, 121, 9222–9233. [Google Scholar] [CrossRef]
- Vadas, S.L.; Liu, H.L. Numerical modeling of the large-scale neutral and plasma responses to the body forces created by the dissipation of gravity waves from 6 h of deep convection in Brazil. J. Geophys. Res. Space Phys. 2013, 118, 2593–2617. [Google Scholar] [CrossRef]
- Lay, E.H.; Shao, X.M.; Carrano, C.S. Variation in total electron content above large thunderstorms. Geophys. Res. Lett. 2013, 40, 1945–1949. [Google Scholar] [CrossRef]
- Azeem, I.; Yue, J.; Hoffmann, L.; Miller, S.D.; Straka, W.C.; Crowley, G. Multisensor profiling of a concentric gravity wave event propagating from the troposphere to the ionosphere. Geophys. Res. Lett. 2015, 42, 7874–7880. [Google Scholar] [CrossRef]
- Nishioka, M.; Tsugawa, T.; Kubota, M.; Ishii, M. Concentric waves and short-period oscillations observed in the ionosphere after the 2013 Moore EF5 tornado. Geophys. Res. Lett. 2013, 40, 5581–5586. [Google Scholar] [CrossRef]
- Yue, J.; Hoffmann, L.; Joan Alexander, M. Simultaneous observations of convective gravity waves from a ground-based airglow imager and the AIRS satellite experiment. J. Geophys. Res. Atmos. 2013, 118, 3178–3191. [Google Scholar] [CrossRef]
- Kumar, S.; Chen, W.; Chen, M.; Liu, Z.; Singh, R.P. Thunderstorm-/lightning-induced ionospheric perturbation: An observation from equatorial and low-latitude stations around Hong Kong. J. Geophys. Res. Space Phys. 2017, 122, 9032–9044. [Google Scholar] [CrossRef]
- Lay, E.H.; Shao, X.M.; Kendrick, A.K.; Carrano, C.S. Ionospheric acoustic and gravity waves associated with midlatitude thunderstorms. J. Geophys. Res. Space Phys. 2015, 120, 6010–6020. [Google Scholar] [CrossRef]
- Lay, E.H. Ionospheric Irregularities and Acoustic/Gravity Wave Activity Above Low-Latitude Thunderstorms. Geophys. Res. Lett. 2018, 45, 90–97. [Google Scholar] [CrossRef]
- Padokhin, A.M.; Tereshin, N.A.; Yasyukevich, Y.V.; Andreeva, E.S.; Nazarenko, M.O.; Yasyukevich, A.S.; Kozlovtseva, E.A.; Kurbatov, G.A. Application of BDS-GEO for studying TEC variability in equatorial ionosphere on different time scales. Adv. Space Res. 2019, 63, 257–269. [Google Scholar] [CrossRef]
- Savastano, G.; Komjathy, A.; Shume, E.; Vergados, P.; Ravanelli, M.; Verkhoglyadova, O.; Meng, X.; Crespi, M. Advantages of Geostationary Satellites for Ionospheric Anomaly Studies: Ionospheric Plasma Depletion Following a Rocket Launch. Remote Sens. 2019, 11, 1734. [Google Scholar] [CrossRef]
- Zhang, X.; Tang, L. Detection of ionospheric disturbances driven by the 2014 Chile tsunami using GPS total electron content in New Zealand. J. Geophys. Res. Space Phys. 2015, 120, 7918–7925. [Google Scholar] [CrossRef]
- Schaer, S. Mapping and Predicting the Earth’s Ionosphere Using the Global Positioning System; Geod.-Geophys. Arb. Schweiz: Zurich, Switzerland, 1999. [Google Scholar]
- Tang, L.; Zhang, X.; Li, Z. Observation of ionospheric disturbances induced by the 2011 Tohoku tsunami using far-field GPS data in Hawaii. Earth Planets Space 2015, 67, 88. [Google Scholar] [CrossRef]
- Zhang, X.; Tang, L. Traveling ionospheric disturbances triggered by the 2009 North Korean underground nuclear explosion. Ann. Geophys.-Ger. 2015, 33, 137–142. [Google Scholar] [CrossRef][Green Version]
- Ji, S.; Chen, W.; Wang, Z.; Xu, Y.; Weng, D.; Wan, J.; Fan, Y.; Huang, B.; Fan, S.; Sun, G. A study of occurrence characteristics of plasma bubbles over Hong Kong area. Adv. Space Res. 2013, 52, 1949–1958. [Google Scholar] [CrossRef]
- Occhipinti, G.; Rolland, L.; Lognonné, P.; Watada, S. From Sumatra 2004 to Tohoku-Oki 2011: The systematic GPS detection of the ionospheric signature induced by tsunamigenic earthquakes. J. Geophys. Res. Space Phys. 2013, 118, 3626–3636. [Google Scholar] [CrossRef]
- Perkins, F. Spread F and ionospheric currents. J. Geophys. Res. 1973, 78, 218–226. [Google Scholar] [CrossRef]
- Shao, X.M.; Lay, E.H.; Jacobson, A.R. Reduction of electron density in the night-time lower ionosphere in response to a thunderstorm. Nat. Geosci. 2013, 6, 29–33. [Google Scholar] [CrossRef]


© 2019 by the authors. Licensee MDPI, Basel, Switzerland. This article is an open access article distributed under the terms and conditions of the Creative Commons Attribution (CC BY) license (http://creativecommons.org/licenses/by/4.0/).