Article

New Global View of Above-Cloud Absorbing Aerosol Distribution Based on CALIPSO Measurements

1
Key Laboratory of Atmospheric Optics, Anhui Institute of Optics and Fine Mechanics, Chinese Academy of Sciences, Hefei 230031, China
2
Science Island Branch of Graduate School, University of Science and Technology of China, Hefei 230031, China
3
School of Environment and Energy Engineering, Anhui Jianzhu University, Hefei 230031, China
4
School of Environment Science and Optoelectronic Technology, University of Science and Technology of China, Hefei 230031, China
*
Author to whom correspondence should be addressed.
Remote Sens. 2019, 11(20), 2396; https://doi.org/10.3390/rs11202396
Submission received: 3 September 2019 / Revised: 10 October 2019 / Accepted: 12 October 2019 / Published: 16 October 2019

Abstract

:
Above-low-level-cloud aerosols (ACAs) have gradually gained more interest in recent years; however, the combined aerosol–cloud radiation effects are not well understood. The uncertainty about the radiative effects of aerosols above cloud mainly stems from the lack of comprehensive and accurate retrieval of aerosols and clouds for ACA scenes. In this study, an improved ACA identification and retrieval methodology was developed to provide a new global view of the ACA distribution by combining three-channel CALIOP (The Cloud–Aerosol Lidar with Orthogonal Polarization) observations. The new method can reliably identify and retrieve both thin and dense ACA layers, providing consistent results between the day- and night-time retrieval of ACAs. Then, new four-year (2007 to 2010) global ACA datasets were built, and new seasonal mean views of global ACA occurrence, optical depth, and geometrical thickness were presented and analyzed. Further discussion on the relative position of ACAs to low clouds showed that the mean distance between the ACA layer and the low cloud deck over the tropical Atlantic region is less than 0.2 km. This indicates that the ACAs over this region are more likely to be mixed with low-level clouds, thereby possibly influencing the cloud microphysics over this region, contrary to findings reported from previous studies. The results not only help us better understand global aerosol transportation and aerosol–cloud interactions but also provide useful information for model evaluation and improvements.

Graphical Abstract

1. Introduction

The long-range transport of aerosols plays an important role in several regions of the world, having a potential impact on aerosol–cloud interactions, atmospheric chemistry, and air quality [1,2,3,4,5,6,7,8]. In particular, aerosols often overlay lower level clouds [9], for example, biomass burning aerosols and wind-blown dust overlay low-level cloud deck over the Atlantic. The above-low-level cloud aerosols (ACAs) occupy about 25% of the mean aerosol optical depth (fine mode) at a global scale [9], and this fraction could be much higher regionally and seasonally [10]. Current models experience significant inter-model discrepancies in aerosol forcing assessments, especially over the aerosol–cloud overlap regions [11], that result from inter-model differences in both aerosol and cloud properties [11,12]. A recent evaluation showed that most models cannot reproduce the observed large aerosol load episodes [13]. Therefore, improved observations are needed to better understand ACA–cloud interactions and to constrain the aerosol–cloud radiative processes in models.
The ACA has gained increasing attention in recent years because of its important, but not well-understood, radiative and microphysical effects on clouds [14,15,16,17,18,19]. Different from clear-sky aerosols, which are usually associated with a negative (cooling) direct radiative effect [15,19,20,21,22,23], the absorption effect of the ACA is significantly amplified due to the strong reflection light of low clouds, resulting in a less negative or even positive (warming) direct radiative effect. By warming the free troposphere and cooling the surface below, the ACA can increase the low cloud cover by enhancing atmospheric stability [24]. However, if the ACA mixes directly with the cloud layer, warming of the ACA could reduce the relative humidity, dissipating the cloud [24]. Therefore, the radiative and microphysical effects of ACAs on clouds depend on both their loadings and their positions relative to the clouds [25].
Despite its importance, quantifying the effect of the ACA on the clouds from satellite observations is still challenging. For passive remote sensing, the ACA has usually been neglected, and only clear-sky aerosol concentrations can be derived from passive satellites [26,27]. This is because passive satellites employ the reflection of natural sunlight to retrieve aerosol and cloud properties separately. The neglect of the ACA in passive remote sensing can result in uncertainties in the retrieval of cloud micro- and macro-properties, such as the liquid water path, cloud optical thickness, and effective radius of cloud droplets [26,27]. Until recently, based on different absorption effects of the ACA in the visible and near-infrared channels, a “color ratio” (CR) method was used to retrieve the ACA optical depth (ACAOD) and aerosol-corrected cloud optical depth (COD) [26] and this was further improved to a multi-channel method to simultaneously retrieve ACAOD, COD, and cloud effective radius data [27]. The CR between a pair of wavelengths is a function of both the aerosol and cloud optical thicknesses, and the measured reflectance can be related to pairs of aerosol and cloud optical thicknesses. The results indicate that the mean liquid cloud optical thickness can be increased by roughly 6%, and the mean liquid effective radius can be increased by roughly 2.6% after correcting for the effect of the ACA [22,28,29,30,31,32]. An inter-satellite comparison of the ACAOD retrieved from NASA’s A-train sensors revealed a good level of agreement between the passive sensors over homogeneous cloud fields [33]. However, passive satellites can only provide daytime ACAOD and are unable to determine the spatial position of aerosols with respect to the clouds.
Other than passive sensors, the active lidar Cloud–Aerosol Lidar with Orthogonal Polarization (CALIOP) onboard the Cloud–Aerosol Lidar and Infrared Pathfinder Satellite Observations (CALIPSO) can provide valuable vertically resolved information about aerosols and clouds. CALIPSO Level-2 data have already been employed in studies of ACA climate effects [19,22,23,34,35,36]. It was shown that the vertical structure of ACA and clouds was critical in determining the aerosol–cloud radiative forcing. However, inter-satellite comparisons of ACAOD [33,37,38] showed that the CALIPSO-derived ACAOD data was consistently lower than those derived from other satellite sensors in the A-Train, by a factor of four to six, as compared with passive retrieval. The main reason for this is that the current CALIPSO Level-2 aerosol retrieval algorithm employs the 532 nm channel, which cannot detect the true aerosol layer base because of the strong attenuation by the ACA in this channel [33,38]. Based on the CALIPSO Level-2 product, most of the ACA resides above the cloud deck at a distance of about 1 km over the tropical Atlantic region where both the ACA and low cloud frequently occur, indicating that weak cloud microphysical effects occur due to the aerosols not mixing with the cloud [24]. However, this could be misleading because the detected ACA layer base in the CALIPSO Level-2 product has been suggested to be higher than the real position [33,38]. Some other issues also limit the use of CALIPSO Level-2 data in ACA studies, such as the poor consistency between day- and night-time retrieval due to the poor signal-to-noise-ratio (SNR) performance of CALIPSO daytime observations.
This paper aims to provide a new global view of the ACA distribution based on an improved ACA detection method by combining the CALIPSO 532 and 1064 nm channels. Furthermore, efforts to address the low SNR issue in CALIPSO daytime observations were made to minimize the difference between day- and night-time retrieval. The data sources used in this study are introduced in Section 2. The new ACA identification and retrieval method is detailed in Section 3. Section 4 presents the results and discussions, and the conclusions are summarized in Section 5.

2. Data

CALIPSO, CloudSat and operational meteorology datasets were used to perform the study. CloudSat has not been able to operate at night-time and has operated in daylight-only mode since a spacecraft battery anomaly occurred in 2011. Therefore, the 2007–2010 observations were employed in this study to build both day- and night-time ACA datasets.
The CALIPSO Level-1B Version 4 product provides 532 nm total attenuated backscatter ( β 532 ), a perpendicular polarization component ( β 532 p ), and 1064 nm total attenuated backscatter ( β 1064 ) [39], with a 30 m vertical resolution below 8.2 km and a 1/3 km resolution in the horizontal direction along the ground track. The photomultiplier tube exhibited a nonideal recovery at 532 nm after encountering a strong backscattering objective, which was corrected following Li et al. [40]. The CALIPSO Level-2 Vertical Feature Mask (VFM) and Aerosol Profile Products (APro) files were used for comparison in this study.
The cloud type, cloud top height, and cloud bottom height were provided by the 2B-CLDCLASS-Lidar product [41]. The 2B-CLDCLASS-Lidar product used combines the CloudSat Cloud Profiling Radar (CPR), which is a 94 GHz microwave radar, and CALIPSO lidar measurements and thus can provide more accurate and complete cloud mask information than radar-only or lidar-only measurements [42].
The meteorological reanalysis data MERRA2 (The Modern Era Retrospective-analysis for Research and Application, Version 2 [43]) assimilated the meteorological data using a modern satellite database, which was released by the Global Modelling and Assimilation Systems of Goddard Space Flight Centre of NASA. It was used to provide temperature and pressure profiles for molecular backscattering estimation in this study.

3. Methodology

Previous studies have shown that the CALIPSO operational aerosol product tends to miss the bottom of dense ACA layers and underestimates the 532 nm aerosol optical depth because of the relatively strong aerosol attenuation in the 532 nm channel [33,37,44]. In contrast, both the aerosol attenuation and molecular backscattering in the 1064 nm channel are smaller than those in the 532 nm channel. Therefore, CALIPSO 532 and 1064 nm channel lidar observations were combined to develop an ACA retrieval methodology in this study, as detailed below. A flow chart of the methodology is shown in Figure 1.
Firstly, daytime CALIPSO observations experience lower SNRs than night-time observations, resulting in a strong apparent day- and night-time difference in the ACA global distribution (refer to Figure 3 in Alfaro-Contreras et al. [45]). To overcome the poor SNR issue in daytime CALIOP signals, different smoothing scales were selected for day- and night-time observations to provide consistent retrieval. For the β′532 and β′1064 night-time observations, 20 km horizontal averaging was adopted. For the β′532 and β′1064 daytime observations, multiscale averaging in different signal-strength bins was selected according to the night-time noise level. As shown in Figure 2, daytime noise was calculated with horizontal averaging of 20, 40, 60, 80, and 100 km and compared to the 20 km night-time results. According to Figure 2, β′532 daytime signals of higher than 2.3 × 10⁻² km−1sr−1, between 2.3 × 10⁻² and 2.8 × 10³ km−1sr−1, and lower than 2.8 × 10³ km−1sr−1 were exhibited at 20, 40, and 60 km, respectively. The maximum averaging scale was selected to be 60 km, after which the SNR performance improved a little. To avoid involving cloud signals in the moving-smoothed aerosol signals, only non-cloud data were smoothed using the cloud mask from the CloudSat 2B-CLDCLASS-Lidar product.
Secondly, after multiscale smoothing, ACA profiles were screened out using the CloudSat 2B-CLDCLASS-Lidar product and the estimated two-way transmittance at 1064 nm. Low cloud was defined as a cloud top lower than 3 km above ground level (AGL). Only single-layer low cloud or multi-layer thin cirrus cloud above the low cloud cases were considered in this study. Low-level cloud sample quantity is presented for each 2.5° × 2.5° grid box and averaged for winter (DJF, i.e., December, January, and February), spring (MAM, i.e., March, April, and May), summer (JJA, i.e., June, July, and August), and autumn (SON, i.e., September, October and November) in Figure 3. For each low cloud profile, the two-way transmittance at 1064 nm within 6 km above the cloud top was estimated by ignoring the molecular backscattering, as
x = e 2 ζ = 1 2 S β 1064 dr
Here, x is the two-way transmittance, and β   dr is the integrated attenuated backscatter at 1064 nm within 6 km above the cloud top, and S is the lidar ratio at 1064 nm. For cirrus cloud, S was chosen to be 19 sr. For aerosol, the S at 1064 nm has a smaller range than that in the 532 nm channel [46] and was assumed to be 40 sr in this step. By considering the noise, e 2 0.015   = 0.97 was chosen as the threshold, and values smaller than that were identified as possible ACA cases.
Thirdly, following the screening-out of possible ACA cases, the first-guess ACA extinction at 1064 nm was retrieved with the forward integration scheme [47] to build the ACA mask. In this step, the 1064 nm S was chosen to be 40 sr. The first-guess ACA mask was set to unity when the first-estimate ACA extinctions were larger than four times the measured noise, indicating the possible presence of aerosols. Then, the first-guess ACA top and bottom were identified as the highest and lowest points above the cloud top where the ACA mask equals 1.
Finally, using the first-guess ACA top and bottom from the last step, the ACA extinctions from the 532 nm channel were retrieved, with the lidar ratio determined according to the aerosol type classification, identical to the method used by Omar et al. [46]. The ACA mask was thus further refined according to the 532 nm extinctions using a threshold of four times of the measured noise.
Figure 4 presents comparisons of an ACA case derived from the new method and the CALIPSO level-2 V4 aerosol and cloud product. This is an outflowed smoke case immediately above the top of low marine clouds, as can be seen from the smoothed β 532 and data in Figure 4b and Figure 4c, respectively. It should be noted that the same case was demonstrated in Jethva et al. [33]. The retrieval from the new method (Figure 4e) was close to that from passive methods and the CALIOSP “DR” and “CR” methods (refer to Figure 2 in Jethva et al. [33]). In contrast, the ACAOD from the CALIPSO Level-2 product was much smaller than that from the new method, with a strong underestimation by a factor of up to about 2. This is because the standard CALIOP Level-2 aerosol and cloud products use the 532 nm signal to detect respective layers, which, in the presence of thick smoke layers, can be incorrectly assigned due to strong attenuation at 532 nm. Figure 4h shows that only the upper portion of the layer with dense aerosols was detected, while most of the lower portion of the ACA was missed. We tested the projection of a new extinction (Figure 4f) to the CALIOP Level-2 aerosol mask in Figure 4h, and this produced a similar ACAOD to L2. Benefitting from the aid of the 1064 nm extinction coefficient, the new method was shown to provide a complete aerosol mask. Therefore, the new method can provide more accurate ACA detection and retrieval results than the CALIPSO Level-2 product.

4. Results

The new methodology was applied to the 2007–2010 observations to build a new global ACA dataset. Statistical results are also presented for each 2.5° × 2.5° grid box and averaged for DJF, MAM, JJA, and SON. Section 4.1 presents a comparison of day- and night-time cloudy-sky ACA occurrences (ACAOC) and ACAOD, and Section 4.2 analyses the global distribution of the seasonal-mean ACAOC and ACAOD with different aerosol types. The ACAOC is defined as the number of ACA profiles divided by the number of low cloud profiles in each 2.5° grid box.

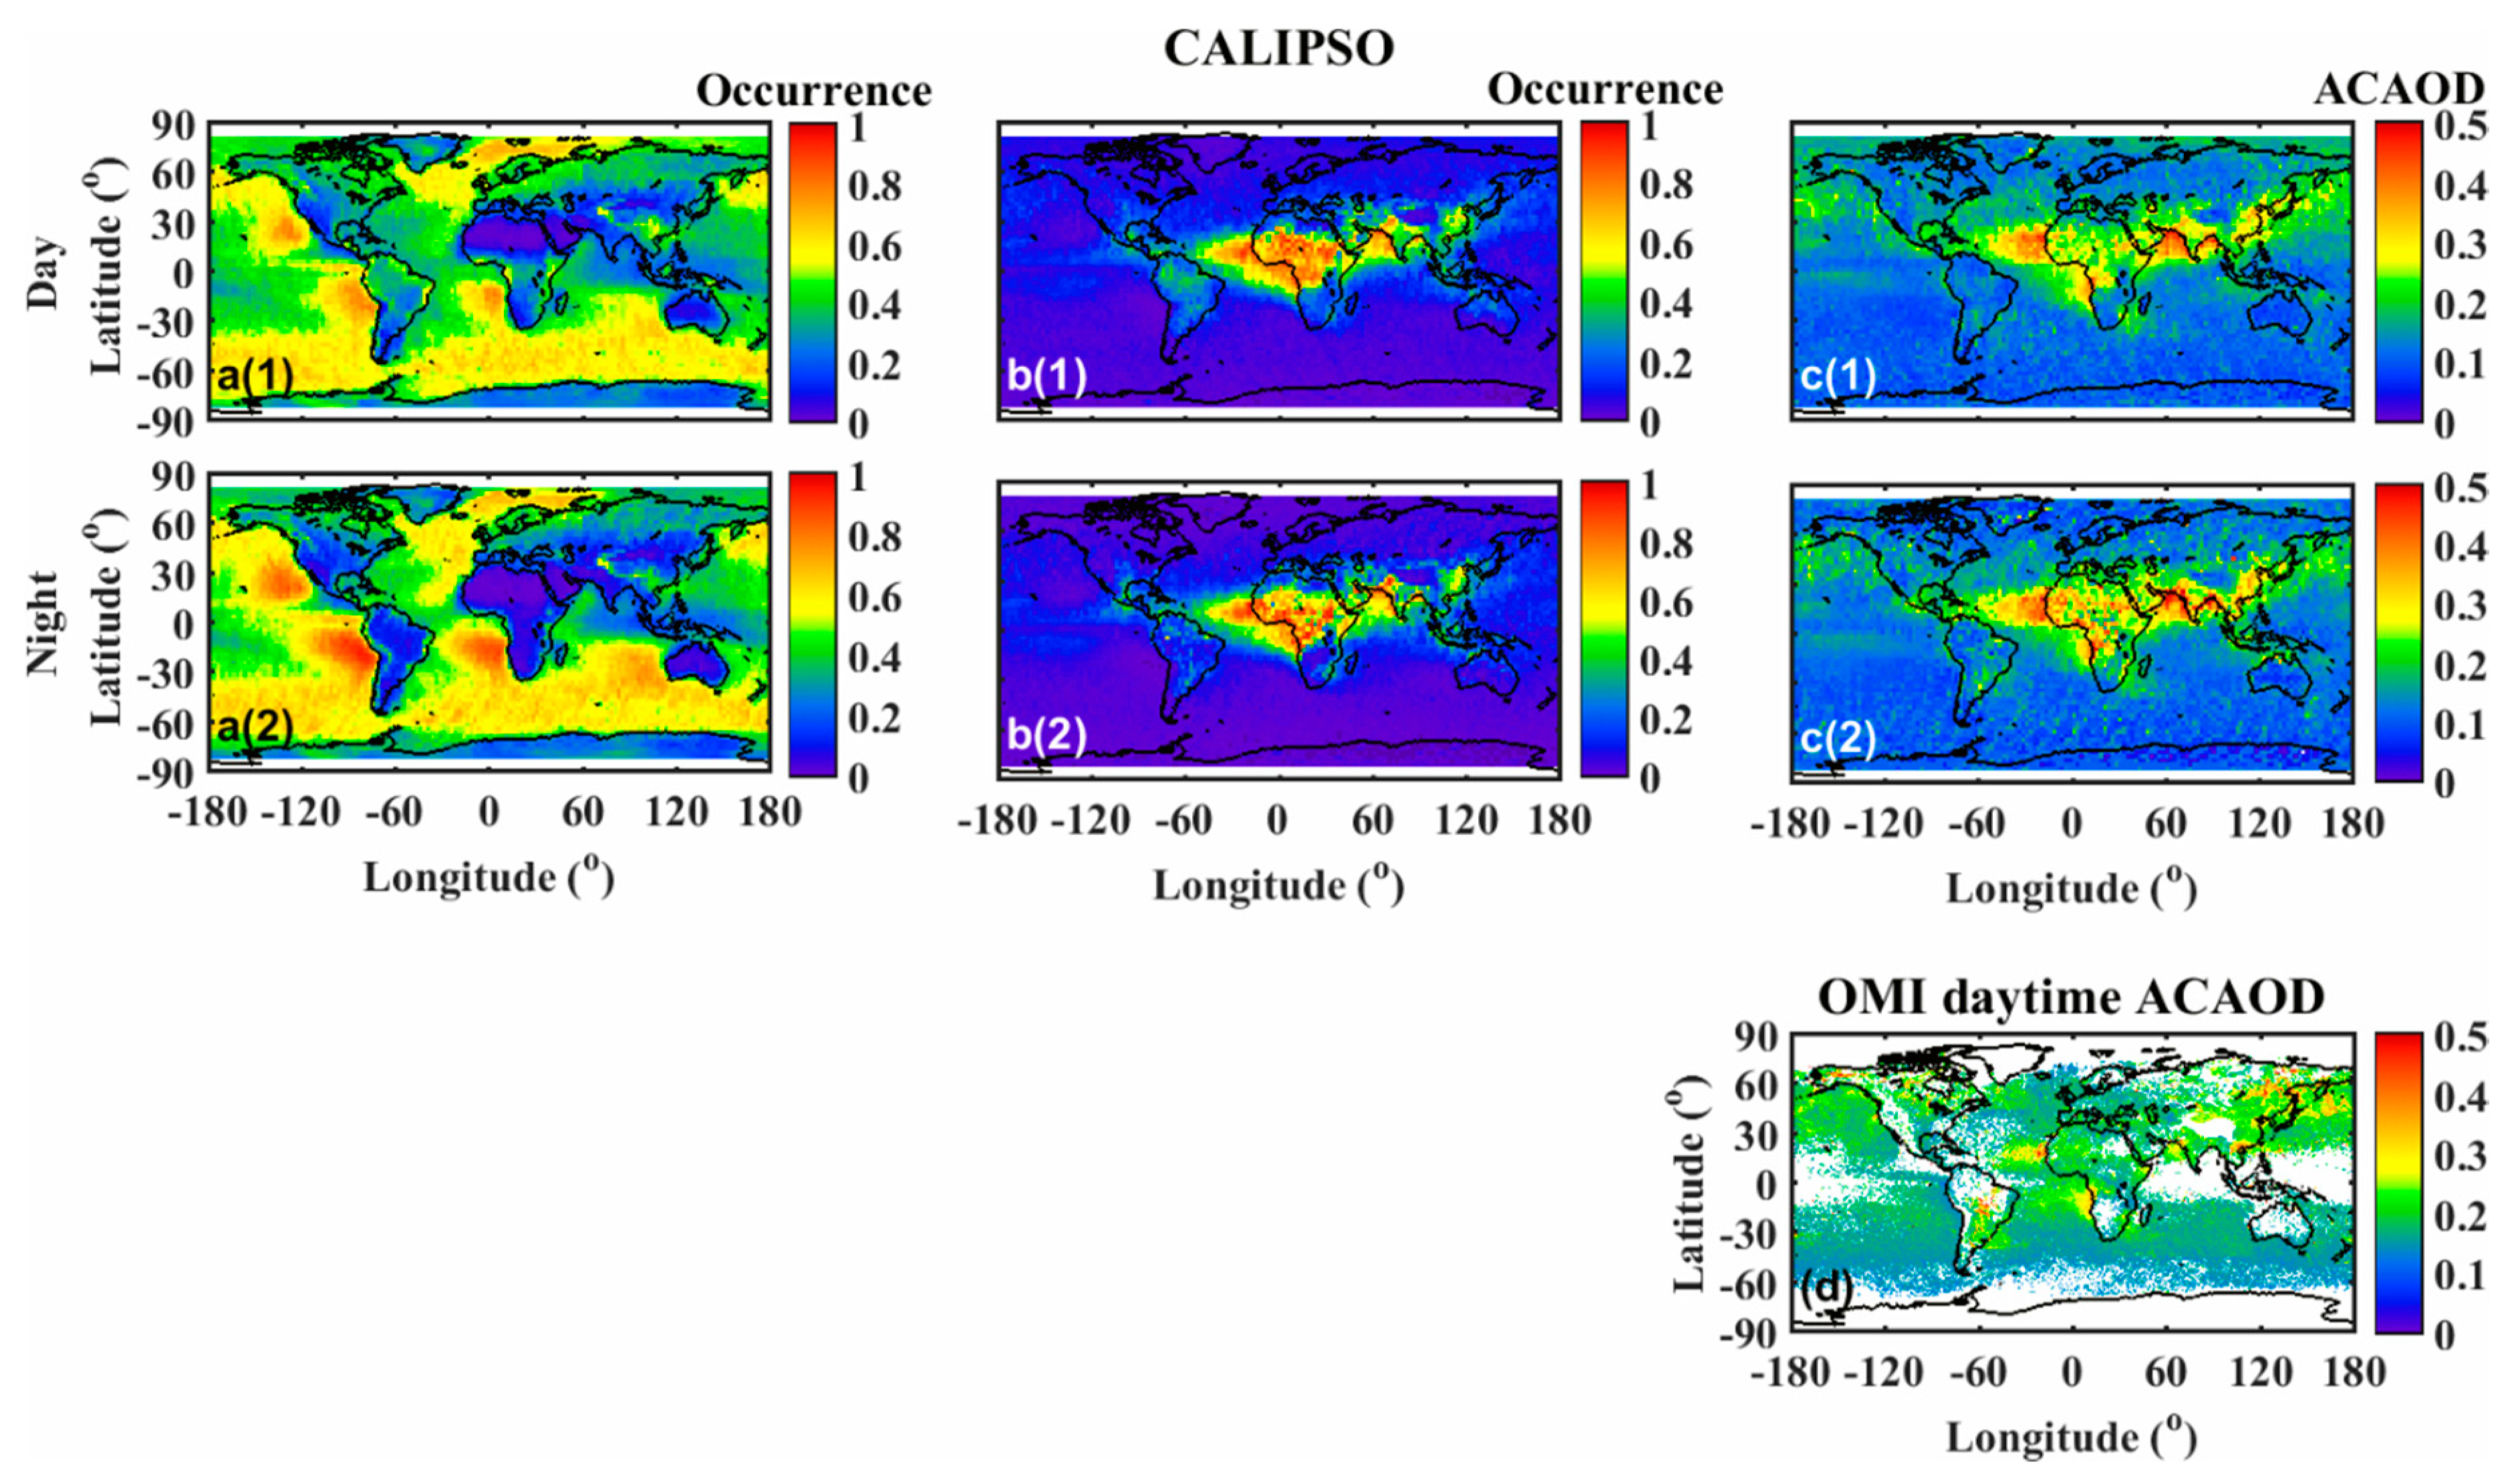
4.1. Day- and Night-Time Comparison of the New ACA Dataset

Figure 5 presents a comparison between night- and day-time global annual mean distributions of low-level cloud fractions (left column), ACAOC (middle column), and ACAOD (right column) derived from the new method using new four-year global ACA datasets. Table 1 summarizes the night- and day-time statistics of the annual mean ACAOC and ACAOD in different seasons globally and over the dust region (5–30° N, 60–16° W), smoke region (22°S–5° N, 18° W–15° E), and Eastern Asia (19–40° N, 100–140° W), respectively. These places have also been documented in previous studies [28,48,49,50,51].
As shown in Figure 5 and Table 1, the ACAOC and ACAOD show very similar patterns and values between day- and night-time retrieval. The global mean day- and night-time ACAOC are 0.125 and 0.108 respectively, and the global mean ACAOD values are 0.146 and 0.143. The correlation coefficient between day- and night-time is 0.938 for ACAOC and 0.796 for ACAOD. This shows that the new method developed in this study can produce reasonable day- and night- time results, better than the prior results derived from the CALIPSO level-2 product (refer to Figure 3 in Alfaro-Contreras et al. [45]). The night-time results from the CALIPSO level-2 product are quite similar to the results produced in this study. However, in the day-time, the CALIPSO level-2 products missed lots of weak aerosol layers due to their poor SNRs and thus gave quite different global distributions of ACAOC and ACAOD from those of night-time CALIPSO level-2 product and our method. The new method described in this study can detect more ACA cases over both source regions and long-range transport regions. Furthermore, the ACAOD values derived by the new method are larger than those from the CALIPSO Level-2 product. The CALIPSO Level-2 product retrieves ACAOD values that are too low over the tropical Atlantic region, a region where other passive methods suggest that high above-cloud aerosol loading could exist (i.e., refer to Figure 2 in Devasthale et al. [52]).
A preliminary comparison between our ACA dataset and passive satellite product was also done. Figure 5d shows the global distribution of annual-mean daytime 500 nm ACAOD derived from OMACA product version 3, which retrieves ACAOD from OMI’s two near-UV observations (354 and 388 nm) [17]. The data processing of Figure 5d follows the same way as Figure 8 in Jethva et al. [10], except that only 2007–2010 data were used in this paper. Comparing to the daytime ACAOD result of this paper (Figure 5c(1)), it shows that both products have quite similar pattern of global distribution to each other, while with regional differences in values. Our ACA dataset retrieves larger ACAOD than OMACA product over some major aerosol source regions, such the main dust band region including Sahara and Middle-Eastern dust regions and related long-range transport regions (tropic Atlantic, Arabian Sea, and Southern Asia), central Africa wildfire region and eastern Asia region except southernmost part of China. In contrast, OMACA product retrieves larger ACAOD than our ACA dataset over some weak aerosol source regions, such as Siberia, Alaska and Southern Oceans. Further detailed evaluation of the ACA dataset developed in this paper with passive satellite products and its possible implements in improving passive ACA and cloud retrievals will be our study interest in the near future.

4.2. Global Distribution of the Seasonal Mean ACA Properties

Figure 6 and Figure 7 illustrate the global distribution of the seasonal mean ACAOC and ACAOD data for all aerosol types (left column), dust aerosols (pure and pollute dust, middle column), and smoke and polluted continental aerosols (right column). Smoke and polluted continental aerosols were analyzed together in these figures, because these two types of aerosol have similar optical properties and are quite difficult to discriminate each other for the ACA case [46]. Furthermore, the existing classification algorithm is not suitable for the detection of above-cloud marine aerosols. As can be seen in those figures, above-cloud marine aerosol occurs over the western tropical Pacific region but is misclassified as smoke or polluted continental aerosols. The global mean ACAOC in each season was found to be 13% (DJF), 20% (MAM), 18% (JJA), and 15% (SON), and the global mean ACAOD was 0.12 (DJF), 0.14 (MAM), 0.15 (JJA), and 0.14 (SON), respectively.
As shown in Figure 6 and Figure 7, ACA frequently occurs near the source regions, such as over the Sahara and Middle-Eastern dust regions (main dust band region), the Africa smoke region, and the Eastern Asia region. Those aerosols are mobilized far from the sources and travel along transoceanic pathways, such as dust transport over the tropical Atlantic, region and smoke transport over the southeast Atlantic region, resulting high ACAOc values there. For convenience, the ACA and its long-distance transport are discussed with regard to its main source as in the following text.
(1)
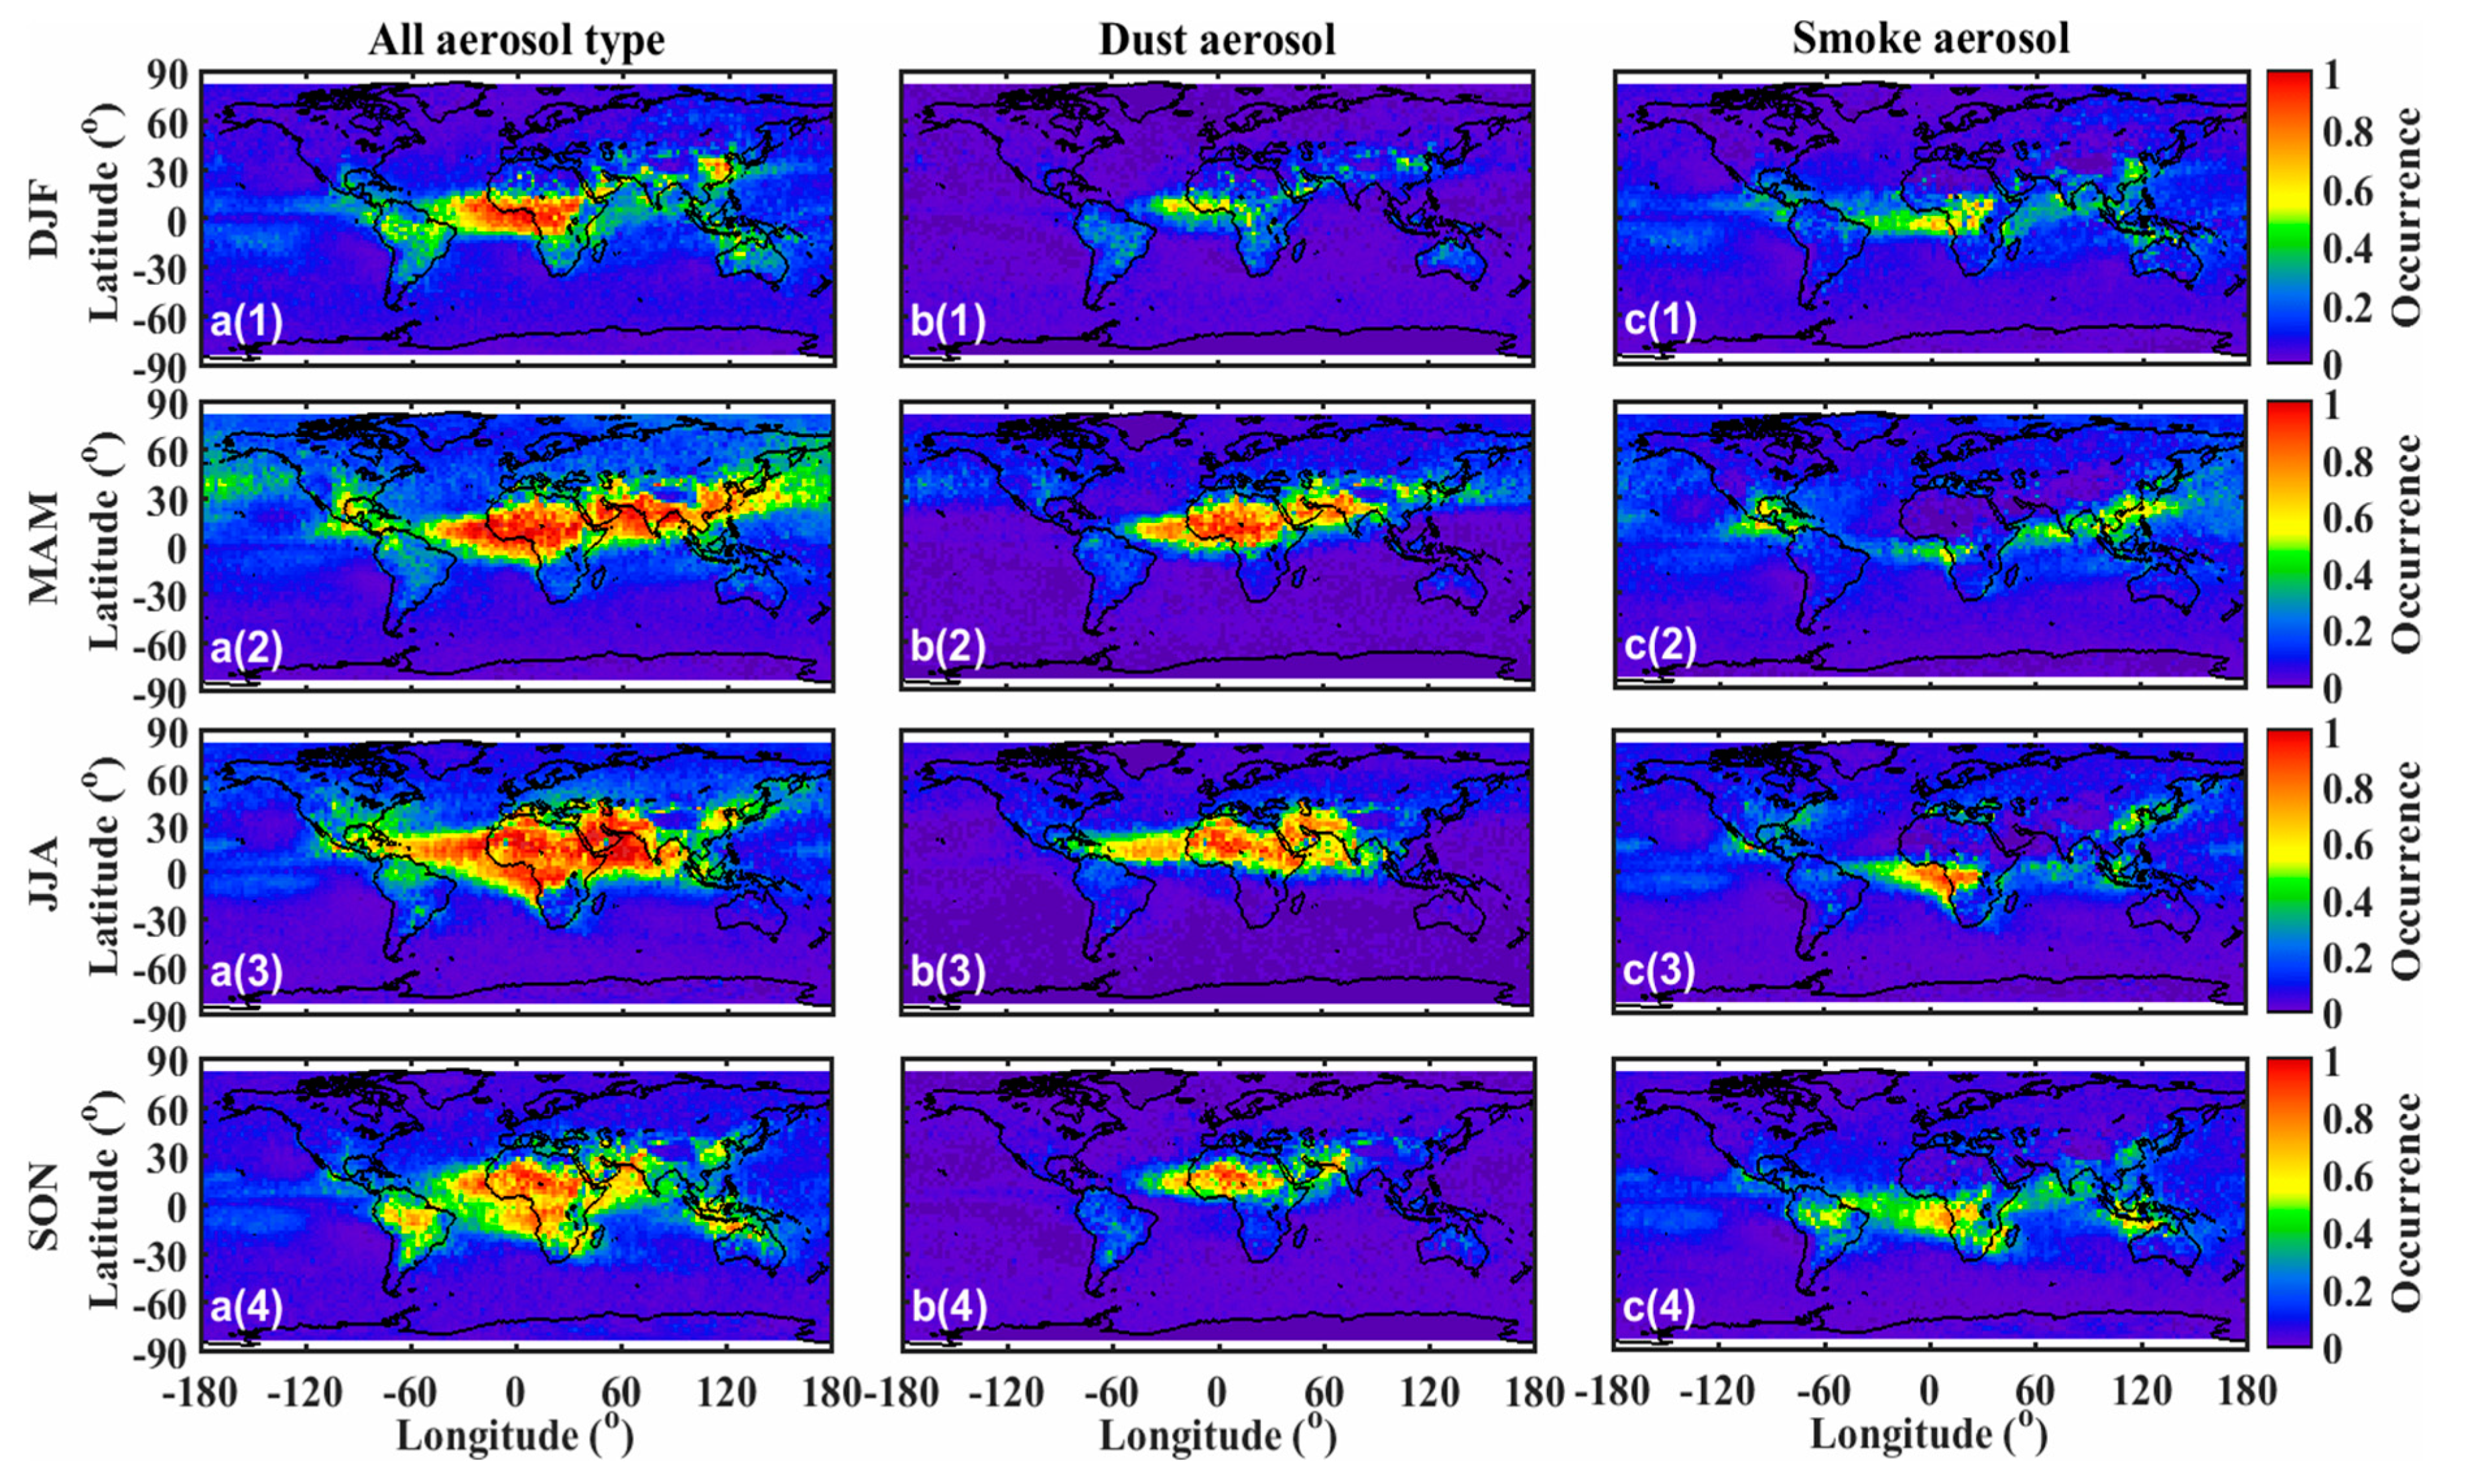
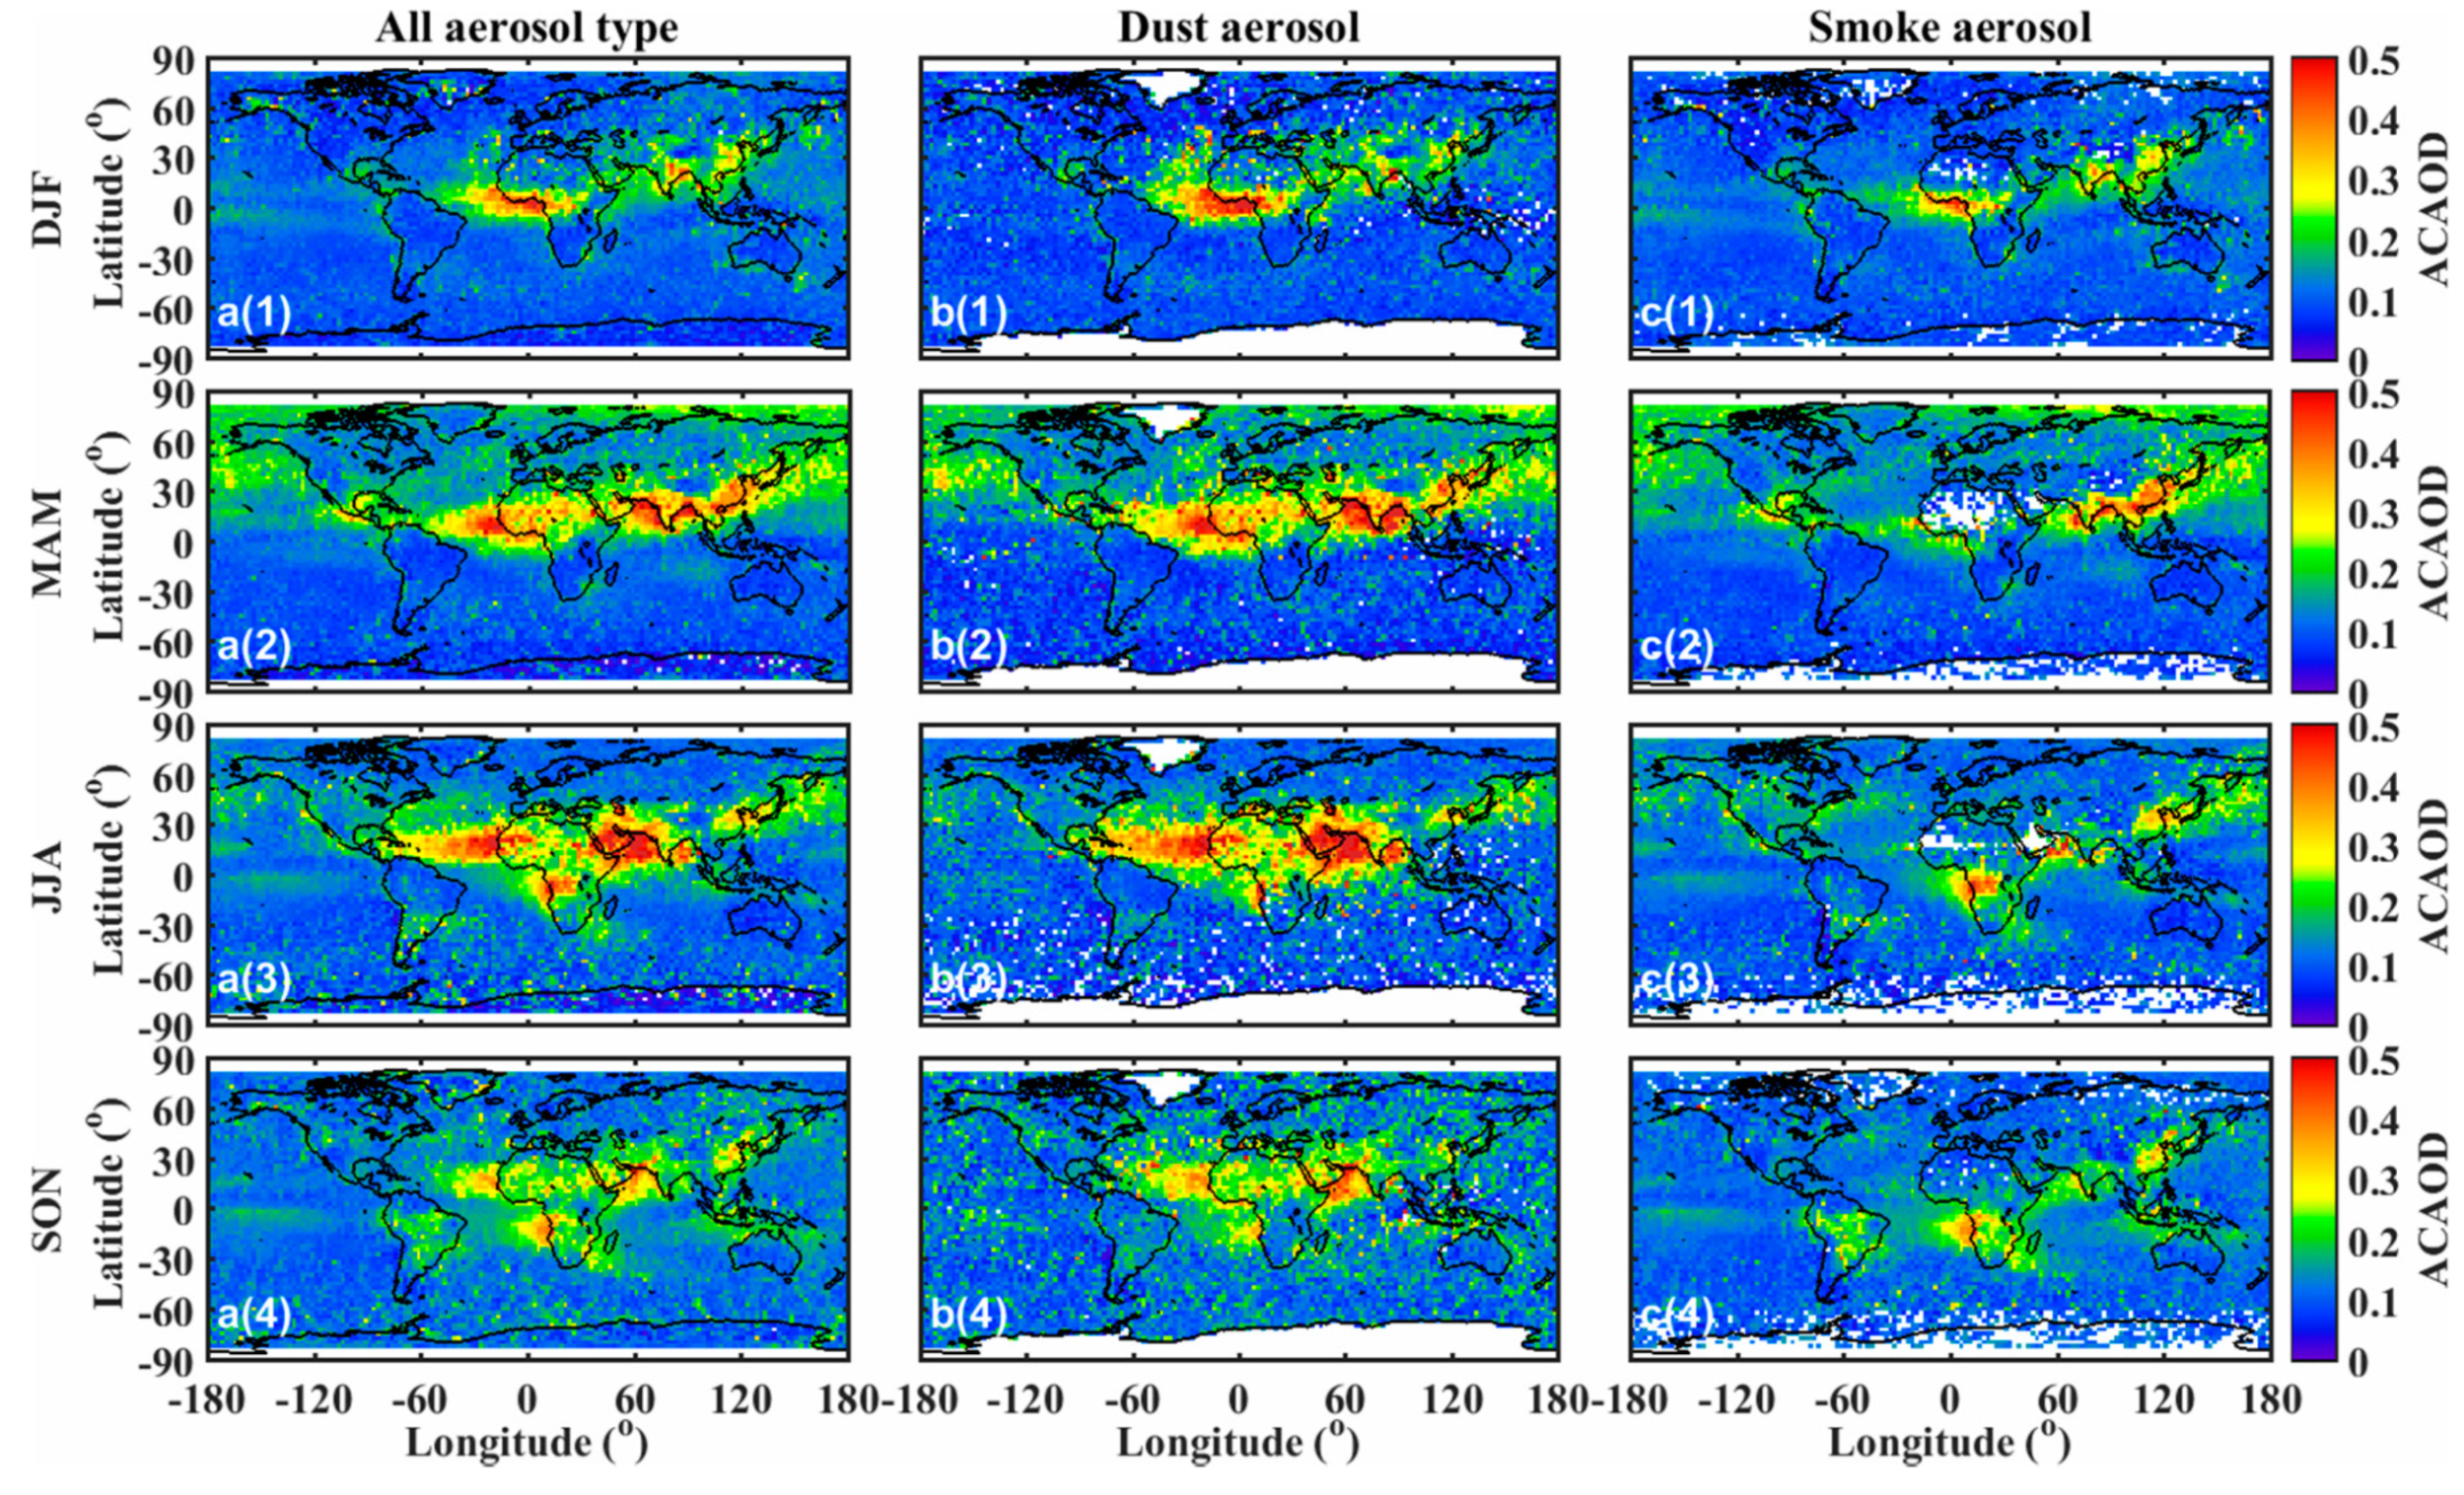
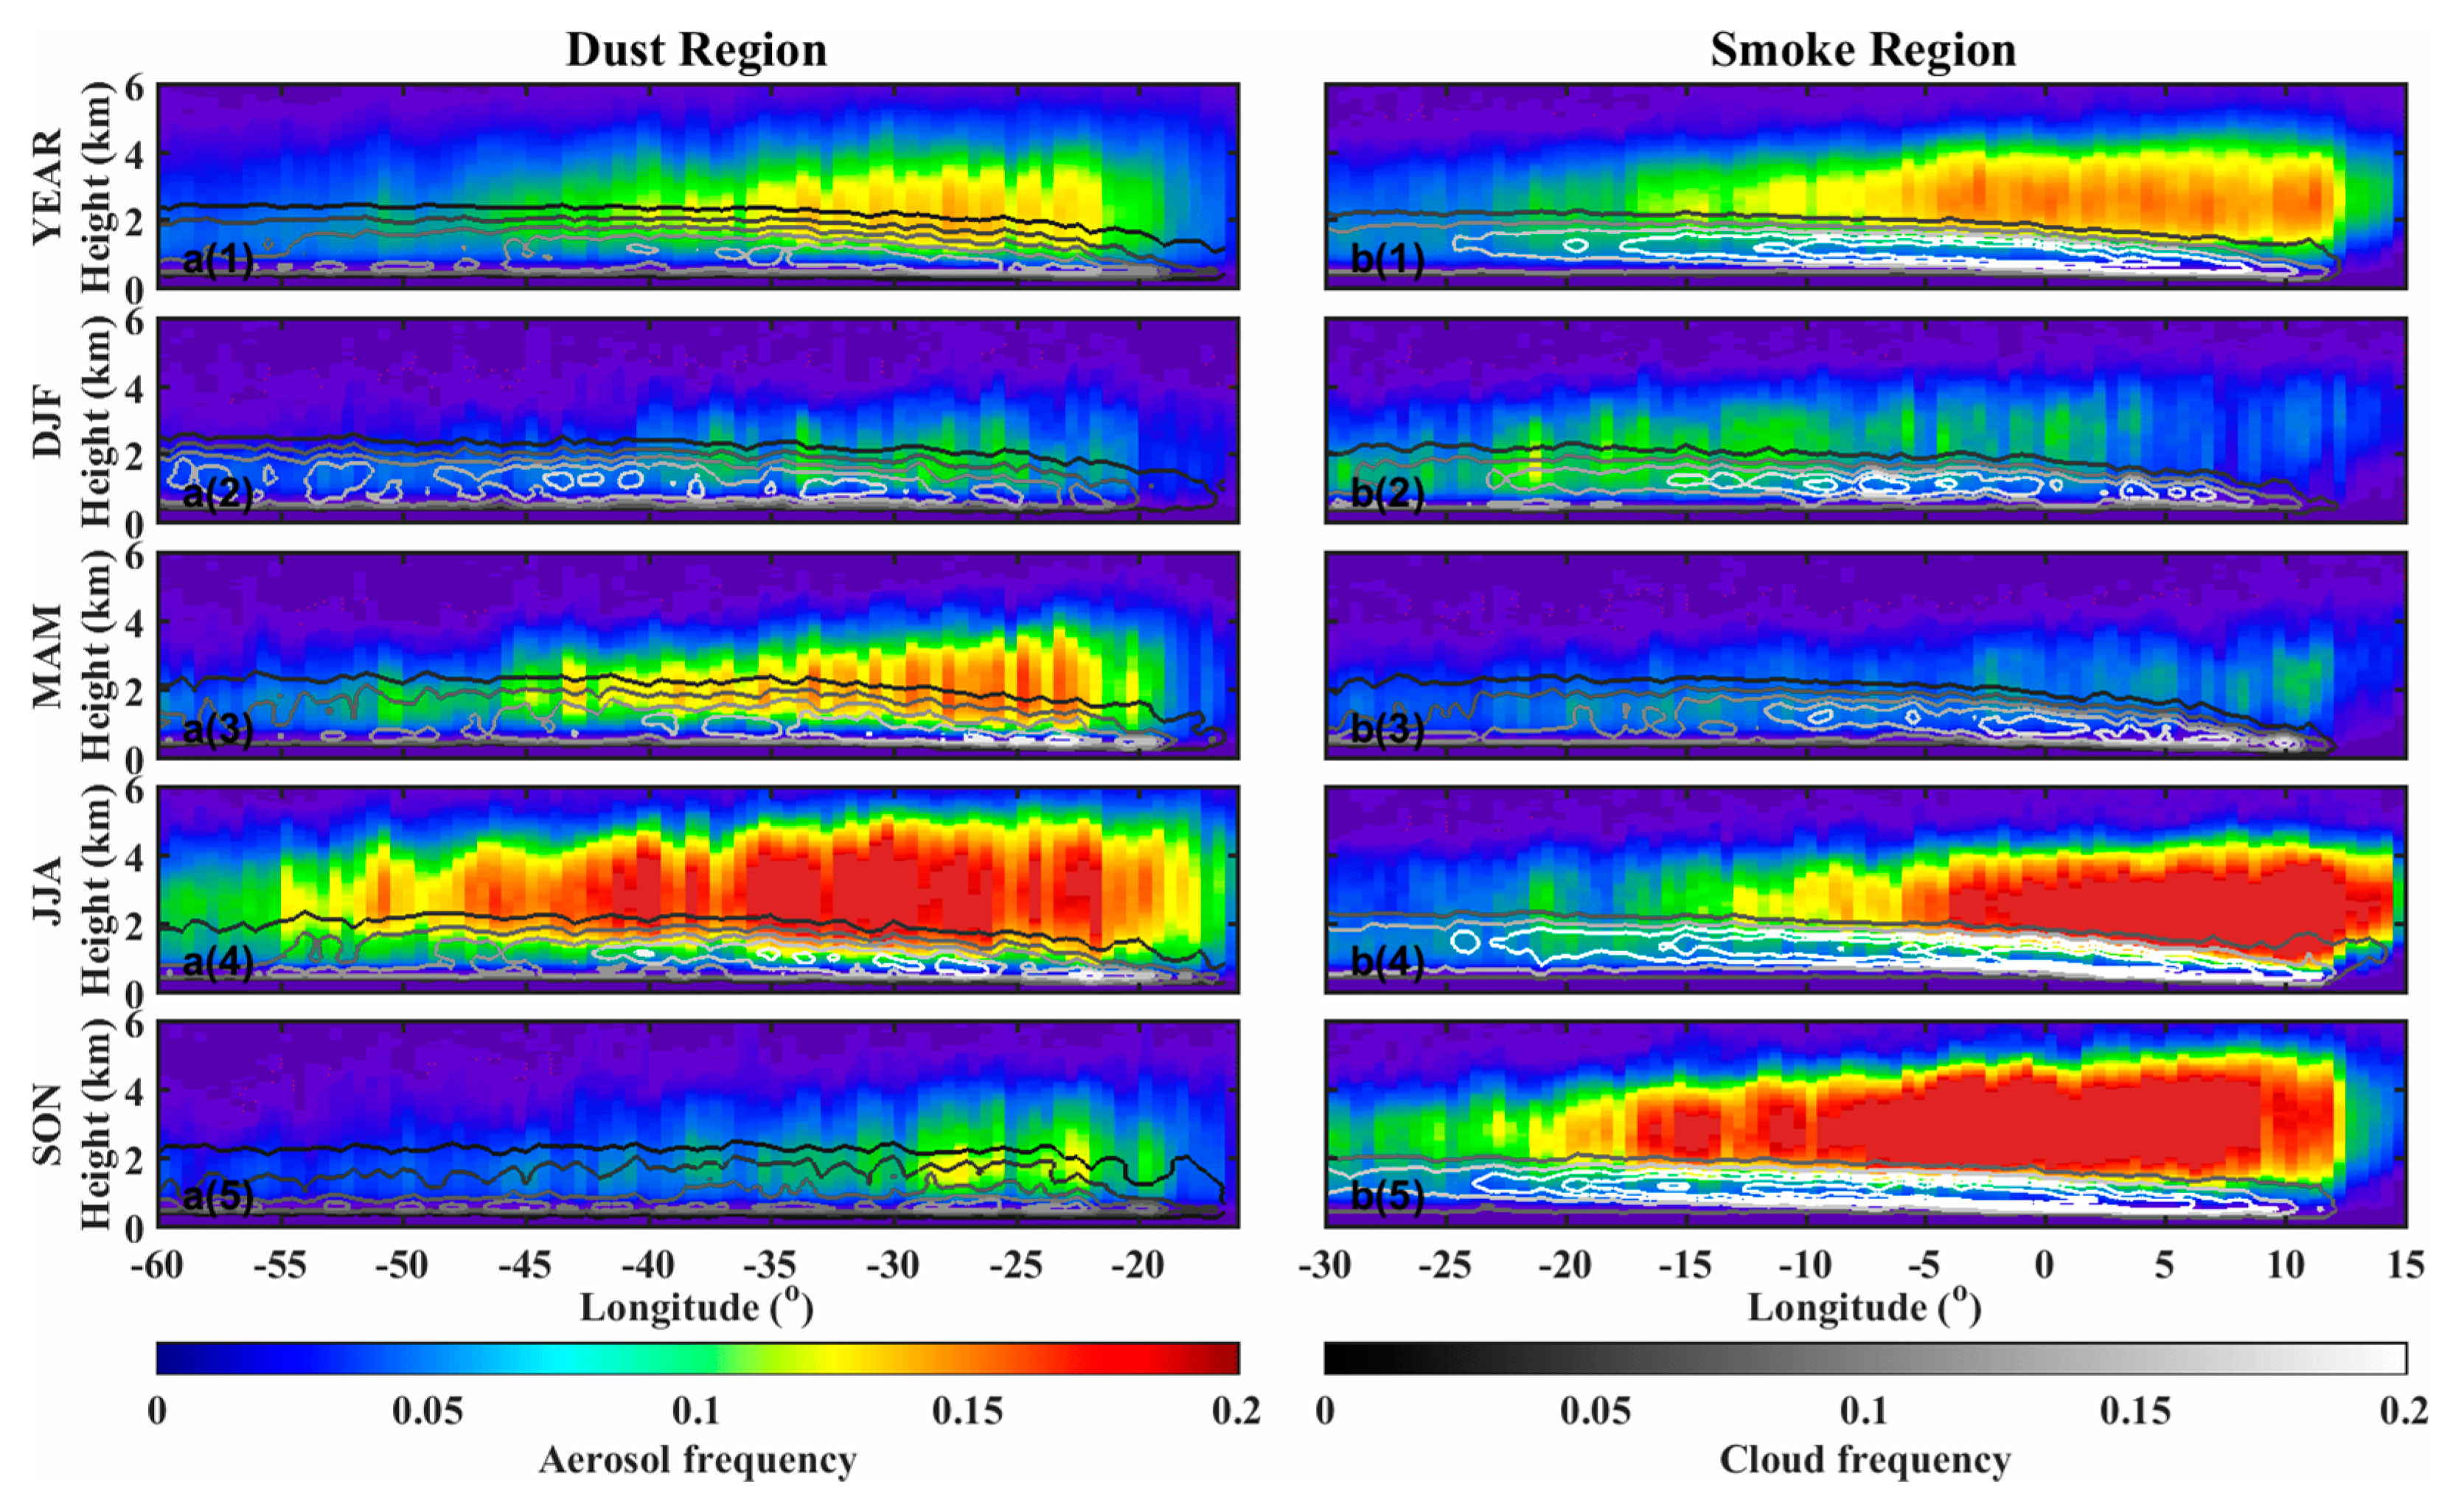
Main dust band region: Above-cloud dust aerosols frequently occur along the main dust band, including in the Saharan to Middle-Eastern dust source regions and transport regions such as the Atlantic and Indian Oceans and India. Over these source regions, dust activity is strongest in MAM and JJA, resulting in more than 80% of low cloud having dust above it (Figure 6). This dust transports furthest, from the west to north Atlantic, in JJA, and it transports most widely in MAM. The above-cloud dust AOD values over the northern Atlantic were found to be 0.26 (MAM) and 0.35 (JJA) (Figure 7b2,b3). The easterly long-range transport of Saharan and Middle-Eastern dust can result in an above cloud occurrence of 65% with an AOD of 0.5 over the Indian Ocean and India in JJA, as shown in Figure 6b3 and Figure 7b3. In SON, the period associated with the weakest dust activities, the above-cloud dust occurrence was found to decrease to ~60% over the source region and ~20–50% over the long-range transport regions. Correspondingly, the above-cloud dust AOD reduced to ~0.15–0.3 over these regions.
(2)
Africa smoke region: Smoke aerosol frequently occurs as a result of biomass events in central Africa and is transported across the cloud deck over southeastern the Atlantic Ocean. As shown in Figure 6c(1)–c(4), the above-cloud smoke aerosol occurs most in JJA (about 52%), second-most in SON (about 49%) and third-most in DJF (about 33%), whereas little ACA occurs in MAM. The mean above-cloud smoke AOD values in each season were found to be 0.28 (DJF), 0.17 (MAM), 0.23 (JJA), and 0.24 (SON).
(3)
Eastern Asia region: In MAM, the period when Asian dust activity is strongest, above-cloud dust aerosol is present for most of the year (about 29%), and this period is associated with the strongest AOD value of about 0.31. The dust from Asia will be transported long-range across the Pacific to northern America, resulting in about 20% of ACA occurrences and an ACAOD value of 0.25 over the Pacific Ocean. The above-cloud smoke and polluted continental aerosols over Eastern Asia are also most active in MAM, representing ~32% of occurrences and having an AOD of 0.31 above low clouds. These aerosols can also be transported over the Pacific and contribute to the ACA presence there. The occurrence of above-cloud smoke and polluted continental aerosols is ~25% and the ACAOD value is 0.23 over the Pacific. In other seasons, the ACA occurrence is about 7–25%, and this is associated with very weak long-range transport.
Other than these major aerosol source regions, our results also indicate some weak aerosol source regions, such as South America, Central America, and Timor Sea, where ACA frequently occurs in some seasons, but this has rarely been studied in previous studies. South America and the Timor Sea can be considered to be anthropogenic source regions due to the biomass burning emissions [53,54]. During SON, the above-cloud smoke aerosol occurrence over South America is about 24% with an AOD value of about 0.16. Trade winds will carry the smoke aerosol produced from Northern Australian savannah fires and agricultural/peat burning fires in Indonesia over the Timor Sea [54], resulting in an above-cloud smoke aerosol occurrence of 57% with an ACAOD value of 0.20. The ACA over Central America mostly occurs in MAM as a result of both anthropogenic sources due to human activity and biomass burning activities [55]. The occurrence of above-cloud polluted continental and above-cloud smoke aerosol in Central America is about 35% with an AOD value of about 0.21 in MAM. Our results also indicate that smoke from southeastern Africa transports in an easterly direction across the Indian Ocean in SON, and may reach the west coast of Australia.

5. Discussion

The relative positions of the ACA and low clouds determine the response of low clouds to the ACA [24]. Figure 8 shows the 4-year zonal mean ACAOC (Figure 8a), ACAOD (Figure 8b), vertical distance between the ACA and cloud (VDAC, Figure 8c), and ACA geometrical thickness (AGT, Figure 8d). The ACAOC and ACAOD values have quite large inter-season variations at low latitudes, which are related to the dust and smoke activity. At low latitudes (between –40° and 40°N), the ACAOC can reach about 40%, and the ACAOD can reach 0.2–0.4 during high ACA activity seasons (i.e., MAM in the northern tropical region and SON in the southern tropical region). Additionally, the VDAC is smaller than about 0.5 km and the AGT can reach 1–2 km, because of the ACA being close to the main source region (Saharan dust and African smoke). When transported away from the source to high latitudes (<–40° and >40°), the ACAOC decreases as the latitude increases. However, the VDAC increases from 0.5 to about 1–1.5 km during long-range transport, associated with the decrease in AGT, except in MAM. In MAM, the AGT in the northern hemisphere is generally about 2 km, as a result of the long-range transport of Asian dust at mid-latitudes [56]. The different behaviors that occur at low and high latitudes indicate different cloud responses to the ACA. The stabilization effect of the ACA dominates the cloud response at the mid-to-high-latitude regions, because the ACA generally resides away from the low clouds [24]. In contrast, at low latitudes, the ACA is more likely to directly mix with low clouds and influence the cloud microphysics.
A more insightful view of the relative positions of the ACA and low clouds at low altitudes is shown in Figure 9 by the 4-year mean longitude–altitude distribution of cloud (gray contour line) and ACA (color shade) occurrences over the dust (left column) and smoke regions (right column). The latitude ranges of the dust (tropical Atlantic) and smoke (southeast Atlantic) regions are the same as those stated in Section 4.1. Similar results by the CALIPSO level-2 product can be found in Figure 1 in Zuidema et al. [24], in which most of the ACA layer was shown to reside above the cloud deck at a mean distance of about 1 km [24]. According to the CALIPSO level-2 product, a semi-direct effect (atmospheric stabilization, reference) due to absorption in the aerosol layers above the cloud deck could dominate the ACA–cloud interaction over these regions. However, our results show that the bottom of the high ACA occurrence layer resides immediately above the most frequent cloud height (Figure 9). Our findings are different to those derived from the CALIPSO level-2 product. The main reason for this is the misdetection of the ACA layer bottom in the CALIPSO level-2 product (as stated in Section 3), which was also reported by Rajapakshe et al. (2017) using two seasons of night-time CATS 1064 nm observations over the southeast Atlantic region [44]. Therefore, as well as the semi-effect, smoke and dust layers can mix into the low cloud over the transport region of the Atlantic and influence the cloud microphysics (indirect effect) due to its proximity to the cloud layer [34].

6. Conclusions

This paper presented an improved ACA identification and retrieval methodology that combines CALIOP 532 and 1064 nm observations. The ACA was mainly detected with the 1064 nm channel by taking advantage of the weaker aerosol attenuation compared with that of the 532 nm channel. The selection of the 1064 nm signal for ACA identification allowed the detection of the full column of aerosols above the clouds, which the 532 nm signal misses due to its stronger attenuation. Effort was made to address the low SNR issue in the CALIOP day-time observation to provide consistent results between day- and night-time retrieval. Another feature of this methodology is the reliable cloud–aerosol distinction that occurs with the combination of CALIPSO and CloudSat observations.
Then, new four-year (2007 to 2010) global ACA datasets were built, and new global seasonal-mean views of ACA properties were presented and analyzed, including the occurrence of ACA and its optical properties. The results indicate that the new method can not only capture the main ACA occurrence regions, such as the tropical Atlantic region which is associated with outflows of African dust and smoke, but also weak ACA occurrence regions, such as Eastern Asia, and long-range transport regions, such as the Pacific, using both day- and night-time observations. Compared with the CALIPSO L evel-2 product, the newly derived day- and night-time global distributions of ACA properties show good agreement, benefitted from multiple moving-smoothing processes.
The relative vertical positions of the ACA and low clouds were presented and discussed. The results indicate that at high latitudes (<–40° and >~40°), the ACA mainly resides above the low clouds at a distance greater than 0.5 km, indicating the semi-direct influence of the ACA on the cloud by stabilizing the atmospheric temperature profile. At low latitudes, the distance between the ACA and low clouds is smaller than 0.5 km. Especially over the Atlantic near the Saharan dust and African smoke source regions, the ACA mainly resides immediately above the clouds; this contrasts with the results derived from the CALIPSO operational product in previous studies. The ACA over the tropical Atlantic (dust region) and southeast Atlantic (smoke region) can directly mix with the cloud, influencing the lower cloud deck through both semi-effect and indirective effects. This highlights the complexity of the aerosol–cloud interactions over these regions, where the model still has difficulty reproducing the vertical aerosol structure and aerosol–cloud radiative effect [11,12,13].
To qualify the roles of these two effects, improve the passive cloud property retrieval, and constrain the relative model process, a height-resolved ACA database like the one developed in this study is needed. The new method developed in this study can provide a more complete and accurate global view of the ACA. Together with other satellite measurements such as MODIS [57] and CERES [58] and cloud property retrieval methods such as that described by Luo et al. [59], the radiative effects of the ACA and its influences on the macro- and micro-physics of low clouds will be further studied in future work. These results not only help us better understand global aerosol transportation and aerosol–cloud interactions but also provide useful information for model evaluation and improvements.

Author Contributions

Conceptualization, S.D.; Data curation, Y.W.; Formal analysis, W.Z. (Wenzhong Zhang); Funding acquisition, T.L.; Investigation, N.L.; Methodology, W.Z. (Wenzhong Zhang); Project administration, X.L.; Software, W.Z. (Wenzhong Zhang); Supervision, Y.H. and W.Z. (Wenyue Zhu); Validation, W.Z. (Wenzhong Zhang); Visualization, W.Z. (Wenzhong Zhang); Writing—original draft, W.Z. (Wenzhong Zhang); Writing—review and editing, T.L.

Funding

This research was funded by the Strategic Priority Research Program of Chinese Academy of Sciences, grant number XDA17010104. Tao Luo’s work was also supported by the National Key Technology Support Program of China, grant number 2017YFC0209801 and Natural Science Foundation of China, grant number 41875041.

Acknowledgments

The authors thank the CALIPSO Team for providing data products, which were obtained from the NASA Langley Research Center Atmospheric Science Data Center. The authors are also grateful to the CloudSat team for making the data available; these data were obtained from the CloudSat Data Processing Center (http://www.cloudsat.cira.colostate.edu). The authors would also like to thank the MERRA team for providing the data obtained from the Global Modeling and Assimilation Systems. The authors thank the OMACA team for providing data products, which were obtained from https://avdc.gsfc.nasa.gov/pub/data/satellite/Aura/OMI/V03/L2/OMACA. The authors acknowledge the anonymous reviewers and the editor for their valuable comments and suggestions.

Conflicts of Interest

The authors declare no conflict of interest.

References

  1. Overpeck, J.; Rind, D.; Lacis, A.; Healy, R. Possible role of dust-induced regional warming in abrupt climate change during the last glacial period. Nature 1996, 384, 447–449. [Google Scholar] [CrossRef]
  2. Tegen, I.; Lacis, A.A.; Fung, I. The influence on climate forcing of mineral aerosols from disturbed soils. Nature 1996, 380, 419–422. [Google Scholar] [CrossRef]
  3. Alpert, P.; Kaufman, Y.J.; Shay-El, Y.; Tanre, D.; da Silva, A.; Schubert, S.; Joseph, J.H. Quantification of dust-forced heating of the lower troposphere. Nature 1998, 395, 367–370. [Google Scholar] [CrossRef]
  4. Kinne, S.; Schulz, M.; Textor, C.; Guibert, S.; Balkanski, Y.; Bauer, S.E.; Berntsen, T.; Berglen, T.F.; Boucher, O.; Chin, M.; et al. An AeroCom initial assessment—Optical properties in aerosol component modules of global models. Atmos. Chem. Phys. 2006, 6, 1815–1834. [Google Scholar] [CrossRef]
  5. Solomon, S.; Qin, D.; Manning, M.; Alley, R.B.; Berntsen, T.; Bindoff, N.L.; Chen, Z.; Chidthaisong, A.; Gregory, J.M.; Hegerl, G.C.; et al. Technical Summary, Climate Change 2007: The Physical Science Basis, Contribution of Working Group I to the Fourth Assessment Report of the Intergovernmental Panel on Climate Change; Solomon, S., Qin, D., Manning, M., Marquis, M., Averyt, K.B., Tignor, M., Miller, H.L., Chen, Z., Eds.; Cambridge University Press: Cambridge, UK; New York, NY, USA, 2007; pp. 19–91. [Google Scholar]
  6. Chaboureau, J.P.; Richard, E.; Pinty, J.P.; Flamant, C.; Girolamo, P.D.; Kiemle, C.; Behrendt, A.; Chepfer, H.; Chiriaco, M.; Wulfmeyer, V. Long-range transport of Saharan dust and its radiative impact on precipitation forecast: A case study during the convective and or graphically-induced precipitation study (COPS). Q. J. R. Meteorol. Soc. 2011, 137, 236–251. [Google Scholar] [CrossRef]
  7. Zhang, X.Y.; Wang, Y.Q.; Niu, T.; Zhang, X.C.; Gong, S.L.; Zhang, Y.M.; Sun, J.Y. Atmospheric aerosol compositions in China: Spatial/temporal variability, chemical signature, regional haze distribution and comparisons with global aerosols. Atmos. Chem. Phys. 2012, 12, 779–799. [Google Scholar] [CrossRef]
  8. Fan, J.; Leung, L.R.; DeMott, P.J.; Comstock, J.M.; Singh, B.; Rosenfeld, D.; Tomlinson, J.M.; White, A.; Prather, K.A.; Minnis, P.; et al. Aerosol impacts on California winter clouds and precipitation during CalWater 2011: Local pollution versus long-range transported dust. Atmos. Chem. Phys. 2014, 14, 81–101. [Google Scholar] [CrossRef]
  9. Waquet, F.; Peers, F.; Ducos, F.; Goloub, P.; Platnick, S.; Riedi, J.; Tanré, D.; Thieuleux, F. Global analysis of aerosolproperties above clouds. Geophys. Res. Lett. 2013, 40, 5809–5814. [Google Scholar] [CrossRef]
  10. Jethva, H.; Torres, O.; Ahn, C. A 12-year long global record of optical depth of absorbing aerosols above the clouds derived from the OMI/OMACA algorithm. Atmos. Meas. Tech. 2018, 11, 5837–5864. [Google Scholar] [CrossRef] [Green Version]
  11. Schulz, M.; Textor, C.; Kinne, S.; Balkanski, Y.; Bauer, S.; Berntsen, T.; Berglen, T.; Boucher, O.; Dentener, F.; Guibert, S.; et al. Radiative forcing by aerosols as derived from the AeroCom present-day and pre-industrial simulations. Atmos. Chem. Phys. 2006, 6, 5225–5246. [Google Scholar] [CrossRef] [Green Version]
  12. Stier, P.; Schutgens, N.A.J.; Bellouin, N.; Bian, H.; Boucher, O.; Chin, M.; Ghan, S.; Huneeus, N.; Kinne, S.; Lin, G.; et al. Host model uncertainties in aerosol radiative forcing estimates: Results from the Aero-Com Prescribed intercomparison study. Atmos. Chem. Phys. 2013, 13, 3245–3270. [Google Scholar] [CrossRef]
  13. Peers, F.; Waquet, F.; Cornet, C.; Dubuisson, P.; Ducos, F.; Goloub, P.; Szczap, F.; Tanré, D.; Thieuleux, F. Absorption of aerosols above clouds from POLDER/PARASOL measurements and estimation of their direct radiative effect. Atmos. Chem. Phys. 2015, 15, 4179–4196. [Google Scholar] [CrossRef] [Green Version]
  14. Chand, D.A.; Anderson, T.L.; Wood, R.; Charlson, R.J.; Hu, Y.; Liu, Z.; Vaughan, M. Quantifying above-cloud aerosol using spaceborne lidar for improved understanding of cloudy-sky direct climate forcing. J. Geophys. Res. 2008, 113, D13206. [Google Scholar] [CrossRef]
  15. Chand, D.A.; Wood, R.; Anderson, T.L.; Satheesh, S.K.; Charlson, R.J. Satellite-derived direct radiative effect of aerosols dependent on cloud cover. Nat. Geosci. 2009, 2, 181–184. [Google Scholar] [CrossRef]
  16. Waquet, F.; Riedi, J.; Labonnote, L.C.; Goloub, P.; Cairns, B.; Deuzé, J.-L.; Tanré, D. Aerosol remote sensing over clouds using A-train observations. J. Atmos. Sci. 2009, 66, 2468–2480. [Google Scholar] [CrossRef]
  17. Torres, O.; Jethva, H.; Bhartia, P.K. Retrieval of aerosol optical depth above clouds from OMI observations: Sensitivity analysis and case studies. J. Atmos. Sci. 2012, 69, 1037–1053. [Google Scholar] [CrossRef]
  18. Tsay, S.-C.; Hsu, N.-C.; Lau, W.K.-M.; Li, C.; Gabriel, P.M.; Ji, Q.; Holben, B.N.; Welton, E.J.; Nguyen, A.X.; Janjai, S.; et al. From BASE-ASIA toward 7-SEAS: A satellite-surface perspective of boreal spring biomass-burning aerosols and clouds in Southeast Asia. Atmos. Environ. 2013, 78, 20–34. [Google Scholar] [CrossRef] [Green Version]
  19. Yu, H.; Zhang, Z. New Directions: Emerging satellite observations of above-cloud aerosols and direct radiative forcing. Atmos. Environ. 2013, 72, 36–40. [Google Scholar] [CrossRef] [Green Version]
  20. Abel, S.J.; Highwood, E.J.; Haywood, J.M.; Stringer, M.A. The direct radiative effect of biomass burning aerosols over southern Africa. Atmos. Chem. Phys. 2005, 5, 1999–2018. [Google Scholar] [CrossRef] [Green Version]
  21. Keil, A.; Haywood, J.M. Solar radiative forcing by biomass burning aerosol particles during SAFARI 2000: A case study based on measured aerosol and cloud properties. J. Geophys. Res. 2003, 108, 8467. [Google Scholar] [CrossRef]
  22. Meyer, K.; Platnick, S.; Oreopoulos, L.; Lee, D. Estimating the direct radiative effect of absorbing aerosols overlying marine boundary layer clouds in the southeast Atlantic using MODIS and CALIOP. J. Geophys. Res. Atmos. 2013, 118, 4801–4815. [Google Scholar] [CrossRef] [Green Version]
  23. Zhang, Z.; Meyer, K.; Platnick, S.; Oreopoulos, L.; Lee, D.; Yu, H. A novel method for estimating shortwave direct radiative effect of above-cloud aerosols using CALIOP and MODIS data. Atmos. Meas. Tech. 2014, 7, 1777–1789. [Google Scholar] [CrossRef]
  24. Zuidema, P.; Redemann, J.; Haywood, J.; Wood, R.; Piketh, S.; Hipondoka, M.; Formenti, P. Smoke and clouds above the southeast Atlantic: Upcoming field campaigns probe absorbing aerosol’s impact on climate. BAMS 2016, 97, 1131–1135. [Google Scholar] [CrossRef]
  25. Shrestha, R.K.; Connolly, P.J.; Gallagher, M.W. Sensitivity of WRF cloud microphysics to simulations of a convective strom over the Nepal Himalayas. Open Atmos. Sci. J. 2017, 11, 29–43. [Google Scholar] [CrossRef]
  26. Jethva, H.; Torres, O.; Remer, L.A.; Bhartia, P.K. A color ratio method for simultaneous retrieval of aerosol and cloud optical thickness of above-cloud absorbing aerosols from passive sensors: Application to MODIS measurements. IEEE Trans. Geosci. Remote Sens. 2013, 51, 3862–3870. [Google Scholar] [CrossRef]
  27. Meyer, K.S.; Platnick, S.; Zhang, Z. Simultaneously inferring above-cloud absorbing aerosol optical thickness and underlying liquid phase cloud optical and microphysical properties using MODIS. J. Geophys. Res.-Atmos. 2015, 120, 5524–5547. [Google Scholar] [CrossRef]
  28. Haywood, J.M.; Osborne, S.R.; Abel, S.J. The effect of overlying absorbing aerosol layers on remote sensing retrievals of cloud effective radius and cloud optical depth. Q. J. R. Meteorol. Soc. 2004, 130, 779–800. [Google Scholar] [CrossRef]
  29. Wilcox, E.M.; Harshvardian; Platnick, S. Estimate of the impact of absorbing aerosol over cloud on the MODIS retrievals of cloud optical thickness and effective radius using two independent retrievals of liquid water path. J. Geophys. Res. 2009, 114, D05210. [Google Scholar] [CrossRef]
  30. Coddington, O.M.; Pilewskie, P.; Redemann, J.; Platnick, S.; Russell, P.B.; Schmidt, K.S.; Gore, W.J.; Livingston, J.; Wind, G.; Vukicevic, T.L. Examining the impacts of overlying aerosols on the retrieval of cloud optical properties from passive remote sensing. J. Geophys. Res. 2010, 115, D10211. [Google Scholar] [CrossRef]
  31. Alfaro-Contreras, R.; Zhang, J.; Campbell, J.R.; Holz, R.E.; Reid, J.S. Evaluating the impact of aerosol particles above cloud on cloud optical depth retrievals from MODIS. J. Geophys. Res. Atmos. 2014, 119, 5410–5423. [Google Scholar] [CrossRef]
  32. Li, Z.; Zhao, F.; Liu, J.; Jiang, M.; Zhao, C.; Cribb, M. Opposite effects of absorbing aerosols on the retrievals of cloud optical depth from space-borne and ground-based measurements. J. Geophys. Res. Atmos. 2014, 119, 5104–5114. [Google Scholar] [CrossRef]
  33. Jethva, H.; Torres, O.; Waquet, F.; Chand, D.; Hu, Y. How do A-train sensors intercompare in the retrieval of above-cloud aerosol optical depth? A case study-based assessment. Geophys. Res. Lett. 2014, 41, 186–192. [Google Scholar] [CrossRef]
  34. Costantino, L.; Bréon, F.-M. Aerosol indirect effect on warm clouds over South-East Atlantic, from co-located MODIS and CALIPSO observations. Atmos. Chem. Phys 2013, 13, 69–88. [Google Scholar] [CrossRef] [Green Version]
  35. Min, M.; Zhang, Z. On the influence of cloud fraction diurnal cycle and sub-grid cloud optical thickness variability on all-sky direct aerosol radiative forcing. J. Quant. Spectrosc. Ra 2014, 142, 25–36. [Google Scholar] [CrossRef] [Green Version]
  36. Zhang, Z.; Meyer, K.; Yu, H.; Platnick, S.; Colarco, P.; Liu, Z.; Oreopoulos, L. Shortwave direct radiative effects of above-cloud aerosols over global oceans derived from 8 years of CALIOP and MODIS observations. Atmos. Chem. Phys 2016, 16, 2877–2900. [Google Scholar] [CrossRef] [Green Version]
  37. Kacenelenbogen, M.; Redemann, J.; Vaughan, M.A.; Omar, A.H.; Russell, P.B.; Burton, S.L.; Rogers, R.R.; Ferrare, R.; Hostetler, C.A. An evaluation of CALIOP/CALIPSO’s aerosol-above-cloud detection and retrieval capability over North America. J. Geophys. Res. Atmos. 2014, 119, 230–244. [Google Scholar] [CrossRef]
  38. Liu, Z.; Winker, D.; Omar, A.; Vaughan, M.; Kar, J.; Trepte, C.; Hu, Y.; Schuster, G. Evaluation of CALIOP 532 nm aerosoloptical depth over opaque water clouds. Atmos. Chem. Phys. 2015, 15, 1265–1288. [Google Scholar] [CrossRef]
  39. Winker, D.M.; Vaughan, M.A.; Omar, A.; Hu, Y.; Powell, K.A.; Liu, Z.; Hunt, W.H.; Young, S.A. Overview of the CALIPSO mission and CALIOP data processing algorithms. J. Atmos. Ocean. Tech. 2009, 26, 2310–2323. [Google Scholar] [CrossRef]
  40. Li, J.; Hu, Y.; Huang, J.; Stamnes, K.; Yi, Y.; Stamnes, S. A New Method for Retrieval of the Extinction Coefficient of Water Clouds by using the Tail of the CALIOP Signal. Atmos. Chem. Phys. 2011, 11, 2903–2916. [Google Scholar] [CrossRef]
  41. Wang, Z.; Vane, D.; Stephens, G.; Reinke, D. Level 2 Combined Radar and Lidar Cloud Scenario Classification Product Process Description and Interface Control Document. JPL Rep, 22. Available online: http://www.cloudsat.cira.colostate.edu/sites/default/files/products/files/2B-CLDCLASS-LIDAR_PDICD.P_R04.20120522.pdf (accessed on 18 February 2019).
  42. Li, X.; Zheng, X.; Zhang, D.; Zhang, W.; Wang, F.; Deng, Y.; Zhu, W. Clouds over East Asia Observed with CollocatedCloudSat and CALIPSO Measurements: Occurrence and Macrophysical Properties. Amosphere 2018, 9, 168. [Google Scholar] [CrossRef]
  43. Draper, C.S.; Reichle, R.H.; Koster, R.D. Assessment of MERRA-2 land surface energy flux estimates. J. Clim. 2018, 31, 671–691. [Google Scholar] [CrossRef]
  44. Rajapakshe, C.; Zhang, Z.; Yorks, J.E.; Yu, H.; Tan, Q.; Meyer, K.; Platnick, S.; Winker, D.M. Seasonally transported aerosol layers over southeast Atlantic are closer to underlying clouds than previously reported. Geophys. Res. Lett. 2017, 44, 5818–5825. [Google Scholar] [CrossRef]
  45. Alfaro-Contreras, R.; Zhang, J.; Campbell, J.R.; Reid, J.S. Investigating the frequency and interannual variability in global above-cloud aerosol characteristics with CALIOP and OMI. Atmos. Chem. Phys. 2016, 16, 47–69. [Google Scholar] [CrossRef] [Green Version]
  46. Omar, A.H.; Winker, D.M.; Vaughan, M.A.; Hu, Y.; Trepte, C.R.; Ferrare, R.A.; Lee, K.-P.; Hostetler, C.A.; Kittaka, C.; Rogers, R.R.; et al. The CALIPSO automated aerosol classification and lidar ratio selection algorithm. J. Atmos. Ocean. Technol. 2009, 26, 1994–2014. [Google Scholar] [CrossRef]
  47. Fernald, F.G. Analysis of atmospheric lidar observations: Some comments. Appl. Opt. 1984, 23, 652–653. [Google Scholar] [CrossRef] [PubMed]
  48. Carlson, T.N.; Prospero, J.M.; Hanson, K.J. Attenuation of Solar Radiation by Windborne Saharan Dust Off the West Coast of Africa; NOAA Technical Memorandum ERL WMPO-7; U.S. Department of Commerce: Boulder, CO, USA, 1973.
  49. Karyampudi, V.M.; Palm, S.P.; Reagen, J.A.; Fang, H.; Grant, W.B.; Hoff, R.M.; Moulin, C.; Pierce, H.F.; Torres, O.; Browell, E.V.; et al. Validation of the Saharan dust plume conceptual model using lidar, meteosat, and ECMWF data. Bull. Am. Meteorol. Soc. 1999, 80, 1045–1076. [Google Scholar] [CrossRef]
  50. Campbell, J.R.; Welton, E.J.; Spinhirne, J.D.; Ji, Q.; Tsay, S.-C.; Piketh, S.J.; Barenbrug, M.; Holben, B.N. Micropulse lidar observations of tropospheric aerosols over northeastern South Africa during the ARREX and SAFARI-2000 dry season experiments. J. Geophys. Res. 2003, 108, 8497. [Google Scholar] [CrossRef]
  51. Yu, H.; Zhang, Y.; Chin, M.; Liu, Z.; Omar, A.; Remer, L.A.; Yang, Y.; Yuan, T.; Zhang, J. An integrated analysis of aerosol above clouds from A-Train multi-sensor measurements. Remote Sens. Environ. 2012, 121, 125–131. [Google Scholar] [CrossRef]
  52. Devasthale, A.; Thomas, M.A. A global survey of aerosol-liquid water cloud overlap based on four years of CALIPSO-CALIOP data. Atmos. Chem. Phys. 2011, 11, 1143–1154. [Google Scholar] [CrossRef]
  53. Saulo, R.F.; Karla, M.L.; Maria, A.F.S.D.; Pedro, L.S.D.; Robert, C.; Elaine, P.; Paulo, A.; Georg, A.G.; Fernando, S.R. Monitoring the Transport of Biomass Burning Emissions in South America. Environ. Fluid Mech. 2005, 5, 135–167. [Google Scholar]
  54. Mallet, M.; Cravigan, L.; Milic, A.; Alroe, J.; Ristovski, Z.; Ward, J.; Keywood, M.; Williams, L.; Miljevic, B. Composition, size and cloud condensation nuclei activity of biomass burning aerosol from north Australian savannah fires. Atmos. Chem. Phys. 2017, 17, 3605–3617. [Google Scholar] [CrossRef]
  55. Torres, O.; Bhartia, P. OMI measurements of aerosol absorption over Central America. AGU Spring Meeting. 2007. Available online: https://www.researchgate.net/publication/253399702_OMI_measurements_of_aerosol_absorption_over_Central_America (accessed on 13 October 2019).
  56. Han, Y.; Fang, X.; Zhao, T.; Kang, S. Long range trans-Pacific transport and deposition of Asian dust aerosols. J. Environ. Sci. 2008, 20, 424–428. [Google Scholar] [CrossRef]
  57. Platnick, S.; King, M.D.; Ackerman, S.A.; Menzel, W.P.; Baum, B.A.; Riedi, J.C.; Frey, R.A. The MODIS cloud products: Algorithms and examples from Terra. IEEE Trans. Geosci. Remote Sens. 2003, 41, 459–473. [Google Scholar] [CrossRef]
  58. Minnis, P.; Sun-Mack, S.; Young, D.F.; Heck, P.W. CERES Edition-2 Cloud Property retrievals using TRMM VIRS and Terra and Aqua MODIS data. Part I: Algorithms. Part II: Examples of average results and comparison with other data. IEEE Trans. Geosci. Remote Sens. 2011, 49, 4374–4430. [Google Scholar] [CrossRef]
  59. Luo, T.; Wang, Z.; Li, X.; Deng, S.; Huang, Y.; Wang, Y. Retrieving the polar mixed-phase cloud liquid water path by combining CALIOP and IIR measurements. J. Geophys. Res. 2018, 123, 1755–1770. [Google Scholar] [CrossRef]
Figure 1. Flow chart of the new above-low-level cloud aerosol (ACA) identification and retrieval methodology.
Remotesensing 11 02396 g001
Figure 2. Comparison of noise between the 20 km moving–smoothing in the night-time and multiscale moving–smoothing in the daytime.
Remotesensing 11 02396 g002
Figure 3. Low cloud samples quantity in (a) winter (DJF, i.e., December, January, and February), (b) spring (MAM, i.e., March, April, and May), (c) summer (JJA, i.e., June, July, and August), and (d) autumn (SON, i.e., September, October, and November).
Remotesensing 11 02396 g003
Figure 4. ACA case on 2 August 2007, 13:12:11 UTC: (a) geo-location; (b) β 532 ; (c) β 1064 ; (d) ACA mask from the new method in this study; (e) aerosol optical depth at 532 nm determined using the new method (red) and CALIPSO Level-2 V4 APro files (blue); (f) extinction coefficient of ACA at 532 nm; (g) extinction coefficient of ACA at 1064 nm; (h) ACA and cloud layer from the CALIPSO Level-2 VFM product.
Remotesensing 11 02396 g004
Figure 5. Day- and night- time comparison of the global annual mean distribution of low-level cloud fractions (a(1)-(2)), cloudy-sky ACA occurrences (ACAOC, b(1)-(2)), ACA optical depth (ACA optical depth (ACAOD), c(1)-(2)), and (d) is the global annual mean distribution of OMI daytime ACAOD.
Remotesensing 11 02396 g005
Figure 6. Global distribution of the seasonal mean ACAOC for all aerosol types (left column), pure dust and polluted dust aerosols (middle column) and smoke and polluted continental aerosols (right column).
Remotesensing 11 02396 g006
Figure 7. Global distribution of the seasonal mean ACAOD for all aerosol types (left column), pure dust and polluted dust aerosols (middle column) and smoke and polluted continental aerosols (right column).
Remotesensing 11 02396 g007
Figure 8. (a) ACAOC line chart with latitude. (b) ACAOD line chart with latitude. (c) Vertical distance between the ACA and cloud (VDAC) line chart with latitude. (d) ACA geometrical thickness (AGT) line chart with latitude.
Remotesensing 11 02396 g008
Figure 9. Positional relationship between the aerosol and cloud layers in the dust and smoke area with longitude.
Remotesensing 11 02396 g009
Table 1. ACAOC and ACAOD data from different regions in the night- and day-time.
GlobalEastern AsiaSmoke RegionDust Region
ACAOCDayDJF0.0980.3260.4960.237
MAM0.1480.5810.4120.395
JJA0.1470.2990.5750.646
SON0.1160.2330.5160.349
NightDJF0.1170.3770.5200.240
MAM0.1740.6500.4710.413
JJA0.1730.3500.5880.677
SON0.1390.2750.5830.407
ACAODDayDJF0.1180.2180.2380.185
MAM0.1430.3110.1990.264
JJA0.1490.2340.2440.353
SON0.1400.2120.2550.237
NightDJF0.1170.2110.2420.178
MAM0.1400.3080.2120.260
JJA0.1510.2340.2190.357
SON0.1390.2120.2360.220

