1. Introduction
The mangrove ecosystem is a wetland forest which is globally distributed at the sea–land interface in tropical and subtropical coastal environments, usually sheltered in deltas, lagoons, rivers and estuaries. Ecologists have been questioning why mangroves have latitudinal limits, and which variables are affecting their distribution [
1,
2,
3].
Several authors observed the spatial agreement of specific values of Sea Surface Temperature (SST) isotherms and mangrove limits for many regions in the world [
4,
5,
6]. These studies revealed the influence of SST in determining mangrove distribution limits. Thus, Duke et al. [
4] suggested that mangroves are generally restricted to the SST winter isotherms around 20 °C, while Woodroffe and Grindrod [
5] proposed a temperature of around 15 °C. However, all authors highlighted that the Eastern South America mangrove limit is an exception to the global pattern of SST isotherms.
One can argue how SST can affect mangrove distribution. First, it is required to know that mangrove tree species are dispersed exclusively by water (mostly marine) due to the properties of their propagules [
7], from short to long distances [
8,
9]. During the dispersal stage, water temperature is an influential variable that can regulate seedling growth of mangrove propagules [
10,
11]. The propagules’ viability and seedling growth are conditioned by favorable temperatures, where low SST can initially already reduce or inhibit their germination or rooting and establishment [
10,
11]. In short, when mangrove propagules are transported by seawater, the main variable is the SST, which determines the success or failure of the establishment of mangrove propagules in new lands. This causes low values of SST to act as a barrier to mangrove expansion. Recently, a study revealed that the minimum SST decreases with higher latitudes in Eastern South America, for which it seems to be a prominent predictor of mangrove limits [
12].
However, recently, the absolute daily minimum and below-zero air temperatures have received more attention in studies on mangrove distribution limits, for instance in the southeast of the United States [
13,
14,
15,
16] and globally [
2], whereas daily SST data are being poorly evaluated at regional scales in mangroves. In this sense, there is a lack of detailed study analyzing seasonality patterns of SST at the limits of mangroves and quantifying daily occurrences of chilling events of SST at high resolution. For instance, the SST derivates used as a proxy of chilling events is the mean annual SST [
1,
17] and the monthly mean of the minimum SST [
1,
12].
In Eastern South America, Soares et al. [
18] suggested multiple limiting factors (or proxies of factors) inhibiting mangrove expansion to higher latitudes, namely, mean air temperature, annual mean SST, the occurrence of frost events, and the northward-directed longshore drift. Nevertheless, other authors consider also other non-climate variables, such as dispersal constraints and unavailable habitat, to better explain the absence of mangroves beyond their limit in Eastern South America [
2,
3]. Contrasting literature statements [
1,
2,
3,
18] on the limiting factors reflects our lack of understanding on why mangroves do not cross their current limit in Eastern South America.
About 70 km south of the mangrove limits in Eastern South America, there is a narrow river parallel to the coastline forming a small lagoon with a marginal vegetation, which seems geomorphologically suitable for wetland ecosystems, but no mangroves have been observed in this site for more than three decades [
18,
19]. Since apparently there is an availability of accessible habitat beyond actual Eastern South American mangrove limits, the absence of mangroves is intriguing. Although the Eastern South American mangrove limit is probably due to dispersal constraints [
17] or multiple factors, including low SST [
18], a detailed analysis of SST data has never been done properly in this region, in order to better understand the limit of mangrove distribution. Currently, daily SST data with high spatio-temporal resolution have been improved, thanks to new products of remote sensing which merge satellite data from several missions and sensors, as well as in situ observations [
20].
With new SST data being freely available, a detailed analysis of SST data in the light of previous laboratory experiments related with low SST stressing mangrove propagules is now possible. For this reason, a better understanding of SST data as a possible limiting factor in mangrove expansion in this region is necessary. Hence, the objective of the present paper is to assess SST data considering occurrences of daily chilling events and to characterize the seasonality patterns of SST fields in Eastern South America mangrove limit (Brazil).
2. Materials and Methods
2.1. Study Area
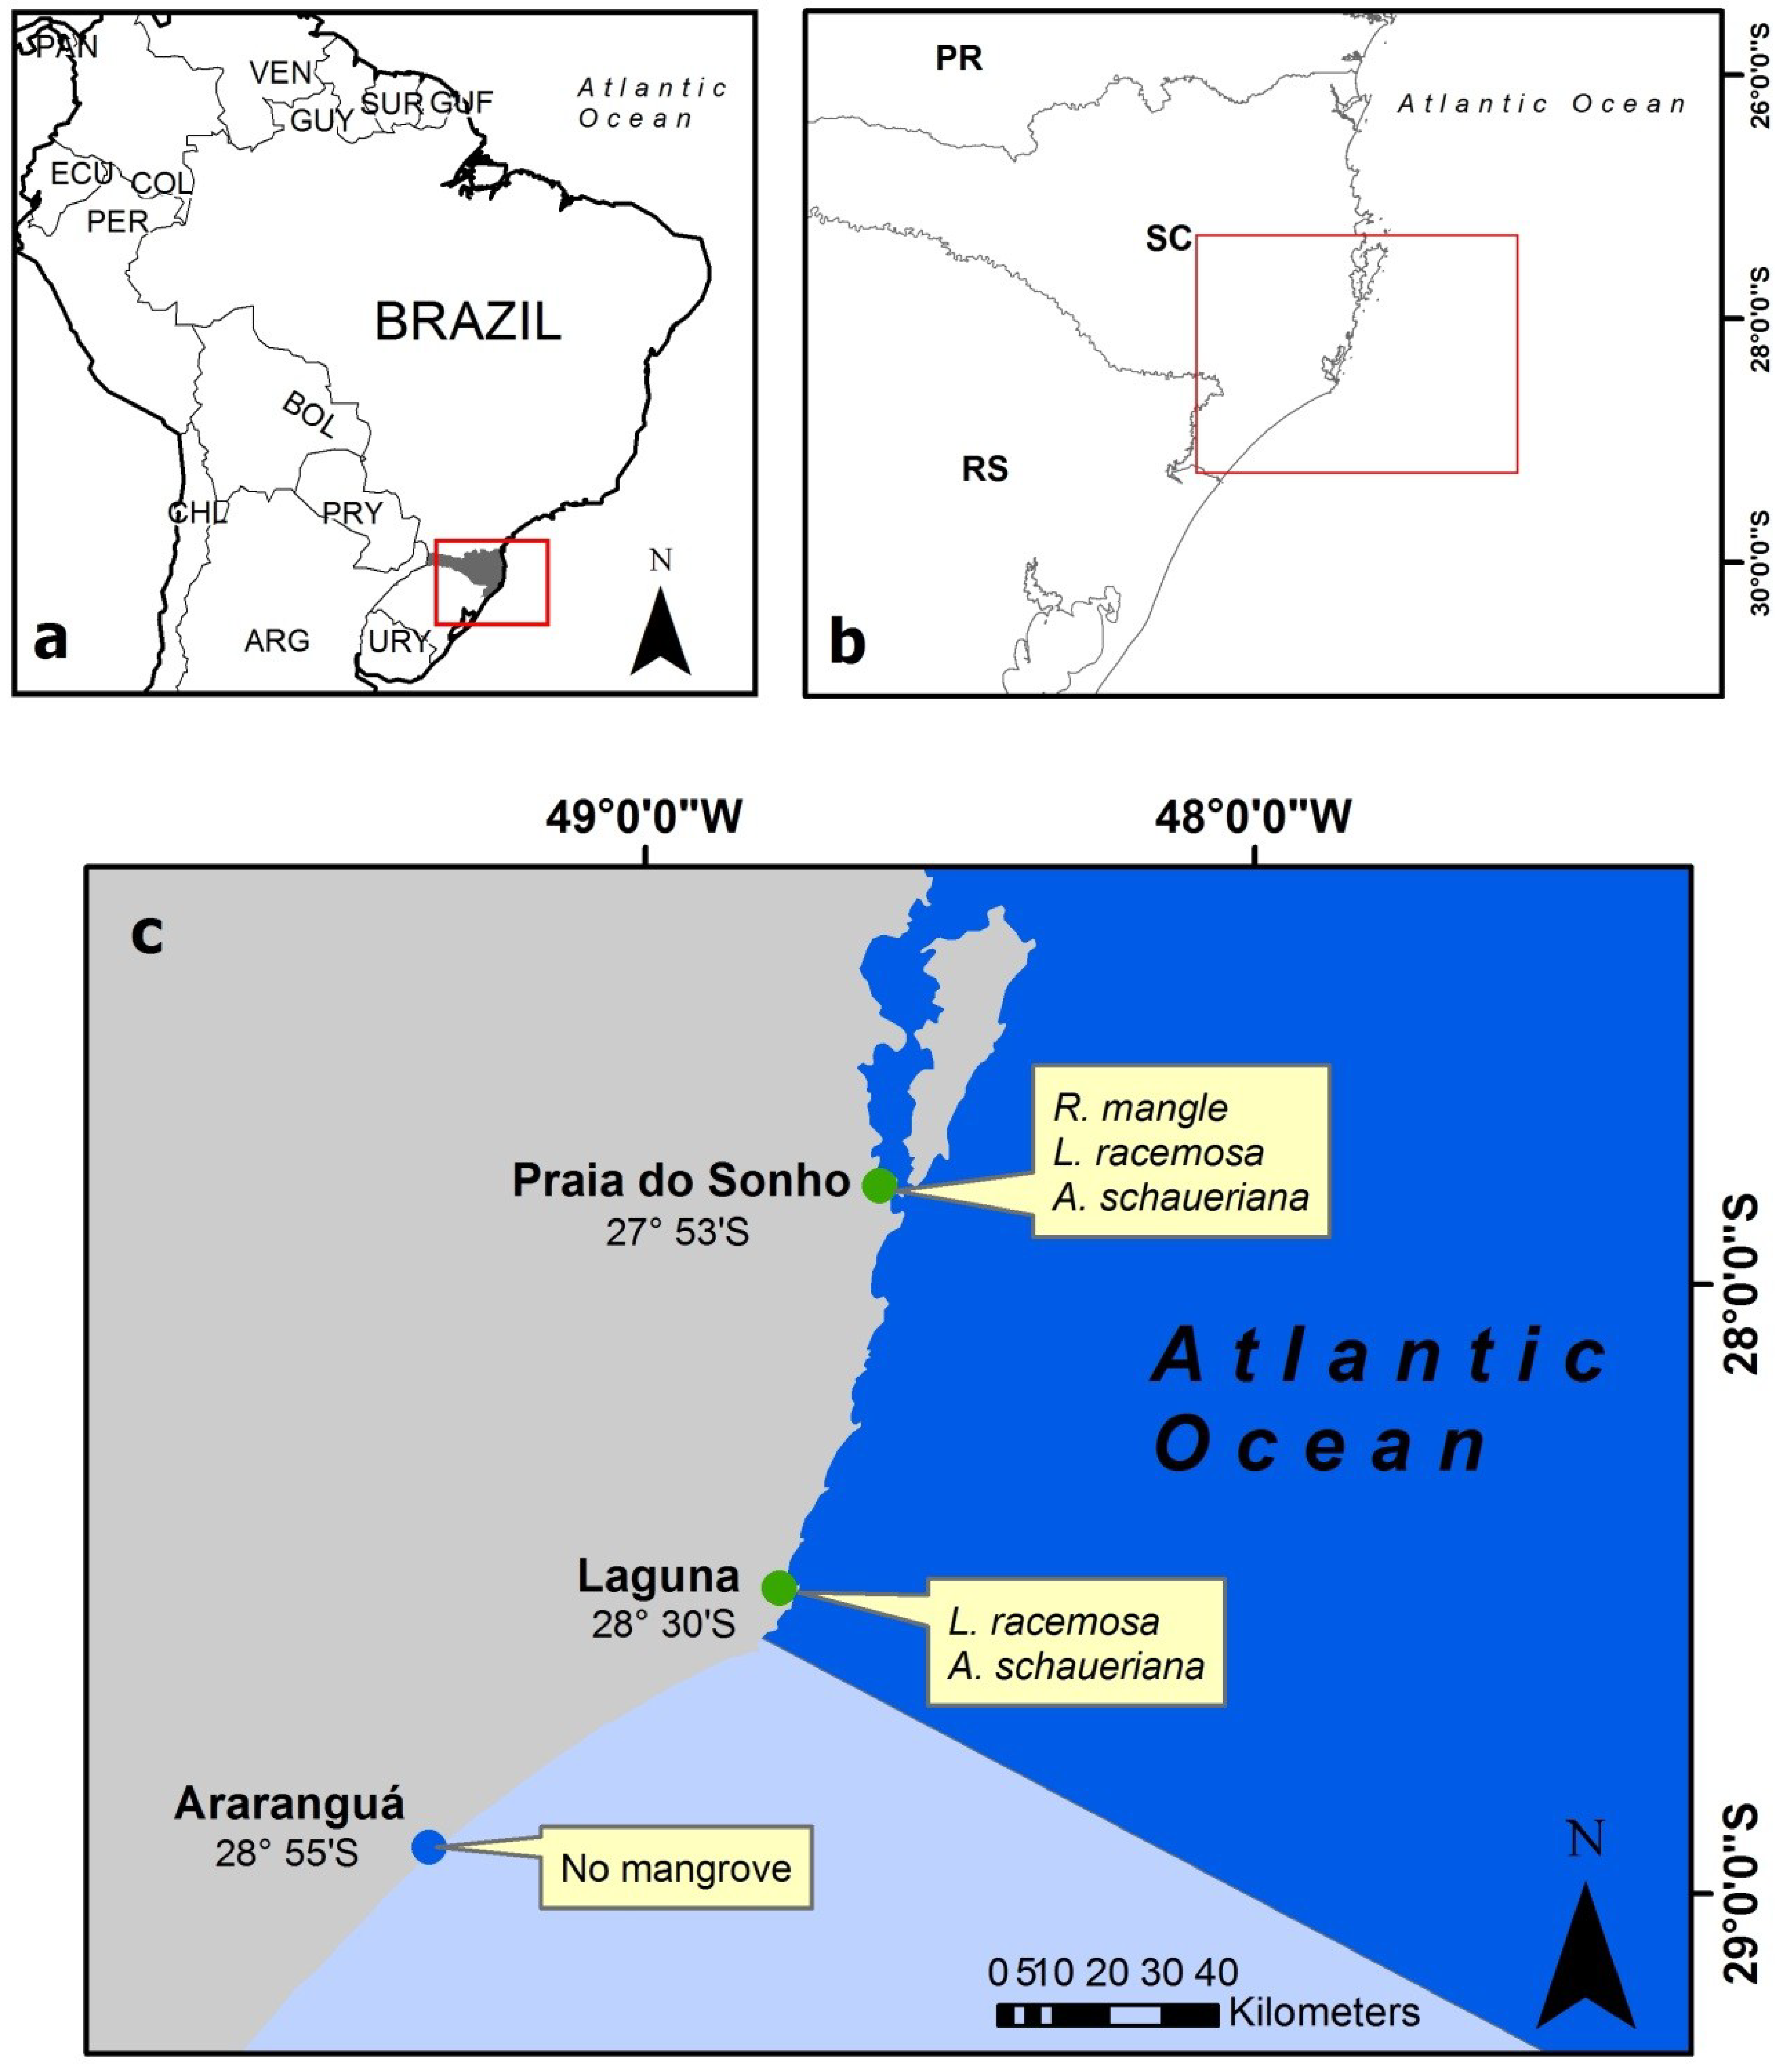
The Eastern South America mangrove limit, also known as the Brazilian southernmost mangrove limit, is located in Laguna (28°30′S) in the state of Santa Catarina, Brazil [
18,
19] (
Figure 1). Our study covers three sites: two are within the current mangrove range, Praia do Sonho and Laguna, and one is beyond the mangrove limit, in Araranguá (28°55′S) (
Figure 1). Therefore, in Araranguá, mangroves are absent; however, wetland vegetation is present [
18]. The distance between Praia do Sonho and Laguna is about 78 km, while Araranguá is about 70 km to the southeast of Laguna.
The geographical limit of
Avicennia schaueriana Stapf & Leechm. ex Moldenke (Acanthaceae) and
Laguncularia racemosa (L.) C.F. Gaertn. (Combretaceae) is in Laguna and the
Rhizophora mangle L. (Rhizophoraceae) limit is in Praia do Sonho (27°53′S), in the city of Palhoça [
18,
19]. All three mangrove trees species are present in Praia do Sonho. In Laguna, only the former two species are found (
Figure 1), with
L. racemosa being dominant and
A. schaueriana represented by few isolated trees only [
18]. The floristic composition of the study sites was described by Schaeffer-Novelli et al. [
19] and by Soares et al. [
18]. The structural development of the mangrove trees decreases according to higher latitudes [
18]. Hence, the Eastern South America mangrove limit in Laguna shows a lower degree of structural development compared to the mangroves north of the limit [
18].
The three study sites are located in a region with warm temperate, fully humid and hot summer (Cfa), according to the Köppen-Geiger climate classification [
21]. Our study areas are located in the same marine province, the Warm Temperate Southwestern Atlantic, but with respect to the marine ecoregions, the two mangrove study sites are in the Southeastern Brazil ecoregion, and Araranguá is localized in the Rio Grande ecoregion [
22] (
Figure 1).
2.2. Sea Surface Temperature
The temperature data was extracted from the Multi-scale Ultra-high Resolution (MUR)-SST Analysis-version 4 (L4) [
20]. This analysis was produced by the Jet Propulsion Laboratory (JPL) from the National Aeronautics and Space Administration (NASA). The data are freely available via the Open-source Project for a Network Data Access Protocol (OPeNDAP) platform.
MUR-SST is provided on a daily basis, since June 2002 to present, and at a longitude-latitude resolution of 0.01 degrees (~ 1 km). Such ultra-high resolution is achieved by combining data from several microwave (MW) and infra-red (IR) sensors, among them the NASA Advanced Microwave Scanning Radiometer-EOS (AMSRE), the US Navy microwave WindSat radiometer, the Moderate Resolution Imaging Spectroradiometer (MODIS) on the NASA Aqua and Terra platforms, Advanced Very High Resolution Radiometer (AVHRR) on a number of National Oceanic and Atmospheric Administration (NOAA) satellites, as well as in situ SST observations from the NOAA iQuam project.
The advantage of merging these complementary products relies in the fact that the IR presents high spatial resolution, but the measurements are affected by cloud coverage. Due to the reflectance promoted by clouds and water vapor, the retrieval of the real SST value may be biased and so the accuracy is reduced. Additionally, an undetected cloud is often found at the edges of the cloud cells which also may affect the SST accuracy. On the other hand, MW does not suffer this limitation and can improve the IR measurements, though it presents much coarser spatial resolution [
20]. Some other issues related to the SST data must be considered, since the reflectance captured by the sensors from the satellites is usually affected by suspended matter and various particles of the shallow coastal waters in which the reflectance of sunlight by these materials interferes in the radiometric determination of the SST. Thus, the SST coastlines near mangroves are the most difficult areas to accurately estimate, due to the high turbidity of river, lagoon and estuary waters. Then, to improve the estimative power of the SST, using several satellite images and sensors, in situ observations were taken to calibrate the MUR data, thus reducing error [
20,
23]. The data description from the provider is found through the following link:
https://podaac.jpl.nasa.gov/dataset/MUR-JPL-L4-GLOB-v4.1.
For a complete description of MUR-SST methodology, the reader is referred to Chin et al. [
20]. In short, these authors make use of wavelet-based multi-scale signal expansion incorporated into a Multi-Resolution Variational Analysis (MRVA) scheme. The authors argue that this method is unique in addressing irregularity in measurement locations and scale-dependent interpolation issues, and as a consequence, the MUR-SST data present two main strengths as compared to the other available L4 SST datasets: (i) there is a better preservation of the spectral power in the SST measurements, and thus all SST features observed in the data are indeed due to the measurements; (ii) this is a “grid-less” analysis due to the use of a continuous basis function, which preserves the original coordinates of the measurements. These two advantages are illustrated in the JPL webpage (
https://podaac.jpl.nasa.gov/Multi-scale_Ultra-high_Resolution_MUR-SST).
We have calculated monthly means from January 2003 to September 2018 by making the grid-point average of the respective daily fields within a certain month. Seasonal fields, namely summer, autumn, winter and spring, were calculated as the averages of January–February–March, April–May–June, July–August–September and October–November–December, respectively. All data processing and plotting were performed using Python 2.7.0 executed under in the Linux operating system (Ubuntu 16.04).
2.3. Chilling Events
We considered, as chilling events of SST, the values of ≤15 °C, ≤16 °C and ≤17 °C. These three values can be considered as three levels of intensity, and the number of occurrences of these daily temperatures is the frequency of such an event. Based on the scientific literature (see
Section 4 for more details), these values were deemed to inhibit or reduce the seedling growth of the mangrove propagules, which we consider herein as chilling events. For example, propagules of
A. schaueriana exposed to a water temperature of 15 °C did not germinate [
10]. Moreover, the mean SST of the coldest month in Araranguá being
circa 17 °C, a temperature of ≤17 °C was used as a reference for a chilling event (
Table 1), since mangroves were reported absent from this site for decades [
18,
19].
Thus, the intensity of such events is represented by the temperature values, with lower values being more intense, and the frequency by the number of occurrences of chilling events observed along the years. These are the two metrics that are known to reflect factors in geographical distribution of species [
24].
The frequency of low SST data was determined by the number of daily occurrences of chilling events that happened per year and by the cumulative daily occurrences over the studied years (June 2002 to September 2018). In order to evaluate and compare different sites, we used the same time span of the SST data for all three sites. This procedure allowed us to investigate differences between the studied sites.
3. Results
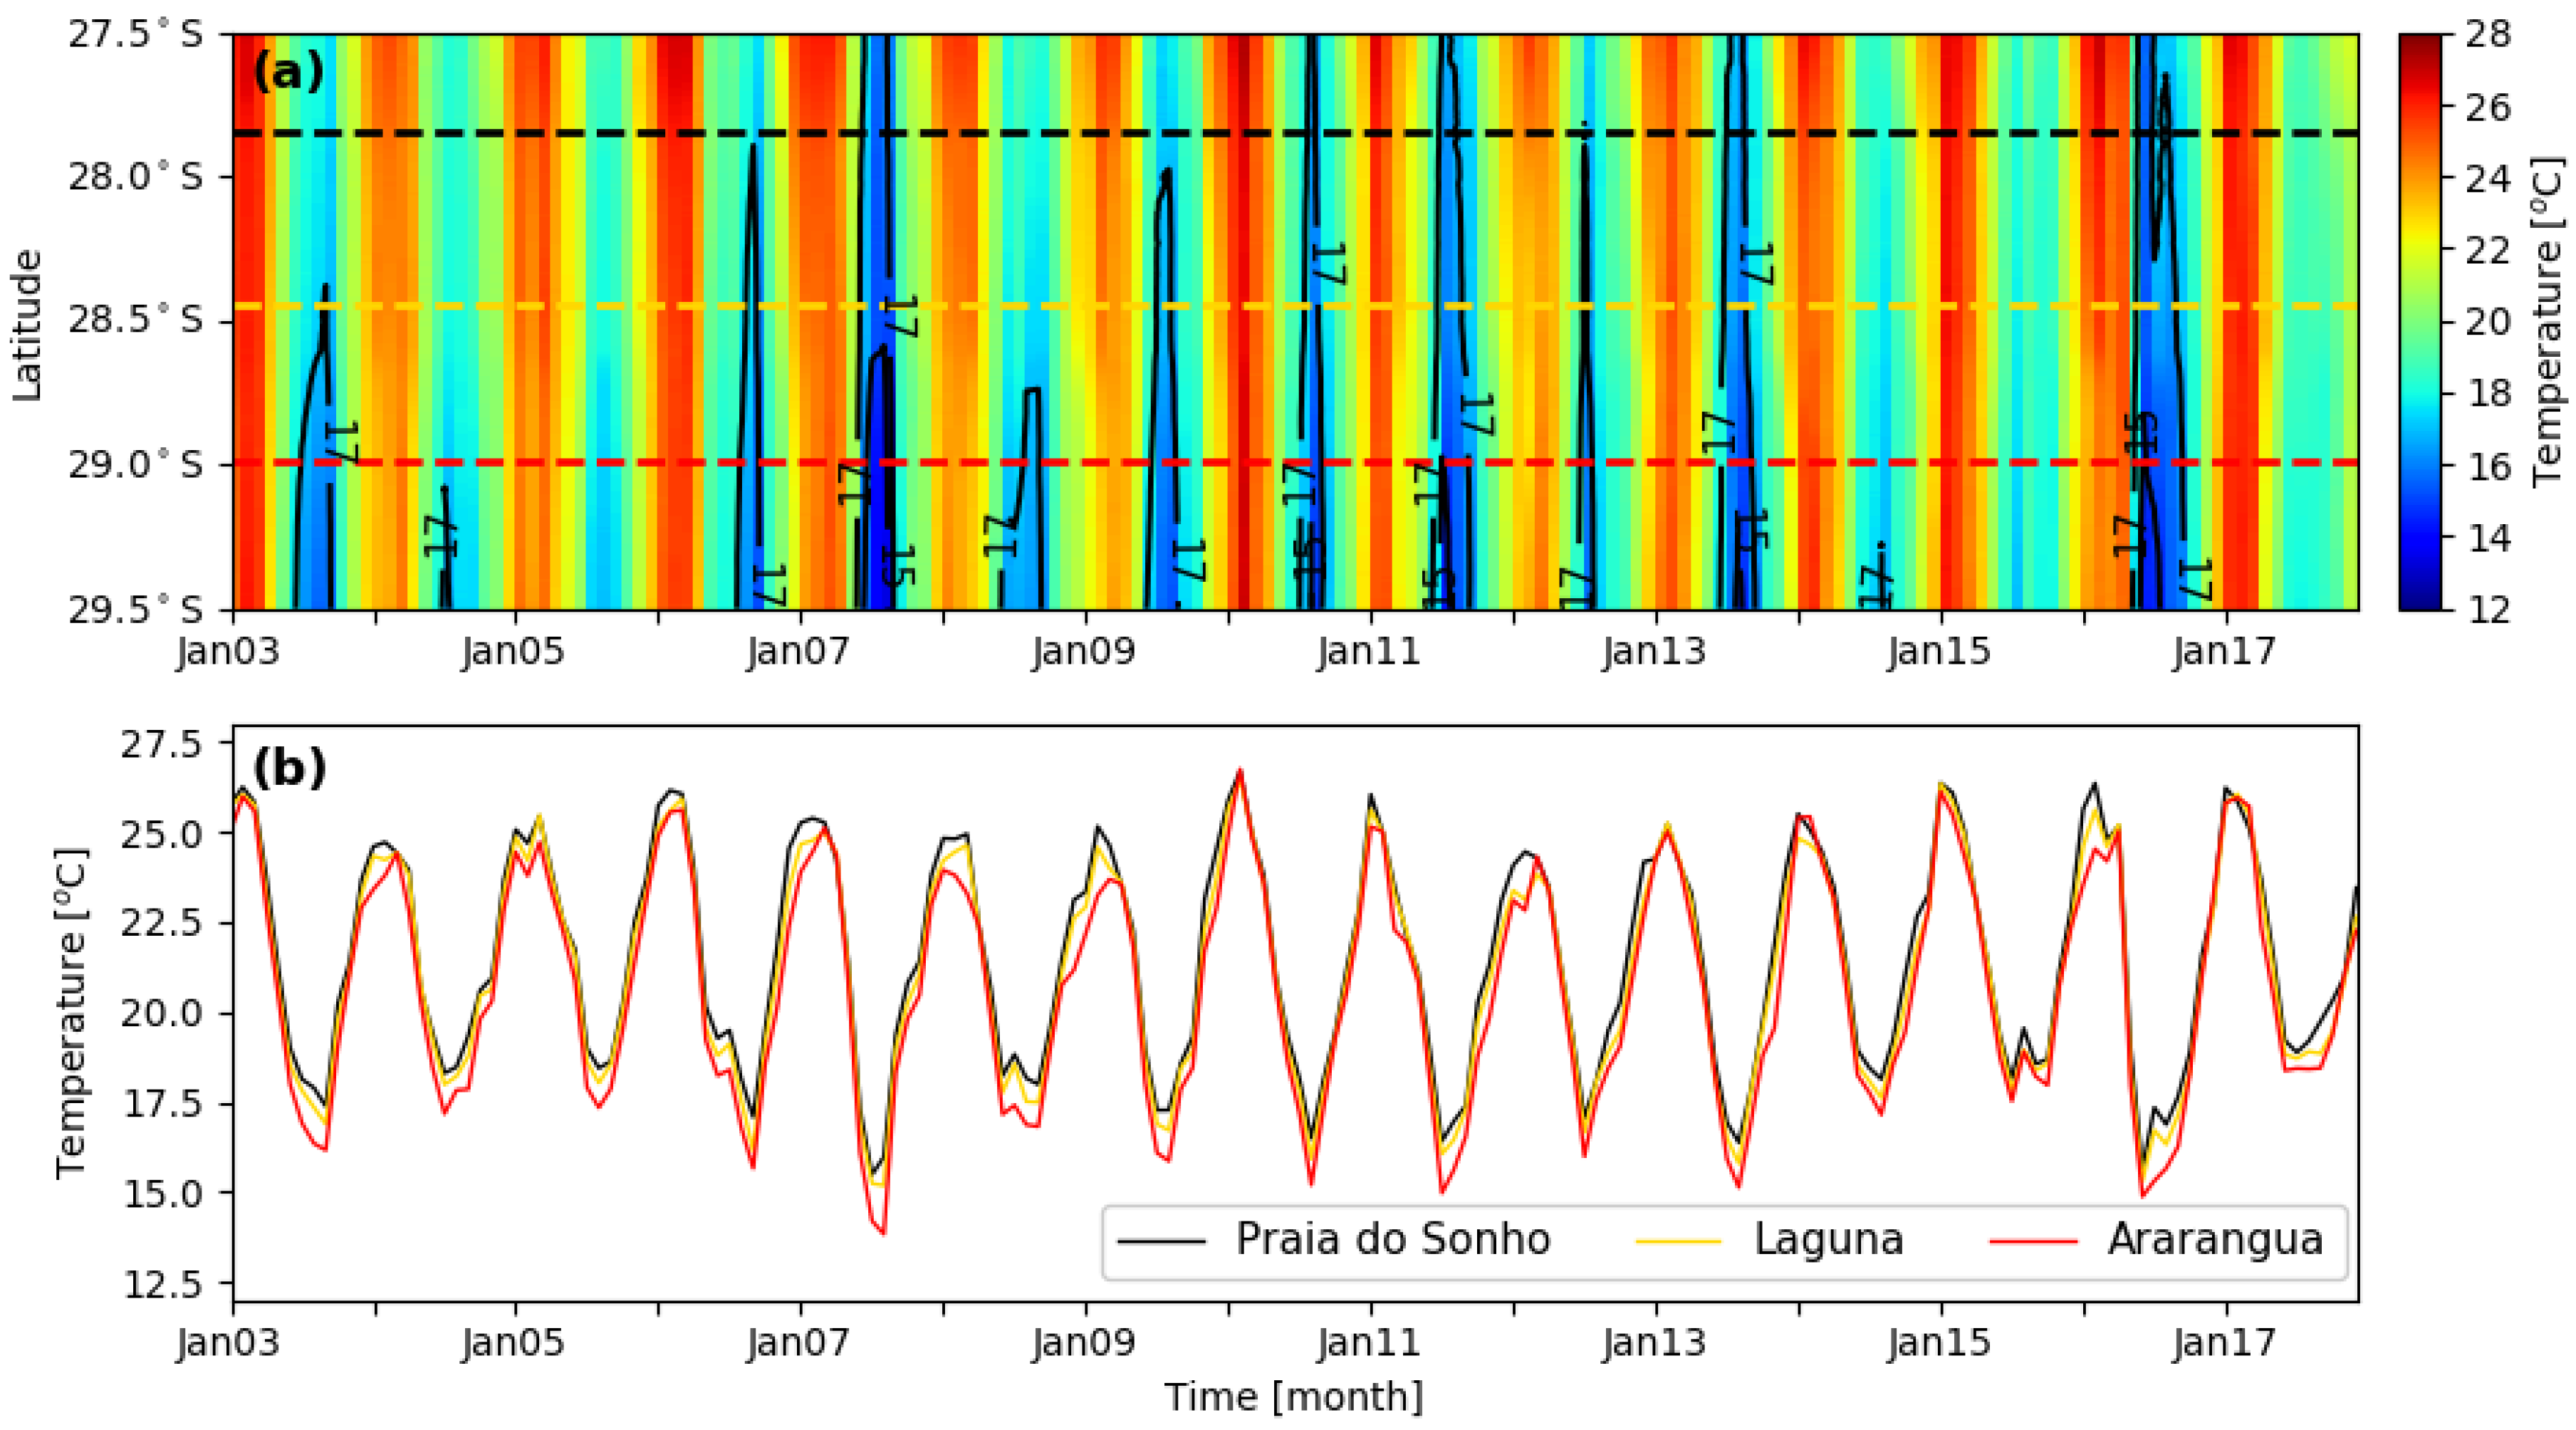
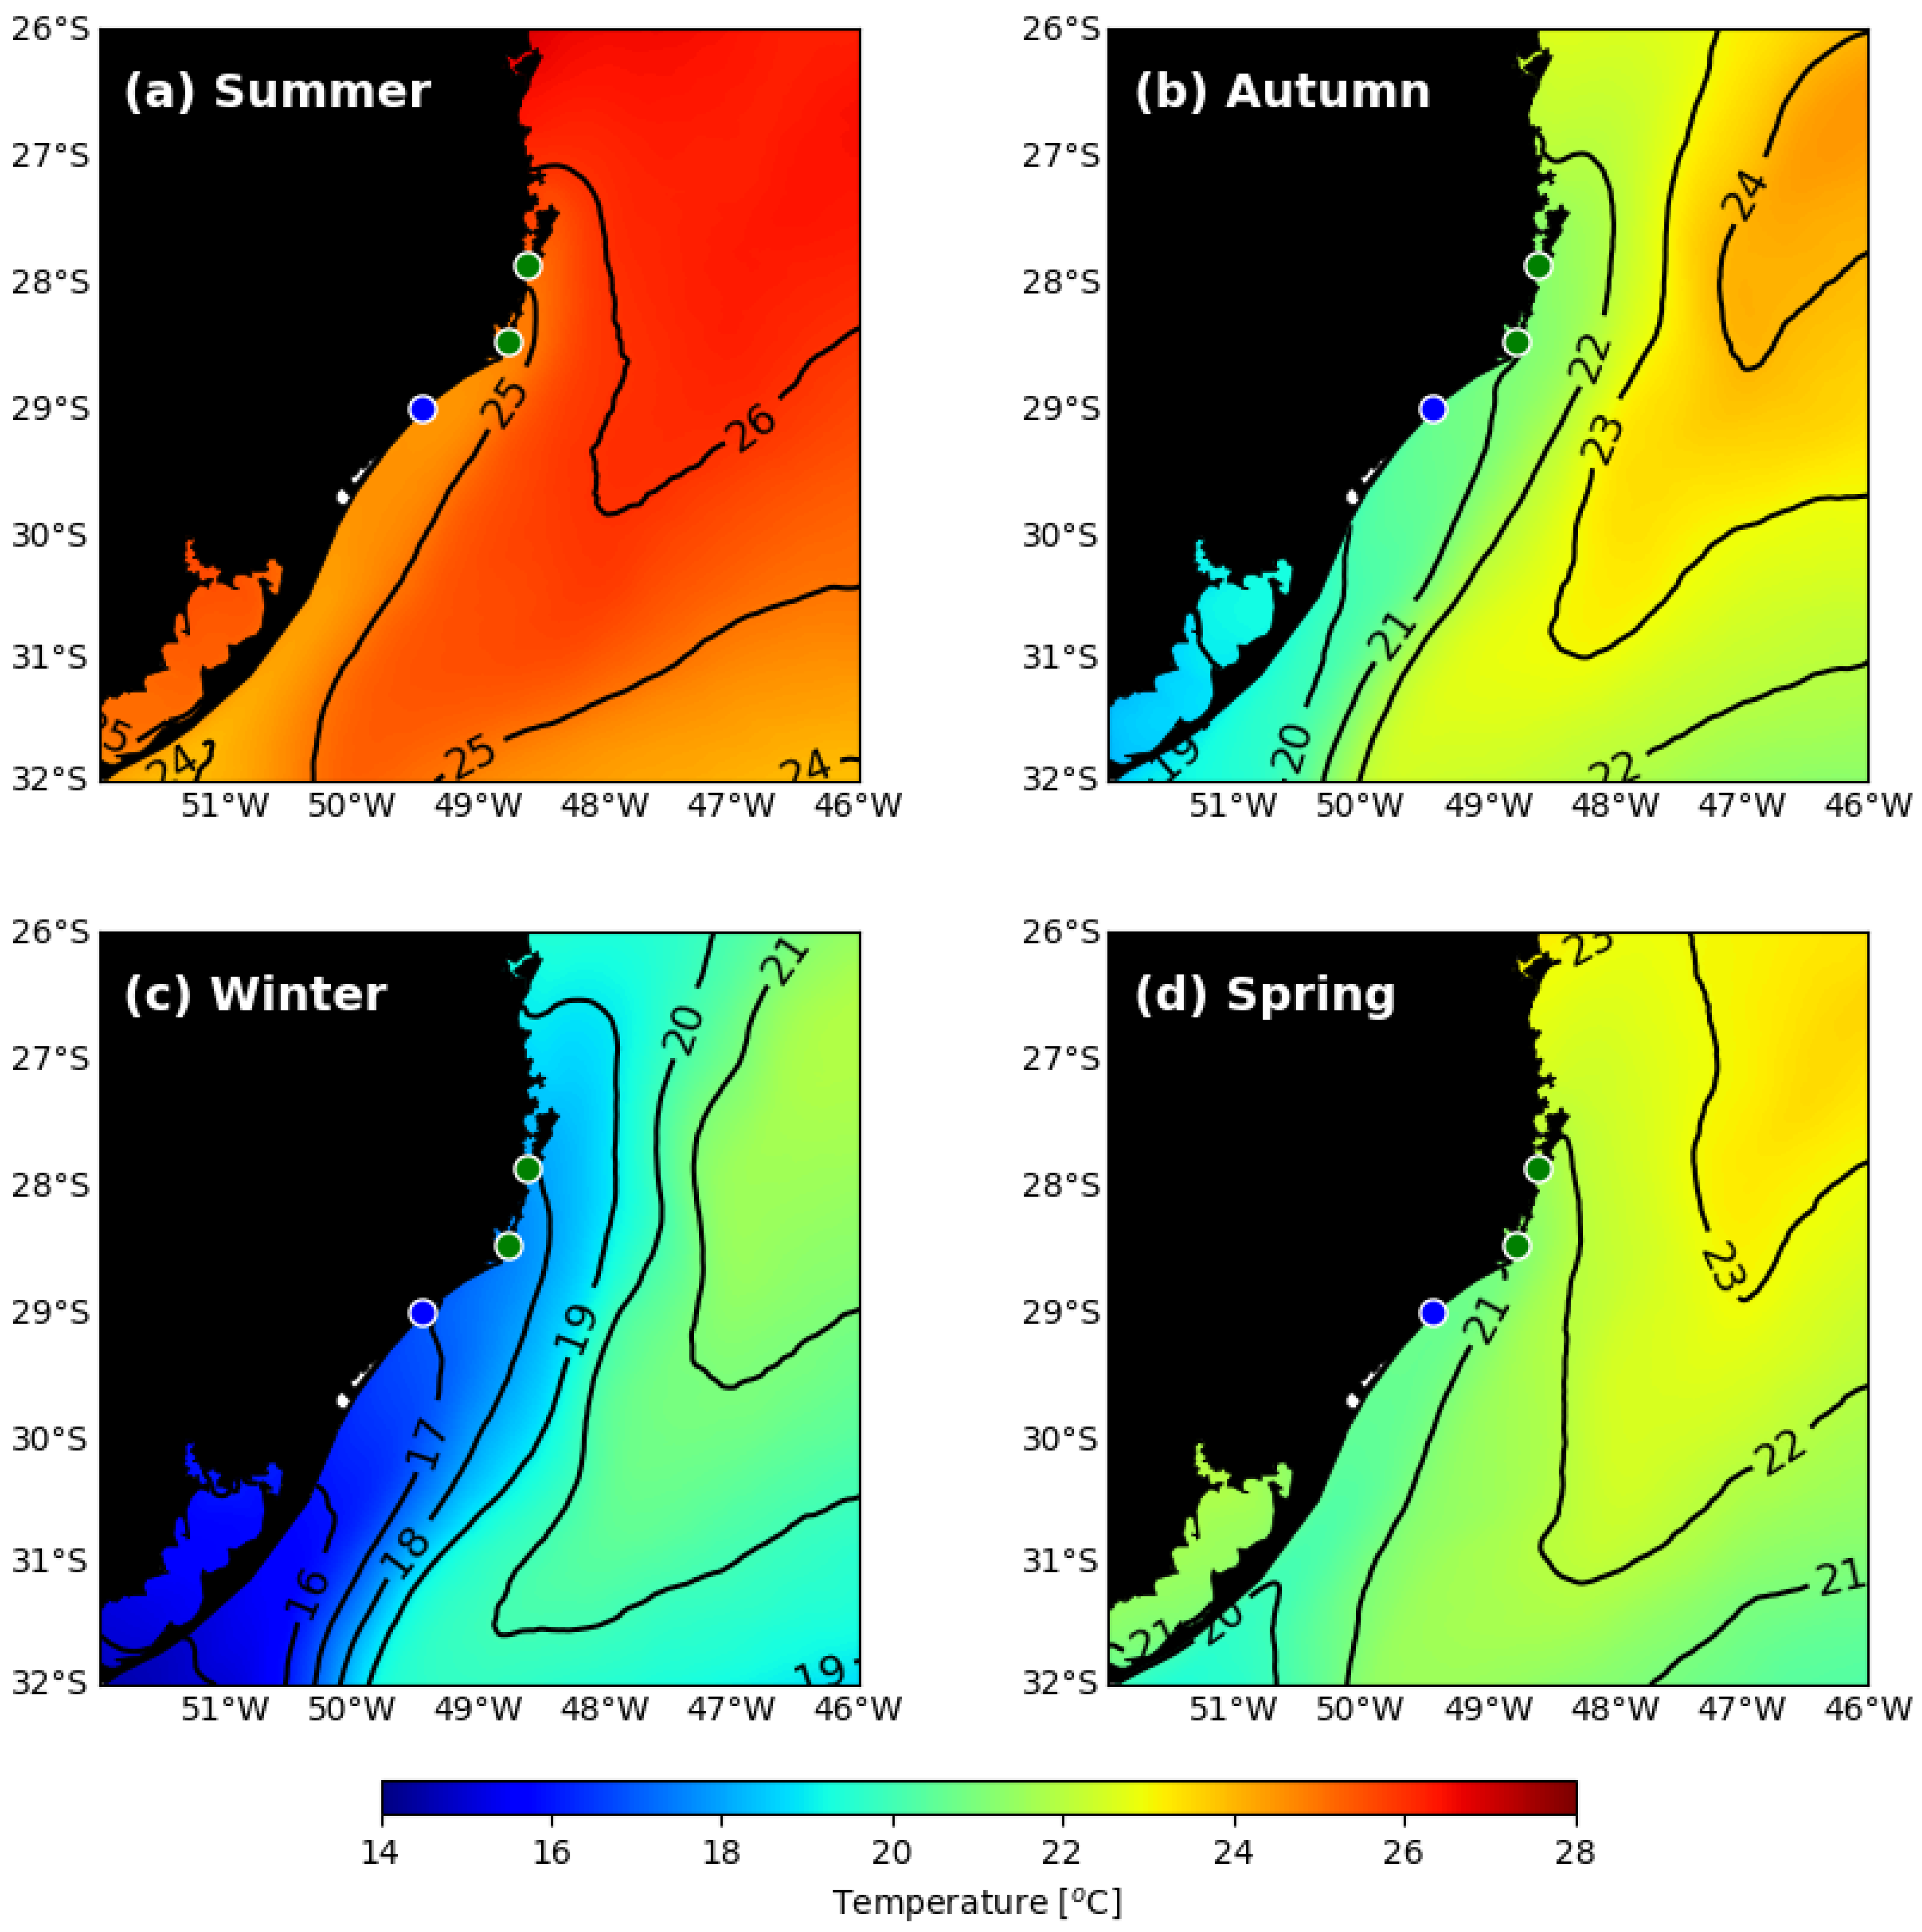
The values of the SST isotherm were expectedly different according to the season of the year and location (
Figure 2 and
Figure 3). The lowest values during the winter mean of SST (and absolute minimum daily SST) were 17.90 °C (14 °C) in Praia do Sonho, 17.54 °C (13.13 °C) in Laguna and 16.86 °C (11.81 °C) in Araranguá (
Table 1). The SST isotherm in autumn and in spring are intermediate, reaching between 21 °C and 22 °C in Laguna and Praia do Sonho and between 20 °C and 21 °C in Araranguá (
Figure 2). During summer, all studied sites present SST higher than 24 °C (
Figure 2). The temporal monthly variability of SST data for the three sites is similar, though Araranguá is marked by colder temperatures during almost the entire time span, being more pronounced in winter (
Figure 3).
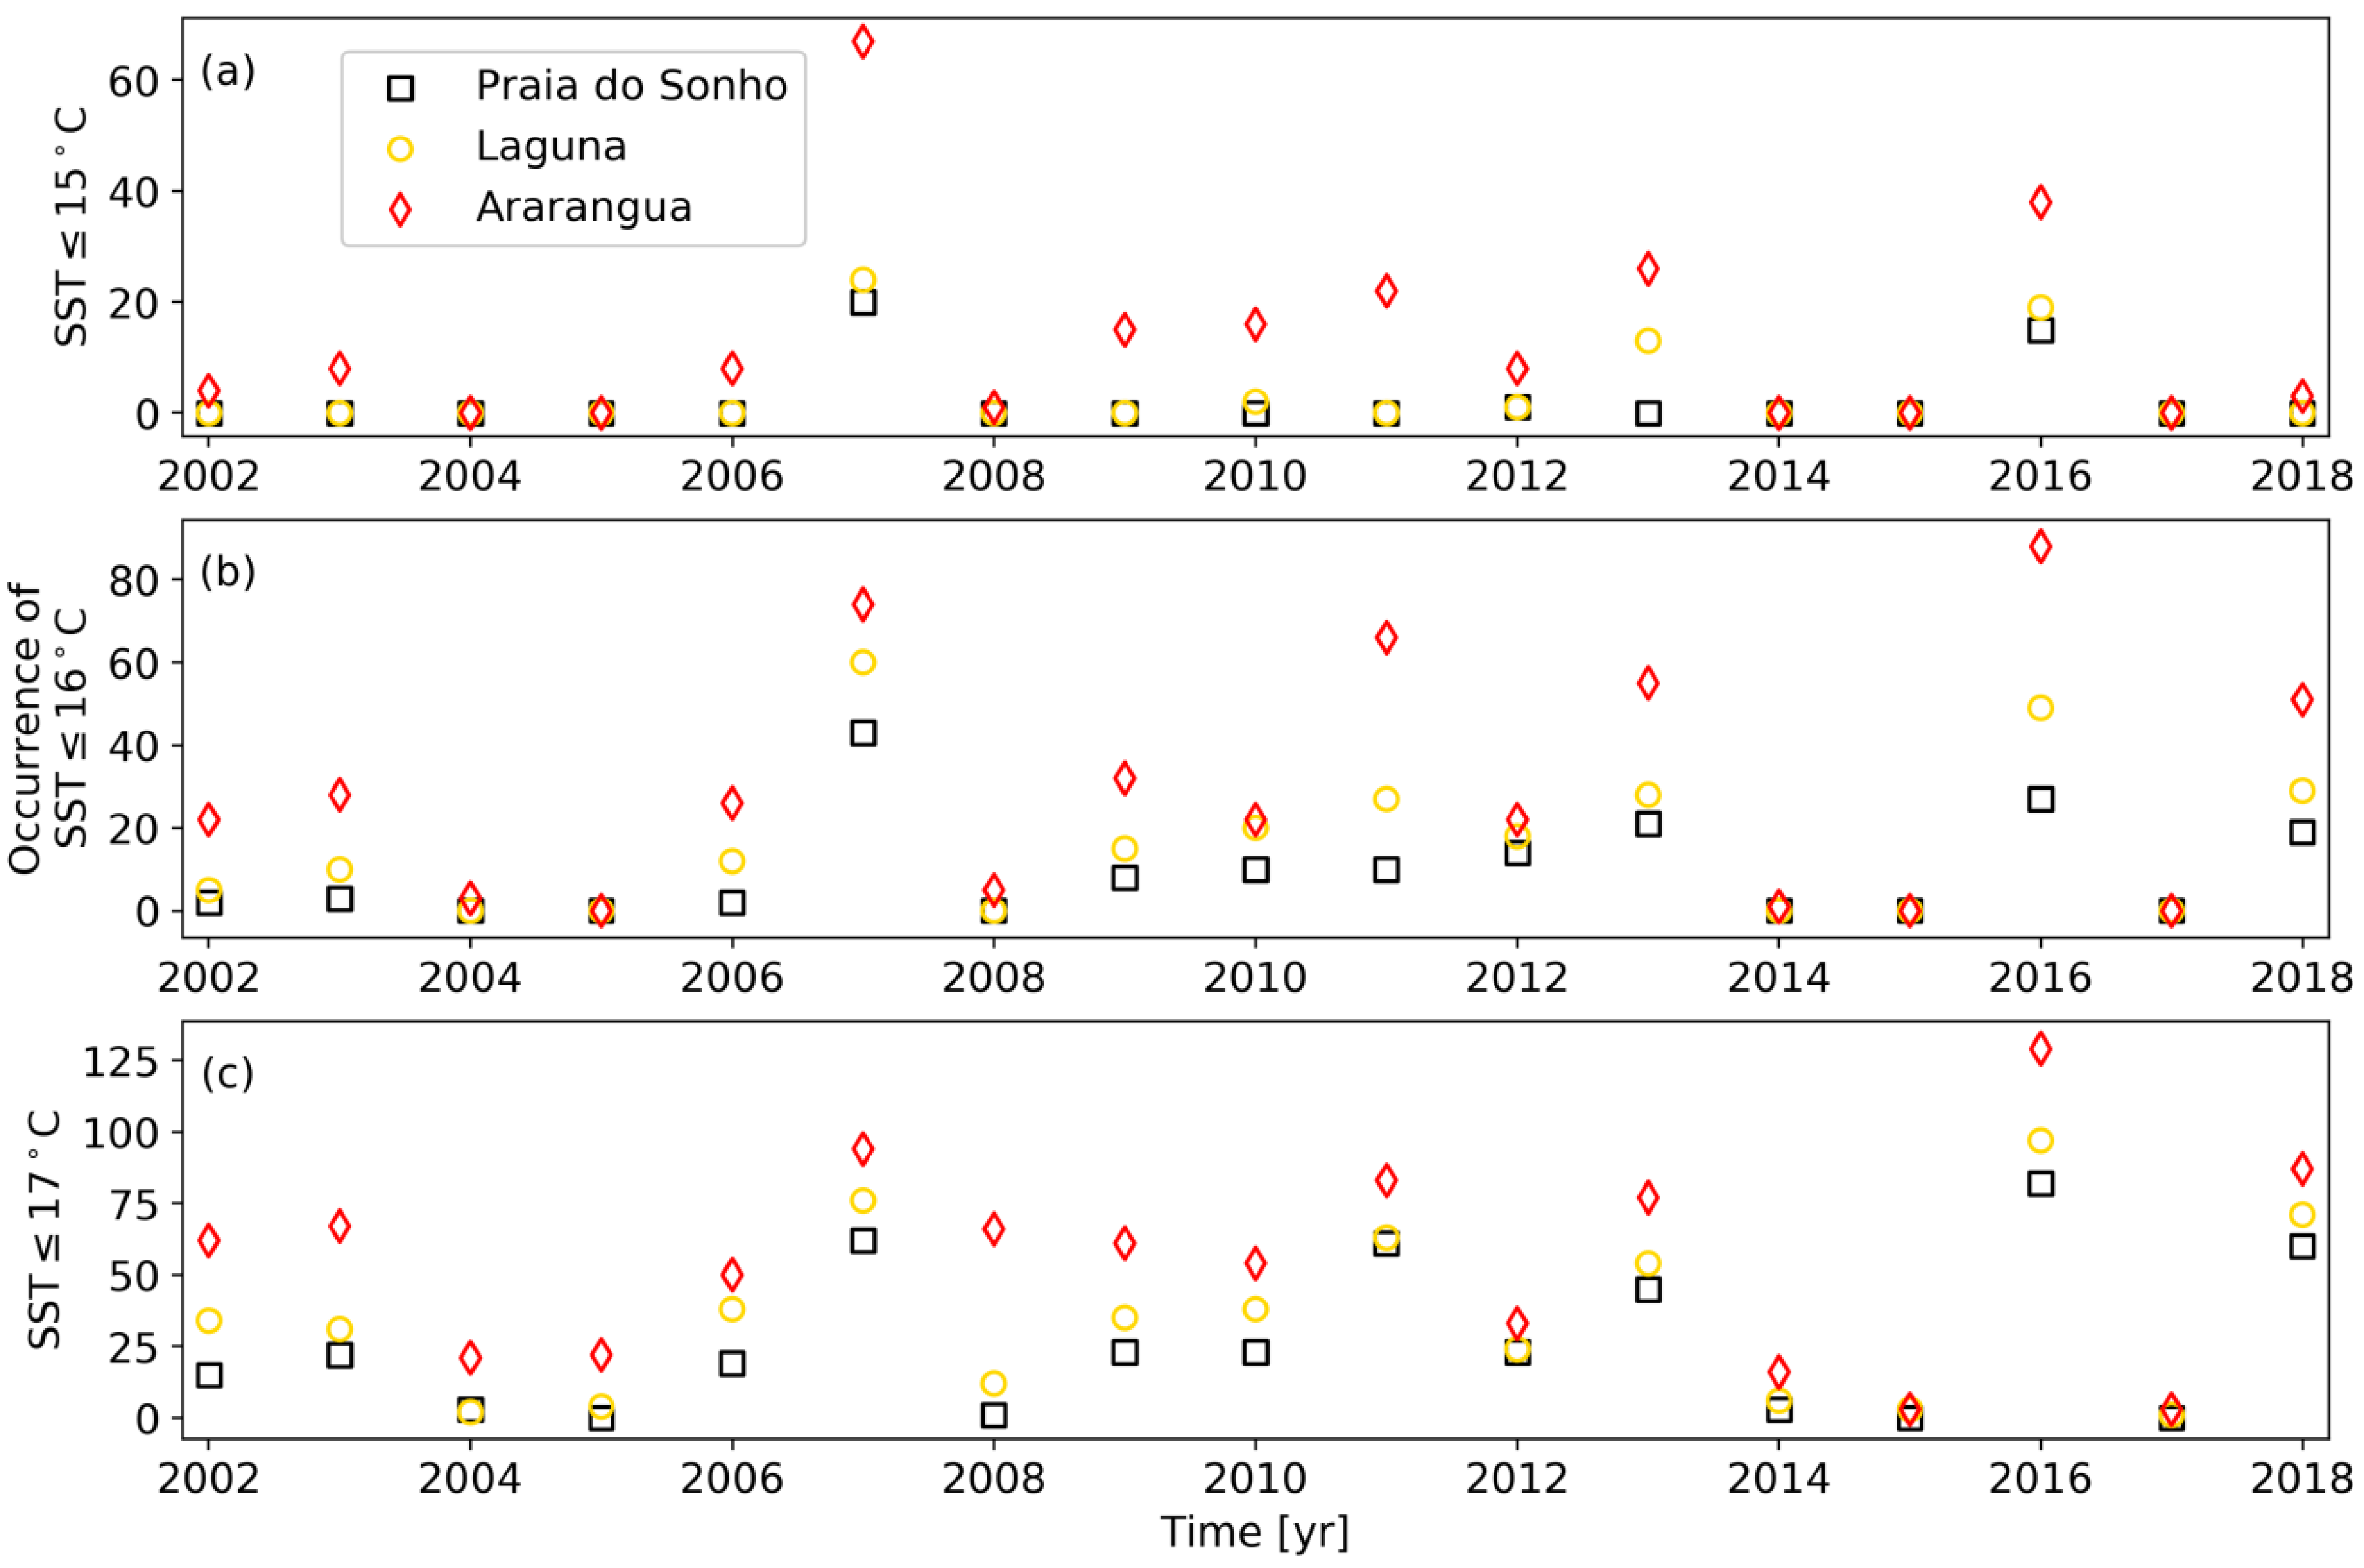
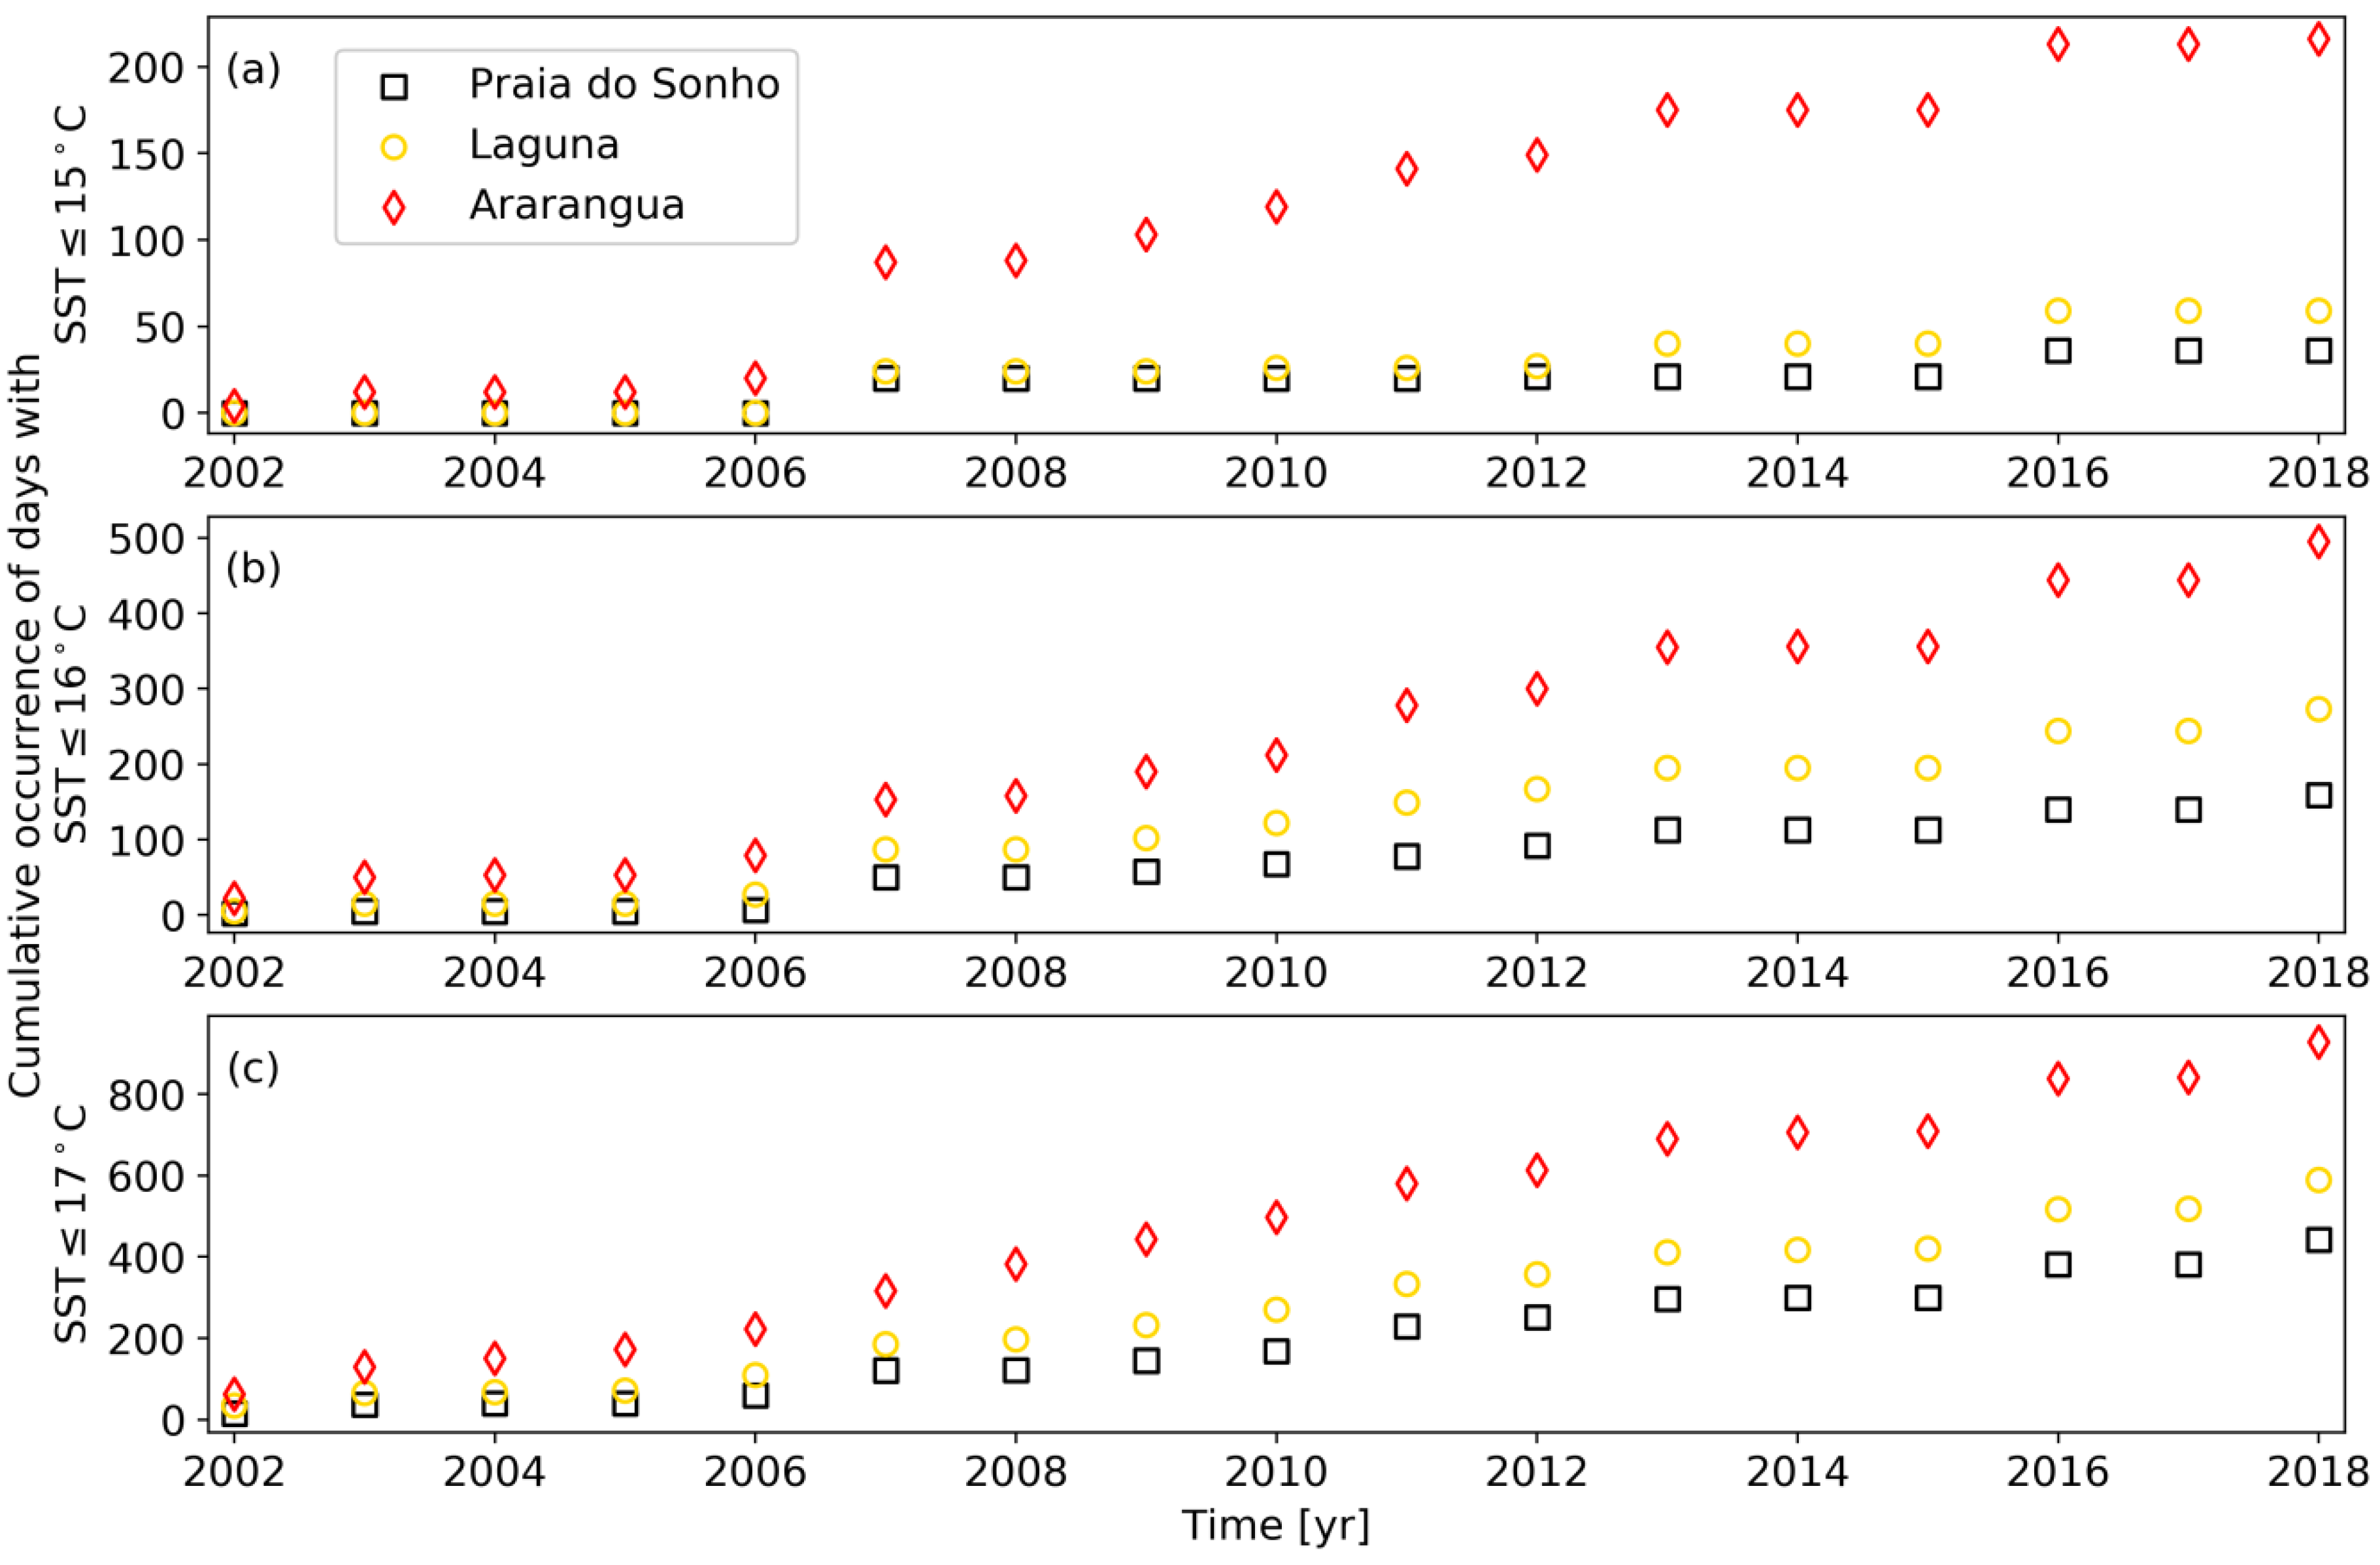
We evaluated the occurrences of chilling events from data shown in
Figure 4 and
Figure 5. Araranguá showed a higher occurrence of chilling events for SST than the other two mangrove sites (
Figure 4 and
Figure 5;
Table 1). In Praia do Sonho, the SST had 36 days with temperatures of ≤15 °C, while Laguna had 59 days of such temperatures, but in Araranguá, we observed temperatures of ≤15 °C for 216 days over a 16-year period (
Figure 4 and
Figure 5;
Table 1). For the SST of ≤16 °C, the cumulative occurrences of chilling events were 495 days in Araranguá, i.e., around 31 days per year, with 222 more days than in Laguna (
Table 1). The two mangrove sites within the mangrove range limit, Praia do Sonho and Laguna, showed less frequent events with an SST of ≤17 °C than Araranguá. For SST equal to or below 17 °C, in Araranguá, 928 days of occurrences of chilling events were found over a 16-year period while Laguna had 589 days and Praia do Sonho had 442 days (
Table 1). Although the chilling events were found mostly during the winter period, low values were also found in other seasons, for example, during autumn. Comparing the two mangrove sites, Praia do Sonho and Laguna, the SST differences are about ≥0.3 °C for the annual mean, winter mean, and mean SSTs in July, August and September. Moreover, Laguna has more chilling events than Praia do Sonho (
Figure 4 and
Figure 5;
Table 1).
On average, SST is lower in Araranguá compared to that in Laguna, and a maximum difference of about 0.76 °C was observed in July, considered as the coldest month. For the entire winter (July, August and September), the mean SST difference is about 0.68 °C (
Table 1). Moreover, within and beyond the mangrove limit, we found higher differences up to 1.32 °C for the absolute minimum daily SST data and 1.29 °C for the mean SST of the 10 coldest days (
Table 1).
4. Discussion
Relatively low SST values were reported to negatively impact seedlings of certain mangrove species [
10,
11,
25]. They can be considered an important limiting factor for mangrove expansion. For the SST, values lower than or equal to 15 °C seem to reflect an important threshold for species distribution [
5]. Empirical experiments with
A. schaueriana propagules showed that no seedling germination occurred when propagules were exposed to a water temperature of 15 °C [
10].
A higher occurrence of chilling events for the SST of ≤15 °C in Araranguá (216 days) was observed; at the same time, these events were less frequent in Laguna (59 days) and in Praia do Sonho (36 days) (
Table 1).
Experimental laboratory research on establishment and early growth of propagules of
Avicennia marina (Forssk.) Vierh. showed that seedlings at an SST of 25 °C developed well, but growth was strongly reduced at a water temperature of 17 °C [
11].
A. marina does not occur in Brazil, but it has a wider latitudinal range than the Brazilian mangrove congeneric species, and hence a threshold for the SST of 17 °C is probably an indication of an acceptable and conservative barrier to the establishment of the mangrove seedlings. In Araranguá, over the studied years, there were about 1.6 times more occurrences of SST of ≤17 °C than in Laguna, and about 2.1 times more than in Praia do Sonho (
Table 1).
The fewer occurrences of SST of ≤15 °C and ≤17 °C in Praia do Sonho may favor the presence of R. mangle, reaching its southernmost occurrence along the Brazilian coastline. Since A. schaueriana and L. racemosa are found in Laguna estuary, no dispersal constraint for R. mangle to reach this estuary is expected either. However, despite its longer capability to float as opposed to L. racemosa propagules, R. mangle is absent in Laguna estuary. More occurrences of chilling events could be an explanation for this absence.
Genetic diversity of
R. mangle (on a basis of microsatellites) was found to be lower in the southern as opposed to the northern Brazilian mangroves [
26]. The authors attributed this pattern to the populations’ recent historical age [
26], a pattern for peripheral populations that was found with other mangrove species elsewhere [
27]. The lower genetic diversity in Brazilian southern populations of
R. mangle can reduce the phenotypic plasticity of this species, the individuals of which become less resilient to constraining factors such as low temperature.
Despite the chilling events being a physiological stress to mangrove plants [
28], experimental research with
L. racemosa propagules showed significant seedling growth even at SST below 15 °C [
10]. Although this advantage can tolerate lower SST than
A. schaueriana [
29], the
L. racemosa propagules have a shorter viability period while floating (and dispersing) than other mangrove species [
7], which contributes to restrict dispersal, and hence range expansion [
4].
Nevertheless, we observed that the
L. racemosa population is dominant and only a few isolated trees of
A. schaueriana were found in Laguna estuary [
18]. This means that
L. racemosa contributed more to expanding mangrove limits in Eastern South America than
A. schaueriana. This dominance of
L. racemosa at the Eastern South America mangrove limit [
18] can be interpreted by higher resistance of
L. racemosa to low SST, enabling seedlings to growth, as observed in experimental studies [
10].
5. Conclusions
The use of new products of SST data in our study allowed us to analyze spatio-temporal series of chilling events which affect the mangroves propagules at high resolution. The latest works for mangrove on a large scale used the SST temporal scale for a 5-year period (from 2009 to 2013) [
2] and an 8-year period (from 2002 to 2009) [
12]. For this reason, we used a historical SST data with 16 years (June 2002 to September 2018) that can be considered within an appropriate time period. Moreover, our study makes use of state-of-the-art SST data, with finer spatio-temporal resolution compared to previous studies. To our knowledge, this is the first research considering daily SST data affecting mangrove ecosystems.
For sure, there are multiple factors constraining mangrove expansion, and they were summarized in previous studies [
2,
18]; however, here we focused our analysis on SST data constraining mangrove expansion and abundance at the distribution limits. In this study, we demonstrate the usage of SST data with respect to mangrove dispersal. Each mangrove species has a threshold of SST that can inhibit primordial physiological functions of the plants and a response to seasonal SST patterns. Based on the literature, we know that the
R. mangle and
A. schaueriana propagules can be affected by low SST of around ≤17 °C, and no seedling germination occurred in
A. schaueriana when exposed to SST of 15 °C [
10]. For SST, comparative evaluation showed that in Araranguá (beyond the mangrove limit), there was a higher occurrence of chilling events (SST of ≤17 °C) than in the two sites having mangrove cover, at lower latitudes. The higher frequency of such chilling events (SST of ≤17 °C) may constrain mangrove expansion, at least for
R. mangle and
A. schaueriana. For narrowing down this explanation, the daily temperature patterns should be matched with propagules production phenology, for which no historical or retrospective data are available.
On the other hand, the
L. racemosa propagules are more physiologically tolerant to SST of ≤15 °C [
10]. For this reason, another explanation, instead of low SST, is needed; for instance, unfavorable directions of sea currents [
30] consequently dispersal constraint [
2,
18] seems a possible explanation. However, the dominance in abundance of the
L. racemosa population at the mangrove limit (Laguna) can be explained by the species’ resilience to low SST while
A. schaueriana is less tolerant and occurred with few isolated individuals. Moreover,
L. racemosa propagules have a shorter viability period while floating when compared with the other two species [
7], which renders long-time dispersal difficult and epic colonization events rare.
For the future, we urge more research on the influence of low SST on the viability of mangrove propagules for different species and populations in different geographical sites, since the relative importance of ecological factors may be different (and hence also response to environmental change). We call for sampling propagules at the Eastern South America mangrove limits in Laguna and Praia do Sonho, to initiate physio-ecological studies, since respective propagules are likely to be more resilient to low SST than the mangrove populations from northern sites. We need to better know the physiological thresholds for low values of SST in regard to the viability and functionality of mangrove propagules. For this reason, laboratory and/or field experiments should be conducted in that direction, for instance, exposing mangrove trees propagules to seawater with different threshold temperatures (controlled in the lab or in different locations at sea), during a typical period in which the propagules stay immersed in seawater. After this exposition, propagules should be planted in appropriate soil in order to test their viability. New physiological studies in regard to SST thresholds influencing propagule viability, aligned with satellite images merged with interpolated in situ data of SST, are a crucial approach to modeling mangrove species distribution.

 ,
, 

