Article

Structural and Spectral Analysis of Cereal Canopy Reflectance and Reflectance Anisotropy

by
Theres Kuester
*,† and
Daniel Spengler
*,†
GFZ German Research Centre for Geosciences, Section 1.4—Remote Sensing, Telegrafenberg, 14473 Potsdam, Germany
*
Authors to whom correspondence should be addressed.
These authors contributed equally to this work.
Remote Sens. 2018, 10(11), 1767; https://doi.org/10.3390/rs10111767
Submission received: 14 September 2018 / Revised: 21 October 2018 / Accepted: 31 October 2018 / Published: 8 November 2018
(This article belongs to the Special Issue Remote Sensing to Assess Canopy Structure and Function)

Abstract

:
The monitoring of agricultural areas is one of the most important topics for remote sensing data analysis, especially to assist food security in the future. To improve the quality and quantify uncertainties, it is of high relevance to understand the spectral reflectivity regarding the structural and spectral properties of the canopy. The importance of understanding the influence of plant and canopy structure is well established, but, due to the difficulty of acquiring reflectance data from numerous differently structured canopies, there is still a need to study the structural and spectral dependencies affecting top-of-canopy reflectance and reflectance anisotropy. This paper presents a detailed study dealing with two fundamental issues: (1) the influence of plant and canopy architecture changes due to crop phenology on nadir acquired cereal top-of-canopy reflectance, and (2) the anisotropic reflectance of cereal top-of-canopy reflectance and its inter-annual variations as affected by varying contents of biochemical constituents and changes on canopy structure across green phenological stages between tillering and inflorescence emergence. All of the investigations are based on HySimCaR, a computer-based approach using 3D canopy models and Monte Carlo ray tracing (drat). The achieved results show that the canopy architecture significantly influences top-of-canopy reflectance and the bidirectional reflectance function (BRDF) in the VNIR (visible and near infrared), and SWIR (shortwave infrared) wavelength ranges. In summary, it can be said that the larger the fraction of the radiation reflected by the plants, the stronger is the influence of the canopy structure on the reflectance signal. A significant finding for the anisotropic reflectance is that the relative row orientation of the cereal canopies is mapped in the 3D-shape of the BRDF. Summarised, this study provides fundamental knowledge for improving the retrieval of biophysical vegetation parameters of agricultural areas for current and upcoming sensors with large FOV (field of view) with respect to the quantification of uncertainties.

Graphical Abstract

1. Introduction

Understanding top-of-canopy crop reflectance is one of the most important issues in the development of robust, transferable and operational methods for crop parameter retrieval based on remote sensing data. The canopy structure is one of the most important factors influencing the top-of-canopy reflectance. However, "canopy structure" is not a fixed single parameter; it is rather determined by many different geometric parameters of the individual plants and their position relative to each other.
Studies about the influence of structural parameters are mainly based on SAR and LiDAR techniques. Synthetic-aperture radar (SAR) is a form of active sensing that allows the physical properties of the ground surface to be measured using microwaves that are largely independent of weather conditions and daylight. In particular, Interferometric Synthetic-Aperture Radar (InSAR) or Polarimetric Synthetic-Aperture Radar Interferometry (PolInSAR) were used to determine the height of vegetation canopies e.g., [1,2,3]. Furthermore, Light Detection And Ranging (LiDAR) with laser scanners has emerged as a powerful, active sensing tool for direct 3D measurement of plant shapes and canopy structures. LiDAR enables obtaining accurate 3D information of plants by measuring the distance between sensor and target. The scales of application range from small plants [4] to entire forest canopies [5]. Numerous studies have shown the benefits of LiDAR for the assessment of 3D plant properties e.g., [5,6,7,8,9].
For optical data, the number of studies about canopy structure is rather limited; in most cases, only the development of the leaf area index (LAI) e.g., [10,11] or the leaf orientation is analysed e.g., [11]. The influence of phenological development hence the change of the plant appearance, for example, is often only investigated by changes in vegetation indices (e.g., NDVI, [12,13], or EVI, [14,15]) or the canopy structure is only indirectly included in the analysis like for the estimation of biomass e.g., [16,17,18] or bio-physical canopy properties e.g., [19,20]. In particular, hyperspectral studies are even rarer. There were Haboudane et al. [21] correlating several vegetation indices sensitive to chlorophyll content to improve the LAI retrieval and Thenkabail et al. [22] proposing narrow band vegetation indices to improve crop-specific estimates of structural parameters like LAI, canopy height and fraction cover. In the recent past, Latorre-Carmona et al. [23] left the idea of indices and developed a method to decompose the top-of-canopy reflectance into its structural and optical components and Dorigo [24] has demonstrated that simultaneous recorded viewings with varying viewing angles from satellite can improve LAI estimations. However, fundamental studies to understand the spectral development of top-of-canopy reflectance for the phenological cycle and the most important structural parameters forming a canopy stand, especially crop stands, such as row spacing, relative row orientation or plant density, are missing. The analysis of these parameters in the form of field experiments is extremely time-consuming and strongly limited to a small number of variations of these parameters. Since the vegetation canopies strongly anisotropically reflect the incident radiation, such measurement experiments lead to a complexity that can hardly be efficiently managed. Nevertheless, some studies have focused on understanding the anisotropic reflectance of vegetation canopies and their BRDF (Bidirectional Reflectance Distribution Function), the function that describes the anisotropy. These studies usually address only the effects along the principal plane e.g., [25,26] or the effects that are caused by the viewing and illumination geometry e.g., [25,27]. Although the importance of the BRDF and its relationship to canopy structure is well known, only a few studies have investigated the dependencies of the structural and spectral properties of the observed canopies within the entire viewing hemisphere e.g., [28,29,30,31]. Schill et al. [28] likewise quantified the temporal differences of canopy anisotropy during a day, and Buchhorn et al. [30] showed the appearance of angular effects even on low-growing vegetated surfaces. Burkart et al. [31] showed that off-nadir viewings cause significant effects on vegetation indices using a UAV-based (unmanned aerial vehicle) goniometer and Roosjen et al. [20] extracted canopy anisotropy from full-frame UAV imagery for the retrieval of biochemical and biophysical parameters. However, reflectance anisotropy is of high importance because the BRDF of each canopy is directly correlated with its structure and most sensors record data from the Earth’s surface apart from the nadir view (e.g., Sentinel-2 with a field of view of 21 [32], or upcoming EnMAP with possible off-nadir acquisition up to ±30 [33]). Furthermore, many new UAV-based imaging techniques have been developed in the last years acquiring with full-frame, where each spatial pixel has a different observation geometry [20,31,34], or with push-broom technique, where the field of view of about 20 e.g., [35] causes pixels with different observation geometry across track.
Another important challenge besides the need to study top-of-canopy reflectance of structurally different vegetation canopies is the acquisition and analysis of realistic BRDF data, since a direct measurement of the BRDF is not possible. Instead, numerous individual reflectance measurements from different observation positions are necessary, which are distributed over the entire observation hemisphere of the canopy in order to approximate the BRDF. For this purpose, goniometers [29,30,36,37,38,39,40] are often used to obtain directional measurements. However, these systems require considerable support during transport and assembly, which is exacerbated by the need to take weather conditions into account for the acquisition of reliable BRDF data. Furthermore, disturbing effects can influence the measurements, such as the movement of the sun, the appearance of cirrus clouds or object movements caused by changing wind conditions. A rather new possibility acquiring multiangular data to obtain the BRDF is the use of UAV-based full-frame sensors [20,31,34]. UAV-based measurements seem to be a genuine alternative to field goniometers, especially considering the relatively high accuracy with which full-frame sensors can determine the viewing and illumination geometry and the data acquisition in a very short time [41]. In contrast, detailed computer-based approaches modelling the top-of-canopy reflectance based on realistic 3D canopy models coupled with Monte Carlo ray tracing (MCRT), such as HySimCaR (hyperspectral simulation of canopy reflectance) [42], the BPMS (Botanical Plant Modelling System) [43] and FLIGHT (Forest LIGHT interaction model) [44], offer stable and uniform simulation conditions. These models allow realistic investigations of the structural and spectral dependencies of hyperspectral canopy reflectance data of vegetation canopies for any observation and illumination scenario. Additionally, a model offers the possibility to vary any input parameter enabling detailed investigations of the structural and spectral dependencies of hyperspectral canopy reflectance and BRDF data of vegetation canopies. This paper addresses this point, presenting a fundamental study by the use of the computer-based model HySimCaR focusing on:
  • The influence of plant and canopy architecture on nadir acquired cereal top-of-canopy reflectance between leaf development (BBCH 11-13, BBCH is the phenological scale system for plants developed by [45] and adapted by BBCH [46]) and senescence (BBCH 99) for the improvement of retrieval methods of soil and plant optical properties and
  • The anisotropic behaviour of cereal top-of-canopy reflectance and its inter-annual variations as affected by varying biochemical properties and canopy structure of green phenological stages from tillering (BBCH 24-25) until inflorescence emergence (BBCH 51-53).

2. Material and Methods

This section describes the simulation of top-of-canopy reflectance and BRDF using HySimCaR, which represents a spectral, spatial and temporal simulation system to model realistic bidirectional reflectance and BRDF of different cereal canopies. This model is realised by an integration of detailed virtual 3D cereal canopies of different phenological stages, whose geometries are linked with corresponding spectral information.

2.1. Modelling of Top-of-Canopy Reflectance

The simulation process to gain canopy reflectance consists of two steps: the build-up of a virtual 3D canopy and its virtual sampling. Both steps are explained in the following.
1. Simulation process: A virtual 3D canopy model consists of 3D plant mock-ups that are placed on a soil digital elevation model (DEM). Each soil DEM is generated using a database of field-measured height profiles to determine the typical geometry and distance of furrows within cereal fields due to mechanical drilling. For each virtual canopy, up to five different mock-ups were cloned, randomly rotated around their vertical axis and placed on the soil DEM considering the row distance and seed density. The mock-ups differ in their physiological and morphological development (number of tillers per plant and number of fully developed tillers per plant) and represent plants of a specific phenological stage. The plant mock-ups were generated with AmapSim [47,48], a scientific software (CIRAD - Centre de Coopération Internationale en Recherche Agronomique pour le Développement, Montpellier, France) to build plants virtually based on real measurements. This software provides stochastic rules based on botanical theory to model plant morphogenesis, obtaining accurate and detailed plant architectures of different growth stages. The shape and spectral information of plant leaves, stems and ears was acquired in the field at different growth stages. Several study sites were sampled in regular intervals during the growing seasons of 2006/2007, 2007/2008 and 2008/2009.
2. Virtual sampling: The sampling of the virtual 3D canopies is performed by the aDvanced Radiometric rAy Tracer (drat, renamed and published as librat by UC London), an efficient MCRT software that was developed by Lewis [43]. Drat calculates the canopy reflectance based on 3D descriptions with linked spectral properties, predefined camera imaging properties and illumination conditions using reverse ray tracing. The reflectance results conform to case 1 (bidirectional) of Nicodemus et al. [49] using a planar camera model with orthographic methods and a directional illumination source. The drat model has been used in numerous studies, e.g., [42,50,51,52,53,54,55], and, in the third phase of RAMI (RAdiation transfer Model Intercomparison, RAMI-3 [56]), the drat model belongs to a series of credible 3D MCRT models.

2.2. Modelling of Top-of-Canopy BRDF

Drat is capable of calculating the bidirectional reflectance factor (BRF) from any viewing position of the observation hemisphere. Interpolating numerous different observations results in the approximation of the BRDF.
For BRDF analysis in this study, each virtual canopy is sampled from 113 different viewing positions for zenith angles between 0 and 65 . Observations of zenith angles >65 are of less importance for remote sensing applications because the influence of the atmosphere becomes too strong (air mass ratio: cos α 1 > > 2 for α > 65 ). The selected observation positions are chosen to be non-uniformly distributed to prevent disturbing patterns that are caused by the interpolation process in order to model the BRDF. The principal and the cross plane are sampled at fine and regular intervals (each 5 ) for detailed analyses. Interpolation is performed by fitting a surface model of the form z = f ( x , y ) to the sampled data vectors x θ v , ϕ v , y θ v , ϕ v , z , where z = ρ θ i , ϕ i , θ v , ϕ v is represented by the bidirectional reflectance factor as observed from the position θ v , ϕ v and illuminated from θ i , ϕ i .
At the current stage, HySimCaR is developed for three cereal types: winter wheat (Triticum aestivum), winter rye (Secale cereale) and winter barley (Hordeum vulgare). A detailed description of HySimCaR, including the entire virtual plant mock-up and canopy generation, the virtual sampling process and its validation can be found in [42,50,57]. In addition, the model has already been used for several applications found in [58,59,60,61,62,63]. Based on the model, the influence of soil moisture on canopy reflectance was investigated and corrected by Spengler et al. [59,60] and the influence of vegetation cover on the prediction of soil spectral features was investigated and quantified by Kuester et al. [58].

2.3. Development of Virtual Canopies

For a systematic and thorough assessment of the impact of canopy structure on nadir top-of-canopy reflectance and on BRDF, an extensive database with a large number of different scenarios varying in their structure is needed. The canopy structure includes two types of structures: (1) the structure due to different phenology of the plants and (2) the structure due to the different arrangement of the plants within the canopy. Therefore, we developed a database with numerous different canopy scenarios varying in phenology and inner field structure. In the following sub-subsections, we explain the development of the different canopy scenarios that were used in this study for the analysis.

2.3.1. Geometrically

For this study, numerous different canopies including three different cereal types (winter barley, winter rye and winter wheat) and 13 different phenological stages between leaf appearance and senescence were modelled and sampled with HySimCaR. The virtual canopies have an extent of 3.5 m × 3.5 m with a maximum canopy height of about 1.8 m to ensure that the off-nadir viewings enter the canopy from their top and not from their side, which would cause a significantly different signal. Figure 1 visualises the 13 phenological stages exemplarily for winter barley. In addition to plant phenology, the following canopy structure parameters were varied: row spacing (RS), plant density (number of plants/m 2 ) (PD), number of tillers per plant in the following named as plant appearance, and relative row orientation against sun azimuth (RRO).
Row spacing varies between wide, medium and narrow. Wide row spacing (22–26 cm) is commonly used in organic farming where chopping or mulching takes place between the rows, whose coverage steadily increases [64]. Narrow (8–12 cm) and medium row spacing are typical row spacings of conventional agriculture cultivation for the modelled cereal types. The space between the rows is depending on soil conditions and machinery of the farmers. For the analysis of the influence of row spacing, plant density was varied to create canopies with comparable leaf areas of the different cereal types for each phenological stage (tillering: 0.7 LAI, early stem elongation: 1.1 LAI, early inflorescence emergence: 2.6 LAI, late ripening: 2.1 LAI). The influence of plant density is only analysed for canopies with medium row spacing by varying the plant density from 0 to 205 plants per m 2 .
To recreate the usual heterogeneity of conventional managed canopies of the test site in Eastern Germany, the plant density was varied between 60 and 100 plants per m 2 corresponding to about 200 to 500 tillers with ears per m 2 . Additionally, the plants are characterised by different appearance. Therefore, each canopy composition was built using several plant mock-ups, where the following four different variations of mock-ups were used: three mock-ups with two to four tillers in total, three mock-ups with three to five tillers in total, four mock-ups with three to six tillers in total, and six mock-ups with two to seven tillers in total. The relative row orientation is measured against the sun azimuth and varies between 0 , 30 , 60 , and 90 . Assuming that the canopies are approximately symmetrical, the canopies with a relative row orientation of 120 , 150 and 180 were not simulated because their sunlit/shaded- and plant/soil-fractions are similar to the canopies with a relative row orientation of 60 , 30 and 0 . In summary, 1488 different virtual canopies were built, including 104 different setups for each cereal type at early stem elongation and 36 different setups during late tillering, late stem elongation, and early inflorescence emergence for the BRDF studies. Figure 2 shows three canopies at different phenological stages as an example for the developed virtual canopies.

2.3.2. Spectrally

1. Artificial optical properties: The canopy reflectance is a mixed signal influenced by the leaf internal optical properties due to biochemistry, water content and leaf internal structure, by plant and canopy architecture which affects the sunlit/shadow fractions, and by the optical properties of the underlying soil. To suppress the influence of leaf internal optical properties and soil optical properties, artificial optical properties are defined. In a first test, a general artificial band is defined with fixed values for reflectance, absorptance and transmittance (listed in Table 1) for all parts of the plant. The resulting artificial reflectance signal is only influenced by scattering behaviour due to plant and canopy structure. In a second test, we simulated the same scenarios but with varying artificial optical properties for the leaves, whereby the optical properties of the ears remain constant in order to investigate the influence of the leaves and ears on the total reflectance of the canopy. The absolute values for the varying artificial optical properties have been selected without specific criteria. A detailed link of the optical properties to e.g., field analysis in this case is not necessary. The selected values enable a good separation of the different plant objects and structural analysis. These varying artificial optical properties are shown in Table 2.
2. Natural optical properties: The spectral information of plant leaves, stems and ears was acquired in the field using an ASD FieldSpec 3 (Analytical Spectral Devices, Inc., Boulder, CO, USA) in a typical agricultural landscape in eastern Germany. The ASD has been placed in near range above the plant parts in nadir position, whereby the individual plant parts were kept horizontal due to the white standard. Several study sites were sampled in regular intervals during the growing seasons 2006/2007, 2007/2008 and 2008/2009 to get reliable data for each phenological stage of the model. All spectral signatures were measured between 350 nm and 2500 nm. Throughout all field campaigns, the focus was on the sampling of numerous spectral information at different locations to capture the inherent natural spectral variability of cereal canopies during the growing season. A detailed description about data acquisition and preprocessing of the spectra can be found in Kuester et al. [42].

2.3.3. Computation

In addition, 117 different cereal canopy scenarios were modelled to analyse the impact of phenological development by using artificial optical properties. The nadir view analysis of the canopy structural parameters bases on about 13,000 single computations for a spectral range between 400 and 2500 nm with a band width interval of 2 nm.
For the BRDF calculations, 636 different virtual canopies were sampled each from 113 different observation positions. Additionally, only 17 selected wavelength bands with 2 nm bandwidth (between 446 nm and 968 nm) were calculated. In total, approximately 72,000 computations were made for the BRDF analysis listed in Table 3.

3. Results and Discussion

3.1. Analysis of Nadir Top-of-Canopy Reflectance

3.1.1. Influence of Plant Structure Due to Phenology

1. Constant artificial optical properties: The resulting artificial top-of-canopy reflectance factor use the constant optical properties and is not related to specific wavelengths. The factor differs significantly for all three cereal types. Figure 3 shows the development of the artificial reflectance factor for all three cereal types. The phenological development starts with bare soil conditions, whose reflectance is zero in this case. The plant growth leads to an increase of the reflectance factor up to a maximum of about 0.25 which is reached at the stage of full ripeness (around BBCH 90) for winter barley (WB) and winter rye (WR). The artificial reflectance factor of winter wheat (WW) does not exceed 0.15 but reached also its maximum during ripening. From bare soil until the end of stem elongation, the development is nearly similar for all three cereal types. Smaller differences result from different leaf blades and positions, which in turn determine the leaf area of the canopies. After stem elongation, the ears appear and the scattering characteristics changes significantly in the following phenological stages and leads to an divergent development of the reflectance factor for all three cereal types. Wheat with its awnless ears shows the lowest reflectance factor, since the number of scattering elements and the associated volume dispersion are lower in comparison to rye and barley equipped with awns. The maximum of the artificial reflectance factor for winter rye and winter wheat is during ripening. Because most of the ears have an almost horizontal orientation, this leads to the fact that top-of-canopy reflectance is mainly affected by the ears optical properties. The drying out of the plants associated with the senescence of the plants leads not only to a further bending of the ears up to a vertical orientation, but also to a drying out of the leaves, which finally partly roll up or break off. As a result of these changes, the soil and shadow signals are once again becoming increasingly important for top-of-canopy reflectance. In the case of these simulations with the use of a soil with 0% reflectance, this leads to a decrease of the top-of-canopy reflectance. The artificial reflectance factor of winter barley decreases only slightly during the senescence of the plants, as its reflectance signal still dominates the top-of-canopy reflectance due to the long awns of the ears covering the canopy stand.
2. Varying artificial optical properties: The integration of varying optical leaf properties into the experiment illustrates the influence of leaf and ear reflectance on the total top-of-canopy reflectance and shows the significant differences between the three cereal species. Figure 4 shows the development of the resulting wavelength independent artificial reflectance factor for all variations for the three cereal types. From the middle of flowering (BBCH 65), the winter barley canopy reflectance is almost exclusively affected by the optical properties of the ears in contrast to winter rye and winter wheat, where top-of-canopy reflectance is significantly affected by the varying leaf properties.

3.1.2. Influence of Canopy Structure

In this section, the results of the natural optical properties for each cereal type and each phenological stage are analysed. Besides the plant-structural and plant-optical properties, canopy-structural parameters such as row spacing, plant density and row orientation have also a decisive influence on the top-of-canopy reflectance of a stand. However, the secondary effects of changes in plant density on plant growth due to changes in growth conditions are not taken into account in the following analysis. The composition of plant and soil and sunlit and shaded fractions of top-of-canopy reflectance varies depending on the appearance of the plants (due to phenology and vitality), the plant density and the spacing and orientation of the plant rows. In the following paragraphs (1) Row spacing, (2) Row orientation, and (3) Plant density, the influence of the parameters studied per wavelength λ is quantified by calculating the coefficient of variation υ ( λ ) over all artificial spectral signatures χ , which represents a dimensionless relative measure of variation, where the standard deviation σ χ is divided by the arithmetic mean χ ¯ and extended to percent: υ ( λ ) = σ χ / χ ¯ × 100 % . The coefficient of variation allows a proportional estimation of the variance of the simulated values around the mean value and thus provides a meaningful measure for the assessment of the investigated structural canopy parameters. In Figure 4, Figure 5 and Figure 6, it is visualised as blue signature.
1. Row spacing:Figure 5 visualises the coefficient of variation including simulated canopy reflectance with the three different types of row spacing for each cereal type during phenological development using the geometrically modelling set-up described in Section 2.3.1. In the early phenological stages, the reflectance signals of the canopies vary only slightly mainly due to similar fraction cover and leaf area. The differences that occur during these stages are largely due to different plant and soil fractions that are differently sunlit and shaded. However, as the phenological development progresses, the reflectance differences between the three types of row spacing become clearer and reach values of about 20% for winter barley, about 25% for winter rye and about 33% for winter wheat during ear emergence. With decreasing row spacing, the gap between the plants decreases and the contribution of the soil optical properties to the total top-of-canopy reflectance decreases too causing the high coefficient of variation. After the maximum during ear emergence, the values decrease. At this stage, the ears are still very erectophile, and the gap between the rows is not yet closed. However, with increasing appearance and bending of the ears, the gap between the rows disappears. The crop-specific differences can be explained by the shape of the ears and their associated awns. The awns of rye and barley ears significantly increase the volume scattering in the upper part of the stand. This leads to a homogenisation of the canopy reflectance signal dominated by the optical properties of the ears and awns. Figure 6 illustrates the spectral differences of top-of-canopy reflectance between the different cereal types during emergence of ears and full ripening. In contrast to winter barley and winter rye, the canopy reflectance of winter wheat during full ripening is significantly influenced by row spacing despite comparable leaf area, since the ears of winter wheat have no awns, which could suppress the soil signal. During senescence of winter barley and winter rye, the increasing weight of the ears causes them to bend so strong that the soil fraction increases again and thus the influence of the soil optical properties on canopy reflectance increases. Therefore, the influence of row spacing becomes more present again during senescence of winter barley and winter rye effecting that the reflectance factors decrease in wavelength ranges where the soil signal is darker than the signal from the plants and vice versa if the soil signal is brighter.
2. Row orientation: The orientation of the rows of plants is usually based on the shape of the field (in the lowlands) or the slope (in hilly regions). Typically, the rows of plants are arranged parallel to the longer side of the field to avoid frequent turns of the farming machinery, or they are arranged across the steeper slope to prevent soil erosion. This means that the plant rows can have any possible orientation. Under the assumption that the sun never stands nadir above the stands, a change of the row orientation always causes a change of top-of-canopy reflectance, since the sunlit/shaded- and plant/soil-fractions composing the reflectance signal change. The simulation results show no significant influence of the row orientation on top-of-canopy reflectance for canopies with narrow and medium row spacing. Regardless of plant species and phenological development, the modelled reflectance factors vary only slightly with a maximum coefficient of variation of less than 3%. There are wavelength-specific differences, but no general trend of particularly influenced wavelength ranges can be identified. Rather, together with only a small variance of the modelled spectra, this indicates that this is only due to different shading effects caused by differently rotated plant models and non-symmetrically soil furrows. Because each plant model within the canopy is randomly rotated around its vertical axis and the furrows of the 3D soil background are modelled using a randomly chosen set of measured height profiles from a field-measured data base (Detailed description about development of virtual canopies can be found in Section 2 of [42]). In contrast, the results for canopies with wide row spacing show significant influences of the row orientation on top-of-canopy reflectance. In general, it can be said that the larger the leaf area index is, the greater are the differences of top-of-canopy reflectance for canopies with varying row orientations. Additionally, it was found that the top-of-canopy reflection becomes darker with increasing relative row orientation up to 90 and, with further increasing relative row orientation up to 180 , it becomes brighter again. This is due to the fact that the plants cast shadows on the soil in the gap between them. With a relative row orientation of 90 , the sun illuminates the canopy perpendicular to the plant rows, which affects a maximum of possible shadows. However, this only applies if there is a gap between the plant rows, as it is the case for cereal canopies with wide row spacing. Figure 6 shows the modelled top-of-canopy reflectance with medium and wide row spacings illustrating the described behaviour exemplarily for winter barley during ear emergence.
3. Plant density: Plant density is mainly driven by the leaf area apparent in the canopy. For the virtual canopies, the leaf area is determined by the number of tillers the plants have and the number of plants within the canopy. Analogous to the analysis of the influence of row spacing, a change of plant density always causes a change of top-of-canopy reflectance, since the sunlit/shaded- and plant/soil-fractions composing the reflectance signal change. However, these changes are strongly dependent on phenology. During tillering and stem elongation, the effect is much greater than in the stages after the ear emergence. Regression analyses based on the linear, logarithmic, exponential and the power function of selected wavelengths (blue: 480 nm, green: 554 nm, red: 668 nm and NIR: 868 nm) have shown that, during tillering and stem elongation, the relation between plant density is clearly linearly correlated with a very high coefficient of determination (R 2 > 0.95). However, this behaviour changes with the emergence of the ears. The tall plants and especially their ears lead to a saturation effect of the reflectance signal, so that a higher plant density does not cause a significant change of top-of-canopy reflectance. Depending on the species and the phenological development, this effect occurs for different plant densities. Figure 7 shows the change of the top-of-canopy reflectance of the three cereals during full ripening. The reflectance signal of the winter barley and winter rye canopy already reaches a relatively constant level from about 60 plants per square metre, so that a higher plant density affects only slight changes on top-of-canopy reflectance. In contrast, in the case of wheat, this effect occurs significantly later for about 150 plants per meter. The reason for this saturation effect lays in the volume scattering, which is stronger for canopies with awned ears (winter barley and winter rye).

3.2. Analysis of Top-of-Canopy BRDF

For the analysis of reflectance anisotropy, the BRDF is interpreted as a 3D terrain model. The analysis has been carried out primarily by interpreting all of the figures of BRDF surfaces of each virtual canopy with an emphasis on the red and the NIR wavelength ranges being most sensitive for green vegetation. Furthermore, the red wavelength range can be seen as representative for the visible wavelength range because the whole visible wavelength range is dominated by the effects of single scattering due to the high absorption of leaf pigments. To analyse the influence of anisotropy regarding the viewing geometry, a normalisation of the BRDF surfaces was previously performed. For this purpose, we used the anisotropy factor (Equation (1)) of Sandmeier et al. [65] normalising the off-nadir reflectance value R as observed from ( θ r , ϕ r ) and illuminated from ( θ i , ϕ i ) with the reflectance value R 0 that was acquired from the nadir:
A N I F θ i , ϕ i , θ r , ϕ r , λ = R θ i , ϕ i , θ r , ϕ r , λ R 0 θ i , ϕ i , 0 , 0 , λ .
All resulting BRDF surfaces show the typical, well-known characteristics such as the hot spot phenomenon [66,67], where sun and observer are in the same direction relative to the target, and the bowl shape in the near-infrared wavelength range [65,67,68] caused by volume scattering of the canopy. The hotspot appears much more pronounced in the visual wavelength range than in the NIR wavelength range. The reason for this is that the hot spot is an effect of single scattering in the visible wavelength range due to high pigment absorption, while the NIR wavelength range is characterised by multiple scattering [69]. Volume scattering is an effect of multiple scattering in vegetation canopies, resulting in diffuse radiation within the canopy, which illuminates the shady interior of the stand and thus reduces the appearance of shadows [42]. The strength of the bowl shape depends on different factors of leaf and canopy level determining the amount of volume scattering. An important factor on leaf level is the amount of leaf transmittance as a function of leaf internal structure [70,71] and the size of the interface between water-containing cells and air-filled intercellularies is a measure of this [71,72,73]. A significant factor on canopy level is the leaf surface, quantified by the LAI. That, in turn, is mainly determined by plant appearance, plant density and canopy height. During the interaction of the radiation with the canopy, the radiation passes through several leaf layers, which exerts an additive effect [71,74,75].
Another striking feature of most of the modelled BRDFs is the appearance of a local maximum in the visible red wavelength range around the nadir point (located in the centre of the surface) and of a local minimum in the NIR wavelength range around the nadir point. This can be explained as an effect of the nadir view, where the soil background of the canopy is clearly visible in contrast to off-nadir viewings because the observed fraction of vegetation increases with increasing off-nadir observation angle. In the simulations of this study, the soil signal is higher than the vegetation signal in the visible red wavelength range causing the local maximum, and, on the contrary, in the NIR wavelength range, the soil signal is lower than the vegetation signal causing the local minimum [42].

3.2.1. Influence of Plant Structure Due to Phenology

The main difference between the phenological stages is the leaf area and the height of the canopy. Primarily, the leaf area affects the canopy chlorophyll content and both affect the intensity of volume scattering. A further but significantly smaller influence comes from the leaf inclination angle, whose change affects the fractional vegetation cover. During tillering, the canopy is of low height and not yet closed along the rows. Therefore, the spectral signals from different observation directions resemble each other, and the BRDF is only slightly affected by row orientation and row spacing. From early stem elongation until late stem elongation, the height and number of tillers increase, and the canopy closes along the rows but not between the rows. Additionally, the bending of the leaves is forced by their weight, which also contributes to the closing along the rows. The orientation of rows is clearly visible for virtual canopies with a wider row spacing. During these early phenological stages, all of the observed effects are more pronounced for winter wheat and winter barley canopies than for winter rye canopies due to their different leaf area and chlorophyll content as explained in the previous section. With the emergence of ears, the effects of the canopy structure on the BRDF decrease. This decrease applies in particular to canopies of winter rye and winter barley because their ears are covered with awns dominating the top-of-canopy reflectance signal as described in Section 3.1.2. The ears of winter wheat are awnless, thus all effects of anisotropy due to canopy structure described during tillering and stem elongation for winter wheat canopies are also noticeable during emergence of ears but less pronounced.

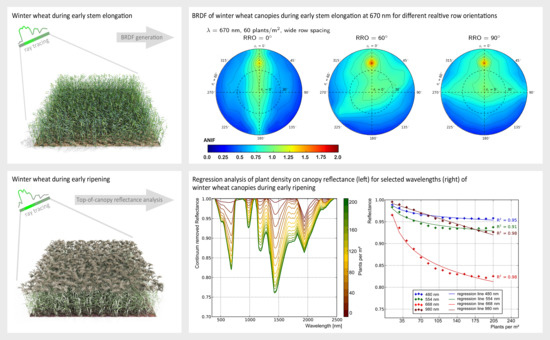
3.2.2. Influence of Row Spacing and Relative Row Orientation

As mentioned in the previous subsection, the row spacing and relative row orientation have a strong influence on the canopy structure. The wider the row spacing is, the greater is the gap between the plant rows. Thus, the soil becomes apparent in nadir observations as well as in off-nadir observations in the direction of the rows. In the BRDF visualisations, this phenomenon is clearly noticeable for all virtual canopies with a wide row spacing. Figure 8 shows exemplarily BRDF surfaces at λ = 670 nm and λ = 800 nm for different virtual winter wheat canopies with a relative row orientation of 60 . The orientation of rows is clearly visible for virtual canopies with a wide row spacing in the visible and in the NIR wavelength range. In the visible range, the values are higher, whereas, in the NIR range, the values are lower (confer Figure 9). Both of these results are due to the visibility of soil in the gap between the plant rows whose signal is brighter in the visible and weaker in the NIR wavelength range than that of vegetation. A dark soil would also effect lower signals in the visible wavelength range. The virtual canopies with a medium row spacing are affected by the soil signal, but the orientation of the rows is mostly not visible in the BRDF visualisations. The virtual canopies with narrow row spacing indicate no anisotropy due to row orientation. These canopies are already so dense that they appear homogeneous. Their anisotropy is caused by leaf attitude and phyllotaxis.
It was found that, if the row orientation significantly influences the BRDF, their relative azimuth angle is mapped in the BRDF as a furrow (in the visible wavelength range) or a longish mound (in the NIR wavelength range). To give a more objective assessment of the influence of row orientation on the BRDF, an automated analysis was carried out to find these surface shapes. For this purpose, the interpolated BRDF surface was used, but only the outer edge between 55 and 60 zenith was considered. The mean value of this edge was determined in 5 steps and saved as a profile. Furthermore, the local minima (visible wavelength range) and maxima (NIR wavelength range) were estimated. If the minimum/maximum fell exactly to 0 , 30 , 60 or 90 and/or to its opposite angle 180 , 210 , 240 or 270 , then this BRDF was counted as a significant influence. Table 4 summarises the results of the automated and visual analysis. Anisotropy due to row spacing is noticeable for the virtual canopies of all of the three cereal types with a wide row spacing and for winter barley and winter wheat canopies with a medium row spacing. Anisotropy of canopies with RRO = 0 is apparently more pronounced in the red wavelength range. In this case, the direction of the solar irradiance is parallel to that of row orientation. The soil between the rows is directly illuminated and reflects a brighter signal, affecting even canopies with a narrow row spacing that are relatively rare. However, in the NIR wavelength range, only a few effects on BRDF are noticeable because volume scattering superimposes the soil signal. It is apparent that the BRDF of winter barley and winter wheat canopies for both of the observed wavelength ranges are more affected by row orientation than the BRDF of winter rye canopies. In the red wavelength range, this result is caused by the high chlorophyll content of rye leaves dominantly absorbing the incoming irradiance. In the NIR wavelength range, this result is caused by the height of winter rye plants (height during ripening about 1.6 m) leading to an increase in volume scattering compared with winter wheat (height during ripening about 0.9 m) and winter barley (height during ripening about 1 m) canopies. Furthermore, the density of plants along a row is not a decisive factor. The effects on BRDF due to row orientation are noticeable for few plants (about 8/m) as well as for many plants (about 15/m) along a row. However, the effects vary in the intensity. Anisotropy is slightly more pronounced for canopies with a wider row spacing. In this case, the vegetation gap between the plant rows cannot be closed despite increasing plant density. The anisotropy of canopies with medium row spacing slightly decreases with an increasing number of plants per row because the natural variability of the plant positions within a plant row leads to a partial closing of the vegetation gap and a decreasing soil signal.

3.2.3. Influence of Plant Density

The more plants that are in the canopy and the more tillers the plants have, the denser is the canopy, which leads to a stronger vegetation signal that superimposes the reflectance signal of the soil. Figure 10 shows the BRDF of different winter wheat canopies with increasing plant density from left to right at λ = 670 nm and λ = 800 nm. In the red wavelength range, the shape of the BRDF changes from elliptic convex to parabolic convex with a falling gradient along the principal plane. Furthermore, the local maximum at the nadir decreases and the local maximum in the hotspot increases with higher plant density. In the NIR wavelength range, the bowl shape of the BRDF is subject to only minor changes, as the curvature of the bowl decreases.

4. Conclusions

The results of this study demonstrate that plant appearance due to phenology and canopy structure (row spacing, plant density, and relative row orientation against sun azimuth) significantly influence nadir top-of-canopy reflectance (between 400 nm and 2500 nm) and the BRDF (between 400 nm and 1000 nm). Even if only selected wavelength ranges of the BRDF could be investigated, the canopy structure influences the entire range between 400 nm and 2500 nm. The canopy structure mainly influences the scattering behaviour of the incoming irradiance and this is more affected in the NIR and SWIR wavelength ranges than in the VIS wavelength range due to pigment absorption. In summary, it can be said that the larger the fraction of the radiation reflected by the plants, the stronger is the influence of the canopy structure on the reflectance signal. In the following, we present our concluding remarks about nadir top-of-canopy reflectance and BRDF separately.

4.1. Nadir Top-of-Canopy Reflectance

In general, the influence of the plant structure due to phenology is quite similar for the young growth stages of the three analysed cereals. With the appearance of the ears, the top-of-canopy reflectance is increasingly characterised by the ears’ optical properties. This is mainly driven by the shape and orientation of the ears and the presence of awns, which are strongly influencing the volume scattering. In particular, the reflectance of barley is almost fully dominated by the optical properties of the ears from BBCH stage 65 (flowering).
The influence of canopy structure on top-of-canopy reflectance has been analysed by investigating the parameters row spacing, row orientation and plant density. The varied parameters mainly influenced the fractions of plant and soil at sunlit and shaded conditions of wheat, rye and barley. This is a typical situation at every field with heterogeneous growth conditions due to parameters like soil condition, water availability or topography. Despite the fact that wheat, rye and barley correspond to the quite similar tribe of Triticeae of the family of Poaceae, the results show clear differences between the cereals. While the influence of varying row spacing on the top-of-canopy reflectance is very small for the young phenological stages and are due to different fractions of the signal (plant, soil, sunlit and shaded), and with phenological progress the canopy reflectance varies up to 33%. It was remarkable that row spacing also plays an important role in the analysis of the row orientation and that this can hardly be considered separately. The nadir top-of-canopy analysis of narrow and medium row spacing only show wavelength dependent differences of about 3%. In contrast, the top of canopy reflectance of canopies with wide row spacing that is used in organic farming varies up to 20%. Finally, the plant density has been analysed. The influence is strongly related to the phenological development of the plants and is also crop specific. It clearly shows that there are saturation effects with regard to top-of-canopy reflectance. However, these occur e.g., during ripening with very different plant densities for the analysed cereals. In winter barley, for example, saturation of reflectance occurs for a plant density of about 60 plants/m 2 , whereas, for winter rye, saturation of reflectance occurs for about 100 plants/m 2 and for winter wheat for about 150 plants/m 2 .
The results show that, for canopies with similar biophysical canopy parameters like LAI and chlorophyll content, strongly varying nadir top-of-canopy reflectance signals can be measured due to the appearance of the plants and their arrangement within the field. This is essential knowledge for the development of retrieval methods for current and upcoming remote sensing mission. Especially for the quantification of uncertainties, this information is of high relevance and should to be taken into account. Furthermore, for example in the frame of operational services that are supported by remote sensing data like GEOGLAM Crop Monitor [76] or Crop Watch [77], detailed knowledge about crop specific potential influences of the canopy structure could improve the quality and accuracy of such information products. Currently, mainly multispectral broadband sensors and simple indices are used, but the relevance will strongly increase when hyperspectral spaceborne data will be available for analysis in the near future like PRISMA (launch scheduled for end of 2018, 400–2505 nm [78]), HISUI (platform ISS, launch 2019, 400–2500 nm [79]), SHALOM (launch scheduled for 2019, 400–2500 nm [80]), EnMAP (launch scheduled for end of 2020, 420–2500 nm [33]), HypXIM (launch scheduled for 2023, 400–2500 nm [81]), and ESA CHIME (in conception [82]) missions.

4.2. Top-of-Canopy BRDF

There are local and global features appearing in the shape of the BRDF. The local feature is due to the row spacing and relative row orientation occurring with the mapping of the relative row orientation. The global features are due to the canopy density influencing the BRDF to change the shape from elliptic convex to parabolic convex (red wavelength range) and to shift the whole BRDF along the z-axis, the axis of BRF or ANIF (NIR wavelength range). It is remarkable that in the case of non-closed canopies, the row structure causes strong effects in the BRDF that are independent of the wavelength. This result is due to the strong signal differences between viewing along the rows that are dominated by the soil signal and viewing across the rows that are dominated by the vegetation signal. A smaller gap between the plant rows reduces the effect, especially for the NIR wavelength range that is mainly characterised by multiple scattering, weakening the extent of anisotropy [65]. The visible wavelength range is more affected because it is dominated by single scattering due to high pigment absorption [65].
The knowledge explaining the BRDF of different plants and canopy architectures during different phenological stages is an indispensable prerequisite for the advanced exploitation of multiangular data in the future. For example, it is conceivable that valuable information about canopy structure and in particular the row orientation can be directly retrieved from multiangular data. However, for such studies, 3D canopy reflectance models are necessary in either case, as they were used in this study, because such detailed BRDF can not be modelled with 1D or 2D vegetation radiative transfer models. On the other hand, it can be concluded that the integration of the observation geometry is indispensable in empirical studies using multiangular data of UAV-based full-frame sensors or tilting satellites. Furthermore, it is recommended to take pixels from as many image areas as possible (in the case of full-frame sensors) or to take pixels from all available data sets (in the case of multiangular time series) in order to include as many different observation angles as possible for model fitting. Consequently, this constitutes an additional requirement for all field-related measurement or validation activities to be considered.
The BRDF effects demonstrated in this study suggest a future focus on the advancement and implementation of 3D canopy reflectance models, especially in an agricultural context whenever off-nadir observations play an important role. Furthermore, the knowledge about the BRDF can also contribute to a standardisation of multitemporal data that are sampled under different tilt angle observations the future data of the upcoming EnMAP [33] and PRISMA [78] hyperspectral sensors. The success of this approach will also depend on the modelling of additional representative crops. Therefore, current studies should focus on crops that are characterised by a distinctive structure, such as maize (tall plants and wide row spacing) and sunflower (heliotropism of leaves and buds) in the frame of remote sensing of agricultural areas.

Author Contributions

T.K. and D.S. developed HySimCaR. T.K. performed the BRDF simulations, the BRDF generation, and the analysis of BRDF data. D.S. performed the nadir reflectance simulations, and the analysis of the nadir reflectance data. T.K. and D.S. wrote the paper together. Both contributed equally to this manuscript.

Funding

The study was supported by the DLR Space Administration with funds of the German Federal Ministry of Economic Affairs and Energy (on the basis of a decision by the German Bundestag: 50 EE 1529) and contributions from DLR, GFZ and OHB System AG. Furthermore, the study was supported by the EU H2020 project HYPERNETS (Grant No.: 775983—HYPERNETS—H2020-SC5-2016-2017/H2020-SC5-2017-OneStageB).

Acknowledgments

The authors would like to thank the AGRAR GbR Wittbrietzen and the Faculty of Agriculture and Horticulture of the Humboldt-University Berlin for enabling in situ data collection. They are also grateful to Philip Lewis and Mathias Disney of the UC London for providing drat and its support. The authors would like to thank the anonymous reviewers for their valuable comments and suggestions to improve the quality of the paper.

Conflicts of Interest

The authors declare no conflict of interest. The funding sponsors had no role in the design of the study, in the simulation process, in the analyses or interpretation of data, in the writing of the manuscript, and in the decision to publish the results.

References

  1. Bousbih, S.; Zribi, M.; Lili-Chabaane, Z.; Baghdadi, N.; Hajj, M.E.; Gao, Q.; Mougenot, B. Potential of Sentinel-1 Radar Data for the Assessment of Soil and Cereal Cover Parameter. Sensors 2017, 17, 2617. [Google Scholar] [CrossRef] [PubMed]
  2. Erten, E.; M.Lopez-Sanchez, J.; Yuzugullu, O.; Hajnsek, I. Retrieval of agricultural crop height from space: A comparison of SAR techniques. Remote Sens. Environ. 2016, 157, 130–144. [Google Scholar] [CrossRef]
  3. Lopez-Sanchez, J.M.; Ballester-Berman, J.D. Potentials of polarimetric SAR interferometry for agriculture monitoring. Radio Sci. 2009, 44, 1–20. [Google Scholar] [CrossRef]
  4. Stumberg, N.; Bollandsås, O.; Gobakken, T.; Næsset, E. Automatic Detection of Small Single Trees in the Forest-Tundra Ecotone Using Airborne Laser Scanning. Remote Sens. 2014, 6, 10152–10170. [Google Scholar] [CrossRef] [Green Version]
  5. Defibaugh y Chàvez, J.; Tullis, J. Deciduous Forest Structure Estimated with LIDAR-Optimized Spectral Remote Sensing. Remote Sens. 2013, 5, 155–182. [Google Scholar] [CrossRef] [Green Version]
  6. Sankey, J.; Munson, S.; Webb, R.; Wallace, C.; Duran, C. Remote Sensing of Sonoran Desert Vegetation Structure and Phenology with Ground-Based LiDAR. Remote Sens. 2015, 7, 342–359. [Google Scholar] [CrossRef]
  7. Dandois, J.; Ellis, E. Remote Sensing of Vegetation Structure Using Computer Vision. Remote Sens. 2010, 2, 1157–1176. [Google Scholar] [CrossRef] [Green Version]
  8. Næsset, E. Predicting forest stand characteristics with airborne scanning laser using a practical two-stage procedure and field data. Remote Sens. Environ. 2002, 80, 88–99. [Google Scholar] [CrossRef]
  9. Lefsky, M.; Cohen, W.; Acker, S.; Parker, G.; Spies, T.; Harding, D. Lidar Remote Sensing of the Canopy Structure and Biophysical Properties of Douglas-Fir Western Hemlock Forests. Remote Sens. Environ. 1999, 70, 339–361. [Google Scholar] [CrossRef]
  10. Kuusk, A. Determination of vegetation canopy parameters from optical measurements. Remote Sens. Environ. 1991, 37, 207–218. [Google Scholar] [CrossRef]
  11. Asner, G.P. Biophysical and biochemical sources of variability in canopy reflectance. Remote Sens. Environ. 1998, 64, 234–253. [Google Scholar] [CrossRef]
  12. Onojeghuo, A.O.; Blackburn, G.A.; Wang, Q.; Atkinson, P.M.; Kindred, D.; Miao, Y. Rice crop phenology mapping at high spatial and temporal resolution using downscaled MODIS time-series. GISci. Remote Sens. 2018, 55, 659–677. [Google Scholar] [CrossRef]
  13. Ulsig, L.; Nichol, C.J.; Huemmrich, K.F.; Landis, D.R.; Middleton, E.M.; Lyapustin, A.I.; Mammarella, I.; Levula, J.; Porcar-Castell, A. Detecting Inter-Annual Variations in the Phenology of Evergreen Conifers Using Long-Term MODIS Vegetation Index Time Series. Remote Sens. 2017, 9, 49. [Google Scholar] [CrossRef]
  14. Cuba, N.; Rogan, J.; Lawrence, D.; Williams, C. Cross-Scale Correlation between In Situ Measurements of Canopy Gap Fraction and Landsat-Derived Vegetation Indices with Implications for Monitoring the Seasonal Phenology in Tropical Forests Using MODIS Data. Remote Sens. 2018, 10, 979. [Google Scholar] [CrossRef]
  15. Karkauskaite, P.; Tagesson, T.; Fensholt, R. Evaluation of the Plant Phenology Index (PPI), NDVI and EVI for Start-of-Season Trend Analysis of the Northern Hemisphere Boreal Zone. Remote Sens. 2017, 9, 485. [Google Scholar] [CrossRef]
  16. Méndez, M.L.P.; Bustamante, J.; Soriguer, R.; Santamaría, L. Modeling Biomass Production in Seasonal Wetlands Using MODIS NDVI Land Surface Phenology. Remote Sens. 2017, 9, 392. [Google Scholar] [Green Version]
  17. Zheng, Y.; Zhang, M.; Zhang, X.; Zeng, H.; Wu, B. Mapping Winter Wheat Biomass and Yield Using Time Series Data Blended from PROBA-V 100- and 300-m S1 Products. Remote Sens. 2016, 8, 824. [Google Scholar] [CrossRef]
  18. Meng, J.; Du, X.; Wu, B. Generation of high spatial and temporal resolution NDVI and its application in crop biomass estimation. Int. J. Digit. Earth 2013, 6, 203–218. [Google Scholar] [CrossRef]
  19. Duan, S.B.; Li, Z.L.; Wu, H.; Tang, B.H.; Ma, L.; Zhao, E.; Li, C. Inversion of the PROSAIL model to estimate leaf area index of maize, potato, and sunflower fields from unmanned aerial vehicle hyperspectral data. Int. J. Appl. Earth Obs. Geoinf. 2014, 26, 12–20. [Google Scholar] [CrossRef]
  20. Roosjen, P.P.; Brede, B.; Suomalainen, J.M.; Bartholomeus, H.M.; Kooistra, L.; Clevers, J.G. Improved estimation of leaf area index and leaf chlorophyll content of a potato crop using multi-angle spectral data—Potential of unmanned aerial vehicle imagery. Int. J. Appl. Earth Obs. Geoinf. 2018, 66, 14–26. [Google Scholar] [CrossRef]
  21. Haboudane, D.; Miller, J.; Pattey, E.; Zarco-Tejada, P.; Strachan, I. Hyperspectral vegetation indices and novel algorithms for predicting green LAI of crop canopies: Modeling and validation in the context of precision agriculture. Remote Sens. Environ. 2004, 90, 337–352. [Google Scholar] [CrossRef]
  22. Thenkabail, S.; Smith, R.; De Pauw, E. Hyperspectral Vegetation Indices and Their Relationships with Agricultural Crop Characteristics. Remote Sens. Environ. 2000, 71, 158–182. [Google Scholar] [CrossRef]
  23. Latorre-Carmona, P.; Knyazikhin, Y.; Alonso, L.; Moreno, J.F.; Pla, F.; Yan, Y. On Hyperspectral Remote Sensing of Leaf Biophysical Constituents: Decoupling Vegetation Structure and Leaf Optics Using CHRIS–PROBA Data Over Crops in Barrax. IEEE Geosci. Remote Sens. Lett. 2014, 11, 1579–1583. [Google Scholar] [CrossRef] [Green Version]
  24. Dorigo, W.A. Improving the Robustness of Cotton Status Characterisation by Radiative Transfer Model Inversion of Multi-Angular CHRIS/PROBA Data. IEEE J. Sel. Top. Appl. Earth Obs. Remote Sens. 2012, 5, 18–29. [Google Scholar] [CrossRef]
  25. Ni, W.; Woodcock, C.; Jupp, D. Variance in Bidirectional Reflectance over Discontinous Plant Canopies. Remote Sens. Environ. 1999, 69, 1–15. [Google Scholar] [CrossRef]
  26. Sandmeier, S.R.; Middleton, E.M.; Deering, D.W.; Qin, W. The potential of hyperspectral bidirectional reflectance distribution function data for grass canopy characterization. J. Geophys. Res. 1999, 104, 9547–9560. [Google Scholar] [CrossRef] [Green Version]
  27. Deering, D.W.; Middleton, E.M.; Irons, J.R.; Blad, B.L.; Walter-Shea, E.A.; Hays, C.J.; Walthall, C.; Eck, T.F.; Ahmad, S.P.; Banerjee, B.P. Prairie Grassland Bidirectional Reflectances Measured by Different Instruments at the FIFE Site. J. Geophys. Res. 1992, 97, 18887–18903. [Google Scholar] [CrossRef]
  28. Schill, S.; Jensen, J.; Raber, G.; Porter, D. Temporal Modeling of Bidirectional Reflection Distribution Function (BRDF) in Coastal Vegetation. GISci. Remote Sens. 2004, 41, 116–135. [Google Scholar] [CrossRef]
  29. Schneider, T.; Schopfer, J.; Oppelt, N.; Dorigo, W.; Vreeling, W.; Gege, P. GonioExp06—A Field Goniometer Intercomparison Campaign. In Support of Physical Model Inversion and Upscaling Methods for Hyperspectral, Multispectral RS Data. Proceedings of the Envisat Symposium, Montreux, Switzerland, 23–27 April 2007; ESA: Pairs, France, 2007. [Google Scholar]
  30. Buchhorn, M.; Petereit, R.; Heim, B. A Manual Transportable Instrument Platform for Ground-Based Spectro-Directional Observations (ManTIS) and the Resultant Hyperspectral Field Goniometer System. Sensors 2013, 13, 16105–16128. [Google Scholar] [CrossRef] [Green Version]
  31. Burkart, A.; Aasen, H.; Alonso, L.; Menz, G.; Bareth, G.; Rascher, U. Angular Dependency of Hyperspectral Measurements over Wheat Characterized by a Novel UAV Based Goniometer. Remote Sens. 2015, 7, 725–746. [Google Scholar] [CrossRef] [Green Version]
  32. ESA. Sentinel-2 Data Sheet, The operational Copernicus Optical High Resolution Land Misssion; ESA: Paris, France, 2017. [Google Scholar]
  33. Guanter, L.; Kaufmann, H.; Segl, K.; Foerster, S.; Rogass, C.; Chabrillat, S.; Kuester, T.; Hollstein, A.; Rossner, G.; Chlebek, C.; et al. The EnMAP Spaceborne Imaging Spectroscopy Mission for Earth Observation. Remote Sens. 2015, 7, 8830–8857. [Google Scholar] [CrossRef] [Green Version]
  34. Roosjen, P.; Suomalainen, J.; Bartholomeus, H.; Kooistra, L.; Clevers, J. Mapping reflectance anisotropy of a potato canopy using aerial images acquired with an unmanned aerial vehicle. Remote Sens. 2017, 9, 417. [Google Scholar] [CrossRef]
  35. Koirala, P.; Loke, T.; Baarstad, I.; Fridman, A.; Hernandez, J. Real-time hyperspectral image processing for UAV applications, using HySpex Mjolnir-1024. Proc SPIE 2017, 10198. [Google Scholar] [CrossRef]
  36. Huang, W.; Wang, J.; Wang, Z.; Ma, Z.; Zhao, C. Winter wheat geometry identification by bidirectional canopy reflected spectrum. Int. J. Agric. Biol. Eng. 2008, 1, 27–31. [Google Scholar]
  37. Landis, B.; Aber, J. Low-cost field goniometer for multiangular reflectance measurements. Emporia State Res. Stud. 2007, 44, 1–6. [Google Scholar]
  38. Peltoniemi, J.I.; Kaasalainen, S.; Näränen, J.; Rautiainen, M.; Stenberg, P.; Smolander, H.; Smolander, S.; Voipio, P. BRDF measurement of understory vegetation in pine forests: Dwarf shrubs, lichen, and moss. Remote Sens. Environ. 2005, 94, 343–354. [Google Scholar] [CrossRef]
  39. Dana, K.; Wang, J. Device for convenient measurement of spatially varying bidirectional reflectance. J. Opt. Soc. Am. A 2004, 21, 1–2. [Google Scholar] [CrossRef]
  40. Sandmeier, S. Acquisition of Bidirectional Reflectance Factor Data with Field Goniometers. Remote Sens. Environ. 2000, 73, 257–269. [Google Scholar] [CrossRef]
  41. Aasen, H.; Honkavaara, E.; Lucieer, A.; Zarco-Tejada, P.J. Quantitative Remote Sensing at Ultra-High Resolution with UAV Spectroscopy: A Review of Sensor Technology, Measurement Procedures, and Data Correction Workflows. Remote Sens. 2018, 10, 1091. [Google Scholar] [CrossRef]
  42. Kuester, T.; Spengler, D.; Barczi, J.F.; Segl, K.; Hostert, P.; Kaufmann, H. Modeling multitemporal and hyperspectral vegetation canopy bidirectional reflectance using detailed virtual 3D canopy models. IEEE Trans. Geosci. Remote Sens. 2014, 4, 2096–2108. [Google Scholar] [CrossRef]
  43. Lewis, P. Three-dimensional plant modelling for remote sensing simulation studies using the botanical plant modelling system. Agronomie 1999, 19, 185–210. [Google Scholar] [CrossRef]
  44. North, P. Three-dimensional forest light interaction model using a Monte Carlo method. IEEE Trans. Geosci. Remote Sens. 1996, 34, 946–956. [Google Scholar] [CrossRef]
  45. Zadoks, J.; Chang, T.T.; Konzak, C. A decimal code for the growth stages of cereals. Weed Res. 1974, 14, 415–421. [Google Scholar] [CrossRef]
  46. Meier, U. Growth Stages of Mono- and Dicotyledonous Plants: BBCH-Monograph; Blackwell Wissenschafts-Verlag: Berlin, Germany, 1997; p. 622. [Google Scholar]
  47. Barczi, J.F.; de Reffye, P.; Caraglio, Y. Essai sur l’identification et la mise en oevre des paramètres nécessaires a la simulation d’une architecture végétale: Le logiciel AmapSim. In Modélisation et Simulation de L’architecture des Végétaux; Bouchon, J., de Reffye, P., Barthélémy, D., Eds.; INRA: Paris, France, 1997; pp. 205–254. [Google Scholar]
  48. Barczi, J.F.; Rey, H.; Caraglio, Y.; de Reffye, P.; Barthélémy, D.; Dong, Q.; Fourcaud, T. AmapSim: A structural whole-plant simulator based on botanical knowledge and designed to host external functional models. Ann. Bot. 2008, 101, 1125–1138. [Google Scholar] [CrossRef] [PubMed]
  49. Nicodemus, F.; Richmond, J.; Hsia, J.; Ginsberg, I.; Limperis, T. Geometrical Considerations and Nomenclature for Reflectance; Technical Report; National Bureau of Standards: Washington, DC, USA, 1977. [Google Scholar]
  50. Spengler, D. Charakterisierung von Getreidearten aus Hyperspektralen Fernerkundungsdaten auf der Basis von 4D-Bestandsmodellen. Ph.D. Thesis, Technische Universität Berlin, FBerlin, Germany, 2014. [Google Scholar]
  51. Disney, M.; Lewis, P.; Gomez-Dans, J.; Roy, D.; Wooster, M.; Lajas, D. 3D radiative transfer modelling of fire impacts on a two-layer savanna system. Remote Sens. Environ. 2011, 115, 1866–1881. [Google Scholar] [CrossRef]
  52. Disney, M.; Lewis, P.; Saich, P. 3D modelling of forest canopy structure for remote sensing simulations in the optical and microwave domains. Remote Sens. Environ. 2006, 100, 114–132. [Google Scholar] [CrossRef]
  53. Disney, M.; Lewis, P.; North, P. Monte Carlo ray tracing in optical canopy reflectance modelling. Remote Sens. Rev. 2000, 18, 163–196. [Google Scholar] [CrossRef]
  54. Saich, P.; Lewis, P.; Disney, M. Biophysical parameter retrieval from forest and crop canopies in the optical and microwave domains using 3D models of canopy structure. In Proceedings of the IEEE International Geoscience and Remote Sensing Symposium (IGARSS 2003), Toulouse, France, 21–25 July 2003; Volume 6, pp. 3546–3548. [Google Scholar]
  55. Saich, P.; Lewis, P.; Disney, M.; Thackrah, G. Comparison of Hymap/E-SAR data with models for optial reflectance and microwave scattering from vegetation canopies. In Proceedings of the Third International Symposium on Retrieval of Bio- and Geophysical Parameters from SAR Data for Land Applications; Wilson, A., Ed.; ESA: Noordwijk, The Netherlands, 2002; pp. 75–80. [Google Scholar]
  56. Widlowski, J.L.; Taberner, M.; Pinty, B.; Bruniquel-Pinel, V.; Disney, M.; Fernades, R.; Gastellu-Etchegorry, J.P.; Gobron, N.; Kuusk, A.; Lavergne, T.; et al. The third RAdiation transfer Model Intercompariosn (RAMI) exercise: Documenting progress in canopy reflectance models. J. Geophys. Res. 2007, 112, 28. [Google Scholar] [CrossRef]
  57. Küster, T. Modellierung von Getreidebestandsspektren zur Korrektur BRDF-Bedingter Einflüsse auf Vegetationsindizes im Rahmen der EnMAP-Mission. Ph.D. Thesis, Humboldt-Universität zu Berlin, Berlin, Germany, 2011. [Google Scholar]
  58. Kuester, T.; Förster, S.; Chabrillat, S.; Spengler, D.; Guanter, L. Assessing The Influence Of Variable Fractional Vegetation Cover On Soil Spectral Features Using Simulated Canopy Reflectance Modeling. In Proceedings of the 10th EARSeL SIG Imaging Spectroscopy Workshop, Zurich, Switzerland, 19–21 April 2017. [Google Scholar]
  59. Spengler, D.; Kuester, T.; Frick, A.; Scheffler, D.; Kaufmann, H. Correcting the influence of vegetation on surface soil moisture indices by using hyperspectral artificial 3D-canopy models. In Proceedings of the SPIE, Dresden, Germany, 23–26 September 2013; Volume 8887, p. 9. [Google Scholar]
  60. Spengler, D.; Frick, A.; Davey, C.; Peisker, T.; Kaufmann, H. Estimation of surface soil moisture content using imaging spectroscopy—A simulation case study. In Proceedings of the 7th EARSeL SIG Imaging Spectroscopy Workshop, Edinburgh, Scotland, UK, 11–13 April 2011. [Google Scholar]
  61. Peisker, T.; Spengler, D.; Segl, K.; Hostert, P.; Kaufmann, H. Simulation of EnMAP measured cereal canopy spectra—Challenges posed by varying observation geometry and plant phenology. In Proceedings of the Hyperspectral Workshop 2010, ESA-ESRIN, Frascati, Italy, 17–19 March 2010; ESA: Pairs, France, 2010. [Google Scholar]
  62. Peisker, T.; Spengler, D.; Segl, K.; Kaufmann, H. On the spectral resolution requirements for the derivation of leaf area index from hyperspectral remote sensing data. In Imaging Spectroscopy: Innovative Tool for Scientific and Commercial Environmental Applications, Proceedings of the 6th EARSeL SIG IS Workshop, Ramat Aviv, Tel Aviv, Israel, 16–19 March 2009; Tel Aviv University: Tel Aviv, Israel, 2009. [Google Scholar]
  63. Spengler, D.; Peisker, T.; Bochow, M.; Segl, K.; Kaufmann, H. Determination of cereal type and growth stage using simulated reflectance data. In Imaging Spectroscopy: Innovative Tool for Scientific and Commercial Environmental Applications, Proceedings of the 6th EARSeL SIG IS Workshop, Ramat Aviv, Tel Aviv, Israel, 16–19 March 2009; Tel Aviv University: Tel Aviv, Israel, 2009. [Google Scholar]
  64. BMELV—Bundesministerium Für Ernährung, Landwirtschaft und Verbraucherschutz. Ökologischer Landbau. Available online: http://www.bmelv.de (accessed on 12 June 2010).
  65. Sandmeier, S.; Müller, C.; Hosgood, B.; Andreoli, G. Physical Mechanisms in Hyperspectral BRDF Data of Grass and Watercress. Remote Sens. Environ. 1998, 66, 222–233. [Google Scholar] [CrossRef]
  66. Gerstl, S. The angular reflectance signature of the canopy hot spot in the optical regime. In Proceedings of the 4th International Colloquium Spectral Signatures of Objects in Remote Sensing, Aussois, France, 18–22 January 1988; pp. 129–132. [Google Scholar]
  67. Gerstl, S.; Simmer, C. Radiation physics and modelling for off-nadir satellite sensing of non-lambertian surfaces. Remote Sens. Environ. 1986, 20, 1–29. [Google Scholar] [CrossRef]
  68. Coulson, K. Effects of Reflection Properties of Natural Surfaces in Aerial Reconnaissance. Appl. Opt. 1966, 5, 905–917. [Google Scholar] [CrossRef] [PubMed]
  69. Sandmeier, S.; Deering, D. Structure Analysis and Classification of Boreal Forests Using Airborne Hyperspectral BRDF Data from ASAS. Remote Sens. Environ. 1999, 69, 281–295. [Google Scholar] [CrossRef]
  70. Verdebout, J.; Jacquemoud, S.; Schmuck, G. Optical Properties of Leaves: Modelling and Experimental Studies. In Imaging Spectrometry—A Tool for Environmental Observations; ECSC, EEC, EAEC: Brussels, Luxembourg, 1994; pp. 169–191. [Google Scholar]
  71. Kumar, L.; Schmidt, K.; Dury, S.; Skidmore, A. Imaging Spectrometry and Vegetation Science. In Imaging Spectrometry. Basic Principles and Prospective Applications; Kluwer Academic Publishers: Enschede, The Netherlands, 2001; pp. 111–155. [Google Scholar]
  72. Knipling, E.B. Physical and physiological basis for the reflectance of visible and near-infrared radiation from vegetation. Remote Sens. Environ. 1970, 1, 155–159. [Google Scholar] [CrossRef]
  73. Buschmann, C. Fernerkundung von Pflanzen, Ausbreitung, Gesundheitszustand und Produktivität. Naturwissenschaften 1993, 80, 439–453. [Google Scholar] [CrossRef]
  74. Hoffer, R. Biological and Physical Considerations in Applying Computer-Aided Analysis Techniques to Remote Sensor Data. In Remote Sensing: The Quantitative Approach; Mcgraw-Hill College: New York, NY, USA, 1978; pp. 297–343. [Google Scholar]
  75. Belward, A. Spectral Characteristics of Vegetation, Soil And Water in Visible, Near Infrared and Middle-Infrared Wavelengths. In Remote Sensing and Geographical Information Systems of Resource Management in Developing Countries; Kluwer Academic Publishers: Dordrecht, The Netherlands, 1991; pp. 31–53. [Google Scholar]
  76. GEOGLAM Crop Monitor. Available online: http://www.cropmonitor.org (accessed on 7 November 2018).
  77. Crop Watch. Available online: http://www.cropwatch.com (accessed on 7 November 2018).
  78. Loizzo, R.; Guarini, R.; Longo, F.; Scopa, T.; Formaro, R.; Facchinetti, C.; Varacalli, G. PRISMA: The Italian Hyperspectral Mission. In Proceedings of the International Geoscience and Remote Sensing Symposium on Observing, Understanding and Forecasting the Dynamics of our Planet (IGARSS), Valencia, Spain, 22–27 July 2018. [Google Scholar]
  79. Matsunaga, T.; Iwasaki, A.; Tsuchida, S.; Iwao, K.; Tanii, J.; Kashimura, O.; Nakamura, R.; Yamamoto, H.; Kato, S.; Obata, K.; Mouri, K.; Tachikawa, T. HISUI Status toward FY2019 Launch. In Proceedings of the International Geoscience and Remote Sensing Symposium on Observing, Understanding and Forecasting the Dynamics of our Planet (IGARSS), Valencia, Spain, 22–27 July 2018. [Google Scholar]
  80. Feingersh, T.; Ben Dor, E. SHALOM—A Commercial Hyperspectral Space Mission. In Optical Payloads for Space Missions; Wiley-Blackwell: Hoboken, NJ, USA, 2015; pp. 247–263. [Google Scholar]
  81. Carrere, V.; Briottet, X.; Jacquemoud, S.; Marion, R.; Bourguignon, A.; Chami, M.; Dumont, M.; Minghelli-Roman, A.; Weber, C.; Lefevre-Fonollosa, M.; et al. HYPXIM: A second generation high spatial resolution hyperspectral satellite for dual applications. In Proceedings of the 5th Workshop on Hyperspectral Image and Signal Processing: Evolution in Remote Sensing (WHISPERS), Gainesville, FL, USA, 26–28 June 2013; pp. 1–4. [Google Scholar]
  82. Nieke, J.; Rast, M. Towards the Copernicus Hyperspectral Imaging Mission for the Environment (CHIME). In Proceedings of the International Geoscience and Remote Sensing Symposium on Observing, Understanding and Forecasting the Dynamics of our Planet (IGARSS), Valencia, Spain, 22–27 July 2018. [Google Scholar]
Figure 1. Modelled phenology stages of winter barley and their corresponding BBCH stages. The colours are chosen to visually support the phenological development. They do not correspond to any spectral characteristics.
Remotesensing 10 01767 g001
Figure 2. Example canopies for early tillering (left), late stem elongation (middle) and early ripening (right) for rye (left), wheat (middle) and barley (right).The images are sampled with drat and the colours correspond to spectral characteristics.
Remotesensing 10 01767 g002
Figure 3. Artificial reflectance of winter barley (green), winter rye (yellow) and winter wheat (red) with constant artificial optical properties during the different BBCH growth stages.
Remotesensing 10 01767 g003
Figure 4. Influence of different artificial optical characteristics of plant parts on the canopy reflectance of (a) winter barley; (b) winter rye and (c) winter wheat during phenological growth stages (BBCH). The legend description gives the values for the artificial optical characteristics of: leaves and stems reflectance | leaves and stems transmittance | leaves and stems absorptance | ears reflectance. The blue line corresponds to the coefficient of variation of the plotted spectra.
Remotesensing 10 01767 g004aRemotesensing 10 01767 g004b
Figure 5. Influence of row spacing on top-of-canopy reflectance of (a,b) winter barley; (c,d) winter rye and (e,f) winter wheat during (a,c,e) emergence of ears, and (b,d,f) full ripening. The blue line corresponds to the coefficient of variation of the plotted spectra.
Remotesensing 10 01767 g005aRemotesensing 10 01767 g005b
Figure 6. Top-of-canopy reflectance for winter barley canopies during ear emergence with (a) medium (13–17 cm) and (b) wide (22–26 cm) row spacing. The blue line corresponds to the coefficient of variation of the plotted spectra.
Remotesensing 10 01767 g006
Figure 7. Continuum removed spectra (left) of canopies with varying plant density of (a) winter barley; (b) winter rye; and (c) winter wheat during ripening. Regression analysis (right) between plant density and top-of-canopy reflectance at λ = 480 nm (blue), λ = 554 nm (green), λ = 686 nm (red), and λ = 980 nm (dark red) of (a) winter barley; (b) winter rye; and (c) winter wheat during ripening.
Remotesensing 10 01767 g007aRemotesensing 10 01767 g007b
Figure 8. BRDF of winter wheat canopies during early stem elongation at λ = 670 nm and λ = 800 nm for wide, medium and narrow spacing between plant rows and for different plant density.
Remotesensing 10 01767 g008
Figure 9. BRDF of winter wheat canopies during early stem elongation at λ = 670 nm and λ = 800 nm for different relative row orientations (RRO = [0 , 30 , 60 , 90 ]).
Remotesensing 10 01767 g009
Figure 10. BRDF of winter wheat canopies at early stem elongation at λ = 670 nm and λ = 800 nm with different canopy densities.
Remotesensing 10 01767 g010
Table 1. Fixed artificial optical properties.
Radiant Power QuantitiesLeavesStemsEarsSoil
Reflectance (R)0.30.60.60.0
Transmittance (T)0.20.00.0-
Absorptance (A)0.50.40.41.0
Table 2. Varying artificial optical properties. With R for reflectance, T for transmittance and A for absorptance factors.
ScenarioLeavesStemsEarsSoil
RTARTARTARA
11.00.00.00.60.00.40.60.00.40.01.0
20.90.10.00.60.00.40.60.00.40.01.0
30.80.10.10.60.00.40.60.00.40.01.0
40.70.20.10.60.00.40.60.00.40.01.0
50.60.20.20.60.00.40.60.00.40.01.0
60.50.30.20.60.00.40.60.00.40.01.0
70.40.30.30.60.00.40.60.00.40.01.0
80.30.40.30.60.00.40.60.00.40.01.0
90.20.40.40.60.00.40.60.00.40.01.0
100.10.50.40.60.00.40.60.00.40.01.0
Table 3. Number of canopy modelling scenarios, in total about 85,000 drat computations.
Crop TypesModelling StagesPlant AppearanceRRORSPDObservationsTotal
Nadir Art. Opt. Prop.31311311117
Nadir Nat. Opt. Prop.31313633112,636
BRDF (mod. stage 4)314 (1)437 (5)11335,652
BRDF (mod. stage 3, 5 & 6)33143311336,612
Table 4. Influence of row spacing (RS) and relative row orientation (RRO) on the BRDF of the different virtual cereal canopies: winter barley (WB), winter rye (WR), winter wheat (WW). Categorised through an automated and visual evaluation of BRDF figures: + the influence of row spacing is automatically measurable; * the influence of row spacing is visually noticeable; and − there is no influence of row spacing noticeable. The different plant density results from the constant number of plants along a plant row for the different row spacings.
Structure FeaturesInfluence of Row Spacing and Row Orientation on BRDF
RRORSPlants/m 2 WBWRWWWBWRWW
BRDF at λ = 670 nmBRDF at λ = 800 nm
0 wide35–60+++**
0 medium60–100***
0 narrow90–150**
30 wide35–60+*++++
30 medium60–100****
30 narrow90–150
60 wide35–60+*++*+
60 medium60–100****
60 narrow90–150
90 wide35–60******
90 medium60–100
90 narrow90–150

