How Can Big Data Support Smart Scenic Area Management? An Analysis of Travel Blogs on Huashan


Abstract
:1. Introduction
- How do Huashan visitors describe their travel experiences in blogs?
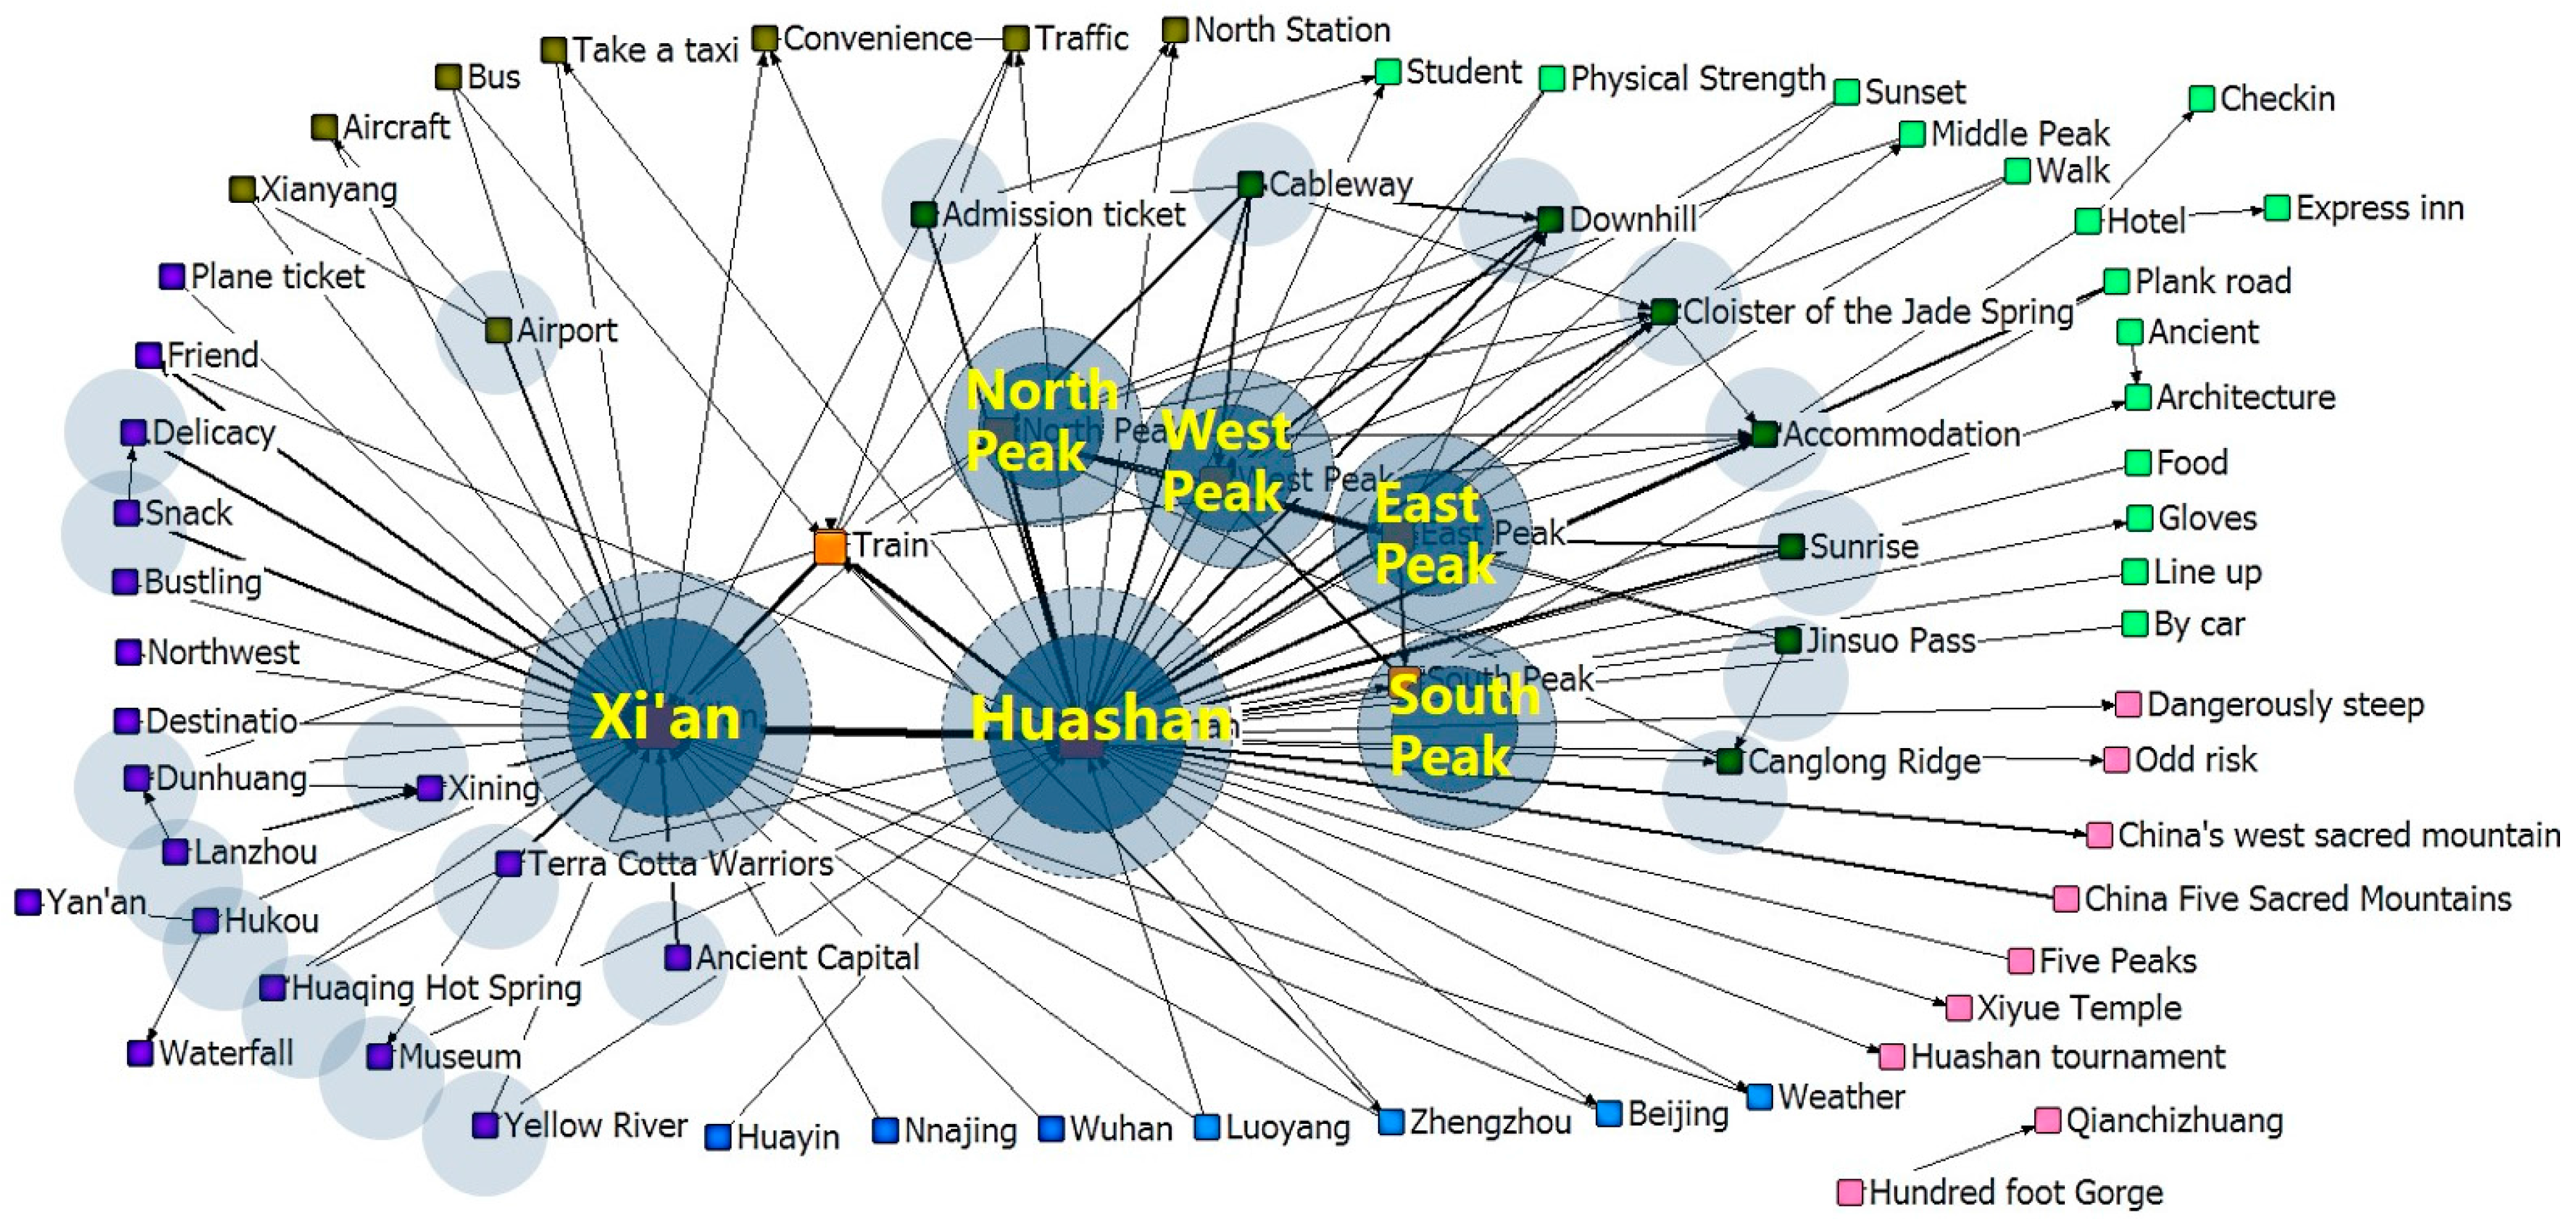
- What sites are visited within the Huashan scenic area?
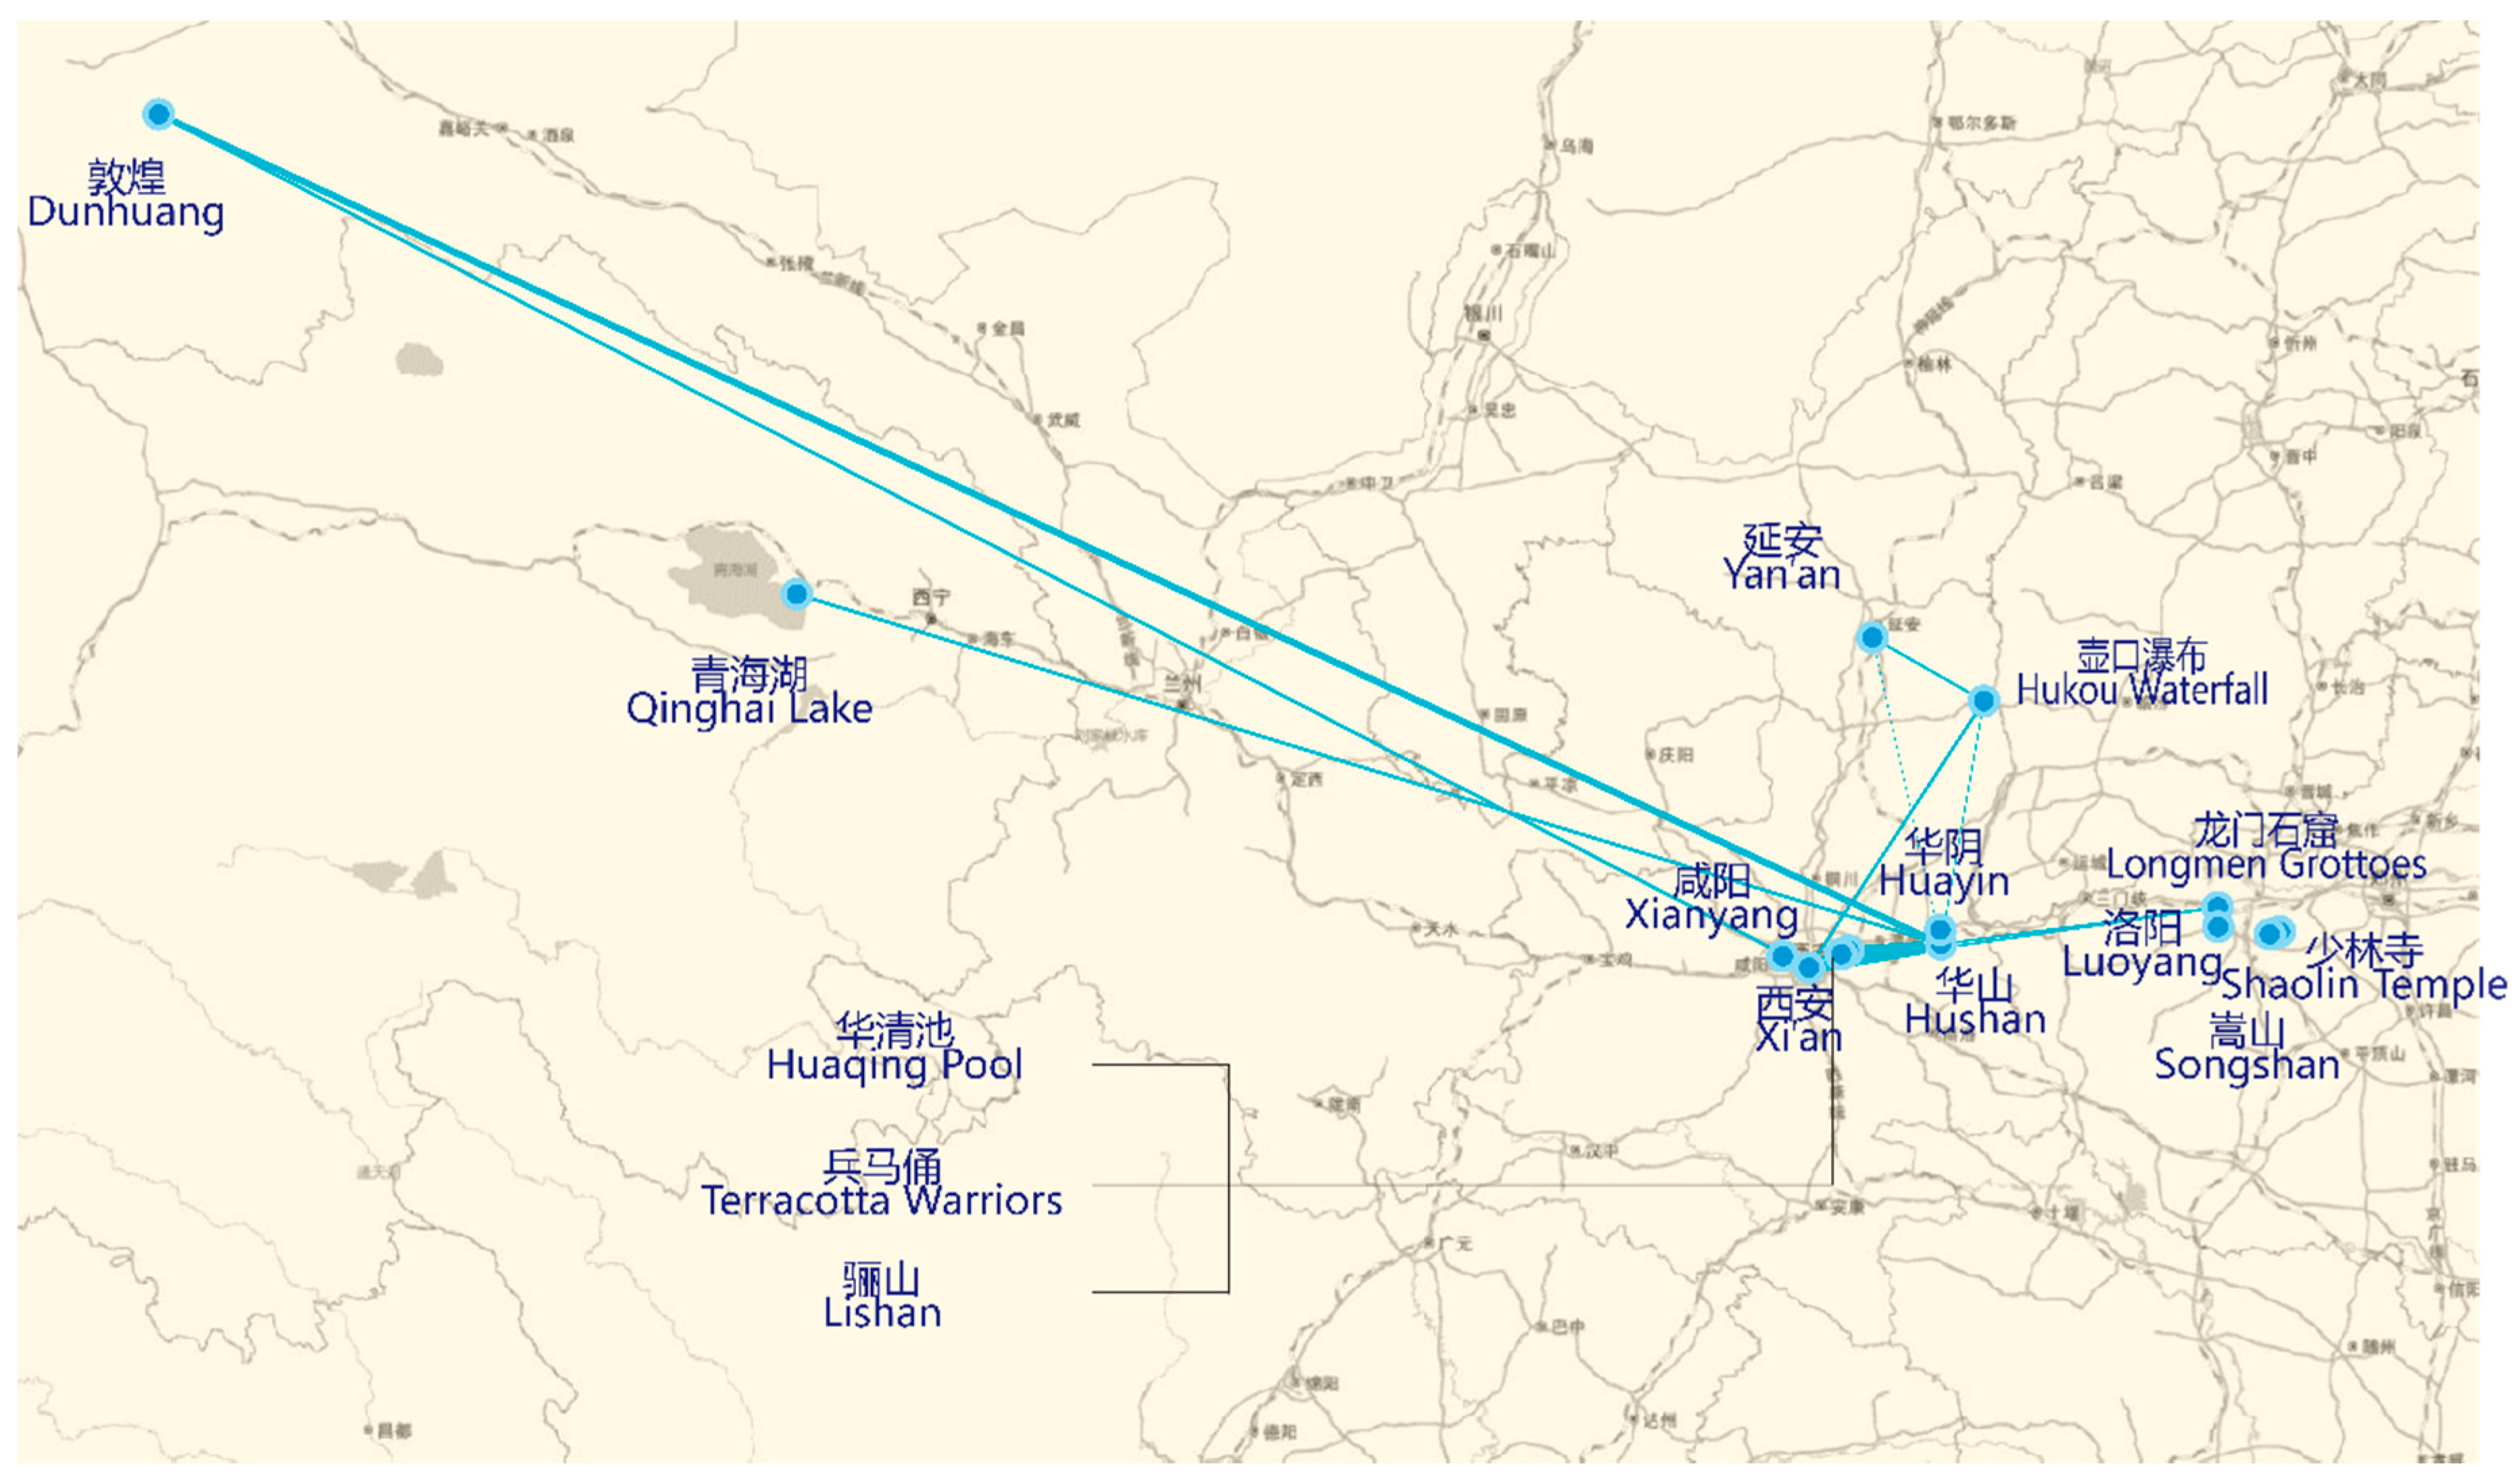
- What are the patterns of movement within Huashan and adjoining destinations?
- Are people satisfied with their experiences at Huashan? If tourists are dissatisfied, what are the reasons?
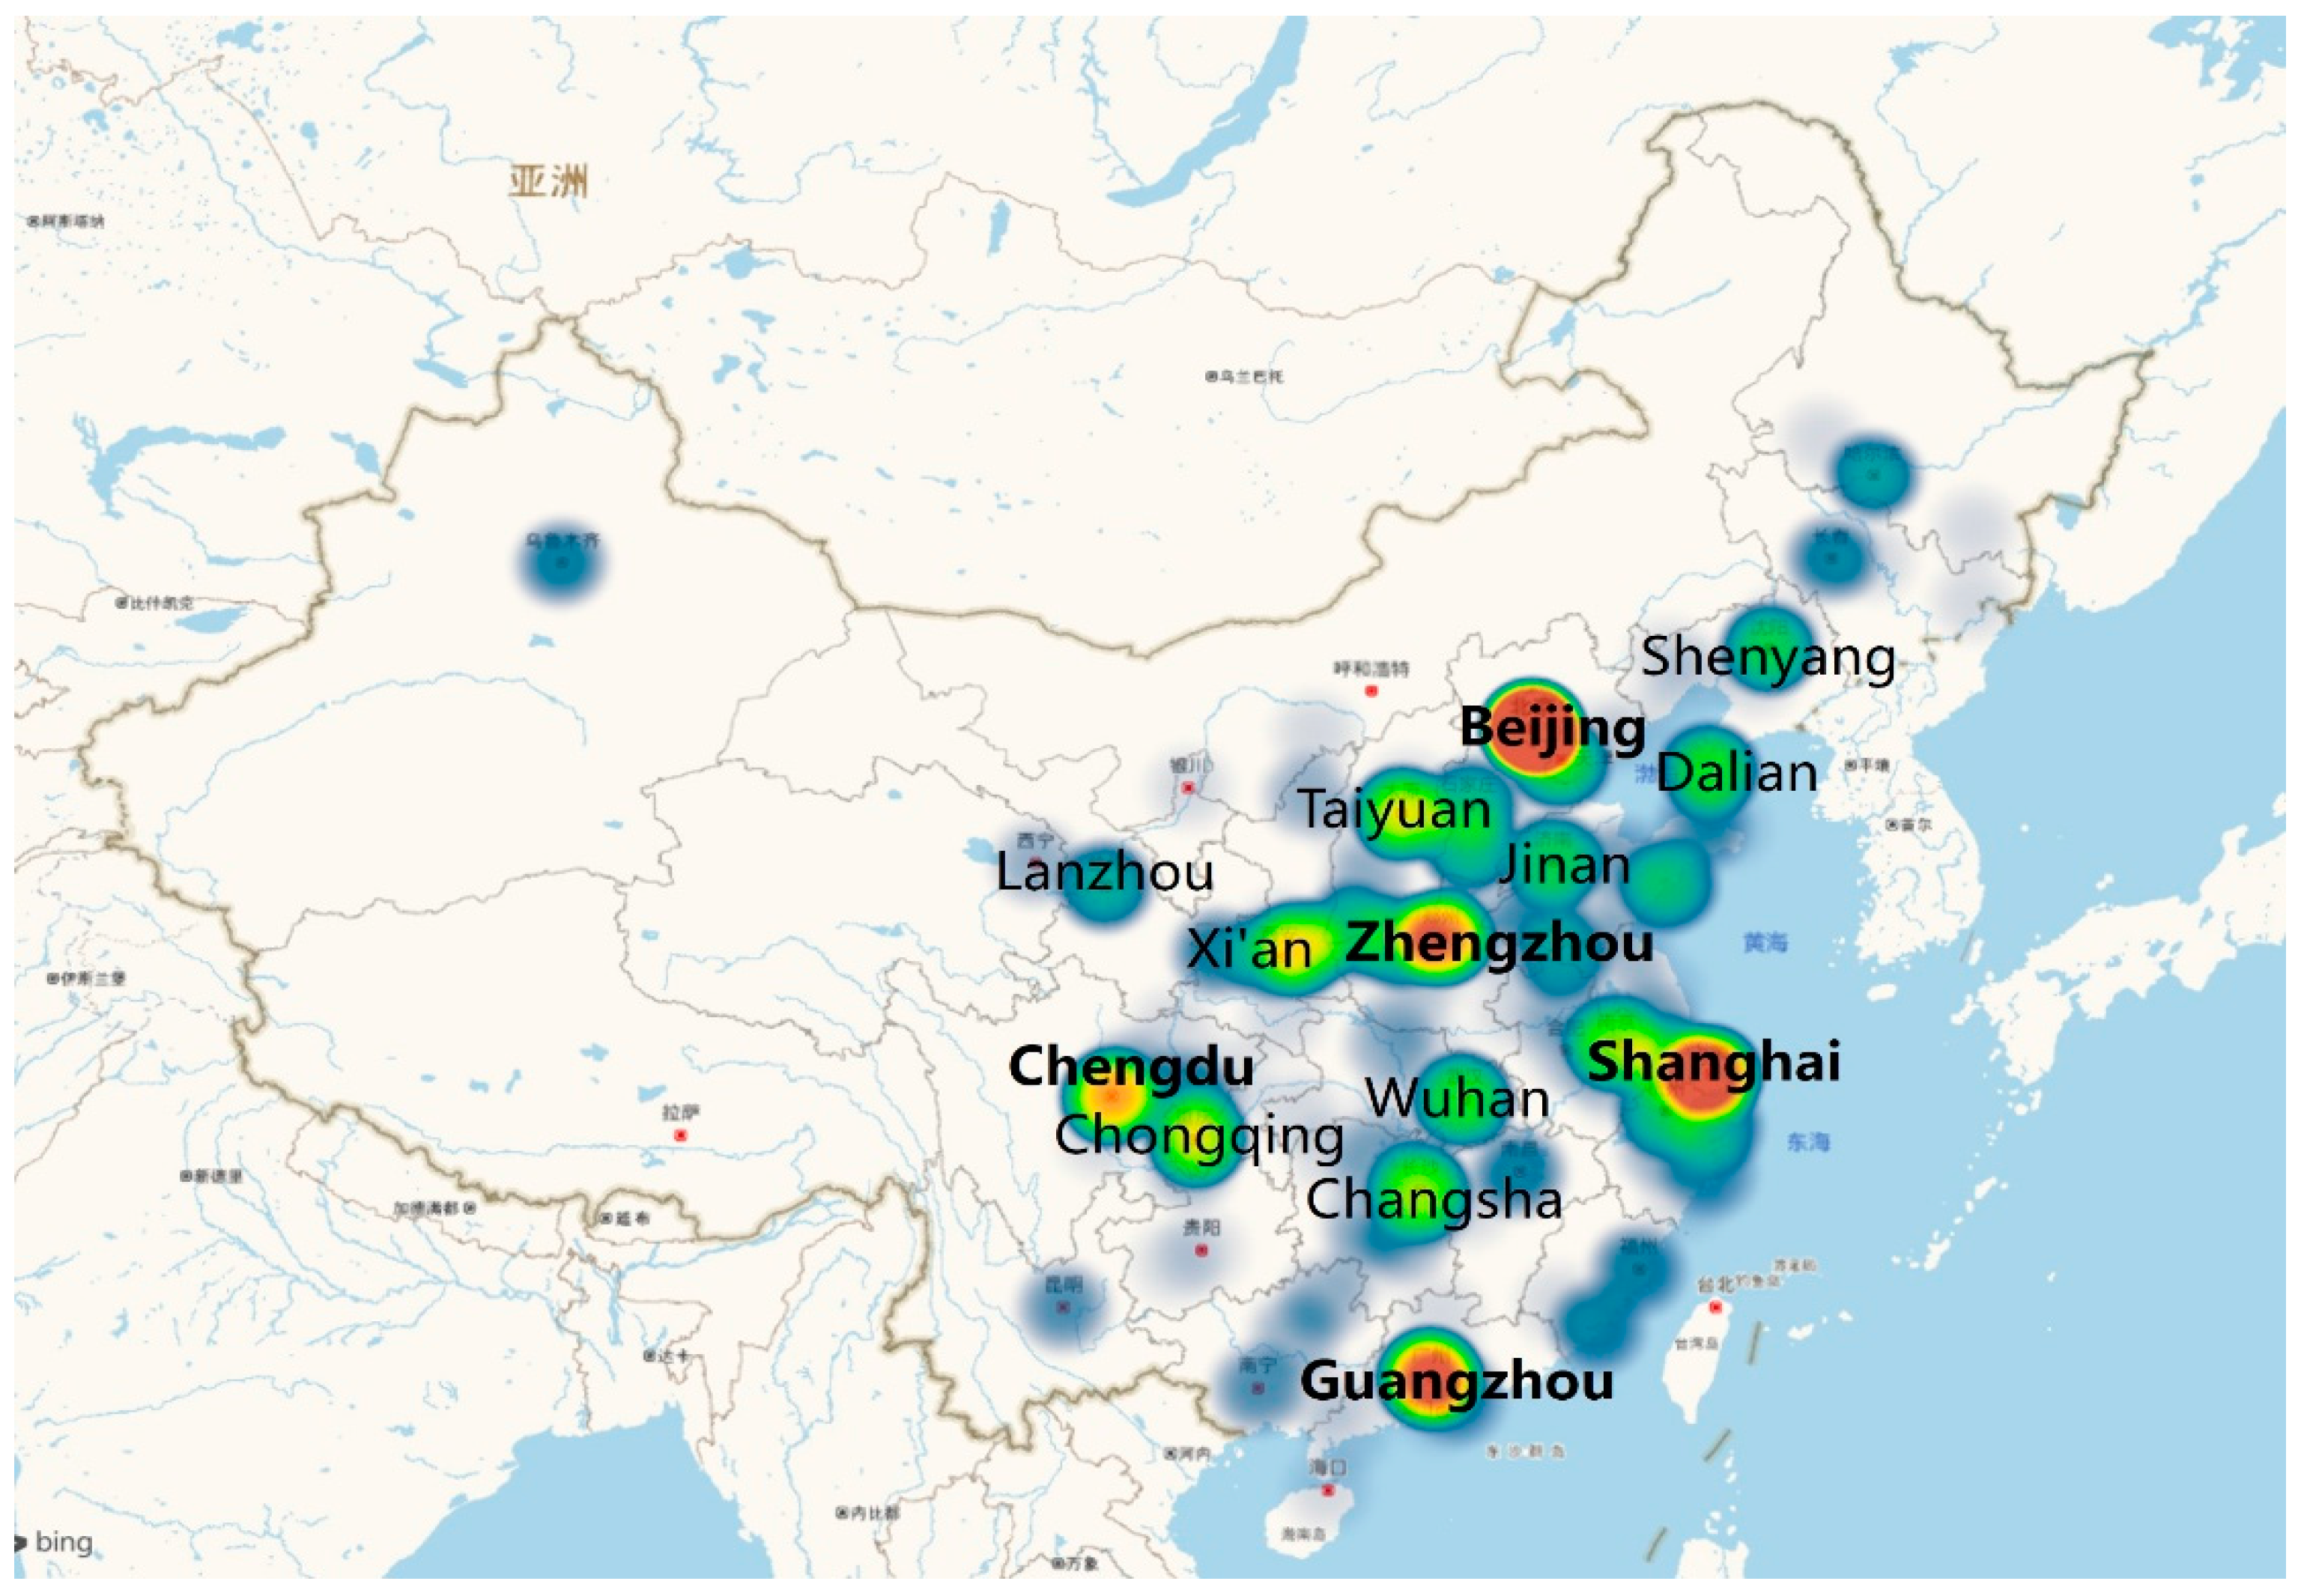
- What are the geographic origins of Huashan tourists?
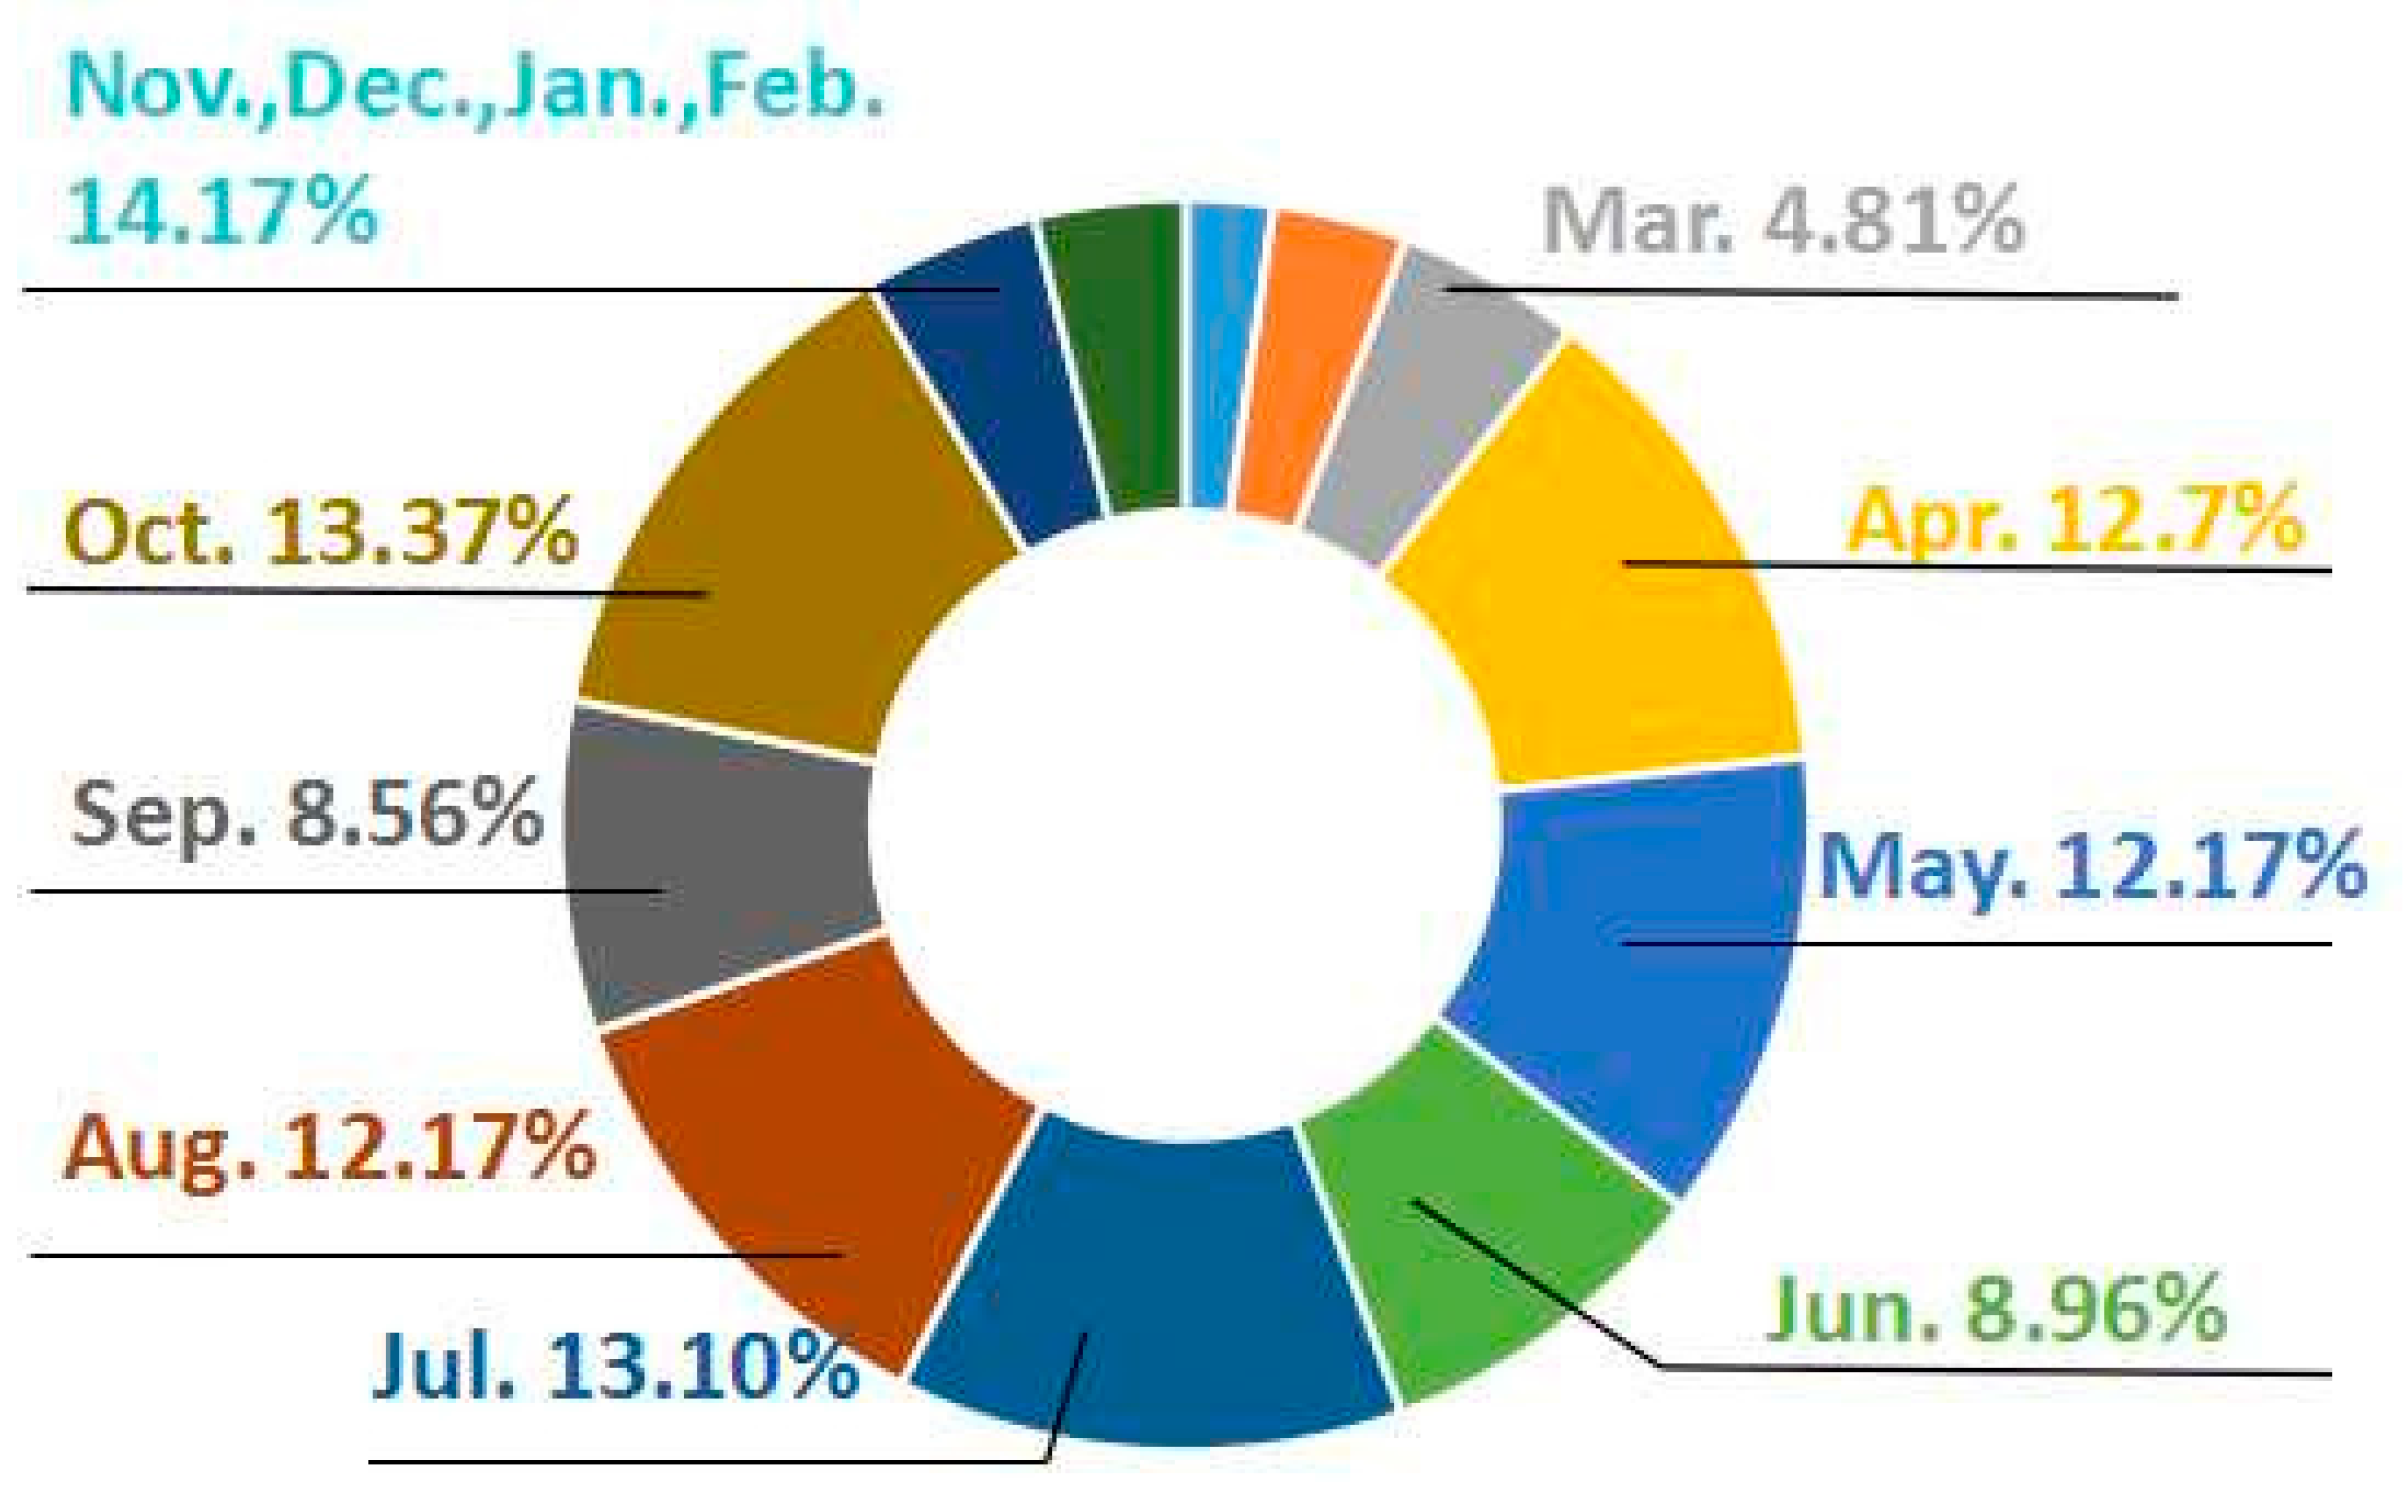
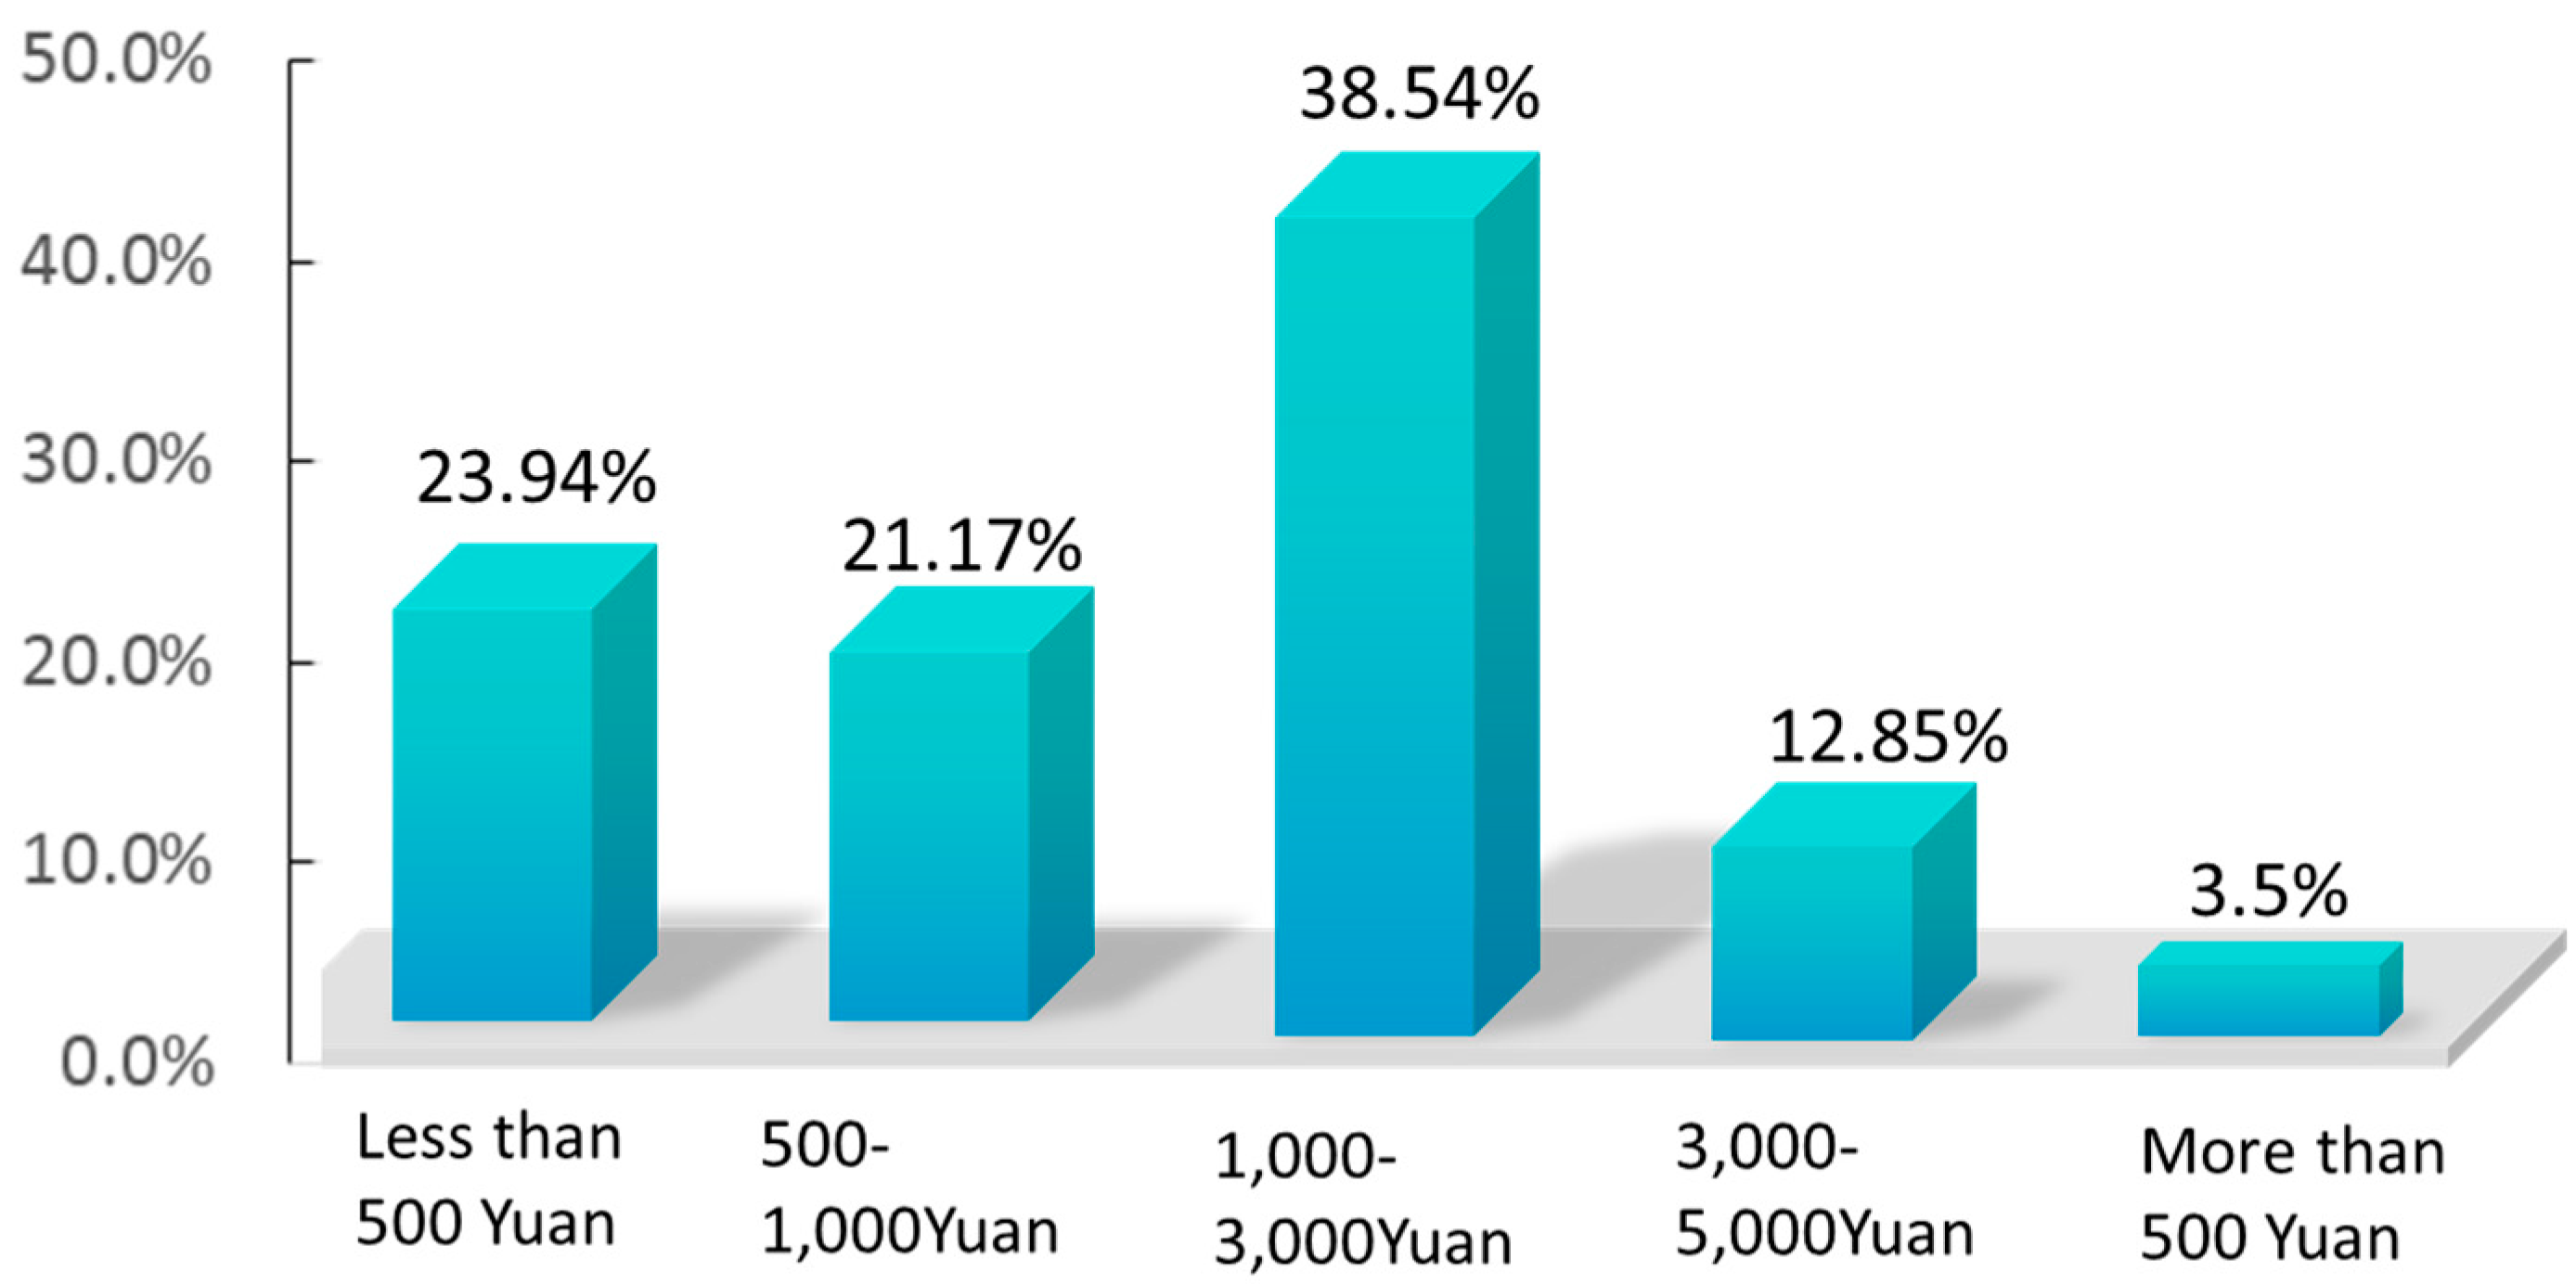
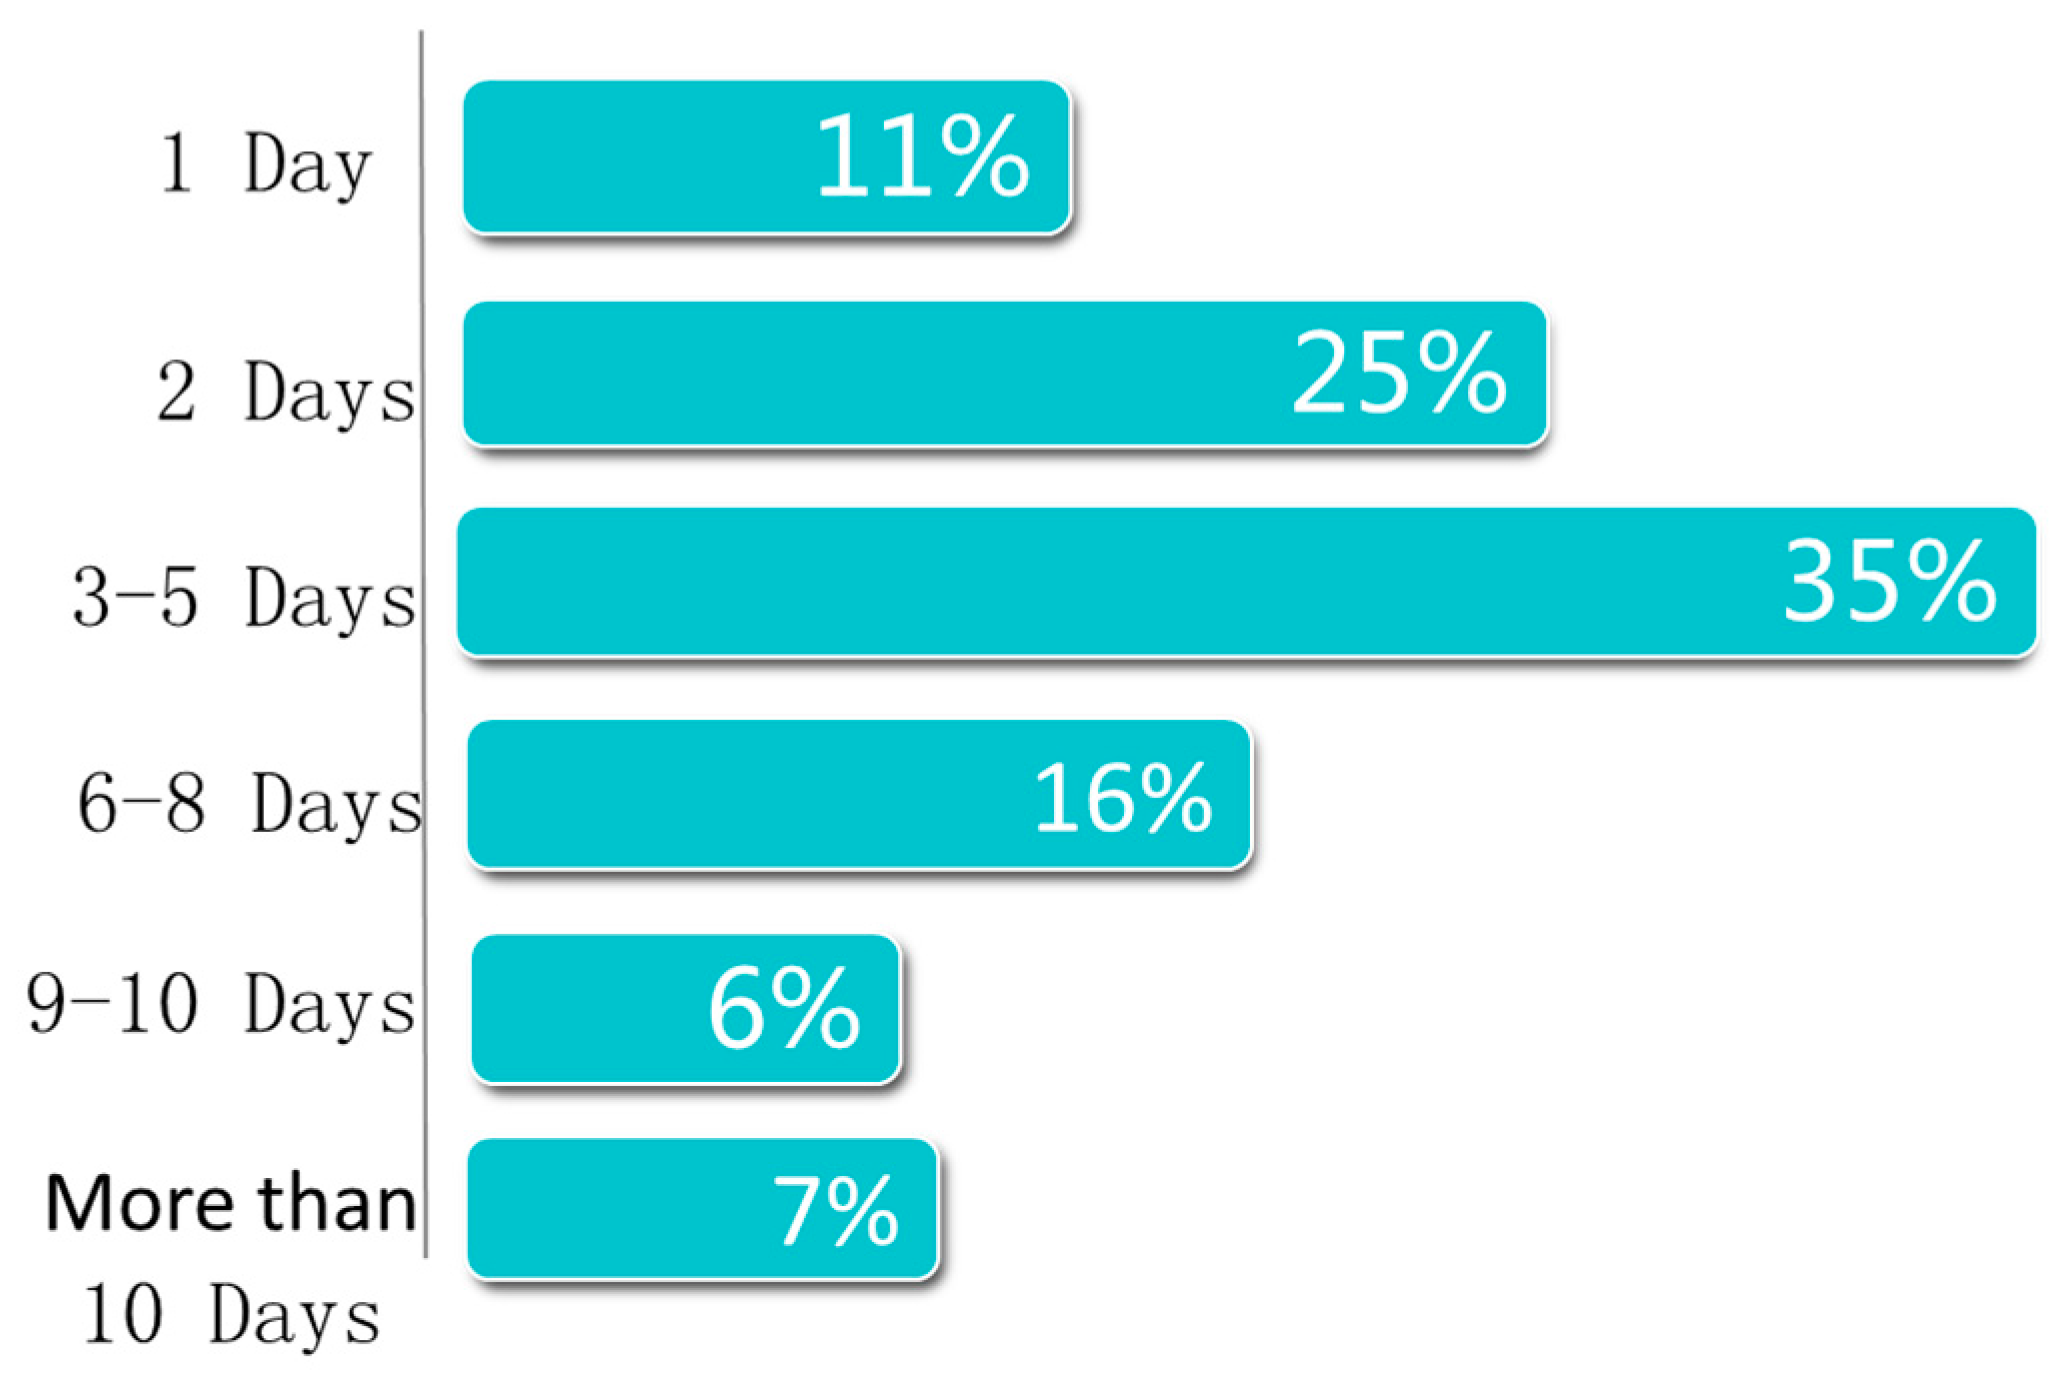
- What are the monthly distributions of visits, expenditures, and lengths of stay for visitors to Huashan?
2. Literature Review
2.1. Travel Blog Data and Tourist Behavior
2.2. Analysis of Tourist-Generated Big Data
3. Methods
3.1. Data Collection
3.2. Data Cleaning
3.3. Data Analysis
4. Results
4.1. Content Analysis of Huashan Travel Blogs
4.2. Travel Pattern Analysis
4.3. Satisfaction or Dissatisfaction with Huashan Trips
4.4. Regions of Origin of Huashan Tourists
5. Conclusions, Management Implications, and Research Limitations
Acknowledgments
Author Contributions
Conflicts of Interest
Appendix A.

| No. | Word | Occurrence Number | No. | Word | Occurrence Number | No. | Word | Occurrence Number | No. | Word | Occurrence Number |
|---|---|---|---|---|---|---|---|---|---|---|---|
| 1 | Huashan 华山 | 580 | 57 | Walk 步行 | 41 | 113 | Cost 费用 | 26 | 169 | On foot 走路 | 17 |
| 2 | Xi’an 西安 | 464 | 58 | Gold Lock 金锁关 | 41 | 114 | Photograph 拍照 | 26 | 170 | Graduation 毕业 | 17 |
| 3 | North Peak 北峰 | 125 | 59 | Take taxi 打车 | 39 | 115 | Mutton 羊肉 | 24 | 171 | Steep 陡峭 | 15 |
| 4 | Train 火车 | 103 | 60 | Plane ticket 机票 | 39 | 116 | Reserve 预定 | 24 | 172 | Economic 省钱 | 15 |
| 5 | West Peak 西峰 | 95 | 61 | Tour line 路线 | 39 | 117 | Vacation 假期 | 24 | 173 | Spectacular 壮观 | 15 |
| 6 | Wall 城墙 | 132 | 62 | Student 学生 | 38 | 118 | Hiking 徒步 | 24 | 174 | Direct 直达 | 15 |
| 7 | Cableway 索道 | 131 | 63 | Urban 市区 | 38 | 119 | Yummy 好吃 | 24 | 175 | Alone 独自 | 15 |
| 8 | East Peak 东峰 | 122 | 64 | North Station 北站 | 38 | 120 | Xining 西宁 | 24 | 176 | Luggage 行李 | 14 |
| 9 | History 历史 | 108 | 65 | Beijing 北京 | 38 | 121 | Mogao Grottoes 莫高窟 | 24 | 177 | Plan 规划 | 14 |
| 10 | Yuquan Yard 玉泉院 | 107 | 66 | Taste 味道 | 38 | 122 | Tang Paradise 芙蓉园 | 23 | 178 | Entrance 入口 | 14 |
| 11 | Huis 回民 | 105 | 67 | China’s West Mountain 西岳 | 36 | 123 | Camera 相机 | 23 | 179 | Lanzhou 兰州 | 14 |
| 12 | Train station 火车站 | 104 | 68 | Experience 体验 | 36 | 124 | Taxi 出租车 | 23 | 180 | Private Cabs 黑车 | 14 |
| 13 | Airport 机场 | 102 | 69 | Luoyang 洛阳 | 36 | 125 | Destination 目的地 | 23 | 181 | Cloud Peak 云峰 | 12 |
| 14 | Hotel 酒店 | 101 | 70 | Convenient 方便 | 35 | 126 | Ancient 古代 | 23 | 182 | Lishan 骊山 | 12 |
| 15 | Sunrise 日出 | 93 | 71 | Steps 台阶 | 33 | 127 | Train Tickets 火车票 | 23 | 183 | Express Inn 快捷酒店 | 12 |
| 16 | Tourist 游客 | 92 | 72 | Scenery 风景 | 33 | 128 | Worry 担心 | 23 | 184 | Tourist 游人 | 12 |
| 17 | Admission ticket 门票 | 84 | 73 | Fountain 喷泉 | 33 | 129 | By car 坐车 | 23 | 185 | Expectation 期待 | 12 |
| 18 | Drum Tower 鼓楼 | 78 | 74 | Knapsack 背包 | 33 | 130 | Park 公园 | 23 | 186 | Whole Course 全程 | 12 |
| 19 | Accommodation 住宿 | 78 | 75 | Museum 博物馆 | 33 | 131 | Guide 导游 | 21 | 187 | Clothes 衣服 | 12 |
| 20 | Downhill 下山 | 74 | 76 | Cheap 便宜 | 32 | 132 | Freedom 自由 | 21 | 188 | Guangzhou 广州 | 12 |
| 21 | Snack 小吃 | 74 | 77 | Aircraft 飞机 | 32 | 133 | Hotel 宾馆 | 21 | 189 | East Gate 东门 | 12 |
| 22 | Route 路线 | 74 | 78 | The Forest of Steles 碑林 | 32 | 134 | Huayin 华阴 | 21 | 190 | Natural 自然 | 12 |
| 23 | Yan Pagoda 雁塔 | 72 | 79 | China’s Five Sacred Mountains 五岳 | 30 | 135 | Wuhan 武汉 | 21 | 191 | Unfortunately 可惜 | 12 |
| 24 | Terracotta Warriors 兵马俑 | 71 | 80 | Huaqing Pool 华清池 | 30 | 136 | Many People 人多 | 21 | 192 | Challenge 挑战 | 12 |
| 25 | Shanxi 陕西 | 69 | 81 | Perform 表演 | 30 | 137 | Chengdu 成都 | 21 | 193 | Leave 离开 | 12 |
| 26 | South Peak 南峰 | 69 | 82 | Legend 传说 | 30 | 138 | Regret 遗憾 | 21 | 194 | Unique 唯一 | 12 |
| 27 | Bell tower 钟楼 | 68 | 83 | Hukou Waterfall 壶口瀑布 | 30 | 139 | Journey 旅途 | 20 | 195 | Yaozifanshen 鹞子翻身 | 11 |
| 28 | Climbing 登山 | 66 | 84 | Cold Rice Noodles 凉皮 | 30 | 140 | Xianyang 咸阳 | 20 | 196 | Shuttle Bus 班车 | 11 |
| 29 | Delicacy 美食 | 65 | 85 | Driver 司机 | 30 | 141 | Tent 帐篷 | 20 | 197 | Huangshan 黄山 | 11 |
| 30 | Square 广场 | 65 | 86 | Security 安全 | 30 | 142 | Nanjing 南京 | 20 | 198 | Expenditure 花费 | 11 |
| 31 | Plank walk 栈道 | 62 | 87 | Middle Peak 中峰 | 29 | 143 | Tianjin 天津 | 20 | 199 | Impression 印象 | 11 |
| 32 | Metro 地铁 | 60 | 88 | Map 地图 | 29 | 144 | Glove 手套 | 20 | 200 | Shock 震撼 | 11 |
| 33 | Culture 文化 | 57 | 89 | Sunset 日落 | 29 | 145 | Gate 山门 | 20 | 201 | Yuntai 云台 | 11 |
| 34 | Rest 休息 | 57 | 90 | Line up 排队 | 29 | 146 | Memorial Gateway 牌坊 | 20 | 202 | Imagine 想象 | 11 |
| 35 | Changan 长安 | 57 | 91 | Side 旁边 | 29 | 147 | Shaanxi 陕西省 | 20 | 203 | Setting sun 夕阳 | 11 |
| 36 | Online 网上 | 57 | 92 | Baidu 百度 | 29 | 148 | Smoothly 顺利 | 20 | 204 | Ticket Office 售票处 | 11 |
| 37 | Architecture 建筑 | 57 | 93 | Music 音乐 | 29 | 149 | Environment 环境 | 18 | 205 | Sell ticket 售票 | 11 |
| 38 | Story 故事 | 57 | 94 | Love 爱情 | 29 | 150 | Happy 开心 | 18 | 206 | Early morning 清晨 | 11 |
| 39 | Traffic 交通 | 56 | 95 | Chartered 包车 | 29 | 151 | Beauty 漂亮 | 17 | 207 | Shanxi opera 秦腔 | 11 |
| 40 | Friend 朋友 | 56 | 96 | Youth 青年 | 29 | 152 | Check in 入住 | 17 | 208 | Strange 陌生 | 11 |
| 41 | Canglong Ridge 苍龙岭 | 56 | 97 | Northwest 西北 | 27 | 153 | Food 食物 | 17 | 209 | Beautiful 美丽 | 11 |
| 42 | Since ancient 自古 | 54 | 98 | Classmate 同学 | 27 | 154 | Thousands of Years 千年 | 17 | 210 | Hotel 旅馆 | 11 |
| 43 | Physical Strength 体力 | 54 | 99 | Qinghai Lake 青海湖 | 27 | 155 | Dayan Pagoda 大雁塔 | 17 | 211 | Lotus 莲花 | 11 |
| 44 | Mountaintop 山顶 | 53 | 100 | Ticket Price 票价 | 27 | 156 | Street 街道 | 17 | 212 | Nervous 紧张 | 11 |
| 45 | Xiyue Temple 岳庙 | 53 | 101 | Problem 问题 | 27 | 157 | Taiyuan 太原 | 17 | 213 | Explain 讲解 | 11 |
| 46 | Ancient City 古城 | 53 | 102 | Taishan 泰山 | 27 | 158 | Dinner 晚饭 | 17 | 214 | Memory 回忆 | 11 |
| 47 | Onhill 山上 | 53 | 103 | Huashan Road 华山路 | 27 | 159 | The Great Wall 长城 | 17 | 215 | Reasonable 合理 | 11 |
| 48 | Bus 大巴 | 51 | 104 | Restaurant 饭店 | 27 | 160 | Comfortable 舒服 | 17 | 216 | Hanzhoung 汉中 | 11 |
| 49 | Museum 博物馆 | 51 | 105 | Visit 游览 | 27 | 161 | Real 真实 | 17 | 217 | Altitude 海拔 | 11 |
| 50 | Weather 天气 | 50 | 106 | University 大学 | 26 | 162 | Kaifeng 开封 | 17 | 218 | Country 国家 | 11 |
| 51 | Cable Car 缆车 | 44 | 107 | Yan’an 延安 | 26 | 163 | Hard Seat 硬座 | 17 | 219 | Thank 感谢 | 11 |
| 52 | Transit 公交 | 42 | 108 | Xi’an Downtown 西安市 | 26 | 164 | Famous 有名 | 17 | 220 | Bustling 繁华 | 11 |
| 53 | Zhengzhou 郑州 | 42 | 109 | Bus 公交车 | 26 | 165 | Dangerously Steep 险峻 | 17 | 221 | Metro Station 地铁站 | 11 |
| 54 | Bell and Drum Tower 钟鼓楼 | 42 | 110 | Yellow River 黄河 | 26 | 166 | Desert 沙漠 | 17 | 222 | Road 道路 | 11 |
| 55 | Dunhuang 敦煌 | 42 | 111 | Qianchi Zhuang 千尺幢 | 26 | 167 | Hundred Foot Gorge 百尺峡 | 17 | 223 | Miss 错过 | 11 |
| 56 | Ancient Capital 古都 | 41 | 112 | Ruins 遗址 | 26 | 168 | One way 单程 | 17 | 224 | White clouds 白云 | 11 |
References
- Dang, A.; Zhang, D.; Ma, Q. The Intelligent Scenic Spot Management and Service Discussion in the Big Data Era. J. Hum. Settl. Forum West China 2016, 31, 8–13. (In Chinese) [Google Scholar]
- Guo, L.; Li, Z.; Sun, W. Understanding Travel Destination from Structured Tourism Blogs. In Proceedings of the 2015 Wuhan International Conference on e-Business, Wuhan, China, 19–21 June 2015; pp. 144–151. [Google Scholar]
- Zhang, L. Smart Tourism Development Needs Intelligent Thinking. Available online: http://www.pinchain.com/article/33689 (accessed on 24 May 2016).
- Shao, Z.; Zhang, X.; Ma, J. Smart Management of Jiuzhai Valley Scenic Area Based on Internet of Things. Geogr. Inf. World 2010, 5, 12–16. (In Chinese) [Google Scholar]
- Deng, G.; Shao, Z. Intelligent Management and Service of Jiuzhai Valley Scenic Area Based on Video Cruise. Comput. Eng. Des. 2011, 11, 3920–3924. (In Chinese) [Google Scholar]
- Zhao, M. Jiuzhai Valley Launched A Big Data Mining System to Prevent a Repeat of the Over-Crowded Crisis. Available online: http://www.thepaper.cn/newsDetail_forward_1269459 (accessed on 24 May 2016).
- China Central TV. First Light in the Morning. Episode 1 of Chinese Civilization. Available online: http://shaoer.cntv.cn/children/C19222/classpage/video/20100301/101570.shtml (accessed on 26 May 2017).
- China Today. Huashan: The Top One Steepest and Wondrous Mountain in China. Available online: http://www.chinatoday.com.cn/chinese/mlzg/mlsh/201608/t20160831_800066194.html (accessed on 26 May 2017).
- China Internet News Center. Mount Huashan—The Root of Chinese. Available online: http://www.china.com.cn/culture/zhuanti/shz09/2010-04/09/content_19780491.htm (accessed on 26 May 2017).
- Huashan Administration Committee. Mount Huashan Won the Most Popular Tourist Attraction in 2017. Available online: http://www.weinan.gov.cn/news/bmdt/hgw/590986.htm (accessed on 18 October 2017).
- Weinan Daily News. Smart Tourism Plugs Wings for Great Huashan’s Soar. Available online: http://www.weinan.gov.cn/cul/lldt/560297.htm (accessed on 18 October 2017).
- Dang, A.; Yuan, M.; Shen, Z. Rational Planning and Urban and Rural Governance and Based on Smart City and Big Data. Constr. Sci. Technol. 2015, 5, 64–66. (In Chinese) [Google Scholar]
- Bian, F.; Du, J.; Meng, X. The Demand, Application and Challenge of Big Data Processing. J. Geomat. 2016, 4, 1–4. (In Chinese) [Google Scholar]
- Vu, H.Q.; Leung, R.; Rong, J. Exploring Park Visitors’ Activities in Hong Kong Using Geotagged Photos. In Information and Communication Technologies in Tourism 2016; Springer International Publishing: Gewerbestrasse, Switzerland, 2016; pp. 183–196. [Google Scholar]
- O’Neill, E.; Kostakos, V.; Kindberg, T. Instrumenting the City: Developing Methods for Observing and Understanding the Digital Cityscape. In Proceedings of the International Conference on Ubiquitous Computing, Orange County, CA, USA, 17–21 September 2006; Springer: Heidelberg, Germany, 2006; pp. 315–332. [Google Scholar]
- Zheng, Y.; Zha, Z.; Chua, T. Mining Travel Patterns from Geotagged Photos. ACM Trans. Intell. Syst. Technol. 2012, 3, 1–18. [Google Scholar] [CrossRef]
- Zheng, Y.; Zhang, L.; Xie, X. Mining Interesting Locations and Travel Sequences from GPS Trajectories. In Proceedings of the International Conference on World Wide Web, Madrid, Spain, 20–24 April 2009; ACM: New York, NY, USA, 2009; pp. 791–800. [Google Scholar]
- Wong, E.; Law, R.; Li, G. Reviewing Geotagging Research in Tourism. In Information and Communication Technologies in Tourism 2017; Springer International Publishing: Gewerbestrasse, Switzerland, 2017; pp. 43–57. [Google Scholar]
- Henderson, J.; Milligan, K.; Niccols, A. Event-Based Analysis of People’s Activities and Behavior Using Flickr and Panoramio Geotagged Photo Collections. In Proceedings of the International Conference Information Visualisation, London, UK, 26–29 July 2010; IEEE Computer Society: Washington, DC, USA, 2010; pp. 289–296. [Google Scholar]
- Kisilevich, S.; Mansmann, F.; Keim, D. P-DBSCAN: A Density Based Clustering Algorithm for Exploration and Analysis of Attractive Areas Using Collections of Geo-Tagged Photos. In Proceedings of the International Conference and Exhibition on Computing for Geospatial Research & Application, Washington, DC, USA, 21–23 June 2010; ACM: New York, NY, USA, 2010; pp. 1–4. [Google Scholar]
- Jiang, K.; Wang, P.; Yu, N. Context Rank: Personalized Tourism Recommendation by Exploiting Context Information of Geotagged Web Photos. In Proceedings of the Sixth International Conference on Image and Graphics, Hefei, China, 12–15 August 2011; IEEE Computer Society: Washington, DC, USA, 2011; pp. 931–937. [Google Scholar]
- Xiang, Z.; Du, Q.; Ma, Y.; Fan, W. A Comparative Analysis of Major Online Review Platforms: Implications for Social Media Analytics in Hospitality and Tourism. Tour. Manag. 2017, 58, 51–65. [Google Scholar] [CrossRef]
- Hall, C.M. Tourism: Rethinking the Social Science of Mobility; Prentice Hall: Harlow, UK, 2005. [Google Scholar]
- Hall, C.M. Time, space, tourism and social physics. Tour. Recreat. Res. 2005, 30, 93–98. [Google Scholar] [CrossRef]
- Hal, C.M.; Page, S.J. Progress in Tourism Management: From the Geography of Tourism to Geographies of Tourism—A Review. Tour. Manag. 2009, 30, 3–16. [Google Scholar] [CrossRef]
- Shoval, N.; McKercher, B.; Ng, E. Hotel location and tourist activity in cities. Ann. Tour. Res. 2011, 38, 1594–1612. [Google Scholar] [CrossRef]
- Forer, P.; Simmons, D. Serial experiences: Monitoring, Modelling and Visualising the Free Independent Traveller in New Zealand at Multiple Scales with GIS. In Monitoring and Management of Visitor Flows in Recreational and Protected Areas; Arnberger, A., Brandenburg, C., Muhar, A., Eds.; Institute of Landscape Architecture and Landscape Management, Bodenkultur University: Vienna, Austria, 2002; pp. 173–180. [Google Scholar]
- Lau, G.; McKercher, B. Understanding Tourist Movement Patterns in a Destination: A GIS Approach. Tour. Hosp. Res. 2006, 7, 39–49. [Google Scholar] [CrossRef]
- McKercher, B.; Lau, G. Movement Patterns of Tourists within a Destination. Tour. Geogr. 2008, 10, 355–374. [Google Scholar] [CrossRef]
- Xia, J.; Zeephongsekul, P.; Arrowsmith, C. Modelling Spatio-temporal Movement of Tourists Using Finite Markov Chains. Math. Comput. Simul. 2009, 79, 1544–1553. [Google Scholar] [CrossRef]
- Li, X.; Meng, F.; Uysal, M. Spatial Pattern of Tourist Flows Among the Asia-Pacific Countries: An Examination over a Decade. Asia Pac. J. Tour. Res. 2008, 13, 229–243. [Google Scholar] [CrossRef]
- Wu, C.; Carson, D. Spatial and Temporal Tourist Dispersal Analysis in Multiple Destination Travel. J. Travel Res. 2008, 46, 311–317. [Google Scholar] [CrossRef]
- Asakura, Y.; Iryo, T. Analysis of tourist Behaviour Based on the Tracking Data Collected Using a Mobile Communication Instrument. Transp. Res. Part A 2007, 41, 684–690. [Google Scholar] [CrossRef]
- Vu, H.; Gang, L.; Law, R. Exploring the Travel Behaviors of Inbound Tourists to Hong Kong Using Geotagged Photos. Tour. Manag. 2015, 46, 222–232. [Google Scholar] [CrossRef]
- Zheng, Y.; Zha, Z.; Chua, T. Research and Applications on Georeferenced Multimedia: A Survey. Multimed. Tools Appl. 2011, 51, 77–98. [Google Scholar] [CrossRef]
- Girardin, F.; Calabrese, F.; Fiore, F. Digital Footprinting: Uncovering Tourists with User-Generated Content. IEEE Pervasive Comput. 2008, 7, 36–43. [Google Scholar] [CrossRef]
- Hawelka, B.; Sitko, I.; Beinat, E. Geo-located Twitter as Proxy for Global Mobility Patterns. Cartogr. Geogr. Inf. Sci. 2014, 41, 260. [Google Scholar] [CrossRef] [PubMed]
- Li, D.; Yang, Y. GIS Monitoring of Traveler Flows Based on Big Data. In Analytics in Smart Tourism Design; Springer International Publishing: Gewerbestrasse, Switzerland, 2017; pp. 111–126. [Google Scholar]
- Kádár, B.; Gede, M. Where Do Tourists Go? Visualizing and Analysing the Spatial Distribution of Geotagged Photography. Cartogr. Int. J. Geogr. Inf. Geovis. 2013, 48, 78–88. [Google Scholar] [CrossRef]
- Sun, Y.; Fan, H.; Helbich, M.; Zipf, A. Analyzing Human Activities through Volunteered Geographic Information: Using Flickr to Analyze Spatial and Temporal Pattern of Tourist Accommodation. In Progress in Location-Based Services. Lecture Notes in Geoinformation and Cartography; Krisp, J., Ed.; Springer: Berlin/Heidelberg, Germany, 2013; pp. 57–69. [Google Scholar]
- Gretzel, U.; Sigala, M.; Xiang, Z.; Koo, C. Smart tourism: Foundations and developments. Electron. Mark. 2015, 25, 179–188. [Google Scholar] [CrossRef]
- Buhalis, D.; Amaranggana, A. Smart Tourism Destinations Enhancing Tourism Experience through Personalisation of Services. In Information and Communication Technologies in Tourism; Tussyadiah, I., Inversini, A., Eds.; Springer: Berlin/Heidelberg, Germany, 2015; pp. 377–389. [Google Scholar]


| Number | Keyword | Occurrence Number | Number | Keyword | Occurrence Number |
|---|---|---|---|---|---|
| 1 | Huashan 华山 | 580 | 19 | Accommodation 住宿 | 78 |
| 2 | Xi’an 西安 | 464 | 20 | Downhill 下山 | 74 |
| 3 | North Peak 北峰 | 125 | 21 | Snack 小吃 | 74 |
| 4 | Train 火车 | 103 | 22 | Route 路线 | 74 |
| 5 | West Peak 西峰 | 95 | 23 | Yan Pagoda 雁塔 | 72 |
| 6 | Wall 城墙 | 132 | 24 | Terracotta Warriors 兵马俑 | 71 |
| 7 | Cableway 索道 | 131 | 25 | Shanxi 陕西 | 69 |
| 8 | East Peak 东峰 | 122 | 26 | South Peak 南峰 | 69 |
| 9 | History 历史 | 108 | 27 | Bell Tower 钟楼 | 68 |
| 10 | Yuquan Yard 玉泉院 | 107 | 28 | Climbing 登山 | 66 |
| 11 | Huis 回民 | 105 | 29 | Delicacy 美食 | 65 |
| 12 | Train station 火车站 | 104 | 30 | Square 广场 | 65 |
| 13 | Airport 机场 | 102 | 31 | Plank walk 栈道 | 62 |
| 14 | Hotel 酒店 | 101 | 32 | Metro 地铁 | 60 |
| 15 | Sunrise 日出 | 93 | 33 | Culture 文化 | 57 |
| 16 | Tourist 游客 | 92 | 34 | Rest 休息 | 57 |
| 17 | Admission ticket 门票 | 84 | 35 | Chang’an 长安 | 57 |
| 18 | Drum Tower 鼓楼 | 78 | ... | ... | ... |
| No. | Destination | Destination | Co-Occurrence | No. | Destination | Destination | Co-Occurrence |
|---|---|---|---|---|---|---|---|
| 1 | Huashan 华山 | Xi’an 西安 | 353 | 10 | Huashan 华山 | Qinghai Lake 青海湖 | 10 |
| 2 | Huashan 华山 | Terracotta Warriors 兵马俑 | 50 | 11 | Xi’an 西安 | Terracotta Warriors 兵马俑 | 62 |
| 3 | Huashan 华山 | Dunhuang 敦煌 | 22 | 12 | Huaqing Pool 华清池 | Terracotta Warriors 兵马俑 | 30 |
| 4 | Huashan 华山 | Huaqing Pool 华清池 | 22 | 13 | Xi’an 西安 | Xianyang 咸阳 | 29 |
| 5 | Huashan 华山 | Luoyang 洛阳 | 21 | 14 | Xi’an 西安 | Dunhuang 敦煌 | 26 |
| 6 | Huashan 华山 | Huayin 华阴 | 19 | 15 | Xi’an 西安 | Hukou Waterfall 壶口瀑布 | 25 |
| 7 | Huashan 华山 | Hukou Waterfall 壶口瀑布 | 16 | 16 | Yan’an 延安 | Hukou Waterfall 壶口瀑布 | 23 |
| 8 | Huashan 华山 | Yan’an 延安 | 13 | 17 | Xi’an 西安 | Huaqing Pool 华清池 | 22 |
| 9 | Huashan 华山 | Xianyang 咸阳 | 11 | 18 | Xi’an 西安 | Luoyang 洛阳 | 11 |
| Category | Absolute Value > 20 | 10< Absolute Value < 20 | Absolute Value < 10 | |||
|---|---|---|---|---|---|---|
| Number | Proportion | Number | Proportion | Number | Proportion | |
| Positive | 1157 | 5.60% | 2653 | 12.85% | 7876 | 38.15% |
| Negative | 22 | 0.11% | 375 | 1.82% | 2362 | 11.44% |
| Issues | Existing Problems | Travel Blogs with Translation in English |
|---|---|---|
| Accommodation | Poor conditions, difficulty in booking at the height of the tourist season |
|
| ||
| ||
| ||
| Catering | Management confusion, high prices, bad service attitude |
|
| ||
| ||
| ||
| ||
| ||
| Toilets | Small quantity, heavy smell |
|
| ||
| ||
| Passenger ropeway | Long wait time |
|
| ||
| Capacity | Full of tourists |
|
| ||
| ||
| Sanitary | Litter everywhere |
|
| ||
| Transportation | Illegal taxis, rip off, old railway station |
|
| ||
| ||
| ||
| ||
| ||
|
| Number | Origin | Proportion | Number | Origin | Proportion |
|---|---|---|---|---|---|
| 1 | Beijing 北京 | 16% | 16 | Shenyang 沈阳 | 2% |
| 2 | Shanghai 上海 | 12% | 17 | Qingdao 青岛 | 1% |
| 3 | Guangzhou 广州 | 9% | 18 | Luoyang 洛阳 | 1% |
| 4 | Zhengzhou 郑州 | 6% | 19 | Shijiazhuang 石家庄 | 1% |
| 5 | Xi’an 西安 | 5% | 20 | Hangzhou 杭州 | 1% |
| 6 | Chengdu 成都 | 4% | 21 | Wuxi 无锡 | 1% |
| 7 | Chongqing 重庆 | 3% | 22 | Xingtai 邢台 | 1% |
| 8 | Taiyuan 太原 | 3% | 23 | Ningbo 宁波 | 1% |
| 9 | Weinan 渭南 | 3% | 24 | Lanzhou 兰州 | 1% |
| 10 | Nanjing 南京 | 3% | 25 | Haerbin 哈尔滨 | 1% |
| 11 | Changsha 长沙 | 2% | 26 | Xianyang 咸阳 | 1% |
| 12 | Wuhan 武汉 | 2% | 27 | Suzhou 苏州 | 1% |
| 13 | Dalian 大连 | 2% | 28 | Yuncheng 运城 | 1% |
| 14 | Tianjin 天津 | 2% | 29 | Xuzhou 徐州 | 1% |
| 15 | Jinan 济南 | 2% | 30 | …… | …… |
© 2017 by the authors. Licensee MDPI, Basel, Switzerland. This article is an open access article distributed under the terms and conditions of the Creative Commons Attribution (CC BY) license (http://creativecommons.org/licenses/by/4.0/).
Share and Cite
Shao, J.; Chang, X.; Morrison, A.M. How Can Big Data Support Smart Scenic Area Management? An Analysis of Travel Blogs on Huashan. Sustainability 2017, 9, 2291. https://doi.org/10.3390/su9122291
Shao J, Chang X, Morrison AM. How Can Big Data Support Smart Scenic Area Management? An Analysis of Travel Blogs on Huashan. Sustainability. 2017; 9(12):2291. https://doi.org/10.3390/su9122291
Chicago/Turabian StyleShao, Jun, Xuesong Chang, and Alastair M. Morrison. 2017. "How Can Big Data Support Smart Scenic Area Management? An Analysis of Travel Blogs on Huashan" Sustainability 9, no. 12: 2291. https://doi.org/10.3390/su9122291
APA StyleShao, J., Chang, X., & Morrison, A. M. (2017). How Can Big Data Support Smart Scenic Area Management? An Analysis of Travel Blogs on Huashan. Sustainability, 9(12), 2291. https://doi.org/10.3390/su9122291