Dynamic Land-Use Map Based on Twitter Data


Abstract
:1. Introduction
2. Related Work
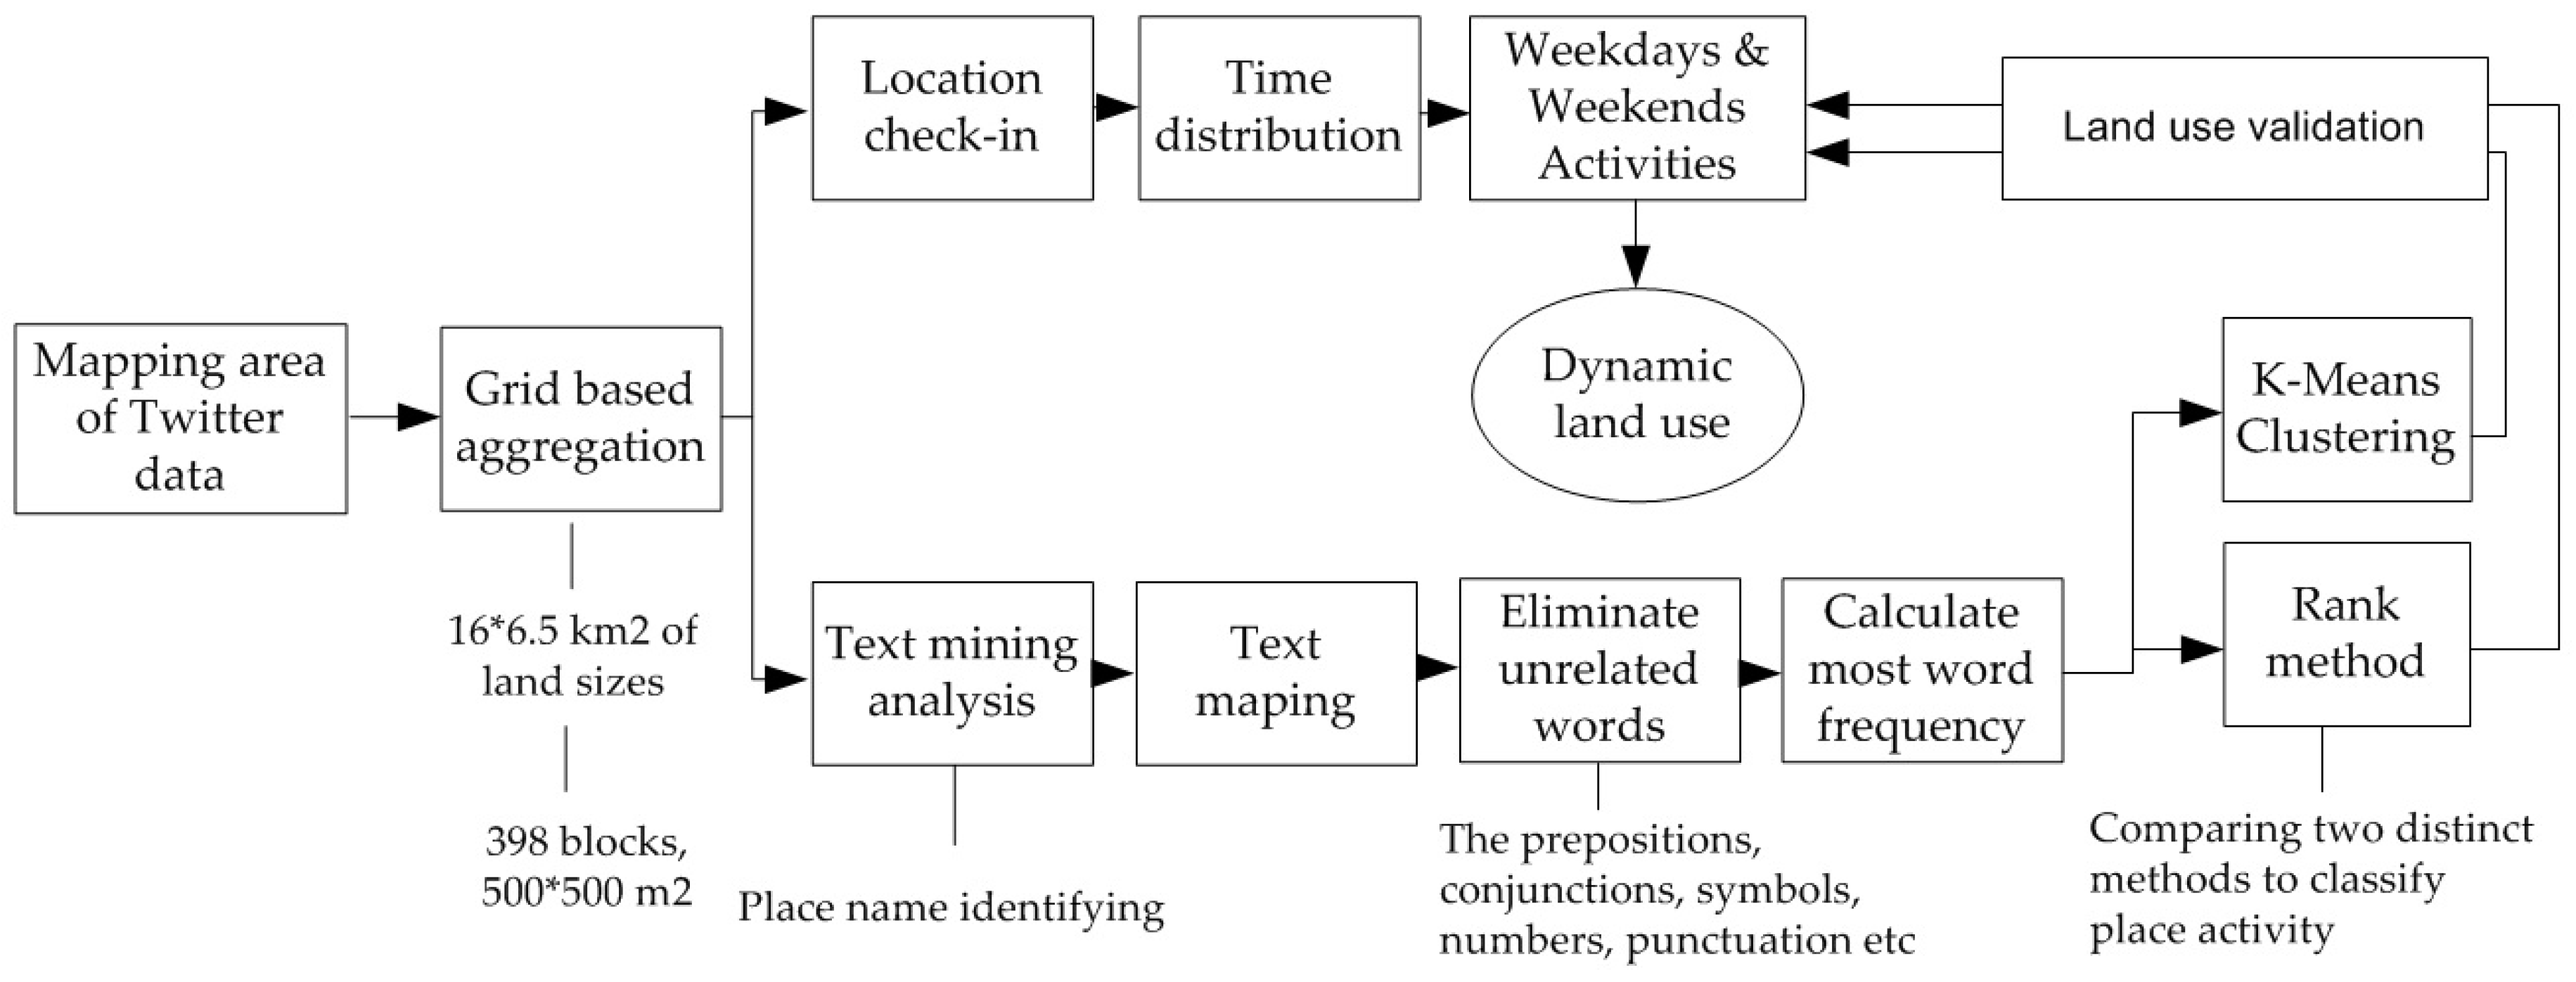
3. Data and Methodology
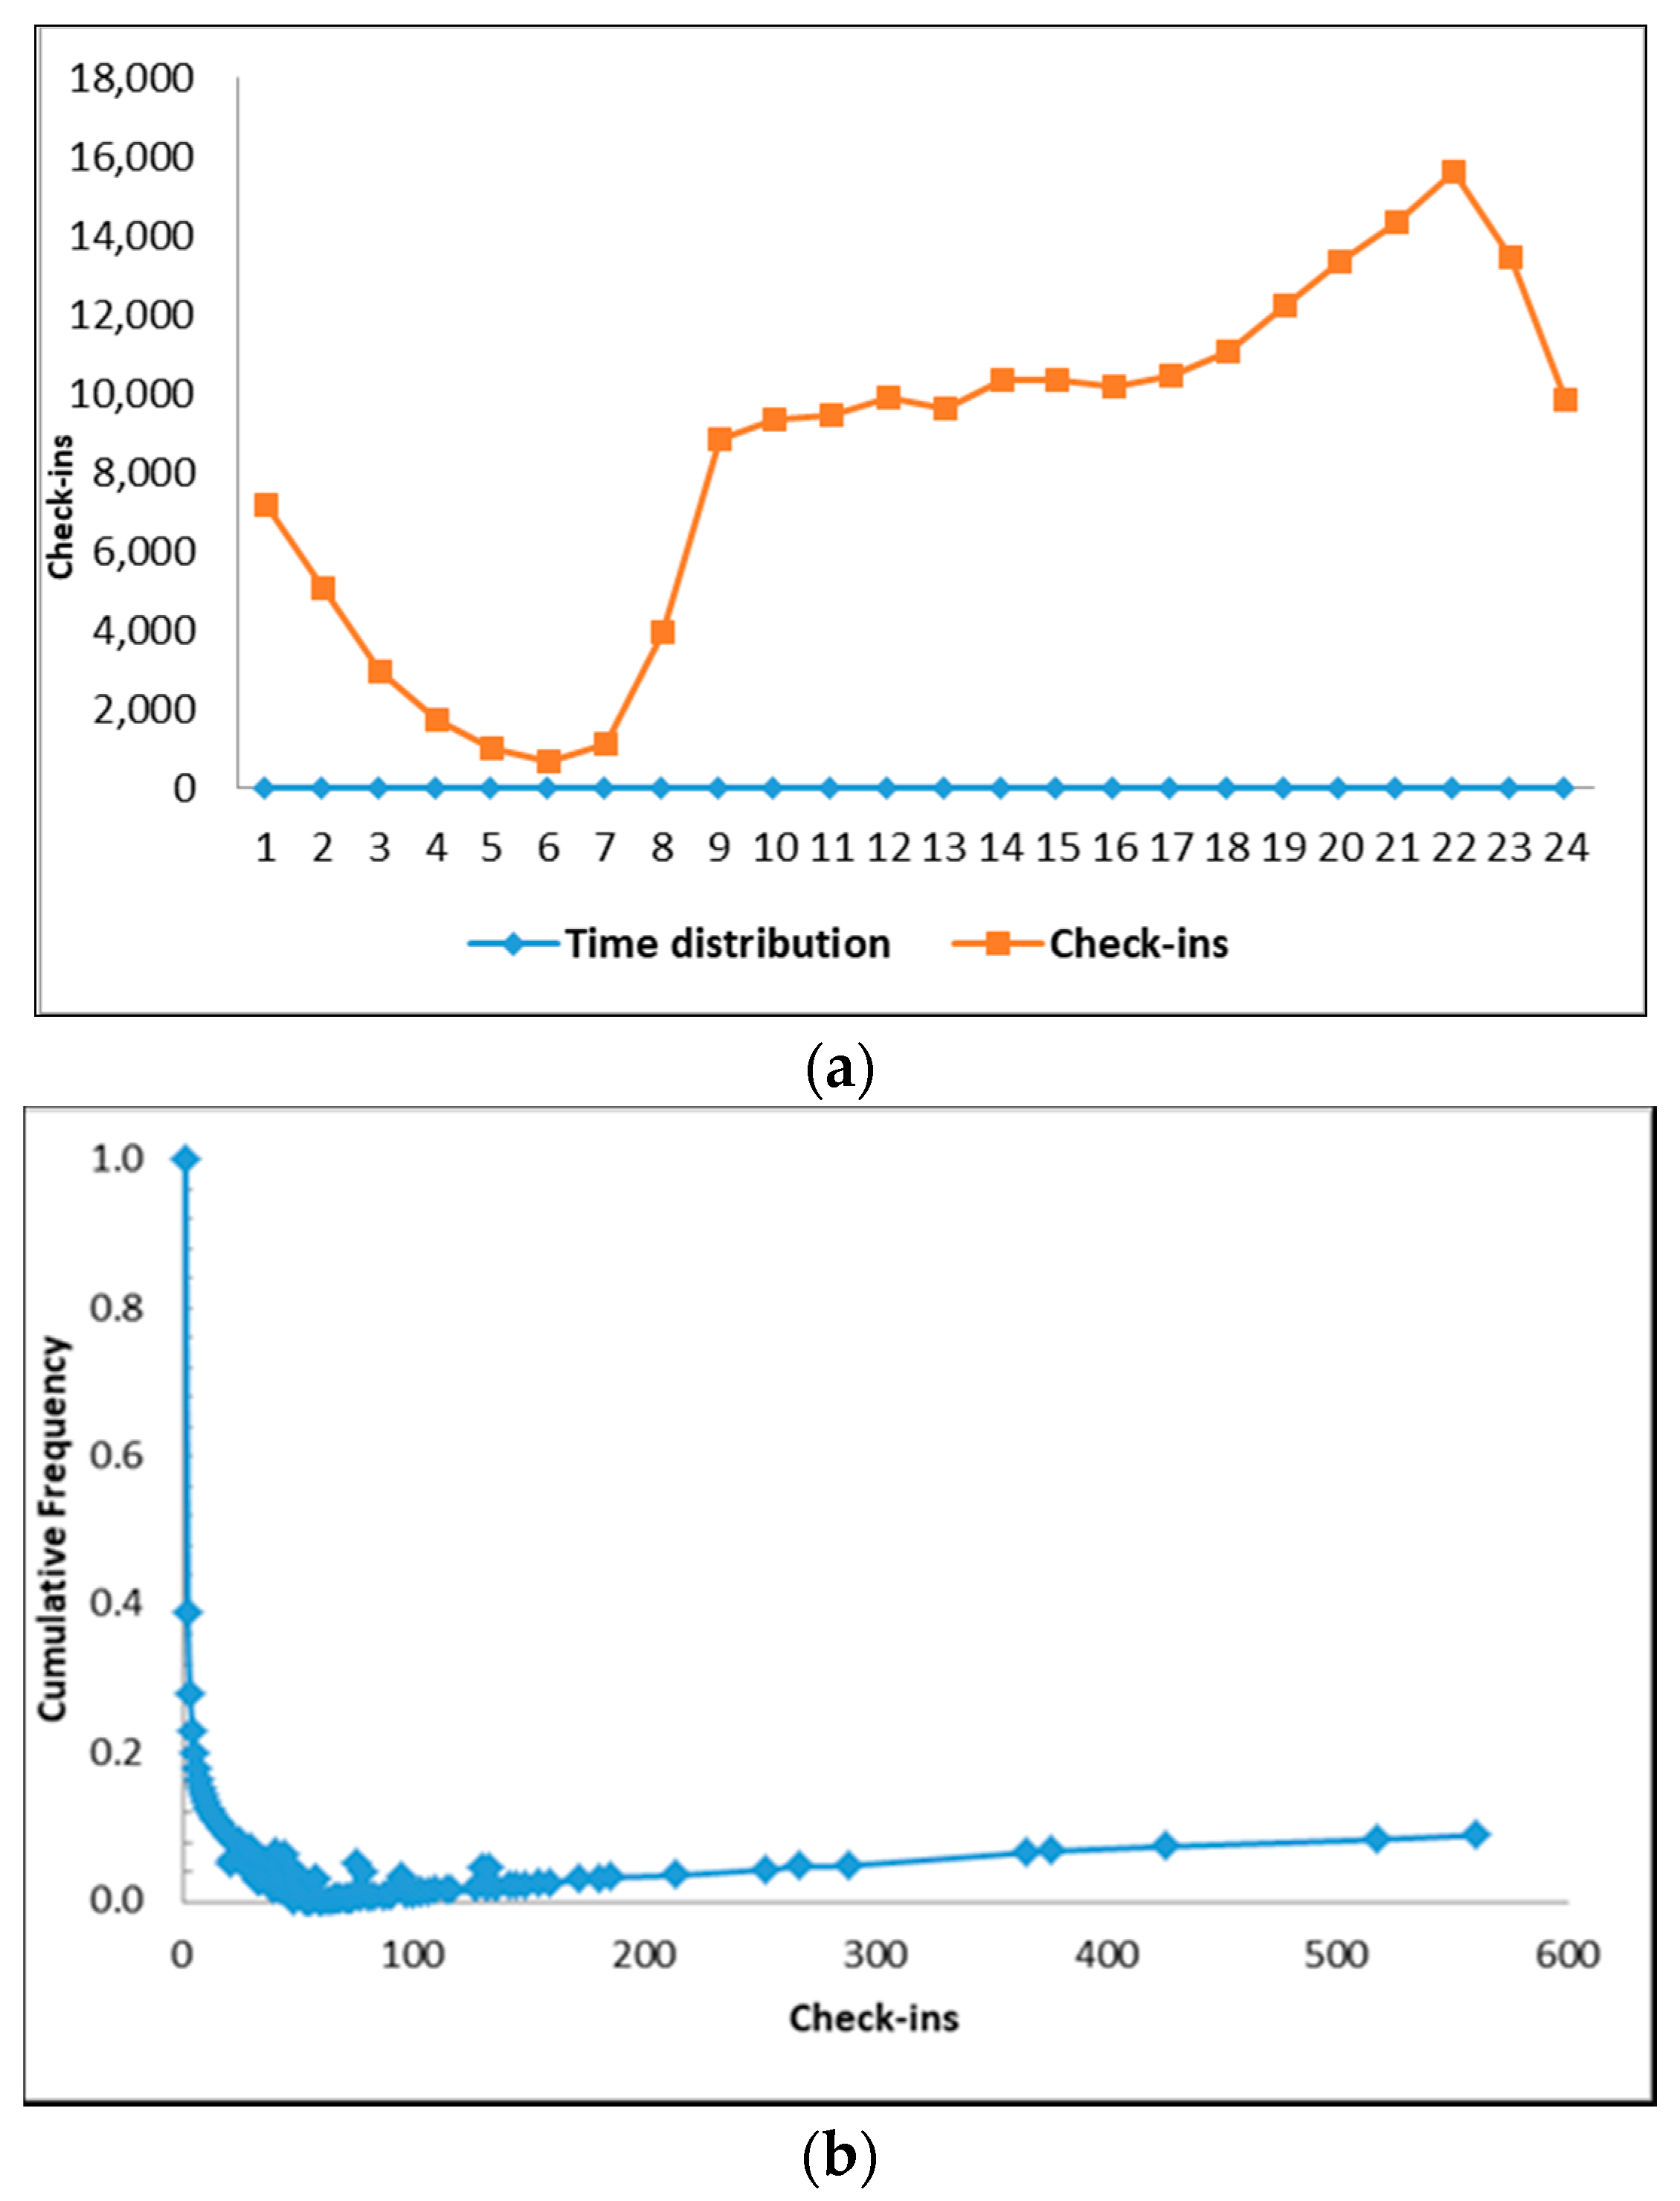
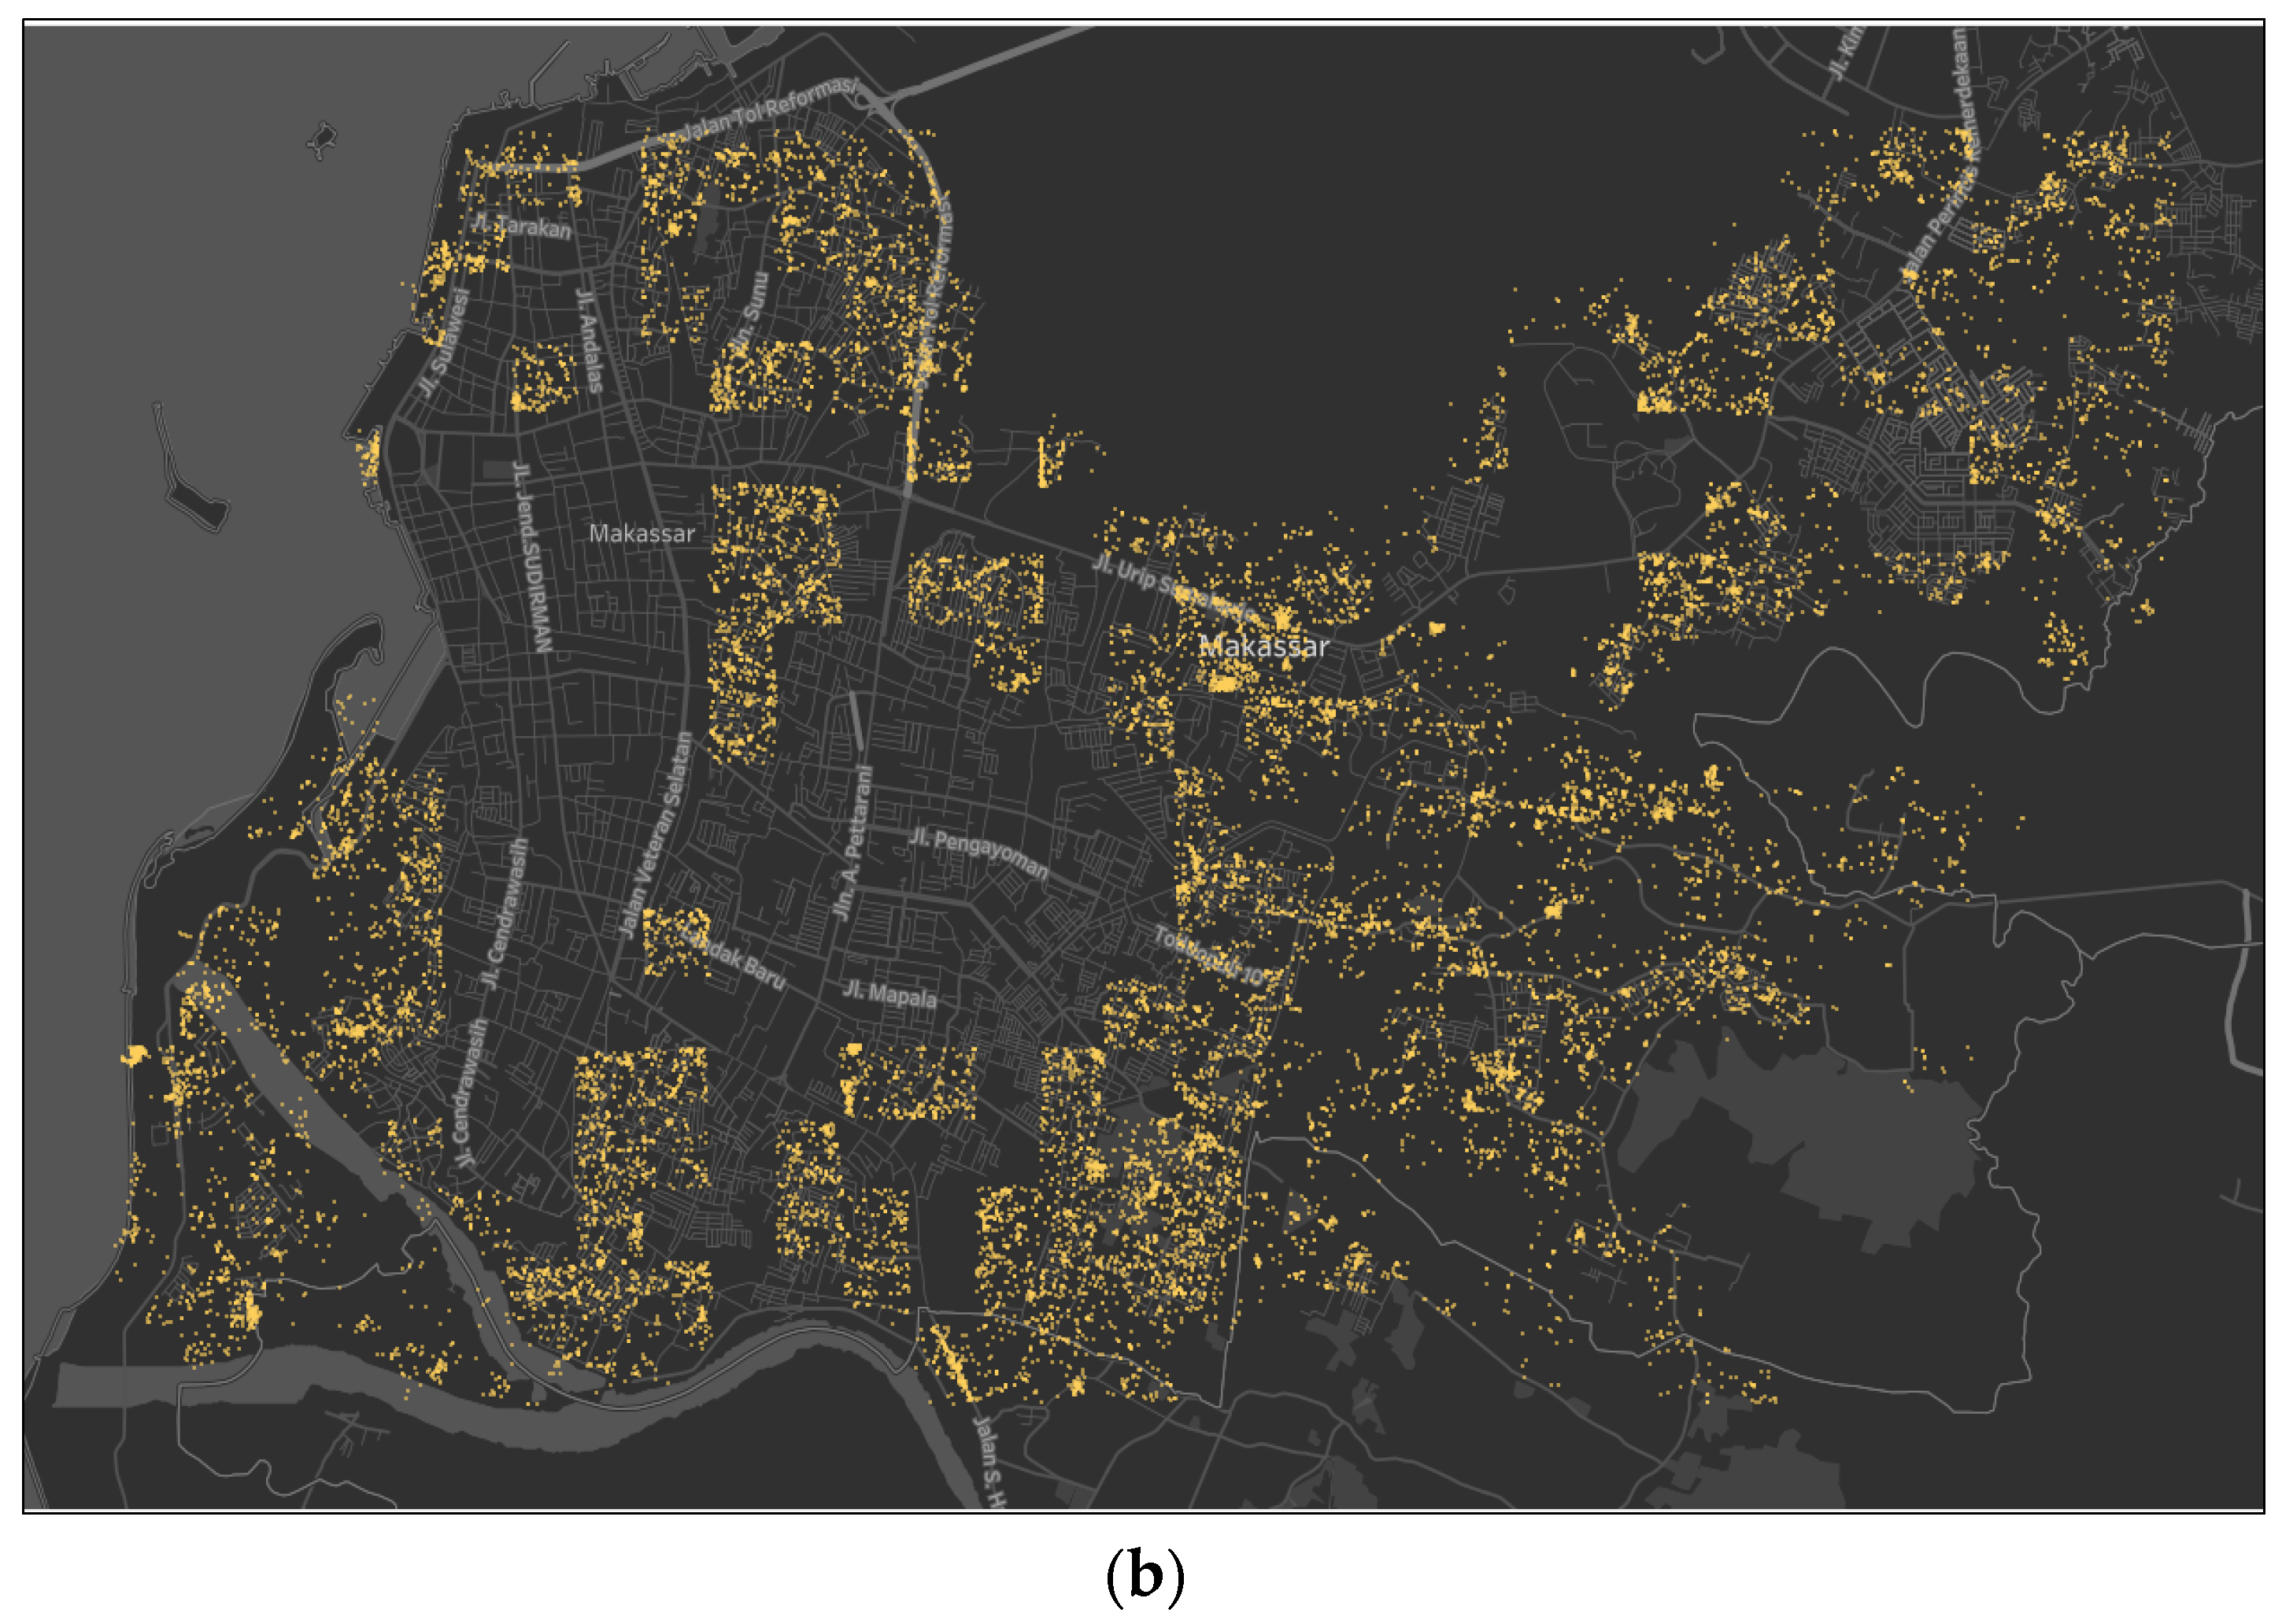
3.1. Data Collection
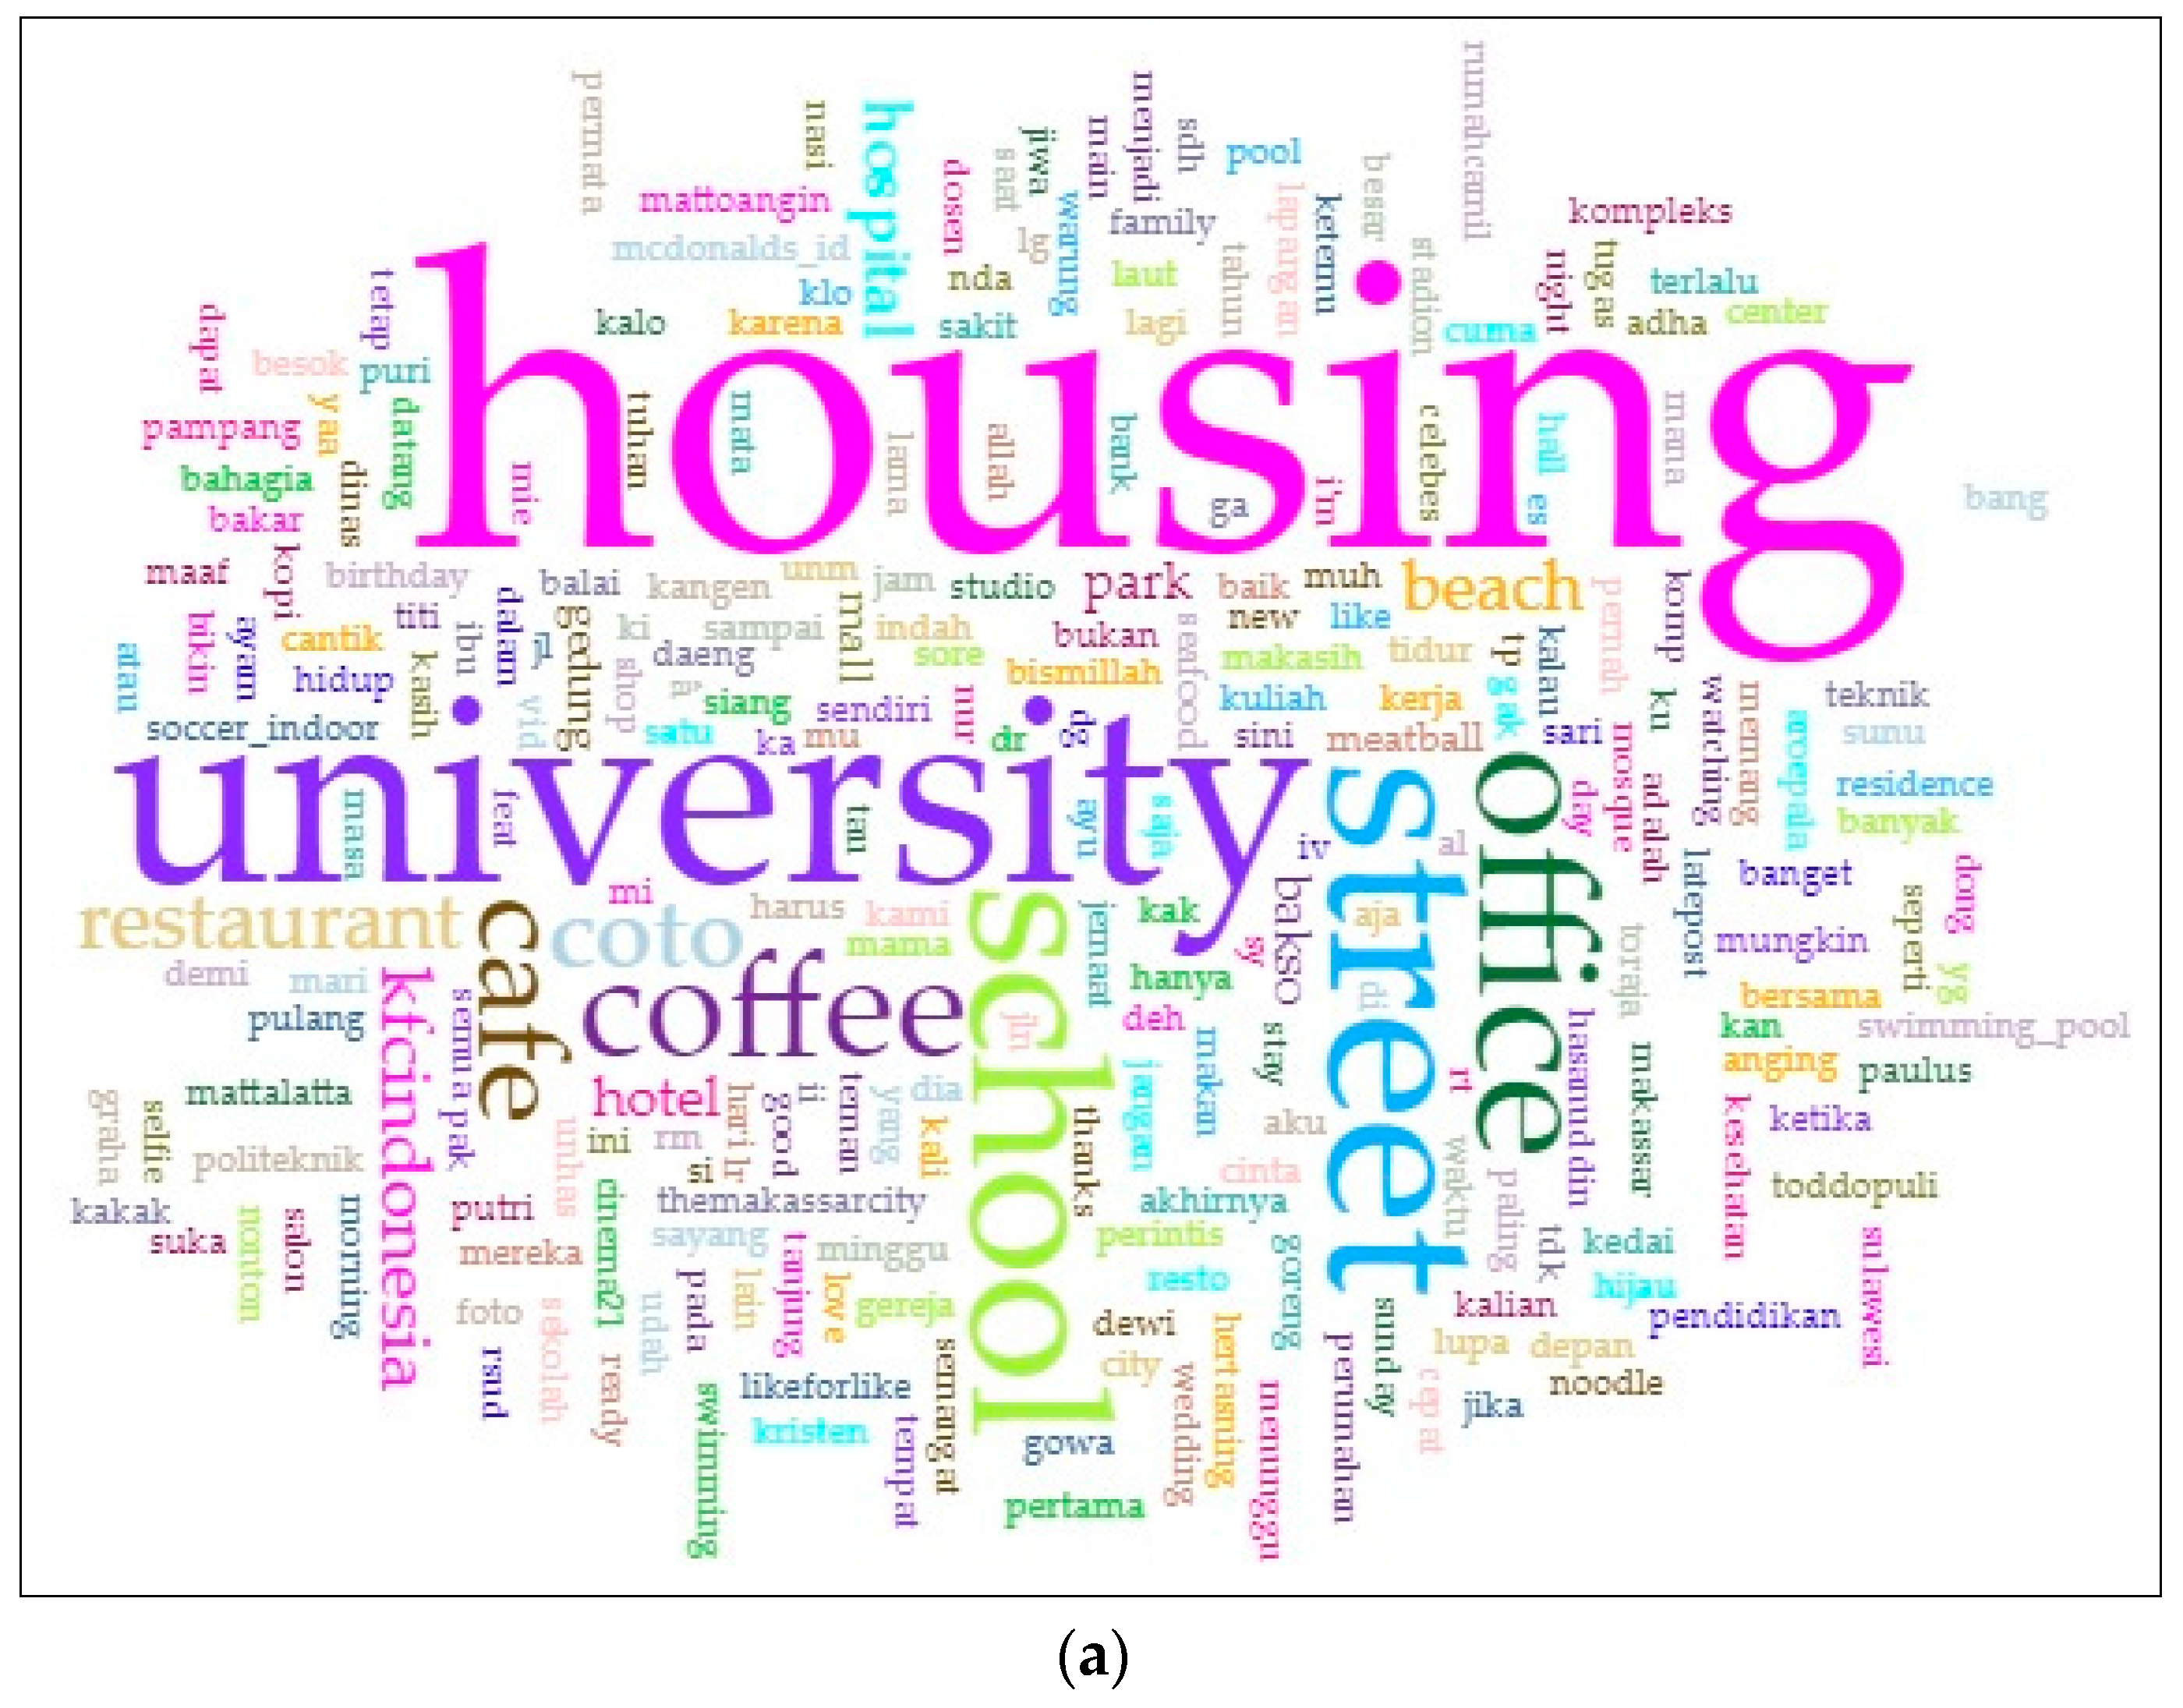
3.2. Text Mining for Place-Name Identification
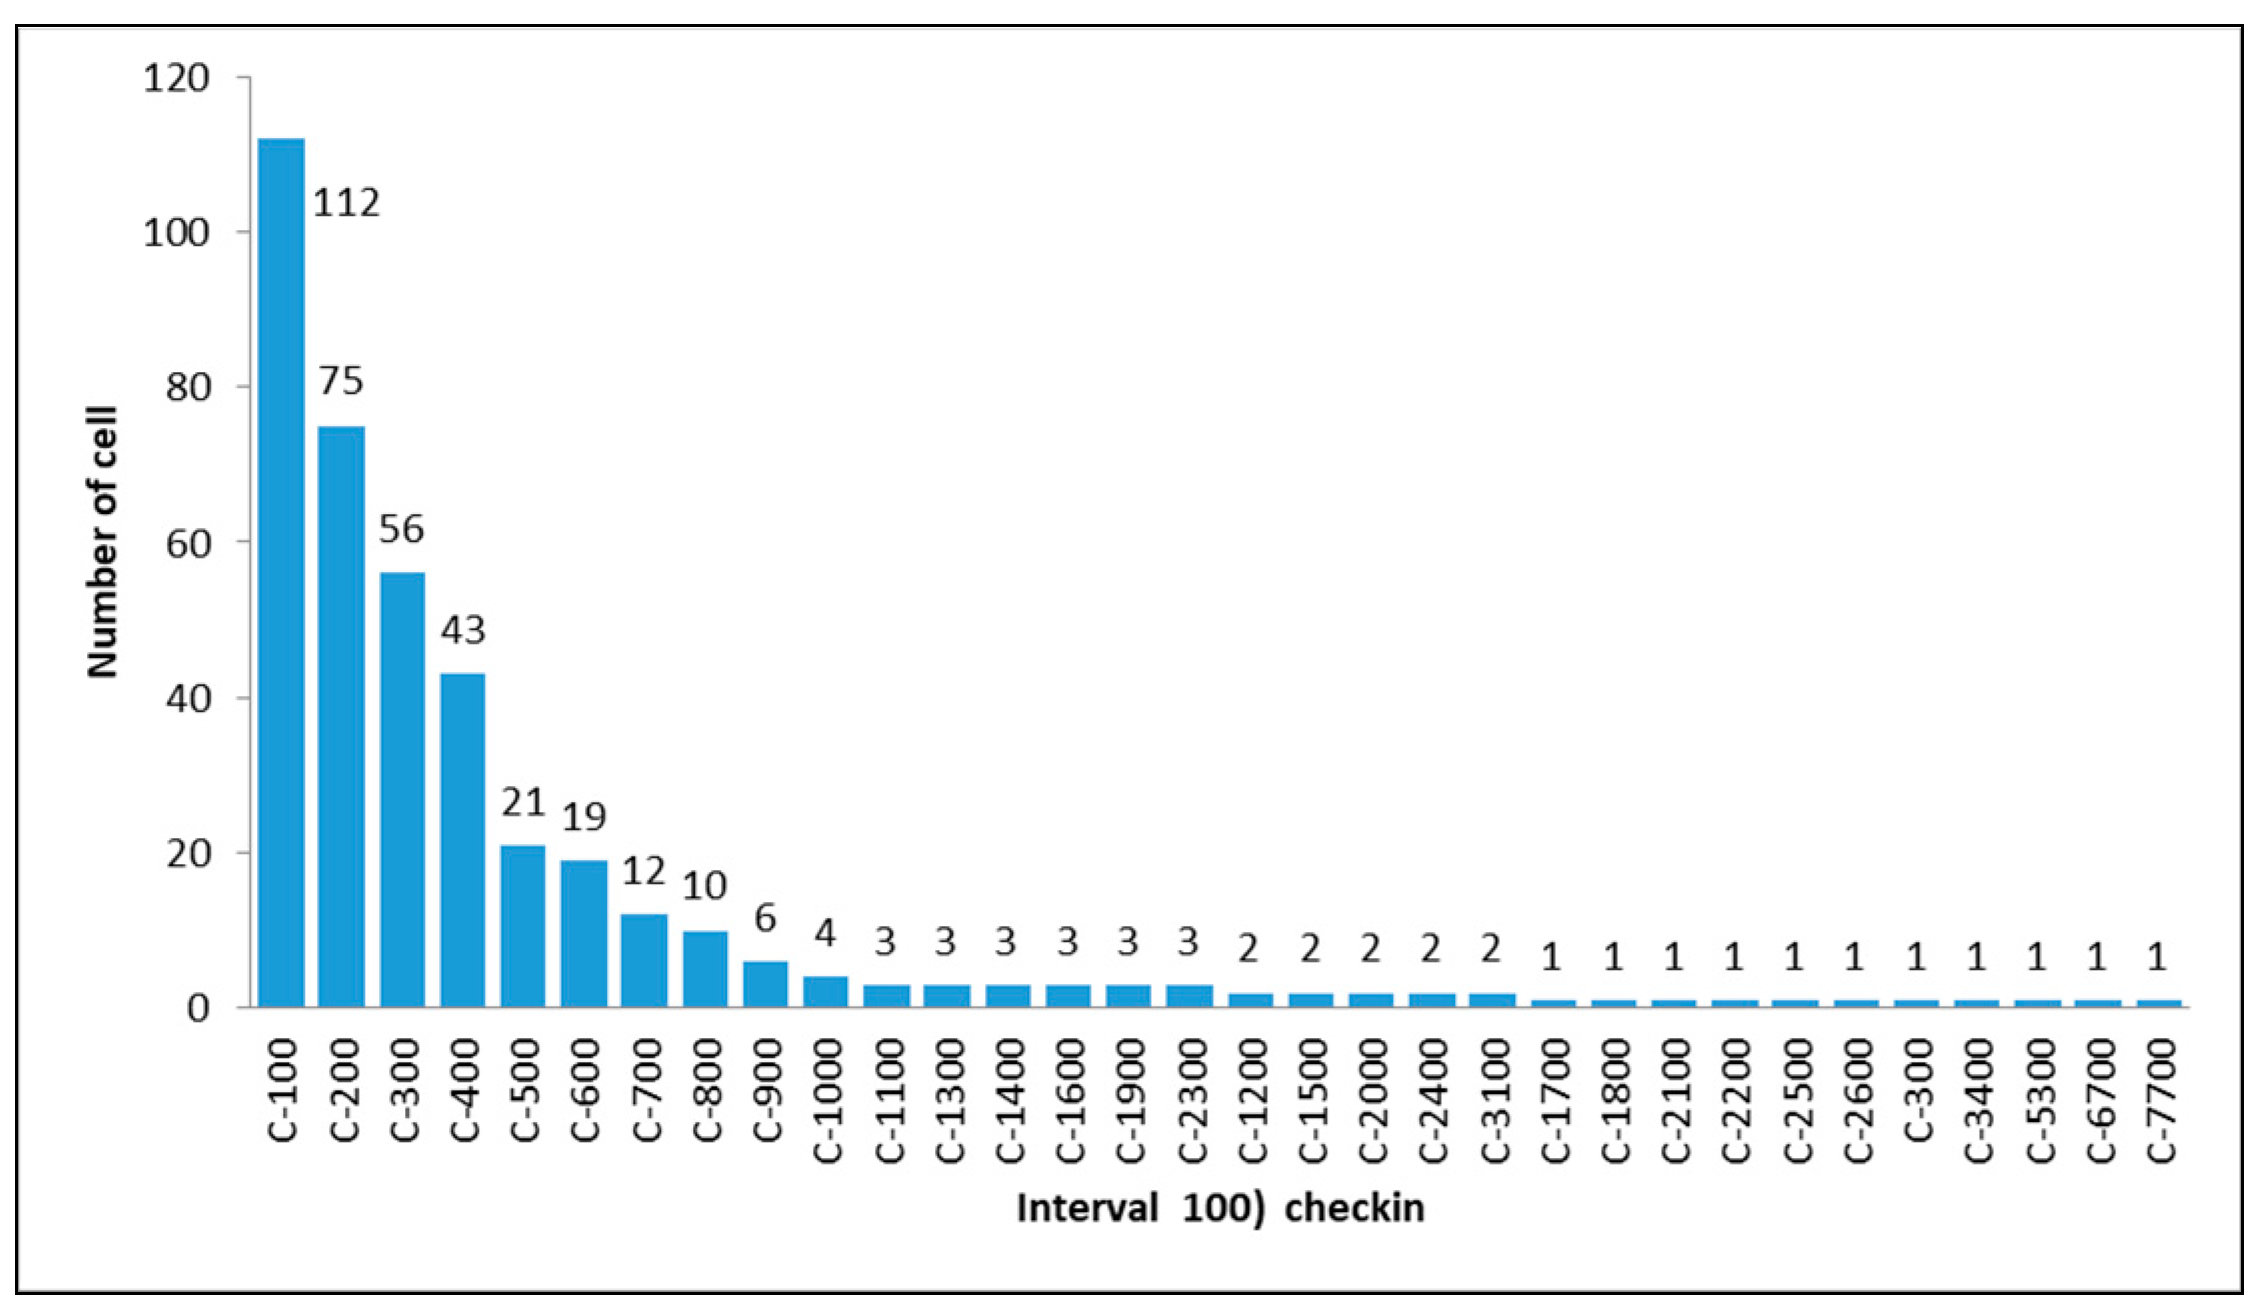
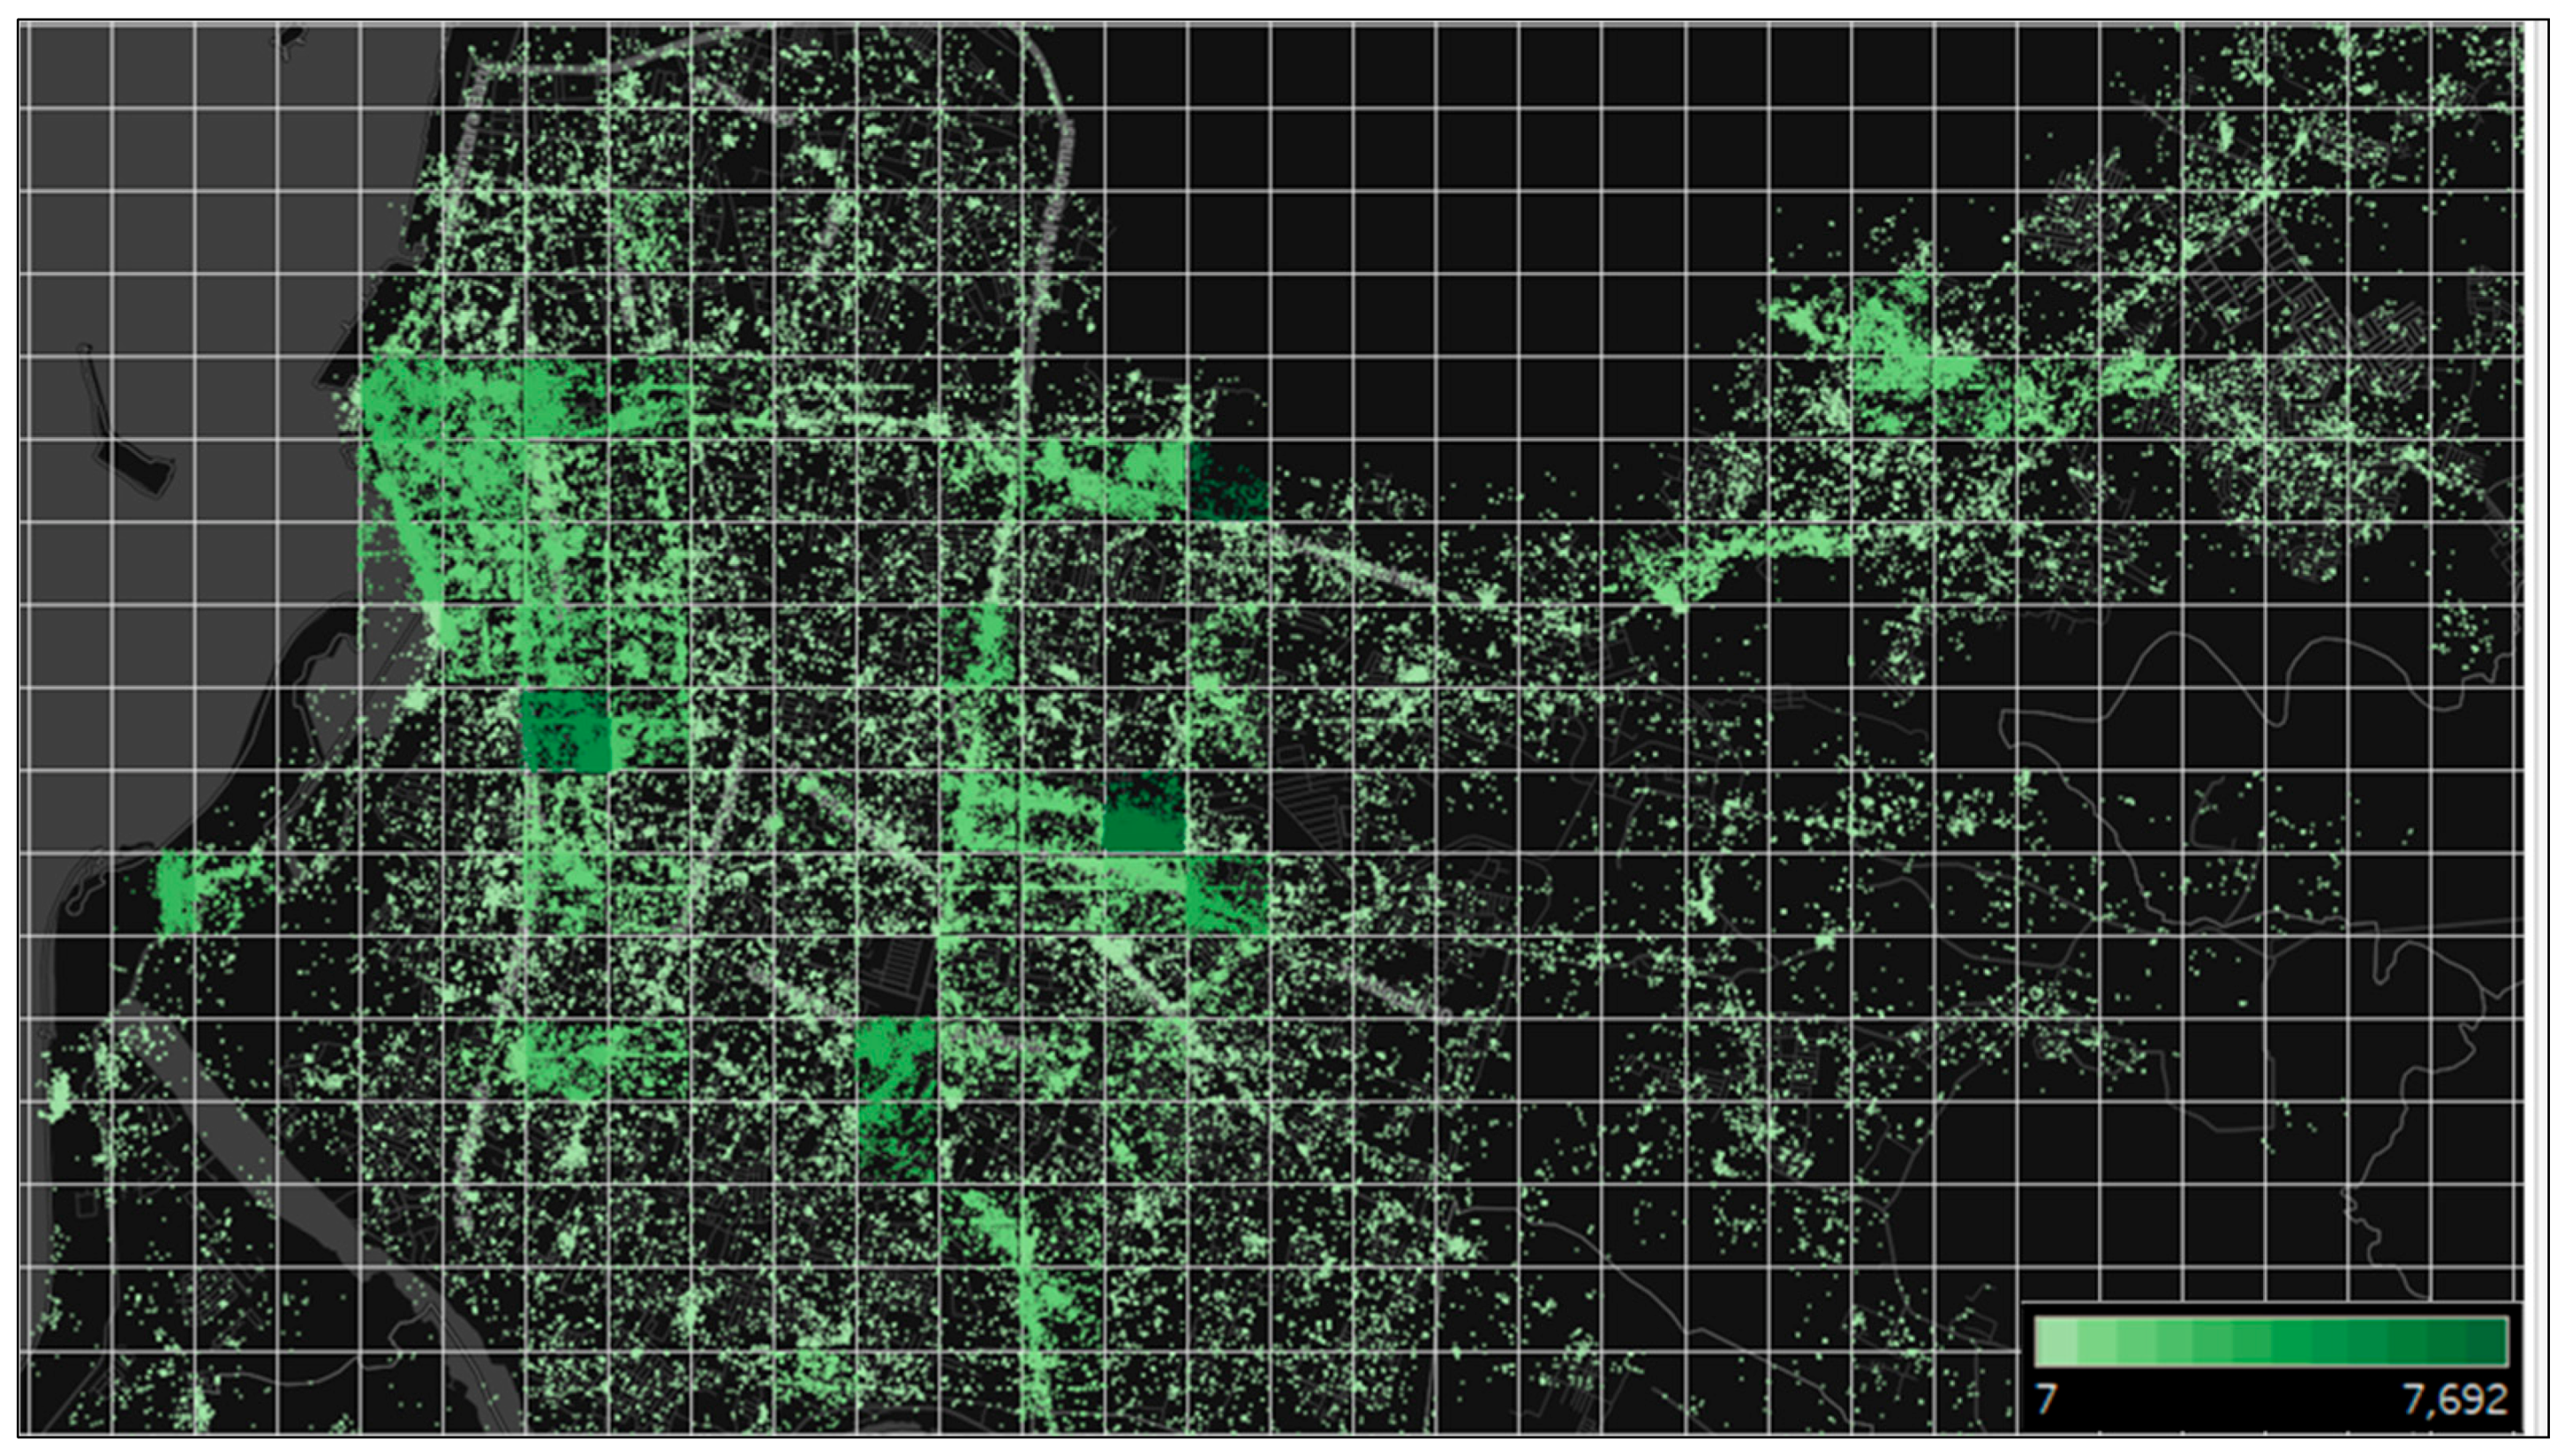
3.3. Aggregation Grid for Dividing Land Area
3.4. K-means Clustering for Land-Use Characterizing
- Decide the number of clusters (in this research, five clusters are specified).
- Determine the centroid value (center of measurement) randomly.
- Calculate the distance between the centroid points and the point of each object. To measure, we use the Euclidean distance:where De is the Euclidean distance, i is the number of the object, (x, y) are the object coordinates, and (s, t) are the centroid coordinates.
- Assign object to closest cluster.
- Go back to step 2 and recalculate the centroid value until the cluster members do not move to other clusters.
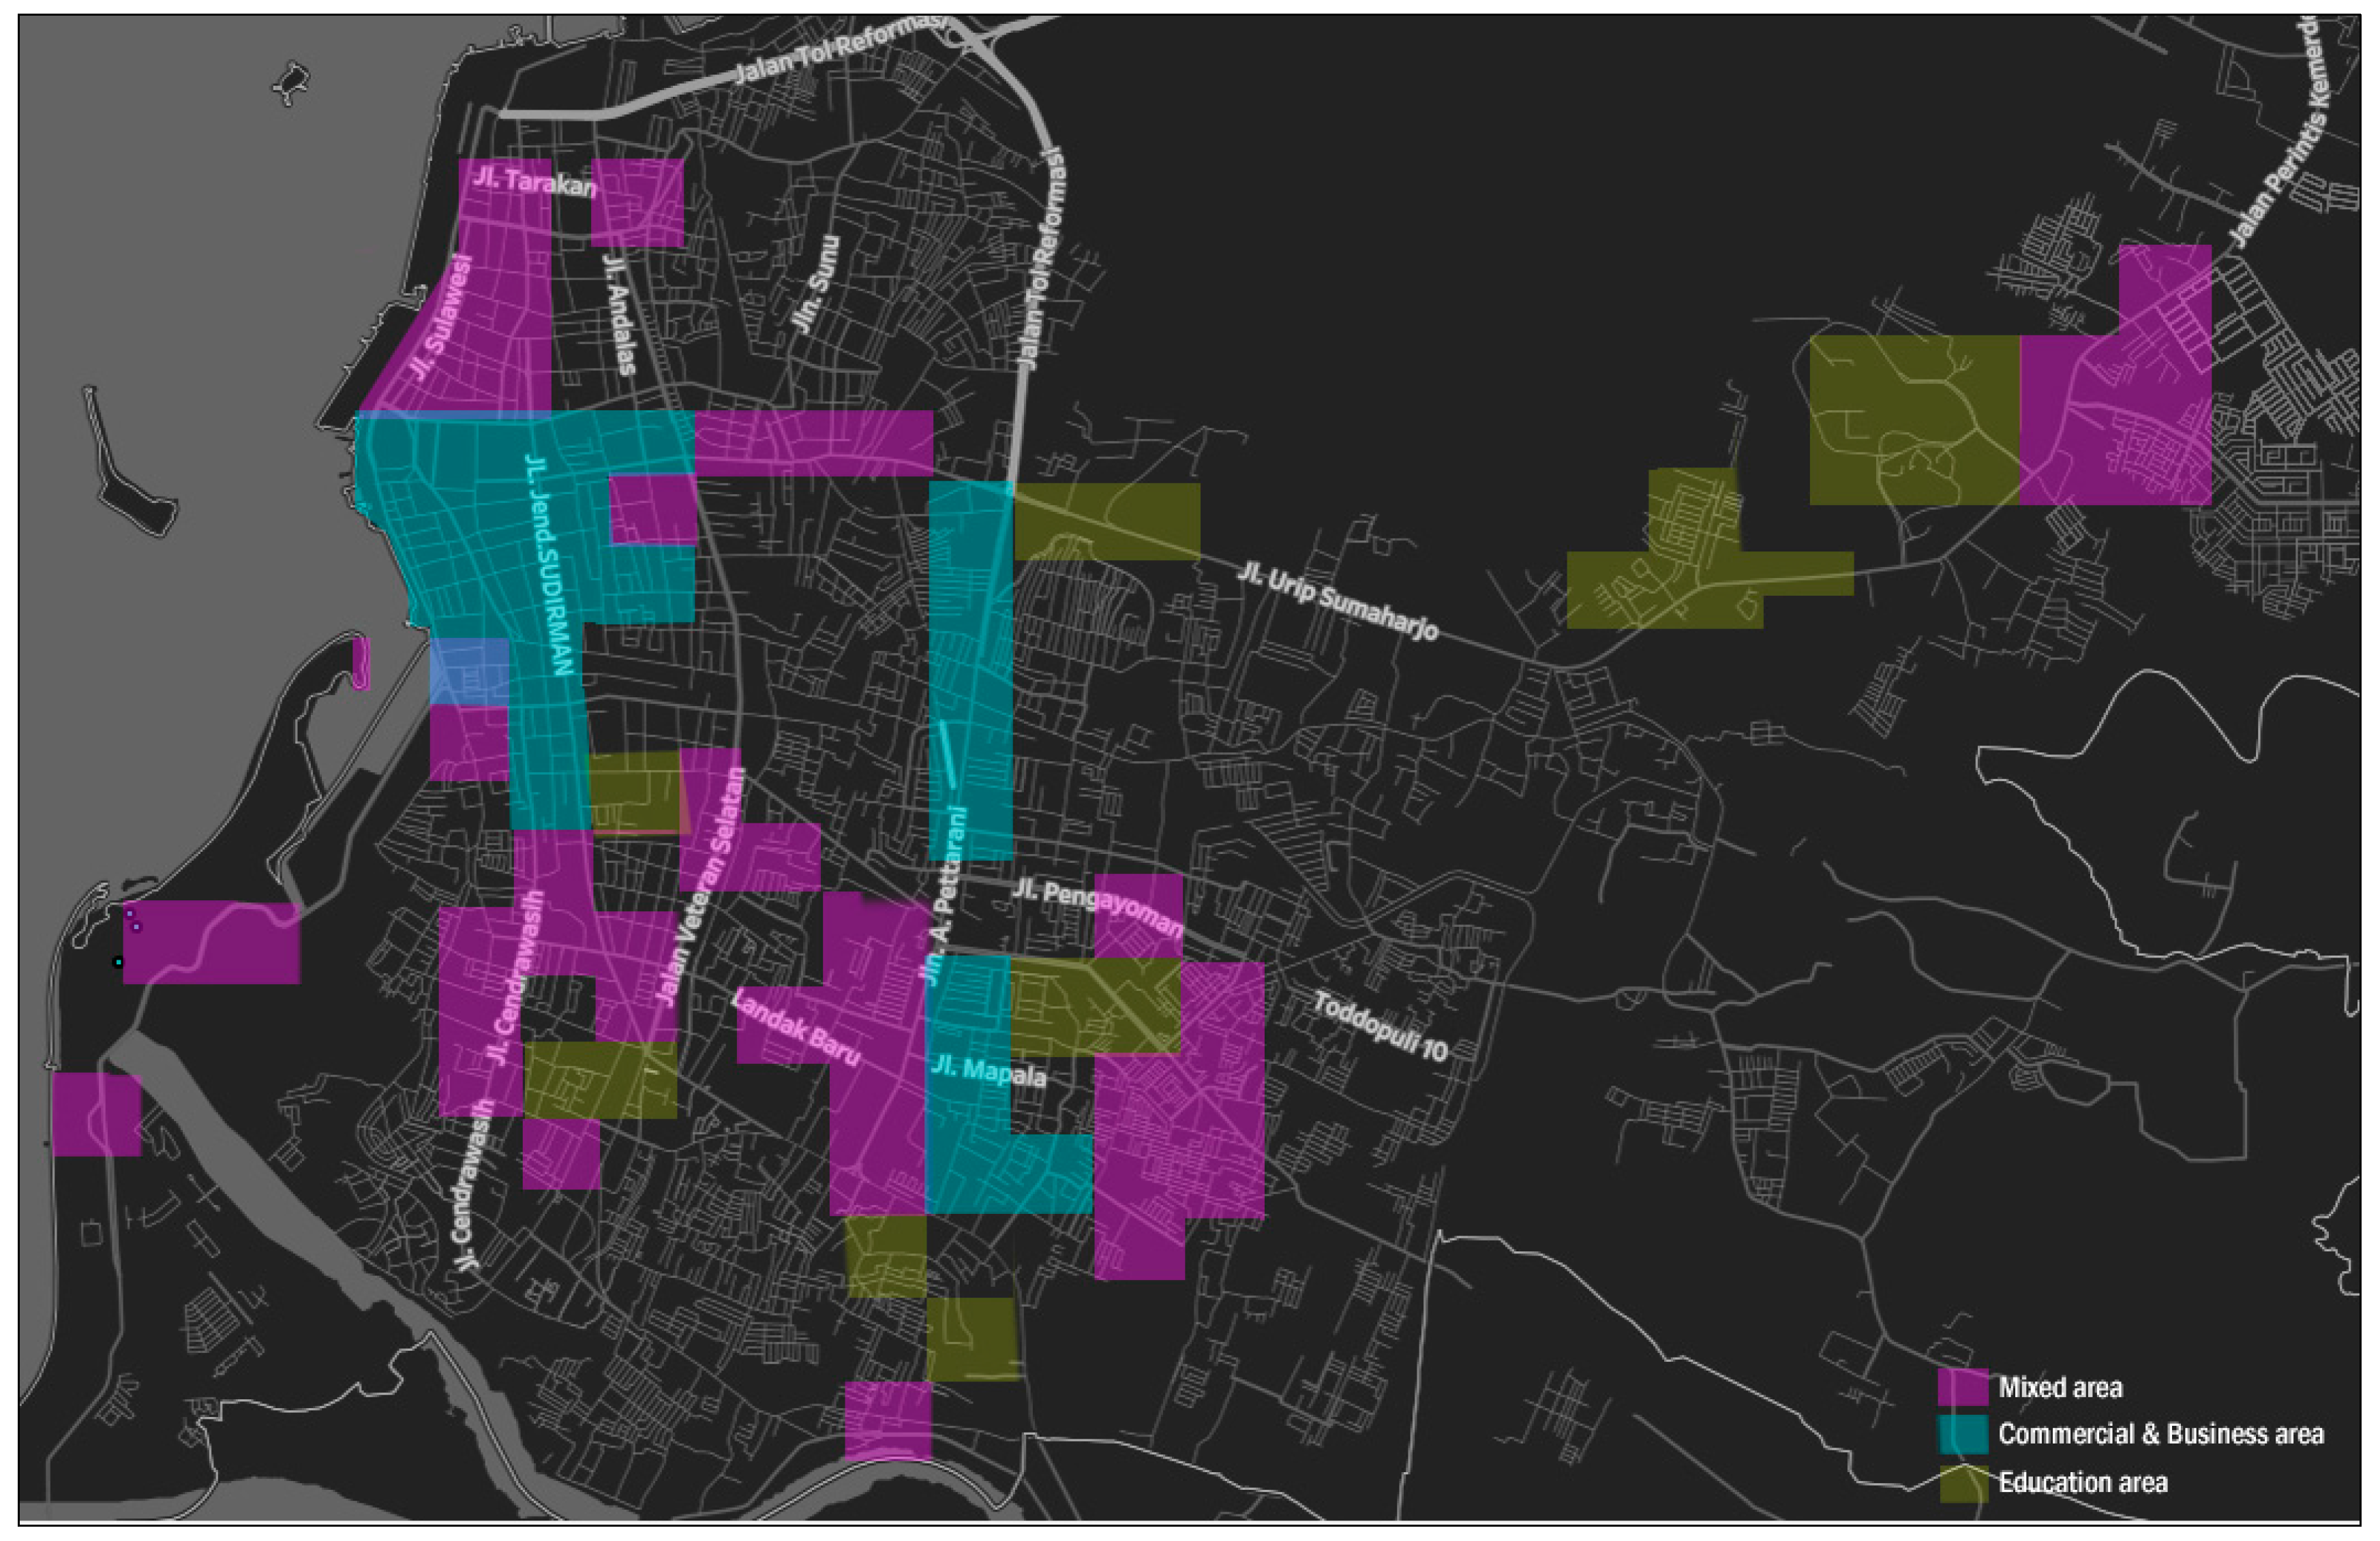
4. Land-Use Segmentation
- We determined the frequency of places visited by comparing the percentage data of each block. We then combined the blocks into several classes and grouped the classes into several clusters. In this case, each cluster was decided by the place with the highest frequency as a decision-making indicator. For example, on the basis of tweets, we found that classes C100, C200, C300, and C400 were dominated by the individual’s activities in residential areas (see Table A1). Thus, the combination of these classes was called cluster 1.
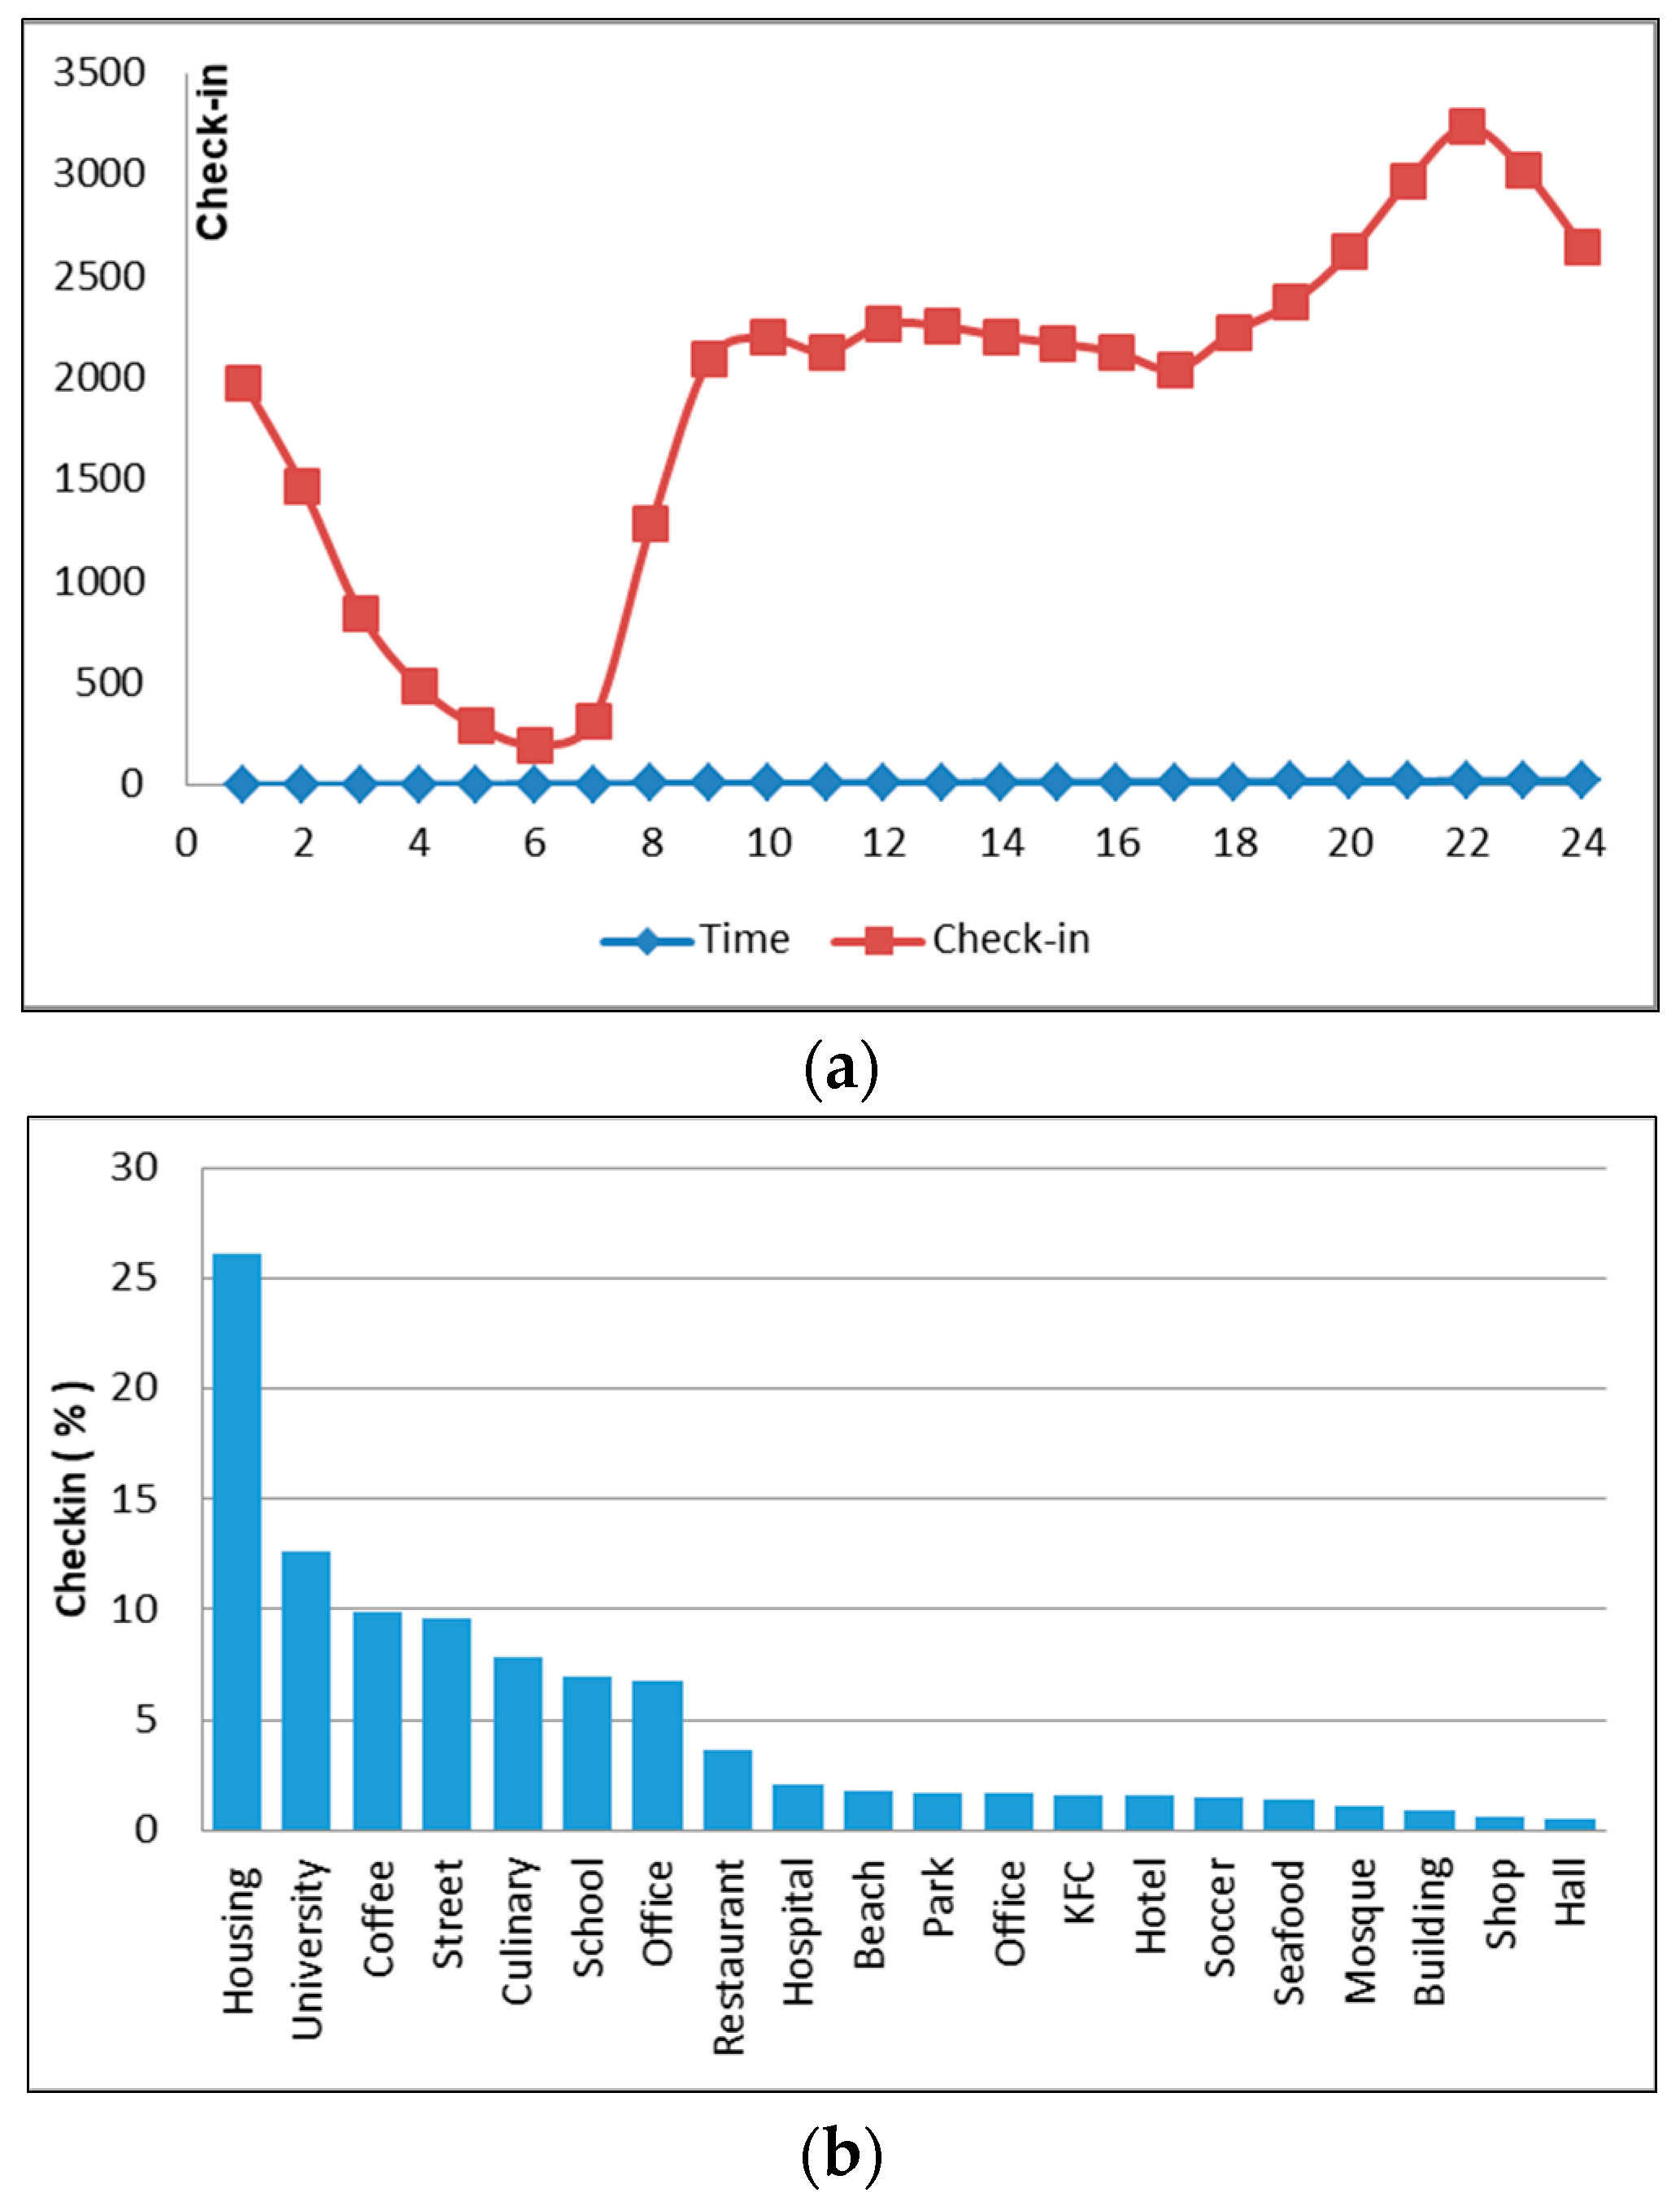
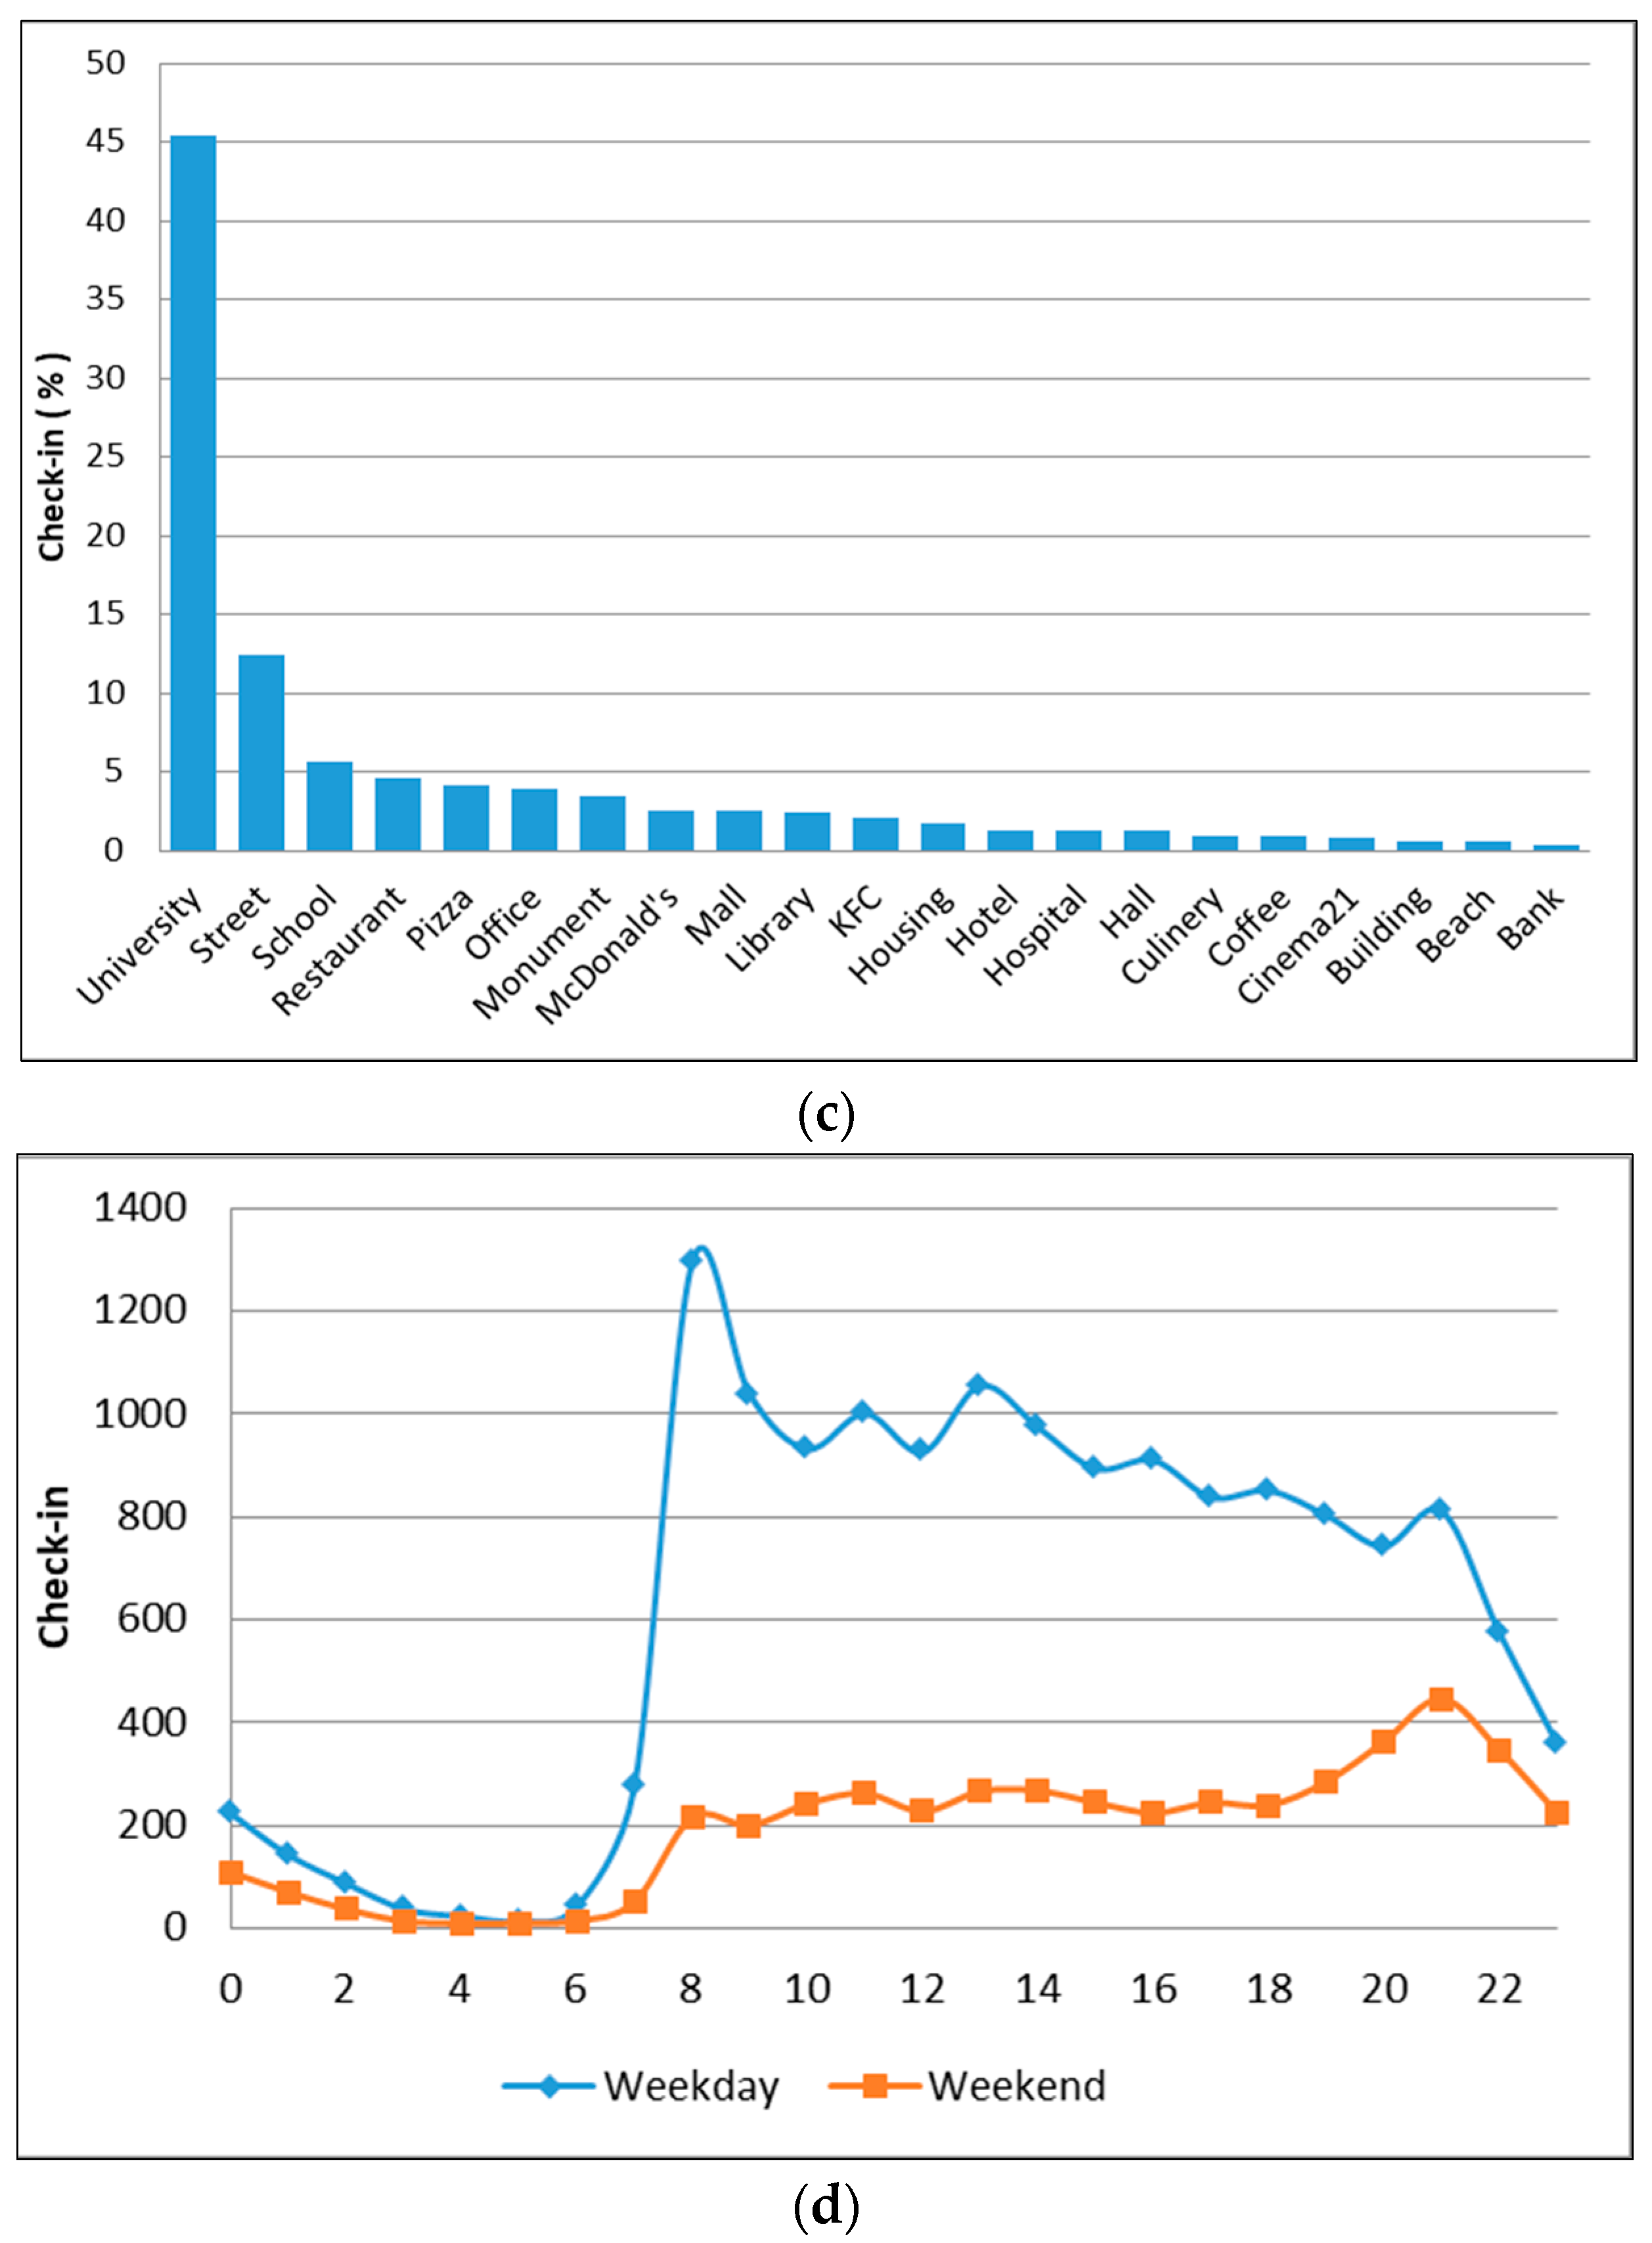
- To identify the land-use type, we ranked every place on each cluster to determine the most visited venue (see Table 4).
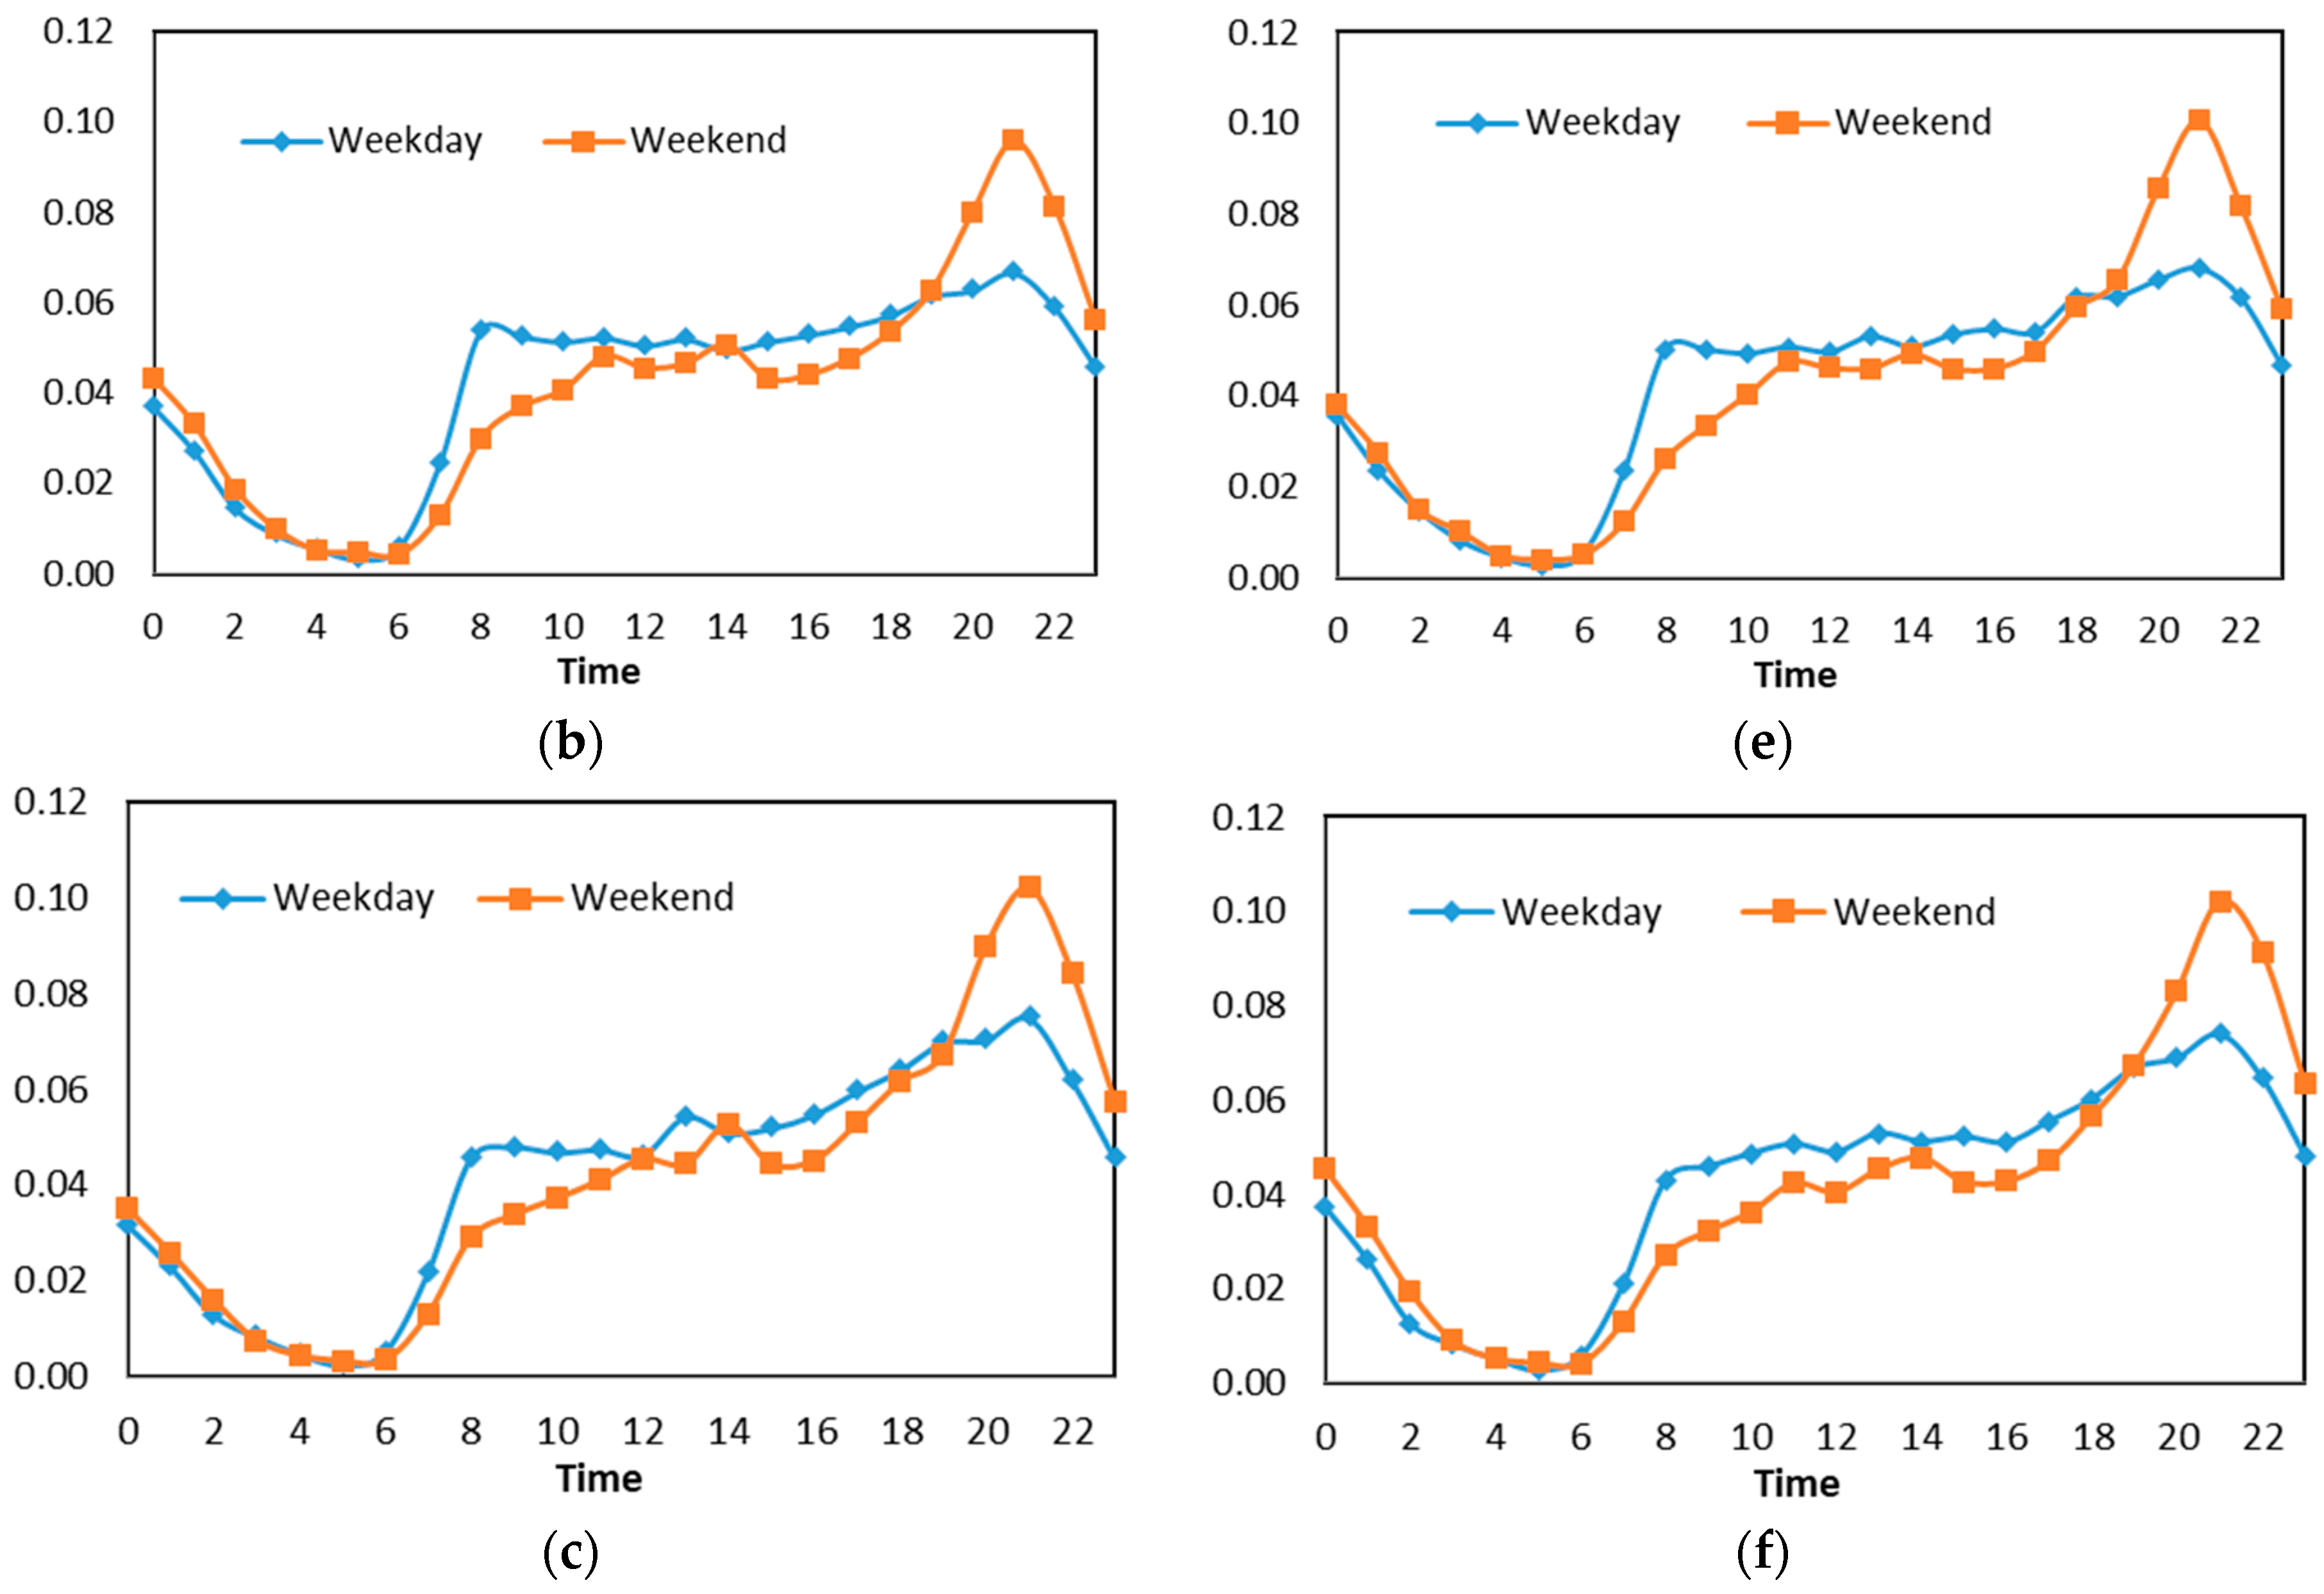
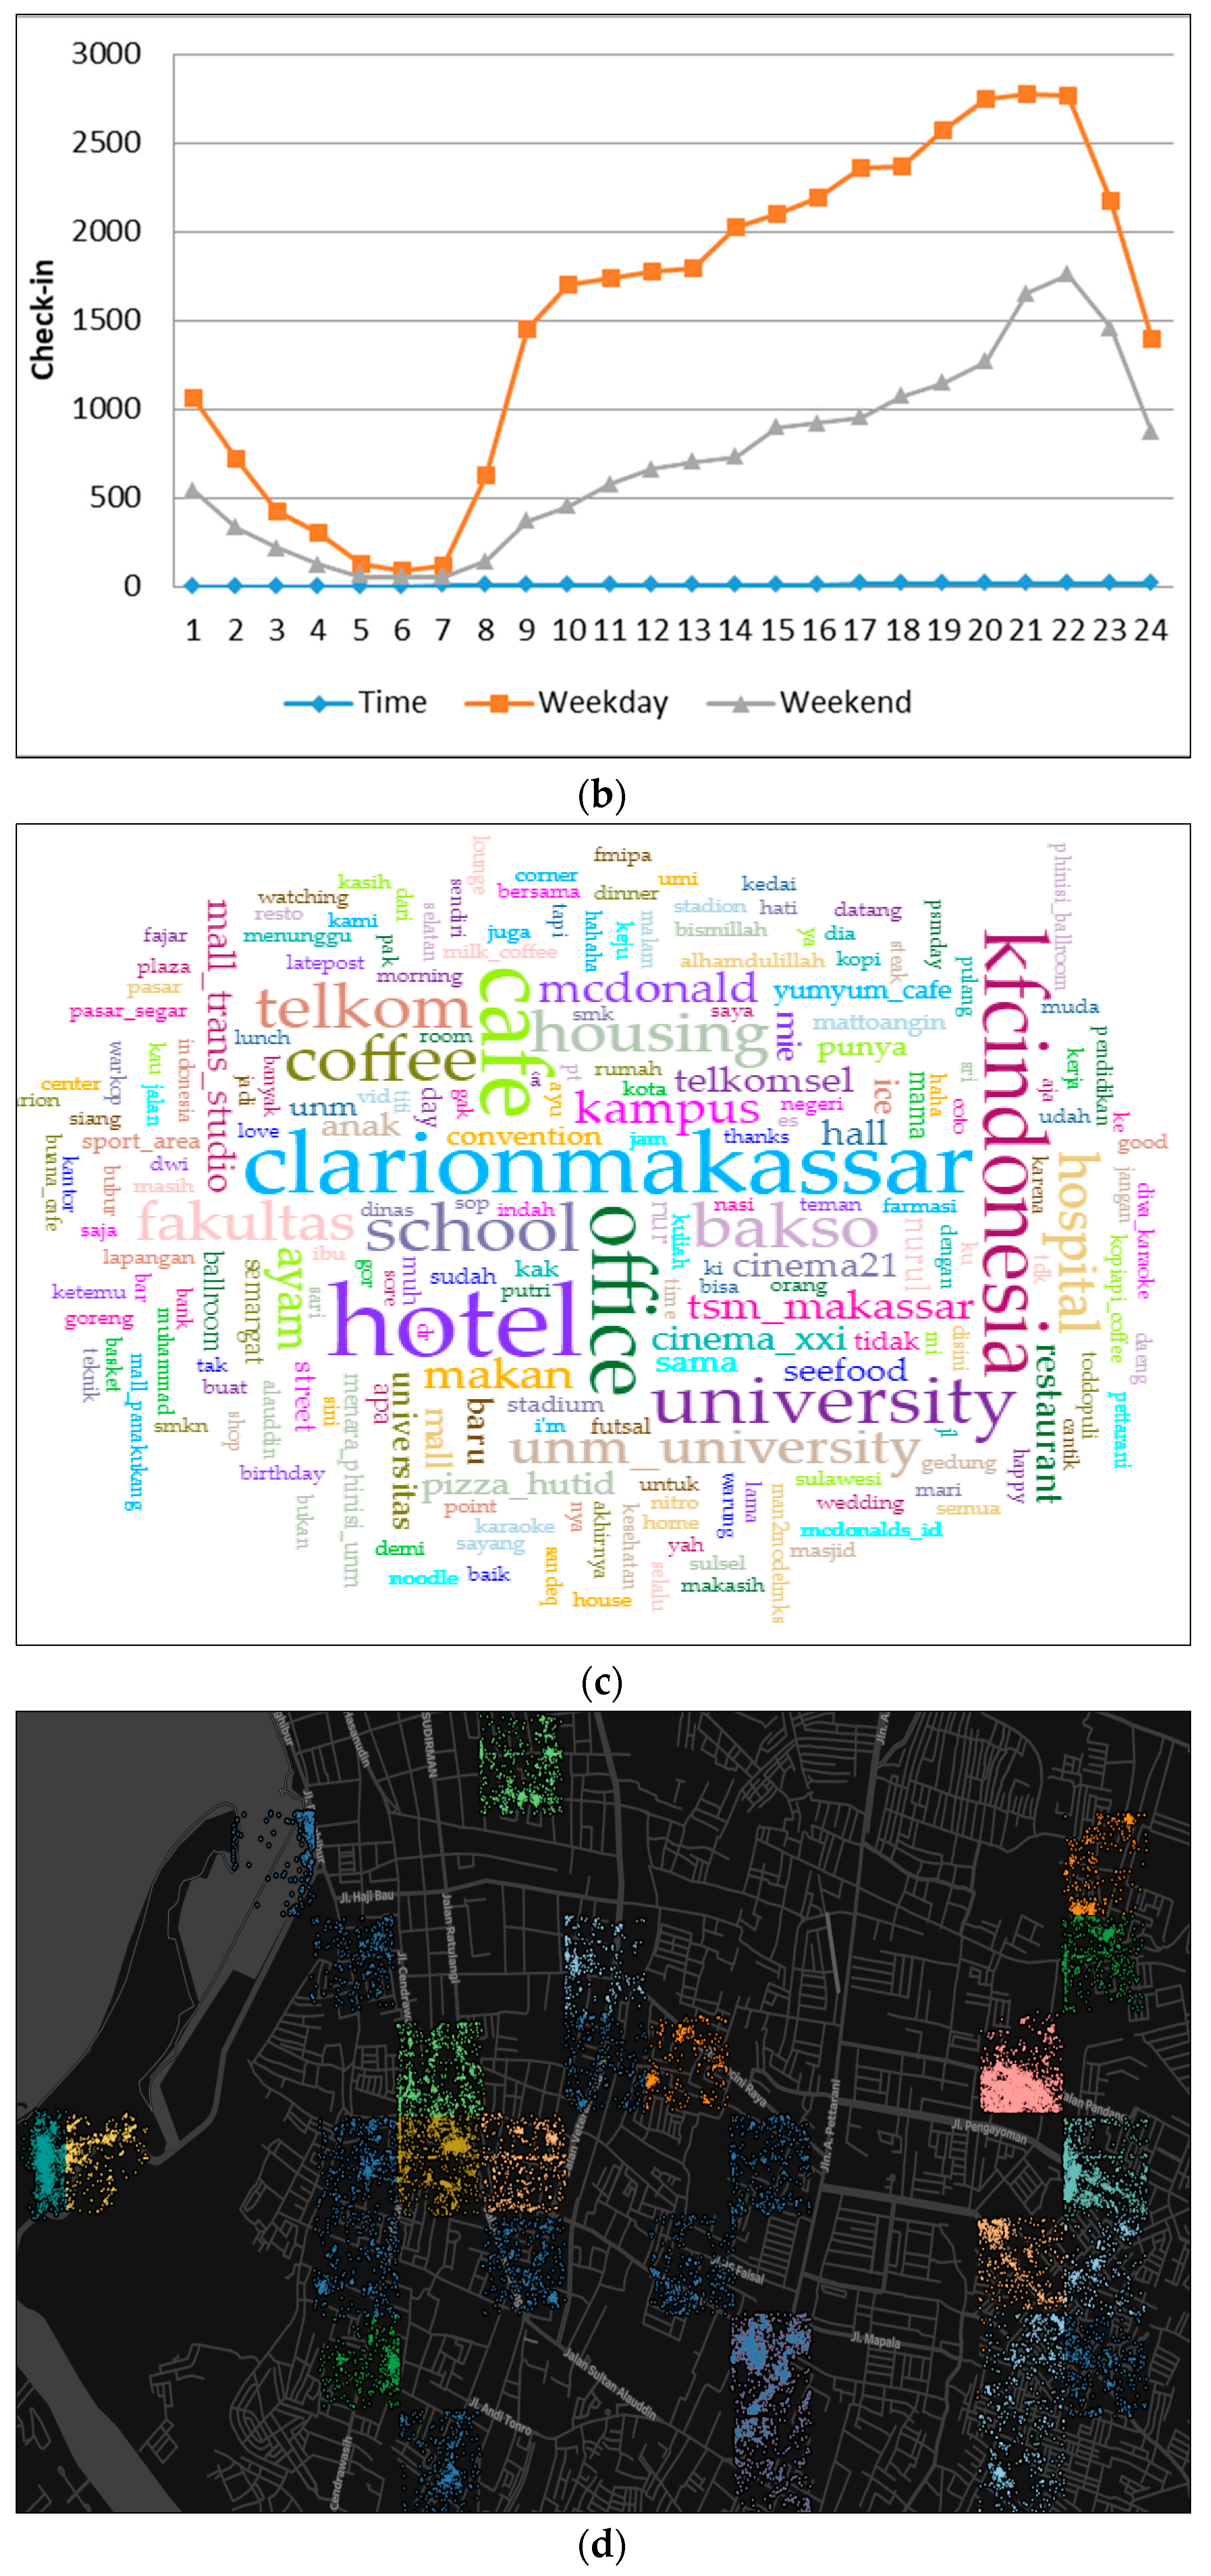
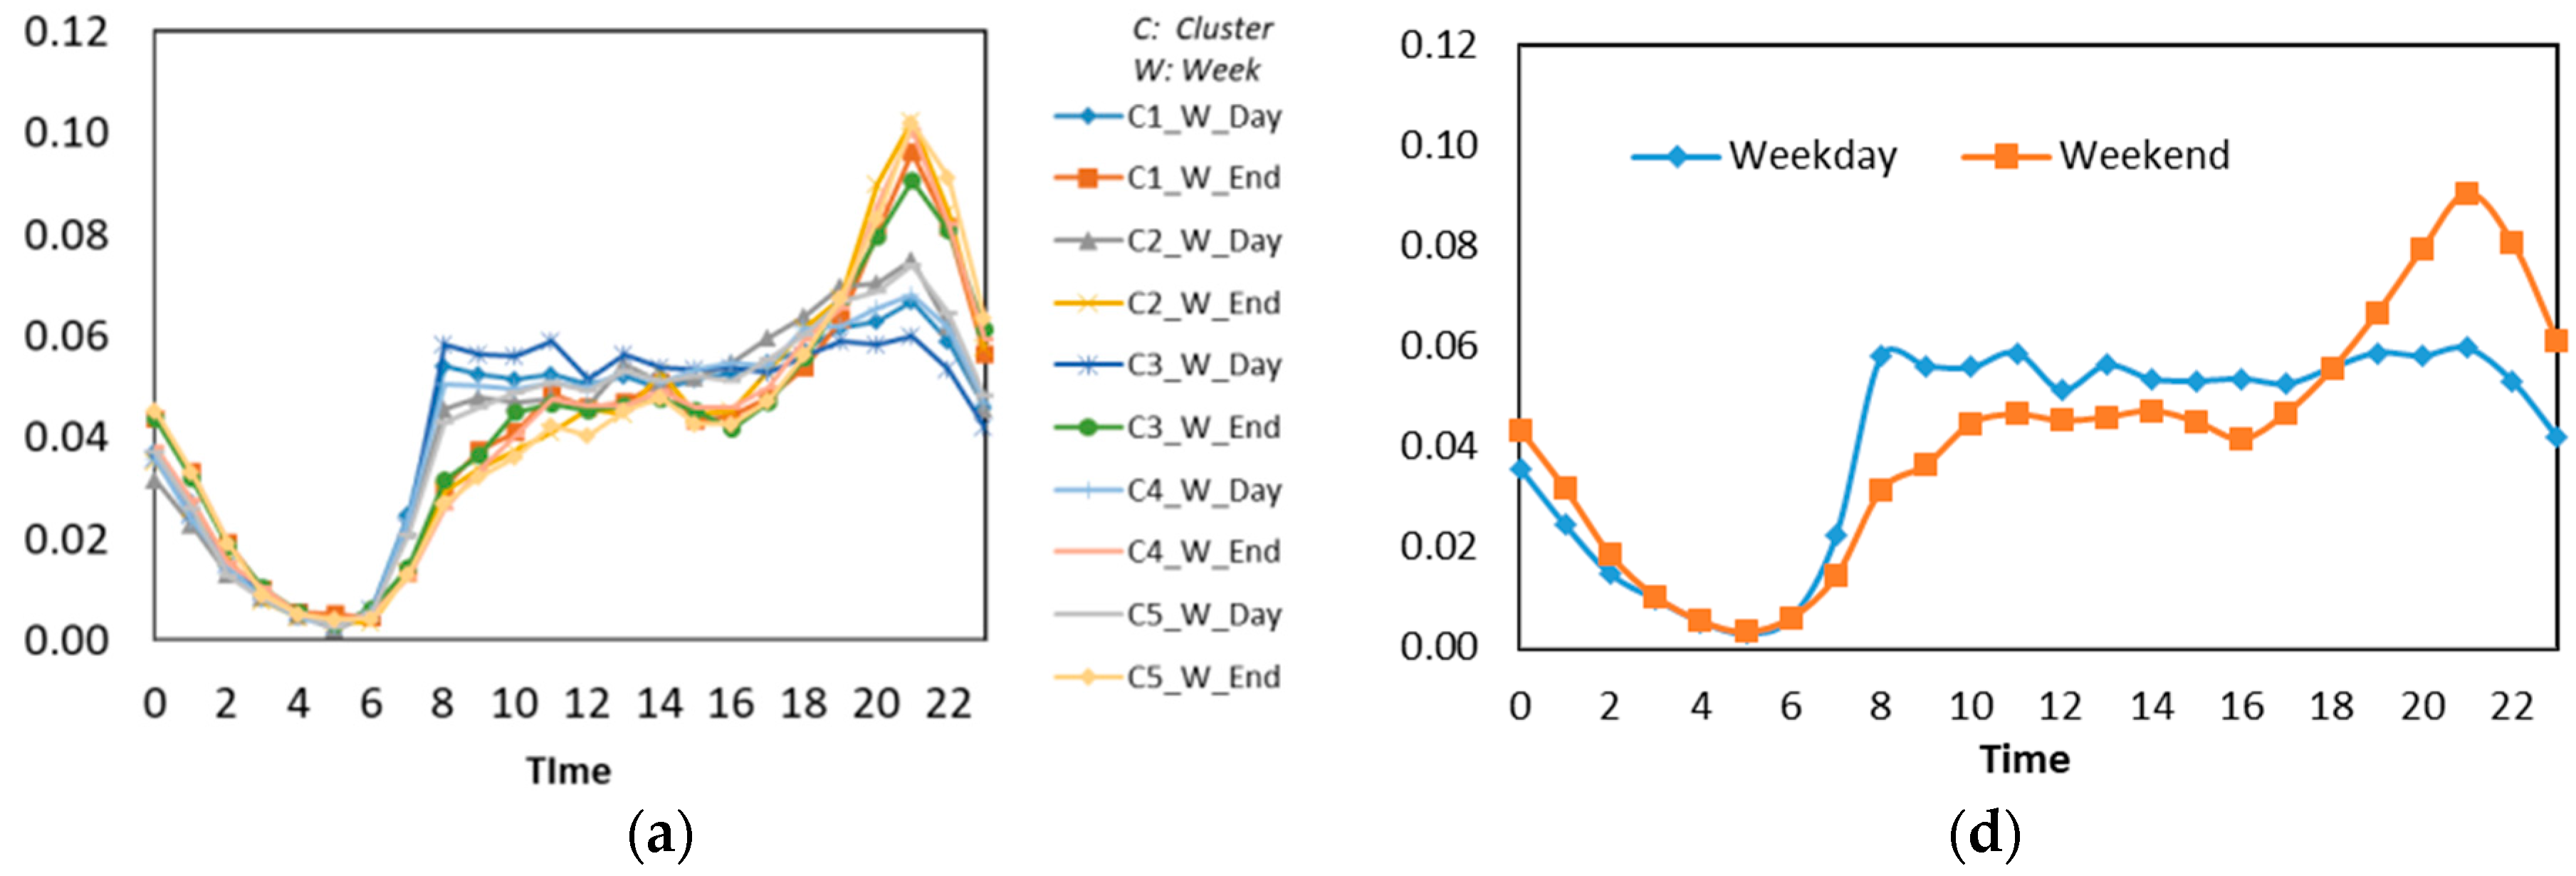
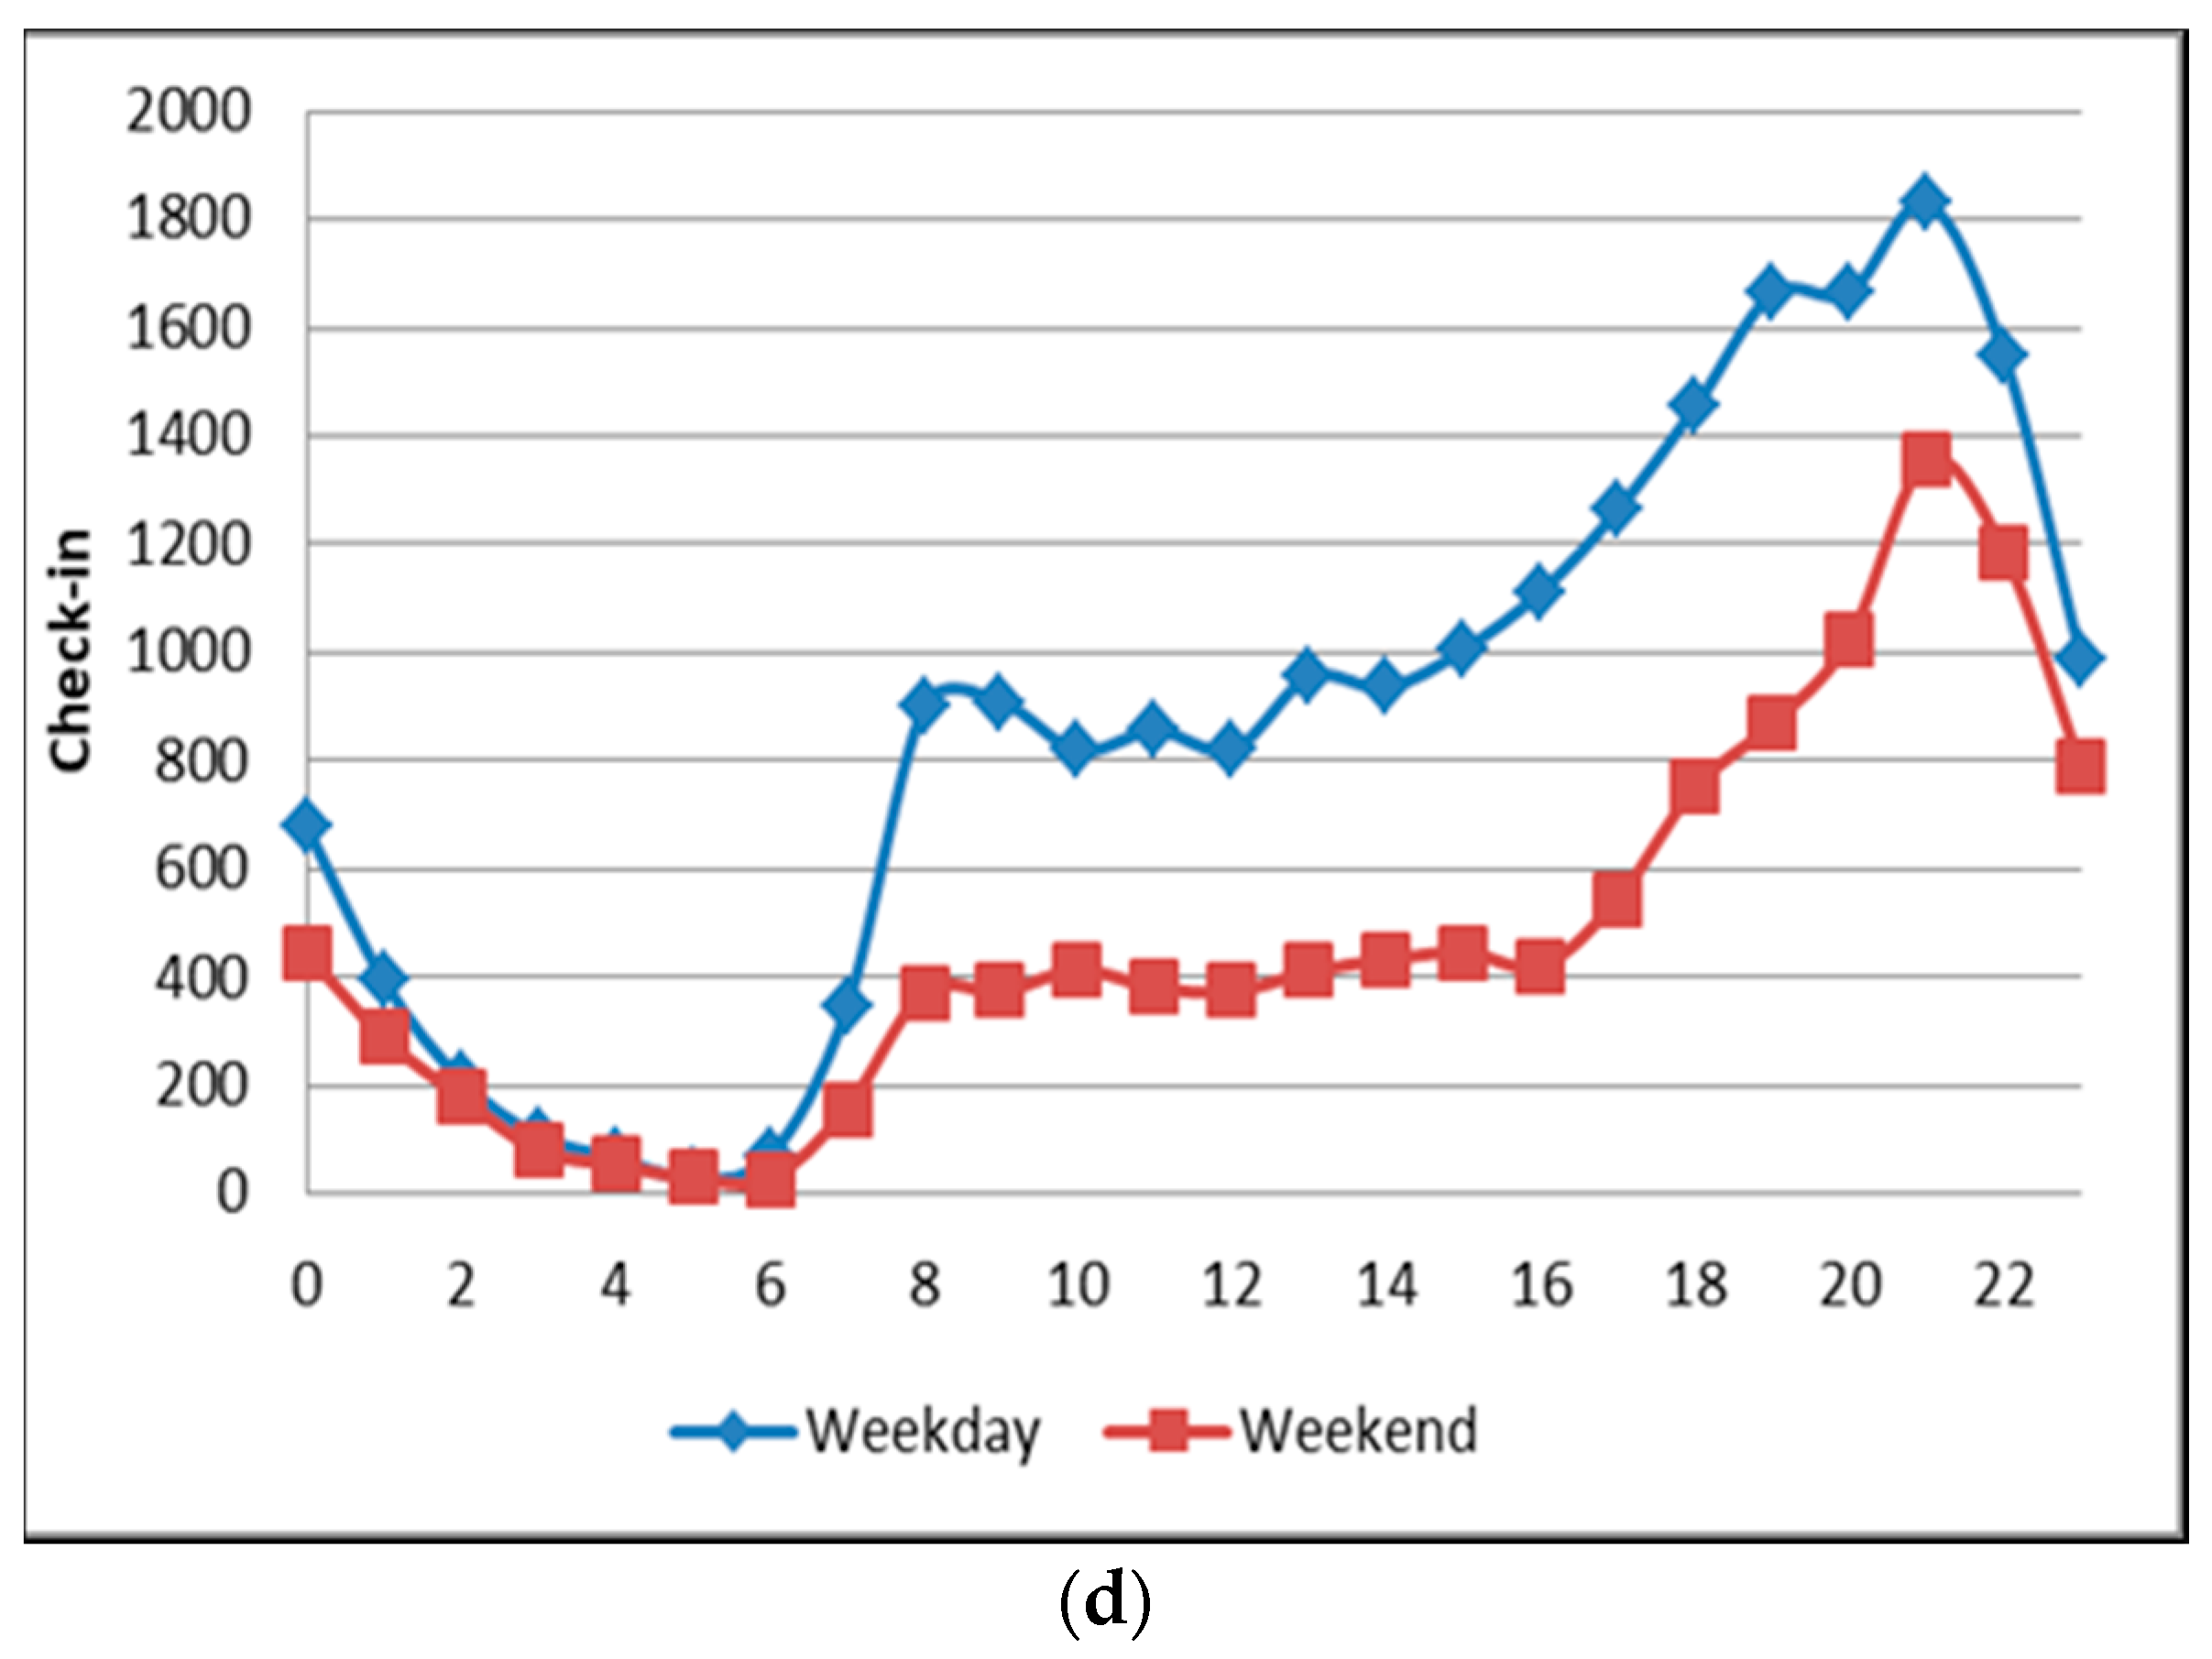
- We then analyzed the time distribution frequency on each class to determine the trends of each region by comparing weekday and weekend check-in patterns. In doing so, the identification of land use could be detected.
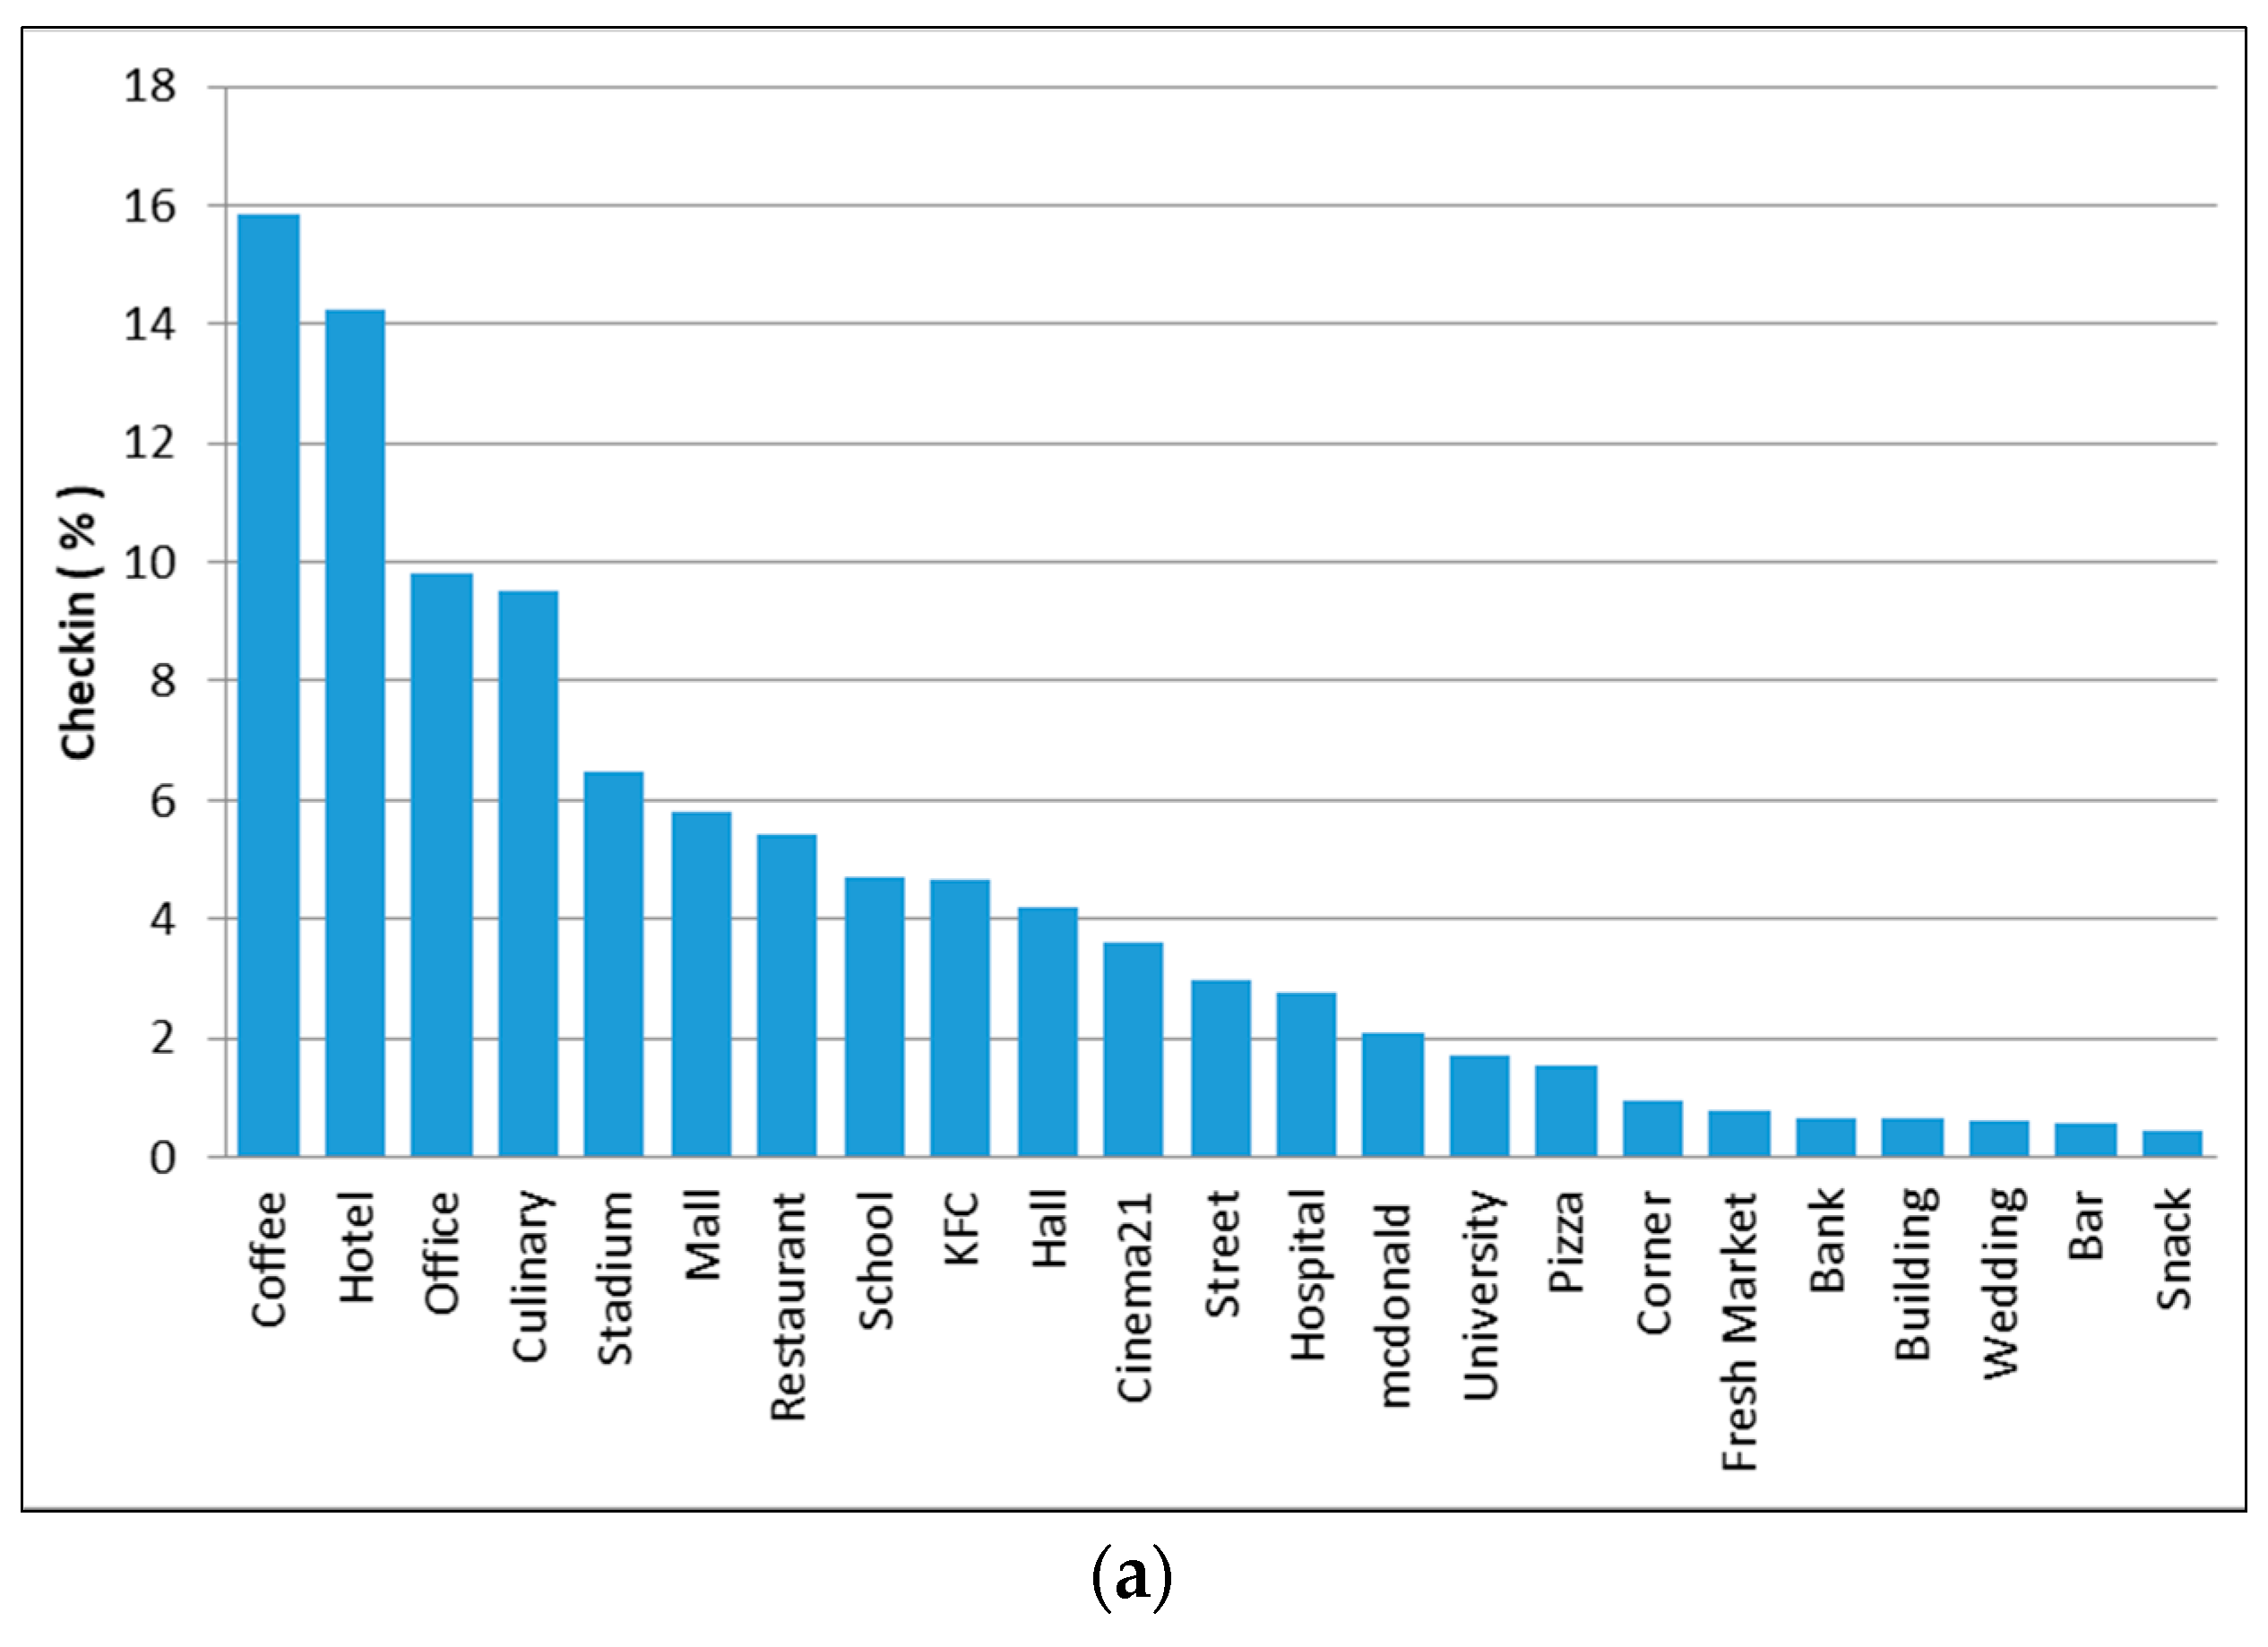
4.1. Housing Area (Cluster 1)
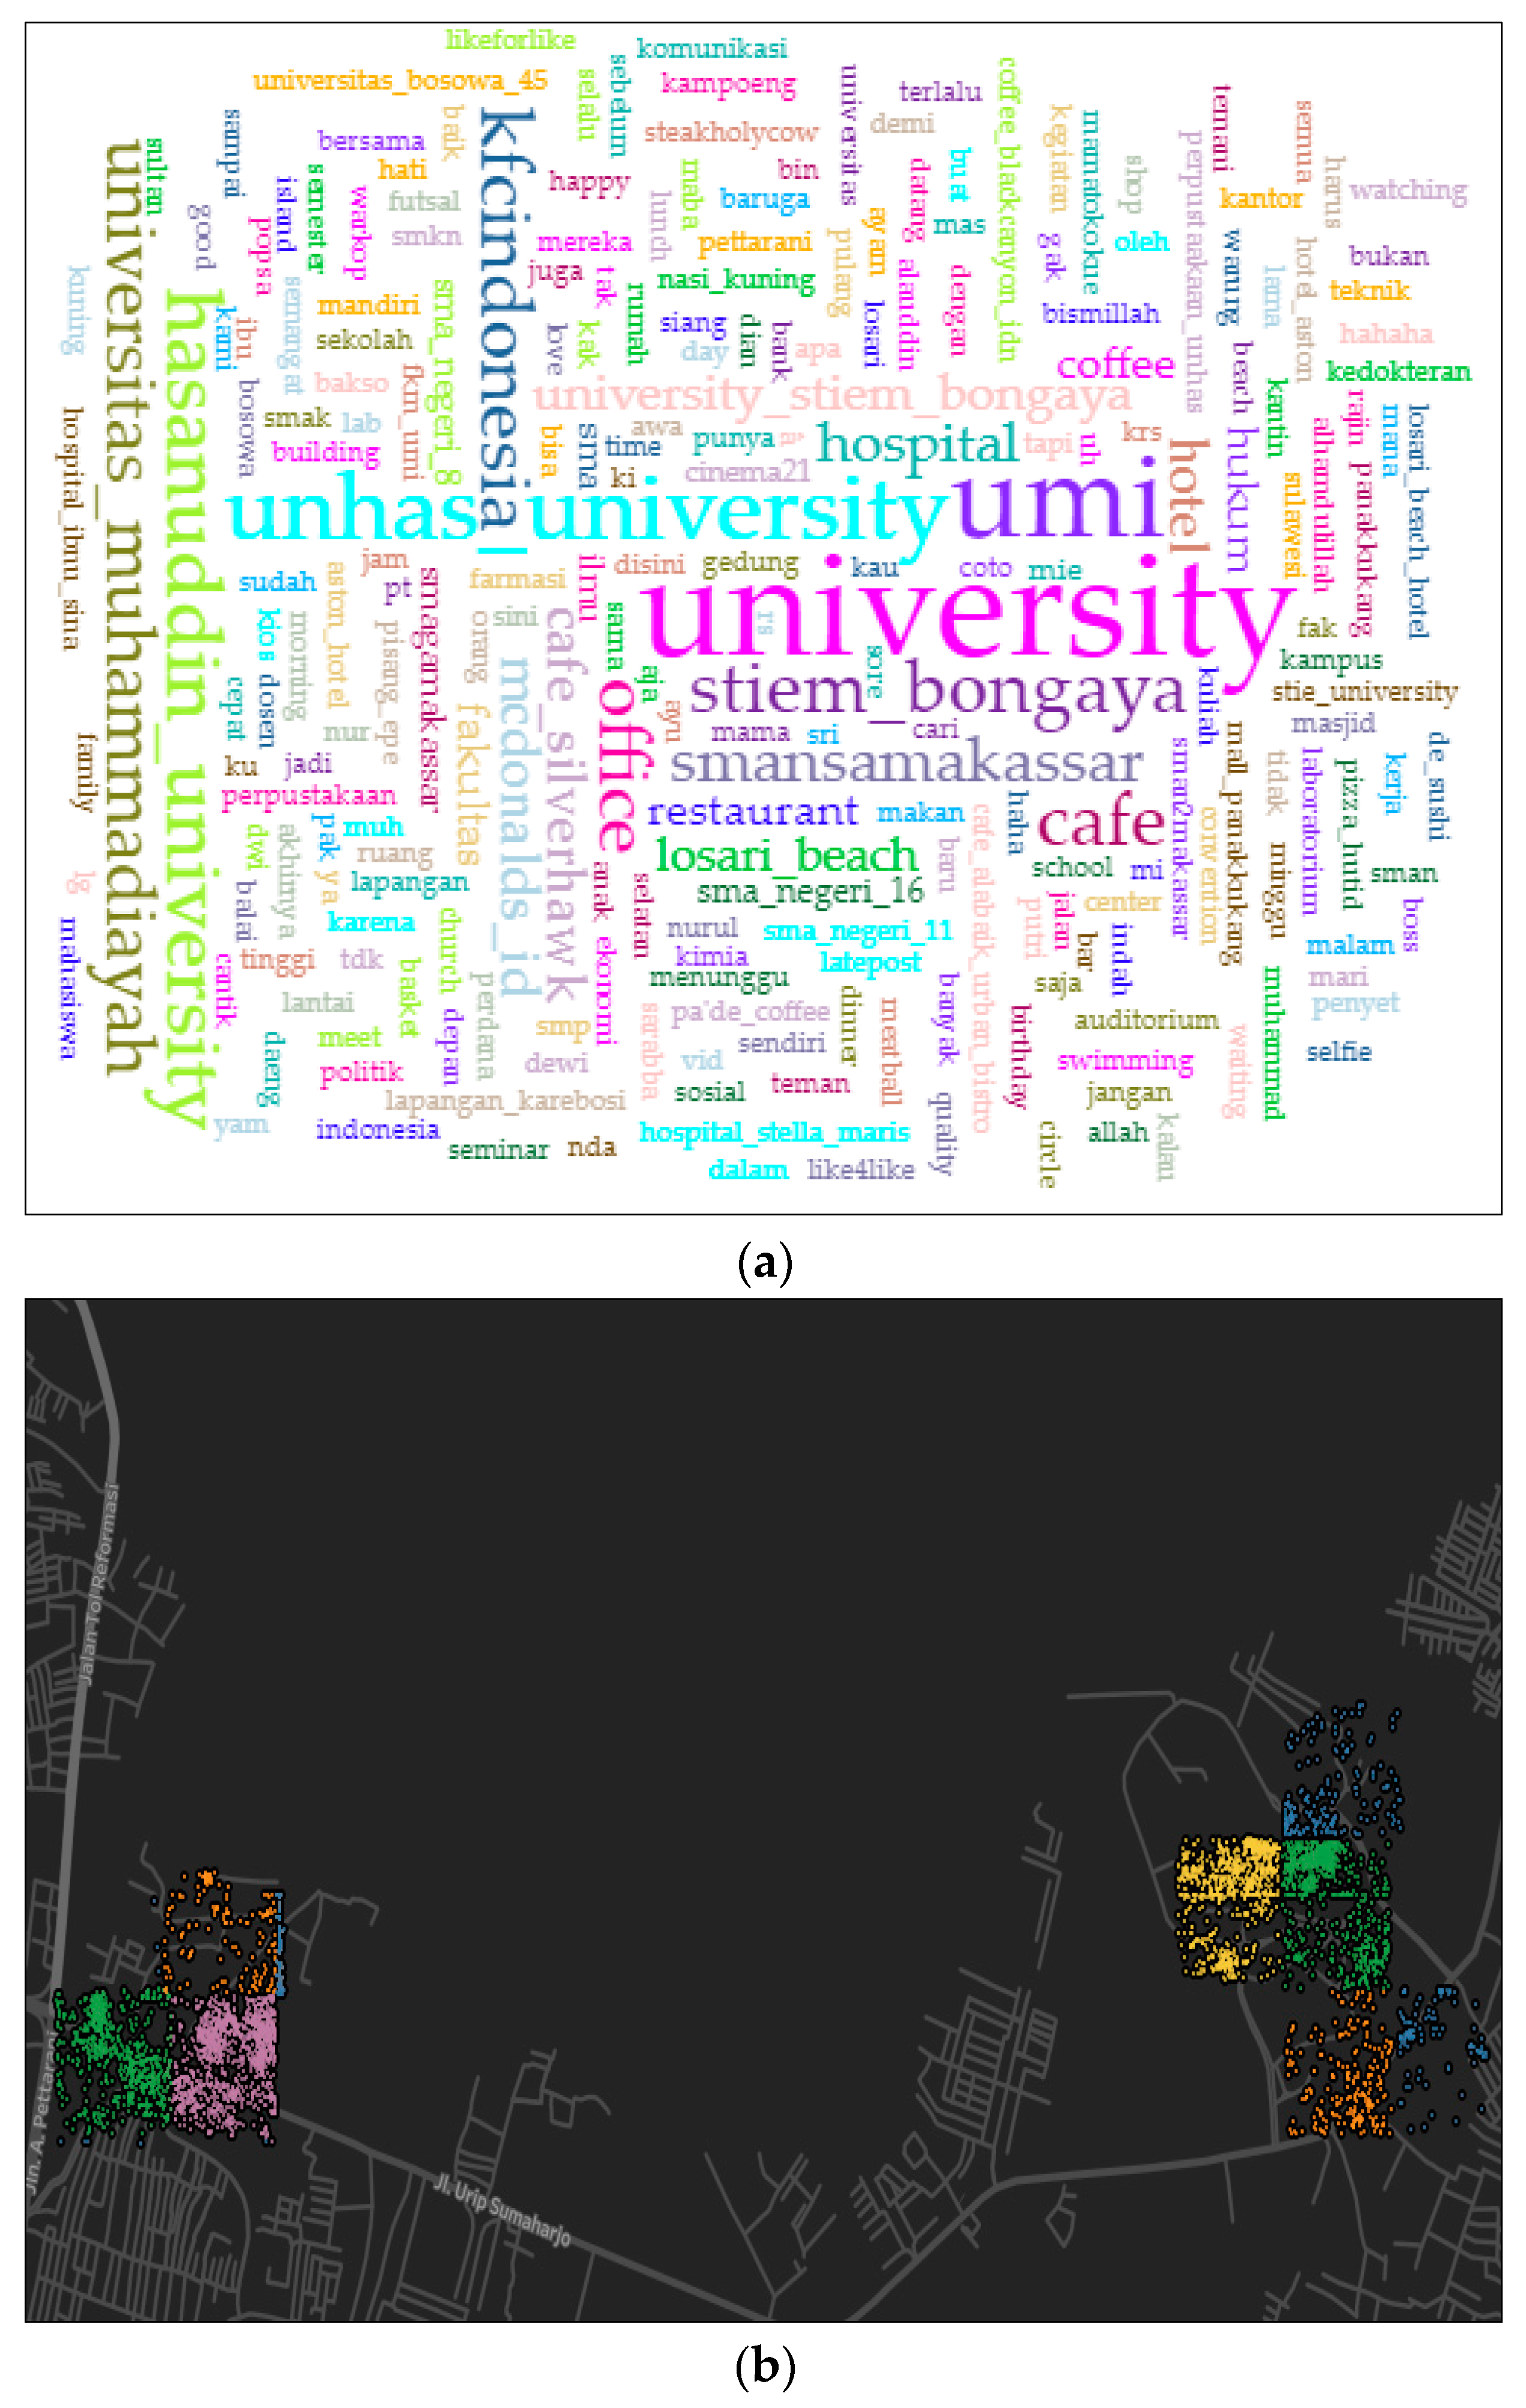
4.2. Education Area (Cluster 2)
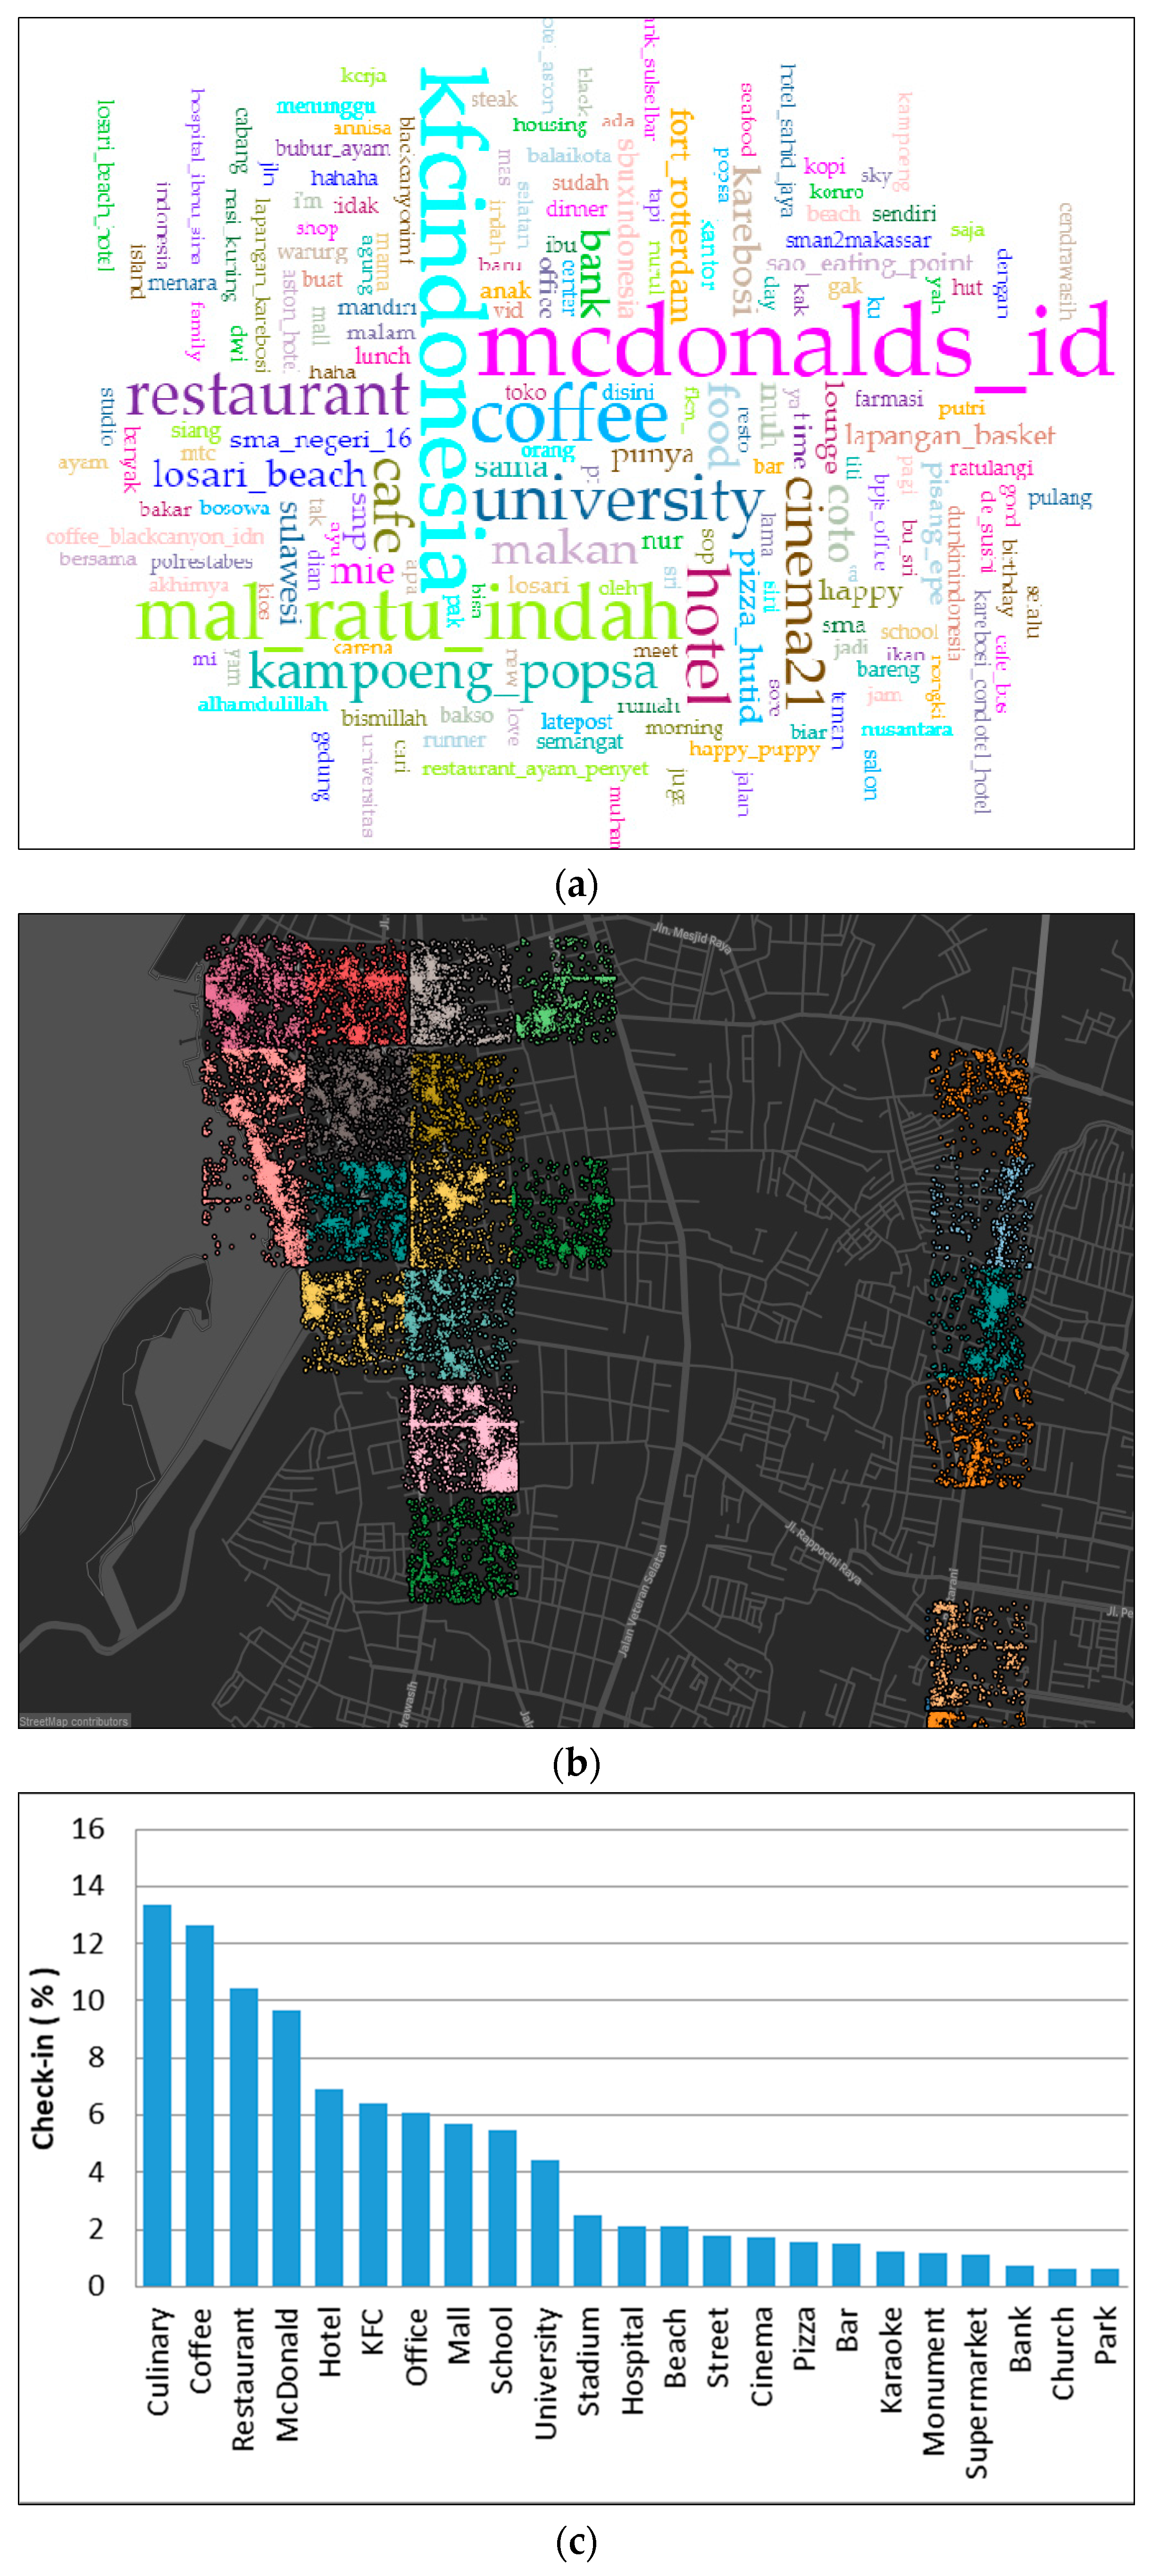
4.3. Commercial, Business, and Work Area (Cluster 3)
4.4. Mixed Area (Cluster 4)
5. Conclusions
Acknowledgments
Author Contributions
Conflicts of Interest
Appendix A

| C200 | Check-In | C300 | Check-In | C400 | Check-In | C500 | Check-In |
| Housing | 1350 | Housing | 1135 | Housing | 1060 | School | 866 |
| University | 469 | University | 885 | Street | 877 | University | 696 |
| Office | 400 | School | 407 | University | 600 | Housing | 457 |
| Street | 303 | Street | 305 | Coffee | 619 | Coffee | 556 |
| School | 299 | Coffee | 267 | Office | 427 | Hospital | 318 |
| Restaurant | 269 | Café | 253 | School | 349 | Office | 189 |
| Coffee | 454 | Office | 248 | Culinary | 268 | Hotel | 119 |
| Pool | 133 | Park | 194 | KFC | 268 | Bank | 109 |
| Seafood | 117 | Meatball | 165 | Meatball | 255 | Ice | 107 |
| Beach | 116 | Culinary | 154 | Hospital | 222 | Street | 107 |
| Culinary | 112 | Restaurant | 149 | Beach | 188 | Unhas | 106 |
| Shop | 96 | Hospital | 119 | Eating | 181 | Meatball | 104 |
| Park | 92 | Noodle | 113 | Hotel | 150 | Eating | 97 |
| Cinema21 | 88 | Hotel | 109 | Noodle | 114 | Culinary | 66 |
| Meatball | 82 | Hall | 92 | Seafood | 108 | Chicken | 62 |
| Field | 81 | Mosque | 83 | Mosque | 97 | ||
| C900 | Check-In | C1100 | Check-In | C5200 | Check-In | C700 | Check-In |
| KFC | 427 | McDonald | 390 | Mall | 845 | Coffee | 763 |
| Coffee | 450 | Ice | 217 | KFC | 631 | Hospital | 268 |
| Housing | 288 | Stadium | 191 | Cinema21 | 364 | University | 366 |
| Hospital | 242 | Restaurant | 319 | McDonald | 333 | Street | 212 |
| Eating | 329 | Office | 181 | Eating | 245 | Office | 206 |
| Mall | 164 | Coffee | 105 | Coffee | 501 | Meatball | 175 |
| Noodle | 126 | Noodle | 101 | Pizza | 216 | Housing | 174 |
| Pizza | 97 | Meatball | 91 | Street | 148 | Seafood | 164 |
| Office | 149 | Café | 68 | Hotel | 133 | Eating | 124 |
| Soccer | 73 | Hotel | 64 | Karaoke | 121 | School | 118 |
| Hotel | 64 | Karaoke | 51 | Restaurant | 117 | Restaurant | 101 |
| Street | 60 | Shop | 45 | Culinary | 117 | Skincare | 98 |
| Porridge | 59 | Mall | 44 | Supermarket | 100 | Cheese | 88 |
| Noodle | 55 | Housing | 39 | Office | 165 | Eating | 85 |
| Cinema21 | 53 | Church | 37 | Shop | 91 | ||
| C1200 | Check-In | C3300 | Check-In | C600 | Check-In | C1000 | Check-In |
| School | 592 | Coffee | 606 | Hotel | 1354 | Coffee | 488 |
| Church | 91 | KFC | 219 | Hall | 341 | University | 344 |
| Coffee | 86 | Cinema21 | 194 | University | 314 | School | 322 |
| Culinary | 147 | Market | 142 | Café | 168 | Culinary | 140 |
| Coffee | 73 | Mall | 122 | School | 136 | Restaurant | 119 |
| Restaurant | 138 | Hotel | 52 | Corner | 87 | Housing | 108 |
| Office | 51 | Street | 87 | Office | 66 | Cinema21 | 107 |
| Hotel | 42 | Bar | 80 | Street | 65 | Noodle | 73 |
| Culinary | 38 | Tea | 77 | School | 65 | Shop | 67 |
| Mall | 38 | Eating | 72 | Building | 57 | Mall | 56 |
| Clinic | 35 | Karaoke | 65 | Wedding | 56 | Office | 48 |
| Store | 29 | Culinary | 182 | Swimming | 55 | Eating | 45 |
| Mall | 28 | Pizza | 63 | Garden | 47 | Bank | 38 |
| Donuts | 26 | Snack | 58 | ||||
| C1800 | Check-In | C2500 | Check-In | C6600 | Check-In | C1300 | Check-In |
| Pizza | 291 | Culinary | 544 | Mall | 1145 | University | 928 |
| Coffee | 361 | Hotel | 263 | Cinema21 | 1025 | McDonald | 371 |
| University | 224 | Office | 114 | Tea | 347 | KFC | 199 |
| Culinary | 190 | Bar | 92 | Supermarket | 250 | Hospital | 186 |
| School | 305 | Mall | 159 | Pizza | 191 | Office | 153 |
| Beach | 187 | Culinary | 102 | Mall | 188 | Street | 152 |
| Restaurant | 482 | Tower | 82 | Coffee | 209 | Coffee | 247 |
| Bar | 131 | Park | 60 | Eating | 102 | Restaurant | 77 |
| Meatball | 119 | Bank | 52 | Restaurant | 313 | Monument | 161 |
| Office | 106 | Hospital | 73 | Bank | 61 | Pizza | 60 |
| Hall | 84 | Eating | 44 | Bookstore | 70 | Noodle | 56 |
| Bank | 70 | Coffee | 32 | ||||
| C7600 | Check-In | C3600 | Check-In | C2900 | Check-In | C1900 | Check-In |
| Mall | 1720 | Hotel | 1106 | Restaurant | 444 | McDonald | 914 |
| Cinema | 935 | Office | 571 | Fort | 296 | Coffee | 344 |
| KFC | 159 | University | 325 | Office | 239 | Office | 172 |
| Tea | 243 | Café | 165 | Coffee | 200 | Eating | 163 |
| Eating | 183 | School | 187 | Park | 67 | Culinary | 271 |
| Coffee | 294 | Ballroom | 100 | Food | 44 | Hotel | 77 |
| Pizza | 141 | Happy | 98 | Bar | 87 | Steak | 77 |
| Restaurant | 180 | Corner | 87 | Culinary | 76 | Ice | 74 |
| Snack | 95 | Wedding | 56 | Hotel | 36 | University | 64 |
| Bookstore | 70 | Street | 131 | Eating | 137 | ||
| C1700 | Check-in | C2100 | Check-in | C2400 | Check-in | C800 | Check-in |
| Mall | 687 | Field | 332 | School | 236 | University | 2138 |
| Cinema21 | 318 | KFC | 125 | KFC | 137 | Office | 564 |
| Restaurant | 101 | School | 246 | Culinary | 179 | School | 392 |
| Coffee | 119 | Field | 86 | Hotel | 142 | Culinary | 280 |
| Tea | 39 | Office | 152 | Field | 67 | KFC | 221 |
| Dinner | 33 | Mall | 70 | Bank | 60 | Seafood | 139 |
| Lunch | 27 | Street | 70 | Coffee | 137 | Pizza | 123 |
| Bank | 25 | Pizza | 53 | Hospital | 41 | Coffee | 116 |
| Snack | 25 | Coffee | 96 | Restaurant | 64 | Soccer | 108 |
| Fitness | 18 | Bank | 42 | ||||
| C2000 | Check-in | C2200 | Check-in | C1500 | Check-in | C100 | Check-in |
| Restaurant | 568 | University | 1897 | University | 1715 | Housing | 779 |
| Hotel | 175 | Beach | 438 | Café | 992 | University | 135 |
| Café | 169 | Restaurant | 258 | Cinema21 | 228 | Street | 111 |
| Bar | 139 | KFC | 241 | Mall | 241 | School | 101 |
| Guesthouse | 84 | Culinary | 200 | Building | 130 | Café | 41 |
| Office | 42 | Coffee | 325 | Library | 233 | Coffee | 37 |
| Hospital | 34 | Hotel | 508 | Meatball | 61 | Restaurant | 36 |
| Eating | 52 | Hall | 84 | Hotel | 59 | Office | 29 |
| Culinary | 62 | Hospital | 106 | School | 57 | Culinary | 28 |
| C1600 | Check-in | C3000 | Check-in | C1400 | Check-in | C2300 | Check-in |
| Stadium | 849 | Mall | 1600 | University | 2117 | University | 574 |
| Office | 101 | Restaurant | 342 | Office | 603 | School | 958 |
| Photography | 62 | Cinema21 | 225 | Hospital | 191 | Futsal | 39 |
| Soccer | 57 | Coffee | 150 | Building | 92 | Hospital | 13 |
| School | 45 | Bar | 77 | School | 126 | Mosque | 18 |
| University | 87 | Snacks | 133 | Hall | 164 | ||
| Culinary | 22 | Eating | 31 | Canteen | 52 | ||
| Television | 17 | Fitness | 30 |
References
- Al-Tahir, R.; Rajack, F.; Oatham, M. Aerial photographs for detecting land use changes in Valencia Wildlife Sanctuary and Forest Reserve, Trinidad. Caribb. J. Earth Sci. 2005, 38, 35–42. [Google Scholar]
- Modara, M.; Belaid, M.A. Mapping and assessing land use/land cover change in Muharraq island based on GIS and remote sensing integration. Remote Sens. Spat. Inf. Sci. 2013, XL-4/W1, 57–63. [Google Scholar] [CrossRef]
- Reis, S. Analyzing land use/land cover changes using remote sensing and GIS in Rize, North-east Turkey. Multidiscip. Digit. Publ. Inst. 2008, 8, 6188–6202. [Google Scholar] [CrossRef] [PubMed]
- Fonji, S.F.; Taff, G.N. Using satellite data to monitor land-use land-cover change in North-eastern Latvia. Springerplus 2014, 3, 1–15. [Google Scholar] [CrossRef] [PubMed]
- Hu, T.; Yang, J.; Li, X.; Gong, P. Mapping urban land use by using landsat images and open social data. Remote Sens. Spat. Inf. Sci. 2016, 8, 151. [Google Scholar] [CrossRef]
- Kawakubo, F.S.; Morato, R.G.; Nader, R.S.; Luchiari, A. Mapping changes in coastline geomorphic features using landsat TM and ETM imagery: examples in South Eastern Brazil. Int. J. Remote Sens. 2011, 32, 2547–2562. [Google Scholar] [CrossRef]
- Haeusler, M.H. Enabling low cost human presence tracking. In Proceedings of the International Conference of the Association for Computer-Aided Architectural Design Research in Asia CAADRIA, Melbourne, ON, Australia, 30 March–2 April 2016; pp. 45–54. [Google Scholar]
- Song, J.; Tang, E.Y.; Liu, L. User behavior pattern analysis and prediction based on mobile phone sensors. In Proceedings of the 2010 IFIP International Conference on Network and Parallel Computing, Zhengzhou, China, 13–15 September 2010; Springer: Berlin/Heidelberg, Germany, 2010; pp. 177–189. [Google Scholar]
- Zhang, A. Detecting Human Behavior Patterns from Mobile Phone. J. Comput. Inf. Syst. 2012, 8, 2671–2679. [Google Scholar]
- Jankowska, M.M.; Schipperijn, J.; Kerr, J. A framework for using GPS data in physical activity and sedentary behavior studies. Exerc. Sport Sci. Rev. 2015, 43, 48–56. [Google Scholar] [CrossRef] [PubMed]
- Munizaga, M.; Devillaine, F.; Navarrete, C.; Silva, D. Validating travel behavior estimated from smartcard data. Transp. Res. Part C 2014, 44, 70–79. [Google Scholar] [CrossRef]
- Van der Spek, S.; van Schaick, J.; de Bois, P.; de Haan, R. Sensing human activity: GPS tracking. Sensors 2009, 9, 3033–3055. [Google Scholar] [CrossRef] [PubMed]
- Farshad, A.; Marina, M.K.; Garcia, F. Urban wifi characterization via mobile crowdsensing. In Proceedings of the IEEE NOMS, Krakow, Poland, 5–9 May 2014. [Google Scholar]
- Soto, V.; Martinez, E.F. Automated land use identification using cell-phone records. In Proceedings of the 3rd ACM International Workshop on MobiArch, Bethesda, MA, USA, 28 June 2011; ACM: New York, NY, USA, 2011; pp. 17–22. [Google Scholar]
- Toole, J.L.; Ulm, M.; González, M.C. Inferring land use from mobile phone activity. In Proceedings of the ACM SIGKDD International Workshop on Urban Computing, Beijing, China, 12 August 2012; ACM: New York, NY, USA, 2012; pp. 1–8. [Google Scholar]
- Ratti, C.; Pulselli, R.M.; Williams, S.; Frenchman, D. Mobile Landscapes: Using location data from cell-phones for urban analysis. Environ. Plan. 2006, 33, 727–748. [Google Scholar] [CrossRef]
- Hasan, S.; Zhan, X.; Ukkusuri, S.V. Understanding urban human activity and mobility patterns using large-scale location-based data from online social media. In Proceedings of the 2nd ACM SIGKDD International Workshop on Urban Computing, Chicago, IL, USA, 11–14 August 2013; ACM: New York, NY, USA, 2013; p. 6. [Google Scholar]
- Sun, Y.; Li, M. Investigation of travel and activity patterns using location-based social network data: A case study of active mobile social media users. ISPRS Int. J. Geo. Inf. 2015, 4, 1512–1529. [Google Scholar] [CrossRef]
- Hasan, S.; Ukkusuri, S.V. Location contexts of user check-ins to model urban geo life-style patterns. PLoS ONE 2015, 10, e0124819. [Google Scholar] [CrossRef] [PubMed]
- Noulas, A.; Scellato, S.; Lathia, N.; Mascolo, C. Mining user mobility features for next place prediction in location-based services. In Proceedings of the 2012 IEEE 12th International Conference on Data Mining (ICDM), Brussels, Belgium, 10–13 December 2012. [Google Scholar]
- Mahmud, J.; Nichols, J.; Drews, C. Home Location Identification of Twitter Users. ACM Trans. Intell. Syst. Technol. 2013, 5, 1–47. [Google Scholar] [CrossRef]
- Williams, E.; Gray, J.; Dixon, B. Improving geolocation of social media posts. J. Pervasive Mob. Comput. 2017, 36, 68–79. [Google Scholar] [CrossRef]
- Kong, L.; Liu, Z.; Huang, Y. SPOT: Locating social media users based on social network context. Proc. VLDB Endow. 2014, 7, 1681–1684. [Google Scholar] [CrossRef]
- Qian, X.; Zhan, X.; Ukkusuri, S.V. Characterizing Urban Dynamics Using Large Scale Taxicab Data. In Engineering and Applied Science Optimization; Springer: Berlin, Germany, 2015; pp. 17–33. [Google Scholar]
- Yuan, J.; Zheng, Y.; Xie, X. Discovering regions of different functions in a city using human mobility and POIs. In Proceedings of the 18th ACM SIGKDD International Conference on Knowledge Discovery and Data Mining, Beijing, China, 12–16 August 2012; ACM: New York, NY, USA, 2012; pp. 186–194. [Google Scholar]
- Frias-Martinez, V.; Frias-Martinez, E. Spectral clustering for sensing urban land use using Twitter activity. Eng. Appl. Artif. Intell. 2014, 35, 237–245. [Google Scholar] [CrossRef]
- Hollenstein, L.; Purves, R.S. Exploring place through user-generated content: Using Flickr tags to describe city cores. J. Spat. Inf. Sci. 2010, 1, 21–48. [Google Scholar]
- Sun, Y.; Fan, H.; Li, M.; Zipf, A. Identifying the city center using human travel flows generated from location-based social networking data. Environ. Plan. B Plan. Des. 2015, 43, 480–498. [Google Scholar] [CrossRef]
- Lansley, G.; Longley, P.A. The geography of Twitter topics in London. Comput. Environ. Urban Syst. 2016, 58, 85–96. [Google Scholar] [CrossRef]
- Wang, Y.; Wang, T.; Tsou, M.H.; Li, H.; Jiang, W.; Guo, F. Mapping dynamic urban land use patterns with crowdsourced geo-tagged social media (sina-weibo) and commercial points of interest collections in Beijing, China. Sustain. Urban Rural Dev. 2016, 8, 1202. [Google Scholar] [CrossRef]
- Open Twitter Streaming Api. Available online: https://dev.twitter.com/docs/streaming-api (accessed on 26 August 2016).
- Central Bureau of Statistic. Available online: http://sp2010.bps.go.id/ (accessed on 18 October 2017).
- Wabula, Y.; Dewancker, B.J. Analysis of urban population using twitter distribution data: Case study of Makassar city, Indonesia. Int. Comput. Electr. Autom. Control Inf. Eng. Waset 2016, 10, 1627–1631. [Google Scholar]
- Land Use Map of Makassar City. Available online: http://darimakassar.com/rtrw-kota-makassar-2010-2030-2/ (accessed on 18 October 2017).
- Irfan, R.; King, C.K.; Es, G.; Ewen, S.; Khan, S.U.; Madani, S.A.; Kolodziez, J.O.; Wang, L.; Chen, D.; Rayes, A.; et al. A survey on text mining in social networks. Knowl. Eng. Rev. 2015, 30, 157–170. [Google Scholar] [CrossRef]
- Varghese, B.M.; Jose, J.T.; Unnikrishnan, A.; Poulose, K.J. Clustering Student Data to Characterize Performance Patterns. Int. J. Adv. Comput. Sci. Appl. Spec. Issue Artif. Intell. 2011, 2, 138–140. [Google Scholar]
- Mihai, D.; Mocanu, M. Statistical considerations on the k-means algorithm. Ann. Univ. Craiova Math. Comput. Sci. Ser. 2015, 42, 365–373. [Google Scholar]


| Category | Place |
|---|---|
| Art and Entertainment | Cinema, street park, bar, karaoke, hall, meeting building, monument, wedding hall, fort, photography studio, radio station, television station. |
| Business and Service | Hotel, guesthouse, housing, bank, diagnostic center, pharmacy, skincare clinic, hospital, telecommunication service headquarter |
| Community and Office | Electricity company, church, office, mosque, university, school, library |
| Food and Drink | Café, coffee shop, restaurant (culinary, meatball, seafood, noodle, chicken porridge, ice cream, fried chicken, pizza, donut, steak, snack, lunch, dinner, fried rice, sushi, and udon), tea house, canteen, cake shop, kiosk/corner stand (roasted corn, and fried banana) |
| Shopping | Mall, shop, store, fresh market, bike shop, bookstore |
| Sports and Recreation | Indoor soccer field, basketball court, beach, stadium, sports area, jogging track, garden, swimming pool, field, gym |
| Place | Check-In | % | Place | Check-In | % | Place | Check-In | % |
|---|---|---|---|---|---|---|---|---|
| Cluster 1 | Soccer | 597 | 0.032 | University | 11187 | 0.805 | ||
| Housing | 2974 | 19.101 | KFC | 450 | 0.024 | Cluster 4 | ||
| Mall | 1691 | 10.861 | Worship | 620 | 0.033 | Office | 2330 | 0.150 |
| Cinema | 1841 | 11.824 | Shop | 278 | 0.015 | School | 1742 | 0.112 |
| School | 1869 | 12.004 | Park | 247 | 0.013 | University | 1969 | 0.127 |
| University | 1780 | 11.432 | Seafood | 278 | 0.015 | Beach | 427 | 0.027 |
| Coffee | 1777 | 11.413 | Karaoke | 421 | 0.023 | Coffee | 3692 | 0.238 |
| Hotel | 958 | 6.153 | University | 436 | 0.023 | Hotel | 568 | 0.037 |
| McDonald’s | 958 | 6.153 | Cinema21 | 269 | 0.014 | Housing | 438 | 0.028 |
| Street | 877 | 5.633 | Hall | 658 | 0.035 | KFC | 1082 | 0.070 |
| Stadium | 845 | 5.427 | Fitness | 182 | 0.010 | Mall | 544 | 0.035 |
| Cluster 2 | Housing | 186 | 0.010 | McDonald’s | 444 | 0.029 | ||
| School | 1017 | 0.054 | Bookstore | 133 | 0.007 | Restaurant | 2309 | 0.149 |
| Hotel | 1003 | 0.054 | Hall | 680 | 0.031 | Cluster 5 | ||
| Culinary | 1372 | 0.073 | Tea | 590 | 0.027 | University | 3517 | 0.160 |
| Bank | 616 | 0.033 | Hotel | 438 | 0.020 | Restaurant | 2938 | 0.133 |
| Restaurant | 2811 | 0.151 | Meatball | 430 | 0.020 | Coffee | 2500 | 0.113 |
| Office | 1164 | 0.062 | Mall | 429 | 0.019 | Hospital | 1889 | 0.086 |
| Coffee | 963 | 0.052 | Beach | 375 | 0.017 | Culinary | 1570 | 0.071 |
| Street | 889 | 0.048 | Fort | 296 | 0.013 | Cinema21 | 1329 | 0.060 |
| Mall | 676 | 0.036 | Supermarket | 250 | 0.011 | Office | 1235 | 0.056 |
| Noodles | 1322 | 0.071 | Stadium | 191 | 0.009 | KFC | 1148 | 0.052 |
| Café | 376 | 0.020 | Cluster 3 | Street | 820 | 0.037 | ||
| Hospital | 506 | 0.027 | Housing | 1350 | 0.097 | McDonald’s | 704 | 0.032 |
| Pizza | 534 | 0.029 | Hotel | 1354 | 0.097 | Pizza | 698 | 0.032 |
| Cluster | Group Class |
|---|---|
| Cluster 1 | C100, C 200, C300, C400 |
| Cluster 2 | C500, C1200, C1300, C1400, C1500, C2200, C2300 |
| Cluster 3 | C1000, C1900, C2000, C2100, C2200, C2400, C2500, C2900, C5200 |
| Cluster 4 | C600, C700, C800, C900, C1100, C1600, C1700, C3300, C3600 |
| Cluster 1 | Cluster 2 | Cluster 3 | Cluster 4 | ||||
|---|---|---|---|---|---|---|---|
| Place | Check-In (%) | Place | Check-In (%) | Place | Check-In (%) | Place | Check-In (%) |
| Housing | 4324 | University | 8033 | Culinary | 2787 | Coffee | 2943 |
| 26.149 | 46.019 | 13.654 | 16.121 | ||||
| University | 2089 | Street | 2206 | Coffee | 2630 | Hotel | 2640 |
| 12.633 | 12.637 | 12.885 | 14.461 | ||||
| Coffee | 1634 | School | 996 | Restaurant | 2170 | Office | 1820 |
| 9.881 | 5.706 | 10.632 | 9.969 | ||||
| Street | 1596 | Restaurant | 814 | McDonald’s | 2008 | Culinary | 1767 |
| 9.652 | 4.663 | 9.838 | 9.679 | ||||
| Culinary | 1291 | Pizza | 728 | Hotel | 1440 | Stadium | 1205 |
| 7.807 | 4.170 | 7.055 | 6.601 | ||||
| School | 1156 | Office | 684 | KFC | 1333 | Mall | 1073 |
| 6.991 | 3.918 | 6.531 | 5.878 | ||||
| Office | 1112 | Monument | 606 | Office | 1269 | Restaurant | 1003 |
| 6.725 | 3.472 | 6.217 | 5.494 | ||||
| Restaurant | 608 | McDonald’s | 457 | Mall | 1184 | School | 873 |
| 3.677 | 2.618 | 5.801 | 4.782 | ||||
| Hospital | 341 | Mall | 440 | School | 1145 | KFC | 867 |
| 2.062 | 2.521 | 5.610 | 4.749 | ||||
| Beach | 304 | Library | 438 | University | 928 | Hall | 780 |
| 1.838 | 2.509 | 4.547 | 4.273 | ||||
| Park | 286 | KFC | 371 | Stadium | 523 | Cinema21 | 672 |
| 1.730 | 2.125 | 2.562 | 3.681 | ||||
| Office | 277 | Housing | 307 | Hospital | 440 | Street | 555 |
| 1.675 | 1.759 | 2.156 | 3.040 | ||||
| KFC | 268 | Hotel | 233 | Beach | 438 | Hospital | 510 |
| 1.621 | 1.335 | 2.146 | 2.794 | ||||
| Hotel | 259 | Hospital | 228 | Street | 370 | McDonald’s | 390 |
| 1.566 | 1.306 | 1.813 | 2.136 | ||||
| Soccer | 244 | Hall | 222 | Cinema | 364 | University | 314 |
| 1.476 | 1.272 | 1.783 | 1.720 | ||||
| Seafood | 225 | Culinary | 164 | Pizza | 329 | Pizza | 283 |
| 1.361 | 0.940 | 1.612 | 1.550 | ||||
| Mosque | 180 | Coffee | 161 | Bar | 318 | Corner | 174 |
| 1.089 | 0.922 | 1.558 | 0.953 | ||||
| Building | 154 | Cinema21 | 152 | Karaoke | 256 | Fresh market | 142 |
| 0.931 | 0.871 | 1.254 | 0.778 | ||||
| Shop | 96 | Building | 109 | Monument | 243 | Bank | 123 |
| 0.581 | 0.624 | 1.191 | 0.674 | ||||
| Hall | 92 | Beach | 107 | Supermarket | 236 | Building | 122 |
| 0.556 | 0.613 | 1.156 | 0.668 | ||||
© 2017 by the authors. Licensee MDPI, Basel, Switzerland. This article is an open access article distributed under the terms and conditions of the Creative Commons Attribution (CC BY) license (http://creativecommons.org/licenses/by/4.0/).
Share and Cite
Yuyun; Akhmad Nuzir, F.; Julien Dewancker, B. Dynamic Land-Use Map Based on Twitter Data. Sustainability 2017, 9, 2158. https://doi.org/10.3390/su9122158
Yuyun, Akhmad Nuzir F, Julien Dewancker B. Dynamic Land-Use Map Based on Twitter Data. Sustainability. 2017; 9(12):2158. https://doi.org/10.3390/su9122158
Chicago/Turabian StyleYuyun, Fritz Akhmad Nuzir, and Bart Julien Dewancker. 2017. "Dynamic Land-Use Map Based on Twitter Data" Sustainability 9, no. 12: 2158. https://doi.org/10.3390/su9122158
APA StyleYuyun, Akhmad Nuzir, F., & Julien Dewancker, B. (2017). Dynamic Land-Use Map Based on Twitter Data. Sustainability, 9(12), 2158. https://doi.org/10.3390/su9122158