1. Introduction
The last century was largely characterized by fossil fuel-based energy production, whereas the twenty-first century has been shaped by increasing efforts to mitigate global warming driven by CO
2 emissions. These efforts have formed the foundation of sustainable development, which aims to balance the use, conservation, and renewal of natural resources [
1]. In this context, the rapid and sustained advancements in photovoltaic (PV) technologies have led to a remarkable global expansion in solar power plant installations in recent years [
2]. While the worldwide installed PV capacity was approximately 593.9 GW in 2019, it is projected to reach nearly 1500 GW by 2030 [
3]. This accelerated deployment has intensified the demand for reliable fault detection, intelligent cleaning management, and advanced performance monitoring solutions to ensure long-term efficiency, safety, and economic viability of PV systems [
4].
The actual field performance of PV systems is not solely determined by module specifications; rather, it is strongly influenced by environmental conditions, installation characteristics, panel orientation, material properties, and maintenance practices [
5]. Among these factors, surface soiling caused by dust accumulation has been identified as one of the most critical contributors to power degradation. Experimental investigations in [
6] report that a dust density of only 10 g/m
2 can reduce PV output power by up to 34%, while each additional 10 g/m
2 increase in dust density results in an average efficiency loss of approximately 3.4%.
Numerous studies have demonstrated that the impact of dust on PV performance varies significantly depending on exposure duration and geographic location. In [
7], a comprehensive global dust distribution map has been developed by categorizing the Earth into four major regions based on dust concentration levels, revealing that the Middle East and North Africa are among the most heavily affected areas worldwide. Experimental studies conducted across different climatic regions have reported power losses ranging from 10 to 30% under moderate soiling conditions [
8,
9,
10]. In Egypt, energy production losses between 33.5 and 65.8% were observed after exposure periods of one to six months [
11]. Similarly, daily energy losses due to soiling were estimated at approximately 0.21% in the United States [
12], while studies in Saudi Arabia reported losses reaching 32 and 40% after several months of exposure [
13].
From a physical perspective, most deposited particles are larger than the wavelength of solar irradiance, leading to increased scattering and a significant reduction in the irradiance reaching the PV cells. Surface contamination also enhances optical reflectance, thereby decreasing photon absorption, while the accumulated dust layer alters the electrical characteristics of PV modules, potentially inducing reverse biasing, hotspot formation, and severe power degradation [
14]. As of 2020, global installed PV capacity reached 707.5 GW [
15], and it has been widely reported that insufficient or inefficient cleaning practices alone can translate into billions of dollars in global economic losses.
In addition to energy yield degradation, inappropriate or poorly timed cleaning operations may introduce significant environmental and operational burdens, particularly in water-scarce and arid regions. Cleaning operations constitute a major component of PV operation and maintenance costs; excessive or unnecessary cleaning increases operational expenses, whereas delayed interventions exacerbate energy yield losses [
16]. Moreover, in regions where cleaning water is extracted from deep groundwater sources, the energy cost of water extraction itself becomes a critical and often overlooked factor in maintenance decision-making.
Consequently, the accurate, rapid, and automated detection of surface soiling in PV panels is essential for preserving energy efficiency and optimizing maintenance costs. The early identification of surface contamination not only improves power output but also enhances panel safety, mitigates hotspot risks, and contributes to the long-term economic sustainability of PV power plants [
17]. However, achieving truly sustainable maintenance requires that cleaning decisions be evaluated not only based on potential energy recovery but also in relation to the energy and environmental costs associated with cleaning actions.
Conventional PV maintenance and fault diagnosis methods, such as thermal imaging inspections, current–voltage (I–V) curve analysis, and manual field inspections, present significant limitations in large-scale solar farms due to their high labor requirements, elevated equipment costs, and reliance on skilled operators [
18,
19]. Although thermal imaging is effective for identifying hotspots and cell-level failures, its operational complexity and cost reduce the overall efficiency. In this context, image processing and machine learning based approaches have emerged as powerful alternatives for PV fault and soiling detection.
Deep learning architectures, including convolutional neural networks (CNNs), Vision Transformers (ViTs), and hybrid image analysis frameworks, have demonstrated high accuracy in identifying surface defects, dust accumulation, cracks, and other anomalies [
20]. However, the majority of existing studies primarily focus on classification performance metrics, and neglect the integration of detected anomalies with real-world energy production data. This limitation creates a critical gap between image-based detection outcomes and their practical deployment in maintenance and operational decision-making processes. Although CNN- and ViT-based models can reliably discriminate against surface defects, comprehensive analyses that systematically link these visual anomalies to inverter-level energy production variations remain scarce.
Furthermore, existing image-based approaches rarely consider the energy cost and environmental implications of cleaning actions, particularly in regions affected by water scarcity and groundwater depletion. As a result, the direct integration of image-based detection results into cleaning optimization strategies, maintenance scheduling, and operational decision support systems remain challenging.
Despite the substantial progress achieved in image-based detection of PV surface defects and soiling-related performance losses, current approaches largely emphasize classification accuracy and fail to quantify the actual energy impact of detected anomalies under real field conditions. This limitation restricts the practical interpretability of image analytics outputs and obscures their operational relevance. There is therefore a clear need for a unified methodological framework that not only links visual anomaly detection with inverter-level energy losses but also embeds energy- and water-aware criteria into maintenance decision-making.
In contrast to existing studies that typically focus either on image-based detection or energy data analysis separately, this study proposes an integrated and decision-oriented framework that directly links visual anomaly detection with inverter-level energy performance. From a methodological perspective, the proposed framework introduces a structured mapping between visual perception and operational decision-making by transforming image-based classification outputs into physically interpretable energy indicators. This distinguishes the proposed approach from conventional system integration studies by explicitly linking perception, energy modeling, and decision-making within a unified and data-driven structure. The key contributions are summarized as follows:
The proposed model is not only trained on a benchmark dataset but also validated using real PV plant data, ensuring robustness under real operating conditions.
The study establishes a quantitative relationship between detected soiling types and inverter-level energy production, enabling physically interpretable performance analysis.
A novel cleaning decision framework is introduced by incorporating both energy recovery and water-related energy costs, providing a practical and operation-oriented solution for PV maintenance.
Unlike purely algorithmic studies, the novelty of this work lies in the integration of image-based deep learning outputs with inverter-level energy performance, enabling a direct and physically interpretable linkage between visual detection and operational impact.
The proposed approach constitutes a system-level methodological contribution by transforming visual classification outputs into a quantitative, data-driven, and decision-oriented framework, rather than focusing solely on model development.
The remainder of this paper is organized as follows:
Section 2 reviews some of the recent studies on image-based detection of PV panel surface anomalies and highlights the existing limitations in linking visual diagnostics with actual energy performance.
Section 3 presents the proposed methodology, including dataset preparation, model architecture, training strategy, and the real-world data acquisition process.
Section 4 discusses the experimental results, providing a comprehensive performance evaluation of the proposed classification technique and a quantitative analysis of inverter-level energy production before and after cleaning under normalized irradiance conditions. Finally,
Section 5 concludes the paper by summarizing the main findings, discussing practical implications for PV maintenance management, and outlining potential directions for future research.
2. Related Work
Surface soiling in PV panels—primarily caused by dust accumulation—has been extensively investigated due to its direct impact on irradiance losses and energy yield degradation. In [
21], a balanced dataset consisting of 2231 images collected from different regions of Bangladesh was constructed, and several state-of-the-art CNN models (AlexNet, VGG16, ResNet50, and InceptionV3) were evaluated alongside a custom-designed CNN architecture named SolNet. This comparison, along with the reported classification accuracy of 98.2%, demonstrates the effectiveness of image-based approaches in distinguishing clean and dusty panels. However, the model was trained and tested exclusively on the same dataset, and no real-world energy production data or large-scale deployment scenario was considered.
Similarly, the study in [
22] has employed 20 pretrained CNN architectures solely as feature extractors and compared their performances using four different support vector machine (SVM) kernels (i.e., Linear, RBF, Polynomial, and Sigmoid). DenseNet169 combined with a linear SVM achieved the highest classification accuracy, and additional validation was conducted using 100 new dusty panel images collected from different locations. In [
16], a two-class (clean–dusty) Kaggle dataset comprising 3260 images has been used to systematically evaluate an enhanced Adam optimizer incorporating Warmup and Cosine Annealing strategies across three CNN architectures (i.e., ResNet-18, VGG-16, and MobileNetV2). Comparative experiments with SGD, RMSprop, Adagrad, Nadam, and conventional Adam optimizers demonstrated consistent performance improvements. Nevertheless, this study also focused exclusively on binary classification and did not address other real-world surface anomalies such as bird droppings, water stains, shading, or scratches.
Ref. [
23] has adopted a hybrid CNN–ViT architecture to classify multiple fault types, including dust, bird droppings, snow, and physical and electrical damage. A comparison of DenseNet, VGG, ResNet, EfficientNet, ViT, and MobileNet models has revealed that these architectures can achieve low latency and a compact model size, making them suitable for real-time edge deployment. However, the absence of data augmentation techniques was identified as a key limitation, increasing the risk of overfitting. In contrast, ref. [
24] has employed YOLOv11 for multi-class detection of surface anomalies such as dust, defects, snow, and physical damage. By using aggressive data augmentation strategies that emulate real environmental conditions and integrating live camera feeds, the model was reported to be deployment ready. Despite these advantages, validation was limited to single panels or small panel groups, and no plant-scale integration was demonstrated.
Although these studies confirm that PV surface soiling can be effectively detected using image-based methods, the literature reveals that bird-dropping detection remains an area that is insufficiently explored. While bird droppings are occasionally included as a class label (e.g., in [
23]), no study provides a detailed quantitative assessment of their specific impact on inverter-level energy production or operational maintenance decisions. This suggests that, despite the maturity of the soiling literature, research focused on bird droppings remains an emerging and underdeveloped area.
Machine learning and deep learning approaches have been widely applied to the automated detection of PV panel defects and anomalies, resulting in a diverse methodological landscape. Transfer learning-based approaches, such as the study in [
25], retrained AlexNet using fine-tuning to detect micro-cracks, scratches, burns, soiling, and crystal breakage with an accuracy of 93.3%. While these results highlight the effectiveness of transfer learning even with small and heterogeneous datasets, the manual collection of images from search engines (e.g., Google, Bing, Yahoo) introduces issues related to data imbalance, inconsistent resolution, and varying image quality. Moreover, the lack of comparison with more advanced architecture represents a notable limitation.
A significant number of object detection-oriented studies rely on the YOLO family. In [
26], an extended dataset combining thermal (Roboflow) and optical (Kaggle) images has been used to compare YOLOv9, YOLOv10-X, and YOLOv11-X against SVM, Faster R-CNN, and YOLOv5s. Here, detection performance is evaluated using the mean Average Precision (mAP), which is a standard metric in object detection that summarizes the area under the precision–recall curve across different intersection-over-union (IoU) thresholds. YOLOv11-X achieves the highest mAP values while maintaining a smaller model size and lower latency, demonstrating its suitability for edge devices. In [
27], a YOLOv7-based model has been trained on thermal infrared images and deployed for real-time hotspot detection using drone-acquired thermal videos in an active PV field. Although this approach offers low computational cost and practical field usability, it focuses exclusively on thermal hotspots and does not consider RGB image fusion or a broader range of surface anomalies.
Electroluminescence (EL) image-based studies also constitute an important research direction. In [
28], a YOLOv5s model has been enhanced using deformable convolution, ECA attention, a redesigned prediction head, K-means clustering, and hybrid data augmentation to detect cracks, finger interruptions, and black-core defects in EL images. Ablation studies demonstrated a 7.85% improvement in mAP. In [
29], ResNet18, ShuffleNet, and CNN-ILD architectures have been evaluated on an expanded and balanced ELPV dataset (~8400 images), achieving classification accuracies between 94 and 98% for an eight-class scenario. The introduction of a refined multi-class taxonomy and extensive data augmentation represents a meaningful methodological contribution. Similarly, ref. [
30] has proposed a lightweight YOLOv8-based EL defect detection model incorporating DW-Conv, GSConv, and BiFPN modules, reducing parameter count by 14% while improving multi-scale feature fusion for distributed building-integrated PV systems. While EL-based methods are effective for cell-level diagnostics, they are typically unsuitable for routine, large-scale outdoor maintenance and cleaning decision support.
Several studies have also focused on optimization strategies. In [
31], five pretrained CNN architectures, including VGGNet-16, have been evaluated using six different metaheuristic optimization algorithms, namely Bacterial Foraging Optimization (BFO), Grey Wolf Optimizer, Ant Colony Optimization, Bee Colony Optimization, Particle Swarm Optimization, and Genetic Algorithm. Among the evaluated combinations, the BFO + VGGNet-16 framework achieved the best overall performance, exceeding 98% accuracy, sensitivity, and specificity. Likewise, ref. [
16] demonstrated that the Adam optimizer enhanced with Warmup and Cosine Annealing learning rate scheduling consistently improved performance across different network architectures. In [
32], a low-complexity framework combining Residual Hybrid Attention, Global Spatial–Quality Attention, Robust Multi-View Defect Modeling, and Hierarchical Optimized Transfer Learning modules was proposed to achieve both noise reduction and defect localization; however, the model was evaluated only on author-collected data, which limits its generalizability to real-world PV installations.
Finally, among field-oriented applications, ref. [
33] has employed a YOLOv5l-based model to detect dusty, cracked, and normal panels using a low-cost drone platform. Histogram equalization was applied as a preprocessing step to enhance performance, and multiple YOLO variants (v5, v7, and v8) were compared, yielding F1-scores between 90 and 97%. The use of an original dataset comprising 1100 images and validation on real panels distinguishes this work from dataset-centric studies. However, the study did not analyze inverter-level energy recovery or the operational implications of cleaning actions.
In addition to deep learning-based approaches, several studies have investigated traditional machine learning, statistical, and experimental methods for PV soiling detection and performance analysis. For example, in [
34], a practical machine learning framework based on RGB image processing is developed to classify PV panels as clean or soiled. Multiple algorithms have been evaluated including CNN, SVM, Random Forest, KNN, Decision Tree, and Naïve Bayes, with the Random Forest model achieving the highest performance with an F1-score of 0.935. The study also incorporates real-world scenarios such as dust storms and rainfall to support maintenance decision-making. However, the approach remains limited to visual classification and does not explicitly link detected conditions to energy production.
In [
35], artificial neural networks have been used to estimate energy losses due to soiling based on environmental and electrical parameters such as irradiance, temperature, humidity, and current measurements. While this method demonstrates a strong statistical relationship between soiling and energy loss (with correlation values up to 0.91), it does not distinguish between different types of surface contamination and relies on indirect measurements rather than direct visual assessment.
Furthermore, ref. [
35] has adopted a purely experimental approach without employing machine learning techniques. By comparing clean, dusty, and conditionally cleaned panels, the study shows that dust accumulation can reduce maximum power around 10%. Although this approach provides valuable physical insight into the impact of soiling, it lacks automation and scalability for large-scale PV systems.
These studies indicate that traditional and non-vision-based approaches either rely on indirect measurements or lack automation and scalability. In contrast, vision-based deep learning methods provide direct insight into the physical surface conditions of PV panels. However, most existing vision-based studies focus primarily on detection accuracy and do not establish a direct connection between visual outputs and energy performance or maintenance decision-making.
Table 1 compares the features of the technique proposed in this paper against those existing methods. As shown in
Table 1, existing studies predominantly focus on image-based analysis without integrating inverter-level energy data or providing decision-oriented maintenance strategies. In contrast, the proposed study offers a comprehensive framework that combines visual detection, energy analysis, and practical decision support within a unified system. It should be emphasized that the novelty of this study does not lie in proposing a new deep learning architecture but in introducing a unified and physically interpretable framework that directly links visual soiling detection with inverter-level energy performance and sustainability-aware decision-making.
Overall, existing studies provide a rich literature in terms of model architecture, optimization techniques, data augmentation strategies, and state-of-the-art comparisons. However, nearly all evaluations remain confined to image-based classification or detection performance metrics.
Despite the significant progress achieved using modern deep learning architectures such as CNNs, ViTs, transfer learning, and YOLO-based detectors, several critical research gaps persist, as summarized below:
Lack of integration between image-based detection and energy production data: Most studies do not quantitatively link detected anomalies with inverter-level energy losses.
Insufficient real-field validation and cleaning impact analysis: Few works experimentally validate energy changes before and after cleaning under operational conditions.
Absence of sustainability-aware maintenance decision criteria: Existing approaches rarely consider the energy and water costs associated with cleaning actions, particularly in water-scarce regions.
Considering these limitations, there is a clear need for an image-based PV panel analysis framework that directly links visual anomaly detection with real-field energy production data and embeds energy- and sustainability-aware criteria into maintenance decision-making. In response to this need, the present study integrates deep learning-based surface condition classification with inverter-level energy performance analysis and experimentally evaluates the impact of cleaning through pre- and post-intervention measurements.
In summary, while some existing CNN-based models (e.g., SolNet) and recent YOLO-based detectors have demonstrated strong performance in PV panel defect and soiling detection, they primarily focus on classification or detection accuracy and do not establish a direct and quantitative link between visual outputs and inverter-level energy performance. In addition, while some studies consider cleaning optimization or economic benefits, they typically rely on simplified assumptions and do not explicitly incorporate the energy cost associated with water extraction and cleaning operations. As such, the key novelty of this study lies in the integration of three previously disconnected components into a unified and operational framework:
Therefore, unlike prior work, the proposed approach moves beyond detection or optimization in isolation and provides a physically interpretable and decision-oriented framework for PV maintenance. Additionally, unlike existing studies that primarily combine components at an application level, it provides a methodological contribution by establishing a structured and physically interpretable linkage between visual outputs and energy-based operational decisions.
3. Methodology
This section outlines the methodology used for the automated detection of PV panel surface anomalies and their integration with energy performance analysis. It presents the dataset and preprocessing steps, the EfficientNetB3-based two-stage visual classification model, the real-world data collection process, and the proposed energy–water–sustainability-aware cleaning decision framework.
3.1. Dataset Description
The primary data source used in this study is the Solar Panel Images Dataset, which is publicly available on the Kaggle platform [
36]. This dataset consists of a total of 869 images representing six surface condition classes: clean, dusty, bird-drop, electrical damage, physical damage, and snow-covered. This data has been used for model training in this study.
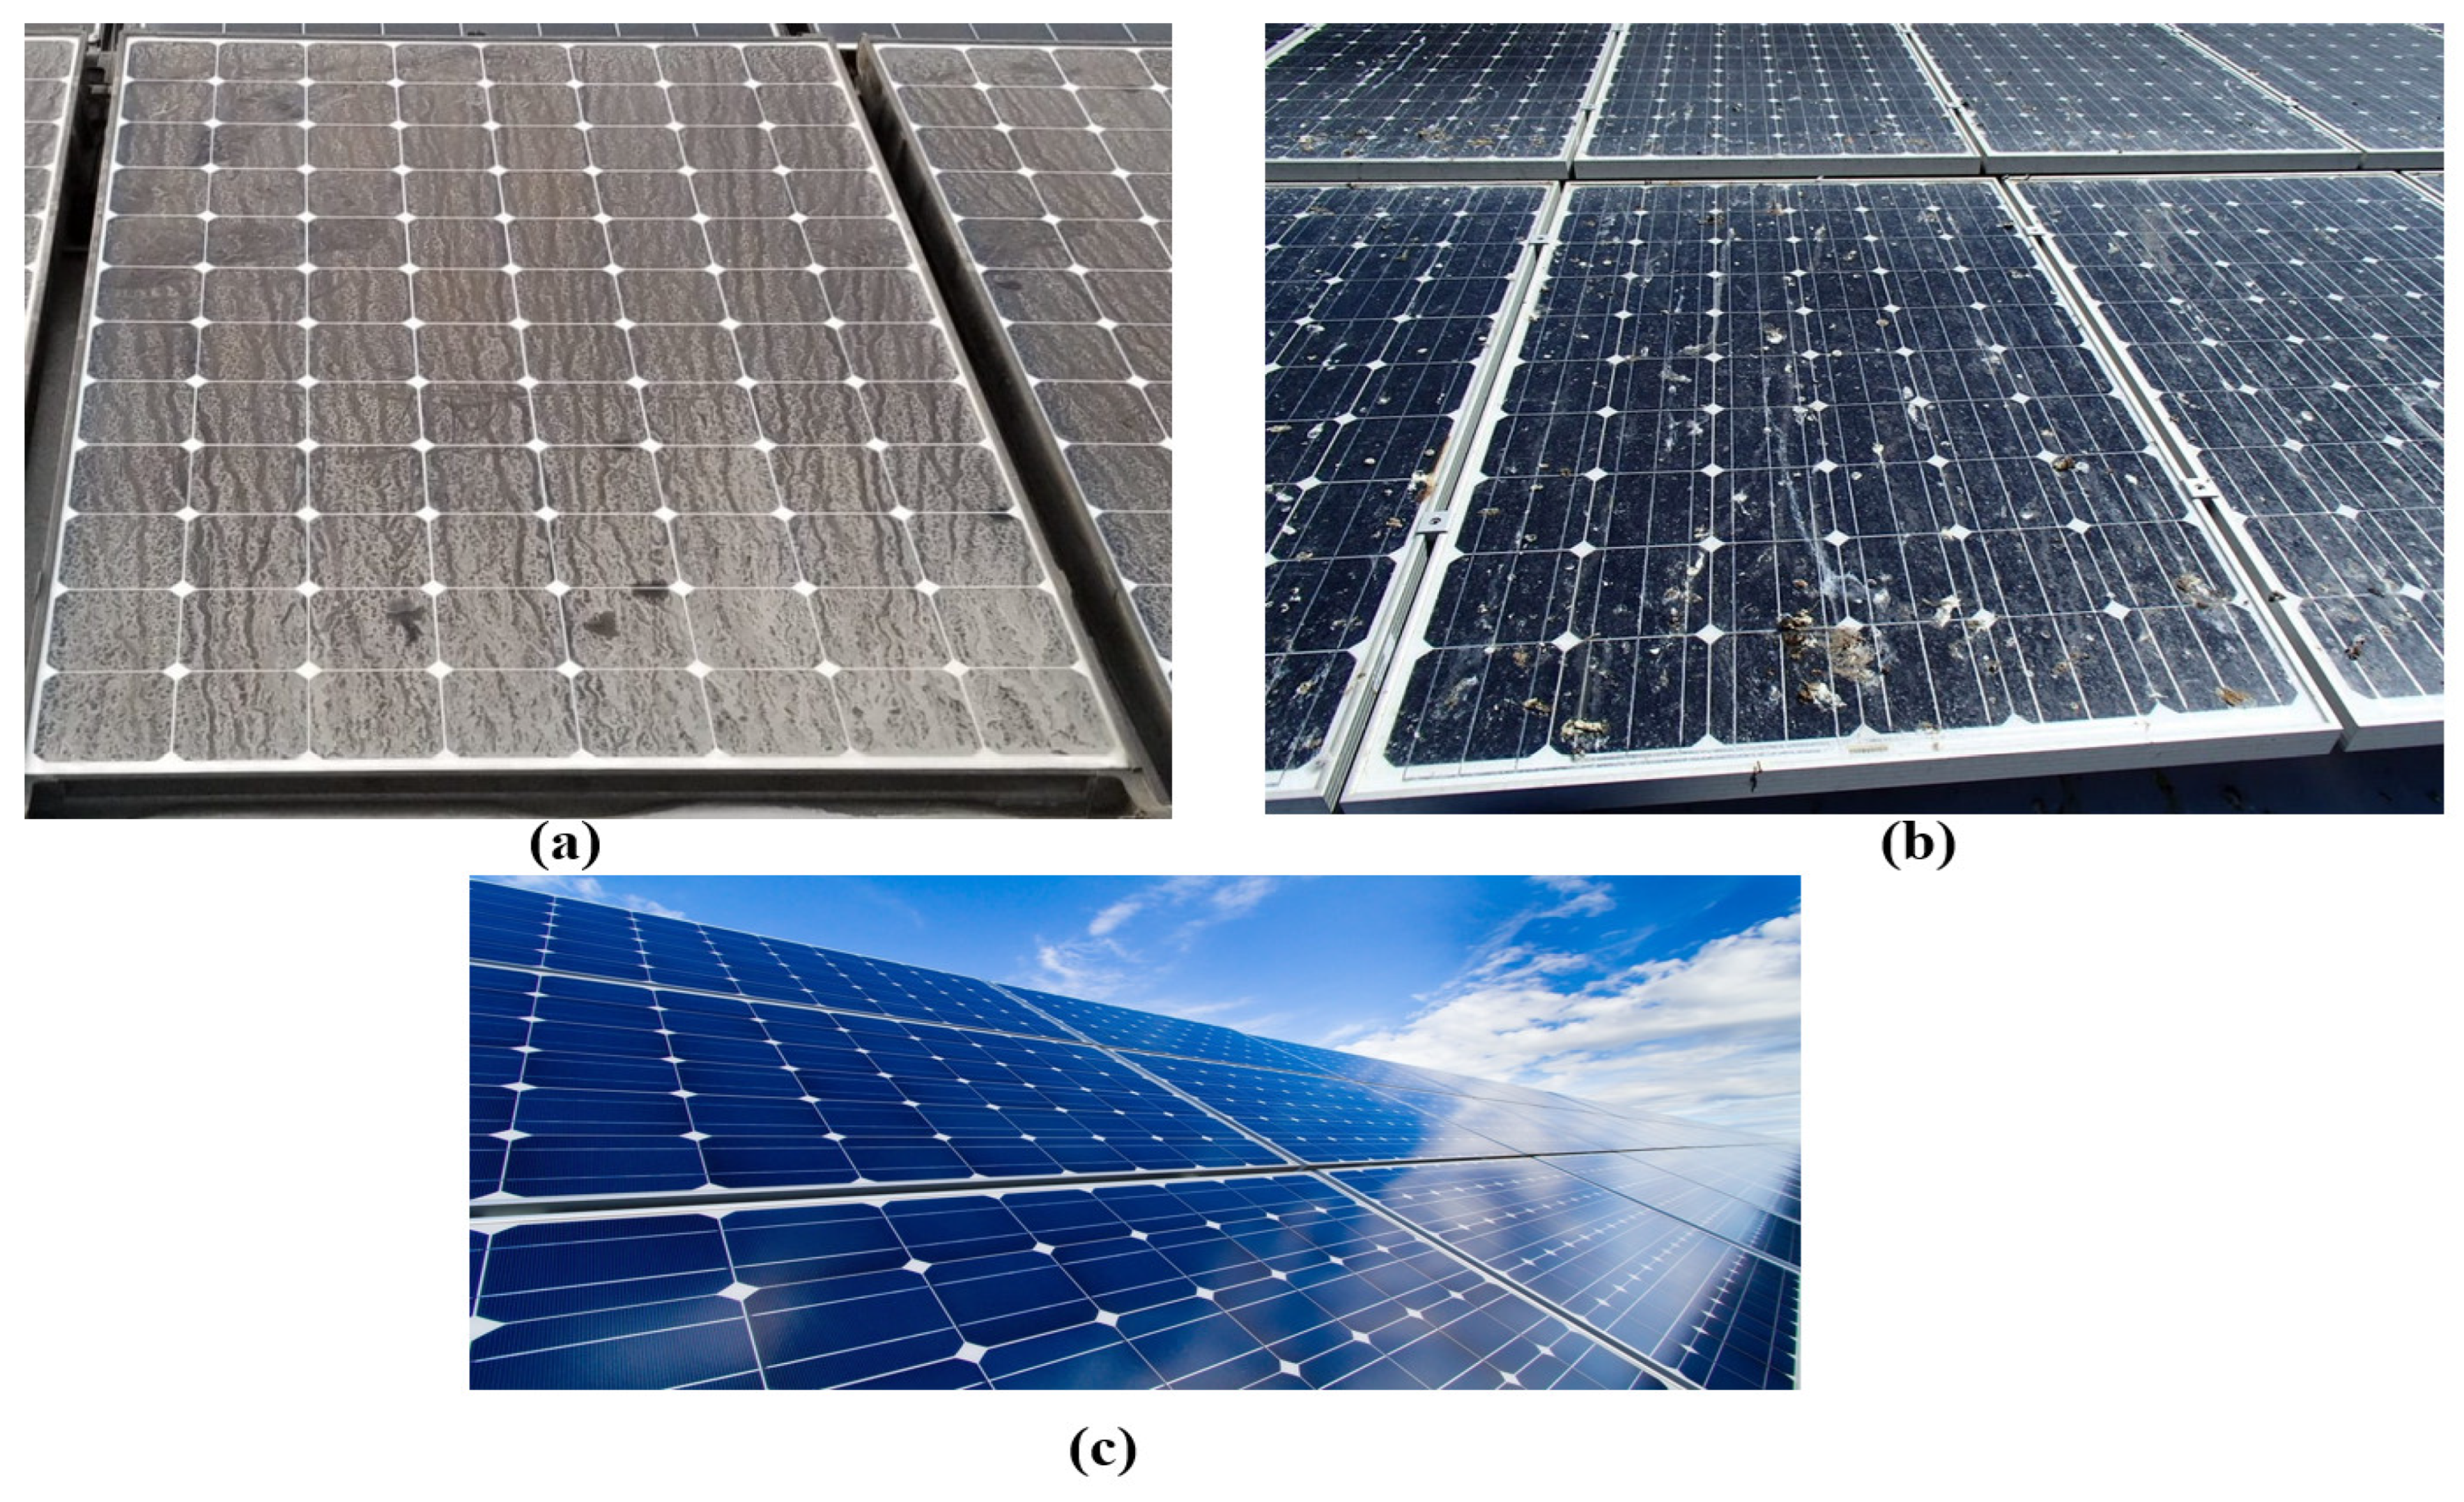
Since the focus of this study is on surface anomalies most frequently encountered in real-world PV plant operations, only three classes, namely clean, dusty, and bird-dropping-contaminated, are considered in the analysis, with examples as shown in
Figure 1. Approximately 600 images belonging to these three categories are used for model training and validation. Class selection is enforced directly within the data loader by specifying classes = [“Bird-drop”, “Clean”, “Dusty”], ensuring that only the relevant surface conditions are learned during training.
The dataset is split into 80% for training and 20% for validation. All images are resized to a resolution of 300 × 300 pixels to match the input requirements of the EfficientNet architecture. To improve model robustness under varying environmental conditions, extensive data augmentation is applied to the training set. Augmentation operations include random rotations up to 20°, width and height shifts of up to 10%, zooming up to 25%, shear transformations of 10%, horizontal flipping, and brightness variations within the range of 0.7–1.3.
Due to the noticeable class imbalance among the clean, dusty, and bird-drop categories, class weights are computed using the class_weight strategy and incorporated into the training process. This approach enhances the representation of underrepresented classes—particularly bird-drop—and mitigates bias during model optimization.
Inspection of sample images reveals that the dataset captures both large-area contamination (dusty) and localized surface anomalies (bird droppings). This diversity contributes to the model’s ability to discriminate different soiling types likely to be encountered under real operating conditions.
3.2. Model Architecture
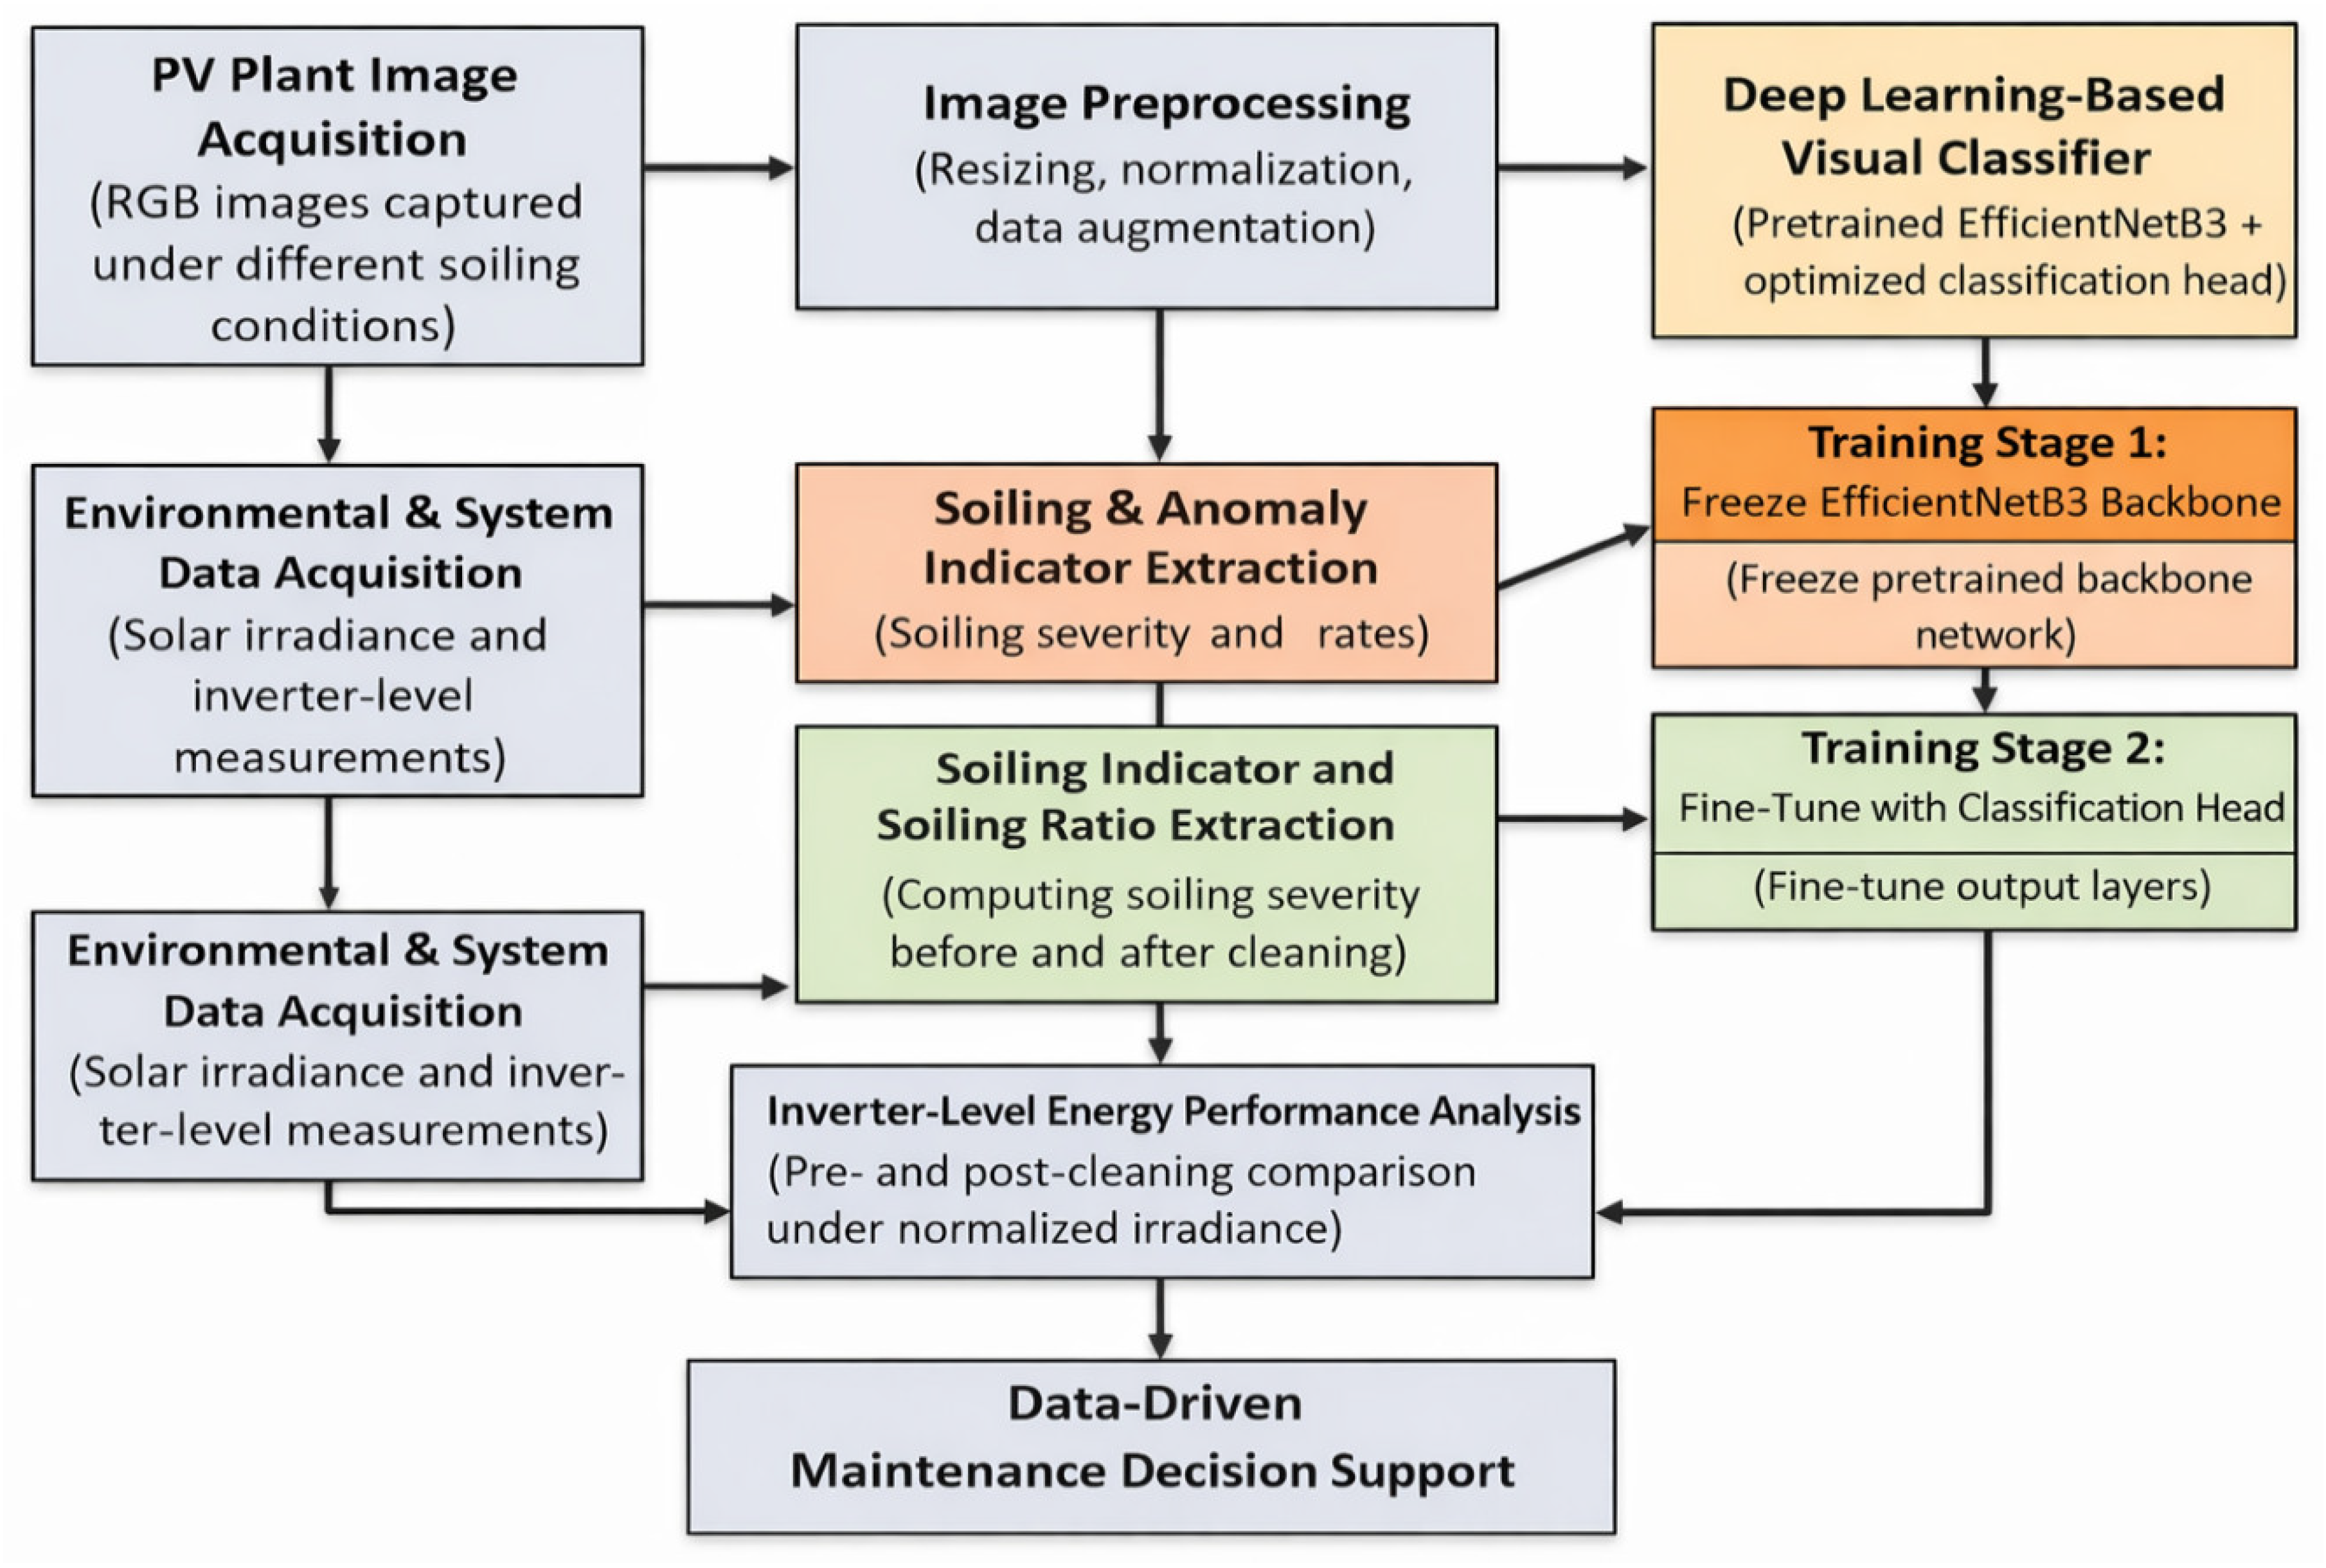
To accurately classify the three targeted PV panel surface conditions—clean, dusty, and bird-drop—a transfer learning-based architecture built upon EfficientNetB3 is adopted in this paper. The proposed model constitutes the visual core of the integrated framework illustrated in
Figure 2, which explicitly highlights the two-stage optimization strategy and its coupling with inverter-level energy performance analysis.
As shown in
Figure 2, the deep learning-based visual classification module is structured into two sequential training stages. The backbone of the model is a pretrained EfficientNetB3 network, originally trained on the ImageNet dataset, which serves as a robust feature extractor for PV panel imagery. This backbone is followed by a lightweight and task-specific classification head designed to balance accuracy and computational efficiency.
In Stage 1 (Frozen Backbone Training), the EfficientNetB3 backbone is fully frozen to preserve its generic visual representations, and only the newly introduced classification head is optimized. The classification head consists of a Global Average Pooling layer, two dropout layers with rates of 0.4 and 0.3 to mitigate overfitting, and a fully connected layer with 512 neurons using ReLU activation. A final softmax layer outputs class probabilities corresponding to the three surface condition categories. This stage enables stable learning of high-level discriminative features while preventing overfitting and excessive parameter updates.
In Stage 2 (Fine-Tuning of High-Level Features), the last 40 layers of the EfficientNetB3 backbone are unfrozen to allow the adaptive refinement of higher-level feature representations. During this phase, the learning rate is reduced, and training is continued to better capture class-specific visual patterns associated with real-world PV panel conditions, such as varying illumination, heterogeneous dust distributions, and localized bird-dropping contamination. This fine-tuning stage enhances the model’s sensitivity to subtle surface variations while maintaining generalization capability.
As depicted in
Figure 2, the outputs of the two-stage visual classification module are not treated as standalone predictions. Instead, the classified surface conditions are forwarded to a downstream analysis pipeline that includes soiling indicator extraction and inverter-level energy performance assessment. This integrated design ensures that visual classification results are directly interpretable in terms of operational impact, enabling data-driven evaluation of performance degradation and recovery before and after maintenance actions.
The performance of the proposed model is evaluated using standard classification metrics used in similar research, including accuracy, precision, recall, and F1-score [
37], defined by
where
,
,
, and
denote, respectively, the true positive, true negative, false positive, and false negative values.
3.3. Field Solar Energy Data Collection
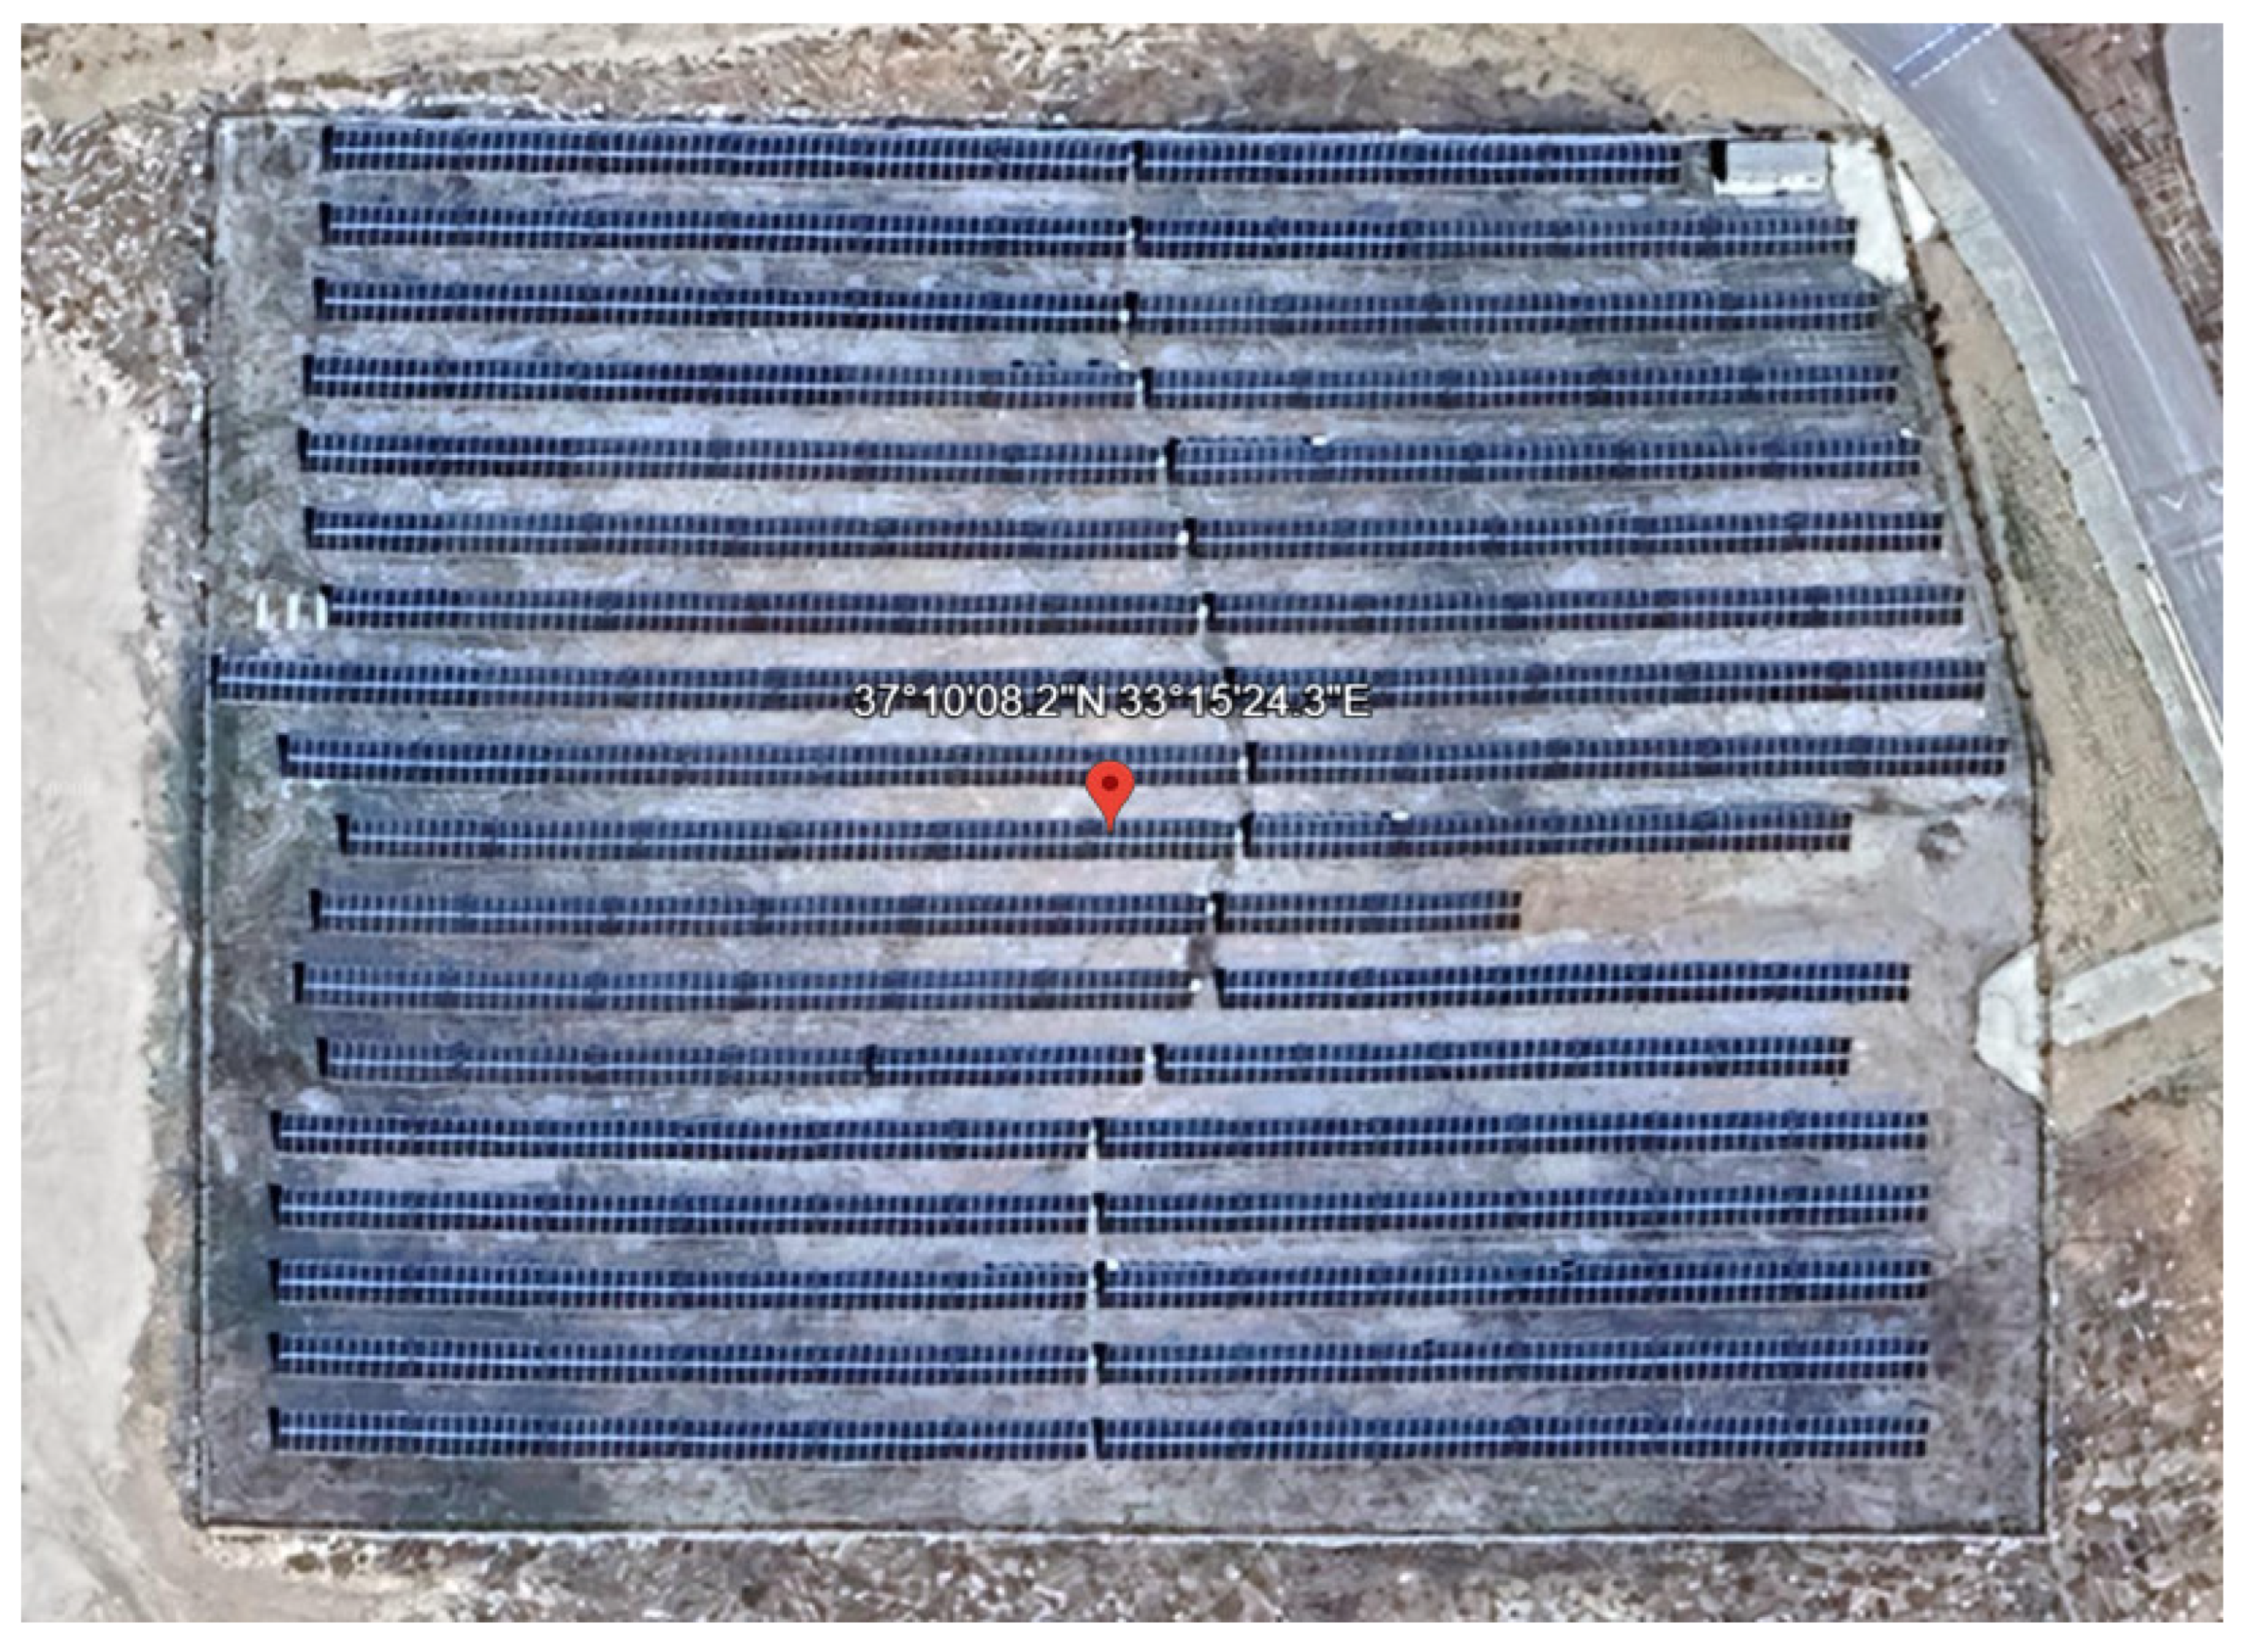
In the second phase of the study, the trained deep learning model is evaluated not only on the Kaggle dataset but also using images collected from an operational photovoltaic power plant in order to assess its real-world applicability. The field study is conducted at a grid-connected PV power plant with a total installed capacity of 1 MW, located within the Yunus Emre Campus of Karamanoglu Mehmetbey University in Karaman, Türkiye, where the research was conducted, as illustrated in
Figure 3. The analyzed section of the plant is geographically located at 37.16894099° N latitude and 33.25680904° E longitude.
The aerial view presented in
Figure 3 visualizes the spatial layout of the PV plant, including panel array configurations, inverter groupings, and maintenance access paths. This spatial context enables panel-level surface condition classifications to be interpreted at the plant scale and supports the integration of visual diagnostics with inverter-level energy performance analysis.
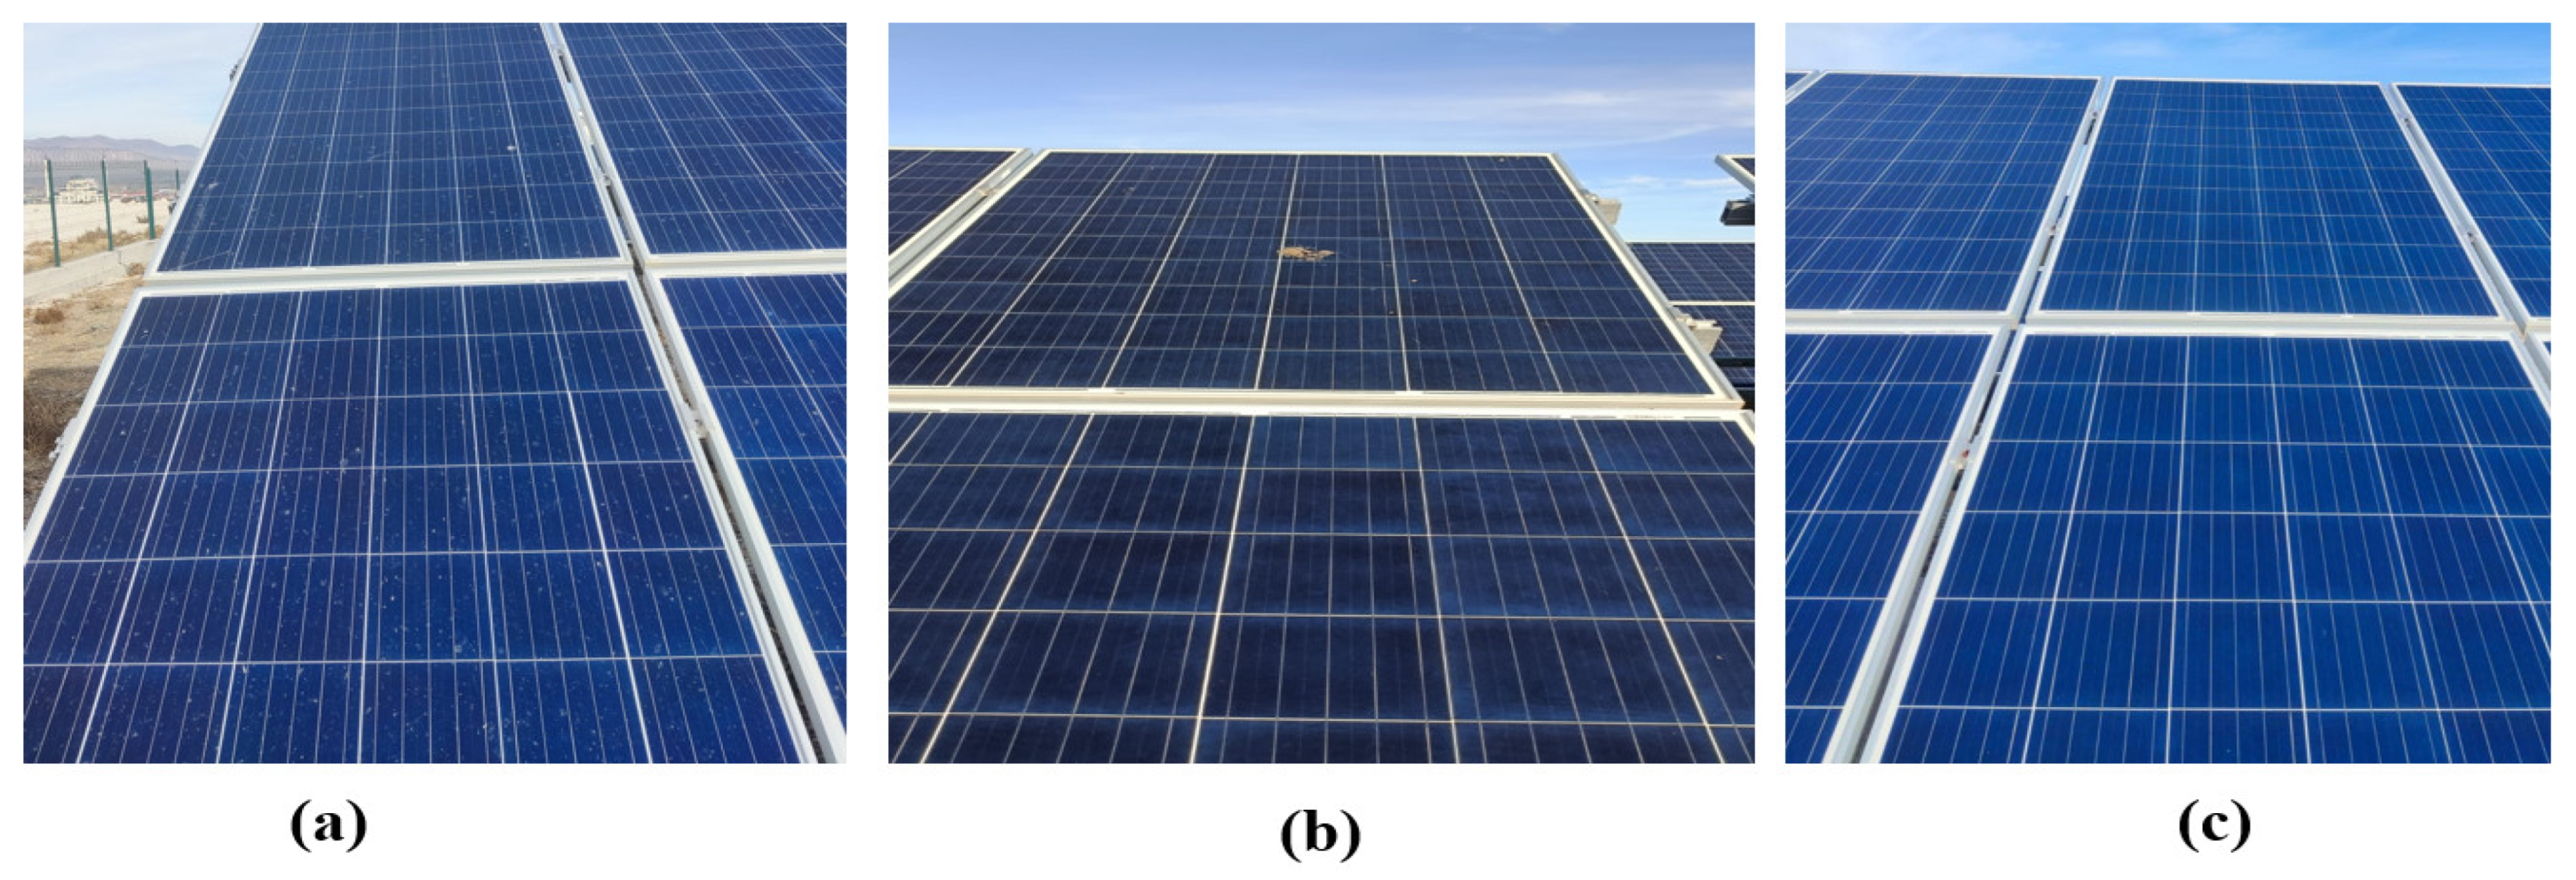
Panel images were manually captured on 28 November 2025 between 10:00 and 12:00 under actual operating conditions. This data has been used for real-world testing and validation in this study. It should be noted that the proposed framework is designed to operate using standard RGB images that can be captured with widely available devices such as smartphone cameras up to more advanced drone-based systems. The choice of standard RGB images enables image capturing without requiring additional very expensive hardware and enhances practical applicability and enables scalable deployment across different PV installations. During data acquisition, particular attention is paid to minimizing shadow effects, excessive viewpoint variations, and localized surface reflections in order to reduce external factors that could adversely influence classification performance.
The collected images undergo standard preprocessing steps and are categorized into clean, dusty, and bird-drop classes in accordance with the labels used during model training. The real-world test set consists of 68 images, including 21 clean, 23 dusty, and 24 bird-drop samples. This dataset is entirely independent of the Kaggle dataset and is therefore used as an external test set to objectively evaluate model generalization under field conditions. Representative examples of the three surface condition classes observed in the PV plant are shown in
Figure 4, illustrating both widespread soiling patterns and localized contamination effects.
The trained model generates surface condition predictions for each image in the real-world test set, and the classification results are validated through direct on-site visual inspections. This validation step ensures that the predicted labels are consistent with the actual panel surface conditions observed in the field, providing a reliable assessment of model performance beyond controlled datasets.
3.4. Energy–Water–Sustainability-Aware Cleaning Decision Framework
To move beyond anomaly detection toward operational decision-making, this study introduces an energy–water–sustainability-aware cleaning decision framework. The proposed framework integrates vision-based soiling classification with energy and water considerations to determine whether panel cleaning is energetically and environmentally justified, particularly in water-stressed regions.
In arid and semi-arid climates, photovoltaic (PV) panel cleaning decisions cannot be evaluated solely based on potential energy gains. Water scarcity, groundwater depletion, and the energy required for water extraction introduce additional environmental and operational constraints. Therefore, rational maintenance planning requires a joint evaluation of recoverable energy, water consumption, and auxiliary energy expenditures associated with cleaning operations.
To quantitatively describe the contamination level of the PV array, a soiling ratio indicator is defined based on the panel-level classification results obtained from the vision-based deep learning model. The soiling ratio (SR) represents the proportion of panels affected by surface contamination relative to the total number of inspected panels. It is calculated as
where
denotes the soiling ratio,
represents the number of panels classified as dusty,
denotes the number of panels contaminated with bird droppings and
corresponds to the total number of analyzed panels.
provides a simple yet effective quantitative measure of surface contamination across the PV array and enables the integration of image-based classification outputs with inverter-level energy performance analysis.
The proposed framework evaluates the energetic feasibility of cleaning actions using an energy balance criterion. Let the following be true:
denotes additional auxiliary energy demands (kWh), including water pressurization, distribution, and cleaning equipment operation.
The total energy cost associated with a cleaning operation is expressed as
Based on this formulation, a sustainability-aware cleaning decision is defined using the following condition:
Only when the expected recoverable energy exceeds the total energy required for water extraction and cleaning is panel washing considered energetically justified. If this condition is not satisfied, cleaning is deferred to avoid unnecessary energy consumption and water usage.
Within the proposed framework, the estimation of is not performed heuristically. Instead, it is derived directly from the output of the deep learning-based visual classification model. The image-based soiling ratio, calculated from panel-level surface condition predictions, is mapped to historical pre- and post-cleaning energy differentials obtained from inverter-level measurements. This data-driven linkage enables a physically interpretable and operationally meaningful estimation of recoverable energy.
It is to be noted that (4) could have been modified to be more complex by considering other factors such as labor costs, water resource costs, and climate uncertainty; however, it has been specifically chosen to only consider water usage and the energy required for groundwater extraction, enabling a sustainability-aware evaluation. At the same time, the model is intentionally kept simple and interpretable to ensure practical applicability in real PV plant operations.
In this study, the relationship between and the expected is established using a data-driven approach based on historical inverter measurements before and after cleaning operations. First, the energy production difference measured over a given time interval between pre-cleaning and post-cleaning conditions () is defined as a reference energy gain under comparable irradiance and environmental conditions.
Subsequently, the instantaneous
, obtained from the image-based classification model, is proportionally related to this reference energy difference. Accordingly,
can be approximately expressed by
where
represents the normalized energy gain derived from historical cleaning operations. It should be noted that the linear proportionality assumption between
and
in (5) is adopted as a simplified and first-order approximation. This formulation is intentionally selected to ensure interpretability and direct applicability within operational decision-making contexts, especially under limited data availability. In practice, this relationship may exhibit nonlinear characteristics depending on other factors considered such as irradiance variability, spatial distribution of soiling, and panel-specific conditions, etc.
This approach enables the integration of visually detected soiling levels into the model in a direct and physically interpretable manner in terms of energy performance. Consequently, the decision-making mechanism is not solely based on classification outputs but is supported by a quantitative energy estimation grounded in real-world operational data. In this context, the proposed framework represents a methodological contribution by systematically converting image-based classification outputs into physically interpretable energy estimates through a data-driven mapping mechanism. It should be emphasized that the proposed decision-making model is intentionally designed to remain simple and interpretable, ensuring practical applicability. However, it should be considered within its defined scope, as the model does not incorporate all possible operational variables such as labor costs, water pricing, and environmental uncertainties. Therefore, the proposed formulation should not be interpreted as a fully comprehensive decision model but rather as a baseline and extensible framework for condition-based cleaning decisions. At the same time, the framework is inherently flexible and can be extended to incorporate additional parameters such as labor costs, water pricing, and environmental uncertainties, depending on the specific operational context. This design ensures that the model is not overly simplified but rather intentionally structured to balance interpretability and practical applicability, while remaining extensible to incorporate additional variables when required.
4. Results and Performance Analysis
This section presents a comprehensive evaluation of the proposed EfficientNetB3-based framework using both the publicly available Kaggle dataset and independent data collected under real-world operating conditions. The learning behavior of the two-stage training strategy is first analyzed through accuracy and loss curves, followed by a quantitative assessment of classification performance using precision, recall, F1-score, and confusion matrix metrics. Subsequently, the visual classification results are integrated with inverter-level energy production data to quantify the impact of PV panel surface conditions on actual system performance. Finally, the results are extended toward an energy–water–sustainability-aware cleaning decision perspective, highlighting the operational relevance of the proposed framework for maintenance planning.
4.1. Model Training and Test Performance
This subsection examines the learning behavior and classification performance of the proposed deep learning architecture under the two-stage training strategy applied to the Kaggle dataset. Firstly, EfficientNetB3-based model, ResNet50, and MobileNetV2, was conducted to further assess model robustness and selection. Then, Accuracy and loss curves corresponding to the frozen-backbone training stage of best method and the fine-tuning stage of best method are presented, together with class-based performance metrics obtained from an independent test set, to quantitatively evaluate the model’s generalization capability.
The classification performance of the evaluated models is summarized in
Table 2 in terms of precision, recall, and F1-score for each class. Prior to obtaining these results, a consistent experimental setup was established to ensure a fair comparison among the considered architectures. In this context, k-fold cross-validation (k = 5) was applied on the Kaggle dataset to evaluate model robustness and reduce the impact of data partitioning bias. For the ResNet50-based model, a transfer learning strategy was employed. In Stage 1, the pretrained backbone was frozen and only the top layers were trained for 6 epochs. In Stage 2, the last 30 layers were unfrozen and fine-tuned. The model was trained using categorical cross-entropy loss with class weighting to address class imbalance, along with moderate data augmentation. Similarly, the MobileNetV2 model was initialized with pretrained weights and trained using a two-stage approach. In Stage 1, the top layers were trained, followed by fine-tuning of the last 30 layers in Stage 2. The training process incorporated rescaling and moderate data augmentation, with the Adam optimizer and categorical cross-entropy loss function.
Based on these results, summarized in
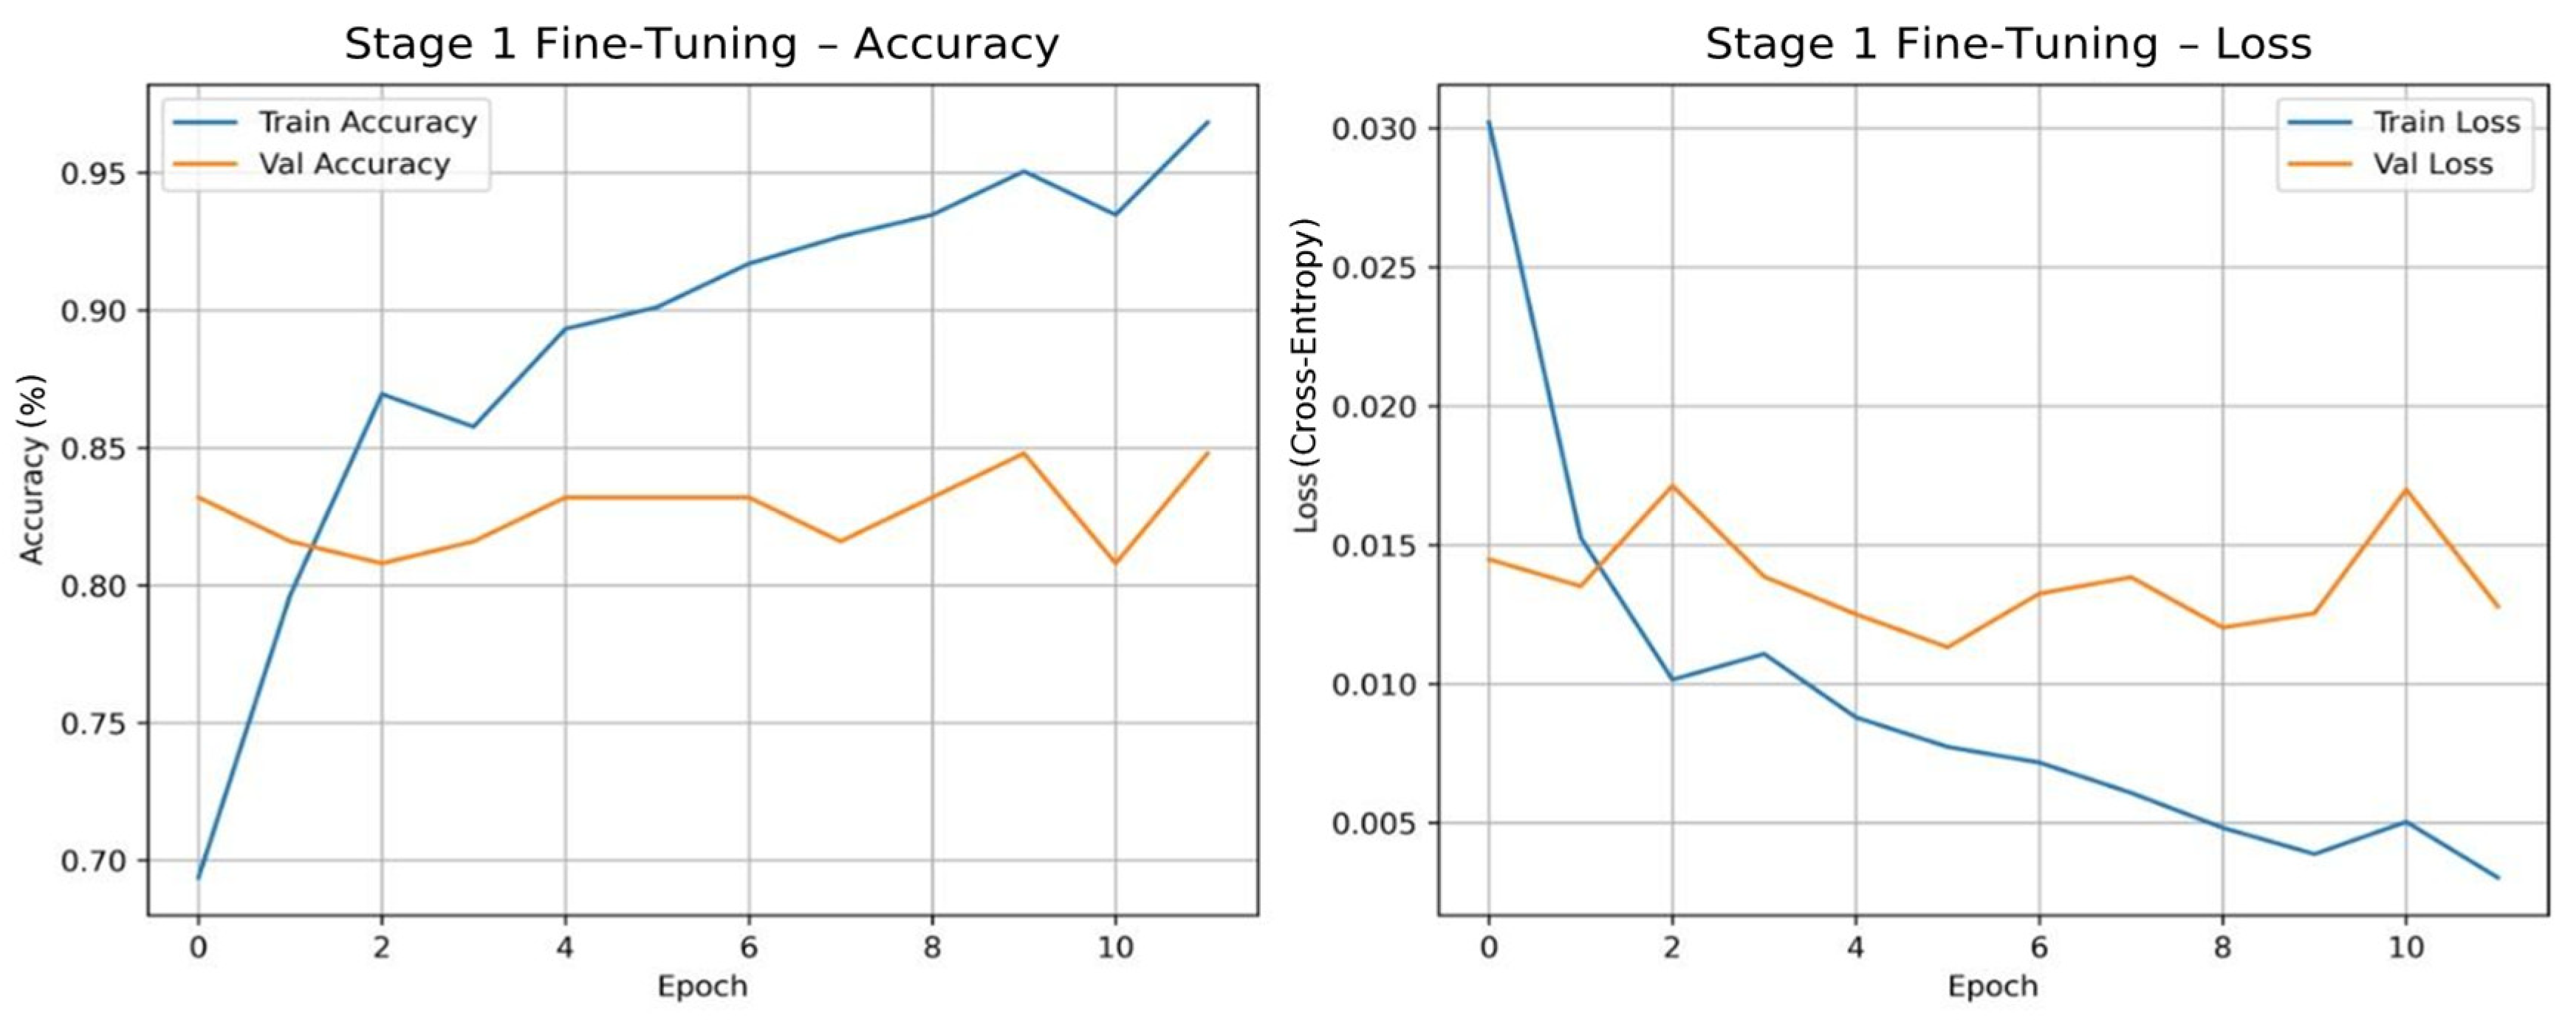
Table 2, EfficientNetB3 demonstrates more balanced and consistent performance across all classes compared to alternative architectures, and therefore it has been selected as the backbone model for the remainder of the study. This systematic comparison enables the performance advantages of the selected model to be clearly verified and improves the overall persuasiveness of the obtained results. The training and validation accuracy and loss curves obtained during the first training stage—where the EfficientNetB3 backbone is frozen and only the classification head is optimized—are shown in
Figure 5.
During this stage, training accuracy increases steadily from approximately 59% in the initial epoch to around 83%, while validation accuracy remains relatively stable within the range of 72–82%, exhibiting only minor fluctuations in early epochs. The consistent decrease observed in both training and validation loss curves indicates that the model successfully learns fundamental discriminative features without entering an overfitting regime.
These results demonstrate that the model effectively captures the core semantic and textural characteristics of PV panel surfaces and provides a robust initialization for the subsequent fine-tuning stage.
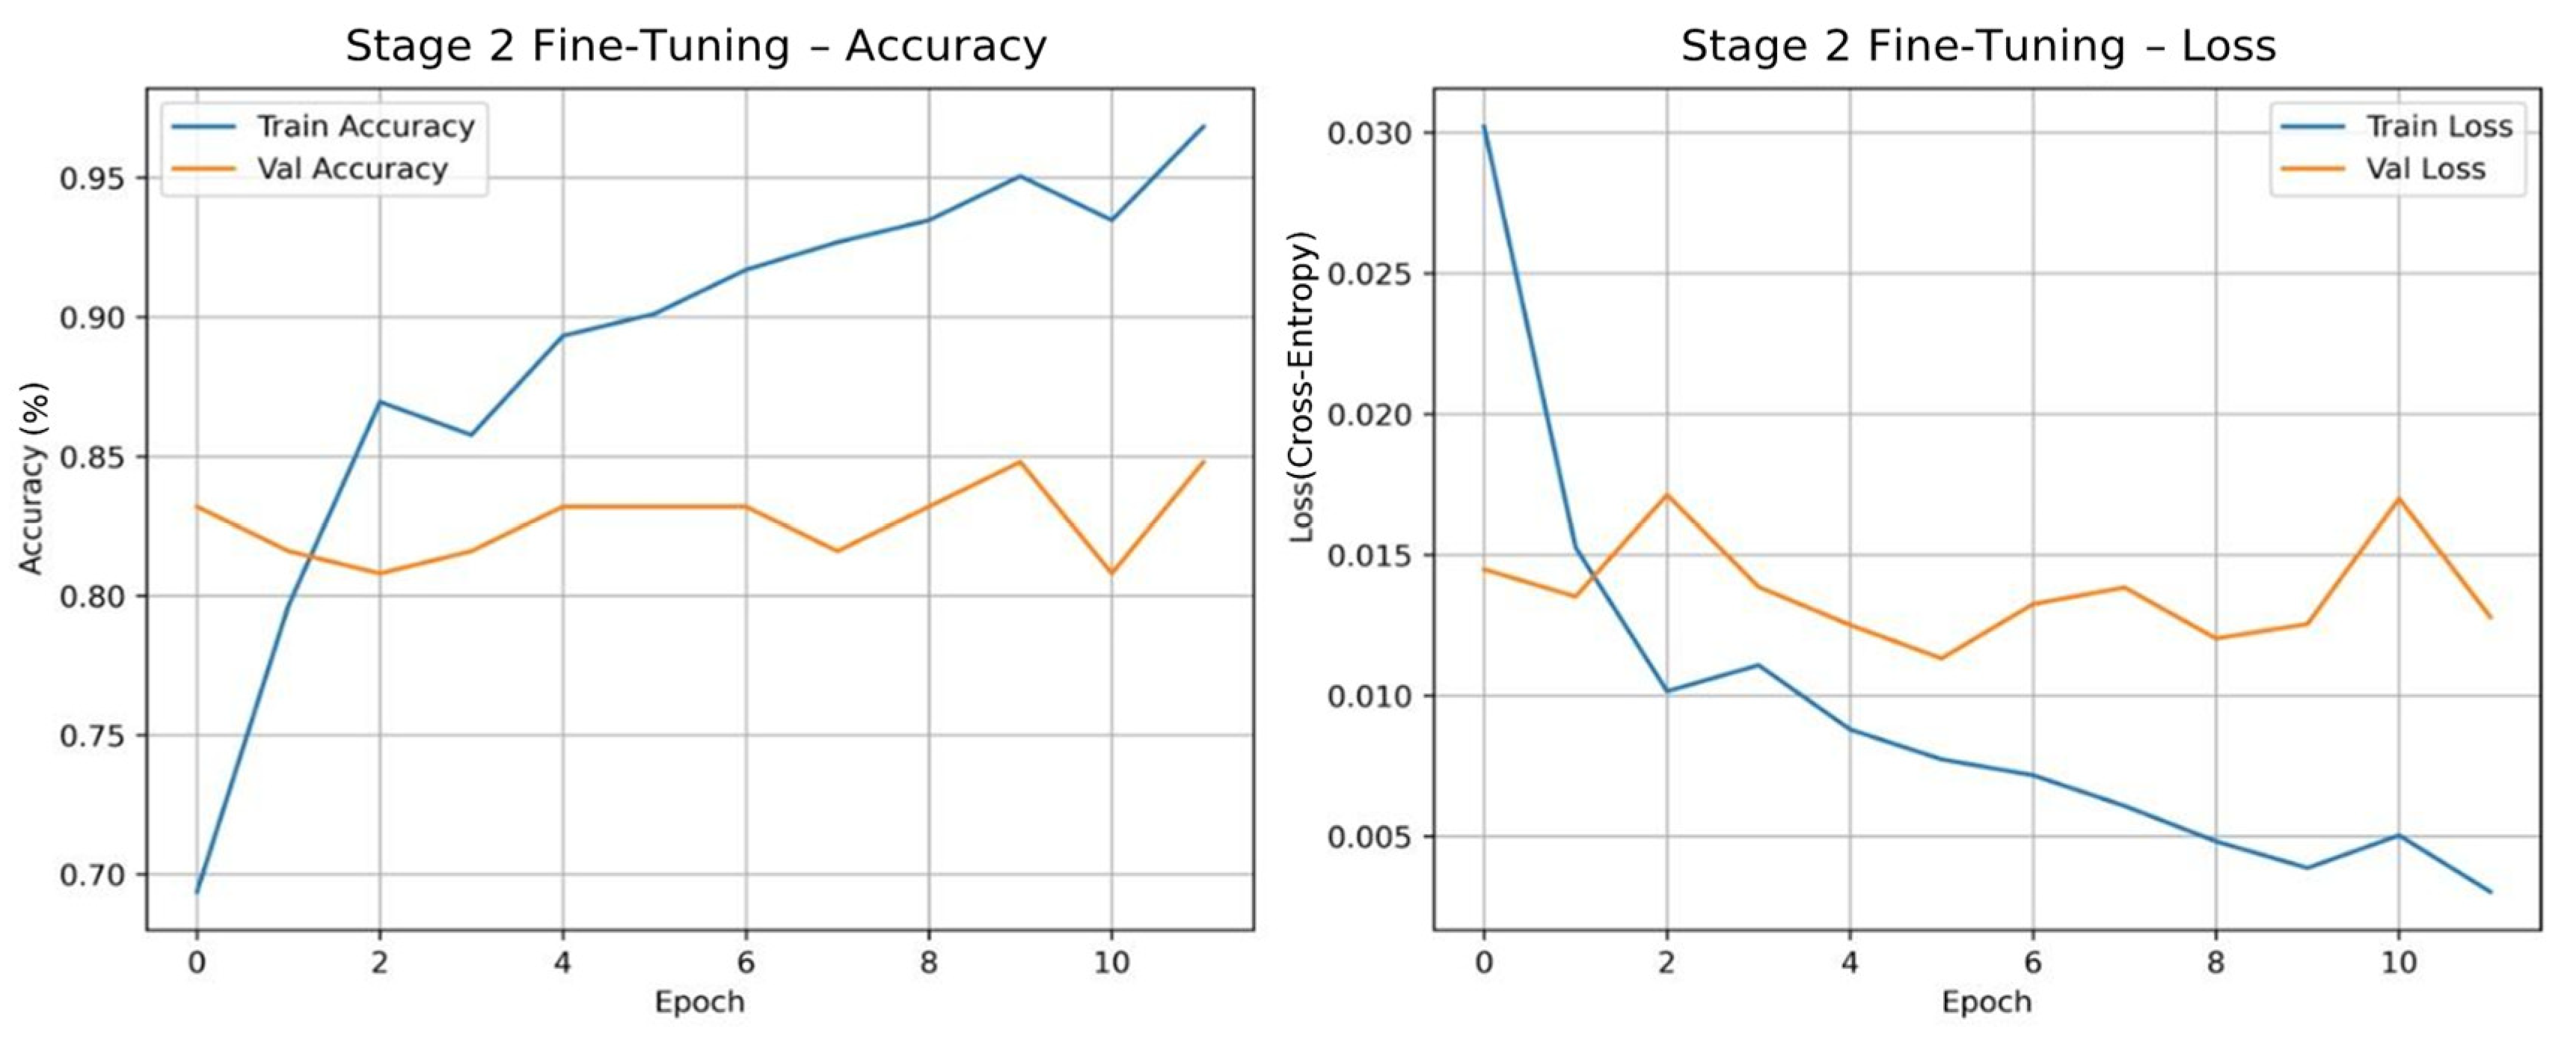
In the second stage, the last 40 layers of the EfficientNetB3 backbone are unfrozen to enable the learning of deeper and more class-specific representations. The corresponding accuracy and loss curves are presented in
Figure 6.
Following fine-tuning, training accuracy reaches approximately 93%, while validation accuracy stabilizes within the range of 85–87%, despite visual similarities between certain surface condition classes. Training loss decreases almost linearly to approximately 0.005, and the validation loss closely follows this trend.
It is to be noted that the relatively limited dataset size in this study and the class imbalance may introduce a risk of overfitting. To mitigate this, several strategies were employed, including data augmentation, class weighting, transfer learning, and a two-stage training approach. The proximity of training and validation curves in this study indicates that the model generalizes well across dataset variations and does not exhibit a pronounced overfitting tendency. This observation, together with consistent performance on an independent real-world test set, suggests that overfitting is effectively mitigated despite the relatively limited dataset size.
4.2. Deployment of the Trained Model in a Real PV Power Plant
Section 4.2 focuses on the application of the trained and validated model to panel images collected from an operational solar power plant. The behavior of the image-based classification approach under field conditions is analyzed to assess its practical applicability for panel-level surface condition detection.
These results demonstrate that potential classification errors are limited and do not significantly affect the overall decision-making process. The use of aggregated indicators such as the soiling ratio further reduces the impact of individual misclassifications, thereby enhancing the robustness and reliability of the proposed framework under real-world operating conditions.
The proposed vision-based PV panel surface condition classification model is deployed at a grid-connected solar power plant with a total installed capacity of 1 MW, located within the Yunus Emre Campus of Karamanoglu Mehmetbey University in Karaman, Türkiye, as illustrated in
Figure 3.
The spatial layout of the plant, including panel array configurations, inverter groupings, and maintenance access paths, is visualized using aerial imagery. This spatial context enables panel-level classification results to be interpreted at the plant scale and facilitates operational assessment.
The trained model is evaluated using an independent real-world test set consisting of three classes: clean, dusty, and bird-drop. Despite the inherently imbalanced class distribution typical of field conditions, the model demonstrates high and consistent performance. Class-wise performance metrics are summarized in
Table 3.
The obtained F1-scores confirm that the model reliably distinguishes both widespread surface contamination and localized, high-contrast anomalies such as bird droppings.
The confusion matrix presented in
Table 4 provides further insight into intra- and inter-class discrimination performance.
All clean samples are correctly classified, demonstrating that the model effectively learns the characteristic textural integrity of uncontaminated panel surfaces. For the bird-drop class, 23 out of 24 samples are correctly identified, highlighting strong sensitivity to localized anomalies. Misclassifications observed in the dusty class are primarily attributed to heterogeneous or low-density dust patterns exhibiting visual similarities to bird droppings. This error pattern is physically interpretable and indicates consistent decision behavior.
4.3. Linking Visual Classification Results with Energy Performance
In this subsection, surface condition classifications generated by the trained model for PV panel images are linked with inverter-associated energy production data to quantify the operational impact of soiling. The analysis focuses on the inverter-connected PV group (120 panels, ~270 Wp) to ensure that the visual outputs and the energy measurements refer to the same physical subsystem.
To reduce uncertainty due to changing atmospheric conditions, the comparison is performed under normalized irradiance geometry by selecting measurement windows in which the shortwave radiation/global tilted irradiance ratio remains constant.
Table 5 summarizes the environmental conditions for the selected pre- and post-cleaning periods and confirms that both time windows exhibit an identical normalized ratio of 0.90, improving the comparability of the energy values.
Under pre-cleaning conditions, visual classification results indicate that 30 panels are classified as dusty, 18 panels as bird-drop contaminated, and 72 panels as clean, revealing substantial surface contamination across the plant. The corresponding average soiling ratio is calculated as 0.40. Following panel cleaning and subsequent natural rainfall, a marked improvement in surface conditions is observed. The average soiling ratio decreases to 0.05, quantitatively confirming a significant reduction in surface contamination.
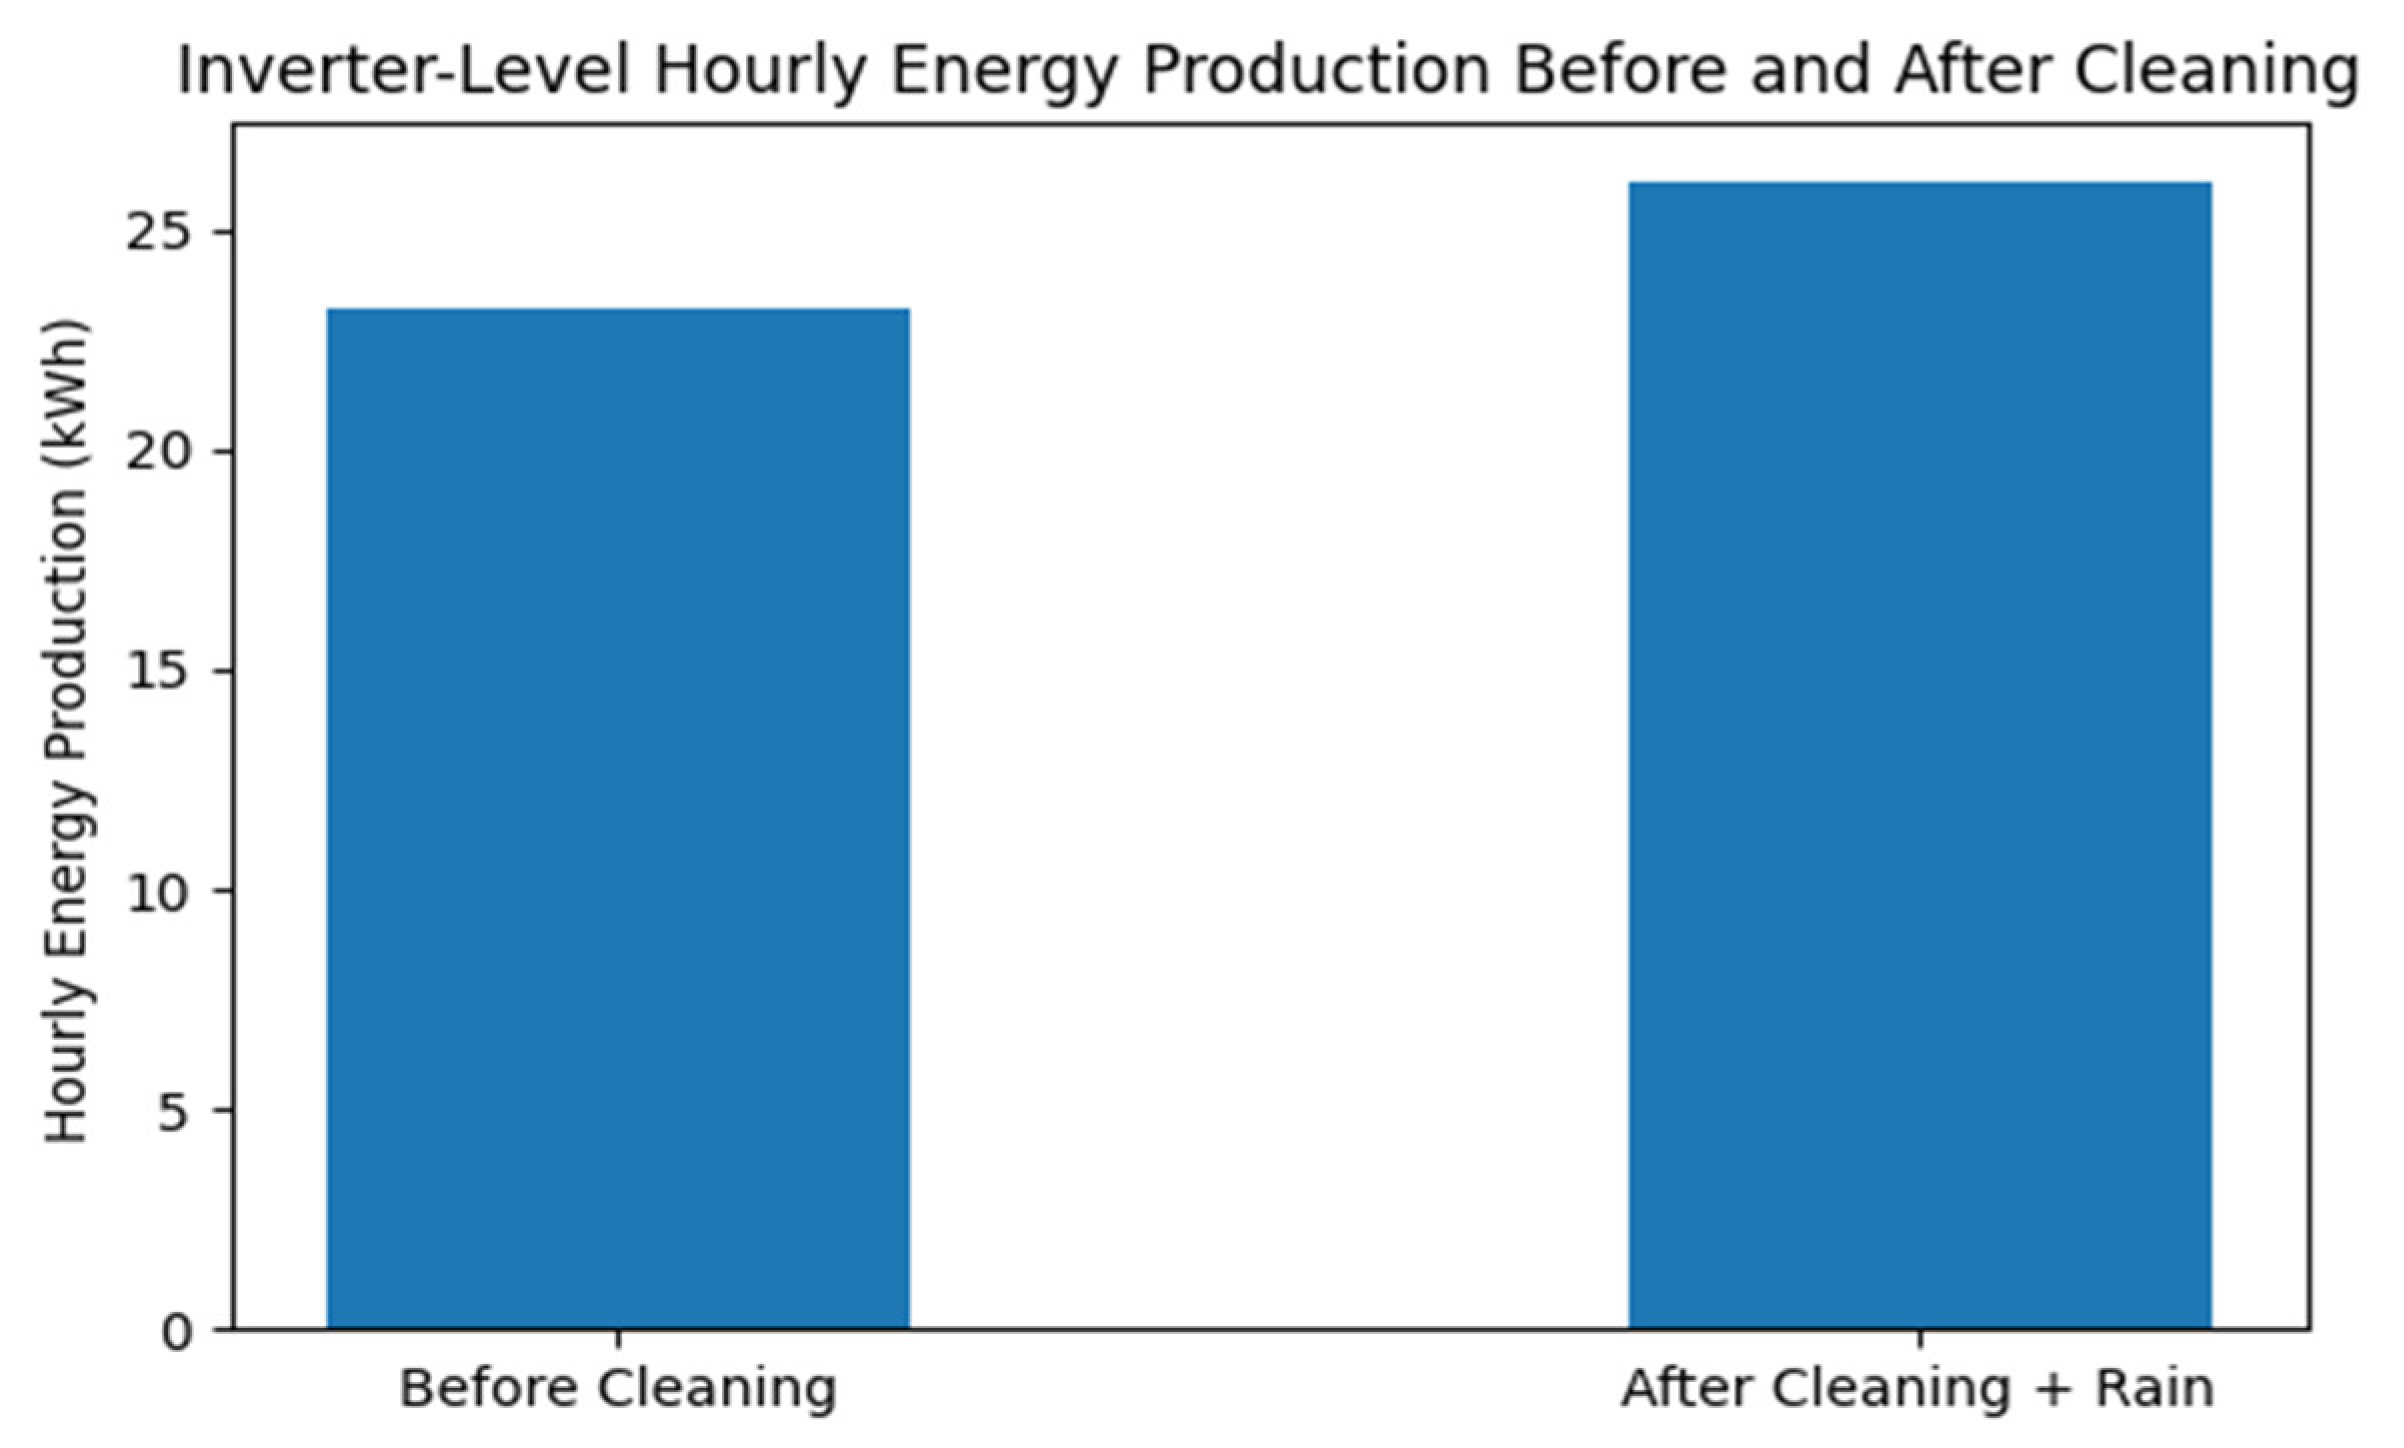
As illustrated in
Figure 7, inverter-level hourly energy production increases from approximately 23.2 kWh before cleaning to 26.1 kWh after cleaning and rainfall. Given that irradiance normalization conditions remain unchanged between the two measurement periods, the observed hourly power increase of approximately 12.5% can be confidently attributed to improved panel surface conditions rather than variations in solar input.
The concurrent reduction in the soiling ratio (0.40 → 0.05) and the increase in hourly inverter-level energy production demonstrate that the vision-based classification outputs are physically consistent with measured system performance. These results confirm that the proposed framework extends beyond image-based accuracy assessment and provides operationally meaningful insights into performance degradation and recovery associated with maintenance actions.
It should be noted that the energy comparison presented in this study is conducted under controlled and normalized irradiance conditions, ensuring direct comparability between pre- and post-cleaning measurements. This approach reduces the impact of environmental variability and allows the observed differences in energy production to be primarily attributed to surface soiling conditions. While the analysis is based on selected time intervals, it provides a physically consistent and practically relevant validation of the proposed framework.
4.4. Implementation and Evaluation of the Cleaning Decision Framework
In water-stressed regions, PV panel cleaning strategies must be evaluated not only from an energy recovery perspective but also by explicitly accounting for water consumption and the energy required for water extraction. In semi-arid locations such as Karaman, groundwater-based cleaning operations may introduce additional environmental and operational burdens if not carefully planned. Therefore, cleaning decisions should be guided by a joint assessment of recoverable electrical energy, water demand, and pumping-related energy consumption.
To formalize the cleaning decision for the investigated PV power plant, the proposed energy balance criterion is evaluated using the actual system parameters and measured performance gains.
Based on the inverter-level analysis presented in
Section 4.3, panel cleaning results in an hourly energy production increase of approximately 12.5%. For the inverter-connected PV group with a nominal capacity of 270 Wp (120 panels), this corresponds to an increase from approximately 23.2 to 26.1 kWh per hour, yielding an hourly energy gain of 2.9 kWh.
Water required for panel cleaning is supplied from an underground well with an average depth of 150 m using an electric submersible pump rated at 60 hp (≈45 kW) and a nominal flow rate of 20 m
3/h. According to commonly reported field practices, manual PV panel cleaning requires approximately 3 L of water per 1 kWp of installed capacity [
38].
Based on this criterion, the total water demand for cleaning the analyzed inverter-connected PV group (120 panels, 270 Wp each; 32.4 kWp total) is calculated as 32.4 kWp × 3 L/kWp = 97.2 L (≈0.097 m3). Given the pump flow rate, the required water volume can be extracted within 0.097 m3/20 m3/h ≈ 0.0049 h (≈17.5 s). During this pumping period, the electrical energy consumed by the pump is 45 kW × 0.0049 h ≈ 0.22 kWh.
In the present study, is calculated based on the actual field setup, which consists of a pump-driven manual cleaning system. Under these conditions, auxiliary energy components such as pressurization losses and manual operation are relatively small compared to pumping energy and are therefore considered negligible. However, the proposed framework is inherently flexible, and for other cleaning configurations such as automated or robotic systems, additional energy components can be explicitly incorporated into as system-specific parameters. In contrast, the measured and extrapolated energy recovery associated with improved panel surface conditions corresponds to an hourly energy gain substantially exceeding this value at the plant scale.
More importantly, this quantitative evaluation demonstrates how the proposed vision-based framework enables condition-based cleaning decisions. Rather than relying on fixed schedules, cleaning actions are triggered only when image-derived soiling levels indicate that the expected energy recovery will outweigh the energetic cost of water extraction. This approach reduces unnecessary groundwater use, limits auxiliary energy consumption, and supports sustainable operation of PV power plants in water-scarce regions.
5. Discussion and Conclusions
This study proposed a vision-based deep learning framework for automatically detecting PV panel surface anomalies—specifically dust accumulation and bird droppings—and validating these detections using inverter-level energy production data obtained under real operating conditions. The proposed framework is intended as a decision-support tool rather than a predictive performance model, emphasizing interpretability, operational feasibility, and sustainability considerations over algorithmic complexity. The results showed that the EfficientNetB3-based approach achieves high classification accuracy while providing actionable insights for maintenance planning in utility-scale PV power plants. The two-stage training strategy enabled stable and effective feature learning. While the frozen-backbone stage captures fundamental textural and semantic characteristics of PV panels, the fine-tuning stage enhances class-specific representations. The close alignment of training and validation curves and the strong performance on an independent real-world test set confirm the model’s robustness and generalization capability, particularly in distinguishing both widespread soiling and localized anomalies. The consistent relationship between the reduction in image-derived soiling ratio and the increase in measured energy output highlights the physical interpretability of the proposed framework. These findings demonstrate that the system functions not only as an image classification tool but also as an operational decision-support mechanism capable of tracking performance degradation and recovery.
A major contribution of this work is the validation of the proposed framework at an operational 1 MW grid-connected PV power plant. The field deployment demonstrates that the model performs reliably not only on curated datasets but also under real environmental and operational conditions. The integration of panel-level classification with aerial plant visualization enables interpretation of visual diagnostics at the plant scale, increasing practical relevance.
Unlike most image-centric studies, this work directly links visual classification outputs with inverter-level energy performance. By selecting measurement periods with identical normalized irradiance conditions, external effects were minimized. Under these conditions, panel cleaning resulted in an approximately 12.5% increase in hourly energy production for the analyzed inverter-connected PV group (120 panels, ~270 Wp), increasing output from 23.2 to 26.1 kWh. This confirms that the observed energy gain is primarily driven by improved panel surface conditions.
Compared to existing studies, the proposed framework offers several distinct advantages. Unlike conventional approaches that rely solely on image-based detection or indirect performance indicators, this study has established a direct and quantitative link between visual soiling conditions and inverter-level energy production. In addition, the integration of real-field validation, condition-based decision-making, and sustainability-aware evaluation—through the inclusion of water consumption and pumping energy—distinguishes this work from prior studies that focus primarily on detection accuracy. Furthermore, the proposed framework has introduced a structured mapping between visual perception and operational decision-making by transforming image-based classification outputs into physically interpretable energy indicators. This explicit linking of perception, energy modeling, and decision-making within a unified and data-driven structure is another distinguished methodological feature of the proposed approach from conventional system integration studies. These aspects collectively provide a more comprehensive, practical, and operationally relevant solution for PV maintenance management.
By incorporating water demand and pumping energy into the evaluation process, the framework supports sustainability-aware, condition-based cleaning decisions. This is particularly important in water-scarce regions, where unnecessary cleaning can impose significant environmental and energetic costs. From an economic perspective, this sustainability-aware formulation can also provide the necessary inputs—such as recoverable energy and operational energy costs—to support cost–benefit analysis for cleaning decisions by the PV plant owner/operator. Future work can focus on integrating electricity market prices or feed-in tariffs in this decision-making platform to quantify the economic impact of condition-based cleaning strategies, in line with recent studies on energy and carbon markets.
It should be noted that the validation presented in this study is based on data collected from a single PV power plant and a limited time window. In particular, the relatively limited dataset size that has been employed in this study (i.e., approximately 600 images used for training and validation, together with one single field data) may constrain the generalization capability of the model across different environmental conditions, PV system configurations, and geographical regions. Therefore, the results should be interpreted with caution and should not be over-generalized beyond the conditions investigated.
While the results demonstrate a clear relationship between surface soiling and energy performance under theca investigated conditions, this may not fully represent the variability observed across different climatic regions, seasonal patterns, and plant configurations. Therefore, the findings should be interpreted within the scope of a case-specific analysis. Furthermore, although environmental conditions were carefully controlled through irradiance normalization, the validation is based on a single cleaning event. Therefore, the presented energy analysis should be considered as a case study in nature, reflecting the existing specific operational conditions, rather than statistically generalizable results across different time periods and PV systems. While the findings provide physically consistent and practically meaningful insights, further multi-period and long-term analyses supported by statistical methods are required to generalize the results. Therefore, future studies can incorporate multi-period and long-term analyses to further enhance the robustness and statistical reliability of the proposed approach. In addition, to improve the generalizability of the proposed framework, future studies can also incorporate multi-site and multi-season datasets, enabling a more comprehensive evaluation of the relationship between soiling conditions and energy production under diverse environmental conditions.
It is noteworthy that the potential impact of classification and energy estimation errors on the decision-making process should be carefully examined. The misclassification of panel conditions may lead to the over- or under-estimation of the soiling ratio, which in turn may influence the calculated energy gain and the resulting cleaning decision. However, the use of aggregated indicators such as the soiling ratio reduces the sensitivity of the system to individual prediction errors, as localized misclassifications tend to have a limited effect on the overall decision outcome. Therefore, the proposed framework demonstrates a reasonable level of robustness and reliability under practical operating conditions, although extreme or systematic errors may still affect decision accuracy.
In summary, this study presents a holistic and scalable framework that combines visual deep learning, real-field validation, energy performance analysis, and sustainability-aware decision criteria for PV panel maintenance. The proposed approach supports optimized cleaning schedules, reduces unnecessary resource use, and improves operational efficiency. From a scientific perspective, this study contributes to the literature by proposing an integrated and physically interpretable framework that combines deep learning-based visual analysis with inverter-level energy validation and sustainability-aware decision-making. The direct linkage established between image-derived soiling conditions and quantified energy performance represents a novel contribution beyond conventional approaches. From a societal perspective, the proposed framework supports more efficient and sustainable operation of photovoltaic power plants by reducing unnecessary cleaning, minimizing water consumption, and improving energy yield. These outcomes contribute to resource conservation, cost reduction, and the broader goal of promoting clean energy and reducing environmental impact. Beyond application-level contributions, this study also provides a methodological advancement by establishing a structured and data-driven linkage between image-based classification outputs and inverter-level energy performance. This cross-domain integration enables the transformation of visual information into operationally meaningful energy indicators, representing a shift from model-centric approaches toward system-level and decision-oriented frameworks in PV maintenance research. However, this study has certain limitations. The dataset size is relatively limited, and the field validation is conducted at a single PV power plant, which may affect the generalizability of the results. In addition, the use of manually captured images and on-site visual validation may introduce a degree of subjectivity; therefore, future work may focus on integrating automated data acquisition methods to improve objectivity and consistency. Alternative architectures such as MobileNetV2 and ResNet50 can also be investigated within the proposed framework in future studies to enhance performance and scalability under different operational conditions.
Future works can focus on long-term evaluations, different PV power plants, the integration of automated data acquisition methods such as drone-based imaging and fixed camera systems, and modeling soiling severity as a continuous variable to further enhance system effectiveness. Future studies can further investigate the relationship between soiling ratio and energy gain using nonlinear or data-driven statistical modeling approaches to improve accuracy and generalization under diverse environmental and operational conditions. Future work can also focus on sensitivity analysis and uncertainty-aware modeling to further improve the robustness of the system and cleaning decisions made against the classification or energy estimation errors.