3.1. Research Approach and Design
The objective of this study is to develop and validate the 5P–ESG Composite Index as a finance-oriented instrument for assessing firm-level sustainable-financial performance in the MSCI COLCAP universe, and to examine whether its broader 5P architecture produces classification outcomes that differ from those obtained through a conventional ESG-3 framework. In methodological terms, this objective requires not only the conceptual design of a multidimensional assessment model, but also the statistical verification of its internal coherence, structural consistency, and operational applicability in an emerging-market setting.
Accordingly, the study is framed within a quantitative applied approach with an exploratory–descriptive scope and a non-experimental, cross-sectional design. It is quantitative because it relies on measurable financial and sustainability-related information that can be standardized and statistically processed; applied because it is aimed at constructing and operationalizing an issuer-level assessment tool; and exploratory–descriptive because, given the finite cross-sectional sample (N = 17), the empirical analysis focuses on index construction, internal consistency, structural validation, robustness checks, and comparative classification, rather than on testing causal relationships between sustainability and financial performance. Any observed association between the composite score and financial dimensions is therefore interpreted only as preliminary descriptive evidence.
This design is consistent with the purpose of the study, since the manuscript does not seek to estimate the causal effect of ESG performance on financial outcomes, but rather to construct, validate, and apply a multidimensional composite index capable of supporting comparative analysis. In this sense, the methodological strategy was organized around four sequential components: (i) the selection and refinement of indicators aligned with the 5P framework; (ii) the standardization and harmonization of heterogeneous firm-level data to ensure comparability; (iii) the statistical validation of the measurement structure through reliability and factorability diagnostics; and (iv) the construction of a composite issuer-level score suitable for ranking and classification, including its comparison with a conventional ESG-3 benchmark.
Likewise, the study adopts a non-experimental and cross-sectional design because the variables are not manipulated but observed as reported by firms in a specific period. The cross-sectional character of the analysis reflects that the empirical application is limited to the set of companies included in the MSCI COLCAP index during the period under study. This decision is methodologically coherent with the objective of assessing the operational feasibility and comparative usefulness of the proposed index within a defined issuer universe representative of the Colombian equity market.
The overall methodological process was therefore structured as a transparent sequence linking the research objective to the empirical application: first, the conceptual and operational construction of the 5P–ESG framework; second, the refinement and statistical validation of the instrument; and third, the calculation of the final issuer-level composite score for classification and benchmark comparison. This sequencing ensures that the methodological design directly supports the central purpose of the study and provides a coherent basis for the interpretation of the results.
3.4. Initial Construction of the Instrument
To achieve the study objective, the methodological strategy was organized around four operational components: (i) the selection and refinement of indicators aligned with the 5P framework; (ii) the standardization and harmonization of heterogeneous firm-level data; (iii) the statistical validation of the measurement structure; and (iv) the construction of a composite issuer-level score suitable for comparative classification.
As part of the construction process of the 5P–ESG Composite Index, the study initially considered a total of 28 conceptually grouped variables aimed at broadly capturing the financial and sustainability dimensions associated with the five Ps of sustainable development: People, Planet, Prosperity, Peace, and Partnerships.
The preliminary selection of variables was based on three fundamental criteria:
Theoretical support in the literature on sustainable finance, ESG, and corporate performance;
International standards such as GRI, SASB, and MSCI ESG Ratings;
Availability and comparability of information for companies listed on the Colombian Stock Exchange.
This process resulted in a broader initial instrument, which was subsequently subjected to statistical cleaning and validation procedures in order to construct a final version that is more parsimonious, robust, and operationally viable (see
Table 1).
Table 1 presents the preliminary instrument comprising 28 indicators, designed to broadly cover the five dimensions of People, Planet, Prosperity, Peace, and Partnerships.
However, to ensure that the composite index was operationally viable, comparable across issuers, and statistically stable, a data reduction process based on four sequential filters (F1–F4) was applied, combining expert judgment (content validity) and statistical criteria (empirical validity). The objective was to obtain a parsimonious set of variables with high financial interpretability and internal consistency, enabling the construction of pillar-level scores and the overall 5P–ESG Composite Index.
A technical review of the preliminary list was conducted to assess: (i) alignment with the 5P construct, (ii) conceptual clarity and directionality, and (iii) financial relevance for corporate analysis. Priority was given to indicators with direct interpretability for investors (e.g., verifiable policies, comparable ratios, efficiency metrics, and distribution measures). Variables whose measurement was highly heterogeneous across sectors or not consistently reportable across issuers were identified and excluded at this stage.
Data availability for each indicator was audited for the period under analysis. Indicators with systematic data gaps or inconsistent definitions across firms were excluded. This filter is critical in composite index construction, as it avoids biases arising from excessive imputation and ensures that rankings reflect actual differences in corporate performance rather than information gaps.
Indicators exhibiting (i) null or near-zero variance (i.e., lacking discriminatory power across issuers), and (ii) redundancy (very high correlations implying double counting of the same underlying phenomenon) were removed. These controls enhance index stability and reduce the risk that final scores are disproportionately driven by a single subset of variables.
For the refined set of indicators, internal consistency tests (Cronbach’s alpha at the pillar and global levels) and factorability tests (KMO and Bartlett’s test of sphericity) were applied as prerequisites for exploratory factor analysis (EFA).
Adherence to an explicit index-construction workflow. In line with the composite-indicators literature, the overall methodological process is organized as an explicit and transparent sequence: (i) variable selection and cleansing (implemented through the sequential filters F1–F4), (ii) normalization to ensure comparability across heterogeneous indicators (outlier treatment, standardization, directional harmonization, and bounded rescaling), (iii) assessment of latent structure and internal consistency (reliability and factorability diagnostics reported as preliminary evidence given the finite sample), and (iv) defensible aggregation rules. Specifically, indicators are first aggregated into pillar-level scores and then combined into the global 5P–ESG Composite Index through a weighted-sum rule, where pillar weights are derived endogenously from PCA (PC1) and complemented with sensitivity analysis against equal weights.
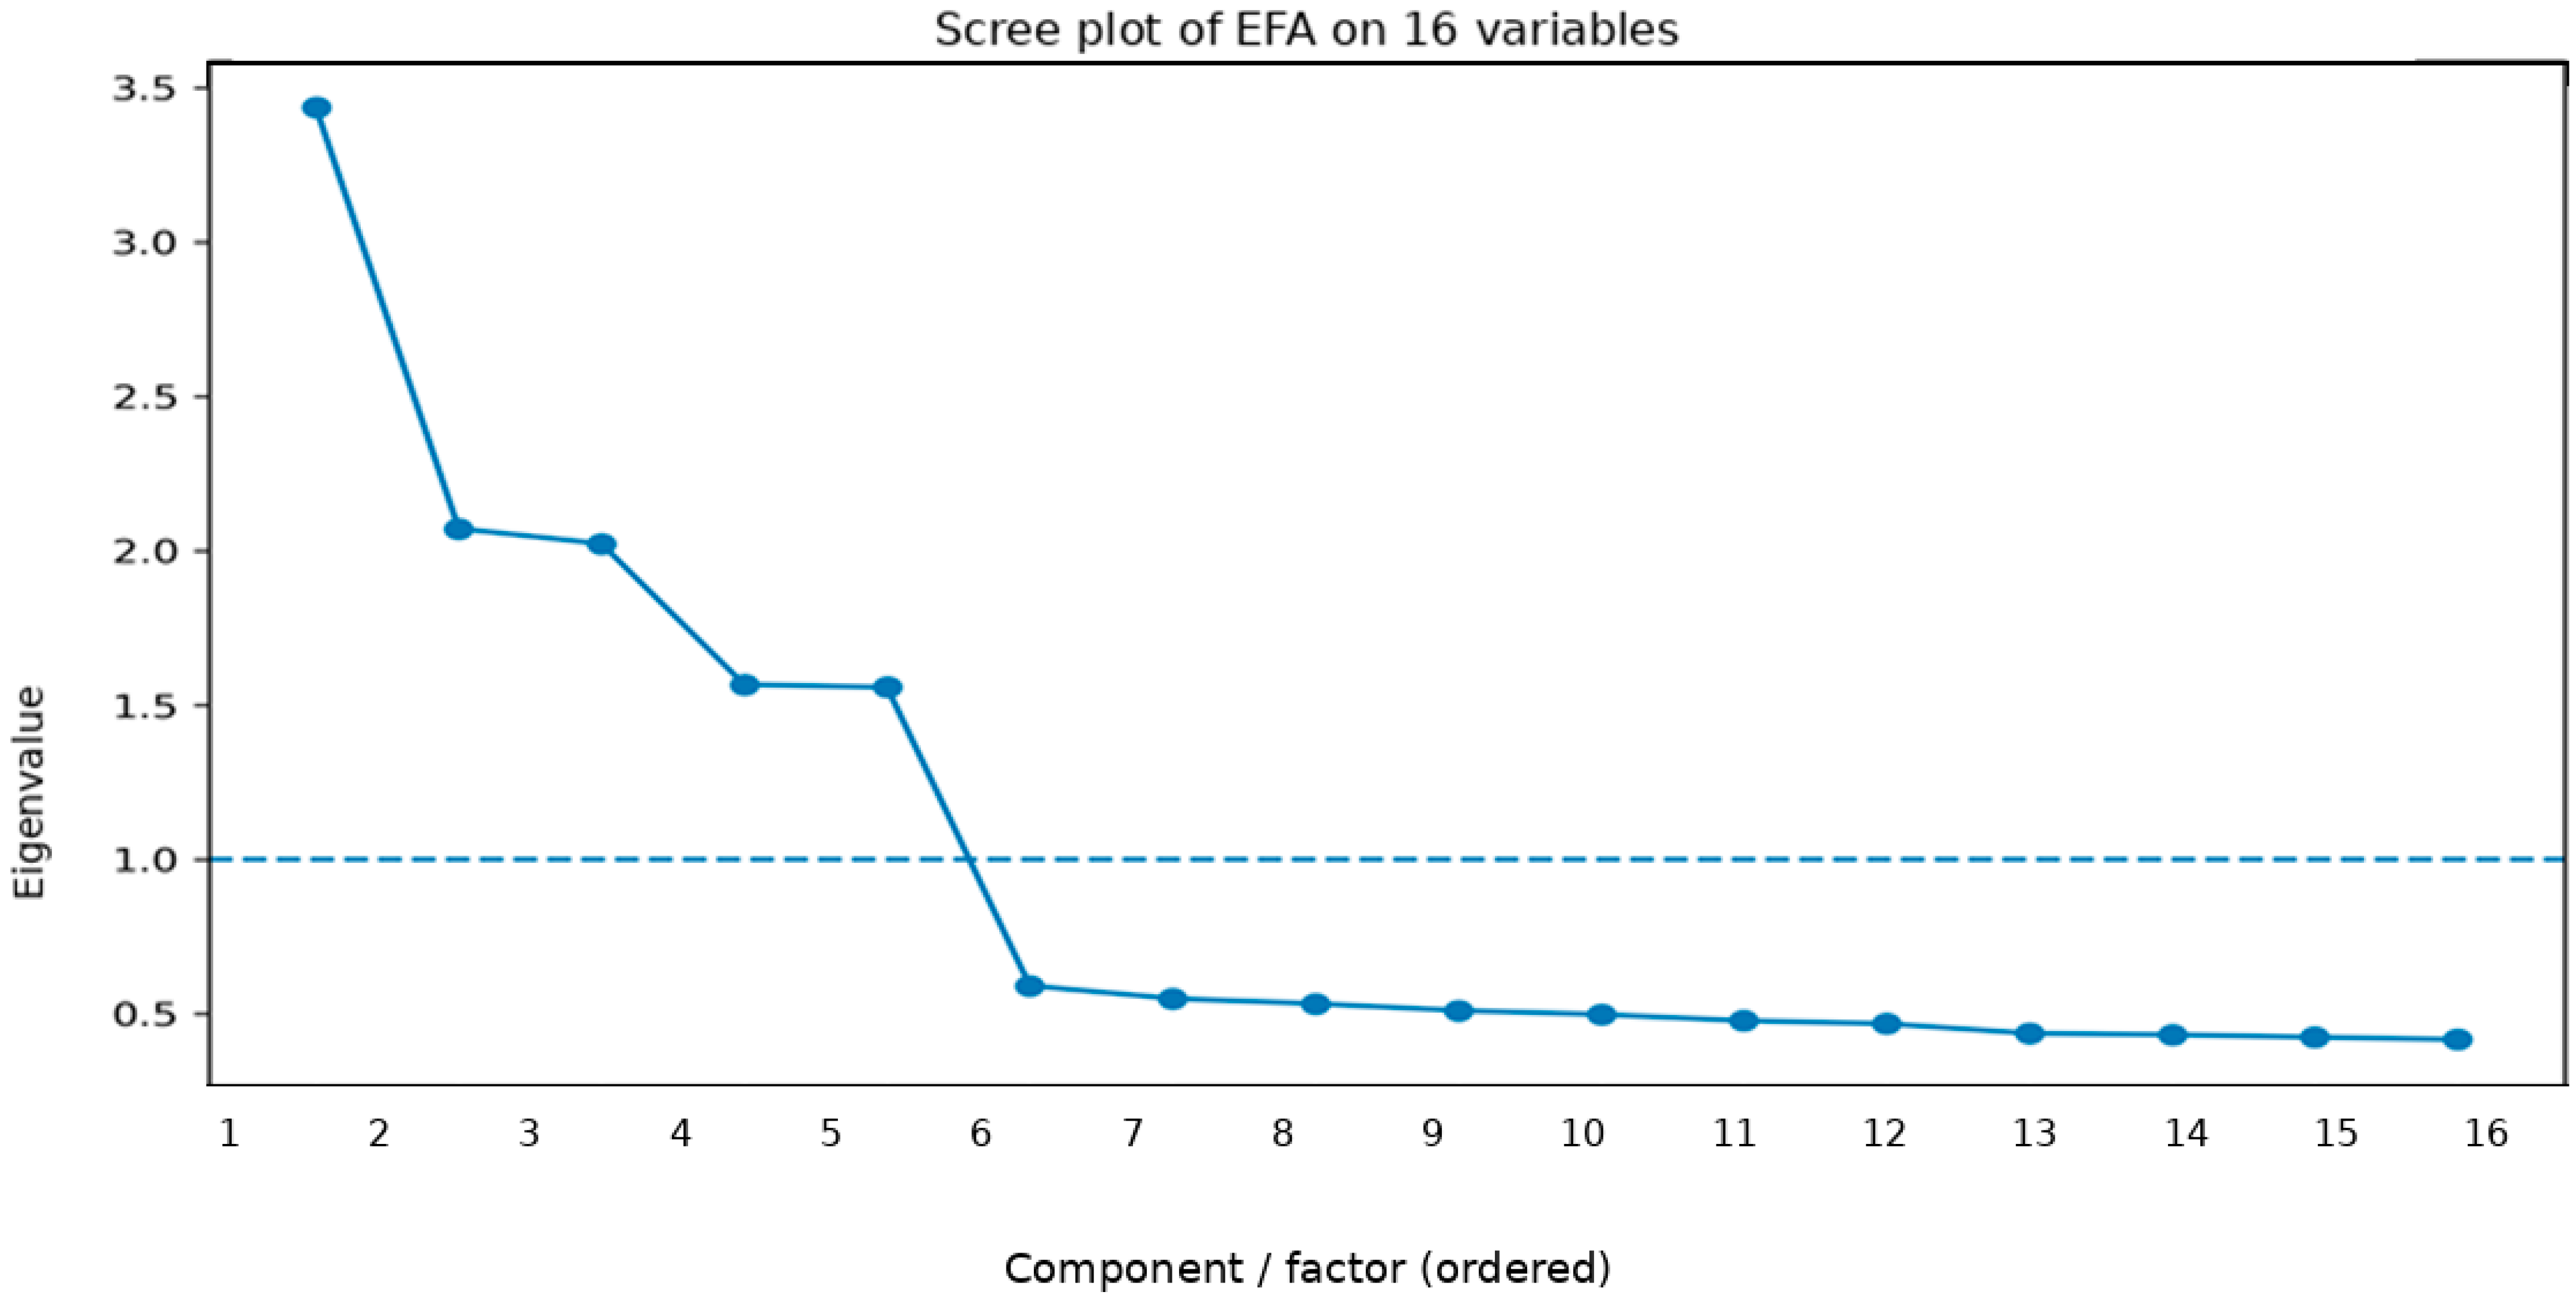
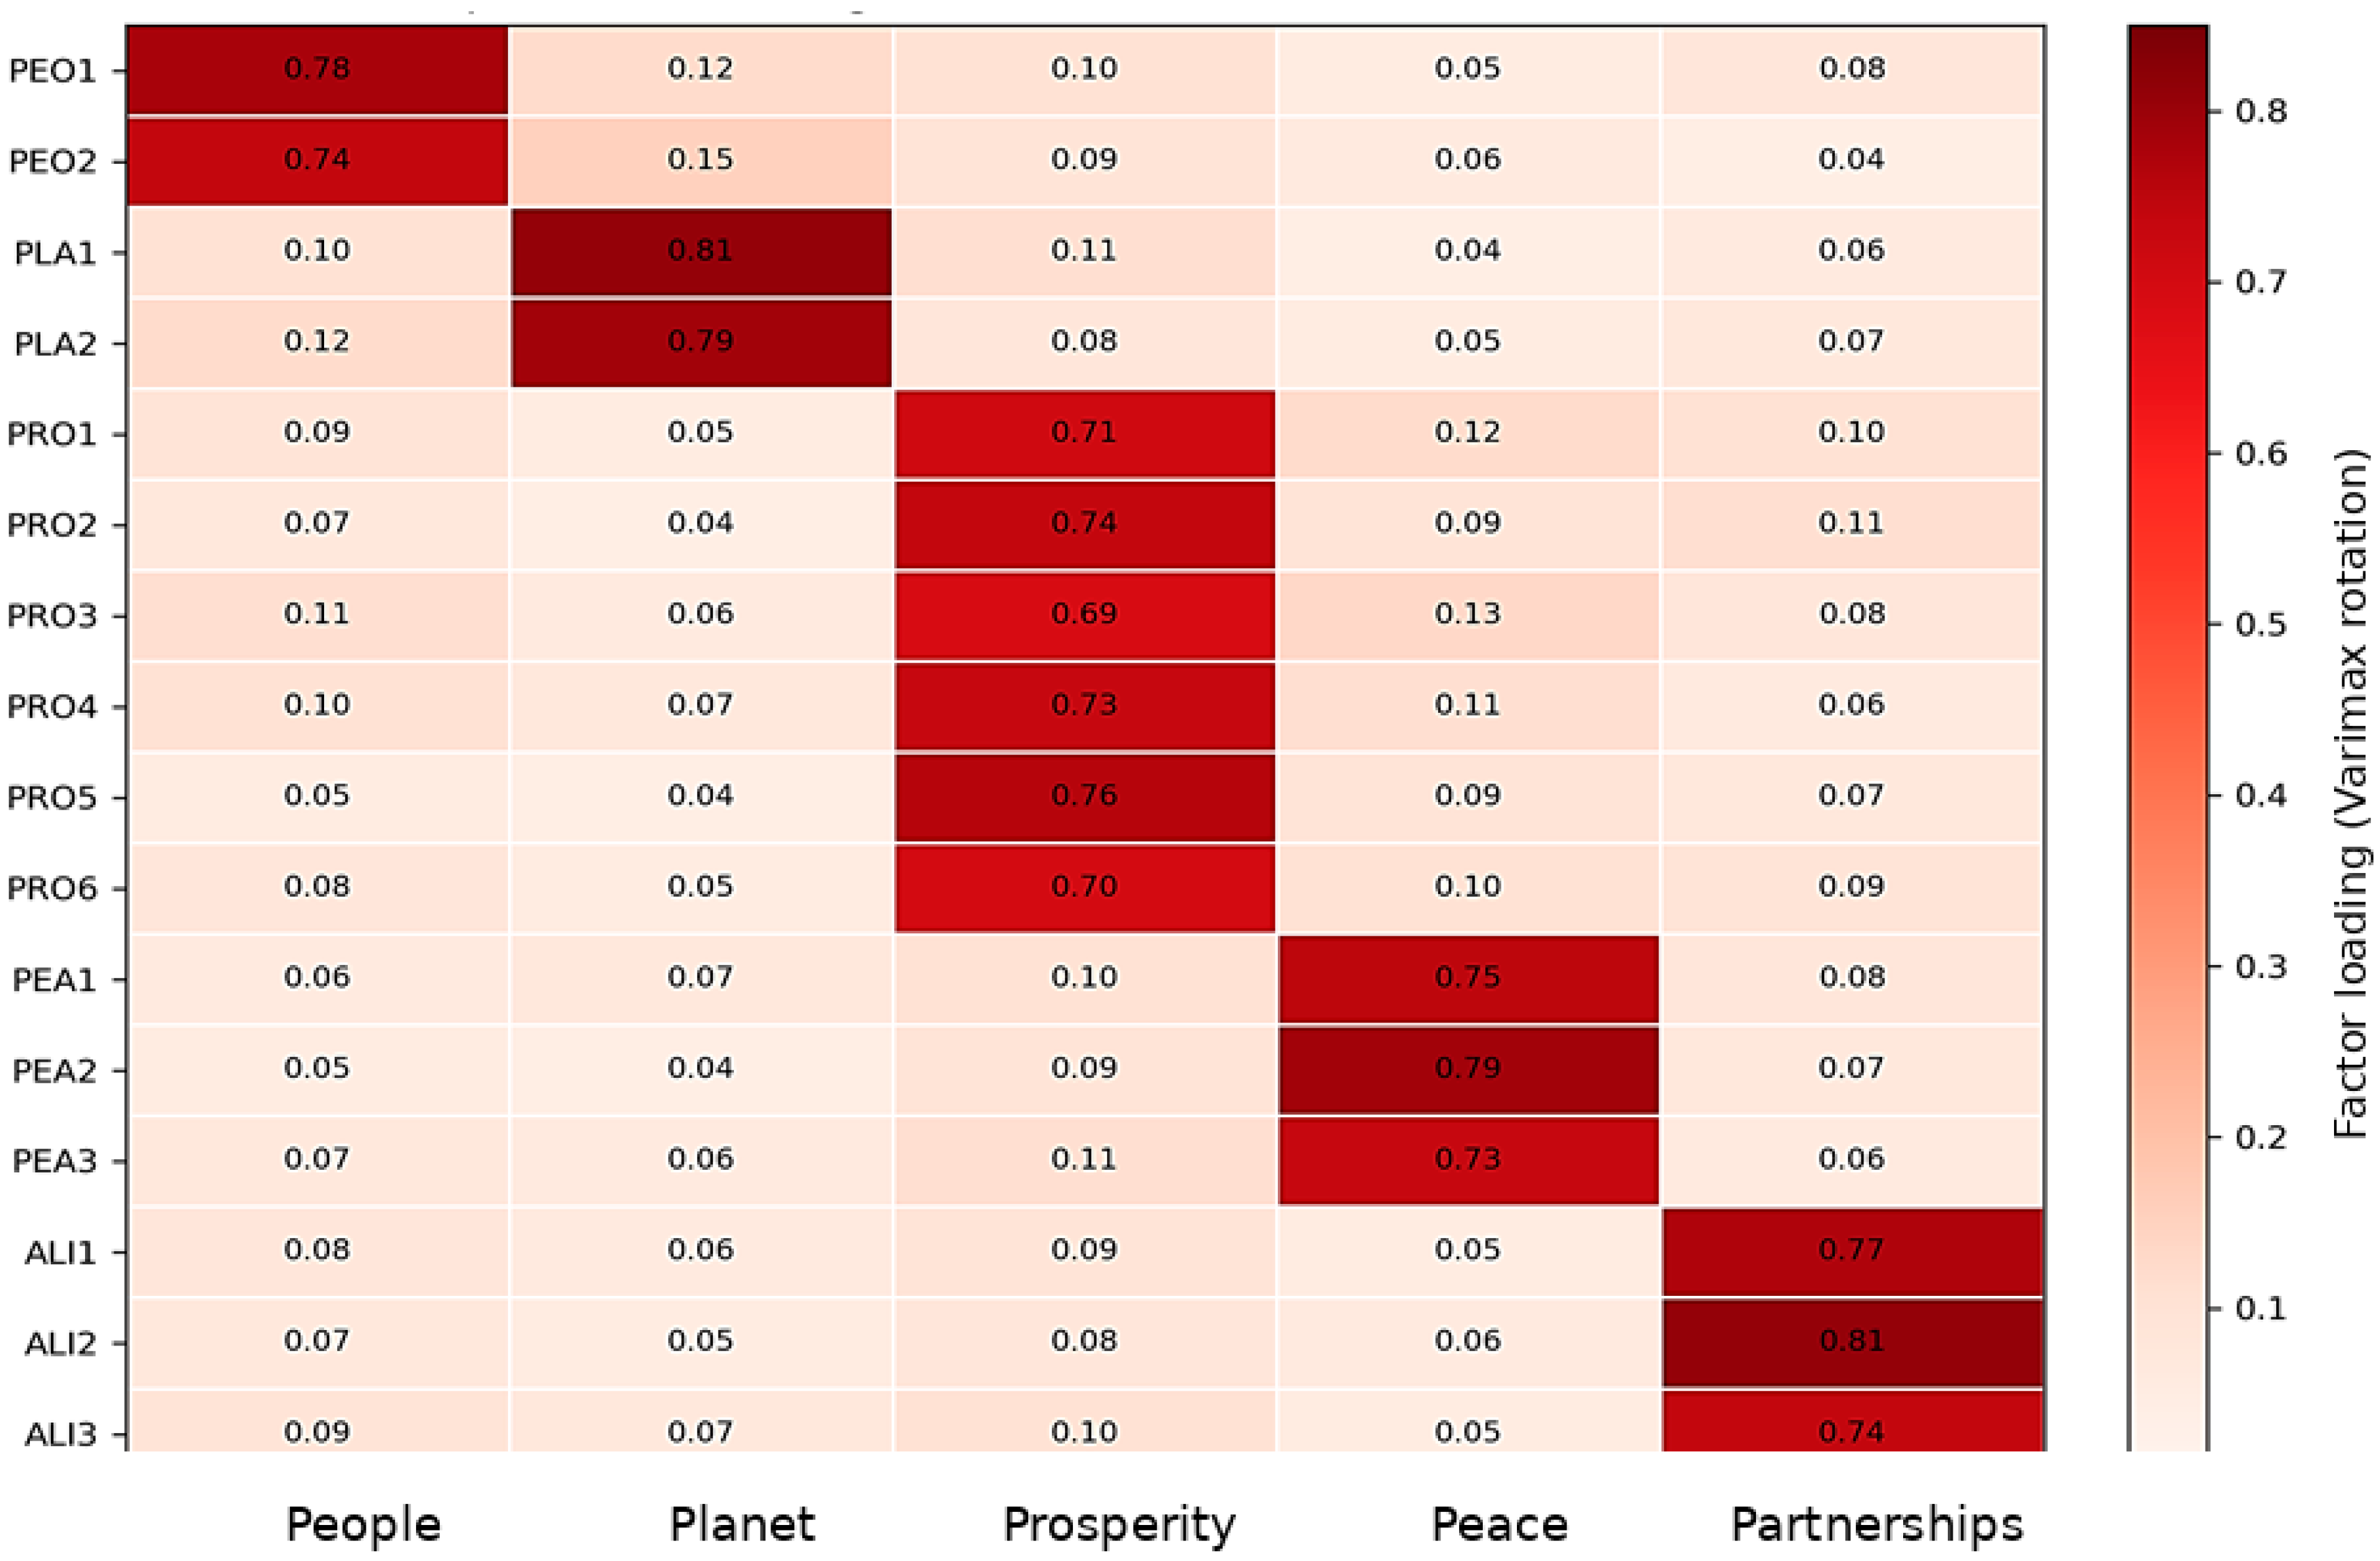
Subsequently, EFA confirmed that the retained indicators exhibited an interpretable factor structure and adequate factor loadings, supporting the empirical coherence of the measurement instrument.
In summary, the filters—defined ex ante and designed to be replicable—followed the logic outlined below:
F1 = Content validity (expert judgment: 5P relevance and financial interpretability).
F2 = Availability and comparability (consistent public data for COLCAP issuers; low missingness).
F3 = Preliminary statistical quality (sufficient variability and non-redundancy; avoidance of non-discriminatory items).
F4 = Empirical validation (contribution to reliability and structure: internal consistency and interpretable factor patterns).
Overall, the instrument refinement process was structured as a sequential and replicable filtering procedure (F1–F4), aimed at ensuring that the resulting index is comparable across issuers, operationally measurable, and statistically robust. This approach avoids the inclusion of indicators with limited availability or heterogeneous measurement and mitigates double counting arising from redundancy. Accordingly, priority was first given to content validity and financial interpretability (F1), followed by empirical feasibility within the MSCI COLCAP universe (F2), then discriminatory capacity and preliminary statistical quality (F3), and finally empirical coherence through reliability and structural tests (F4). The incremental logic of the procedure is summarized in
Table 2.
Based on the traceability presented in
Table 2, the filtering process made it possible to move from the preliminary set of 28 indicators to a parsimonious core of variables with high inter-firm comparability, direct financial interpretability, and conceptual coherence with the 5P framework. Accordingly,
Table 3 presents the decisive filter and the complete structure and specifications for each indicator, following a logic analogous to PRISMA reporting applied to index construction. Likewise, the core instrument (
N = 16) used in the subsequent stages of the study is consolidated: direction homogenization, winsorization, normalization (Z-scores), calculation of pillar scores, and construction of the composite index (5P–ESG Composite Index), as well as internal consistency and structural tests (Cronbach’s alpha, KMO/Bartlett, and EFA) (see
Table 3).
To ensure methodological transparency, the manuscript explicitly details the replacement of the preliminary Prosperity pillar indicators (
Table 1) with the refined indicators included in the final instrument (
Table 3):
ROA (PRO01) was replaced by Real revenue growth (PRO01), prioritizing real growth over accounting profitability as a proxy for Prosperity.
ROE (PRO02) was replaced by Distribution to labor and government/Revenues (PRO02), in order to capture distributive and fiscal contributions (wages and taxes) within the concept of Prosperity.
Net Profit Margin (PRO03) was replaced by Responsible supplier payment index (DPO) (PRO03), incorporating economic responsibility toward suppliers, a dimension not reflected in conventional accounting margins.
Asset Turnover (PRO04) was replaced by Equity-adjusted net margin (PRO04), integrating profitability with an equity factor based on the Gini index.
Leverage ratio (PRO05) was replaced by Labor productivity (PRO05), aligning Prosperity with operational productivity and efficient value-generation capacity.
Current ratio (PRO06) was replaced by Dividend stability (PRO06), serving as a proxy for consistency in value generation and return to investors.
Specification of constructed indicator (PRO04). The equity-adjusted net margin is defined as follow:
where Gini ∈ [0, 1] (if reported on a 0–100 scale, it is divided by 100). This formulation simultaneously incorporates a profitability dimension (net margin) and a distributive dimension (equity), aligning with the broader conceptualization of Prosperity within the 5P framework.
The construction of the synthetic scores associated with the five dimensions of the 5P model (People, Planet, Prosperity, Peace, and Partnerships) followed a standardized statistical procedure designed to ensure comparability across heterogeneous indicators, reduce distortions caused by extreme values, and provide the statistical consistency required for a robust composite index.
The index design adopted a four-step standardization procedure, in line with OECD recommendations [
1] and the specialized literature on ESG ratings [
2,
3]:
- (i)
Data cleaning and winsorization;
- (ii)
Standardized normalization;
- (iii)
Aggregation of items by dimension;
- (iv)
Estimation of the final score for each pillar.
This procedure ensures the statistical stability of the estimates and prevents extreme values or scale differences from affecting comparability across firms included in the MSCI COLCAP index.
First, a bilateral winsorization procedure (scientific control of outliers) was applied, setting the 5th and 95th percentiles as lower and upper bounds, respectively.
Given the finite sample size (N = 17) and the heterogeneous units and scales of the indicators, winsorization at the P5/P95 levels is employed as a conservative robustness mechanism to limit the disproportionate influence of extreme values without excluding issuers from the analysis. In small samples, a single outlier can distort standardization and aggregation procedures, potentially affecting the final ranking. As a sensitivity check, we verified that issuer rankings do not change materially under alternative outlier treatments (e.g., P10/P90 or no winsorization).
This method allows for:
- (i)
Mitigation of the influence of extreme values without eliminating observations, thus preserving the full sample structure;
- (ii)
Reduction of the impact of outliers associated with atypical variations or measurement errors;
- (iii)
Retention of all cases in the analysis, unlike trimming procedures that remove observations;
- (iv)
Improvement in the stability of means and dispersions in sensitive indicators such as ratios, rates, operational days, and risk-management-related metrics.
Given that the data matrix includes quantitative and proportional performance indicators across the five dimensions (People, Planet, Prosperity, Peace, and Partnerships), winsorization was applied exclusively to continuous variables:
PPL01–PPL02 (People);
PLA1–PLA2 (Planet);
PRO1–PRO6 (Prosperity);
PEA1–PEA3 (Peace);
PRT01–PRT03 (Partnerships).
Binary/categorical columns (values 0–1) do not require winsorization.
Now, for each of the numerical indicators:
Each variable was sorted in ascending order.
The 5th (P5) and 95th (P95) percentiles were identified.
Values below P5 were replaced with the exact value of the 5th percentile.
Values above P95 were replaced with the corresponding 95th percentile.
Accordingly, for each indicator
, its winsorized version
was defined as:
where
and
correspond to the 5th and 95th percentiles of each quantitative variable.
The transformation preserves the relative structure of the dataset while reducing the influence of extreme outliers.
Winsorization resulted in:
A reduction in dispersion for highly volatile indicators such as PRO1, PRO4, and PLA2.
Greater stability in means, eliminating variations induced by extreme values.
Improved symmetry in a considerable portion of the Prosperity metrics, where several companies exhibited unusually high values in periods of operating days (PRO3).
Removal of adverse bias in indicators with negative proportions or values exceeding 100%, which distorted benchmarking.
Normalization and comparability pipeline. After winsorization (P5–P95) for continuous indicators, we applied a two-stage normalization to ensure cross-indicator comparability and to integrate continuous and binary variables in the same scoring framework.
Step 1 (standardization): for each continuous indicator
, we compute a z-score:
Step 2 (directional harmonization): for “lower-is-better” indicators, we reverse the orientation by , so that higher values always indicate better performance.
Step 3 (bounded rescaling for aggregation/reporting): to report normalized values on a bounded scale and to align with binary variables, we rescale standardized scores to [0, 1] using min–max:
Binary indicators remain unchanged (0/1).
Table 5 reports
(bounded normalized values), while
Table 4 reports winsorized raw inputs.
Furthermore, it should be noted that
Table 5 confirms that certain dichotomous indicators (0/1) exhibit zero variance within the sample (i.e., they take the value 1.00 for all issuers), specifically PPL02, PRT02, and PRT03. Accordingly, these indicators were excluded from correlation-based procedures (correlation matrix, KMO test, Bartlett’s test, exploratory factor analysis, and PCA), as they do not contribute statistical information and may distort the estimation of the latent structure. However, they are retained as descriptive variables within the instrument for purposes of transparency and conceptual traceability.
3.7. Estimation of Weights Using Principal Component Analysis (PCA)
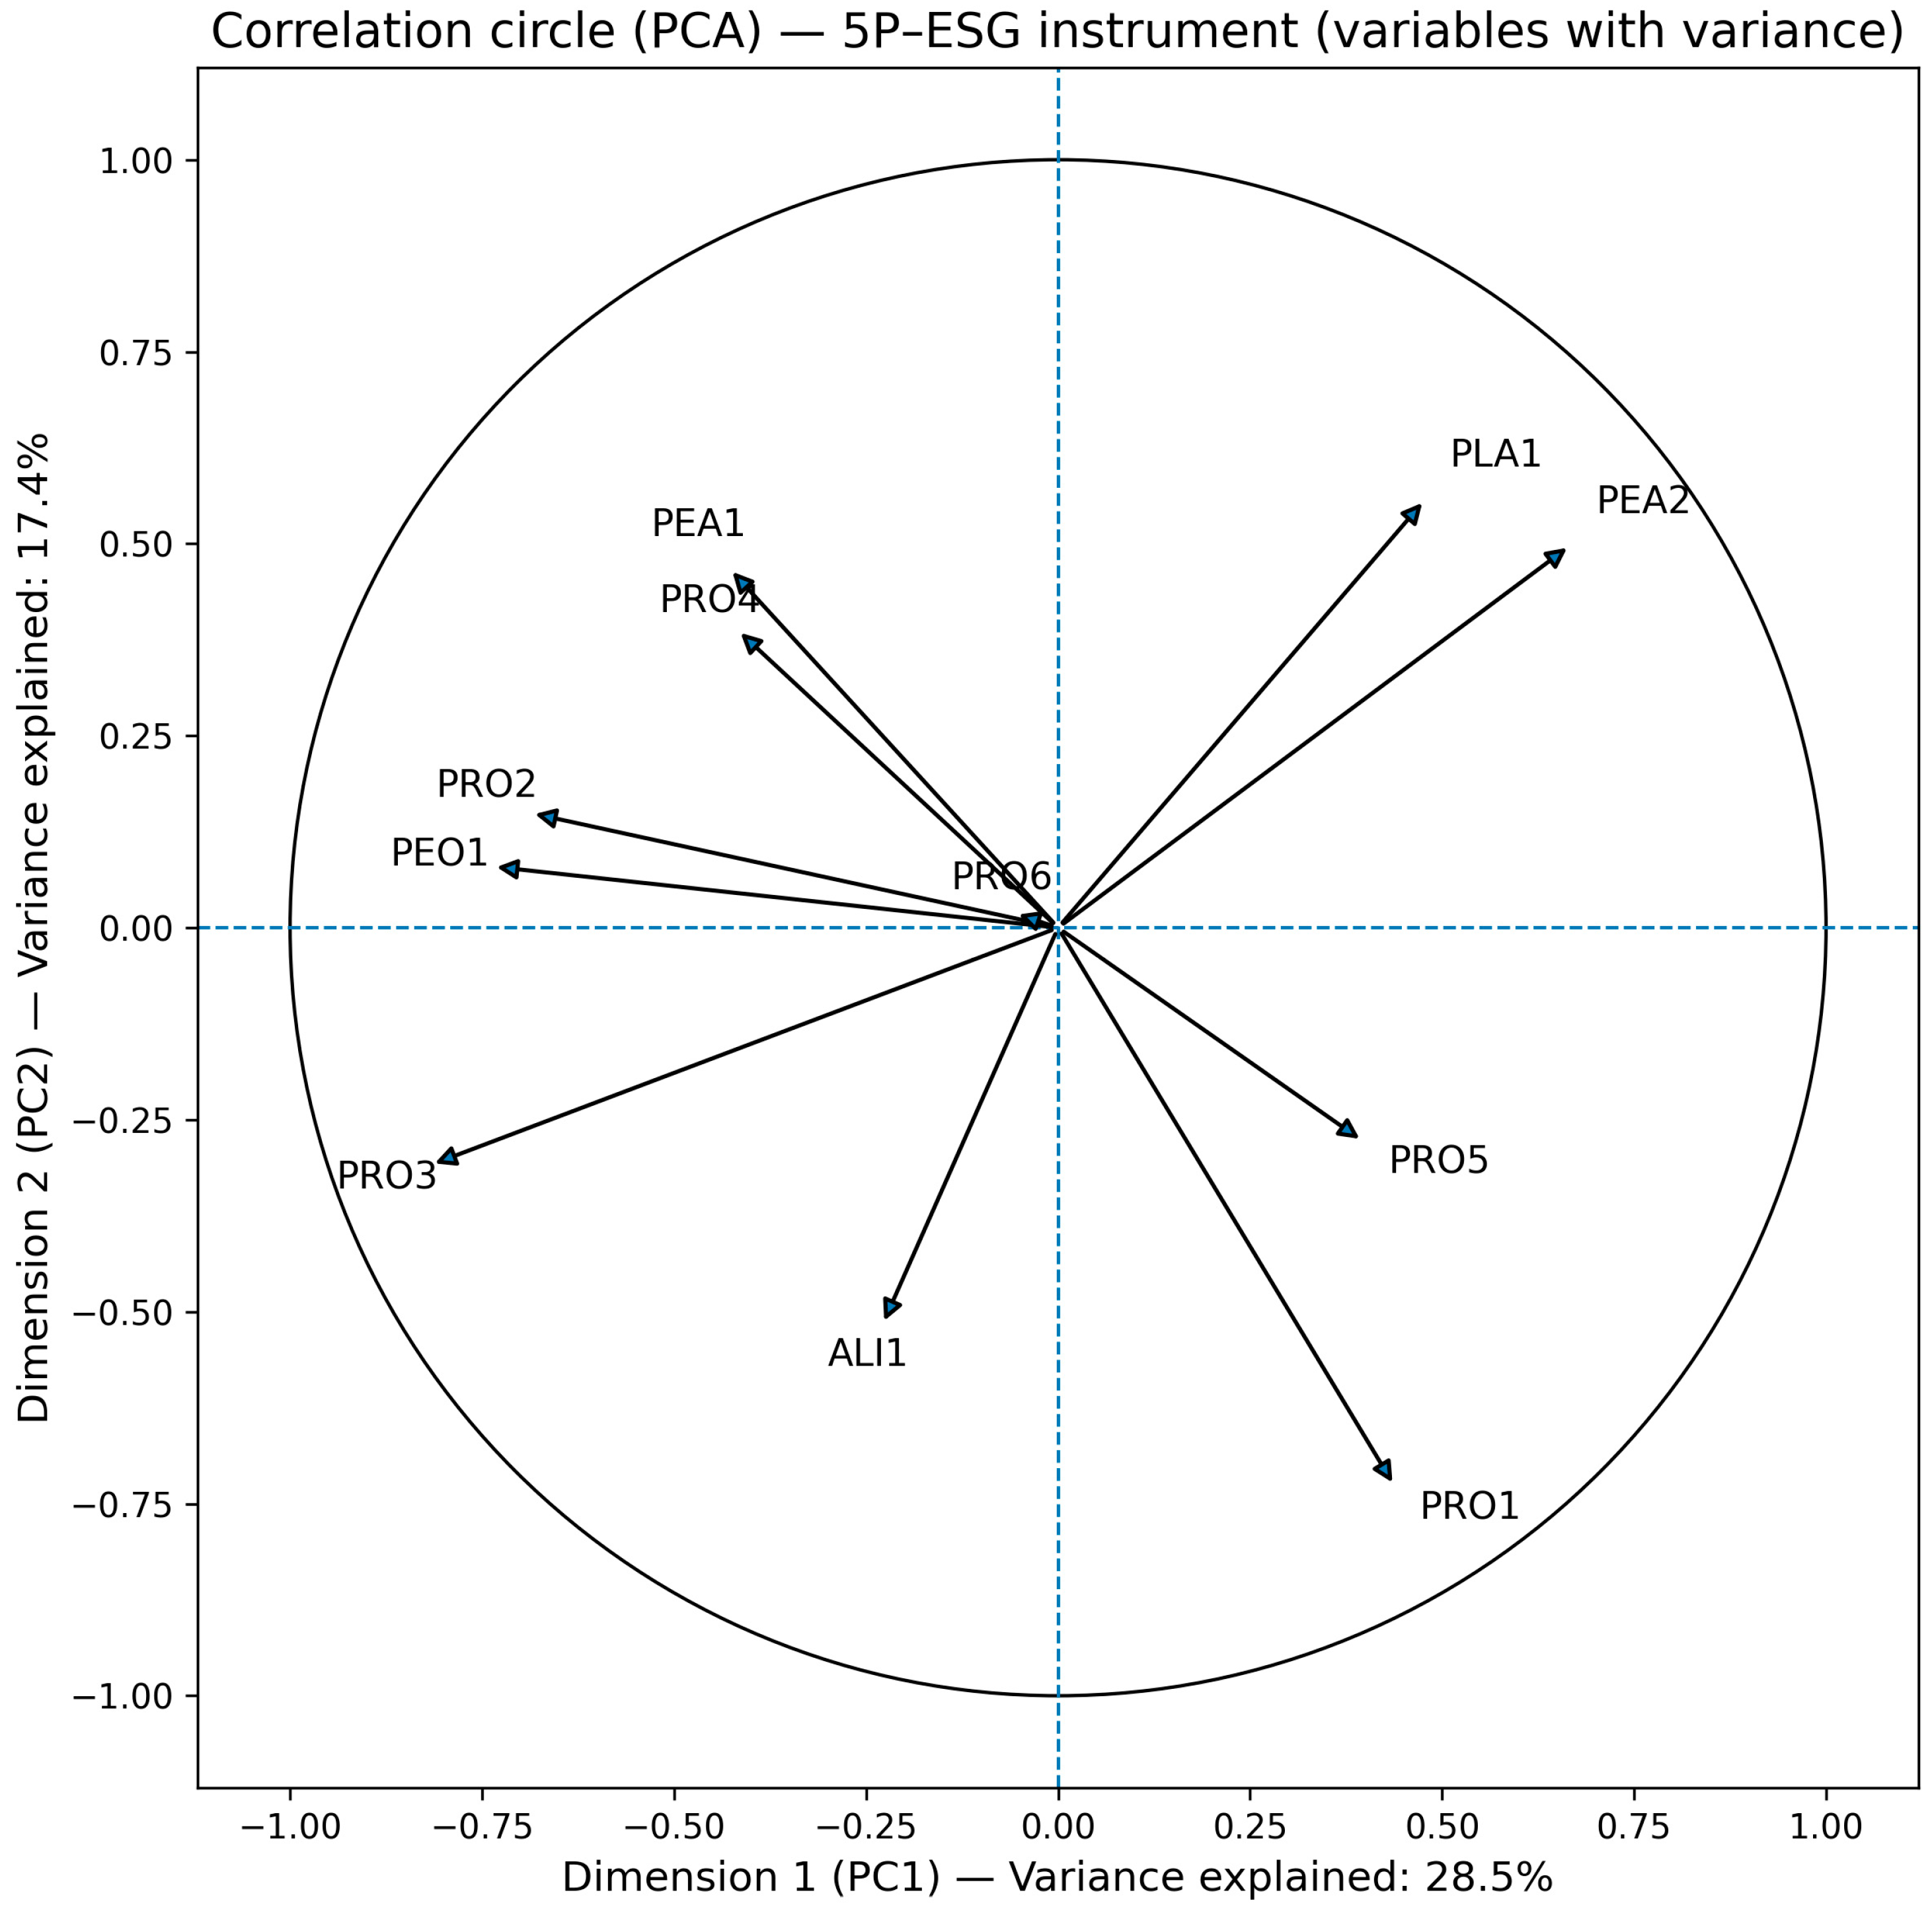
With the aim of transforming the pillar scores into a sustainable scoring model, endogenous weights were estimated using Principal Component Analysis (PCA). This procedure allows identifying the relative contribution of each dimension of the 5P model to the aggregated sustainable-financial performance, avoiding the use of arbitrary weights.
Prior to the analysis, the pillar scores were re-standardized:
Subsequently, PCA was applied to the matrix of standardized scores P′, extracting the first principal component, which captures the largest proportion of the joint variance of the five pillars. The factor loadings associated with this component were interpreted as indicators of the relative importance of each dimension.
These loadings were transformed into normalized weights using
where
corresponds to the factor loading of pillar
.
〖w_p=1〗. In this study, the resulting normalized weights derived from Principal Component Analysis (PCA) were as follows:
Let denote the score of pillar for firm , where . Let represent the weight of pillar , derived from Principal Component Analysis (PCA) and normalized such that .
The composite index for each firm
is defined as:
where
is the score of issuer
in pillar
, and
is the corresponding PCA-derived normalized weight. In this study, the resulting weights were as follows:
Therefore, the final composite score is:
The above expression constitutes the mathematical core of the research work and represents an integrated model for evaluating the financial and sustainable performance of companies, built based on the conceptual structure of the 5Ps and validated using multivariate statistical techniques.
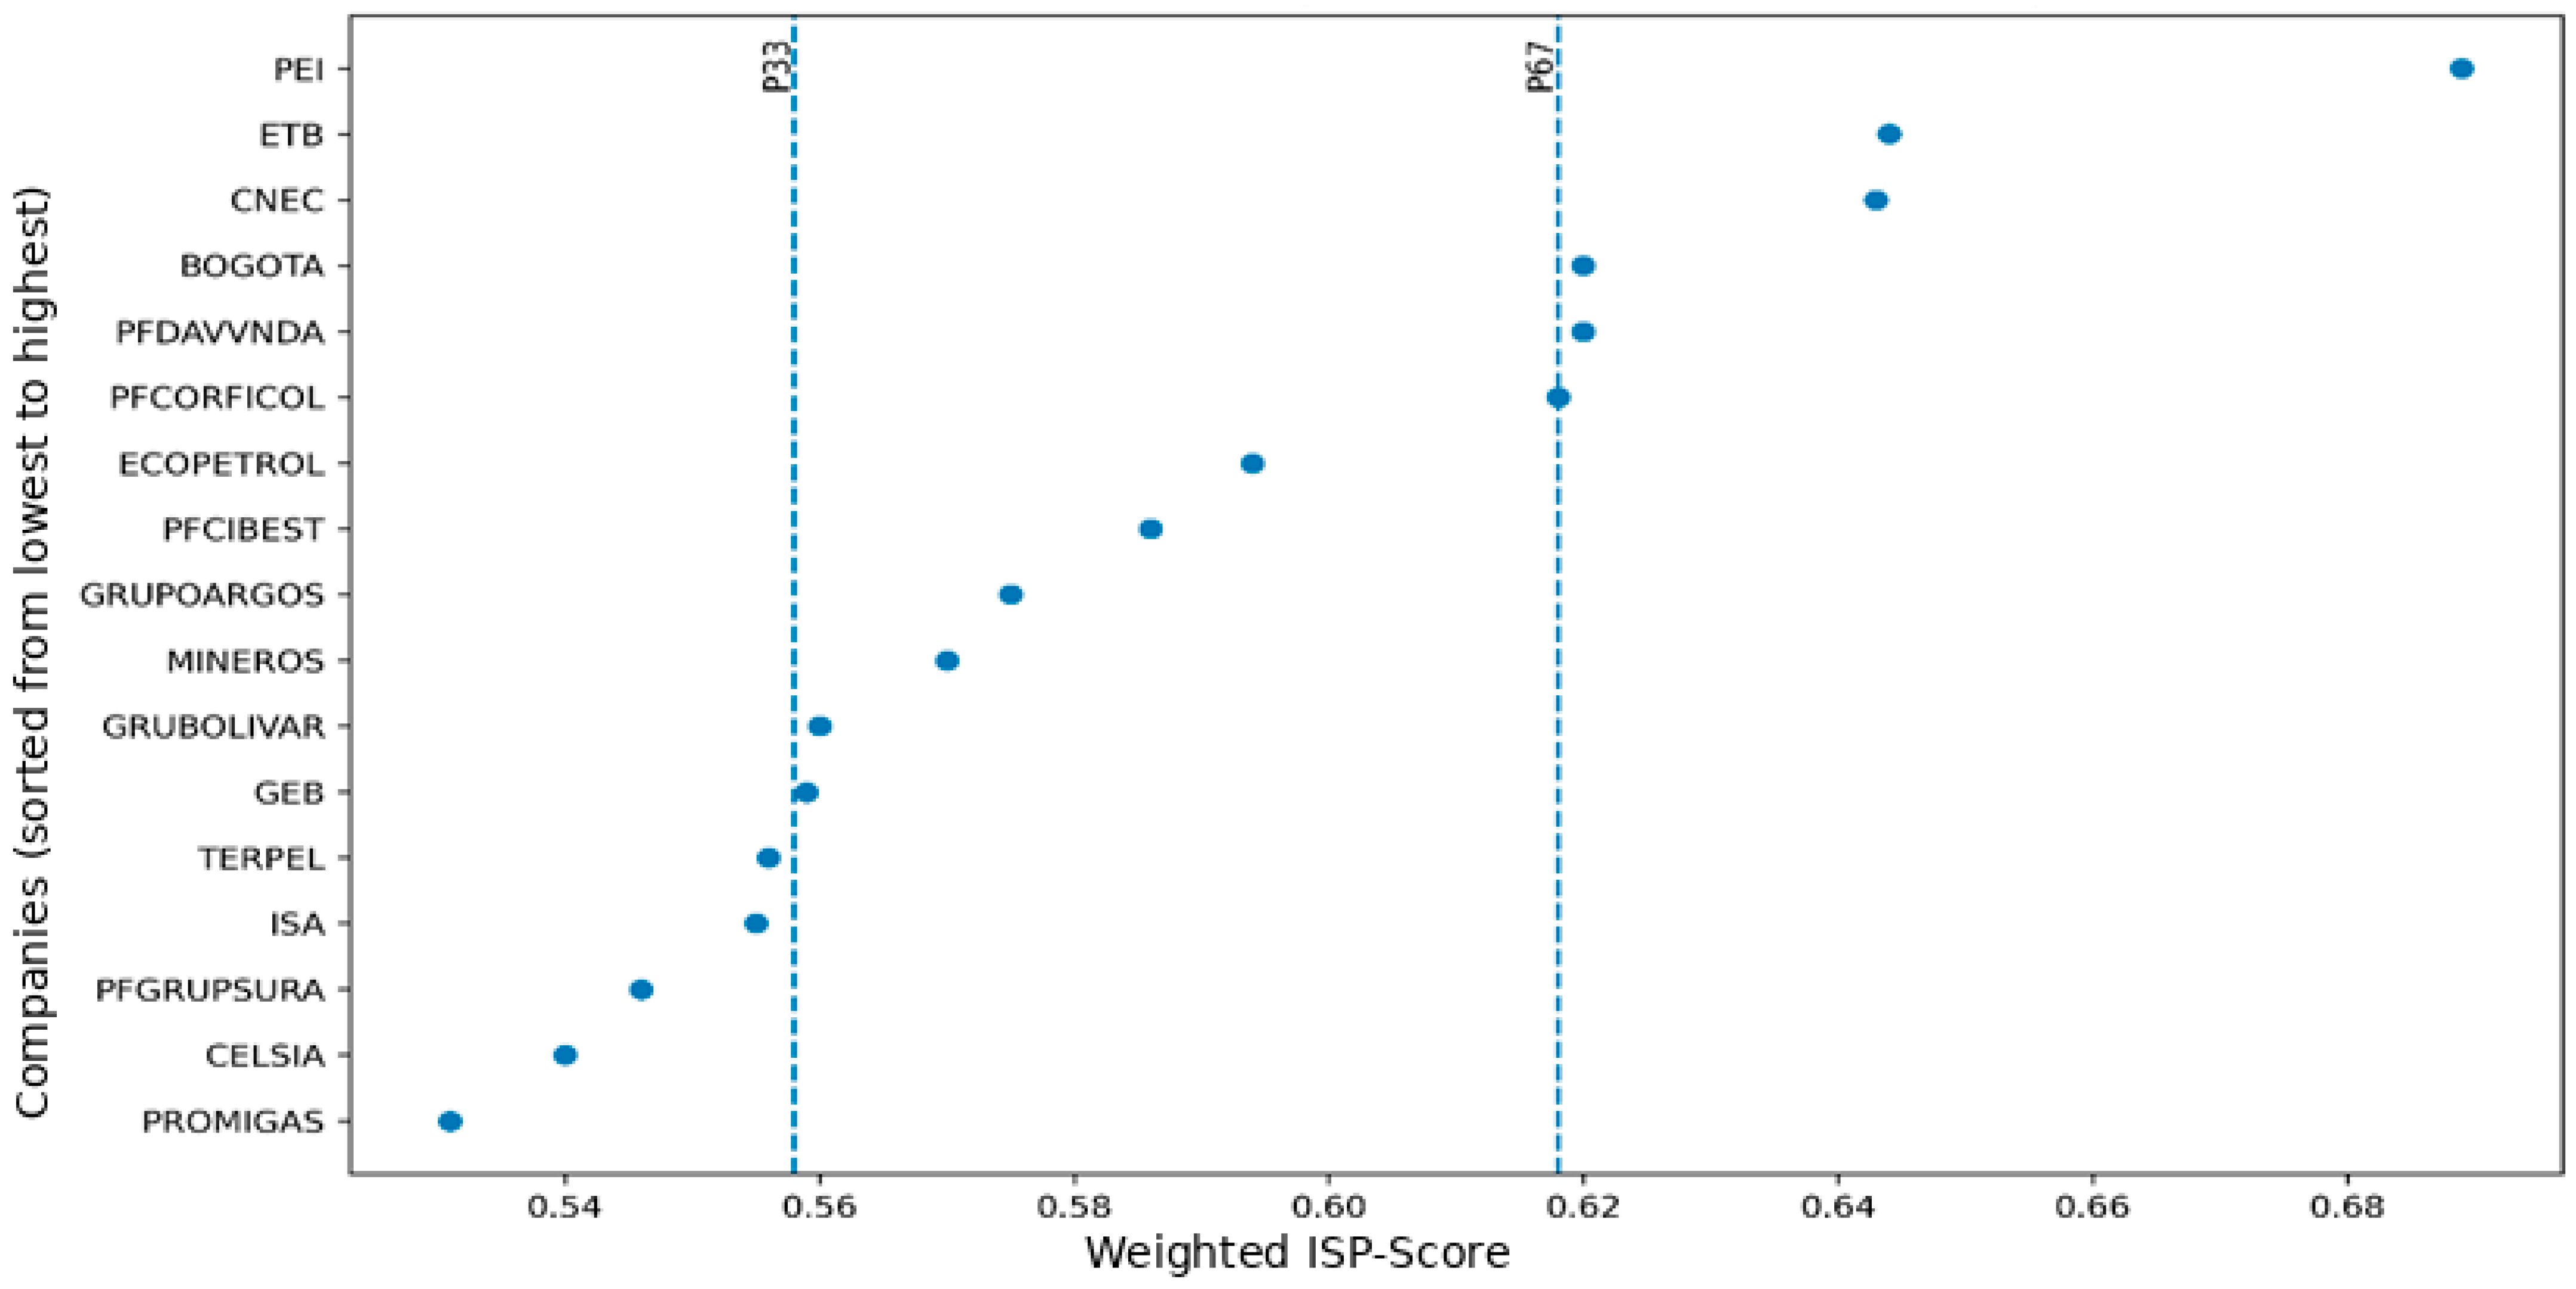
To interpret the 5P–ESG Composite Index in an operational manner and avoid the use of arbitrary absolute thresholds, a relative classification was adopted based on quantiles of the distribution of the indicator within the analyzed universe (MSCI COLCAP companies). This strategy is consistent with the nature of composite indices constructed from standardization and endogenous weights, whose scale depends on the set of observations and the period considered.
Two cut-off points were defined based on the empirical percentiles of the 5P–ESG Composite Index.
Based on these cut-offs, each company
was classified into three levels:
The thresholds and were estimated directly from the observed values of the index in the sample, ensuring that the classification is replicable (given the same data and the same analysis period) and suitable for moderate-sized samples, avoiding groups that are too small.







 ,
,