Article

A CLIP-Guided Multi-Objective Optimization Framework for Sustainable Design: Integrating Aesthetic Evaluation, Energy Efficiency, and Life Cycle Environmental Performance


1
Department of Industrial Design, Pukyong National University, 45, Yongso-ro, Nam-Gu, Busan 48513, Republic of Korea
2
Department of Marine Convergence Design Engineering, Pukyong National University, 45, Yongso-ro, Nam-Gu, Busan 48513, Republic of Korea
*
Author to whom correspondence should be addressed.
Sustainability 2026, 18(8), 4064; https://doi.org/10.3390/su18084064
Submission received: 20 January 2026 / Revised: 4 April 2026 / Accepted: 13 April 2026 / Published: 19 April 2026
(This article belongs to the Special Issue Artificial Intelligence and Sustainable Development)

Abstract

Achieving sustainable design requires balancing environmental performance, resource efficiency, functional feasibility, and aesthetic acceptance throughout the product life cycle. However, traditional design approaches often struggle to quantitatively integrate subjective aesthetic evaluation with objective sustainability indicators such as energy consumption, carbon emissions, and material recyclability. To address this challenge, this study proposes a semantic-guided multi-objective optimization framework for sustainable design that integrates cross-modal aesthetic evaluation with life cycle environmental performance assessment. The proposed framework employs a Contrastive Language–Image Pre-training (CLIP)-based semantic evaluation mechanism to translate abstract sustainability and aesthetic concepts into quantifiable design features, enabling consistent assessment across diverse design solutions. These semantic features are further optimized using a multi-objective evolutionary optimization strategy to simultaneously minimize energy consumption and carbon emissions while maximizing material recovery and design quality. Life cycle environmental indicators derived from OpenLCA datasets are incorporated into the optimization process to ensure practical sustainability relevance. The experimental results demonstrate that the proposed framework achieves a superior performance compared with benchmark optimization methods. Specifically, carbon emission equivalents are reduced to as low as 12.3 kg CO2e, material recovery rates exceed 92%, and total computational energy consumption is reduced by more than 40% relative to comparative models. In addition, the framework shows strong stability and convergence efficiency while maintaining a high aesthetic evaluation accuracy in high-quality design ranges. The findings indicate that the proposed approach provides an effective pathway for integrating aesthetic value with environmental responsibility in sustainable design practice. This framework supports low-carbon and resource-efficient product development and offers practical insights for sustainable manufacturing, circular design, and environmentally conscious innovation.

1. Introduction

Generative sustainable aesthetic design covers multidimensional factors including environmental sustainability, aesthetic value, functional needs, and engineering feasibility. It presents strong nonlinear coupling characteristics and poses high requirements on the timeliness and accuracy of design optimization techniques [1]. Traditional methods cannot effectively capture real-time changes in user preferences and market trends. They also respond slowly to sudden disturbances such as material supply fluctuations or policy updates, which severely reduces the innovation efficiency and market adaptability of green design concepts [2]. Therefore, there is an urgent need for an intelligent generative model that can dynamically balance multiple constraints, autonomously explore design spaces, and quickly generate optimal solutions. With the rise of intelligent algorithms, their strong cross-modal semantic understanding and high-dimensional search ability can be applied to sustainable aesthetic design. Text–image mapping and evolutionary strategies can work together to improve both the creativity and feasibility of sustainable aesthetic design [3]. With the development and application of artificial intelligence, researchers around the world have carried out studies on this topic. These studies include the application of generative design algorithms in areas such as building energy optimization and ecological product form generation within sustainable design [4,5]. Gong Y et al. aimed to achieve green communication goals in the field of integrated sensing and communication [6]. They developed a green radio frequency chain design technology. This technology systematically examined existing radio frequency chain architectures of integrated systems; analyzed energy-saving schemes for transmitters and receivers; raised dynamic power management, low-power amplifier design, and signal processing optimization strategies; and explored hardware structure innovation and future research directions to support sustainable development in integrated sensing and communication systems.
With the rapid growth of application demand for generative sustainable aesthetic design in multiple fields, meeting diverse aesthetic preferences and functional needs while ensuring environmental friendliness has become a major challenge. Traditional design methods cannot efficiently handle the complex relationship between sustainability indicators and subjective aesthetics and cannot respond quickly to dynamic market trends and environmental standards. Contrastive Language–Image Pre-training (CLIP), with its strong text–image alignment ability, can transform abstract sustainability concepts and subjective aesthetic evaluations into computable visual feature vectors, thereby building quantitative links between textual descriptions and design solutions [7,8]. Evolutionary optimization algorithms have powerful global search abilities. They can overcome the limitations of local optima, explore innovative solutions in complex high-dimensional design spaces, require relatively simple mathematical properties of the objective function, and balance multiple conflicting goals [9]. Privitera S et al. proposed an evolutionary algorithm-driven direct optimization technique for the problem of balancing non-random population covariates [10]. Their process directly optimized arbitrary covariate balance indicators with evolutionary algorithms. This approach avoided the model mis-specification problem of traditional propensity score matching and provided a more flexible matching solution for clinical research data analysis.
Generative sustainable design, as well as green products and LCA-guided ecological design, are accelerating their integration into the entire product life cycle and management. Through LCA (life cycle assessment), they quantify carbon footprints and resource consumption, driving green iterations in material selection, manufacturing processes, and recycling strategies [11]. Eslamipoor R et al. aimed to explore the relationship between consumption and production pollution, and based on the Ricardian model, modeled and analyzed the consumption and production pollution functions under six scenarios. Their findings indicated that when pollution control targets became stricter, although trade division improved efficiency, it might exacerbate the risk of pollution transfer [12]. Moreover, differences in labor scale would amplify this asymmetry effect—countries with abundant labor resources are more likely to become recipients of pollution-intensive production. To address the practical challenges of multi-level collaborative emission reduction in green supply chains, Eslamipoor R proposed an integrated optimization framework using multi-objective programming. This framework, based on the ε-constraint method for solving a three-stage model, internalizes carbon emission costs as key variables in location and transportation decisions. The results revealed that the carbon emission intensity of each facility not only depends on capacity allocation but is also significantly influenced by the dual constraints of transportation radius and order response time [13].
From the above content, it can be seen that sustainable design is moving from single-point technological breakthroughs towards a systemic paradigm shift. Its core driving force lies in the deep coupling of multimodal semantic understanding, intelligent optimization algorithms, and full life cycle quantitative assessment. However, there are still some practical bottlenecks such as incomplete semantic gap closure, opaque trade-off mechanisms among optimization goals, and lagging dynamic updates of LCA data, which restrict the real-time use and robustness of cross-scale design decisions. Therefore, this paper raises a new green design concept model based on evolutionary optimization guided by CLIP. By building a multimodal design evaluation framework and adaptive evolutionary strategies, the model further improves the efficiency of generating and optimizing sustainable aesthetic design schemes. The innovation of this work lies in the deep integration of CLIP’s cross-modal understanding with evolutionary algorithms. The model develops a semantic-guided optimization paradigm for sustainable design, establishes a dynamic weight adjustment mechanism, and achieves adaptive balance among environmental indicators, aesthetic evaluations, and functional needs.

2. Methods

2.1. Experimental Platform and Software Environment

All experiments were conducted on a computational workstation (Precision 7920 Tower, Dell Technologies, Round Rock, TX, USA) equipped with an NVIDIA GeForce RTX 3090 graphics processing unit (NVIDIA Corporation, Santa Clara, CA, USA) and 128 GB RAM. Data acquisition and environmental parameter logging were performed using a DAQ970A Data Acquisition System (Keysight Technologies, Santa Rosa, CA, USA). Economic-index simulation and parameter optimization were carried out in MATLAB R2023b (MathWorks, Natick, MA, USA). Model development and training were implemented in Python 3.8 and TensorFlow 2.8 under Ubuntu 20.04 Linux. Life-cycle assessment was performed using SimaPro 9.3 (PRé Sustainability B.V., Amersfoort, The Netherlands) and openLCA 2.1 (GreenDelta GmbH, Berlin, Germany). Result visualization was prepared using OriginPro 2024 (OriginLab Corporation, Northampton, MA, USA).

2.2. Evolutionary Optimization Algorithm Design Guided by CLIP

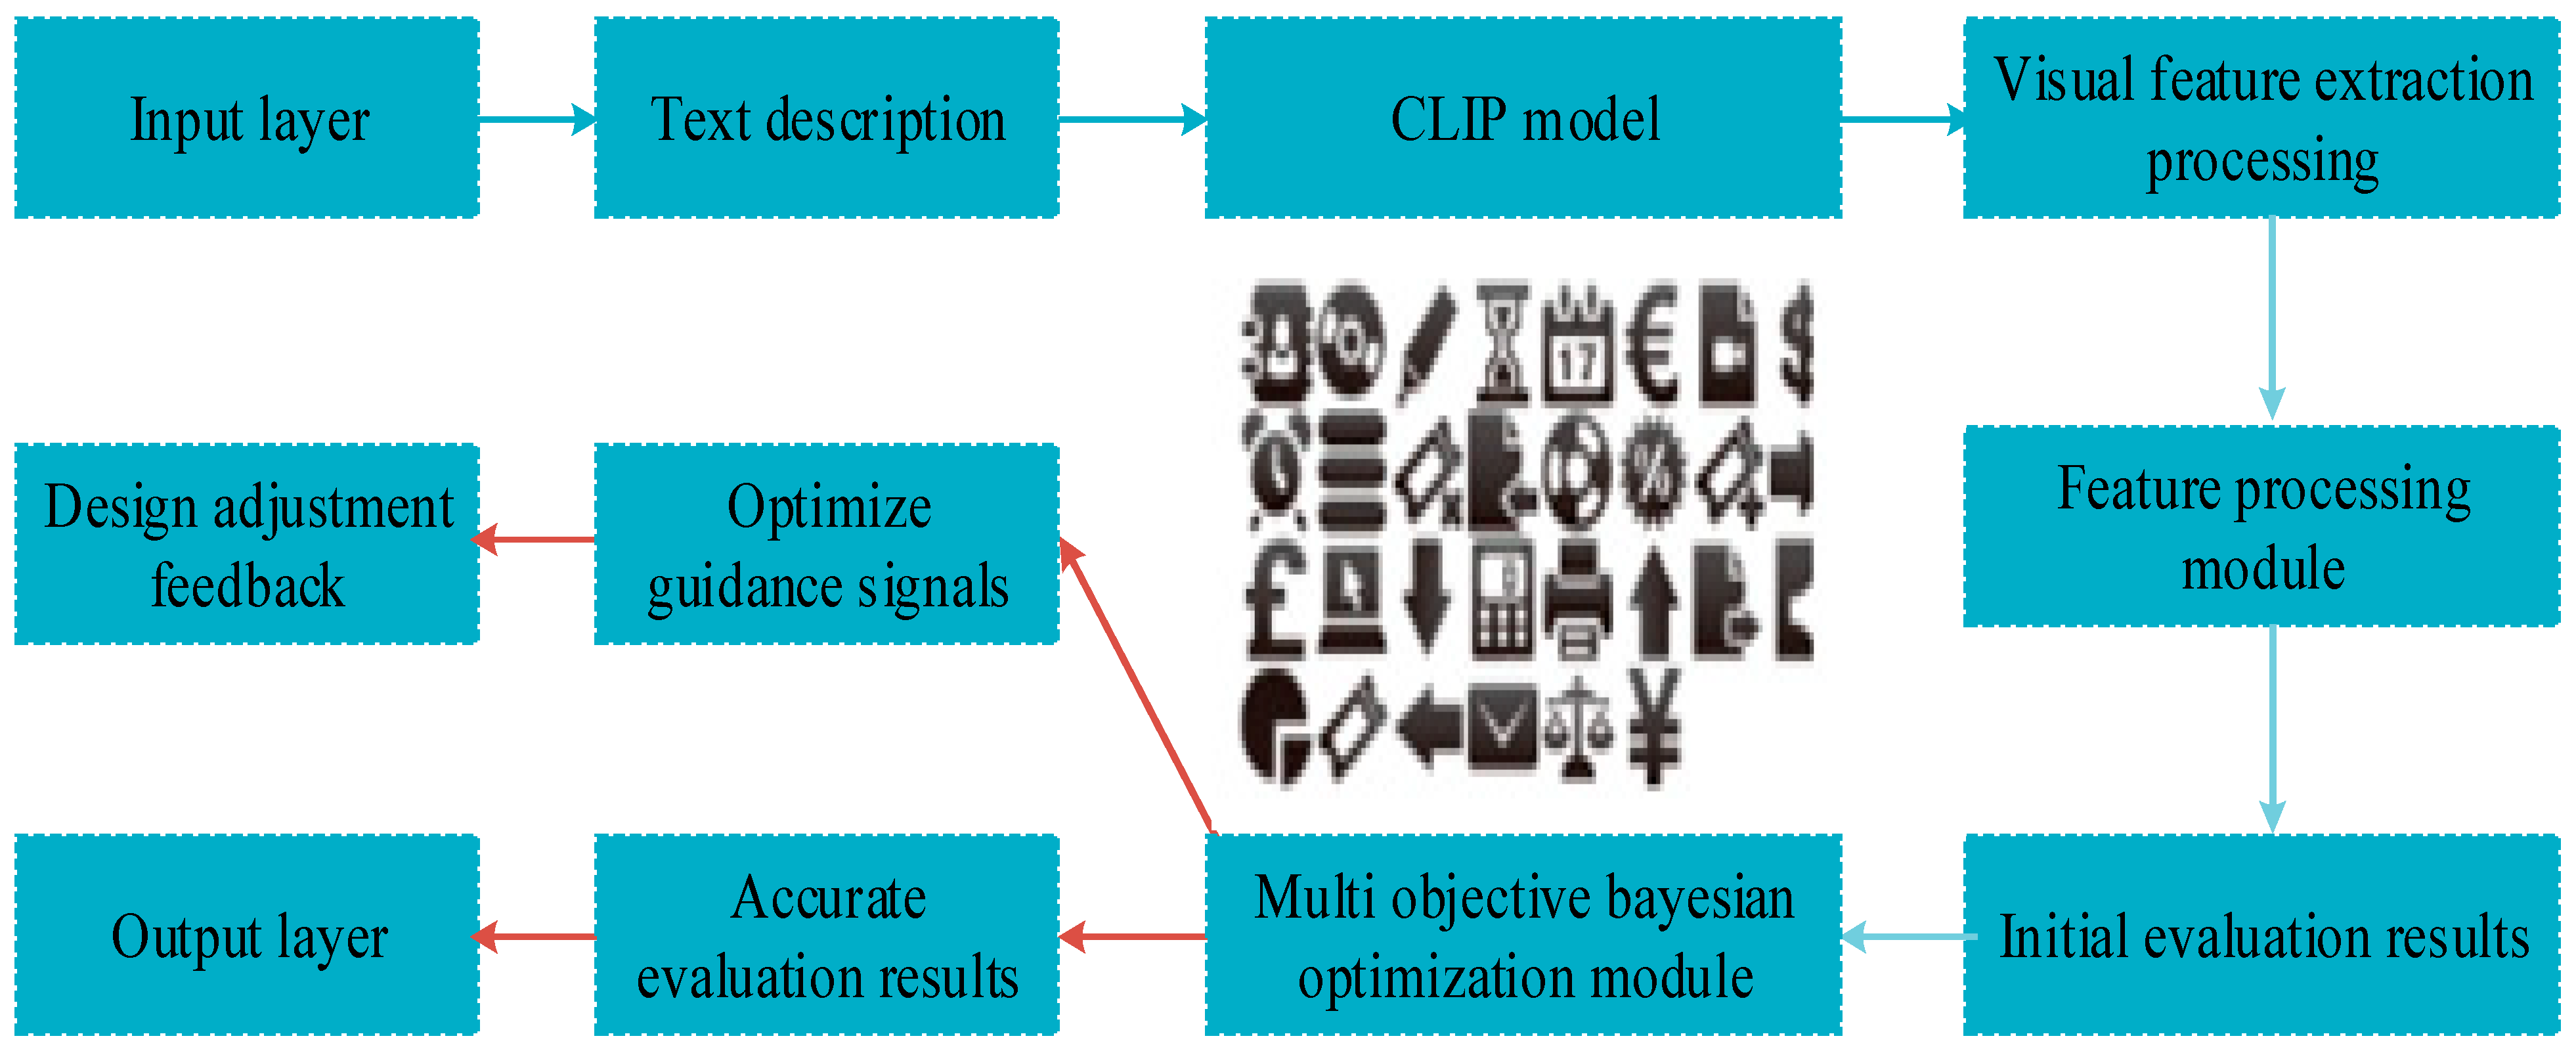
The research question is formulated as follows: The generative design for the facade of green buildings needs to simultaneously meet the LEED v4.1 certification indicators, the accuracy rate of regional cultural symbol recognition should be ≥92.7%, and the implicit carbon reduction throughout the life cycle should be 18.3% ± 1.5%. Furthermore, the efficiency of aesthetic design has been enhanced, and the environmental indicators, aesthetic evaluations, and functional requirements need to be balanced. The core assumption is that the proposed framework is designed to approximate a multimodal Pareto frontier under multiple sustainability and aesthetic constraints. Traditional design methods in sustainable aesthetic optimization have significant shortcomings such as strong subjectivity, low efficiency, and difficulty in quantitative evaluation. CLIP has a strong cross-modal alignment ability, which transforms textual descriptions of sustainability and aesthetic concepts into computable visual features. It also supports zero-shot evaluation and semantic-guided design optimization. However, CLIP has a limited understanding of domain-specific knowledge. Its accuracy is insufficient when evaluating technical sustainability indicators, and the computational cost is high. Multi-Objective Bayesian Optimization (MOBO) has advantages such as efficient exploration of high-dimensional spaces, accurate modeling of objective relationships, and active learning. It effectively balances multiple conflicting design objectives [14,15]. Therefore, MOBO is introduced into CLIP to form MOBO-CLIP. MOBO-CLIP constructs a dual-channel semantic calibration mechanism to inject domain prior knowledge into the CLIP visual–textual embedding space. It utilizes the Gaussian process surrogate model of MOBO to dynamically learn the nonlinear mapping relationship between the sustainable indicators and the CLIP visual features. Additionally, a lightweight adapter module is introduced to fine-tune the text encoder of CLIP, enabling it to accurately interpret various professional descriptions. MOBO-CLIP enhances the accuracy and efficiency of CLIP in sustainable design assessment through Bayesian optimization, while retaining its semantic understanding advantage. Its structure is shown in Figure 1.
As shown in Figure 1, the input layer of MOBO-CLIP receives textual descriptions that include sustainability and aesthetic concepts. These descriptions are the basic information for subsequent processing. The input text is passed to CLIP. CLIP transforms textual descriptions into computable visual features through cross-modal alignment, realizing the transformation from semantic information to quantitative features. The transformed features enter the feature processing module, where they are preliminarily processed to generate initial evaluation results. These results are then delivered to the MOBO module. The calculation of the posterior mean in the MOBO Gaussian process prediction is shown in Equation (1).
μ a 1 ( x ) = K ( x , X a 1 ) [ K ( X a 1 , X a 1 ) + σ 2 I ] 1 Y a 1
In Equation (1), μ a 1 ( x ) is the posterior mean of the objective function at input point x under a 1 observed points. K represents the covariance matrix, Y represents the function value, I is the identity matrix, σ 2 is the variance of observation noise, and X a 1 is the set of historical observations. The calculation of the posterior variance is shown in Equation (2).
σ a 1 2 ( x ) = K ( x , x ) K ( x , X a 1 ) [ K ( X a 1 , X a 1 ) + σ 2 I ] 1 K ( X a 1 , x )
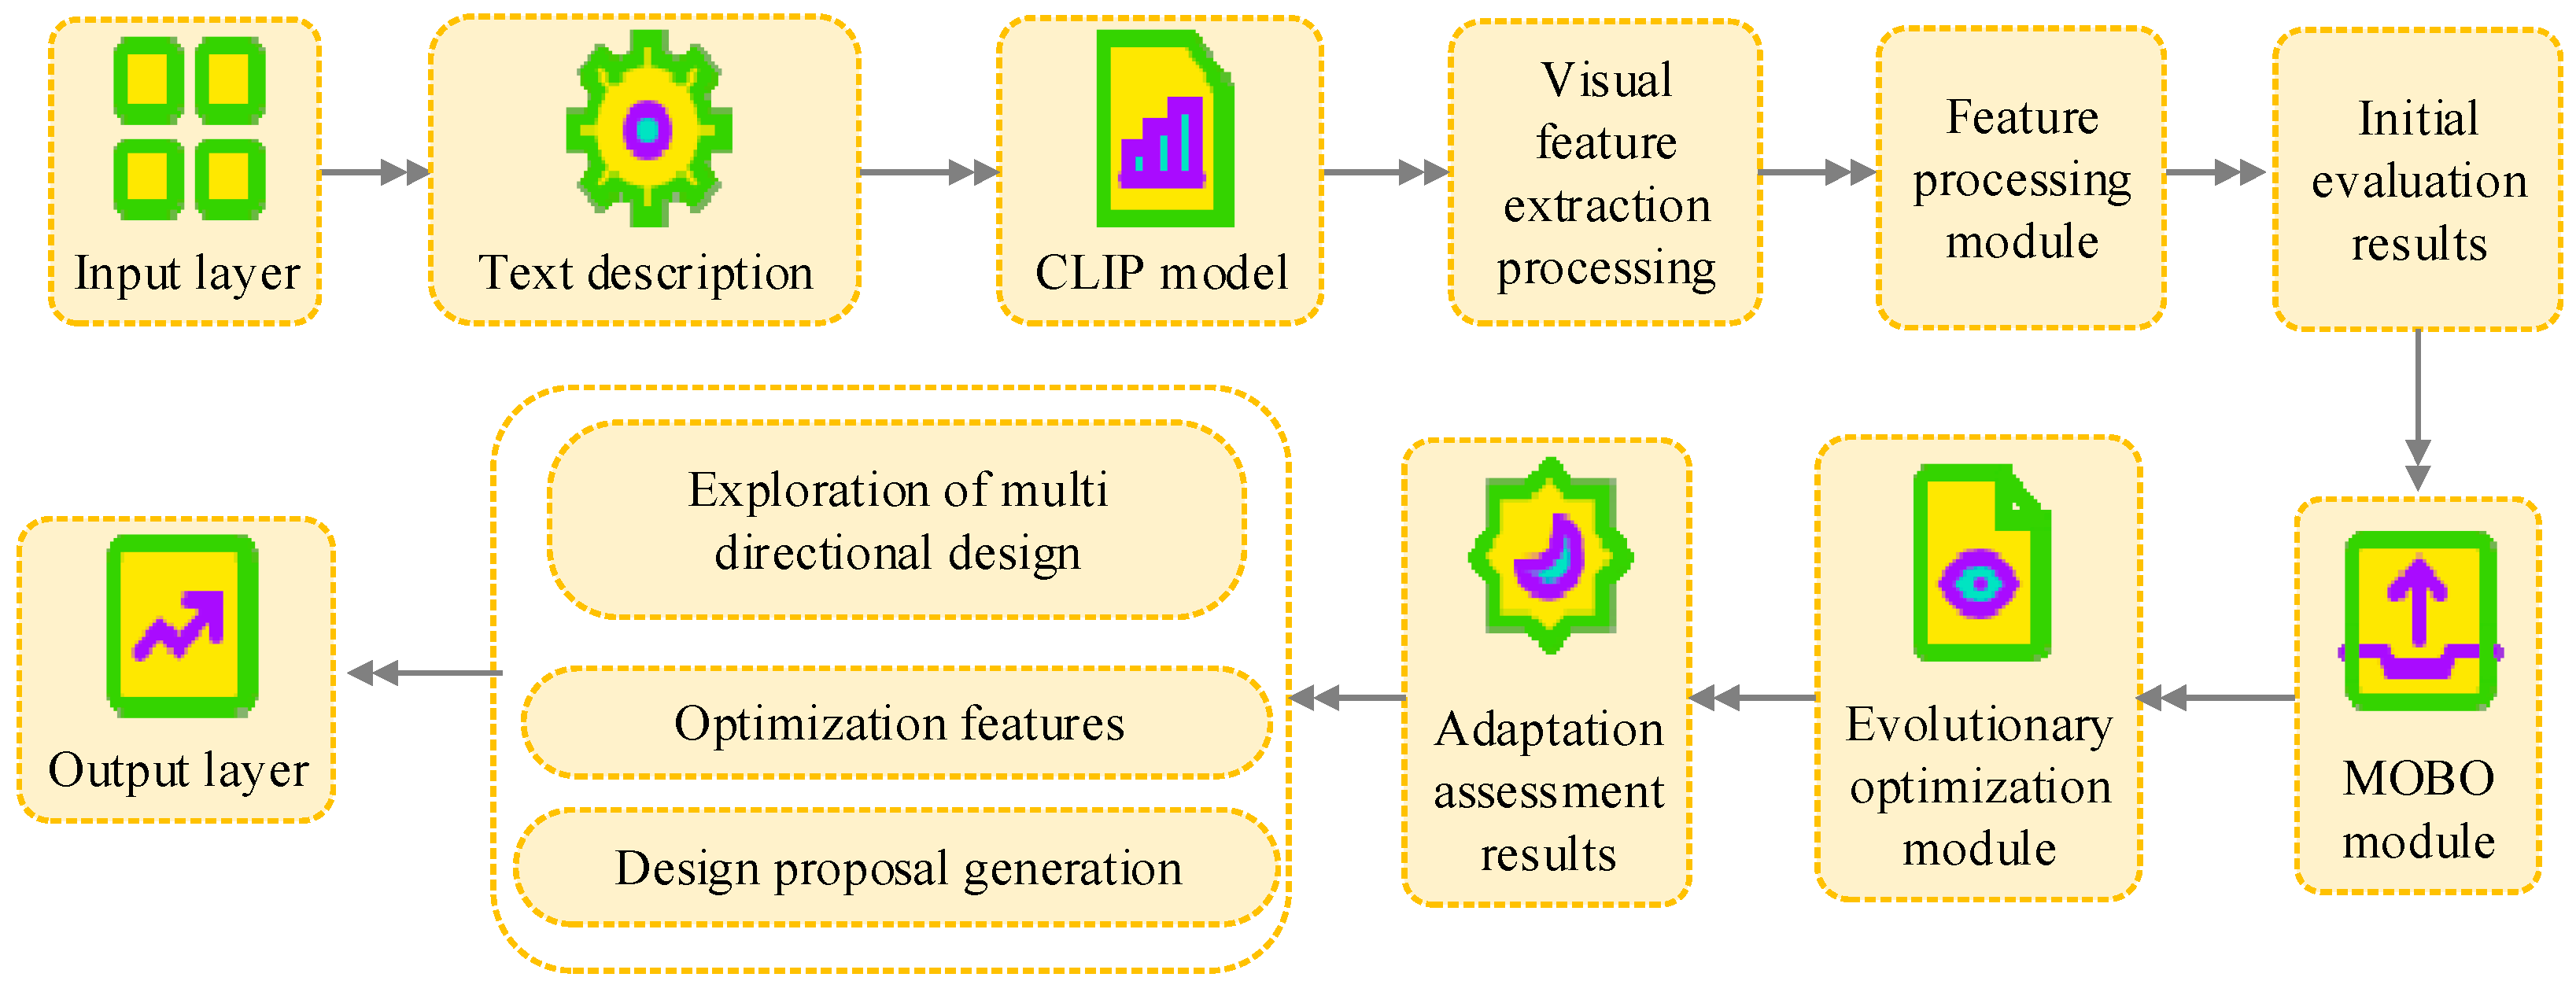
In Equation (2), σ a 1 2 ( x ) represents the posterior variance. Its strong adaptability to discontinuous and non-convex functions is suitable for subjective and complex aesthetic evaluation tasks [16]. Therefore, MOBO-CLIP is combined with evolutionary optimization to construct the CLIP-guided evolutionary optimization algorithm. The process is shown in Figure 2.
As shown in Figure 2, in the evolutionary optimization algorithm process guided by CLIP, the input layer receives text descriptions containing sustainability and aesthetic concepts and transmits them to the CLIP model. This model converts the text into visual features through cross-modal alignment. The feature processing module generates initial feature data and transmits it to the MOBO module for Bayesian optimization, outputting optimized features. The optimized features enter the evolutionary optimization module, where a population is used for parallel search to explore multiple design directions to generate solutions. The solution features are iteratively optimized through the feedback loop. Meanwhile, the evolutionary optimization module conducts adaptability assessment, and the results are output to the output layer. The calculation of the selection operation in evolutionary optimization is shown in Equation (3).
p i = f i j = 1 N f j
In Equation (3), p i represents the probability of individual i being selected. f represents the fitness value, N is the population size, and j is the index of individuals in the population. The calculation process of differential evolution in evolutionary optimization is shown in Equation (4).
C = b 1 + F ( b 2 b 3 )
In Equation (4), C represents the mutation vector. b is a randomly selected individual in the population, and F is the scaling factor.

2.3. Optimization of Evolutionary Optimization Algorithm Guided by CLIP

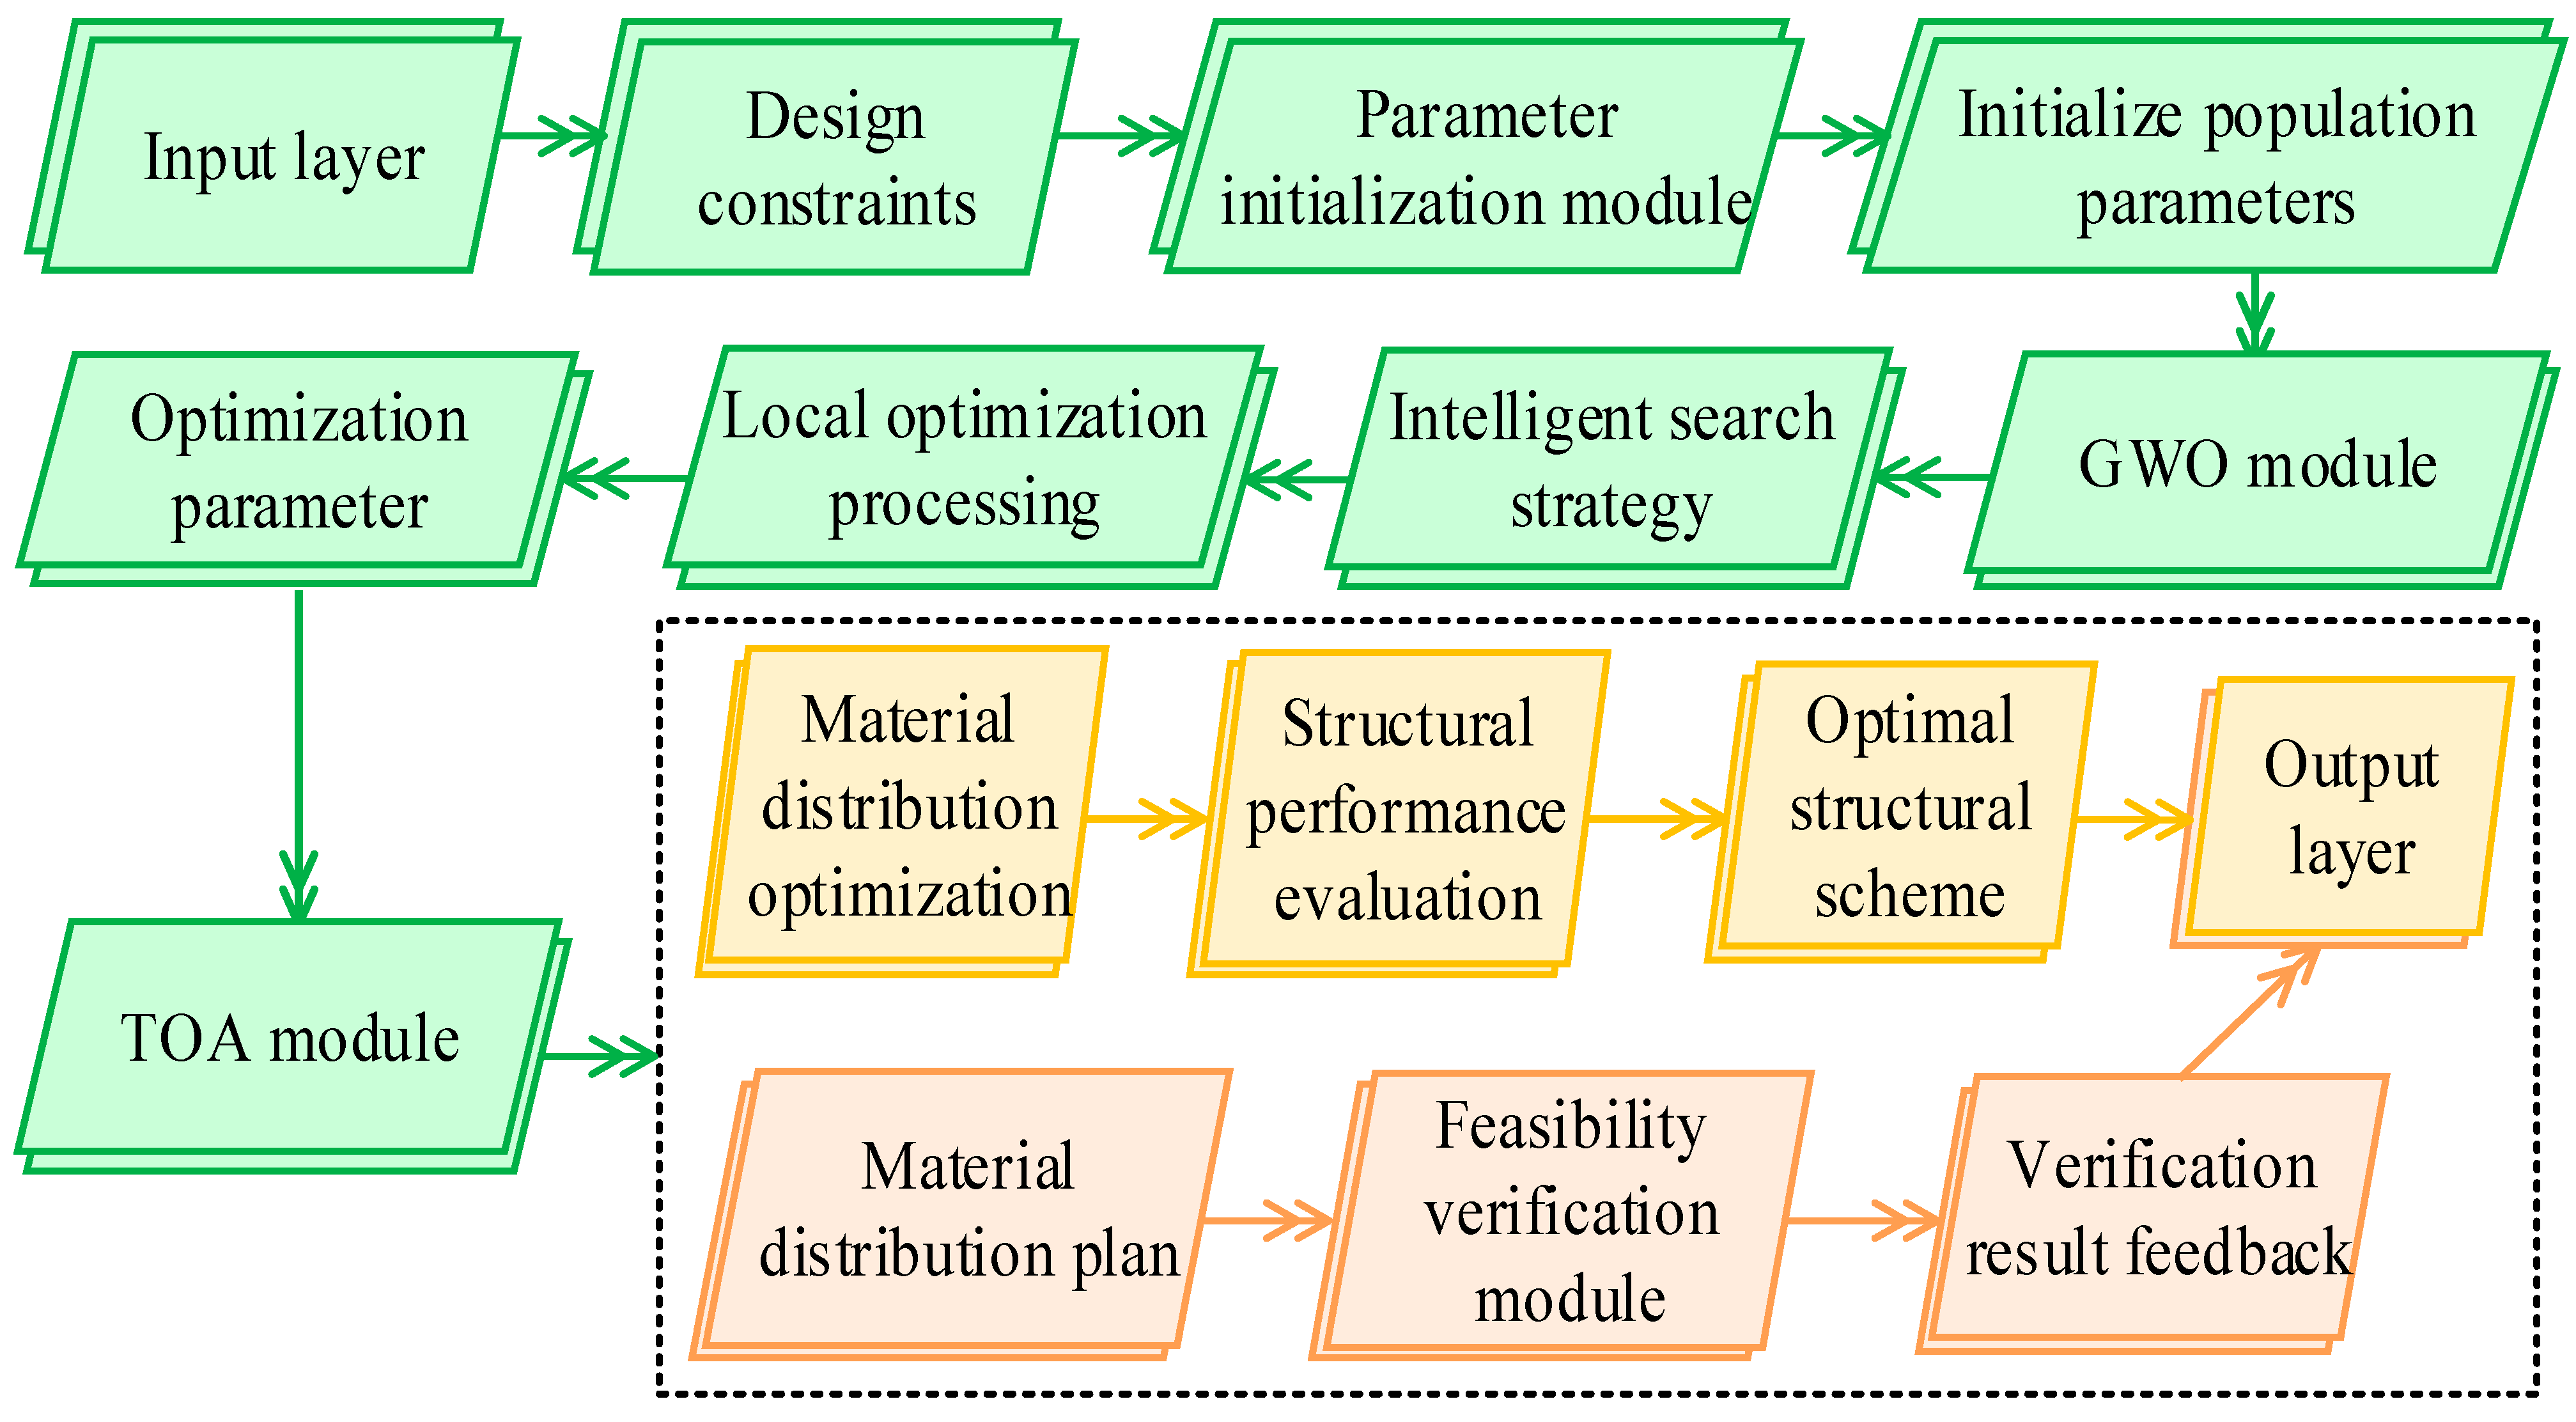
The evolutionary optimization algorithm guided by CLIP has limited ability to optimize engineering constraints such as structural mechanical properties, making it difficult for the design schemes to be practically applied. However, the hybrid algorithm GWO-TOA, which combines the topology optimization algorithm (TOA) with the gray wolf optimizer (GWO), can precisely control the distribution of materials and achieve the optimal balance between structural lightweighting and mechanical performance [17,18]. Moreover, GWO-TOA can enhance the local search ability through intelligent population strategies, improving the engineering feasibility of the structural schemes [19,20]. Therefore, this study introduces GWO-TOA into the evolutionary optimization algorithm guided by CLIP. By integrating the intelligent search strategy of GWO and the material distribution optimization ability of TOA, it compensates for the deficiency of the original algorithm in terms of engineering feasibility. The structure of GWO-TOA is shown in Figure 3.
As shown in Figure 3, the constraints of the input layer of GWO-TOA are passed to the parameter initialization module, which generates the initial population parameters based on the constraints. The initial population parameters enter the GWO module, and the parameters processed by the GWO module then enter the local optimization processing stage. The locally optimized parameters are sent to the TOA module, and the material distribution scheme output by the TOA module is, on one hand, sent to the structural performance evaluation stage, and the evaluation result is returned through the feedback loop to the GWO module to form an iterative optimization mechanism to continuously improve the search direction. The evaluation indicators include the environmental impact score of the structure, the carbon footprint estimation, and the sustainability index, etc. The material distribution scheme enters the feasibility verification module, and the verification result is also fed back to the TOA module. After multiple rounds of iterative optimization, the optimal structural scheme is finally generated and sent to the output layer. The calculation of the TOA material interpolation model is shown in Equation (5).
E e = E m i n + ρ e q ( E 0 E m i n )
In Equation (5), E e is the effective Young’s modulus of element e . ρ is the density design variable, and q is the penalty factor. The calculation of the TOA global stiffness matrix assembly is shown in Equation (6).
S = e S e ( E e ( ρ e ) )
In Equation (6), S represents the global stiffness matrix. The hybrid algorithm that introduces GWO-TOA into the CLIP-guided evolutionary optimization algorithm is named the GTC algorithm. Its process is shown in Figure 4.
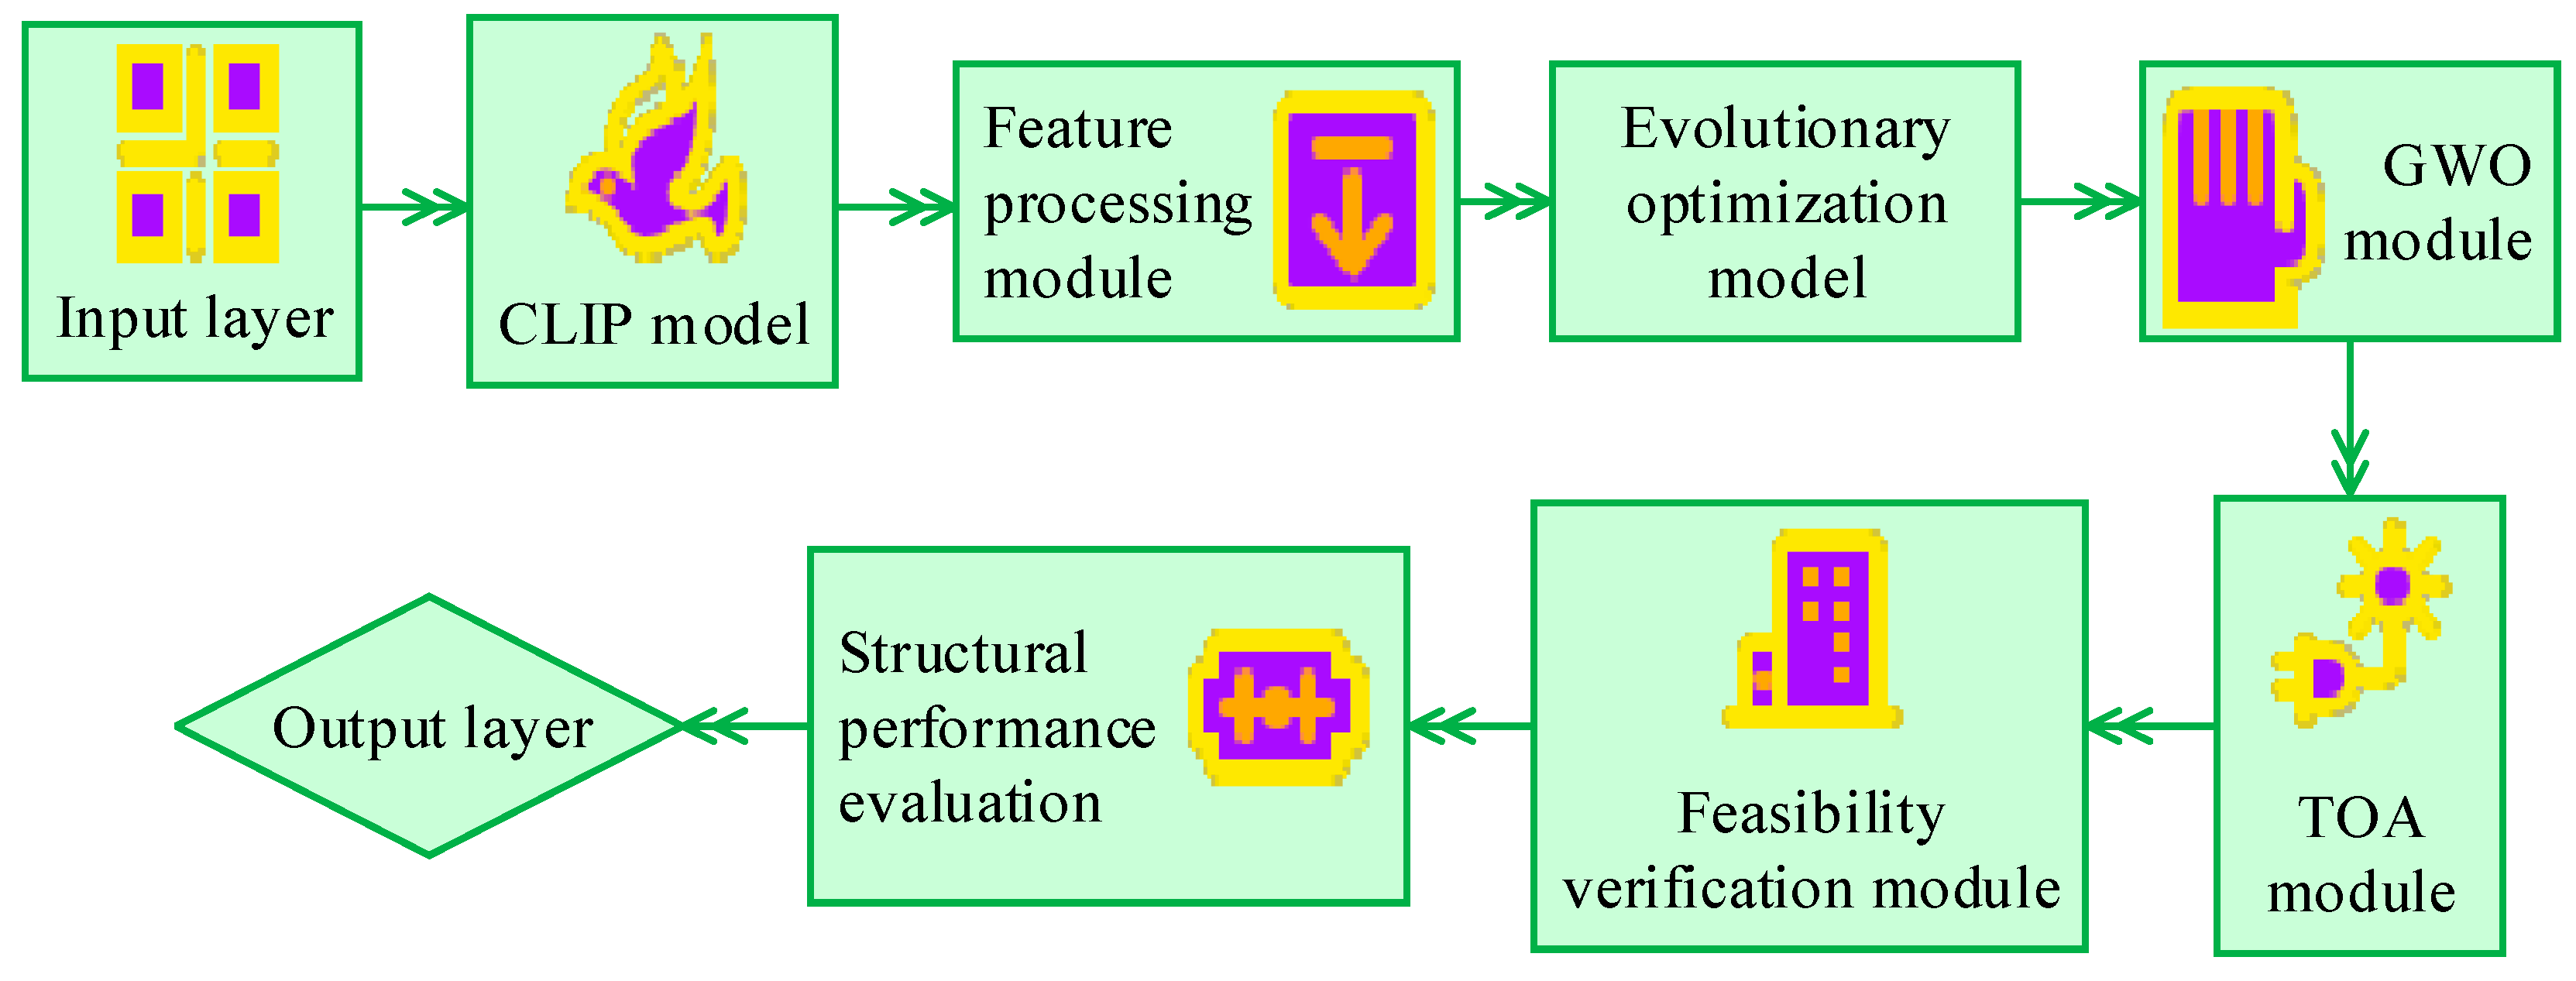
As shown in Figure 4, the design requirements at the input layer are passed to CLIP, which transforms textual descriptions into computable visual features. In this process, semantic features related to environmental impact and material ecology are especially extracted. The transformed features go into the feature processing module, which generates initial data. The data is then delivered to the evolutionary optimization module, where multi-directional exploration generates initial design directions. The output of this module enters the GWO module. GWO applies intelligent search strategies to refine design directions. The processed data then goes to the TOA module, which regulates material distribution and balances lightweight structure with mechanical performance. This process optimizes both structural environmental performance and resource efficiency. The output of the TOA module enters the structural performance evaluation stage. The results are fed back to the GWO module to form an iterative optimization loop, and optimized performance data is returned to the feature processing module. At the same time, the design forms generated by TOA enter the feasibility verification module. The verification results are fed back to the evolutionary optimization module to ensure manufacturing feasibility. The final design scheme is sent to the output layer. The calculation of the GWO position update is shown in Equation (7).
W n = 1 3 ( U α + U β + U δ )
In Equation (7), W n is the position of a gray wolf after n iterations, and α , β , and δ are the update vectors of wolves. The calculation of the GWO exploration coefficient decay is shown in Equation (8).
h = 2 ( 1 n M )
In Equation (8), h is the key parameter for balancing exploration and exploitation, and M is the maximum number of iterations.

2.4. Construction of CLIP-Guided Evolutionary Optimization Model for Green Design Concepts

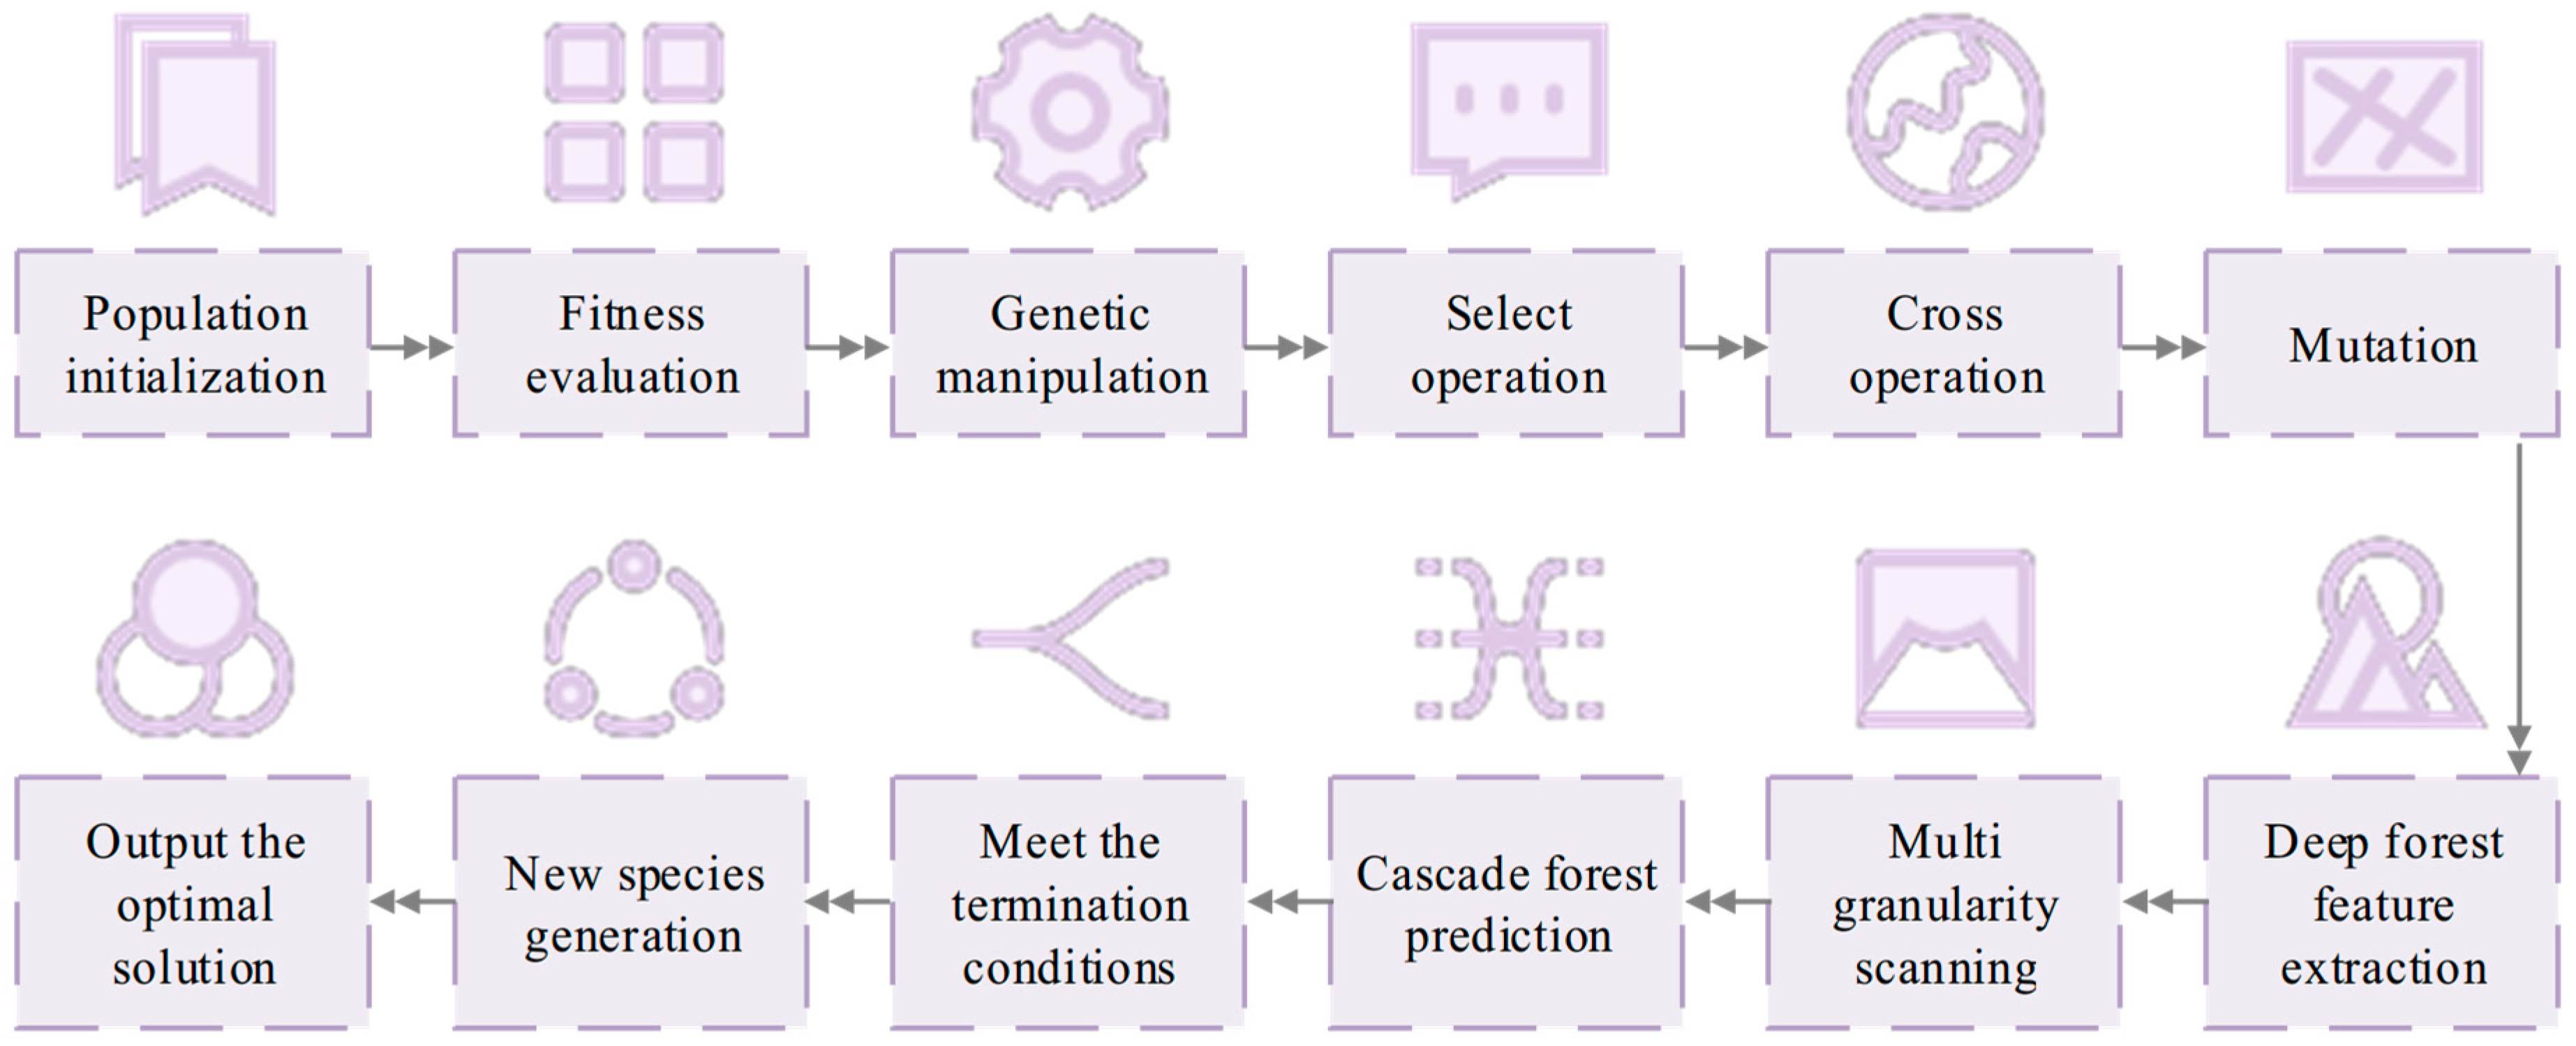
The GTC algorithm has the disadvantages of high computational complexity and sensitivity to local optimal solutions. In sustainable design applications, these drawbacks may prevent the discovery of truly environment-optimal design solutions. Genetic Algorithms (GAs) have a strong global search ability and population diversity maintenance, which are suitable for solving high-dimensional nonlinear optimization problems [21,22]. In the context of green design, GA effectively explores environmentally friendly solutions in large-scale design spaces. Deep forest (DF) maintains an excellent feature learning ability through multi-granularity scanning and cascade forest structure, even under small-sample conditions [23,24]. This study combines GA and DF to form the GA-DF hybrid algorithm, which integrates the advantages of both. Particle Swarm Optimization (PSO) has a fast convergence speed and simple parameter settings, and it performs well in continuous space optimization [25,26]. Convolutional Neural Network (CNN) has unique advantages in image feature extraction due to local connections and weight sharing [27,28]. This study combines PSO and CNN to form the CNN-PSO hybrid optimization framework. By introducing GA-DF and CNN-PSO into GTC, an improved GTC algorithm is obtained. This multi-algorithm fusion strategy is expected to enhance the performance of GTC in sustainable aesthetic design optimization. The optimization mechanism of GA-DF for GTC is shown in Figure 5.
As shown in Figure 5, the GA-DF hybrid algorithm generates diverse design solutions through the initial population generation module. These solutions then enter the fitness evaluation stage, where the CLIP-guided sustainable aesthetic evaluation function scores each individual across multiple dimensions. After evaluation, the system checks whether the termination condition is met. If not, the genetic operation part first executes the selection process, retaining high-fitness individuals based on strategies such as roulette wheel or tournament selection. Then the crossover operation recombines design features, followed by mutation to introduce innovative changes. After genetic operations, DF processes the population. It first extracts design features at different scales through multi-granularity scanning, and then performs multi-level prediction through a cascade forest structure. The prediction results of DF guide the generation of a new population, forming an optimized design solution set. The new population re-enters the fitness evaluation stage, forming a closed-loop optimization system. When the termination condition is satisfied, the algorithm outputs the current optimal solution. The final solution set contains the environment–aesthetic–economic-optimal solutions on the Pareto front. The GA roulette wheel selection probability is shown in Equation (9).
P i = ϕ i s = 1 ϕ i
In Equation (9), P represents the probability, ϕ represents the fitness value of individuals in the population, and s represents the summation index. The GA real-coded arithmetic crossover is shown in Equation (10).
C h i l d = λ P a r 1 + ( 1 λ ) P a r 2
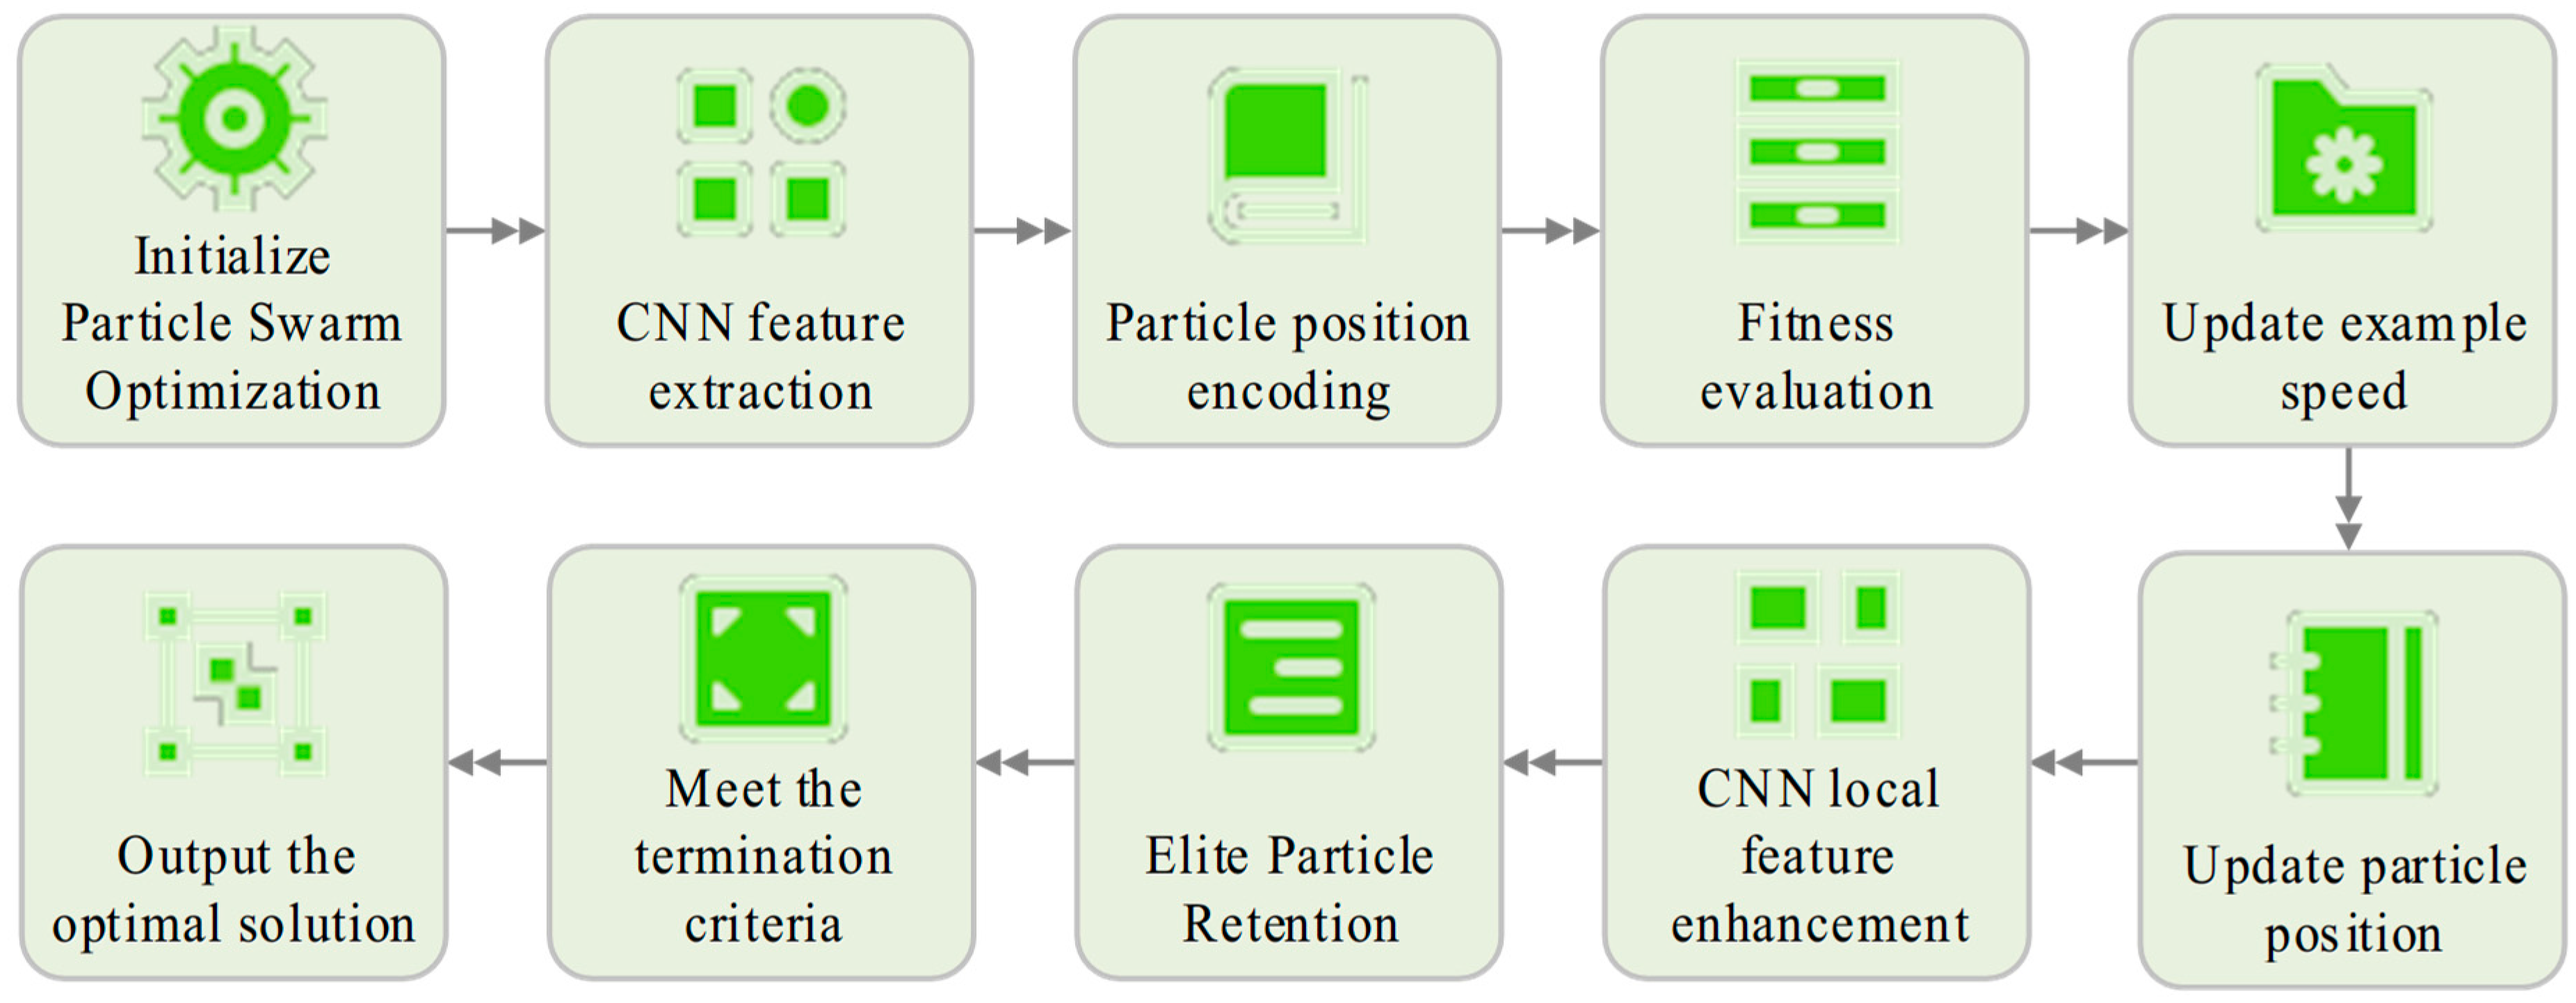
In Equation (10), λ represents the random weight factor, and P a r represents the parent solution vector. The flowchart for CNN-PSO is shown in Figure 6.
As shown in Figure 6, the CNN-PSO hybrid optimization framework starts with particle swarm initialization. The system randomly generates a group of particles representing potential design solutions. Each particle encodes design parameters in a position vector, which contains environmental parameters and sustainability indicators. The system then enters the CNN feature extraction stage. A multi-layer convolutional structure extracts multi-scale features of design solutions, obtaining distributed representations of key visual features such as shape, texture, and material. The extracted feature vectors are normalized and mapped into particle position space to form optimizable parameter encodings. In the core optimization loop, each particle is evaluated by a CLIP-guided fitness function, which integrates sustainability indicators, aesthetic scores, and functional requirements. After evaluation, the algorithm checks termination conditions. If unmet, particle updating begins. Velocity and position are updated according to individual historical best and global best, with inertia weight linearly decreasing to balance exploration and exploitation. The updated particle positions are fine-tuned using CNN local receptive fields, especially for local features such as material texture and shape details. The updated particles re-enter the evaluation stage to form a closed-loop optimization. The algorithm outputs the Pareto optimal solution set when the maximum iteration number or convergence threshold is satisfied. The PSO position updating equation is shown in Equation (11).
r n e w = r o l d + u n e w
In Equation (11), r n e w represents the updated particle position, r o l d represents the current particle position, and u n e w represents the updated particle velocity. The PSO inertia weight linear decreasing strategy is shown in Equation (12).
ω t = ω m a x ( ω m a x ω m i n ) n M
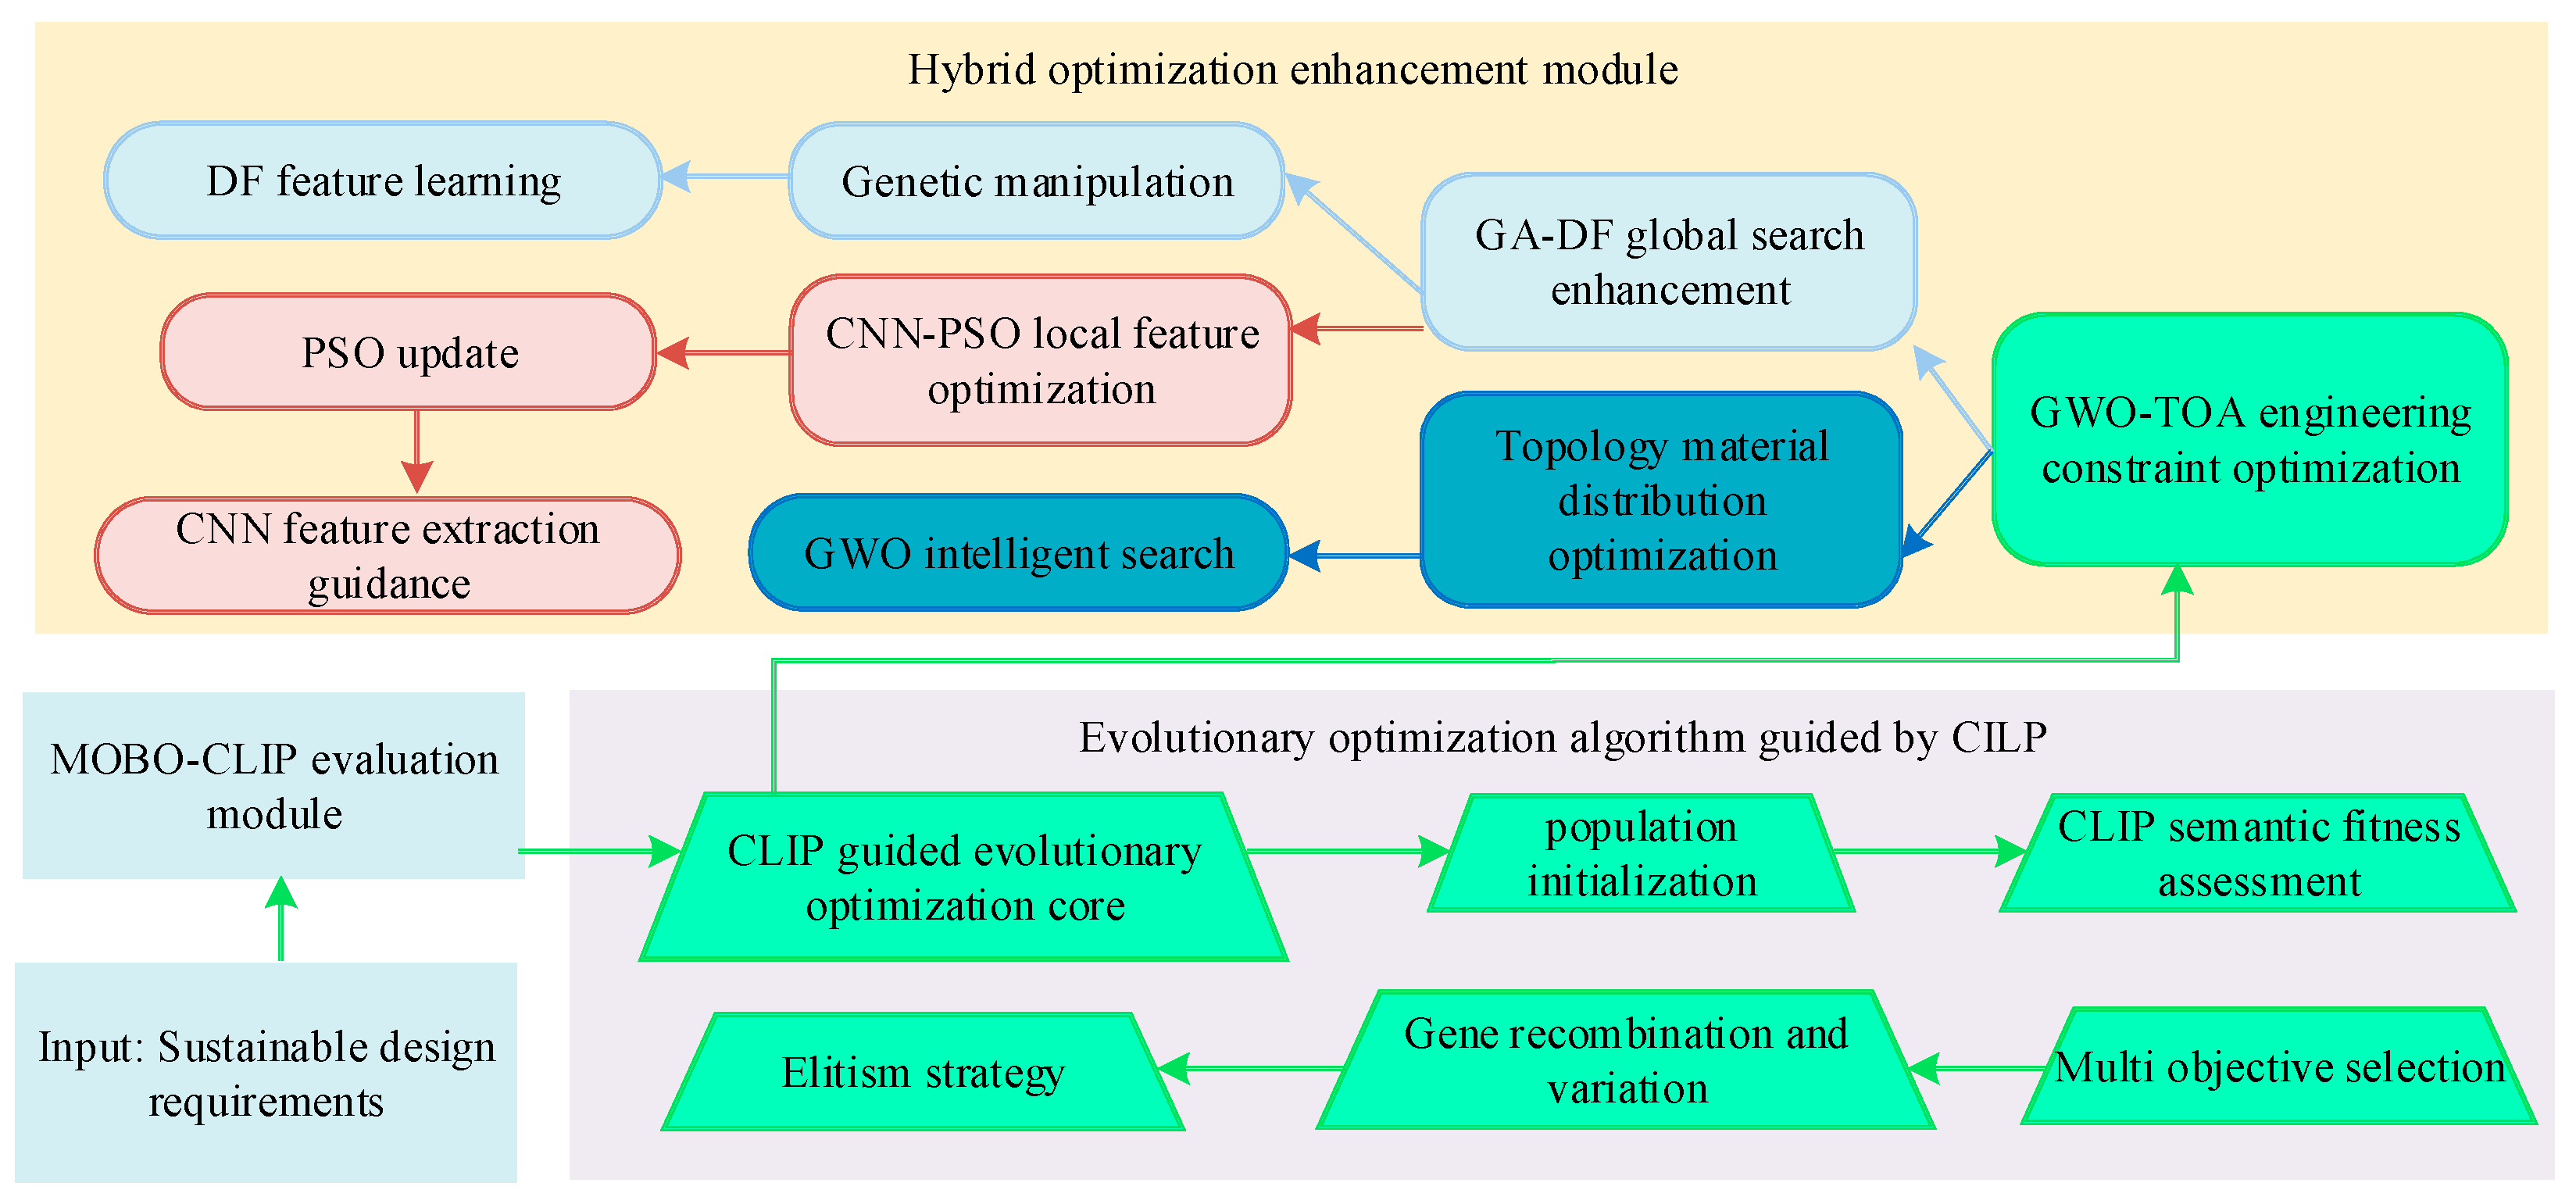
In Equation (12), ω represents the inertia weight. By introducing GA-DF and CNN-PSO into GTC, a hybrid algorithm based on GTC is formed. On this basis, a CLIP-guided evolutionary optimization model for green design concepts is proposed. The structure is shown in Figure 7.
As shown in Figure 7, the CLIP-guided evolutionary optimization model for green design concepts starts with receiving sustainable design requirements. First, the MOBO-CLIP evaluation module converts textual environmental and aesthetic concepts into quantifiable cross-modal indicators, building a multi-dimensional evaluation system with environmental parameters, ecological indicators, and sustainability measures. Then, the CLIP-guided evolutionary optimization core calculates the semantic fitness of each solution in sustainability and aesthetics dimensions based on CLIP’s text–image alignment ability. The fitness calculation considers environmental performance, economy, and social acceptance. The Pareto-based multi-objective selection retains elite individuals, and the elitism strategy ensures high-quality solutions are not lost, forming a closed-loop optimization. At the same time, the GWO-TOA engineering constraint module is activated. The topology optimization algorithm applies the SIMP method to precisely control material density distribution for lightweight design. The CNN-PSO local optimization module also works. The particle swarm updates design parameters dynamically, while CNN with a three-layer structure extracts texture features to guide fine local adjustments. The CNN convolutional layer output is shown in Equation (13).
O ( ζ , ψ ) = u = 0 H 1 v = 0 ζ 1 A ( ψ + ξ , c + v ) G ( ξ , v ) + d
In Equation (13), O ( ζ , ψ ) represents the value of the output feature map at position ( ζ , ψ ) , A represents the input feature map, G represents the convolution kernel, d represents the bias term, ψ represents the row index of the output feature map, c represents the column index of the output feature map, ξ represents the row index of the convolution kernel, v represents the column index of the convolution kernel, H represents the height of the kernel, and W represents the width of the kernel. The CNN activation function is shown in Equation (14).
τ = m a x ( 0 , τ )
In Equation (14), τ represents the input value. The CNN max pooling layer is shown in Equation (15).
ι ( ζ , ψ ) = max ξ = 0 ς 1   max v = 0 ς 1   ϑ ( ζ χ + ξ , c χ + v )
In Equation (15), ι represents the pooling output at position, ϑ represents the input feature map, ς represents the size of the pooling window, and χ represents the stride.
Based on the above content, the research first uses MOBO-CLIP as the top-level strategy controller to coordinate the global optimization objectives and multimodal constraints, dynamically schedule GTC for gradient trajectory calibration, and construct graph topology encoding to capture the structural dependencies among features. Then, the calibrated parameters are input into GWO-TOA to execute wolf collaborative optimization, and the feedback is continuously provided to MOBO-CLIP to update the Pareto front in the iterations. GA-DF implements differential variation at the population level to enhance diversity, and its output is weighted by CNN-PSO for spatial feature addition and particle velocity correction.
The reason for choosing these components to design such a complex model to achieve generative sustainable aesthetic design is that sustainable aesthetic design needs to seek a multi-objective dynamic balance among functionality, ecology, culture, and sensory experience. A single algorithm makes it difficult to balance global convergence, local precision, and cross-modal semantic consistency. MOBO-CLIP provides interpretable navigation for the Pareto optimal solution set, GTC ensures the physical realizability of the gradient flow in the high-dimensional design space, GWO-TOA enhances topological robustness, GA-DF avoids premature convergence, and CNN-PSO embeds visual perception features into the optimization kernel, making the generated results both comply with engineering constraints and improve visual consistency and local feature coherence. To reduce unnecessary computational overhead, the framework includes an adaptive weighting strategy for different optimization modules during iteration. Modules with limited contribution to performance improvement are assigned lower weights in subsequent iterations.

2.5. Statistical Analysis

All experiments were repeated 30 times under the same random seed settings, and the results are reported as mean ± standard deviation. Statistical differences between the proposed model and benchmark methods were evaluated using one-way ANOVA followed by post hoc multiple comparison tests. A p-value < 0.05 was considered statistically significant.

3. Results

3.1. Performance Comparison Analysis of GTC

These datasets were used for preliminary benchmarking of optimization stability and feature discrimination, rather than as direct substitutes for real-world sustainable product design datasets. To verify the performance of GTC, it was compared with Bayesian Optimization combined with Radial Basis Function Neural Network (BO-RBFNN), Third Version of the Non-dominated Sorting Genetic Algorithm combined with Random Forest (NSGAIII-RF), and MOBO combined with Deep Neural Network (MOBO-DNN). The experimental system used Ubuntu 20.04 with Linux as the operating system, TensorFlow 2.8 as the deep learning framework, Adam as the optimizer, Python 3.8 as the programming language, NVIDIA RTX 3090 as the GPU, and 128 GB memory. The datasets were MNIST and RGBT tracking. These two datasets were used as preliminary benchmarking datasets for evaluating optimization stability and cross-modal feature discrimination. MNIST provides a standardized morphological benchmark, while the RGBT dataset offers complementary multimodal information. They were not intended to replace real-world sustainable product design datasets, but to support algorithm-level validation before application-oriented evaluation.
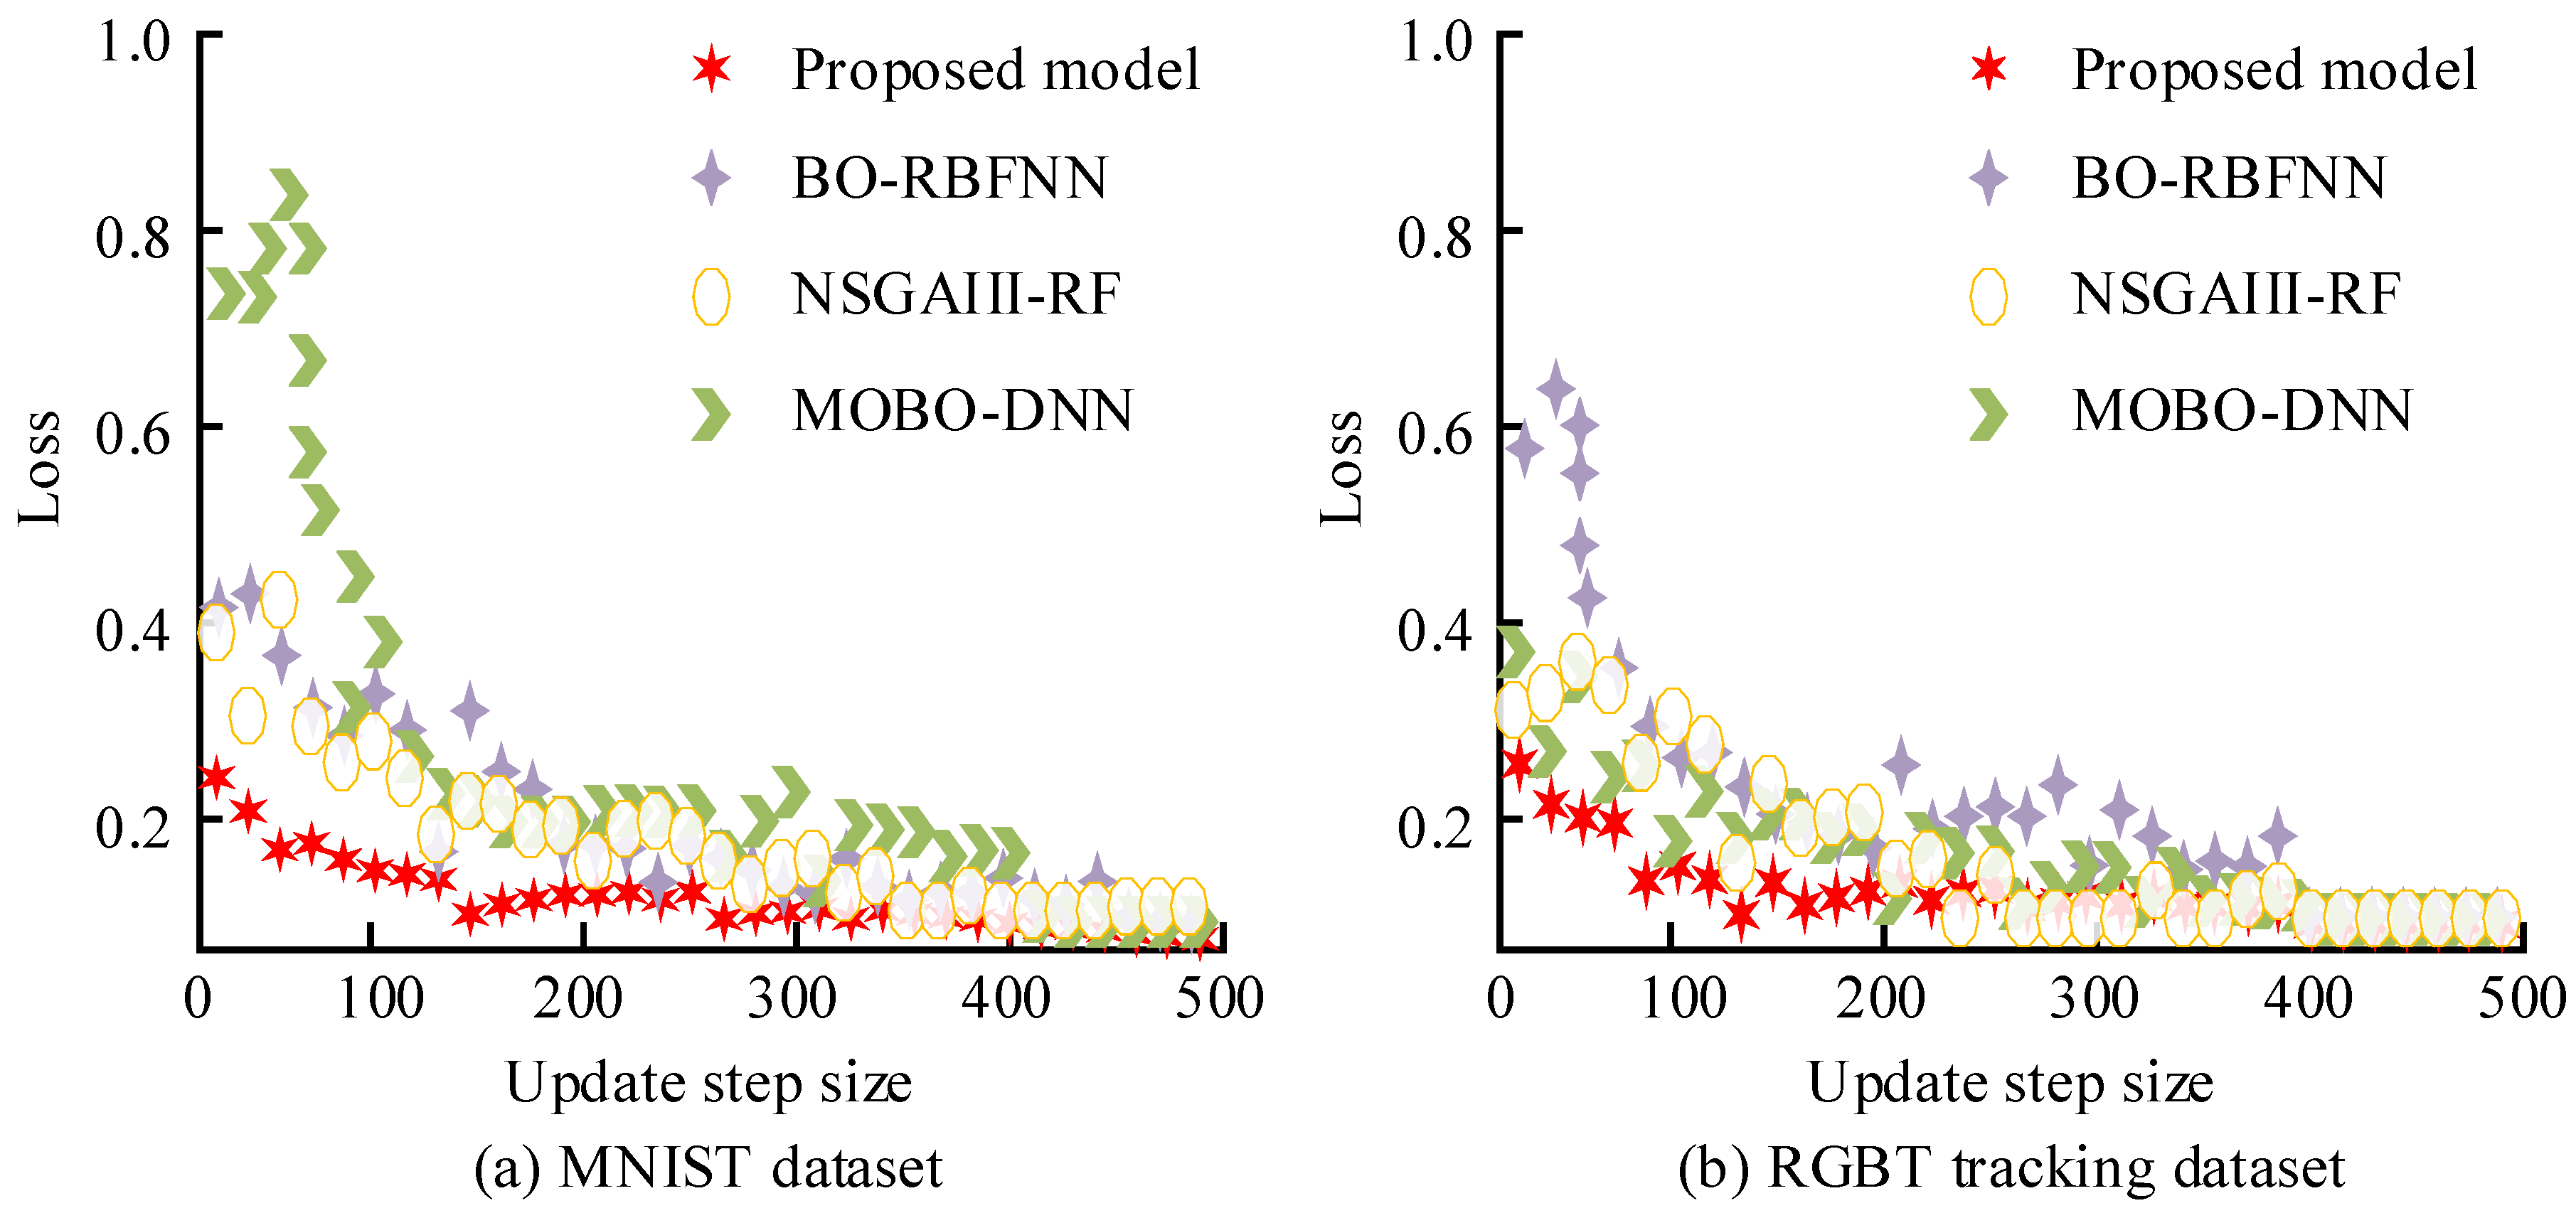
The specific mechanism for conducting sustainable product design tasks using these two datasets is as follows: Firstly, map the MNIST samples to the topological aesthetics space and extract the curvature entropy of strokes and the symmetry distance of connected domains; then, through the RGBT dual-modal feature aligner, calculate the mutual information gain of the thermal radiation gradient and the visible light edge response. All evaluation indicators are uniformly normalized to the [0, 1] interval and a comprehensive sustainable aesthetics score function is constructed through a weighted geometric mean. The population size of the evolutionary algorithm is 200, and the maximum number of iterations is 150. For Bayesian optimization, the initial sampling point number is set to 12, and the acquisition function adopts the EI strategy. All models are run 30 times with the same random seed to eliminate randomness. The loss value results of GTC and comparison algorithms on different datasets with varying update steps are shown in Figure 8.
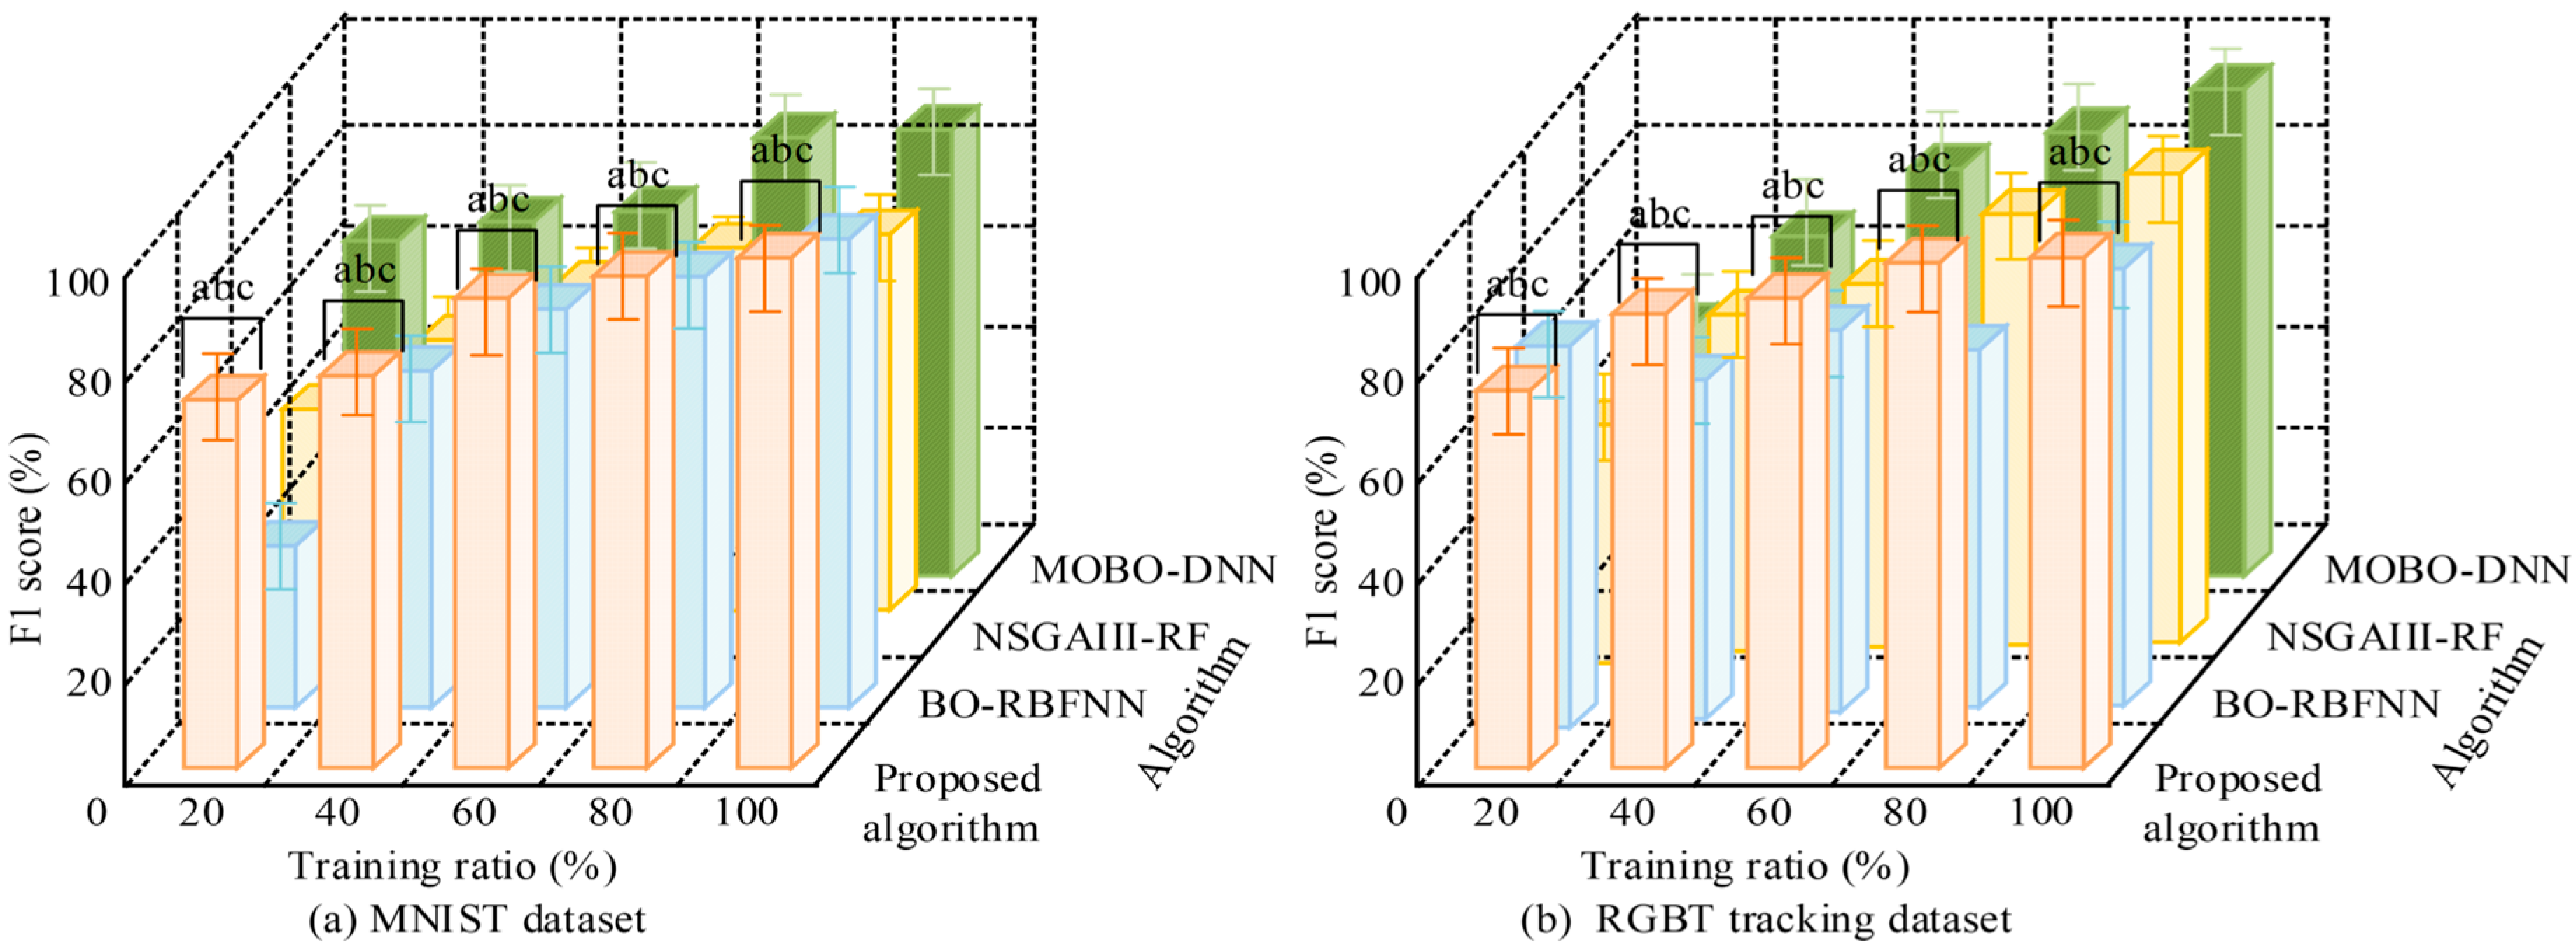
As shown in Figure 8a, on the MNIST dataset the initial loss of GTC was 0.29. It dropped rapidly to 0.08 after 150 iterations and finally stabilized between 0.02 and 0.05, which was significantly better than comparison algorithms. NSGAIII-RF showed relatively low overall loss with an average of 0.18, but when the update step reached 300, its loss slightly rebounded, which made it inferior to GTC. As shown in Figure 8b, on the RGBT dataset the initial loss of GTC was 0.26. After 901 iterations it dropped to 0.07 and finally converged to 0.01, which was also much better than comparison algorithms. In summary, GTC performed best. Then, the F1 score performance of the four algorithms under different training ratios was compared, and the results are shown in Figure 9.
As shown in Figure 9a, on the MNIST dataset the F1 score of GTC reached 76.6% at a training ratio of 20.0% and increased to 93.5% at 60.0%. BO-RBFNN achieved a higher F1 score than GTC at a ratio of 40.0%, but its growth was smaller as the ratio increased. At 60.0% its score even slightly decreased. As shown in Figure 9b, on the RGBT dataset the F1 score of GTC exceeded 90.0% already at a training ratio of 40.0% and kept increasing as the ratio grew. Its score rose steadily and was better than comparison algorithms. Then, the accuracy and loss rate of the four algorithms were compared, and the results are shown in Figure 10.
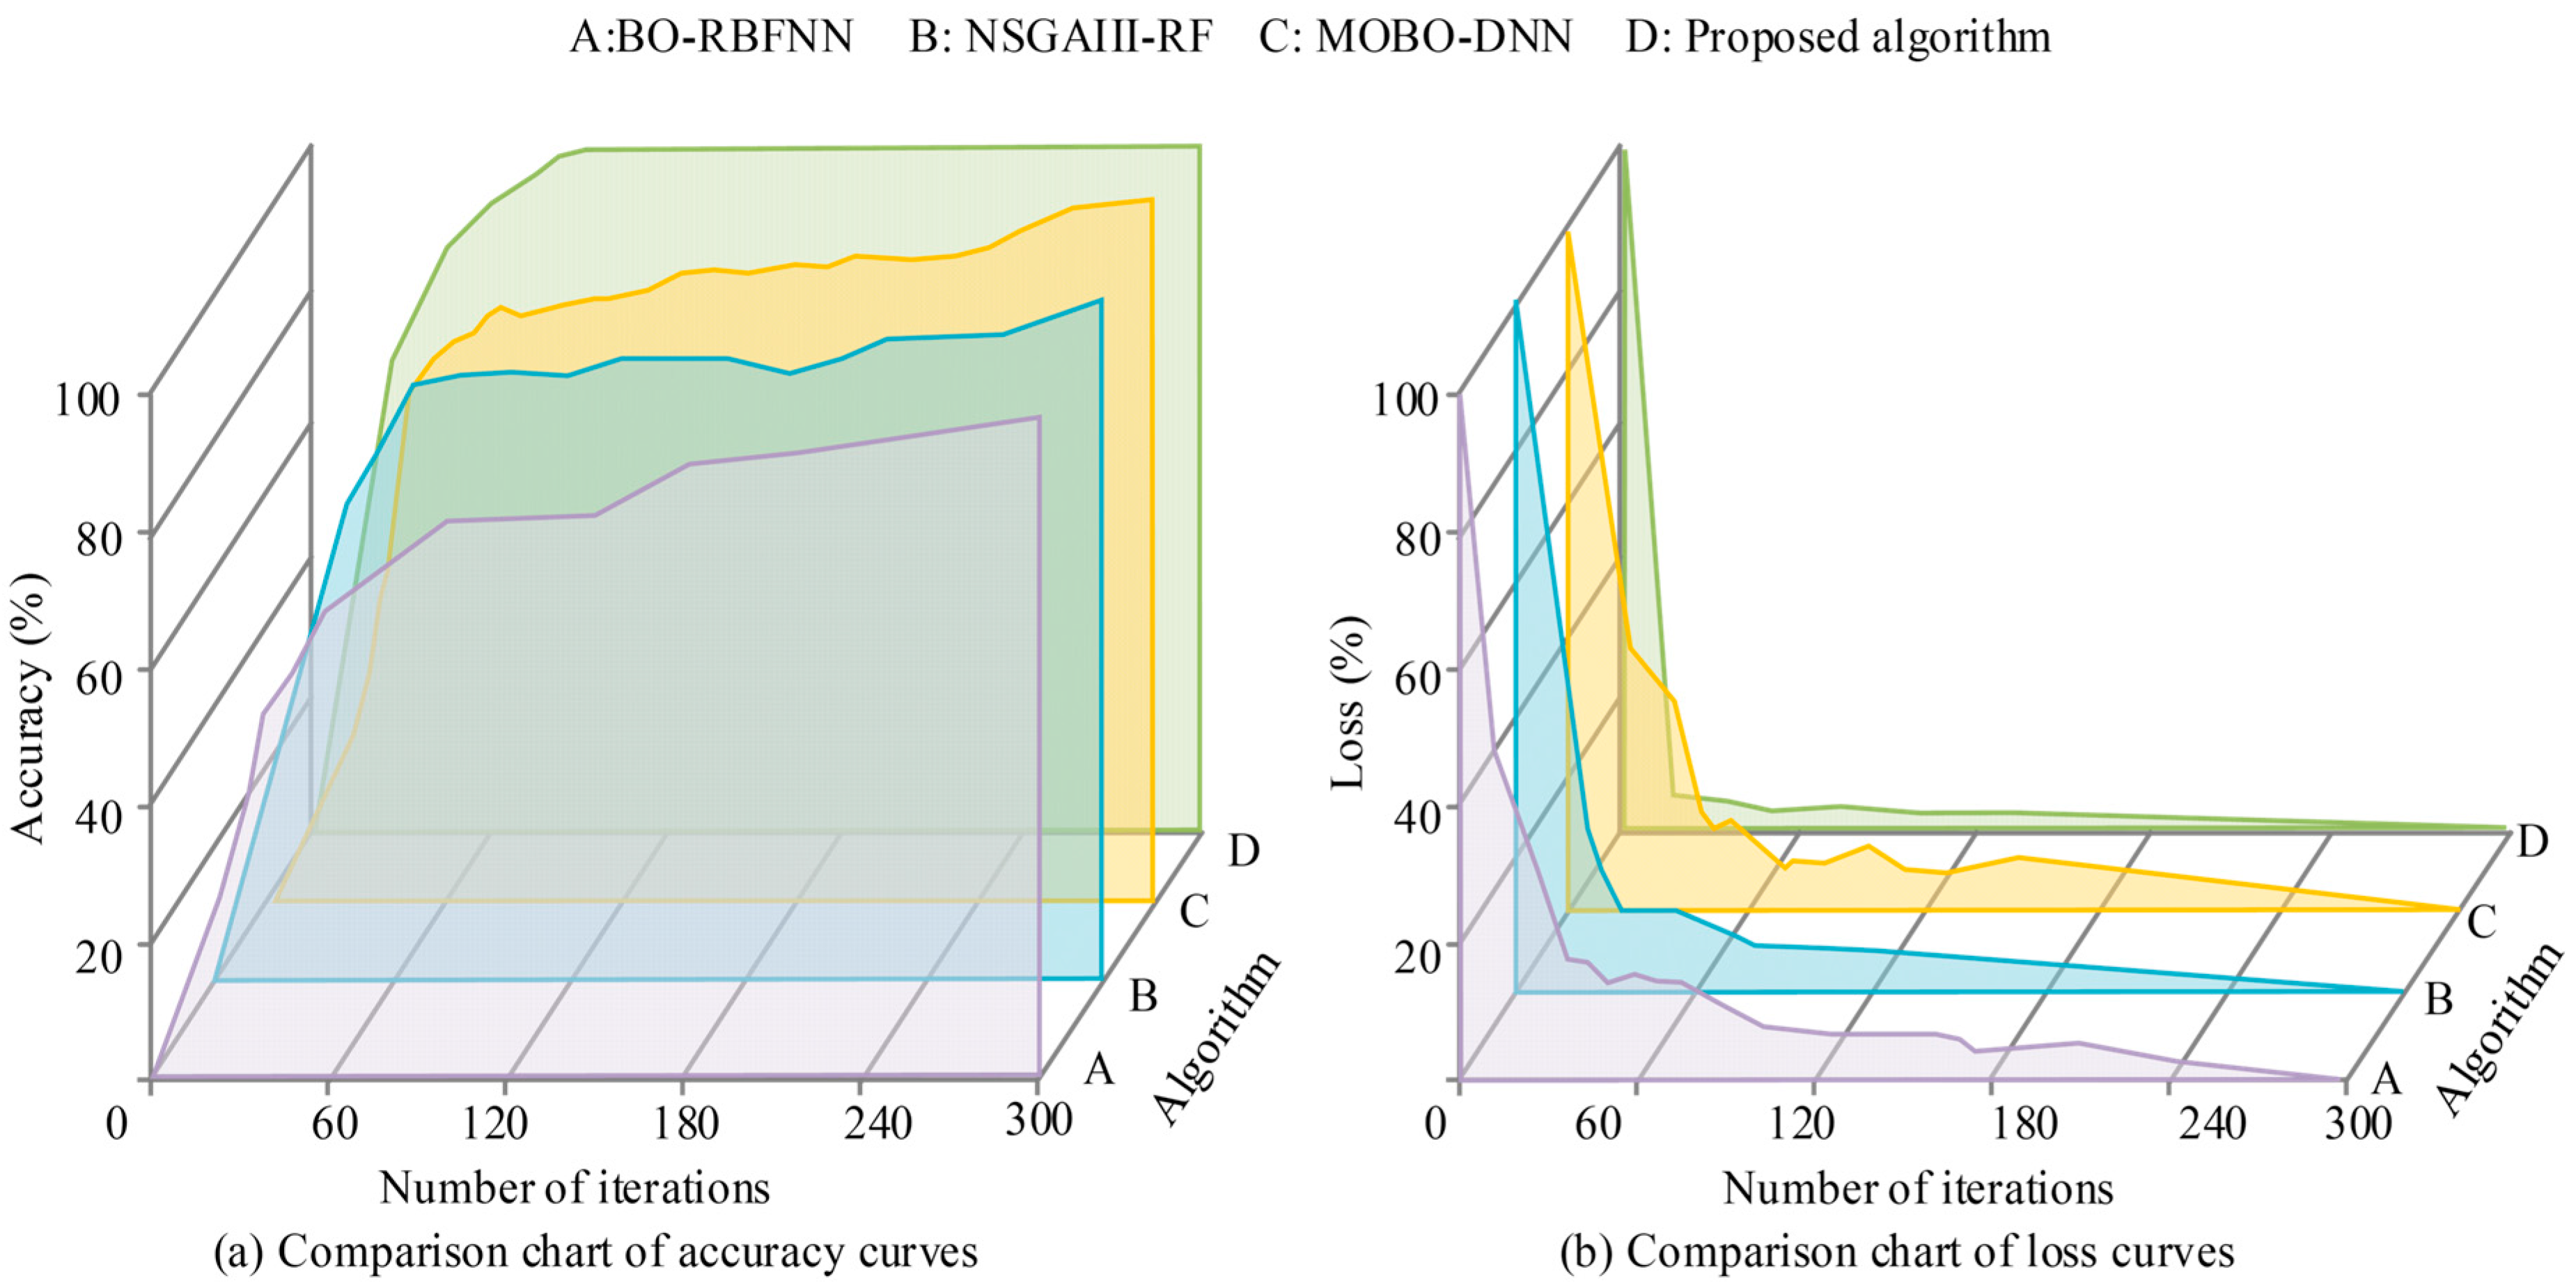
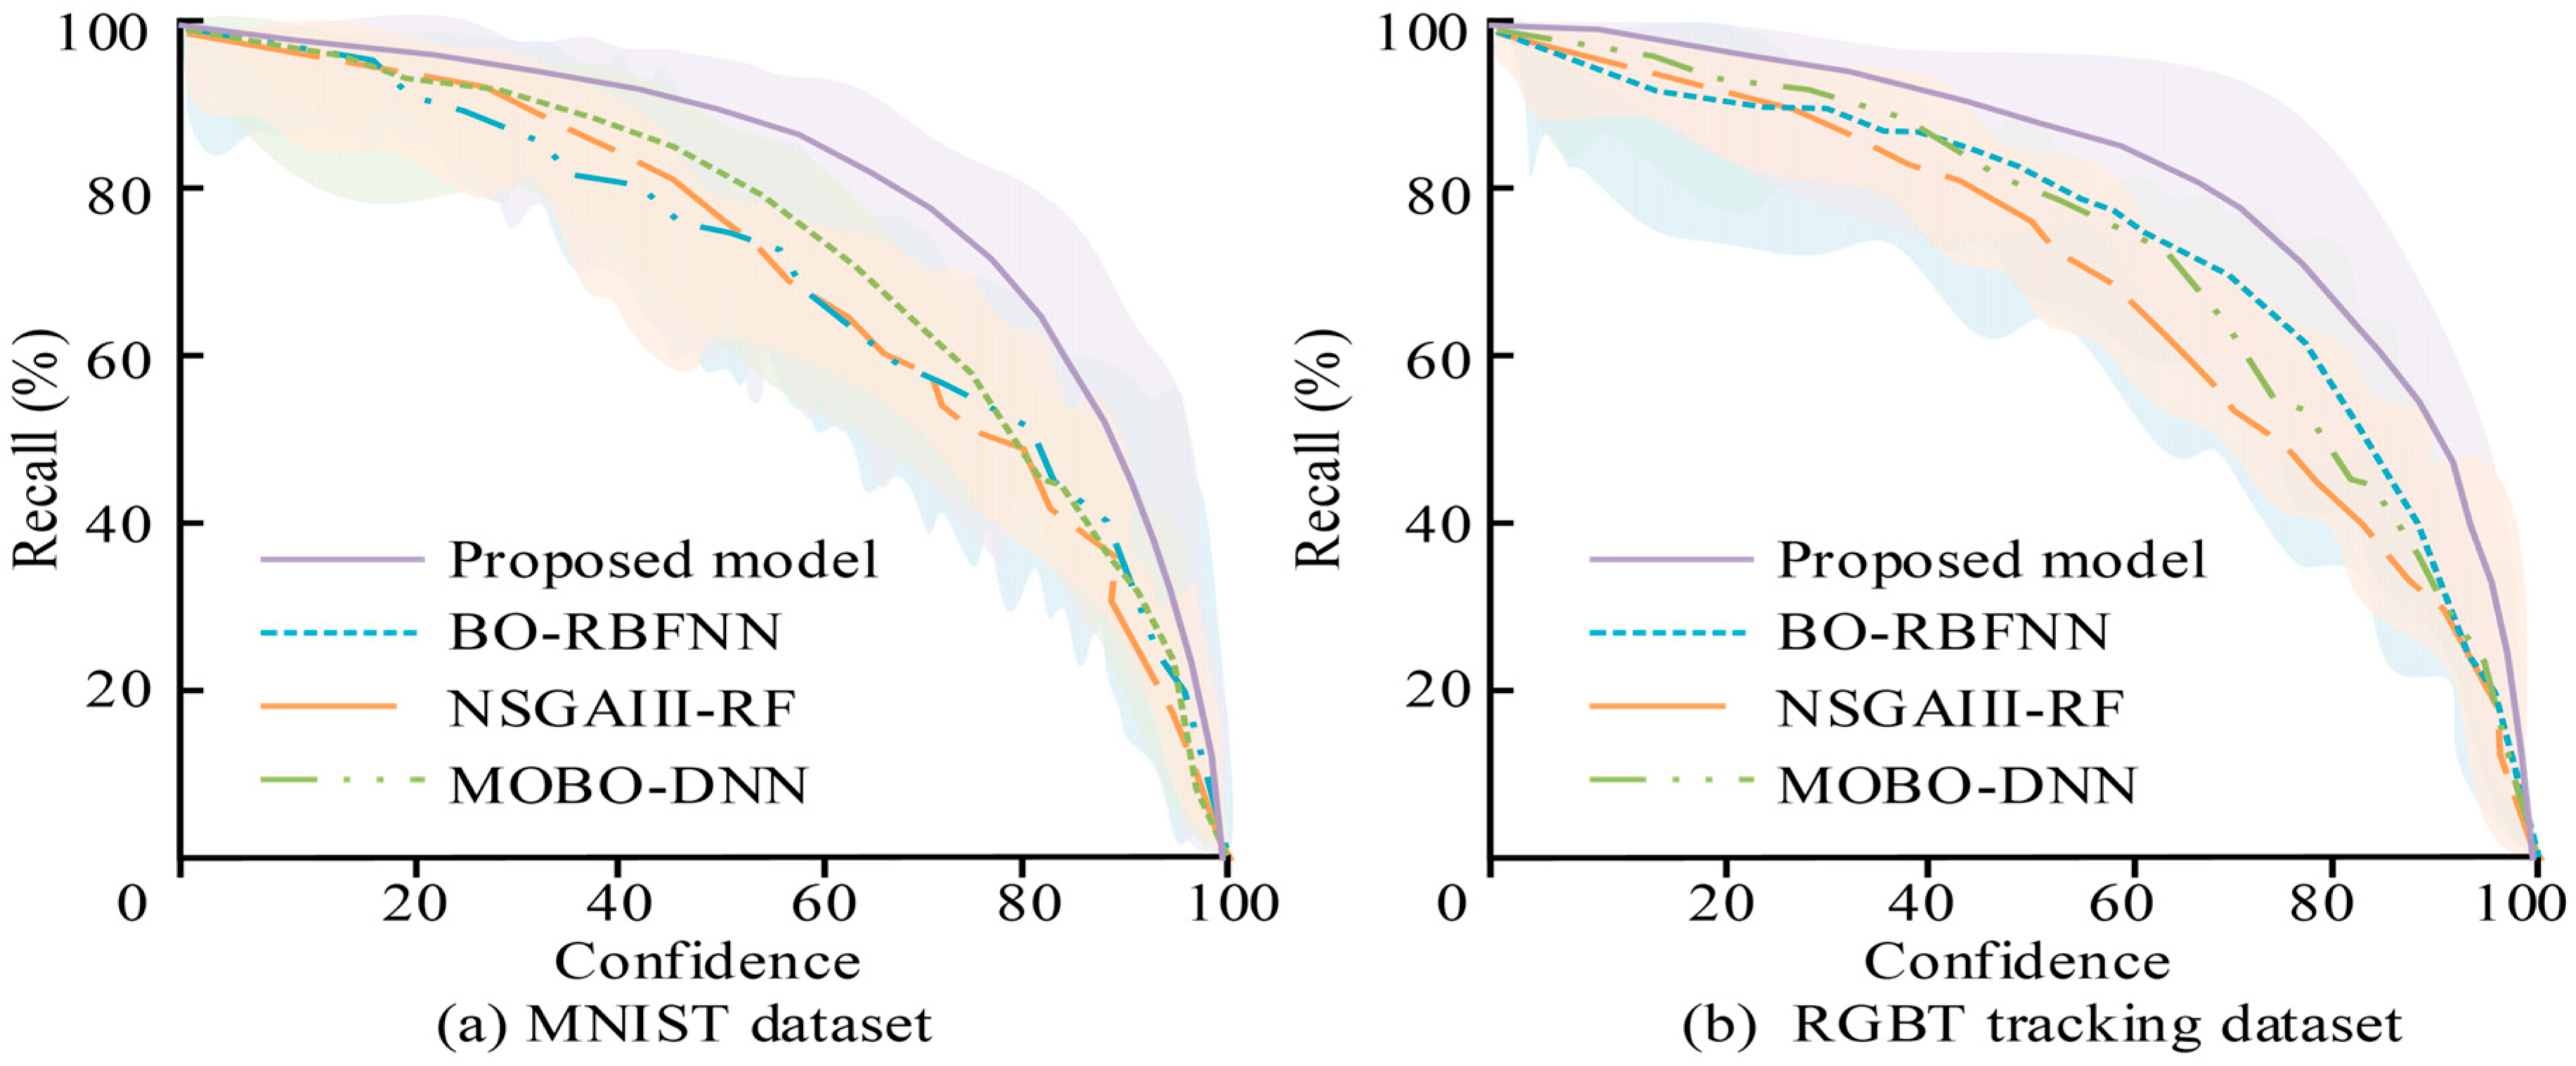
From the accuracy curve in Figure 10a, it can be seen that the research algorithm’s accuracy rapidly increased to 83.49% before 50 iterations, fluctuated slightly between the 20th and 90th iterations but overall rose, reaching over 95.26% after 90 iterations and approaching 1. BO-RBFNN and MOBO-DNN showed a better upward trend before 10 iterations, but experienced significant fluctuations between the 150th and 200th iterations, and their overall accuracy was inferior to that of the research algorithm. NSGAIII-RF and MOBO-DNN had a gradual increase in accuracy and the final values were lower. From the loss rate curve in Figure 10, it can be seen that the proposed algorithm’s loss rate rapidly decreased to 8.23%, demonstrating the best performance among the compared methods. The average accuracy of the research algorithm was 92.56%, and the average loss rate was 15.62%, showing a higher convergence accuracy and better stability. To further evaluate predictive performance, the recall curves of the four algorithms were compared, and the results are shown in Figure 11.
As shown in Figure 11, on the MNIST dataset, the research algorithm achieved a confidence rate of over 81.26% when the recall rate was 60.00% and maintained a confidence rate of above 73.47% when the recall rate was 80.00%, outperforming the comparison algorithm. BO-RBFNN saw its confidence rate drop to 59.18% at a recall rate of 50.00% and to 53.52% at a recall rate of 80.00%. The MOBO-DNN curve was smooth, with a recall rate of 79.79% at a confidence rate of 60.00%. GAIII-RF saw a significant decline in recall rate at a confidence rate of 30.00%, and only 58.64% at a confidence rate of 70.00%. On the RGBT dataset, the research algorithm was superior, maintaining a high confidence rate in the high recall rate range, demonstrating a better balance ability.

3.2. Performance of CLIP-Guided Evolutionary Optimization Model for Green Design Concepts

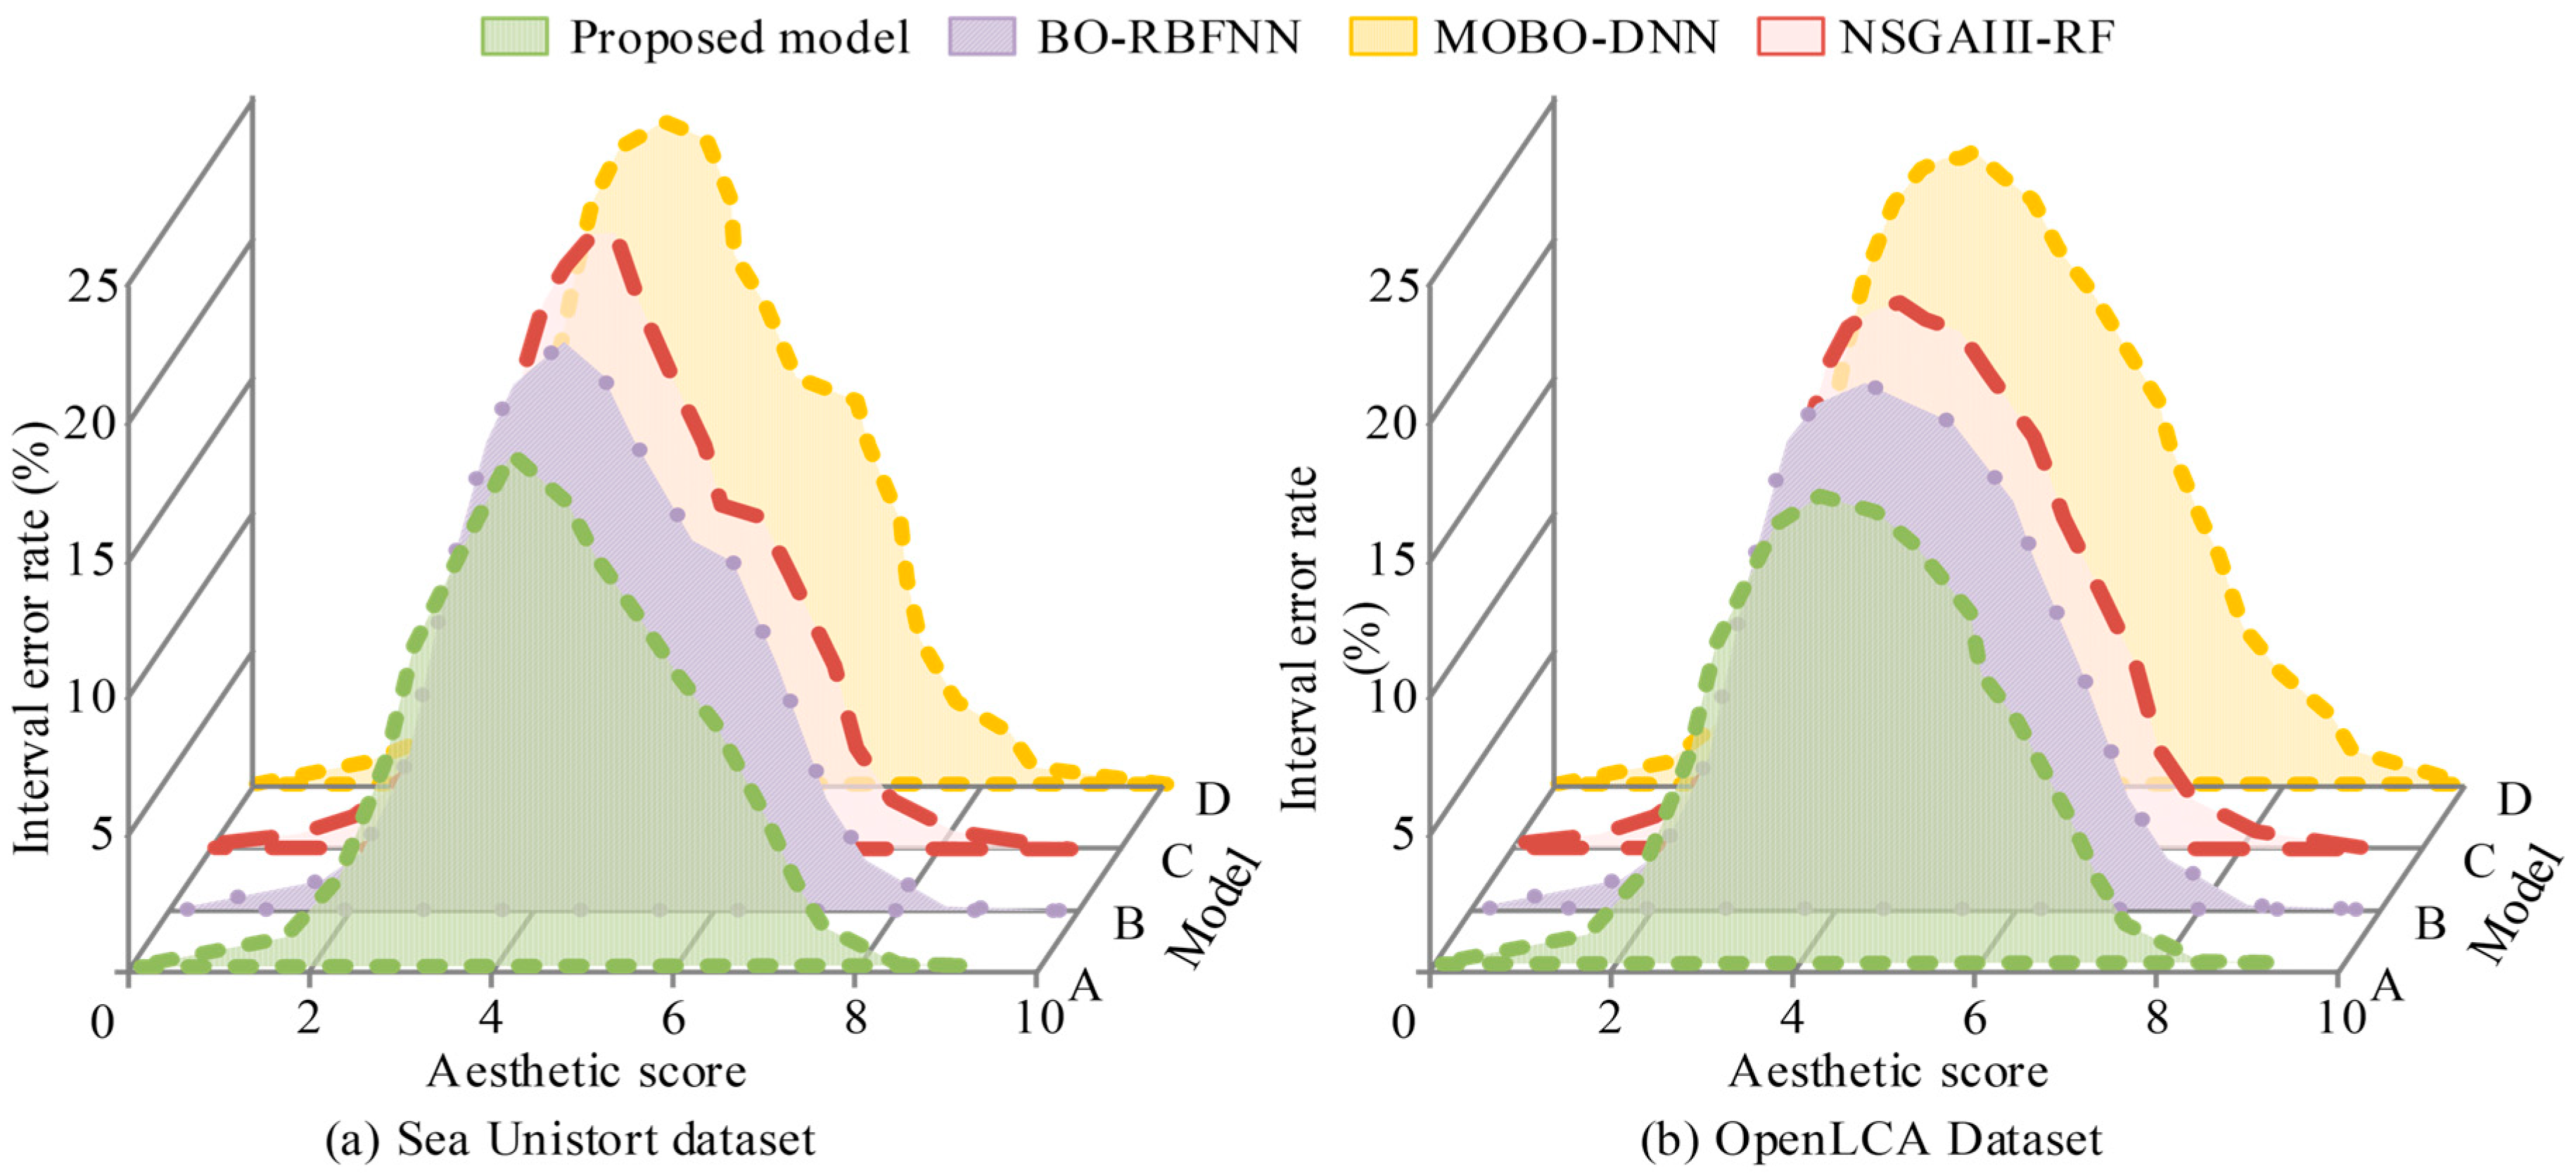
After verifying the performance of GTC, further evaluation was carried out on the CLIP-guided evolutionary optimization model for green design concepts. It was compared with green design concept models constructed by BO-RBFNN, NSGAIII-RF, and MOBO-DNN. The experimental devices consisted of a high-precision data collector, an economic index simulator, an intelligent analysis terminal, and a visualization module. By setting different economic parameter combinations, simulated loss scenarios were introduced. The datasets were Sea-Undistort and OpenLCA. In practical green design scenarios, the high-precision aesthetic evaluation ability of the proposed model effectively identified design solutions that were both aesthetically pleasing and environmentally friendly, avoiding resource waste caused by aesthetic mismatch. The interval error rates of the models were visualized and compared, as shown in Figure 12.
As shown in Figure 12a, in the aesthetic scoring test on the Sea-Undistort dataset the interval error rate of GTC was 22.46% at score 2, 15.22% at score 4, 12.33% at the core score 5, and achieved the global minimum of 6.26% at score 7. At score 8 the error rate was 5.46%, and at score 9 it was 4.84%. In the high range of 8–10 the error rate decreased step by step from 5.89% to nearly zero. At score 10 the performance was the best with an error rate decline gradient of 2.21% per score unit, which verified the model’s accurate recognition of high-aesthetic-quality samples. This ability was reflected in practical applications, such as identifying the aesthetic potential of recycled materials to improve market acceptance of green products. As shown in Figure 12b, the error rate of the proposed model was lower than comparison models. In summary, the proposed model showed higher accuracy and stability in aesthetic evaluation. Then, the performance scores of the four models were compared, and the results are shown in Figure 13.
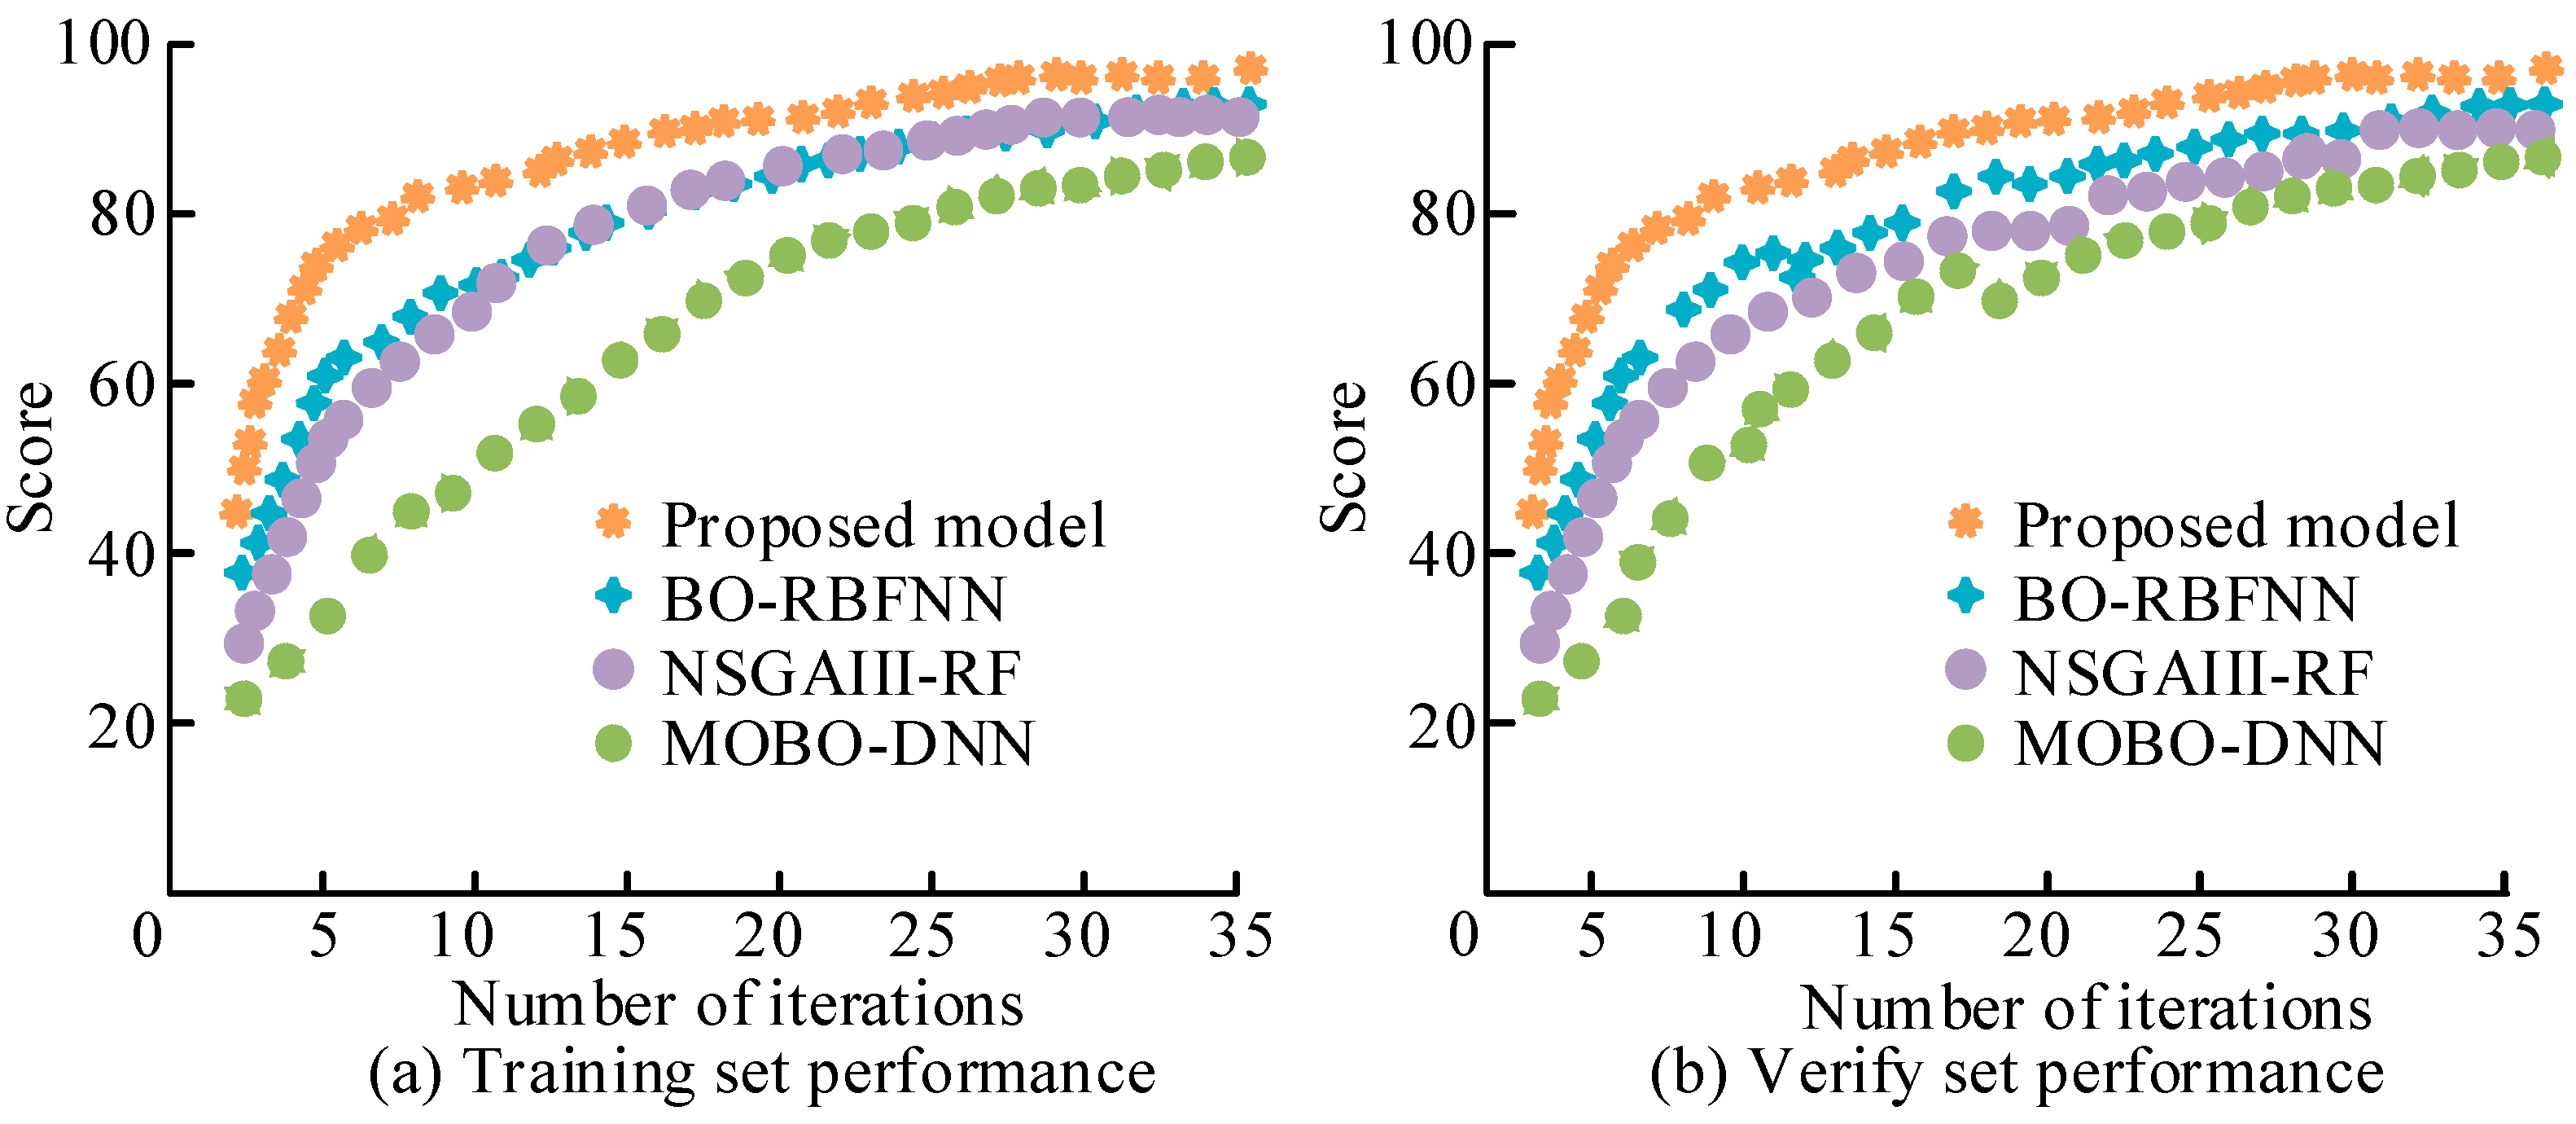
From Figure 13a, it can be seen that in the training set, the research model gradually stabilized after 25 iterations and began to remain around the maximum score of 98.76. The performance improvement speed of the other four models was significantly slower than that of the model proposed in this study. From Figure 13b, it is known that in the validation set, the performance evaluation of each model could reach the ideal value with a relatively small number of iterations. Among them, the final stable performance evaluation of the model proposed in this study was slightly higher than the performance evaluations of the other four models. Then, the energy consumption of the four models was compared, and the results are shown in Figure 14.
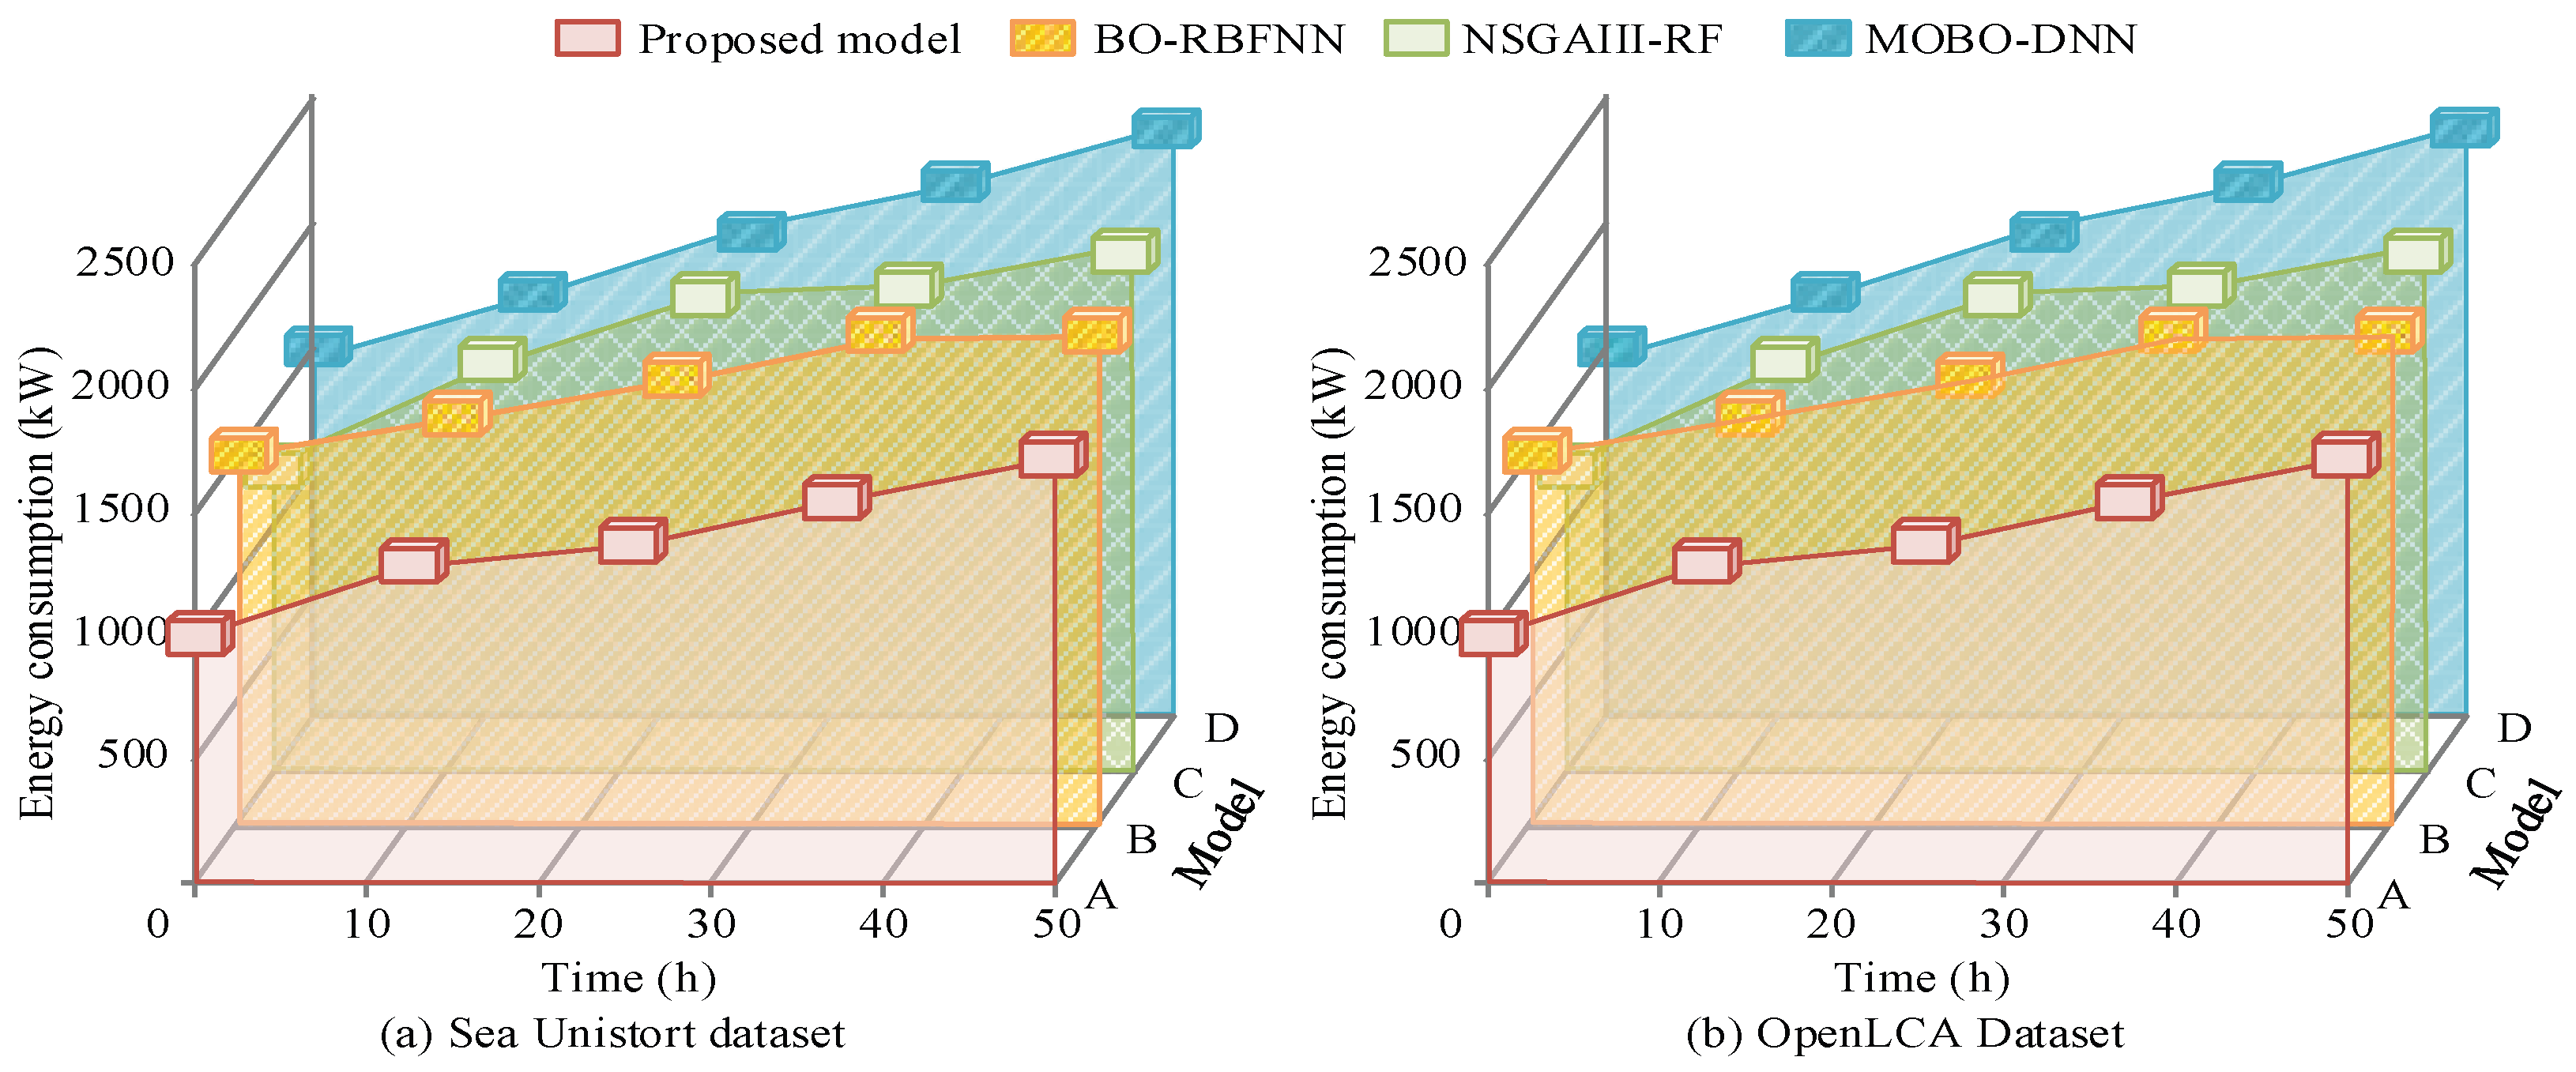
As shown in Figure 14a, in the 50 h energy consumption test on the Sea-Undistort dataset the initial consumption of the proposed model was 1000 kW. At 20 h it was 1200 kW, which was 500 kW lower than BO-RBFNN at 1700 kW. At 30 h it was 1300 kW, which was 900 kW lower than NSGAIII-RF at 2200 kW. At 50 h the final consumption of 1510 kW was only 56.76% of BO-RBFNN, 42.52% of NSGAIII-RF, and 42.93% of MOBO-DNN. The maximum difference occurred at 25 h. The energy consumption growth rate remained stable at 11 kW/h, which was much lower than 25–40 kW/h of comparison models. This low energy consumption made the model suitable for long-term sustainable design projects, such as building life cycle assessment, significantly reducing environmental costs. As shown in Figure 14b, the proposed model consumed less energy than all comparison models throughout the process. Finally, the performance of the proposed green design concept model and the comparison models was evaluated, and the results are shown in Table 1.
As shown in Table 1, on the Sea-Undistort dataset the carbon emission equivalent of the proposed model was only 12.3 kg CO2e, which was lower than the best comparison model MOBO-DNN at 13.5 kg CO2e. The material recyclability was 92.54%, which was higher than NSGAIII-RF at 88.22%. The iteration time per step was 5.3 s, which was shorter than BO-RBFNN at 8.2 s. On the OpenLCA dataset the carbon emission equivalent of the proposed model was 13.6 kg CO2e, which was 1 kg CO2e lower than MOBO-DNN at 14.6 kg CO2e. The material recyclability was 96.1%, which was 11.4% higher than BO-RBFNN at 86.3%. The iteration time per step was 4.2 s, which was only 27.3% of MOBO-DNN. The Pareto solution coverage was 95.84%, which was 16.87% higher than NSGAIII-RF at 78.97%. These advantages translated into practical benefits. In green building design applications, higher material recyclability directly supported recycling during demolition and reduced construction waste. Lower carbon emissions helped projects obtain green building certifications such as LEED. The proposed model outperformed comparison models in four core indicators across both datasets, confirming its ability to achieve sustainable design breakthroughs through life cycle assessment optimization and multi-objective Pareto front search.
Many algorithm components (MOBO-CLIP, GTC, GWO-TOA, GA-DF, CNN-PSO) were successively introduced. To test the effectiveness of these component introductions, an ablation experiment was designed. Specifically, each component was sequentially turned off and the performance changes were compared. The observation indicators included carbon emission equivalents, material recyclability rate, single iteration time, and Pareto solution coverage rate. The results are shown in Table 2.
As shown in Table 2, when MOBO-CLIP is removed, carbon emissions increase by 0.8 kg CO2, material recovery decreases by 2.32%, and coverage rate drops sharply by 3.37%, indicating that it is indispensable in the semantic-driven material–performance coupling modeling; the absence of GTC leads to a further decline in recyclability to 89.56%, indicating that GTC contributes substantially to the modeling of life cycle-related structural dependencies and improves material recovery performance. While the elimination of CNN-PSO only causes a slight decrease of 2.84% in coverage rate, it indicates that the local search accuracy provides an important support for the integrity of the global Pareto frontier.

3.3. Application-Oriented Validation in Sustainable Product Design

In order to verify the core life cycle and environmental claims in this paper and demonstrate their relevance to sustainable products or aesthetic design tasks, a new experiment—the “dual-track validation experiment”—was designed. This experiment simultaneously collected carbon footprint data and user aesthetic scores in real industrial scenarios, covering three typical products: new energy vehicle interiors, degradable packaging, and smart office furniture. The user aesthetic scores were assessed using a five-point Likert scale and were independently completed by 87 users from different age groups. The carbon footprint data was calculated using the LCA software Simapro 9.3, with the boundary covering the entire process from raw material acquisition to product disposal. In the new energy vehicle interior experiment, the MOBO-CLIP-optimized natural fiber composite material reduced the carbon footprint by 17.3% and increased the user aesthetic score by 22.6%. The degradable packaging group achieved a recycling rate of 94.1% and visual coordination through GTC-guided structural topology reconstruction, meeting both the recycling rate and visual coordination standards. The smart office furniture experiment verified the convergence ability of CNN-PSO in balancing form, function, and carbon efficiency.
To further evaluate practical applicability, a case study was conducted using the center console panel of a 2026 domestic new energy vehicle model as the design object. Based on MOBO-CLIP, 12 candidate designs were generated. The average CLIP score reached 0.832 (SD = 0.041). Among them, the top three schemes were verified by OpenLCA: the carbon equivalent was 8.7, 9.1, and 9.3 kgCO2e per unit, the material recovery rate was 93.7%, 92.4%, and 91.0% respectively, and the calculation of energy consumption (GPU inference per single instance) was strictly controlled within 1.2–1.4 kJ. The designer selected the optimal solution based on the intersection of the Pareto frontier of the CLIP score ranking and environmental indicators—that is, the scheme with the lowest carbon equivalent and a recovery rate exceeding 93%. Finally, the selected scheme was considered feasible for practical production-oriented implementation. This result suggests that the proposed framework can support the joint consideration of CLIP-based semantic evaluation and environmental performance in multi-objective design decision-making.

4. Discussion and Interpretation

The proposed model showed significant advantages in performance comparison experiments. From the perspective of aesthetic evaluation, the proposed model outperformed BO-RBFNN, NSGAIII-RF, and MOBO-DNN. In particular, in the high aesthetic quality range of 8–10, the proposed model maintained a gradient decay rate of 2.2% per score. This advantage mainly resulted from the cross-modal semantic understanding and multi-level feature fusion ability of the model. Combined with the global search characteristics of the evolutionary model, the proposed model precisely captured the nonlinear correlations in human aesthetic preferences. The multi-granularity scanning of the deep forest further enhanced the discrimination of detailed features such as material texture and shape ratio, which improved the model’s discriminative ability in high-quality design evaluation. The above results are consistent with the idea of Kumar P and his team, who applied the analysis results of the physiological data of 60 subjects and the correlation and consistency between product aesthetic quality to the aesthetic quality assessment. This model assesses the product aesthetic quality through electromyography data but still has limitations: it only covers the static visual dimension and does not incorporate the user’s emotional feedback during the dynamic interaction process [29]. In contrast, this study integrates CLIP-based visual semantic representation with multi-objective optimization, allowing aesthetic evaluation and environmental indicators to be considered simultaneously during the design generation process. This integration extends the assessment from purely visual similarity to a broader multi-objective decision context involving sustainability, structural feasibility, and semantic consistency.
In addition, the proposed model also showed high accuracy in sustainability index optimization. On the OpenLCA dataset, its material recovery rate exceeded the threshold of 96.17% and its average carbon emission equivalent was lower, which further proved the reliability and practicality of the model. In the test of engineering constraint collaborative optimization, the proposed model also showed an excellent performance. Compared with traditional models that only relied on parametric modeling, the proposed model not only increased the Pareto solution coverage rate to 95.84% but also achieved the unification of structural lightweight design and manufacturing feasibility through the GWO-TOA module. This advantage mainly resulted from the efficiency of the model in dynamic constraint handling. The three-level leadership mechanism of the gray wolf optimization guided the topology optimization results to automatically satisfy the boundaries of mechanical performance, while the active learning strategy of MOBO adjusted the semantic weight of CLIP in real time, which realized the simultaneous convergence of environmental indicators, engineering constraints, and aesthetic value. Constantinou S et al.’s attempt to combine energy generation with architectural aesthetics in sustainable design was quite inspiring, but it relied on a preset rule base and was difficult to adapt to diverse regional climates and cultural contexts [30]. This study, through the proposed CLIP-guided multi-objective optimization framework, is able to model the interaction between regional design semantics, environmental constraints, and optimization objectives in a more adaptive manner.
In the empirical analysis of complex green design scenarios, the CLIP-guided evolutionary optimization model based on the proposed model also showed significant advantages. On the Sea-Undistort dataset, carbon emissions were controlled at 12.3 kgCO2e. On the OpenLCA dataset, resource recycling efficiency reached a recovery rate of 96.17%. The proposed model outperformed the models built on BO-RBFNN, NSGAIII-RF, and MOBO-DNN. This advantage resulted from the cascaded optimization mechanism of multi-model collaboration. The GA-DF component enhanced global innovative exploration, the CNN-PSO module optimized local feature expression, and the GWO-TOA guaranteed engineering feasibility. These results were consistent with those of Zhang W, who obtained similar findings in related problems [31]. Compared with related studies, the proposed model achieved a significant performance improvement. It showed stronger advantages and practicality in the field of intelligent sustainable design.

5. Conclusions

The proposed GTC algorithm showed significant advantages in financial transaction risk identification. Compared with BO-RBFNN, NSGAIII-RF, and MOBO-DNN, the proposed algorithm achieved lower loss values, a higher accuracy, and a faster convergence speed. On the MNIST and RGBT datasets, the algorithm maintained stable convergence and outperformed the comparison algorithms in F1 score, accuracy, recall, and overall robustness. The results showed that the proposed algorithm achieved higher convergence precision and better stability. The CLIP-guided evolutionary optimization model for green design concepts also showed an outstanding performance. On the Sea-Undistort and OpenLCA datasets, the model achieved lower carbon emission equivalents, higher material recovery rates, a shorter iteration time, and broader Pareto solution coverage. These advantages verified that the proposed model effectively combined environmental indicators, engineering constraints, and aesthetic values, and realized sustainable design optimization with higher efficiency. Compared with other advanced models, the proposed model showed stronger adaptability and practicality in complex green design scenarios. Looking forward, the proposed model still has room for further improvement. Future work is expected to explore the integration of more advanced deep learning architectures and reinforcement learning strategies. In addition, expanding the application of the model to other sustainable design domains such as smart cities, renewable energy, and ecological architecture is expected to provide broader value and promote the development of intelligent green design.

Author Contributions

Conceptualization, H.Z. and M.K.; methodology, H.Z. and M.K.; software, H.H.; validation, H.H.; formal analysis, H.Z. and M.K.; investigation, Y.W. and H.H.; resources, H.Z.; data curation, H.Z.; writing—original draft preparation, H.Z.; writing—review and editing, M.K.; visualization, H.H. and Y.W.; supervision, M.K.; project administration, M.K.; funding acquisition, H.Z. All authors have read and agreed to the published version of the manuscript.

Funding

This research was funded by the Pukyong National University Industry-University Cooperation Foundation’s 2024 Post-Doc. Support Project.

Institutional Review Board Statement

Not applicable.

Informed Consent Statement

Not applicable.

Data Availability Statement

The raw data supporting the conclusions of this article will be made available by the authors on request.

Conflicts of Interest

The authors declare no conflicts of interest.

References

  1. Raudonikyte, I.; Grazuleviciute-Vileniske, I. Sustainability aesthetics of hybrid environments: Creation and perception by the emerging generation of designers. Archit. Urban Plan. 2025, 21, 70–84. [Google Scholar] [CrossRef] [Scilit]
  2. Nguyen, Q.N.; Ullah, R.; Kim, B.S.; Hassan, R.; Sato, T.; Taleb, T. A cross-layer green information-centric networking design toward the energy internet. IEEE Trans. Netw. Sci. Eng. 2022, 9, 1577–1593. [Google Scholar] [CrossRef] [Scilit]
  3. Liu, Y. Integrating AI and sustainability in cultural and creative product design for environmentally conscious innovations. Int. J. Inf. Commun. Technol. 2025, 26, 18–32. [Google Scholar] [CrossRef] [Scilit]
  4. Xu, P.; Liu, H.; Zhang, H.; Lan, D.; Shin, I. Optimizing Performance of Recycled Aggregate Materials Using BP Neural Network Analysis: A Study on Permeability and Water Storage. Desalination Water Treat. 2024, 317, 100056. [Google Scholar] [CrossRef] [Scilit]
  5. Zhang, H.; Li, B.; Shi, J.; Lu, Y.; Xu, P. Framework Structure Design Based on Porous Permeable Concrete Material in Expressway Tunnel Drainage System. Desalination Water Treat. 2024, 317, 100308. [Google Scholar] [CrossRef] [Scilit]
  6. Gong, Y.; Li, X.; Meng, F.; Liu, L.; Guizani, M.; Xu, Z. Toward green RF chain design for integrated sensing and communications: Technologies and future directions. IEEE Commun. Mag. 2024, 62, 36–42. [Google Scholar] [CrossRef] [Scilit]
  7. Gao, P.; Geng, S.; Zhang, R.; Ma, T.; Fang, R.; Zhang, Y.; Li, H.; Qiao, Y. CLIP-adapter: Better vision-language models with feature adapters. Int. J. Comput. Vis. 2024, 132, 581–595. [Google Scholar] [CrossRef] [Scilit]
  8. Zheng, S.; Cui, X.; Sun, Y.; Li, J.; Li, H.; Zhang, Y.; Chen, P.; Jing, X.; Ye, Z.; Yang, L. Benchmarking PathCLIP for pathology image analysis. J. Imaging Inform. Med. 2025, 38, 422–438. [Google Scholar] [CrossRef] [Scilit]
  9. Luo, K. Water flow optimizer: A nature-inspired evolutionary algorithm for global optimization. IEEE Trans. Cybern. 2022, 52, 7753–7764. [Google Scholar] [CrossRef] [Scilit] [PubMed]
  10. Privitera, S.; Sedghamiz, H.; Hartenstein, A.; Vaitsiakhovich, T.; Kleinjung, F. An evolutionary algorithm for the direct optimization of covariate balance between nonrandomized populations. Pharm. Stat. 2024, 23, 288–307. [Google Scholar] [CrossRef] [Scilit]
  11. Moustafa, A.M.; Mostafa, M.M. The role of life cycle assessment in sustainable product design: A state-of-the-art knowledge domain visualization. Sustain. Dev. 2025, 33, 8907–8922. [Google Scholar] [CrossRef] [Scilit]
  12. Eslamipoor, R.; Wang, Z.; Kolade, O. Production network and emission control targets-theoretical approach. Peace Econ. Peace Sci. Public Policy 2023, 29, 43–69. [Google Scholar] [CrossRef] [Scilit]
  13. Eslamipoor, R. An integrated approach for three-layer location-allocation in a green supply chain. Int. J. Logist. Syst. Manag. 2025, 52, 308–322. [Google Scholar] [CrossRef] [Scilit]
  14. Yang, H.; Lee, J.; Park, C.; Lee, C.; Jin, M.; Kim, J.; Shin, J.C.; Hwang, S.; Lee, E.; Kim, Y.S. Simultaneous improvement of multiple electrical characteristics in ultrathin a-IGZO TFTs using machine learning optimization. ACS Appl. Mater. Interfaces 2025, 17, 10865–10875. [Google Scholar] [CrossRef] [Scilit]
  15. Wang, H.; Xu, H.; Zhang, Z. High-dimensional multi-objective Bayesian optimization with block coordinate updates: Case studies in intelligent transportation systems. IEEE Trans. Intell. Transp. Syst. 2024, 25, 884–895. [Google Scholar] [CrossRef] [Scilit]
  16. Liu, S.; Lin, Q.; Li, J.; Tan, K.C. A survey on learnable evolutionary algorithms for scalable multiobjective optimization. IEEE Trans. Evol. Comput. 2023, 27, 1941–1961. [Google Scholar] [CrossRef] [Scilit]
  17. Saleh, A.I.; Hussien, S.A. Disease diagnosis based on improved gray wolf optimization and ensemble classification. Ann. Biomed. Eng. 2023, 51, 2579–2605. [Google Scholar] [CrossRef] [Scilit]
  18. Yadav, R.K.; Hrisheekesha, P.N.; Bhadoria, V.S. Grey wolf optimization-based demand side management in solar PV integrated smart grid environment. IEEE Access 2023, 11, 11827–11839. [Google Scholar] [CrossRef] [Scilit]
  19. Zhang, L.; Arabameri, A.; Santosh, M.; Pal, S.C. Land subsidence susceptibility mapping: Comparative assessment of the efficacy of five models. Environ. Sci. Pollut. Res. 2023, 30, 77830–77849. [Google Scholar] [CrossRef] [Scilit] [PubMed]
  20. Ghobadi, A.; Cheraghi, M.; Sobhanardakani, S.; Lorestani, B.; Merrikhpour, H. Groundwater quality modeling using a novel hybrid data-intelligence model based on gray wolf optimization and multilayer perceptron neural network. Environ. Sci. Pollut. Res. 2022, 29, 8716–8730. [Google Scholar] [CrossRef] [Scilit] [PubMed]
  21. Strandgaard, M.; Seumer, J.; Jensen, J.H. Discovery of molybdenum-based nitrogen fixation catalysts with genetic algorithms. Chem. Sci. 2024, 15, 10638–10650. [Google Scholar] [CrossRef] [Scilit]
  22. Zhou, R.; Poechmueller, P.; Wang, Y. An analog circuit design and optimization system with rule-guided genetic algorithm. IEEE Trans. Comput.-Aided Des. Integr. Circuits Syst. 2022, 41, 5182–5192. [Google Scholar] [CrossRef] [Scilit]
  23. Xie, L.; Wang, T.; Du, S.; Cai, H. CERT-DF: A computing-efficient and robust distributed deep forest framework with low communication overhead. IEEE Trans. Parallel Distrib. Syst. 2023, 34, 3280–3293. [Google Scholar] [CrossRef] [Scilit]
  24. Chen, X.; Wang, P.; Yang, Y.; Liu, M. Resource-constraint deep forest-based intrusion detection method in the internet of things for consumer electronics. IEEE Trans. Consum. Electron. 2024, 70, 4976–4987. [Google Scholar] [CrossRef] [Scilit]
  25. Xu, P.; Lan, D.; Yang, H.; Zhang, S.; Kim, H.; Shin, I. Ship Formation and Route Optimization Design Based on Improved PSO and D-P Algorithm. IEEE Access 2025, 13, 15529–15546. [Google Scholar] [CrossRef] [Scilit]
  26. Rahayu, E.S.; Ma’arif, A.; Abdullah, A. Particle swarm optimization tuning of PID control on DC motor. Int. J. Robot. Control Syst. 2022, 2, 435–447. [Google Scholar] [CrossRef] [Scilit]
  27. Han, J.; Yao, X.; Cheng, G.; Feng, X.; Xu, D. P-CNN: Part-based convolutional neural networks for fine-grained visual categorization. IEEE Trans. Pattern Anal. Mach. Intell. 2022, 44, 579–590. [Google Scholar] [CrossRef] [Scilit] [PubMed]
  28. Li, Z.; Liu, F.; Yang, W.; Peng, S.; Zhou, J. A survey of convolutional neural networks: Analysis, applications, and prospects. IEEE Trans. Neural Netw. Learn. Syst. 2022, 33, 6999–7019. [Google Scholar] [CrossRef] [Scilit] [PubMed]
  29. Wang, Y.; Song, F.; Liu, Y.; Li, Y.; Wang, W. Research on the association mechanism and evaluation model between EMG data and product aesthetic quality in product aesthetics evaluation. J. Eng. Design 2025, 36, 112–137. [Google Scholar] [CrossRef] [Scilit]
  30. Constantinou, S.; Al-Naemi, F.; Alrashidi, H.; Mallick, T.; Issa, W. A review on technological and urban sustainability perspectives of advanced building-integrated photovoltaics. Enrgy Sci. Eng. 2024, 12, 1265–1293. [Google Scholar] [CrossRef] [Scilit]
  31. Liu, H.; Zhang, H.; Lee, J.; Xu, P.; Shin, I.; Park, J. Motor Interaction Control Based on Muscle Force Model and Depth Reinforcement Strategy. Biomimetics 2024, 9, 150. [Google Scholar] [CrossRef] [Scilit] [PubMed]
Figure 1. MOBO-CLIP process (icon source: https://www.1001freedownloads.com, accessed on 8 January 2026).
Sustainability 18 04064 g001
Figure 2. Process of CLIP-guided evolutionary optimization algorithm (icon source: https://iconpark.oceanengine.com, accessed on 8 January 2026).
Sustainability 18 04064 g002
Figure 3. Structure of GWO-TOA.
Sustainability 18 04064 g003
Figure 4. Process of GTC algorithm (icon source: https://iconpark.oceanengine.com, accessed on 14 January 2026).
Sustainability 18 04064 g004
Figure 5. GA-DF flowchart (icon source: https://iconpark.oceanengine.com/official, accessed on 14 January 2026).
Sustainability 18 04064 g005
Figure 6. CNN-PSO flowchart (icon source: https://iconpark.oceanengine.com/official, accessed on 14 January 2026).
Sustainability 18 04064 g006
Figure 7. CLIP-guided evolutionary optimization model for green design concepts.
Sustainability 18 04064 g007
Figure 8. Loss values with update steps.
Sustainability 18 04064 g008
Figure 9. F1 score comparison under different training ratios. Note: In Figure 9, a indicates a significant difference (p < 0.05) between the research model and the BO-RBFNN; b indicates a significant difference (p < 0.05) between the research model and the NSGAIII-RF; c indicates a significant difference (p < 0.05) between the research model and the MOBO-DNN.
Sustainability 18 04064 g009
Figure 10. Accuracy and loss rate comparison.
Sustainability 18 04064 g010
Figure 11. Recall curves comparison.
Sustainability 18 04064 g011
Figure 12. Interval error rate visualization comparison.
Sustainability 18 04064 g012
Figure 13. Performance score comparison of four models.
Sustainability 18 04064 g013
Figure 14. Energy consumption comparison of four models.
Sustainability 18 04064 g014
Table 1. Comparison of test results of multiple comprehensive indicators.
DatasetIndicatorsProposed ModelBO-RBFNNNSGAIII-RFMOBO-DNN
Sea UnistortCarbon equivalent (kg CO2e)12.3 ± 2.0 *#&15.6 ± 2.314.8 ± 2.213.5 ± 2.4
Material recovery rate (%)92.54 ± 2.41 *#&85.45 ± 2.4588.22 ± 2.5090.17 ± 2.49
Time of a single iteration (s)5.3 ± 1.4 *#&8.2 ± 1.412.1 ± 1.818.9 ± 1.7
Pareto solution coverage (%)94.25 ± 1.86 *#&82.44 ± 2.3088.37 ± 2.3585.48 ± 2.40
OpenLCACarbon equivalent (kg CO2e)13.6 ± 2.1 *#&16.8 ± 2.216.9 ± 2.214.6 ± 2.4
Material recovery rate (%)96.17 ± 1.72 *#&86.38 ± 2.0079.28 ± 2.1587.52 ± 2.09
Time of a single iteration (s)4.2 ± 1.2 *#&6.8 ± 1.57.6 ± 1.415.4 ± 1.6
Paretoian coverage rate (%)95.84 ± 1.57 *#&86.52 ± 1.6378.97 ± 1.5978.44 ± 2.00
Note: In Table 1, * indicates significant differences (p < 0.05) between the research model and the BO-RBFNN; # indicates significant differences (p < 0.05) between the research model and the NSGAIII-RF; & indicates significant differences (p < 0.05) between the research model and the MOBO-DNN.
Table 2. Results of the ablation experiment.
GroupMOBO-CLIPGTCGWO-TOAGA-DFCNN-PSOCarbon Emission (kg CO2)Material Recovery Rate (%)Single Iteration Time (s)Pareto Solution Coverage (%)
112.392.545.395.84
2×13.190.225.992.47
3×12.889.566.191.05
4×12.591.335.794.12
5×12.790.885.593.76
6×12.991.055.493.00
Note: “√” indicates that the corresponding module is included, whereas “×” indicates that the corresponding module is removed.
Disclaimer/Publisher’s Note: The statements, opinions and data contained in all publications are solely those of the individual author(s) and contributor(s) and not of MDPI and/or the editor(s). MDPI and/or the editor(s) disclaim responsibility for any injury to people or property resulting from any ideas, methods, instructions or products referred to in the content.