Article

Inventory, Distribution and Geometric Characteristics of Landslides in the Dongchuan District, Yunnan Province, China

1
Kunming Institute of Earthquake Prediction, China Earthquake Administration, Kunming 650225, China
2
Yunnan Earthquake Agency, Kunming 650225, China
3
Key Laboratory of Earthquake and Volcanic Hazards, Institute of Geology, China Earthquake Administration, Beijing 100029, China
*
Author to whom correspondence should be addressed.
Sustainability 2026, 18(8), 3994; https://doi.org/10.3390/su18083994
Submission received: 6 March 2026 / Revised: 6 April 2026 / Accepted: 13 April 2026 / Published: 17 April 2026
(This article belongs to the Special Issue Mountain Hazards and Environmental Sustainability)

Abstract

The Dongchuan District in Kunming City is located in the transition zone between the Yunnan–Guizhou Plateau and the Sichuan Basin. As a region with a copper mining history of over 2000 years, the district has experienced frequent landslides that pose serious threats to human lives, property, and ecological sustainability. Therefore, it is essential to compile a comprehensive landslide inventory and analyze the relationships between landslide spatial distribution and influencing factors for geological hazard prevention. High-resolution remote sensing imagery was interpreted to establish a landslide inventory, based on which the spatial distribution and geometric characteristics of landslides were systematically analyzed. The results show that a total of 1623 landslides were identified, with a total area of 10.36 km2. Landslides predominantly occur at elevations of 1000–2000 m, on slopes of 20–45°, with aspects of 255–285°, and relief between 150 and 400 m, in areas with annual rainfall below 825 mm, within 1000 m of rivers and 3000 m of fault lines, and 1000–5000 m of mines. Four landslide clusters were delineated along the Xiao River Fault, highlighting the significant influence of the fault on the spatial distribution of landslides. Most landslides are longitudinal in planform, with travel distances (L) of 50–450 m and heights (H) from 25 to 350 m, both exhibiting allometric scaling with volume. The mean H/L ratio is 0.56 (corresponding to a mean reach angle of 29°), significantly higher than that in Baoshan City (21°). The results provide insights into landslide initiation mechanisms and spatial distribution patterns on the northern margin of the Yunnan–Guizhou Plateau, offering valuable data for landslide hazard assessment and sustainable regional development.

1. Introduction

Landslides, resulting from the imbalance between crustal uplift and erosion in mountainous areas, significantly influence topographic development and landform evolution [1,2]. Existing studies demonstrate that topographic and geological factors critically govern slope stability, with landslide distribution patterns varying significantly across different terrain conditions, thereby reflecting complex interplay between environmental settings and controlling factors [3,4,5,6].
A detailed and comprehensive landslide inventory serves as a crucial foundational dataset for analyzing landslide patterns and assessing landslide risk [7,8,9,10,11,12,13,14,15]. Yunnan is among the most landslide-prone provinces globally, where steep topography, active neotectonics, frequent seismicity, and intense precipitation foster highly susceptible slopes [16]. Researchers have compiled extensive landslide inventories through visual interpretation of remote sensing imagery. For instance, Tian et al. [17], He et al. [18], and Jin et al. [19] developed coseismic landslide inventories for the Ludian Ms 6.5, Qiaojia Ms 5.1, and Yiliang Ms 5.6 earthquakes in northern Yunnan Province using high-resolution pre- and post-earthquake satellite imagery. Similarly, Shao et al. [8] established a detailed landslide inventory for Baoshan City in western Yunnan by interpreting landslides from high-resolution Google Earth satellite images. However, scarce regional landslide inventories have hindered systematic comparisons of landslide spatial patterns and geometric characteristics across diverse geological settings.
The Dongchuan District of Kunming City lies at the transition zone between the Yunnan–Guizhou Plateau and the Sichuan Basin, a unique geomorphic setting characterized by high-relief terrain and deep gorges. This region is tectonically controlled by the active Xiao River Fault Zone, one of the most prominent strike-slip fault systems in southwestern China, characterized by intense neotectonic uplift, structural deformation, and frequent seismicity [20], combined with thousands of years of copper mining [21] and intense human engineering activities. These factors collectively have caused widespread slope instability that critically threatens local lives and property, as well as environmental sustainability. This distinctive geohazard setting serves as a natural laboratory for elucidating human-topographic-geological controls on landslide distribution in plateau-margin environments, with far-reaching implications for sustainable regional development.
While previous research has primarily focused on susceptibility and risk assessments of debris flows [22,23,24,25,26], as well as their monitoring and kinematic characteristics [27,28,29,30], the influence of geological setting on landslide spatial patterns remains inadequately explored. This study addresses this gap by establishing a detailed landslide inventory map and analyzing the spatial distribution, geometric features, and influencing factors. The results provide essential support for subsequent landslide susceptibility mapping and landslide hazard assessment and offer new insights into the long-term impacts of landslides on landform evolution at the northeastern margin of the Yunnan–Guizhou Plateau.

2. Study Area

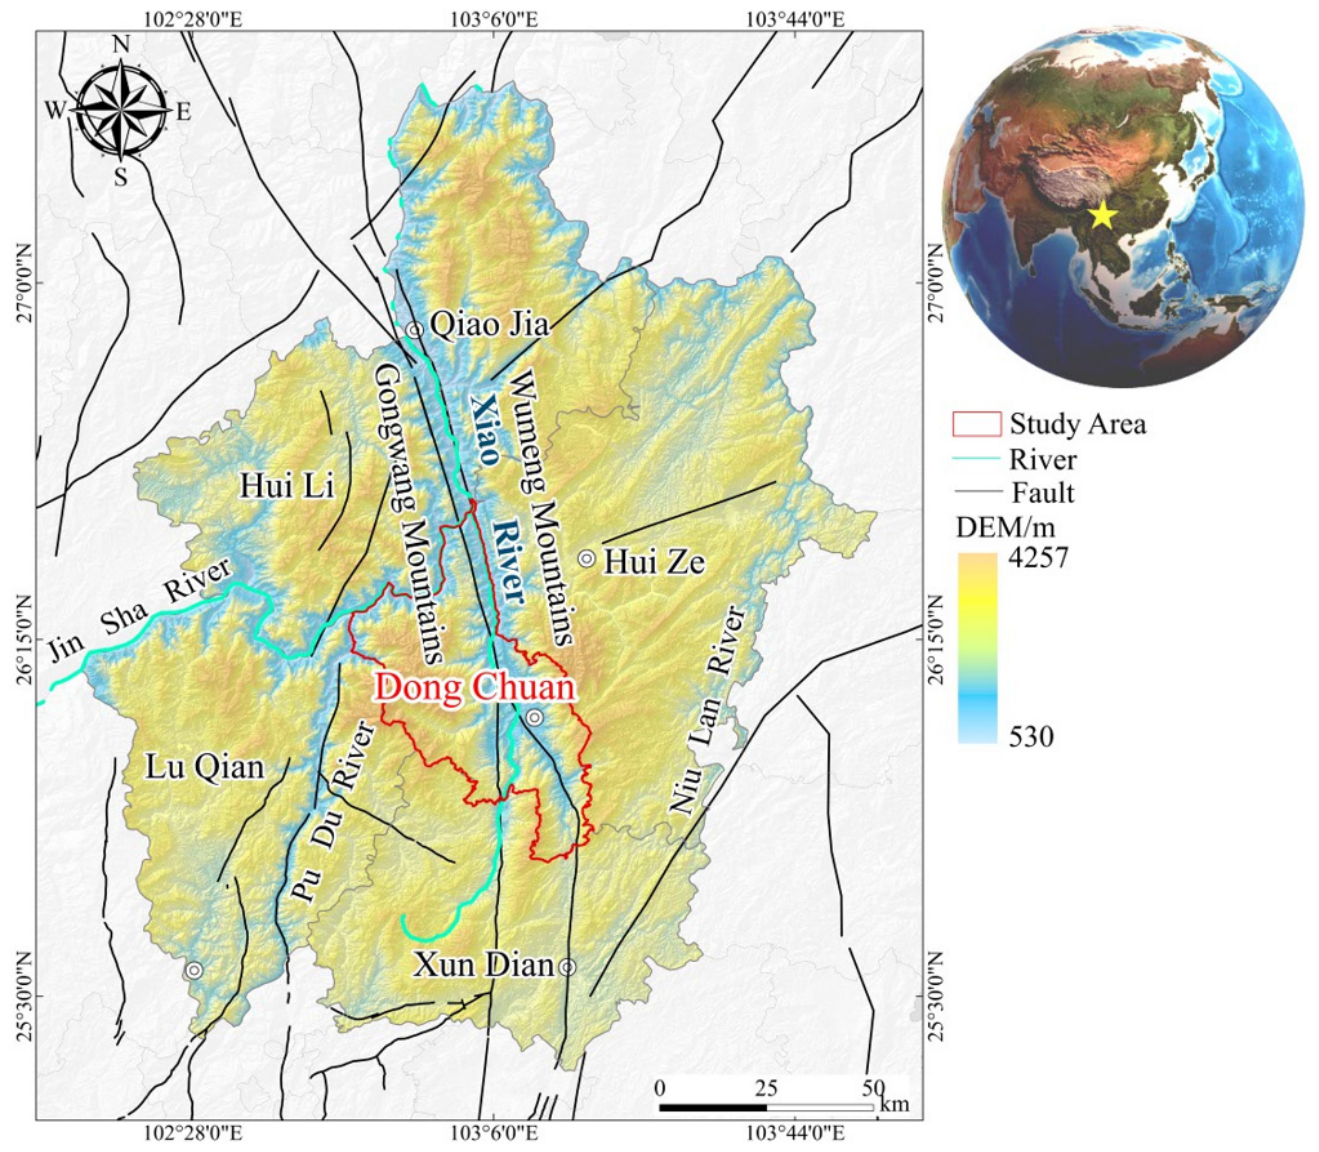
The Dongchuan District is situated in northeastern Yunnan Province, China, spanning longitudes from 102°47′ E to 103°18′ E and latitudes from 25°57′ N to 26°32′ N, covering a total area of 1865.8 km2. It borders Guizhou Province to the east, Huize County to the west, Luquan County and Xundian county to the south, and Qiaojia County of Zhaotong City to the north (Figure 1). The Wumeng and Gongwang Mountains enclose the Xiao River, which flows through the entire territory from north to south, forming a distinctive alpine canyon landscape and contributing to high susceptibility to debris flows. This area is often referred to as the “World’s Museum of Debris Flows”. Notably, the study area is renowned for its abundant copper resources and boasts a mining history of over 2000 years. The topography is characterized by higher elevations in the northwest and lower elevations in the southeast; the altitude ranges from 695 m to 4344 m, and it features a subtropical monsoon climate, with an average annual temperature of 14.9 °C and mean annual precipitation of 1000.5 mm, primarily concentrated from May to September (www.kmdc.gov.cn/c/2025-04-28/7002072.shtml) (accessed on 20 October 2025).
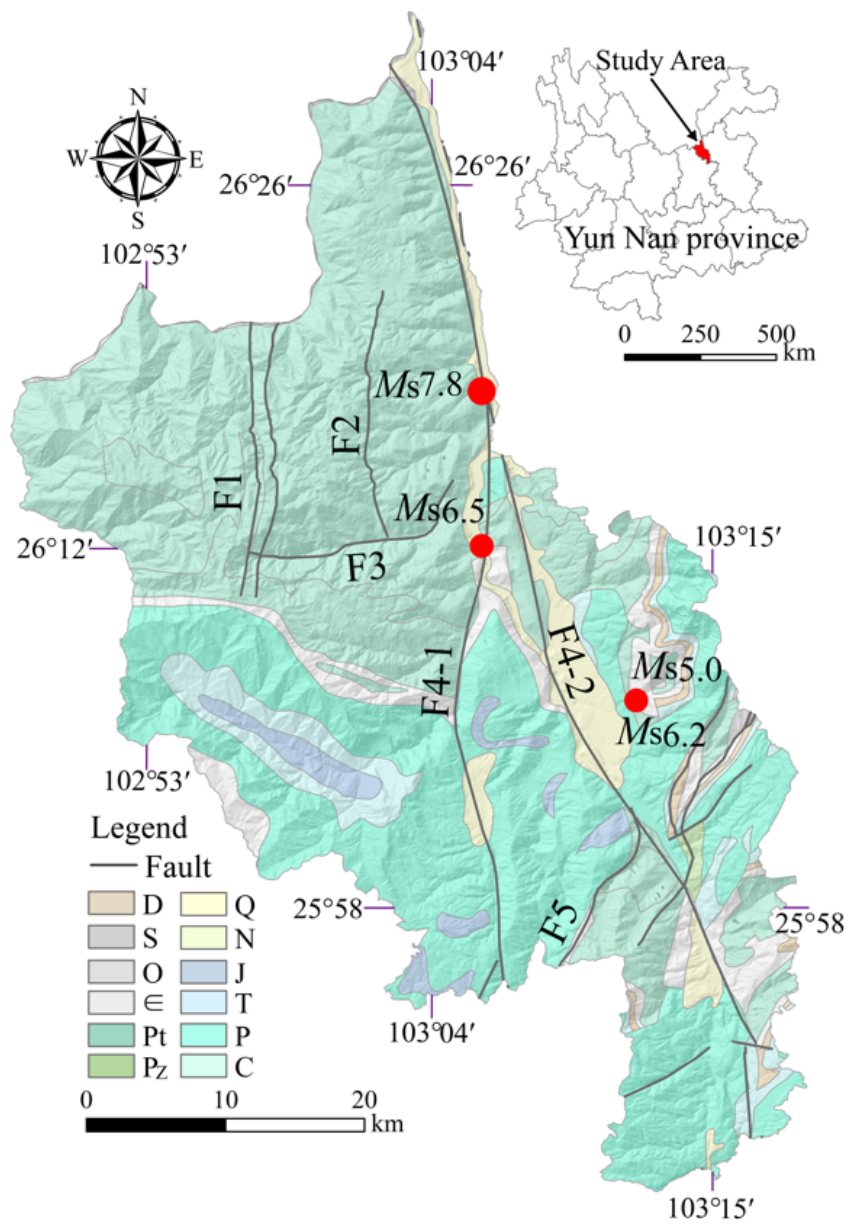
Structurally, the region lies on the western margin of the Yangtze Block, where intense tectonic activity has led to the formation of numerous faults. Major faults include the Luoxue Fault (F1), Xindianfang Fault (F2), Xinlongcun Fault (F3), Western Branch of the Xiao River Fault (F4-1), Eastern Branch of the Xiao River Fault (F4-2), and the Yulu-Daibu Fault (F5) (Figure 2). These faults are primarily N-S to NNW striking, among them, the Xiao Rive Fault (F4-1 and F4-2) is the only active fault and is characterized by left-lateral strike-slip motion [20]. Since 1733, four earthquakes with Ms > 5.0 have occurred in this region (Figure 2).
The stratigraphy of the study area is diverse, with exposed strata ranging from the Paleozoic Erathem to the Quaternary. To the west of the Western Branch of the Xiao River Fault (F4-1), the exposed strata primarily consist of Proterozoic (Pt), Cambrian (Є), Ordovician (O), Silurian (S), Permian (P), Triassic (T), Jurassic (J) and Quaternary (Q), while to the east, they are mainly composed of Paleozoic Erathem (Pz), Proterozoic (Pt), Devonian (D), Carboniferous (C), Permian (P), Jurassic (J), and Tertiary (N) and Quaternary(Q) (Figure 2).

3. Methods and Data

3.1. Landslide Mapping

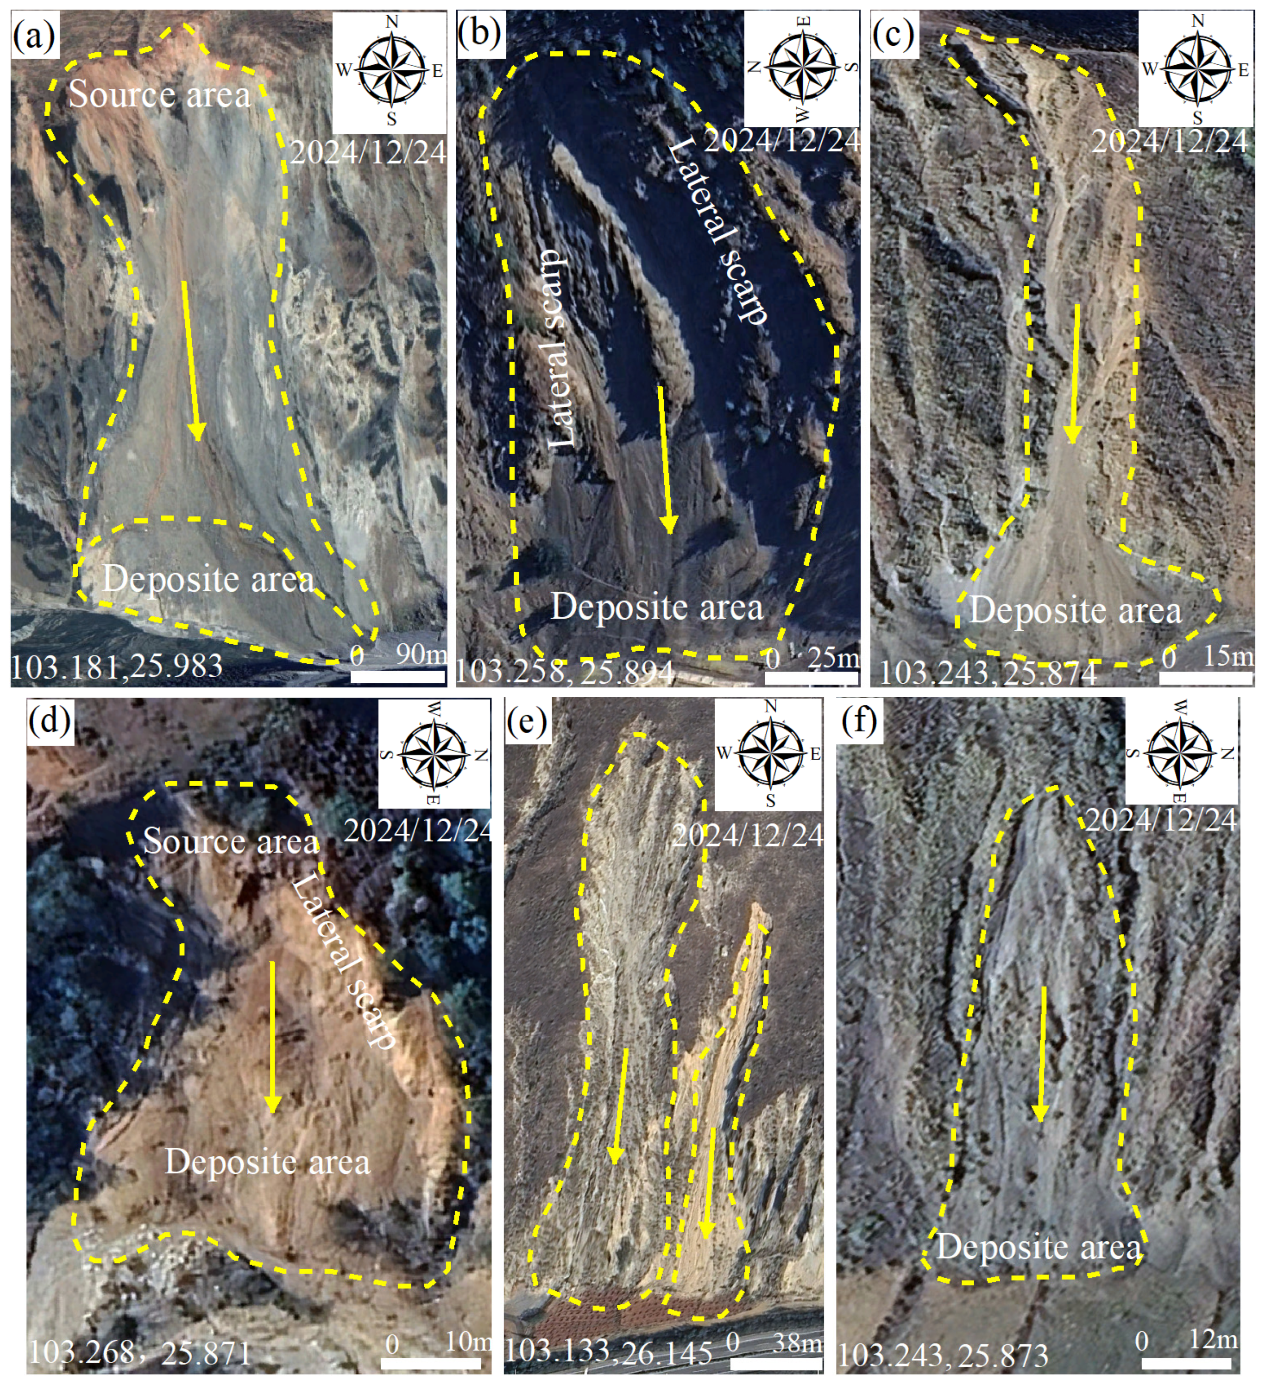
The Google Earth platform provides high-resolution satellite imagery and is widely used in landslide investigations [14,31,32]. In this study, landslides were identified and analyzed through visual interpretation of remote sensing imagery [12,33]. High-resolution images accessed via the Google Earth platform span January 2020 to March 2025, providing complete spatial coverage of the study area. The interpretation focused on landslides within the Dongchuan District, with boundaries delineated as polygons through analysis of color, texture, and topographic variations in multi-temporal images. In high-resolution imagery, most landslides appear as bright spots and preserve key geomorphic features such as landslide scarps, depressions, and accumulation bodies. These features exhibit distinct textures and spectral signatures that significantly differ from the surrounding environment (Figure 3). In this study, identified landslides were classified as recent slope failures based on qualitative assessment of relative ages from satellite imagery, using indicators such as vegetation cover, fluvial activity, erosion features, and cross-cutting relationships [7,34]. Recent landslides are typically shallow, well preserved, and less eroded than old slope failures (deep-seated landslides) [7].
To ensure comprehensive and accurate landslide identification, a systematic interpretation was conducted across the entire study area. A grid-based approach was adopted using the latitude-longitude grid provided by Google Earth (version 7.3). During interpretation, a viewing altitude of approximately 1.5 km above ground level was maintained as the baseline. When landslide outlines were not clearly discernible at this scale, the view was magnified to delineate boundaries accurately. Finally, the inventory was rigorously cross-checked to minimize omissions and commission errors.

3.2. Geometric Parameters of Landslides

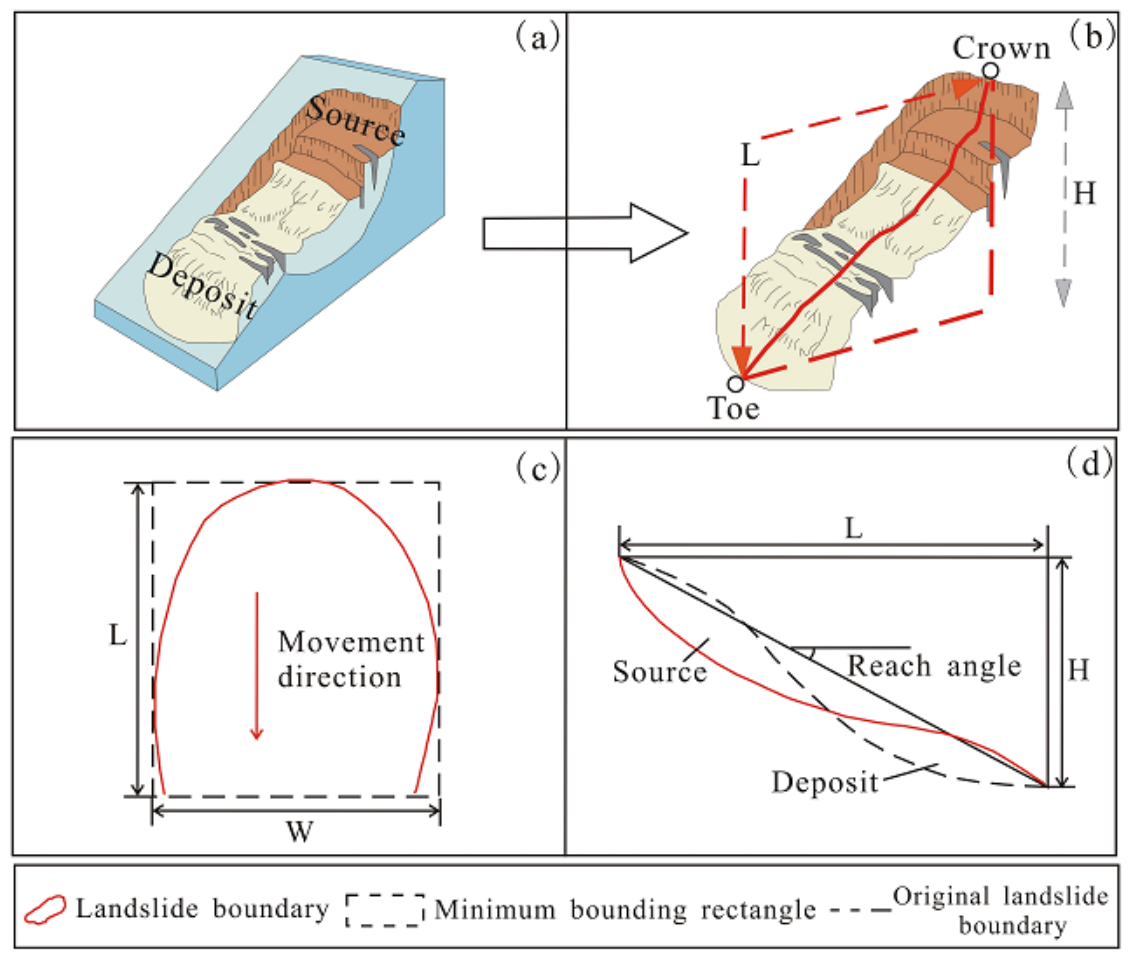
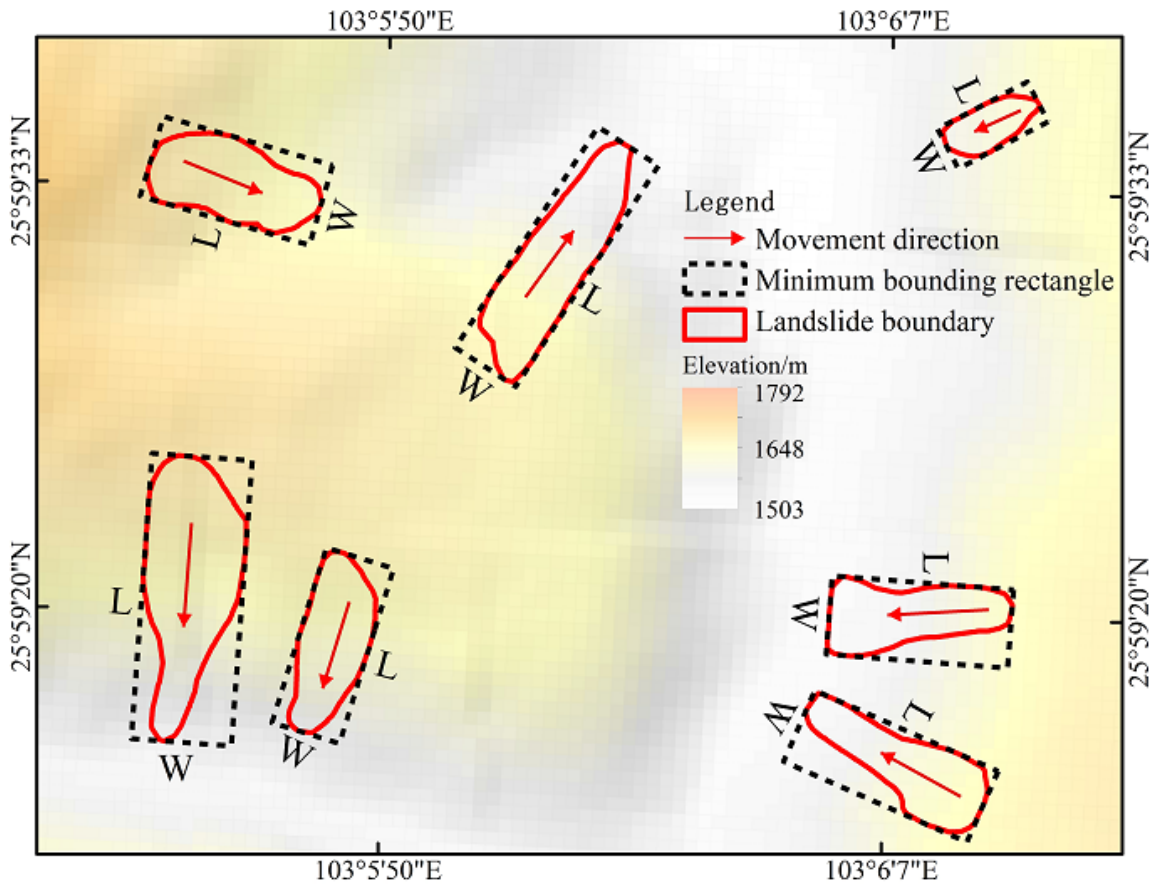
Geometric parameters are fundamental for determining landslide types and understanding their kinematic characteristics [35,36]. Among these, the length-to-width ratio (L/W) reflects the geometrical shape of a landslide, while the height-to-length ratio (H/L) and the reach angle (arctan (H/L)) represent landslide mobility [36]. In this study, the height (H) is defined as the elevation difference between the landslide crown and toe along the direction of movement (Figure 4b,d). The length (L) refers to the minimum distance from the crown to the toe along the sliding direction, and the width (W) is the maximum breadth perpendicular to the length (L) (Figure 4b–d and Figure 5) [37].
The volume of landslides is calculated using the following empirical formula [38], where V is the estimated landslide volume, and A is the landslide area. This formula was derived from a comprehensive global dataset comprising 4231 landslide records [38] and has been validated across diverse physiographic settings [39,40,41,42]. As the landslides in the study area are shallow-seated and of small to medium volumes, we set α and γ to 0.146 and 1.332, respectively, following [38].
V L = α A β   ( α = 0.146 ,   γ = 1.332 )
Figure 4. (a) Landslide slope position [43]; (b) Landslide length and height map [43]; (c) Landslide length and width [44]; (d) Landslide height and the reach angle [45].
Sustainability 18 03994 g004
Figure 5. Sketch showing seven examples of landslide minimum bounding rectangles and siding directions that can be used to estimate the length and width of a landslide. These landslide boundaries were derived from the landslide inventory of the Dongchuan District.
Sustainability 18 03994 g005

3.3. Data Source

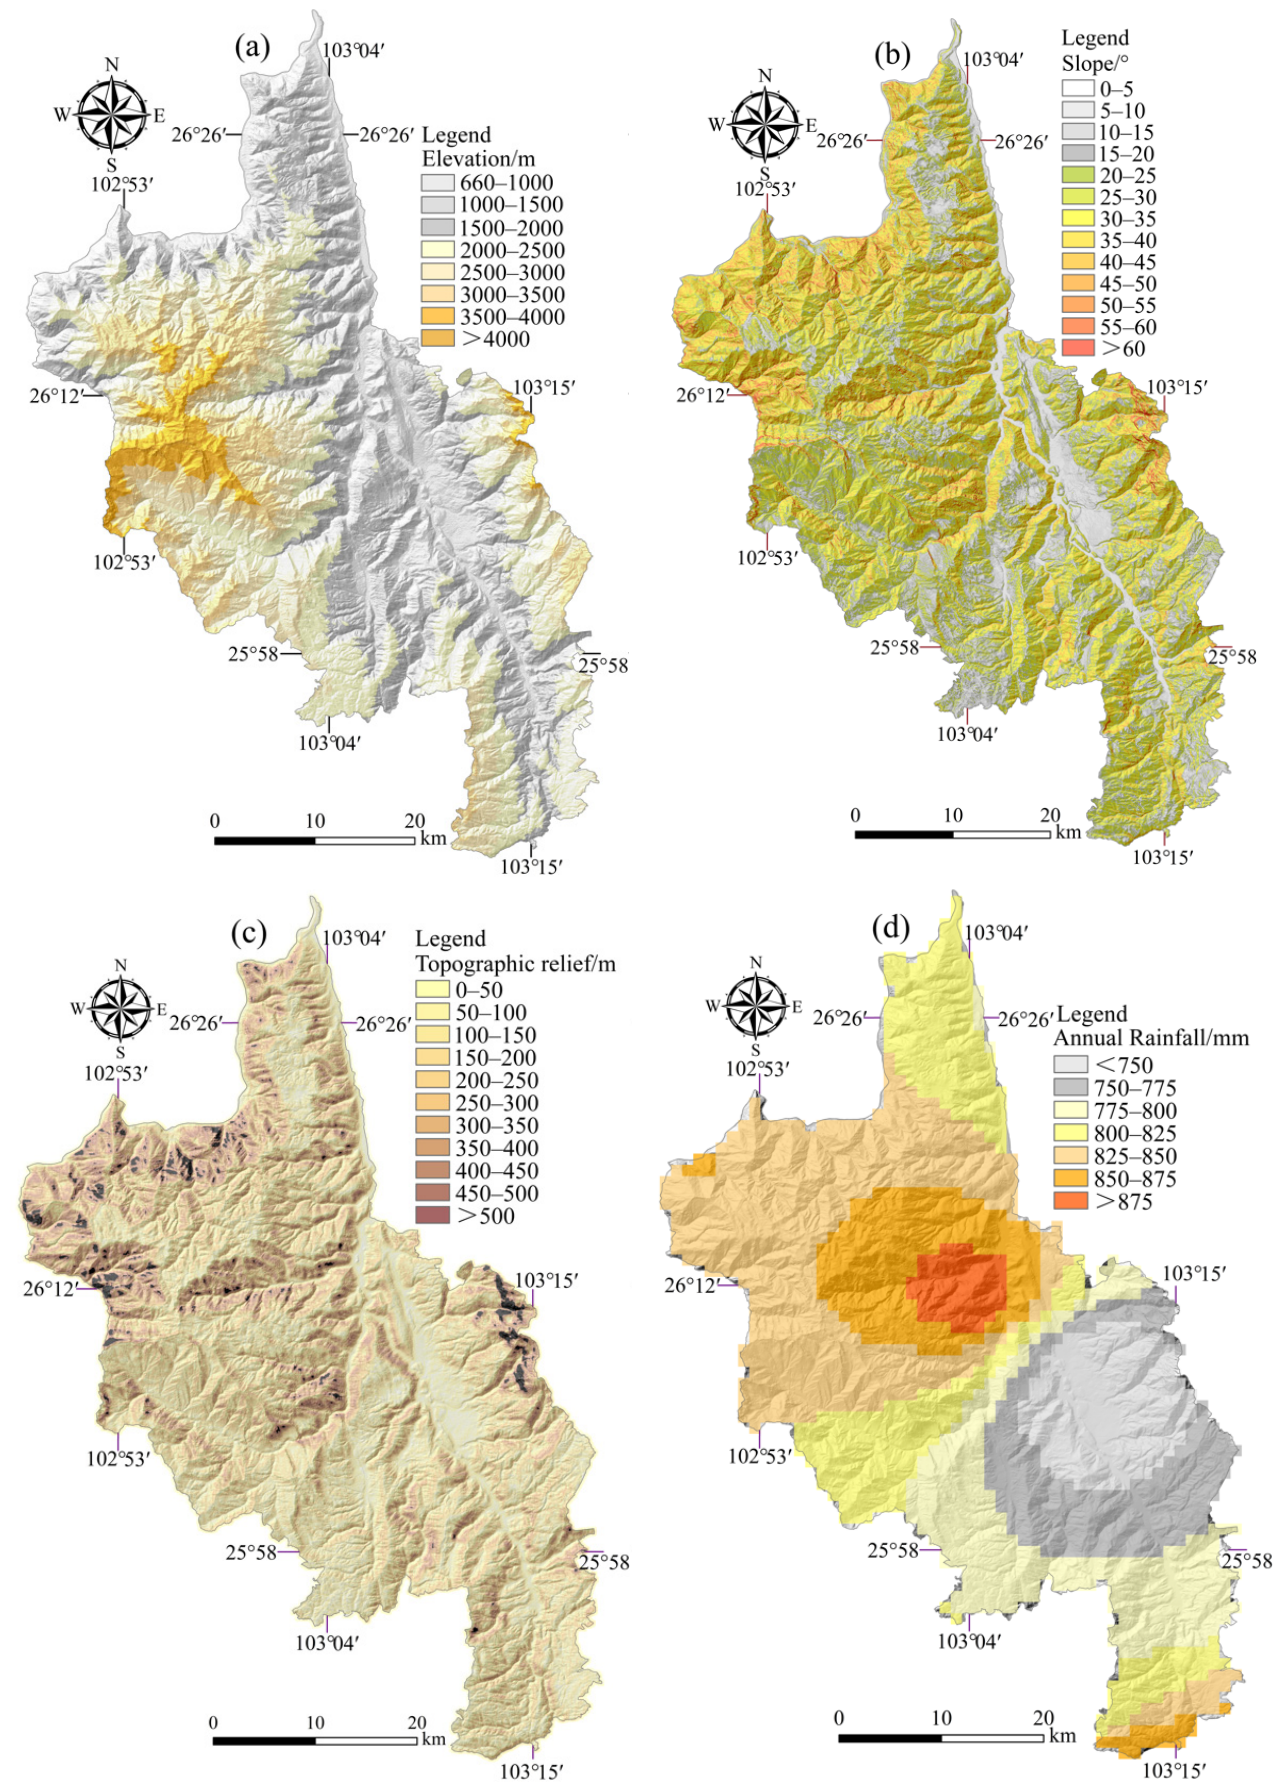
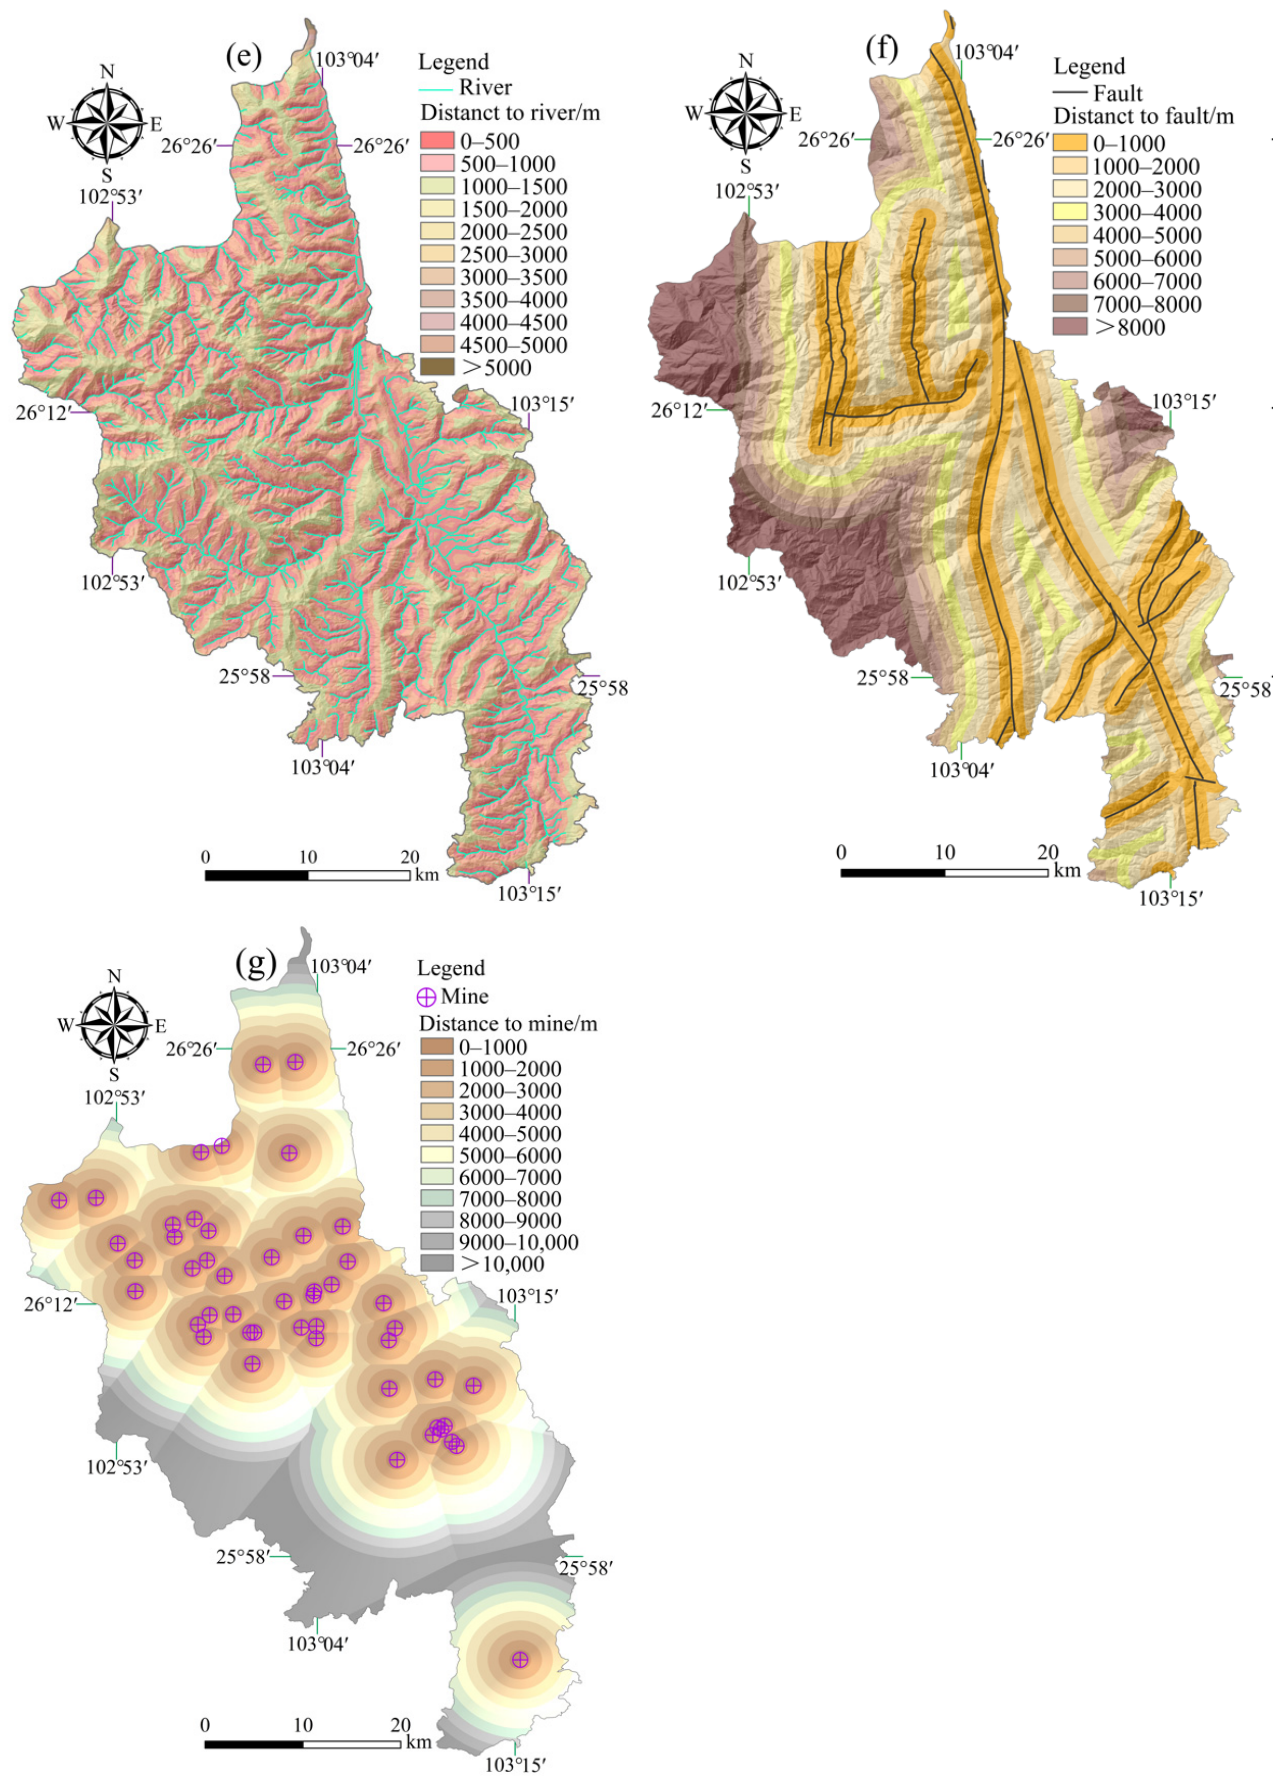
Various factors influence the spatial distribution of landslides, and their interactions with landslides vary significantly across different regions [3,4,5]. This study investigated the impact of nine factors (elevation, slope, aspect, topographic relief, rainfall, lithology, distances to rivers, faults and mines) on the spatial distribution of landslides. A 12.5 m resolution ALOS PALSAR DEM served as the foundational data source. From this DEM, we extracted elevation (Figure 6a), slope (Figure 6b), aspect, topographic relief (Figure 6c), and river networks. Annual average rainfall (Figure 6d) data was calculated using Kriging interpolation based on long-term precipitation records from 8 meteorological stations surrounding the study area. Lithology and fault data were obtained from the 1:200,000-scale Geological map (http://www.cgs.gov.cn, accessed on 20 October 2025) and the Chinese active tectonic map [46]. Mining site data were obtained from the Natural Resources Bureau of Dongchuan District as of December 2025. Distances to rivers, faults and mines (Figure 6e–g) were calculated using ArcGIS Spatial Analyst tool (version 10.6), measuring the distance from each grid cell center to the nearest rivers, faults, and mines. All of the influencing factor layers were transformed into raster format with a grid size of 12.5 m × 12.5 m. These layers are illustrated in Figure 6. This paper calculated landslide number density (LND) and landslide area density (LAD) for each influencing factor. Detailed descriptions and calculation methods are provided in previous studies [47,48,49,50].

4. Result

4.1. Landslide Inventory Map

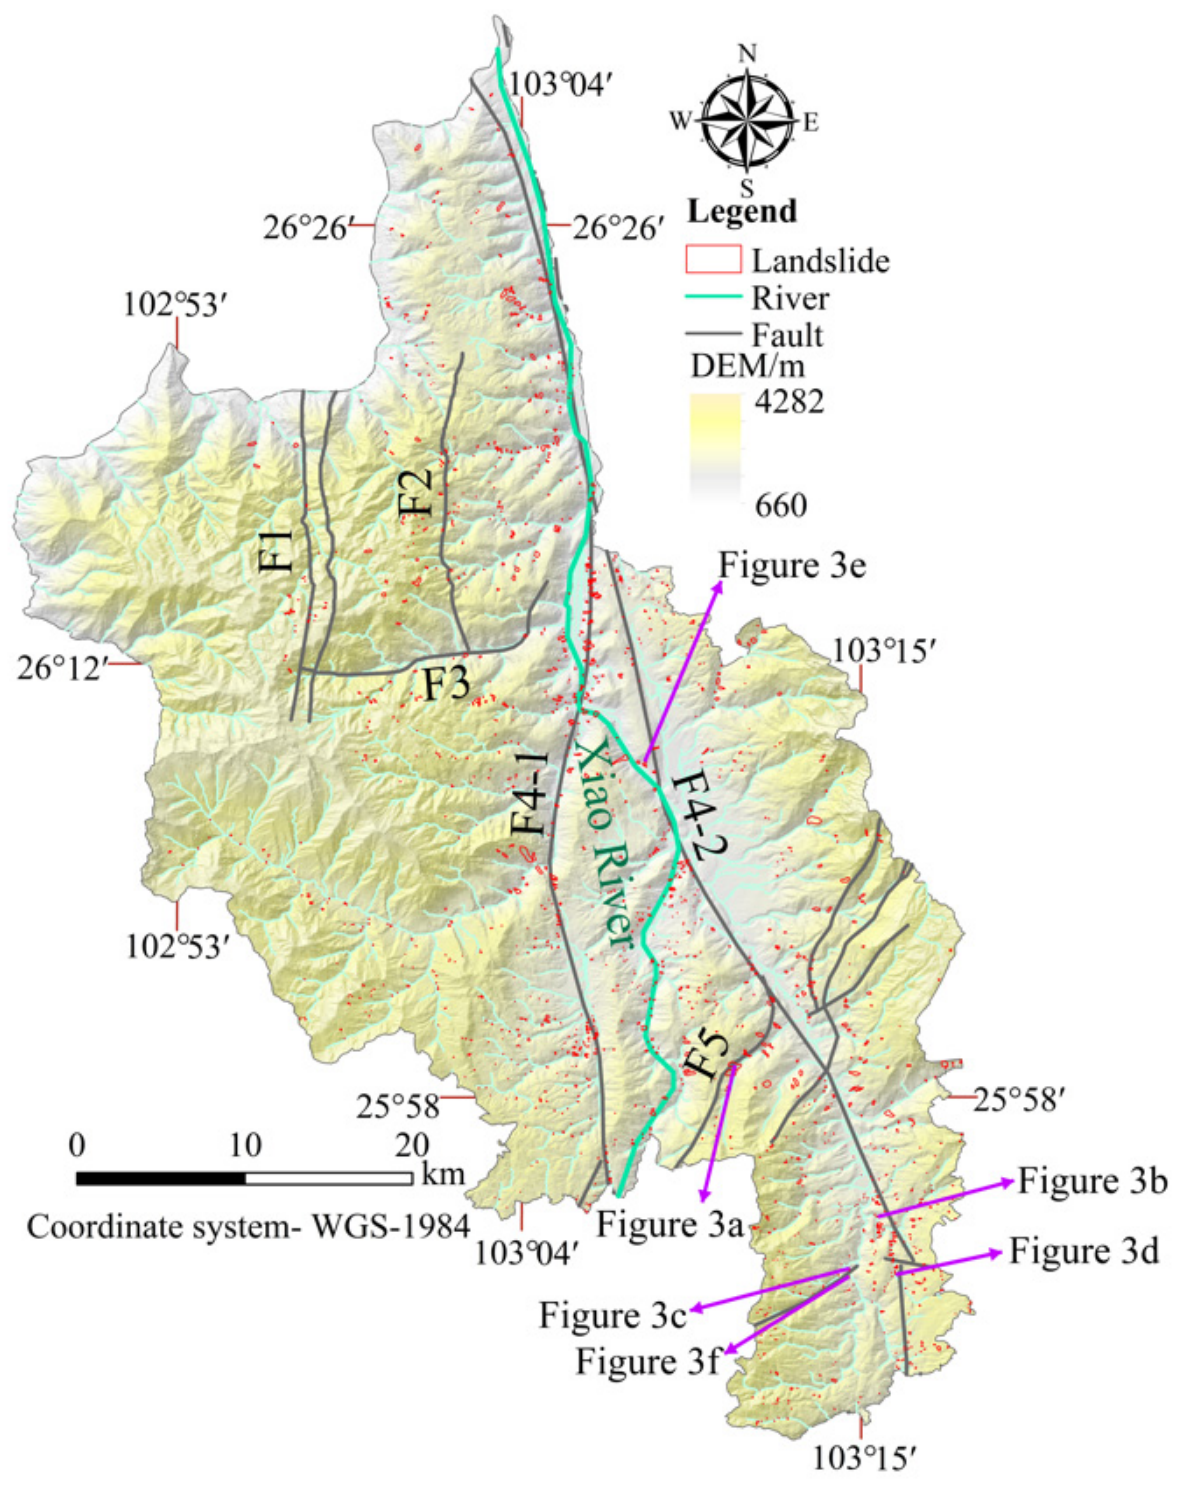
Detailed and accurate landslide inventory maps are crucial for analyzing landslide spatial patterns [51,52]. In this study, a total of 1623 landslides were identified, covering a cumulative area of 10.36 km2 (Figure 7). Individual landslide areas ranged from 74.8 m2 to 279,181 m2, with an average area of 6384 m2. Based on the empirical volume formula [38] and size classification criteria [53], 346 landslides (21.32%) had volumes between 101 and 103 m3, while 1273 landslides (78.43%) ranged from 103 to 106 m3, and only 4 landslides (0.25%) had volumes between 106 and 109 m3. Consequently, medium-sized landslides predominated, followed by small-sized ones. According to the updated Varnes classification [54], the predominant types were debris flows and shallow landslides, followed by rock topples and rock slides.
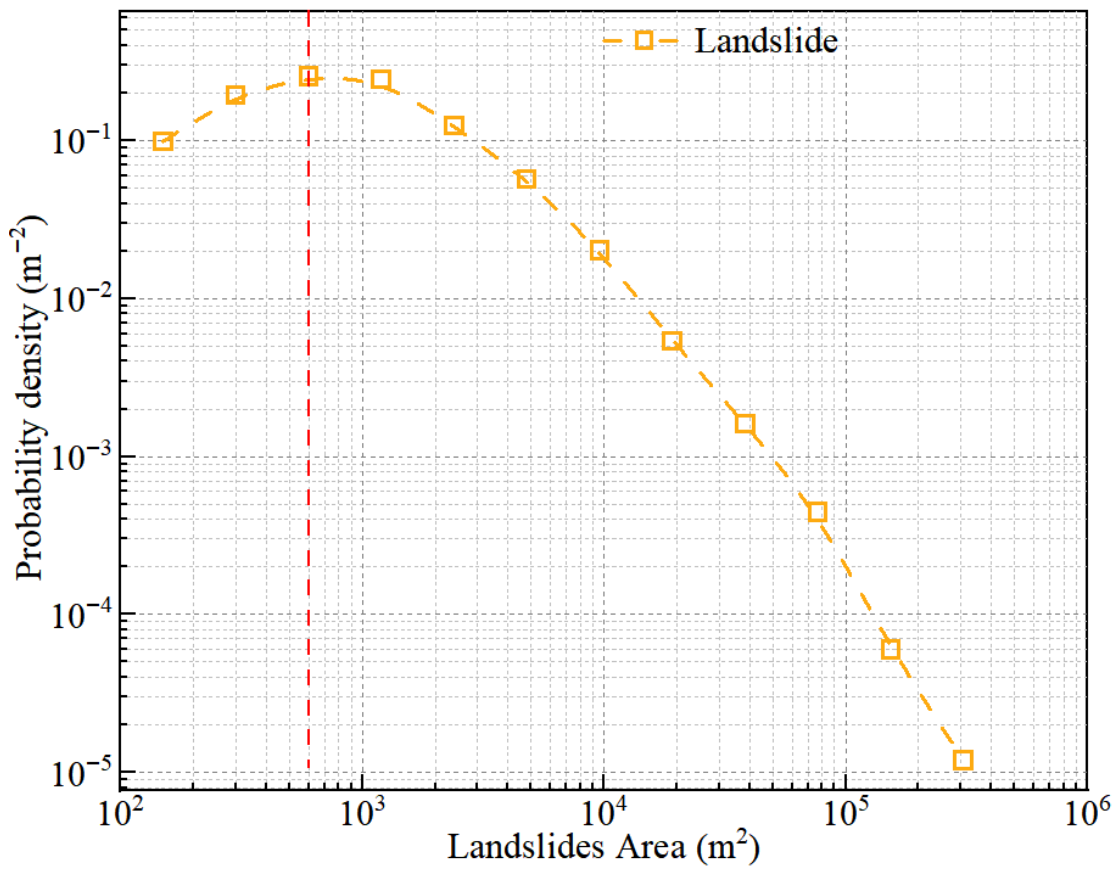
Figure 8 illustrates the probability density distribution of landslide areas in log-log coordinates. The distribution curve follows an inverse gamma pattern, exhibiting a pronounced inflection point at an area of approximately 102 to 103 m2. Beyond this point, the probability density decreases gradually with increasing landslide area. This observed pattern suggests that the identification and interpretation of the landslides were thorough and comprehensive [55].

4.2. Spatial Distribution Characteristic of Landslides

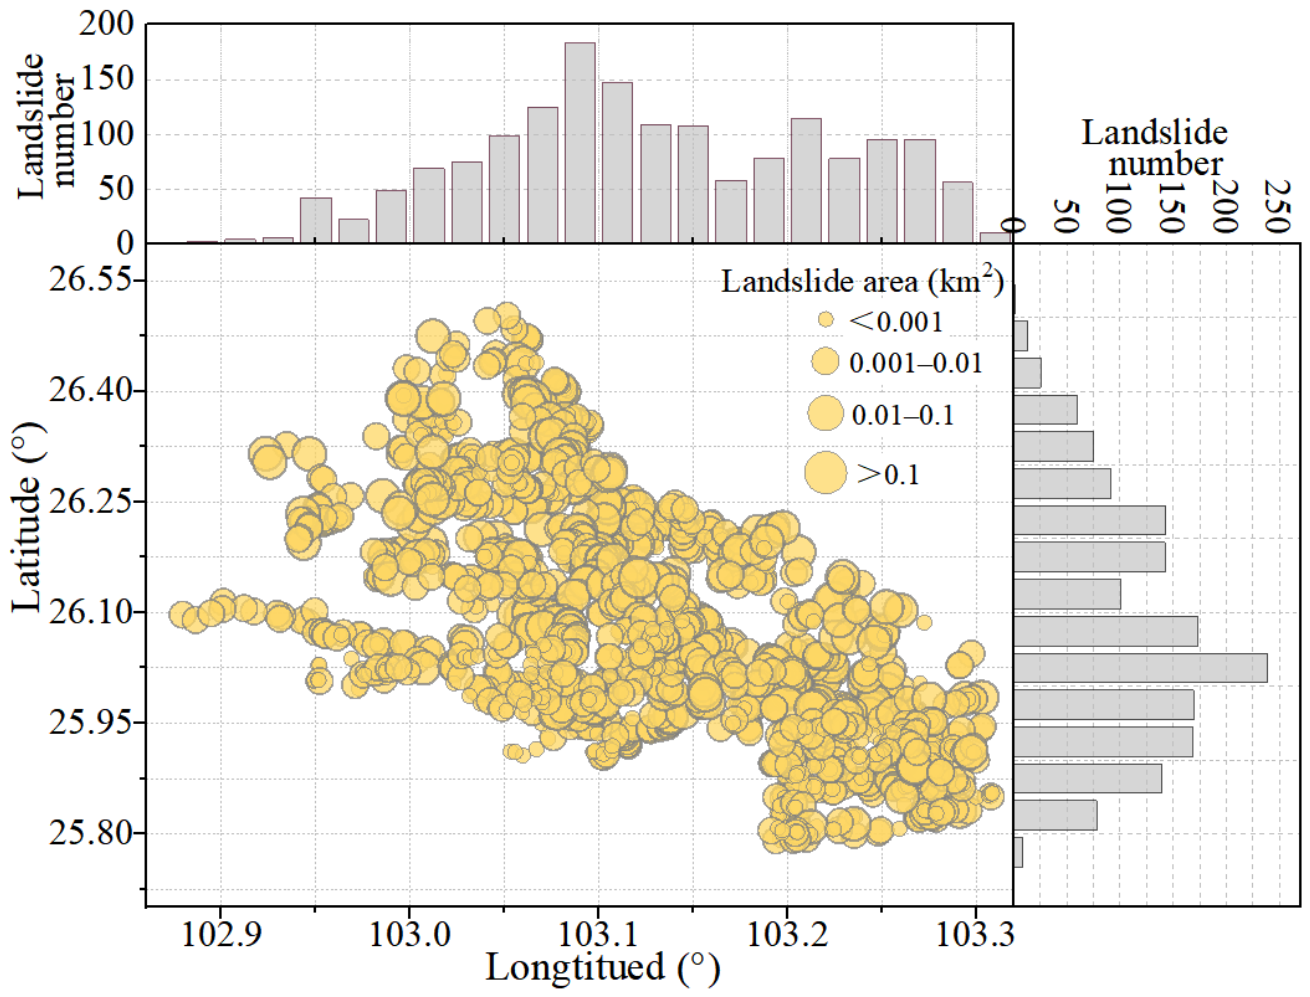
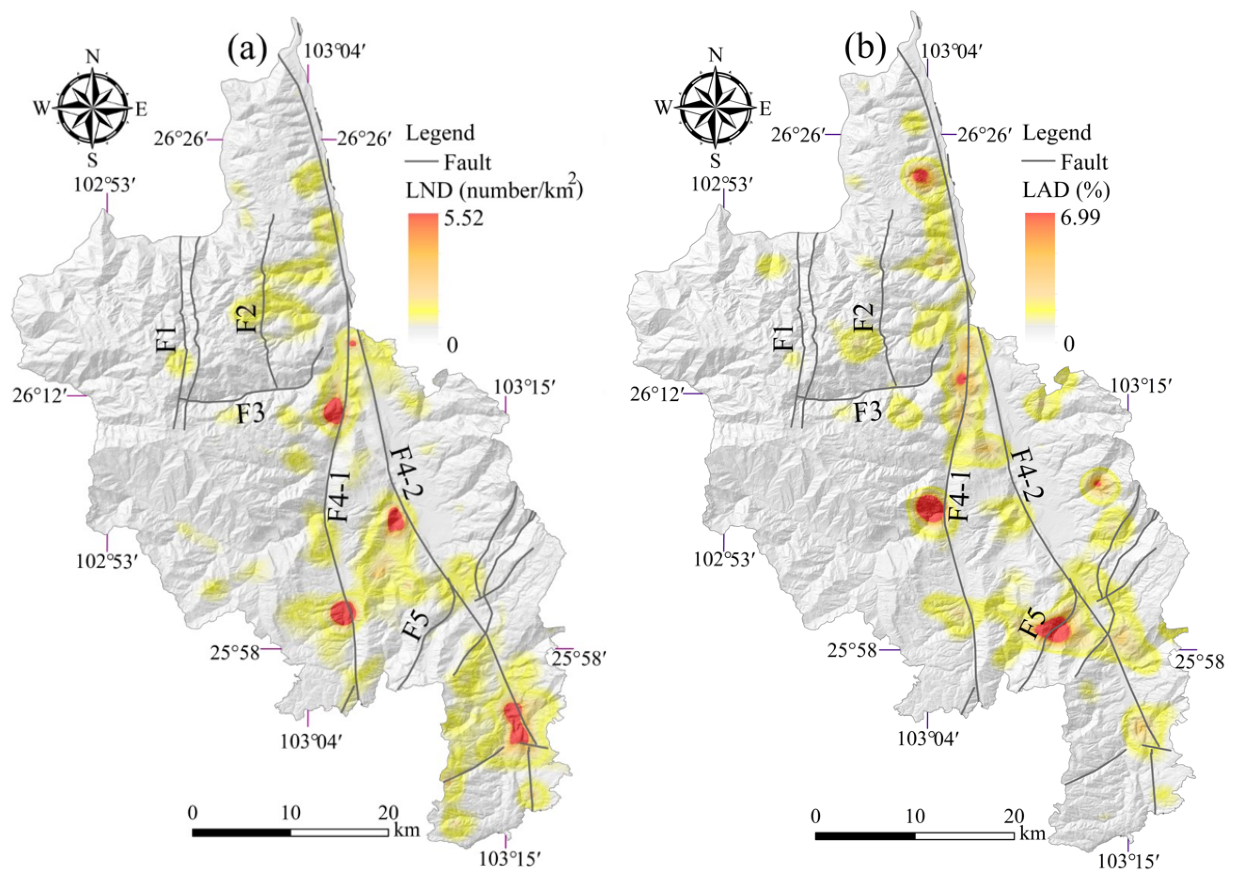
Figure 9 reveals that landslides in the Dongchuan District exhibit marked clustering in the central and southeastern parts of the study area. Regions adjacent to the Xiao River Fault (F4-1 and F4-2) are identified as high-density landslide zones (Figure 10). Regarding landslide size, larger events (>0.01 km2) are predominantly distributed along both sides of these fault segments.
The landslide number density (LND) and landslide area density (LAD) for the study area were calculated using the kernel density analysis tool in ArcGIS, with a moving window radius of 2.5 km (Figure 10a,b). The resulting maps show distinct distribution patterns, with peak values of 5.52 landslides/km2 and 6.99%, respectively. Interestingly, the spatial distributions of LND and LAD exhibit similarities, with their highest values generally co-located near major faults. Specifically, the highest LND (5.52 landslides/km2) is observed along the western (F4-1) and eastern (F4-2) branches of the Xiao River Fault, while the corresponding LAD in this area is only 2.36% (Figure 10a). This disparity suggests a concentration of smaller landslides. Conversely, the highest LAD (6.99%) occurs in the central part of the study area, near both the western branch of the Xiao River Fault (F4-1) and the Yulu-Daibu Fault (F5) (Figure 10b). This area has a moderate LND of only 2.41 landslides/km2, associated with a propensity for larger landslides.

4.3. Relationship Between Landslide and Various Influencing Factors

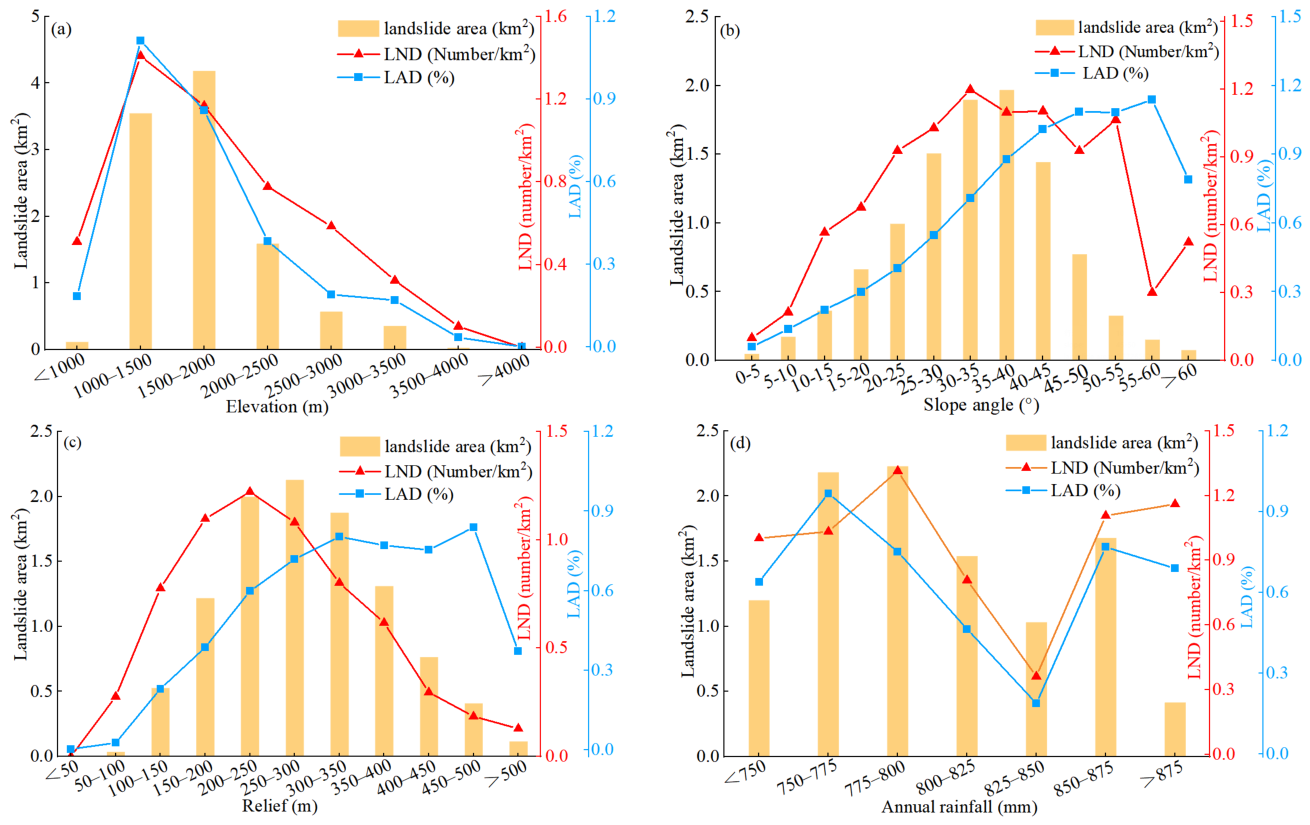
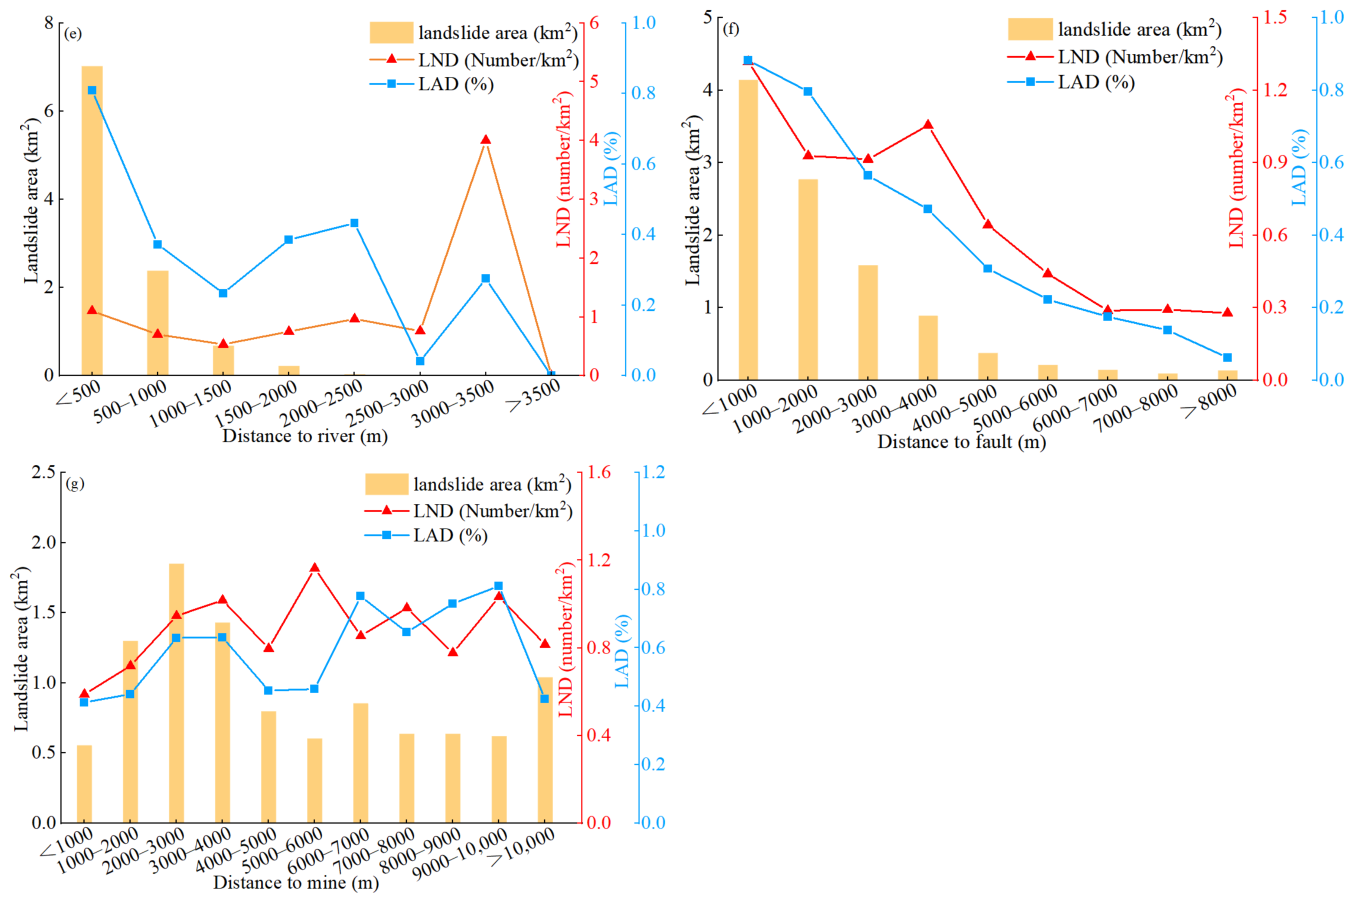
Figure 11 illustrates the relationship between landslide abundance (LND and LAD) and various influencing factors. Regarding elevation, both LND and LAD showed an initial increase followed by a decrease with rising elevation. Landslide areas were predominantly concentrated within the 1000–2000 m range, accounting for 74.45% of the total area. The highest LND and LAD of 1.41 numbers/km2 and 1.11%, respectively, occurred between 1000 and 1500 m (Figure 11a). For slope, the distribution of landslide areas followed a pattern similar to that of elevation. Most landslide areas were found on slopes of 20–45°, comprising 75.23% of the total. LND peaked at 1.20 numbers/km2 within the 30–35° range, while LAD reached its maximum of 1.14% between 55 and 60° (Figure 11b). In terms of topographic relief, landslide areas were mainly distributed within the 150–400 m range, representing 64.1% of the total area. Both LND and LAD tended to rise with increasing relief, reaching maxima of 1.22 numbers/km2 at 200–250 m and 0.83% at 450–500 m (Figure 11c). Regarding rainfall, landslides were predominantly found in areas with annual rainfall between 750 and 825 mm, accounting for 57.90% of the total landslide area. The highest LND and LAD of 1.31 numbers/km2 and 0.97%, respectively, were observed in the 775–800 mm and 750–775 mm ranges (Figure 11d). For distance to rivers, most landslide areas were located within a distance of 1000 m from the river, comprising 90.87% of the total landslide area. Both LND and LAD decreased clearly as distance increased. The maximum LND of 4.0 numbers/km2 occurred at 3000–3500 m from rivers, while the highest LAD of 0.81% was found within 0–1000 m (Figure 11e). The trend for distance to faults was similar to that for rivers. Landslides were mainly distributed within 3000 m of the faults, making up 80.08% of the total. The highest values of LND and LAD, 1.32 numbers/km2 and 0.88% were recorded at a distance of 0–1000 m from the faults (Figure 11f). Finally, with respect to distance to mines, the majority of landslide areas were located within a distance of 1000–5000 m from the mines, comprising 52.8% of the total landslide area. The highest values of LND and LAD, 1.02 numbers/km2 and 0.64%, occurred at a distance of 3000–4000 m from the mines (Figure 11g).
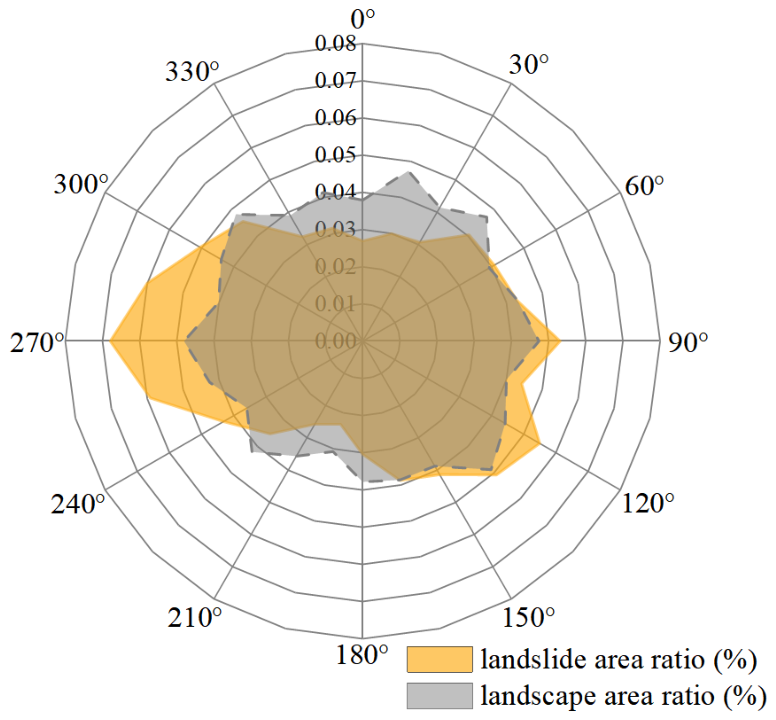
Figure 12 illustrates the distribution of landslides and the landscape (non-landslide) area ratio across different slope aspects. The landscape areas show a relatively uniform distribution, with area ratios in each aspect remaining around 0.04%. In contrast, landslide areas are predominantly concentrated on slopes facing 225–315°. Notably, within the 255–285° range, the landslide area ratio reaches a peak of 0.068%. This indicates that landslides have a strong tendency to occur on southwest-facing slopes.
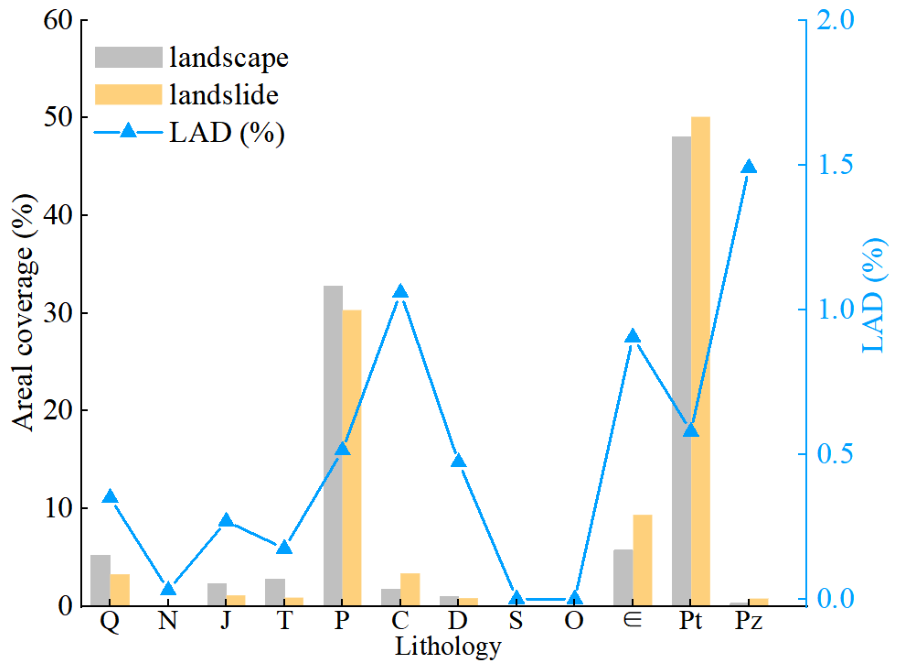
Stratigraphic lithology serves as the foundational medium for landslide initiation. Figure 13 shows the area coverage proportions (%) of landslides, landscape regions, and the corresponding landslide area density (LAD) across different lithological units. Among these, the Proterozoic (Pt) unit is the most extensive, covering 48.01% of the total study area and encompassing 50.09% of all landslides. The Permian (P) and Cambrian (Є) units rank second and third in landslide area, accounting for 30.30% and 9.38% of the total landslide area, respectively. In terms of LAD, the Paleozoic (Pz), Carboniferous (C), Cambrian (Є), and Proterozoic (Pt) units exhibit relatively high values compared with other units, indicating a higher susceptibility to landslides associated with these lithologies.

4.4. Geometric Characteristics of Landslides

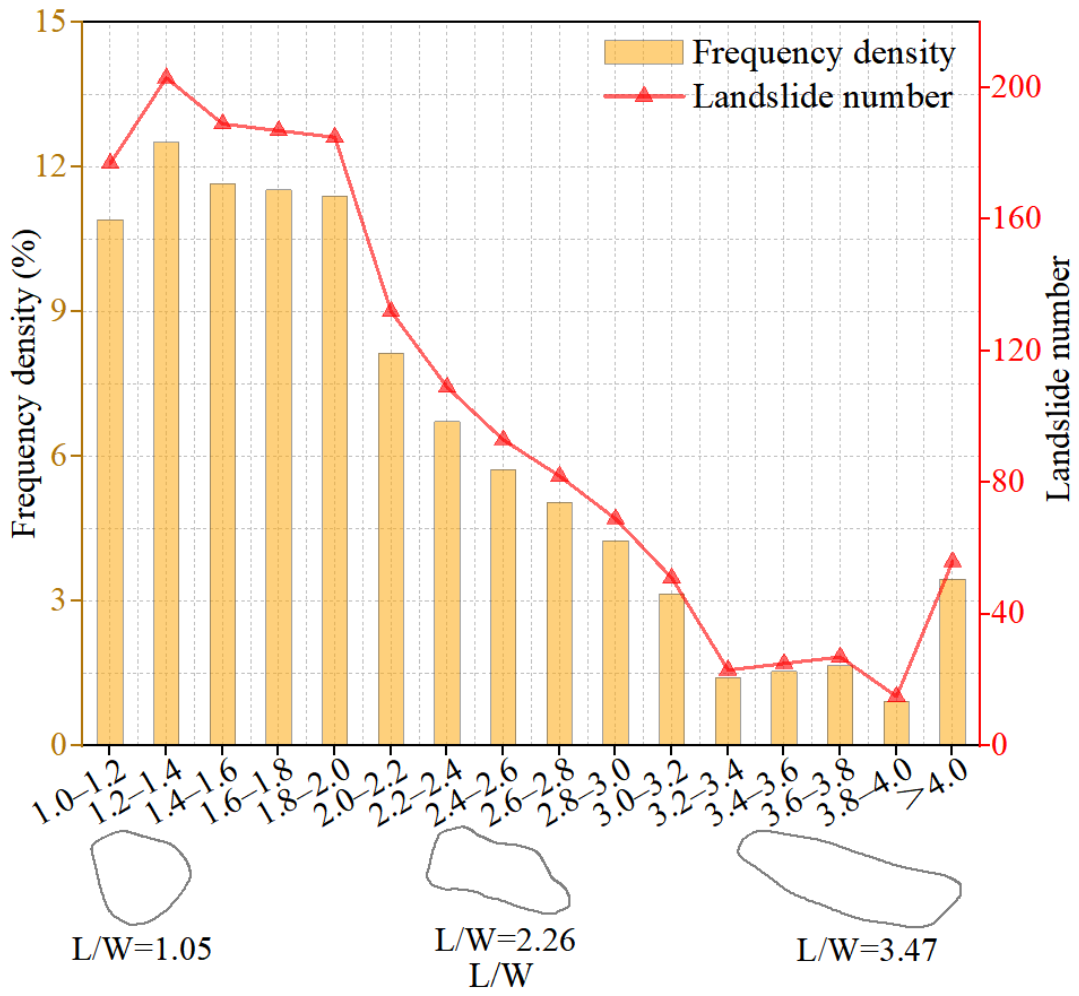
The geometric parameters of landslides are commonly used to characterize their type and kinematic attributes. Figure 14 shows the frequency distribution of length-to-width (L/W) ratios for landslides in the study area. Overall, the L/W ratios range from 1.0 to 7.2, with a mean of 2.06. Approximately 76.96% of the landslides exhibit ratios between 1.2 and 3.0, 12.14% have ratios greater than 3.0, and 10.90% fall between 0.8 and 1.2. Based on the classification criteria for landslide geometrical characteristics [36], the majority of landslides can be categorized as longitudinal landslides (1.2 < L/W ≤ 3.0), followed by elongated landslides (L/W > 3.0) and isometric landslides (0.8 < L/W ≤ 1.2).
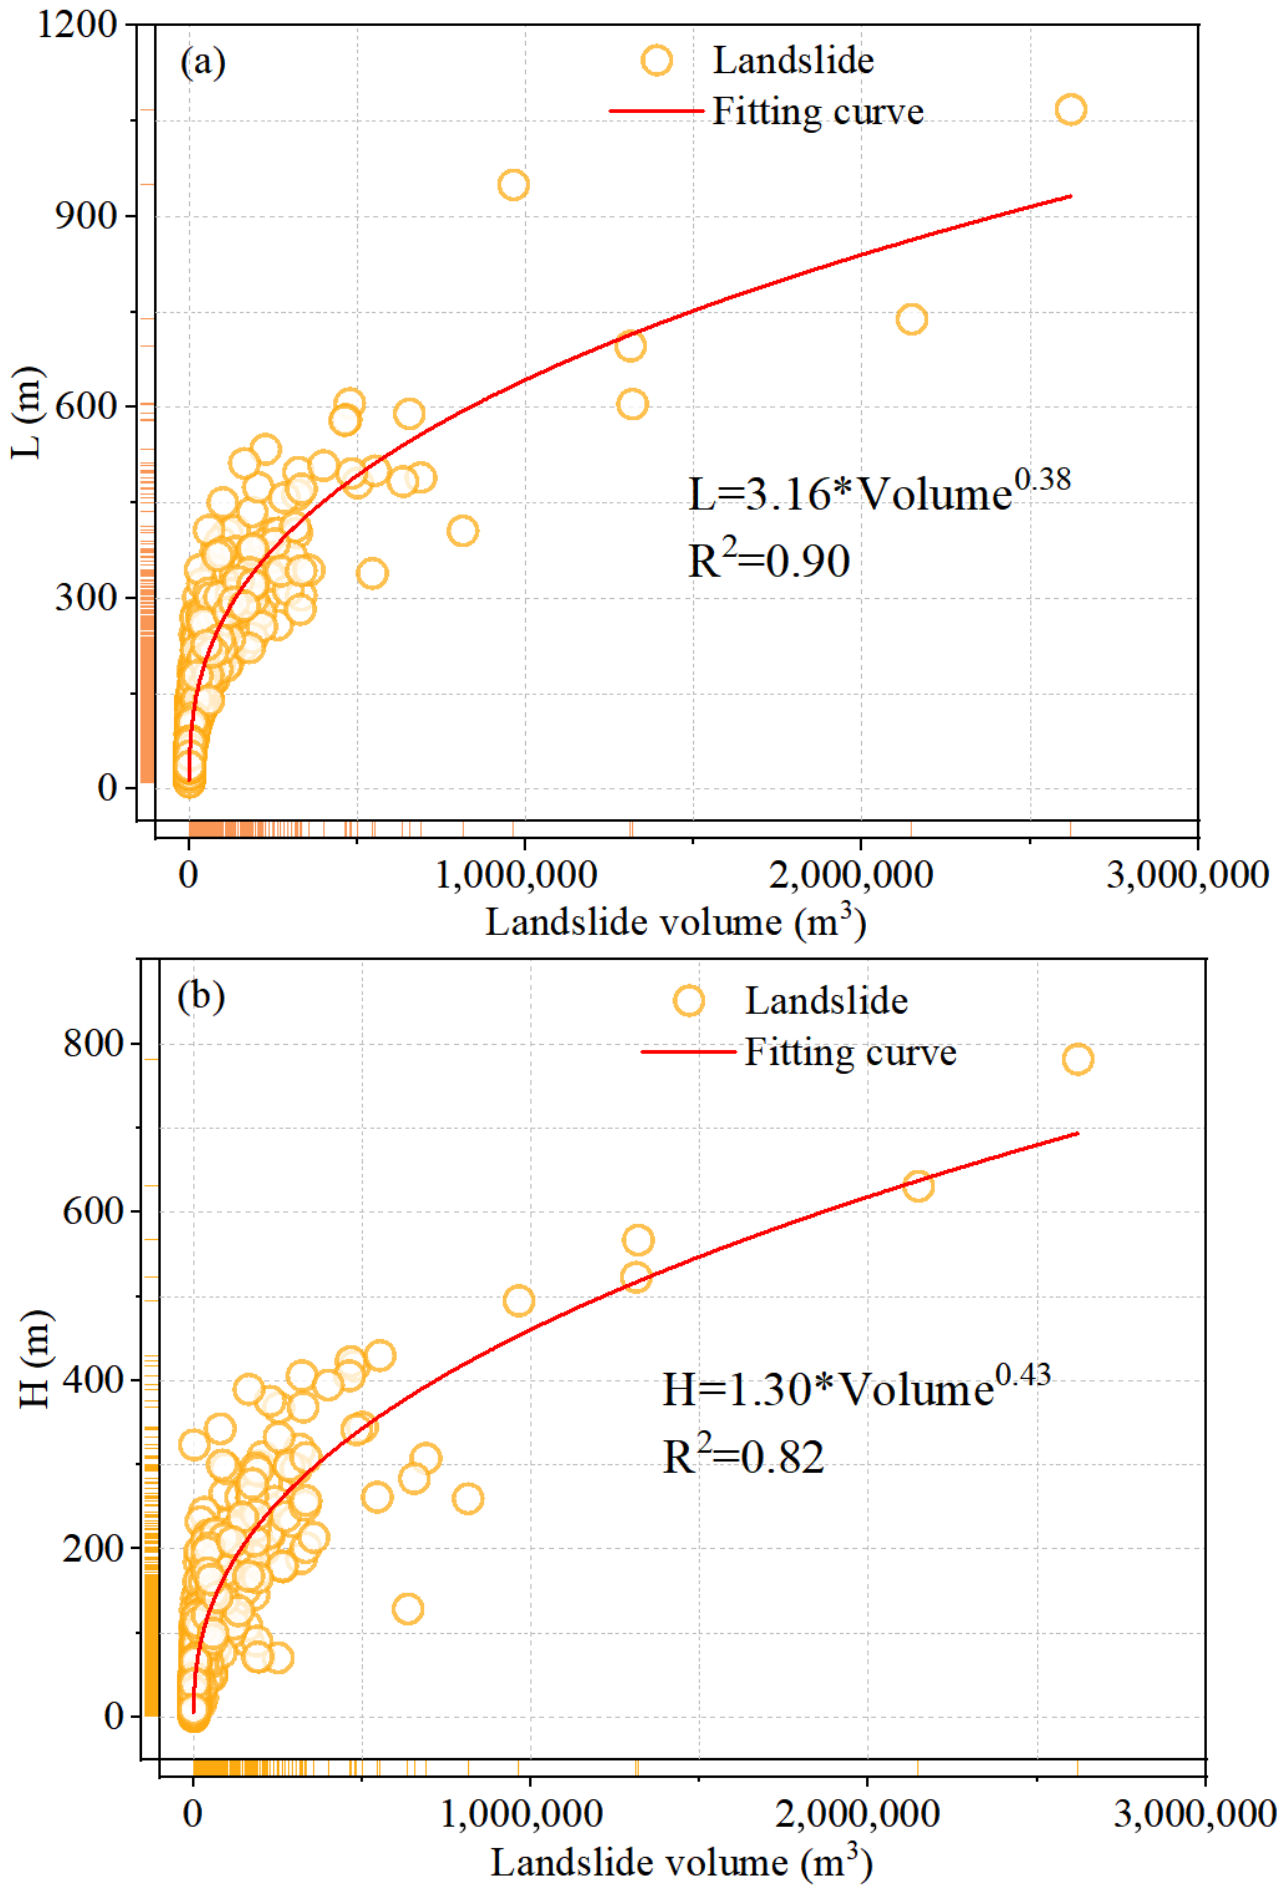
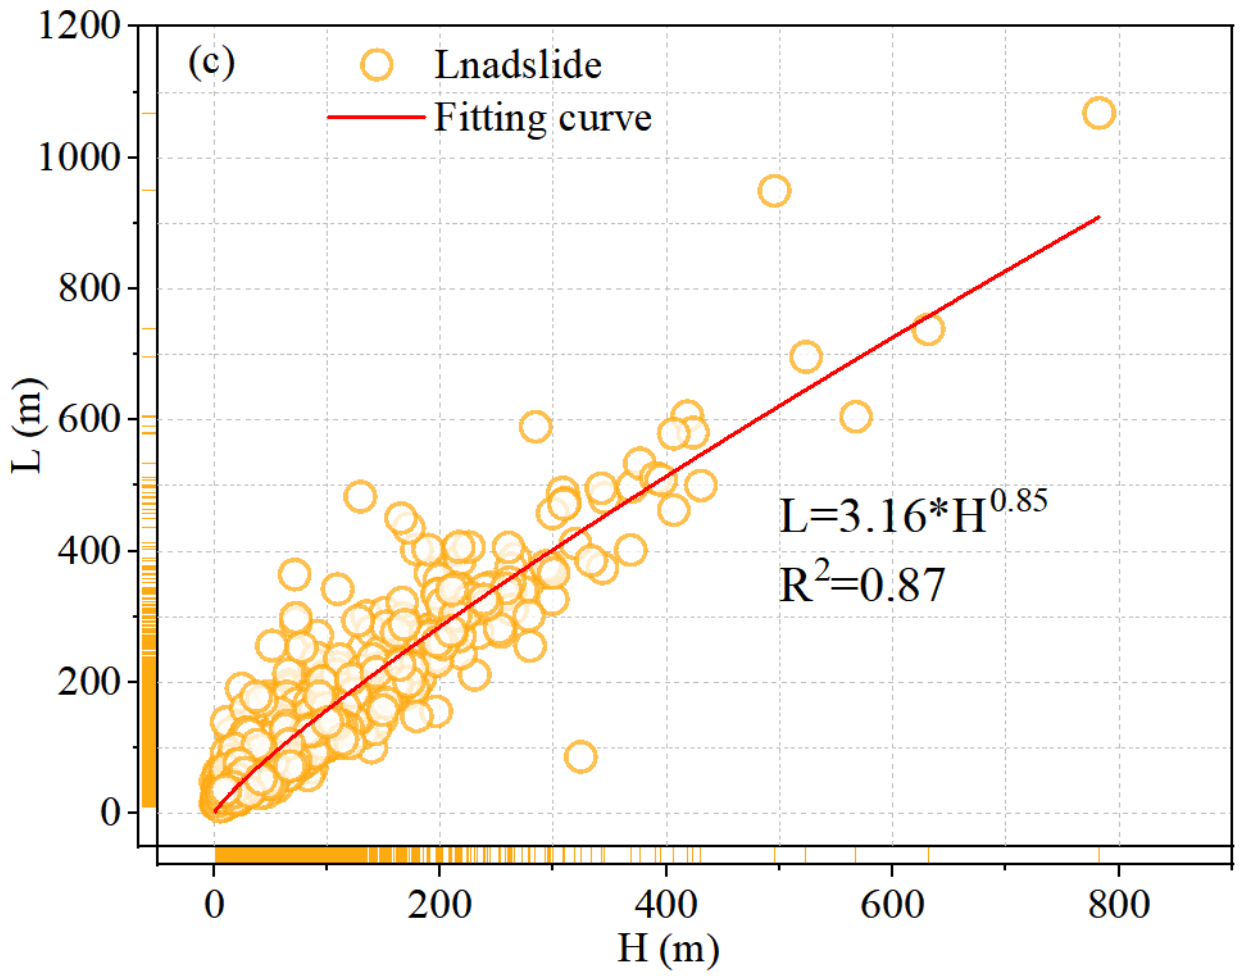
The geometric parameters of landslides are commonly employed to characterize their planar morphology and kinematic features, serving as a critical indicator for elucidating landslide movement mechanisms [35,36]. Figure 15 illustrates the relationships among landslide travel distance (L), height (H), and volume. The travel distances (L) range from 11 to 1068 m, with a mean value of 102 m, and are mainly clustered between 50 and 450 m. Landslide heights (H) range from 1 to 782 m, with an average of 62 m, and are primarily concentrated between 25 and 350 m. Both L and H exhibit allometric scaling with volume (Figure 15a,b), expressed as: L = 3.16 × Volume0.38 (R2 = 0.90) and H = 1.30 × Volume0.43 (R2 = 0.82). Furthermore, travel distances (L) also increase allometrically with height (H) (Figure 15c), following L = 3.16 × H0.85 (R2 = 0.87). These findings indicate that both landslide travel distance (L) and height (H) increase allometrically with volume, with travel distance also scaling allometrically with height.

5. Discussion

5.1. Controlling Factors Affecting the Distribution of Landslides

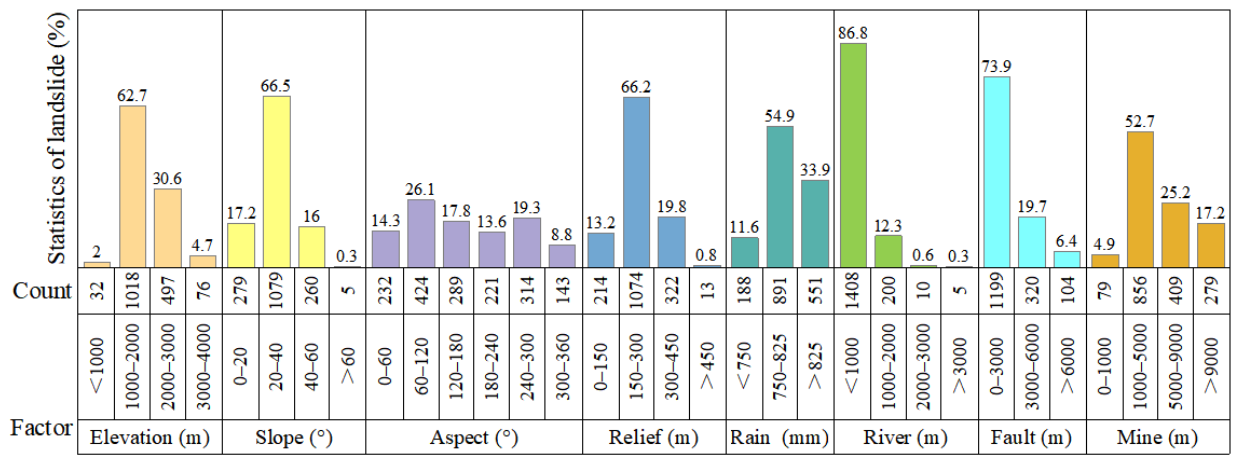
Understanding the spatial characteristics of landslides requires a comprehensive analysis of their complex interactions with topography. In this study, landslides in the Dongchuan District exhibited a distinct distribution pattern, with approximately 62.7% of them concentrated at elevations between 1000 and 2000 m (Figure 16). Slope angle is a key indicator of a slope’s potential energy and directly influences the scale of potential landslide events [56]. The majority of landslides were distributed within slope angles of 20° to 40°, accounting for 66.5% of the total landslide number (Figure 16). Although landslide frequency shows a relatively uniform distribution across aspects ranging from 0° to 300°, landslides are predominantly concentrated in the aspects ranges of 60–120° and 240–300° (Figure 16). This pattern is attributed to higher rainfall intensities in these directions, influenced primarily by moisture transport from the Indian Ocean to the south. The combined effects of rainfall loading and hydro-mechanical softening drive slope instability in these aspects. Topographic relief is another important factor influencing landslide distribution, with 66.2% of all landslides occurring in areas with relief between 150 and 300 m, indicating higher susceptibility in these regions (Figure 16). Rainfall is a primary trigger of landslides [57]. The Dongchuan District receives abundant rainfall, about 54.9% of landslides are located in areas with annual precipitation ranging from 750 to 825 mm (Figure 16). Rainfall undermines slope stability by facilitating water infiltration through surface cracks, which reduces the shear strength of soils and thereby increases slope susceptibility. In terms of distance to rivers, 86.8% of landslides occur within 1000 m of rivers (Figure 16). Similarly, 73.9% of landslides are distributed within 3000 m of fault lines (Figure 16).
Anthropogenic engineering activities constitute a primary control on landslide formation and spatial distribution by inducing intense disturbances to the surface environment. With 52.7% of landslides occurring within 1000–5000 m of mines (Figure 16). The study area, historically renowned as China’s “Copper Capital”, has abundant copper resources and a multi-millennial history of mining and metallurgy, which has represented a sustained perturbation to regional geological system. Specifically, open-pit excavation induces stress relief and rock mass relaxation, generating high and steep artificial slopes that severely compromise geotechnical stability. Tailings impoundments and waste rock dumps increase surface loading while potentially obstructing drainage pathways, thereby facilitating debris flows and landslide initiation. Furthermore, underground mining causes subsidence over mined-out areas (goafs), disrupting groundwater regimes and modifying hydrogeological conditions. Additionally, vegetation removal, soil structure degradation, and altered groundwater flow patterns associated with mining operations exert cumulative, long-term destabilizing effects on slope systems.
The lithology of stratigraphic units provides the geological medium for landslide initiation. Among the stratigraphic units in the study area, the Proterozoic (Pt) unit is the most widespread, hosts 50.09% of all landslides, and exhibits a relatively high LAD value of 0.58% (Figure 13), indicating higher susceptibility to landslides. The main reason is that the Proterozoic (Pt) metamorphic strata in Dongchuan District comprise a Paleoproterozoic-Mesoproterozoic rock sequence dominated by slate and phyllite. Multi-phase tectonic deformation, including the Jinning and Dongchuan orogenies, produced abundant weak structural planes such as interlayer slip zones and joint fractures. Under the coupled conditions of deeply incised valley topography and subtropical monsoon climate, rainfall infiltration and mining activities frequently trigger landslides. Petrologically, the well-developed foliation and high clay mineral content in these rocks result in significant water-induced softening and shear strength reduction, constituting the material precondition for widespread landslide development.

5.2. Correlation Between Landslide Clusters and Fault Features

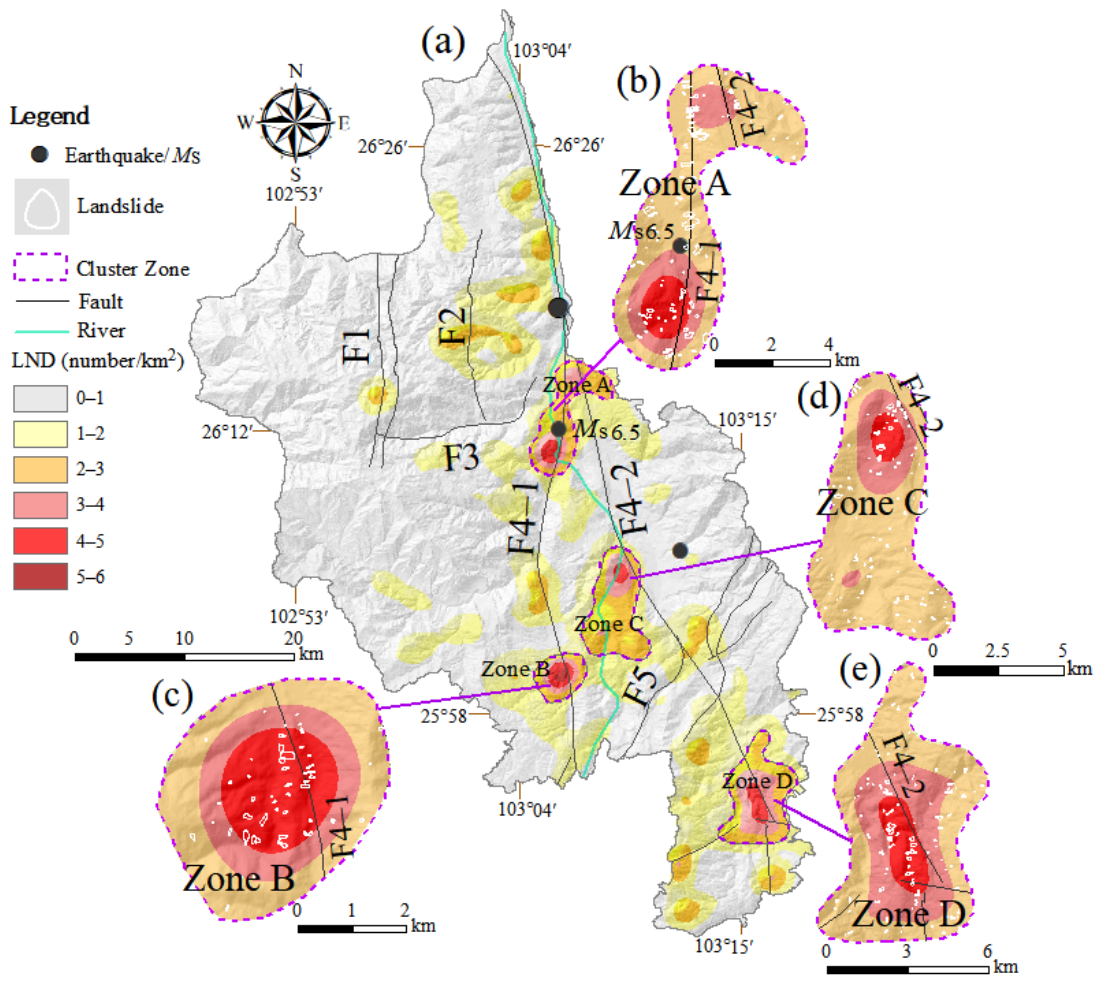
Faults play a crucial role in landslide occurrence, not only by weakening the integrity of slope rock masses but also by triggering seismic events [31]. This is evidenced by the clustering of landslides along the Xiao River Faults (F4-1, F4-2) (Figure 17a). Based on landslide number density (LND), four distinct landslide clustering zones were identified (Figure 17b–e) using the natural breaks classification method. A density threshold of 2 numbers/km2 was used to delineate the boundaries of these clusters, while 4 numbers/km2 was used to distinguish between medium- and high-density clusters. Zone A positioned in the middle segment of the Western Branch of the Xiao River Fault (F4-1), where an earthquake of Ms 6.5 has occurred. It exhibits the highest LND and LAD values of 4.89 numbers/km2 and 4.28%, respectively (Figure 17b). This zone contains a total of 115 landslides, approximately 70.7% of these landslides exhibit length-to-width (L/W) ratios of 1.2–3.0, with a mean height-to-length (H/L) ratio of 0.86 (corresponding to a mean reach angle of 40.7°). Elevations in this zone range from 1038 to 2017 m, with an average slope of 22.87° and a topographic relief of 6–494 m. Zone B lies in the southern part of the Western Branch of the Xiao River Fault (F4-1) and hosts 53 landslides, about 83% of all landslides have L/W of 1.2–3.0, with an average H/L ratio is 0.508 (26.91°). This zone exhibits the maximum LND and LAD values of 5.52 numbers/km2 and 2.36%, respectively (Figure 17c). Elevations range from 1419 to 2051 m, with a mean slope of 23.70° and relief ranging from 31 to 442 m. Zone C is found near the middle segment of the Eastern Branch of the Xiao River Fault (F4-2), encompassing 119 landslides with LND and LAD values of 4.50 numbers/km2 and 1.86% (Figure 17d). Approximately 79.8% (95 landslides) display L/W ratios of 1.2–3.0 and a mean H/L ratio of 0.509 (26.96°). Elevations range from 1097 to 2138 m, with a mean slope of 21.82° and relief of 8–457 m. Zone D is located in the southern part of the Eastern Branch of the Xiao River Fault (F4-2), accounting for 138 landslides with LND and LAD values of 4.45 numbers/km2 and 3.06% (Figure 17e). About 81.9% (113 landslide) show L/W ratios of 1.2–3.0 and a mean H/L ratio of 0.508 (26.92°). Elevations vary between 1401 and 2468 m, with a mean slope of 23.21° and relief of 20–467 m. Notably, although the L/W ratios of landslides in the four clusters predominantly fall within the range of 1.2–3.0, indicating a predominantly longitudinal morphology, the mean H/L ratio in Zone A (0.80) is significantly higher than that in other regions. This arises from the fact that Zone A is located at the intersection of the Western Branch of the Xiao River Fault (F4-1) and Eastern Branch of the Xiao River Fault (F4-2). The interaction between these two faults and the historical seismic event (Ms 6.5) has resulted in stress concentration in this area, causing damage-induced weakening of the rock and soil mass and the development of structural discontinuities. Furthermore, the remarkable topographic relief (6–494 m) in this region provides steep slopes initiating at high elevations with sufficient gravitational potential energy, resulting in high mobility of the landslide debris.
These four landslide clustering zones along the Xiao River Fault (F4-1, F4-2) highlight the significant influence of the fault on the spatial distribution of landslides. As an active fault, the Xiao River Fault creates geomechanically unfavorable conditions that reduce rock mass strength, thereby promoting fracture development. Consequently, water accumulates within fractured zones and subsequently infiltrates the rock mass along pre-existing fracture networks. This leads to increasing pore water pressure and progressive degradation of shear strength along potential sliding surfaces [57], causing gradual deterioration of slope stability. Eventually, under extreme weather conditions or human engineering disturbances, slope failures and associated landslides are easily triggered.

5.3. Comparative Analysis with Other Regions

The northeastern and western regions of Yunnan Province are recognized as areas of severe landslide hazard due to their distinctive alpine canyon terrain, rendering them a research priority. However, systematic comparative studies on the spatial distribution patterns and geometric characteristics of landslides in these two regions remain scarce. This study addresses this deficiency through a comprehensive comparative analysis. Landslides in the Dongchuan District predominantly occur at higher elevations (1000–2000 m) and on steeper slopes (20–45°). Conversely, recent landslides in Baoshan City, western Yunnan Province, are concentrated at lower elevations (1680–1798 m) and on gentler slopes (15–40°) [8]. The average H/L ratio in the study area is 0.56 (corresponding to a reach angle of 29°), higher than that in Baoshan City (reach angle 21°) [8]. These differences reflect distinct geological and climatic settings, despite both areas being characterized by high-relief canyon terrain. Baoshan City receives higher annual precipitation (1375 mm) than Dongchuan (1000.5 mm) and is underlain by Cretaceous intrusive rocks with strong weathering resistance. By comparison, Dongchuan exhibits a higher mean elevation (2159.5 m vs. 1782.3 m) and steeper mean slopes (26.5° vs. 20.9°), composed of older Proterozoic metamorphic rocks (primarily slate and phyllite) that have undergone multi-phase tectonic deformation. This results in weak weathering resistance, well-developed structural weakness zones, and reduced slope stability. Furthermore, the district is traversed by the Xiao River Fault Zone, one of the most seismically active structures in southwestern China. Seismic damage to structural discontinuities and associated fracture development create favorable conditions for landslide initiation. Long-standing copper mining operations [21] have severely disturbed both surface and subsurface geological environments, exacerbating slope instability. Additionally, low vegetation coverage, resulting in severe soil erosion and ecosystem fragility, has led to the disintegration of soil-rock structures on slopes and reduced shear strength of slope materials. Under heavy rainfall, these destabilized masses are readily mobilized for long-distance transport along gullies. The interplay of these factors has produced a distinct landslide regime in the study area: debris flows constitute the primary landslide type and shallow surface landslides the secondary, with predominantly longitudinal morphologies and an elevated mean H/L ratio (0.56) relative to Baoshan City (0.40).
Landslide mobility represents the run-out distance of a landslide [41] and is positively correlated with landslide volume [58]. In this study, the volume-area (V-A) empirical relationship proposed by Larsen et al. [38] was adopted to estimate landslide volume. Derived from extensive field-measured landslide datasets, this relationship has been widely validated in regional-scale geomorphology and landslide studies, demonstrating robust performance and broad applicability [39,40,41,42]. We acknowledge that the V-A empirical approach does not account for local variations in landslide geometry, material properties, or failure mechanisms, potentially leading to deviations in volume estimates in specific instances. Due to the large number of landslides distributed across high-relief mountain canyon terrain, conducting field surveys to directly measure landslide volumes was impractical. In this context, the V-A relationship provides statistically reliable estimates for regional-scale analysis. Based on this volume estimation, we established the relationship between travel distance (L) and volume, which is expressed by the empirical formula: L = 3.16 × Volume0.38 (R2 = 0.90). This indicates that travel distance (L) increases with volume following an allometric growth trend (Figure 15a), confirming that landslide volume significantly influences mobility.

5.4. Limitation and Future Work

This study compiled a landslide inventory map through manual visual interpretation, identifying a total of 1623 landslides within the study area. However, this approach has several limitations. The primary limitation is the lack of systematic field validation. Additionally, the interpretation process is inherently subjective, which makes it difficult to maintain consistent criteria and may lead to omissions or misclassifications. Furthermore, accurate classification of landslide types at fine scales remains challenging, introducing uncertainty into the inventory results. To address these limitations and enhance data reliability, future research will seek to integrate automated detection techniques (e.g., deep learning) with InSAR time-series monitoring for cross-validation and improved mapping accuracy. These improvements are expected to provide a more robust basis for landslide susceptibility and hazard assessments in the study area.
In addition to methodological limitations, this study reveals significant clustering of landslides along fault lines, confirming that fault structures play a critical role in governing the spatial distribution of landslides. However, the lack of quantitative investigations into fault activity has constrained the precise characterization of landslide spatiotemporal patterns. Furthermore, the observed spatial distribution patterns and geometric characteristics reflect the cumulative effects of long-term geomorphic and tectonic processes as well as anthropogenic activities. Future work will systematically investigate fault activity in the study area, aiming to elucidate the coupled effects of tectonic activity, topographic conditions, climate variability, and anthropogenic activities on landslide formation and evolution across multiple spatiotemporal scales. Such efforts are expected to provide fundamental insights into landscape evolution dynamics and improve risk assessment capabilities for cascading geological hazards along the northern margin of the Yunnan–Guizhou Plateau.

6. Conclusions

This study established a detailed landslide inventory for the Dongchuan District through visual interpretation of the high-resolution Google Earth imagery. Statistical analyses were conducted on landslide numbers, areas, and morphological parameters, with systematic examination of the relationships between landslide occurrence and influencing factors. The main conclusions are as follows:
1. A total of 1623 landslides were identified in the study area, covering a total area of 10.36 km2, with a mean area of 6384 m2. These landslides predominantly occurred in areas characterized by high elevation (1000–2000 m), steep slopes (20–45°), preferred slope aspects of 255–285°, high relief (150–400 m), rainfall of 750–825 mm, and within 1000 m of rivers, 3000 m of fault lines, and 1000–5000 m of mines. The Proterozoic (Pt) unit hosts 50.09% of all landslides and exhibits a relatively high LAD of 0.58%, indicating that this unit provides the necessary material basis for slope failure and that landslides preferentially developed within this unit. Kernel density analysis revealed four landslide clusters (Zones A-D) distributed along the Xiao River Fault (F4-1 and F4-2), highlighting the significant influence of this fault on the spatial distribution of landslides.
2. Morphological analysis revealed that the majority of landslides were longitudinal in planform, with travel distances (L) of 50–450 m and heights (H) of 25–350 m. The relationships between H, L, and volume followed allometric trends: L = 3.16 × Volume0.38 (R2 = 0.90), H = 1.30 × Volume0.43 (R2 = 0.82), and L = 3.16 × H0.85 (R2 = 0.87). These expressions demonstrated that both H and L increased with volume and that L increased with H. The mean reach angle of 29° was significantly higher than that of Baoshan City (21°). These findings indicated that the landslide spatial distribution, geometry, and kinematics were significantly influenced by tectonics, topography, and geomorphology, as well as anthropogenic activities.
We expect that the landslide inventory map of the Dongchuan District compiled in this study serves as a valuable resource for both landslide susceptibility mapping and hazard assessment in the region, thereby providing essential data to support sustainable regional development. Furthermore, this work enhances our understanding of landscape evolution and geohazard-chain processes on the northern margin of the Yunnan–Guizhou Plateau.

Author Contributions

X.C. proposed the research concept, organized the landslide interpretation, and provided basic data. S.L. designed the framework and wrote the manuscript. S.M. participated in the writing and data analysis. All authors have read and agreed to the published version of the manuscript.

Funding

This research was funded by [Yunnan Earthquake Agency] grant number [2025ZX04], and [Institute of Geology, China Earthquake Administration] grant number [IGCEA2202].

Institutional Review Board Statement

Not Applicable.

Informed Consent Statement

Not Applicable.

Data Availability Statement

The original contributions presented in this study are included in the article. Further inquiries can be directed to the corresponding author.

Acknowledgments

We thank Google Earth satellite images for the free access satellite images used in this study. This study was supported by The Science and Technology Special Program of Yunnan Earthquake Agency (2025ZX04), and the National Nonprofit Fundamental Research Grant of China, Institute of Geology, China Earthquake Administration (Grant no. IGCEA2202).

Conflicts of Interest

The authors declare no competing interests.

References

  1. Burbank, D.W. Rates of erosion and their implications for exhumation. Mineral. Mag. 2002, 66, 25–52. [Google Scholar] [CrossRef] [Scilit]
  2. Roering, J.J.; Perron, J.T.; Kirchner, J.W. Functional relationships between denudation and hillslope form and relief. Earth Planet. Sci. Lett. 2007, 264, 245–258. [Google Scholar] [CrossRef] [Scilit]
  3. Gorüm, T. Tectonic, topographic and rock-type influences on large landslides at the northern margin of the Anatolian Plateau. Landslides 2018, 16, 333–346. [Google Scholar] [CrossRef] [Scilit]
  4. Jacobs, L.; Dewite, O.; Poesen, I.; Maes, J.; Mertens, K.; Sekajugo, J.; Kervyn, M. Landslide characteristics and spatial distribution in the Rwenzori Mountains, Uganda. J. Afr. Earth Sci. 2017, 134, 917–930. [Google Scholar] [CrossRef] [Scilit]
  5. Tanyas, H.; Rossi, M.; Alvioli, M.; van Westen, C.J.; Marchesini, I. A global slope unit-based method for the near real-time prediction of earthquake-induced landslides. Geomorphology 2019, 327, 126–146. [Google Scholar] [CrossRef] [Scilit]
  6. Bounab, A.; EI Kharim, Y.; EI Hamdouni, R.; Sahrane, R.; Ourdaras, L. Multidisciplinary investigations of earthflow processes in the differential erosion furrows morphostructural unit, Northern Rif (Morocco): Case study of the Seikha landslide. Nat. Hazards 2025, 121, 12551–12574. [Google Scholar] [CrossRef] [Scilit]
  7. Santangelo, M.; Gioia, D.; Cardinali, M.; Guzzetti, F.; Schiattarella, M. Landslide inventory map of the upper Sinni River valley, Southern Italy. J. Maps 2014, 11, 444–453. [Google Scholar] [CrossRef] [Scilit]
  8. Shao, X.; Ma, S.; Xu, C.; Shen, L.; Lu, Y. Inventory, Distribution and Geometric characteristics of landslides in Baoshan City, Yunnan Province, China. Sustainability 2020, 12, 2433. [Google Scholar] [CrossRef] [Scilit]
  9. Brardinoni, F.; Slaymaker, O.; Hassan, M.A. Landslide inventory in a rugged forested watershed: A comparison between air-photo and field survey data. Geomorphology 2003, 54, 179–196. [Google Scholar] [CrossRef] [Scilit]
  10. Colombo, A.; Lanteri, L.; Ramasco, M.; Troisi, C. Systematic GIS-based landslide inventory as the first step for effective landslide-hazard management. Landslides 2005, 2, 291–301. [Google Scholar] [CrossRef] [Scilit]
  11. Harp, E.L.; Keefer, D.K.; Sato, H.P.; Yagi, H. Landslide inventories: The essential part of seismic landslide hazard analyses. Eng. Geol. 2011, 122, 9–21. [Google Scholar] [CrossRef] [Scilit]
  12. Xu, C. Preparation of earthquake-triggered landslide inventory maps using remote sensing and GlS technologies: Principles and case studies. Geosci. Front. 2015, 6, 825–836. [Google Scholar] [CrossRef] [Scilit]
  13. Rosi, A.; Tofani, V.; Tanteri, L.; Tacconi Stefanelli, C.; Agostini, A.; Catani, F.; Casagli, N. The new landslide inventory of Tuscany (Italy) updated with PS-InSAR: Geomorphological features and landslide distribution. Landslides 2018, 15, 5–19. [Google Scholar] [CrossRef] [Scilit]
  14. Ma, S.Y.; Shao, X.Y.; Xu, C. Landslide inventory and distribution patterns in Lhasa area, Tibet Plateau. Nat. Hazards 2025, 121, 5849–5871. [Google Scholar] [CrossRef] [Scilit]
  15. Sahrane, R.; Bounab, A.; EI Kharim, Y.; Obda, O.; EI Miloudi, Y.; Mihraje, A.I.; EI Afi, M. Landslide-Anthropogenic interactions in urban areas: A multidisciplinary case study from Taounate, Morocco. Geotech. Geol. Eng. 2025, 43, 23. [Google Scholar] [CrossRef] [Scilit]
  16. Cui, P.; He, M.; Tapponnier, P.; Zhang, L.; Li, Z.; Gong, W.; Zhou, G.; Guo, J. Preface for Geohazards and mitigation along the Sichuan-Tibet Railway. Eng. Geol. 2023, 317, 107095. [Google Scholar] [CrossRef] [Scilit]
  17. Tian, Y.; Xu, C.; Xu, X.; Wu, S.E.; Chen, J. Spatial distribution analysis of coseismic and pre-earthquake landslides triggered by the 2014 Ludian MS 6.5 earthquake. Seismol. Geol. 2015, 37, 291–306. [Google Scholar]
  18. He, X.; Xu, C.; Qi, W.; Huang, Y.; Cheng, J.; Xu, X.; Yao, Q.; Lu, Y.; Dai, B. Landslides Triggered by the 2020 Qiaojia Mw 5.1 Earthquake, Yunnan, China: Distribution, Influence Factors and Tectonic Significance. J. Earth Sci. 2021, 32, 1056–1068. [Google Scholar] [CrossRef] [Scilit]
  19. Jin, J.L.; Cui, Y.L.; Xu, C.; Zheng, J.; Miao, H.B. Application of logistic regression model for hazard assessment of landslides caused by the 2012 Yiliang Ms 5.7 earthquake in Yunnan Province, China. J. Mt. Sci. 2023, 20, 657–669. [Google Scholar] [CrossRef] [Scilit]
  20. Shen, J.; Wang, Y.P.; Song, F.M. Characteristics of the active Xiaojiang fault zone in Yunnan, China: A slip boundary for the southeastward escaping Sichuan-Yunnan Block of the Tibetan Plateau. J. Asian Earth Sci. 2003, 21, 1085–1096. [Google Scholar]
  21. Wang, T.; Liu, J.; Huang, C. Research on Ore-controlling factors and Metallogenic Prognosis of Dongchuan Copper Mining Area, Yunnan, China. IOP Conf. Ser. Earth Environ. Sci. 2017, 59, 01203. [Google Scholar] [CrossRef] [Scilit]
  22. Tian, S.; Zhang, Z. Housing loss estimation study of urban debris flow disaster based on SPOT-5 data-A case study on Dongchuan District, Kunming, Yunnan Province. In 2009 Joint Urban Remote Sensing Event; IEEE: New York, NY, USA, 2009; pp. 1–5. [Google Scholar]
  23. Cui, P.; Zou, Q.; Xiang, L.; Zeng, C. Risk assessment of simultaneous debris flows in mountain townships. Prog. Phys. Geogr. 2013, 37, 516–542. [Google Scholar] [CrossRef] [Scilit]
  24. Xu, J.; Cheng, X.; Huang, Q.; Chen, Y.; Qi, W.; Yuan, J.; Yang, J. Susceptibility evaluation of debris flow based on experience weight method combined with”3S”technology: A case study from Dongchuan in Yunnan Province, China. IOP Conf. Ser. Earth Environ. Sci. 2017, 95, 022051. [Google Scholar] [CrossRef] [Scilit]
  25. Li, K.; Zhao, J.S.; Lin, Y.L.; Chen, K.; Bi, R. Assessment of debris flow susceptibility in Dongchuan based on RF and SVM models. J. Yunnan Univ. Nat. Sci. Ed. 2021, 44, 107–115. [Google Scholar]
  26. Sun, B.; Zhu, C.B.; Kang, X.B.; Ye, L.; Liu, Y. Susceptibility assessment of debris flows based on information model in Dongchuan, Yunnan Province. Chin. J. Geol. Hazard Control 2022, 33, 119–127. [Google Scholar]
  27. Wei, F.; Hu, K.; Cui, P.; Guan, Q. A decision support system for debris-flow hazard mitigation in towns based on numerical simulation: A case study at Dongchuan, Yunnan Province. Int. J. Risk Assess. Manag. 2008, 8, 373–383. [Google Scholar] [CrossRef] [Scilit]
  28. Cao, C.; Song, S.; Chen, J.; Zheng, L.; Kong, Y. An approach to predict debris flow average velocity. Water 2017, 9, 205. [Google Scholar] [CrossRef] [Scilit]
  29. Liu, D.; Li, Y.; You, Y.; Liu, J.; Wang, B.; Yu, B. Velocity of debris flow determined by grain composition. J. Hydraul. Eng. 2020, 146, 06020010. [Google Scholar] [CrossRef] [Scilit]
  30. Zhang, X.; Gan, S.; Yuan, X.; Zong, H.; Wu, X. Slope deformation monitoring and early identification of disasters in debris flow source area of Baini River, Dongchuan District, China. Front. Earth Sci. 2022, 10, 1000736. [Google Scholar] [CrossRef] [Scilit]
  31. Li, C.; Zhang, J.; Gao, L.; Chen, X.; Ma, S.; Yuan, R. Spatial Clustering and distribution characteristics of large landslides in the Yalong River Basin, China. Geomorphology 2025, 475, 109667. [Google Scholar] [CrossRef] [Scilit]
  32. Bian, M.; Qiu, H.; Chen, X. The Distribution Characteristics of Large Landslides Along the Daduhe River in the Eastern Tibetan Plateau and Their Effects on Landscape Evolution. Remote Sens. 2025, 17, 1133. [Google Scholar] [CrossRef] [Scilit]
  33. Guzzetti, F.; Mondini, A.C.; Cardinali, M.; Fiorucci, F.; Santangelo, M.; Chang, K.-T. Landslide inventory maps: New tools for an old problem. Earth-Sci. Rev. 2012, 112, 42–66. [Google Scholar] [CrossRef] [Scilit]
  34. Keaton, R.; De Graff, J. Surface observation and geologic mapping. Spec. Rep. Natl. Res. Counc. Transp. Res. Board 1996, 247, 178–230. [Google Scholar]
  35. Taylor, F.E.; Malamud, B.D.; Witt, A.; Guzzetti, F. Landslide shape, ellipticity and length-to-width ratios. Earth Surf. Process. Landf. 2018, 43, 3164–3189. [Google Scholar] [CrossRef] [Scilit]
  36. Tian, Y.; Xu, C.; Chen, J.; Zhou, Q.; Shen, L. Geometrical characteristics of earthquake-induced landslides and correlations with control factors: A case study of the 2013 Minxian, Gansu, China, Mw 5.9 event. Landslides 2017, 14, 1915–1927. [Google Scholar] [CrossRef] [Scilit]
  37. The IAEG Commission on Landslides. Suggested nomenclature for landslides. Bull. Int. Assoc. Eng. Geol.-Bull. I’Assoc. Int. Géol. I’Ing. 1990, 41, 13–16. [Google Scholar]
  38. Larsen, I.J.; Montgomery, D.R.; Korup, O. Landslide erosion controlled by hillslope material. Nat. Geosci. 2010, 3, 247–251. [Google Scholar] [CrossRef] [Scilit]
  39. Xu, C.; Xu, X.; Shen, L.; Yao, Q.; Tan, X.; Kang, W.; Ma, S.; Wu, X.; Cai, J.; Gao, M. Optimized volume models of earthquake-triggered landslides. Sci. Rep. 2016, 6, 29797. [Google Scholar] [CrossRef] [Scilit]
  40. Fan, X.; Scaringi, G.; Xu, Q.; Zhan, W.; Dai, L.; Li, Y.; Pei, X.; Yang, Q.; Huang, R. Coseismic landslides triggered by the 8th August 2017 Ms 7.0 Jiuzhaigou earthquake (Sichuan, China): Factors controlling their spatial distribution and implications for the seismogenic blind fault identification. Landslides 2018, 15, 967–983. [Google Scholar] [CrossRef] [Scilit]
  41. Roback, K.; Clark, M.K.; West, A.J.; Zekkos, D.; Li, G.; Gallen, S.F.; Chamlagain, D.; Godt, J.W. The size, distribution, and mobility of landslides caused by the 2015 Mw7. 8 Gorkha earthquake, Nepal. Geomorphology 2018, 301, 121–138. [Google Scholar] [CrossRef] [Scilit]
  42. Zou, Y.; Oi, S.; Guo, S.; Zheng, B.; Zhan, Z.; He, N.; Huang, X.; Hou, X.; Liu, H. Factors controlling the spatial distribution of coseismic landslides triggered by the Mw 6.1 Ludian earthguake in China. Eng. Geol. 2022, 296, 106477. [Google Scholar] [CrossRef] [Scilit]
  43. Huang, Y.; Xu, C.; He, X.; Cheng, J.; Huang, Y.; Wu, L.; Xu, X. Distribution characteristics and cumulative effects of landslides triggered by multiple moderate-magnitude earthquakes: A case study of the comprehensive seismic impact area in Yibin, Sichuan, China. Landslides 2024, 21, 2927–2943. [Google Scholar] [CrossRef] [Scilit]
  44. Pourghasemi, H.R.; Moradi, H.R.; Aghda, S.M.F.; Sezer, E.A.; Jirandeh, A.G.; Pradhan, B. Assessment of fractal dimension and geometrical characteristics of the landslides identified in North of Tehran, Iran. Environ. Earth Sci. 2013, 71, 3617–3626. [Google Scholar] [CrossRef] [Scilit]
  45. Hunter, G.; Fell, R. Travel distance angle for rapid landslides in constructed and natural soil slopes. Can. Geotech. J. 2003, 40, 1123–1141. [Google Scholar] [CrossRef] [Scilit]
  46. Deng, Q.D. Chinese Active Tectonic Map; Seismological Press: Beijing, China, 2007. [Google Scholar]
  47. Xu, C. A preliminary spatial distribution analysis of landslides triggered by the 2010 Haiti earthquake. In Landslide Science for a Safer Geoenvironment: Volume 3: Targeted Landslides; Springer International Publishing: Cham, Switzerland, 2014; pp. 183–190. [Google Scholar]
  48. Tian, Y.; Xu, C.; Xu, X.; Chen, J. Detailed inventory mapping and spatial analyses to landslides induced by the 2013 Ms 6.6 Minxian earthquake of China. J. Earth Sci. 2016, 27, 1016–1026. [Google Scholar] [CrossRef] [Scilit]
  49. Tanyas, H.; Westen, C.; Allstadt, K.; Jibson, R. Factors controlling landslide frequency-area distributions. Earth Surf. Process. Landf. 2018, 44, 900–917. [Google Scholar] [CrossRef] [Scilit]
  50. Wang, W.; Ma, S.; Yan, W.; Yuan, R. The Spatial Distribution Characteristics and Possible Influencing Factors of Landslide Disasters in the Zhaotong Area, Yunnan Province of China. Appl. Sci. 2024, 14, 5093. [Google Scholar] [CrossRef] [Scilit]
  51. Bucci, F.; Santangelo, M.; Cardinali, M.; Fiorucci, F.; Guzzetti, F. Landslide distribution and size in response to Quaternary fault activity: The Peloritani Range, NE Sicily, Italy. Earth Surf. Process. Landf. 2016, 41, 711–720. [Google Scholar] [CrossRef] [Scilit]
  52. Marc, O.; Hovius, N. Amalgamation in landslide maps: Effects and automatic detection. Nat. Hazards Earth Syst. Sci. 2015, 15, 723–733. [Google Scholar] [CrossRef] [Scilit]
  53. McColl, S.T.; Cook, S.J. A universal size classification system for landslides. Landslides 2024, 21, 111–120. [Google Scholar] [CrossRef] [Scilit]
  54. Hungr, O.; Leroueil, S.; Picarelli, L. The Varnes classification of landslide types, an update. Landslides 2014, 11, 167–194. [Google Scholar] [CrossRef] [Scilit]
  55. Malamud, B.D.; Turcotte, D.L.; Guzzetti, F.; Reichenbach, P. Landslide inventories and their statistical properties. Earth Surf. Process. Landf. 2004, 29, 687–711. [Google Scholar] [CrossRef] [Scilit]
  56. Katz, O.; Morgan, J.K.; Aharonov, E.; Dugan, B. Controls on the size and geometry of landslides: Insights from discrete element numerical simulations. Geomorphology 2014, 220, 104–113. [Google Scholar] [CrossRef] [Scilit]
  57. Barth, S.; Geertsema, M.; Bevington, A.R.; Bird, A.L.; Clague, J.J.; Millard, T.; Bobrowsky, P.T.; Hasler, A.; Liu, H. Landslide response to the 27 October 2012 earthquake (Mw 7.8), southern Haida Gwaii, British Columbia, Canada. Landslides 2020, 17, 517–526. [Google Scholar] [CrossRef] [Scilit]
  58. Scheidegger, A.E. On the prediction of the reach and velocity of catastrophic landslides. Rock Mech. Rock Eng. 1973, 5, 231–236. [Google Scholar] [CrossRef] [Scilit]
Figure 1. Map showing the location, topographic distribution, river system, and faults of the Dongchuan District and surrounding area. The red polygon denotes the study area; black lines denote faults; and green lines denote rivers. The yellow star indicates the location of the study area in China and Asia.
Sustainability 18 03994 g001
Figure 2. Map showing the stratigraphy, historical earthquakes, and faults of the Dongchuan District (F1: Luoxue Fault; F2: Xindianfang Fault; F3: Xinlongcun Fault; F4-1: Western Branch of the Xiao River Fault; F4-2: Eastern Branch of the Xiao River Fault; and F5: Yulu-Daibu Fault).
Sustainability 18 03994 g002
Figure 3. Typical landslides in the study area (satellite images from the Google Earth platform). The yellow polygons represent the interpreted landslide boundaries. (af) showing six recent landslides. Yellow dashed lines delineate the outer boundaries of the full landslide area; yellow solid arrows indicate landslide sliding directions.
Sustainability 18 03994 g003
Figure 6. Maps showing the spatial distribution of influencing factors in the study area. (a) Elevation; (b) Slope angle; (c) Topographic relief; (d) Annual rainfall; (e) Distance to rivers; (f) Distance to faults; (g) Distance to mines. Green lines and black lines represent rivers and faults, purple circles with cross patterns denote mines.
Sustainability 18 03994 g006aSustainability 18 03994 g006b
Figure 7. Landslide inventory map of the Dongchuan District. Red polygons denote landslides and black lines denote faults. Figure 3a–e show typical landslide positions.
Sustainability 18 03994 g007
Figure 8. Probability density plot of landslide size (area in m2) distribution for the whole landslide inventory, The red line indicates the inflection point.
Sustainability 18 03994 g008
Figure 9. Spatial distribution and scales of landslides in the Dongchuan District along with their corresponding longitudinal and latitudinal profiles.
Sustainability 18 03994 g009
Figure 10. Map showing the spatial density distribution of landslides in the Dongchuan District. (a) Landslide number density (LND), (b) Landslide areal density (LAD). Densities are displayed by different background colors, with red indicating higher density and gray indicating lower density.
Sustainability 18 03994 g010
Figure 11. Correlations between landslide abundance indices (LND and LAD) and different influencing factors. (a) Elevation; (b) Slope; (c) Topographic relief; (d) Annual rainfall; (e) Distance to rivers; (f) Distance to faults; (g) Distance to mines.
Sustainability 18 03994 g011aSustainability 18 03994 g011b
Figure 12. Distribution of slope aspects for landslides and landscape area. Yellow represents landslide areas and gray represents landscape areas.
Sustainability 18 03994 g012
Figure 13. Distribution of areal coverage (%) for landslide and non-landslide areas, and landslide areal density (LAD) in different lithological units.
Sustainability 18 03994 g013
Figure 14. Statistical distribution of elongation ratio (L/W) of landslide planimetric shapes.
Sustainability 18 03994 g014
Figure 15. Mobility characteristics of landslides. (a) Relationship between Length (L) and landslide volume; (b) Relationship between height (H) and landslide volume; (c) Relationship between Length (L) and height (H).
Sustainability 18 03994 g015aSustainability 18 03994 g015b
Figure 16. Statistical analysis of landslide influencing factors in the Dongchuan District.
Sustainability 18 03994 g016
Figure 17. Map showing spatial clustering analysis of landslides in the Dongchuan District based on landslide number density (LND). (a) Overview map showing the LND distribution and four clustering zones (A–D); (be) Enlarged views of Zone A, Zone B, Zone C, and Zone D, respectively. LND is displayed by background colors, with red indicating high density and gray indicating low density.
Sustainability 18 03994 g017
Disclaimer/Publisher’s Note: The statements, opinions and data contained in all publications are solely those of the individual author(s) and contributor(s) and not of MDPI and/or the editor(s). MDPI and/or the editor(s) disclaim responsibility for any injury to people or property resulting from any ideas, methods, instructions or products referred to in the content.