Article

Nitrate Contamination in Groundwater of the Nansi Lake Region: Source Apportionment, Driving Mechanisms, and Health Risk Assessment

College of Earth Science and Engineering, Shandong University of Science and Technology, Qingdao 266590, China
*
Author to whom correspondence should be addressed.
Sustainability 2026, 18(8), 3981; https://doi.org/10.3390/su18083981
Submission received: 6 March 2026 / Revised: 11 April 2026 / Accepted: 14 April 2026 / Published: 16 April 2026

Abstract

To identify the sources and driving mechanisms of nitrate contamination in pore water around Nansi Lake, 54 pore water samples were analyzed via hydrogeochemical analysis, Gibbs diagrams, ionic ratios, and principal component analysis (PCA). The pore water is predominantly slightly alkaline, with dominant cations Ca2+ and Na+, and anions HCO3 and SO42−. Nitrate-nitrogen (NO3-N) concentrations range from 0.82 to 54.31 mg·L−1, with a coefficient of variation of 1.41 and an exceedance rate of 18.52%, indicating significant external inputs. A positive correlation between NO2 and NO3 suggests denitrification in some areas. Nitrate concentrations exhibit distinct spatial heterogeneity: high concentrations occur in agricultural/aquaculture lakeside plains and urban areas, low concentrations near coal mining subsidence zones, and transitional zones showing outward diffusion. Nitrate sources are predominantly anthropogenic. High Cl and low NO3/Cl ratios indicate domestic and aquaculture wastewater infiltration, whereas low Cl and high NO3/Cl ratios indicate agricultural fertilizer input. Industrial and natural sources are minor. PCA identified three controlling factors (cumulative variance 69.81%): coal mining and industrial/domestic pollution (39.82%), carbonate rock weathering (19.44%), and agricultural activities (10.55%). Health risk assessment shows no significant risk for adults (hazard quotient (HQ) < 1), but children face localized risks at nine sites (HQs of 1.25–2.26) in intensive farming, urban, and transitional zones. Excessive fertilizer application and sewage leakage are the primary causes, posing methemoglobinemia risks to infants. This study provides a scientific basis for nitrate pollution control and sustainable water management in the Nansi Lake Basin and offers methodological insights for similar lacustrine plain regions.

1. Introduction

Groundwater is a key constituent of the water system as well as a tactical resource for maintaining ecological balance worldwide, supporting industrial and agricultural production, and ensuring water security for urban and rural populations [1]. In water-scarce regions of northern China, the consistent availability of groundwater has become essential for sustainable socio-economic development, with water quality directly affecting public health [2]. However, rapid urbanization, intensive agricultural development, and increasing industrial activity have intensified groundwater pollution [3]. Among the various contaminants, nitrate (NO3) has emerged as a global water quality concern [4]. Elevated nitrate levels in groundwater pose multiple health risks. Excess nitrate ingested by humans can be converted to nitrite, potentially causing methemoglobinemia—a condition particularly dangerous for sensitive groups such as infants and pregnant women. Long-term exposure may increase the risk of digestive system carcinomas, while adversely affecting cardiovascular and immune system functions [5,6].
The Nansi Lake Basin serves as an inseparable part of the Huaihe River system. The topography of the region slopes downward from east to west, and it encompasses two major geomorphic types: the Taiyi Mountain piedmont alluvial plain and the Yellow River alluvial plain. In this region, the main types of aquifers include porous aquifers in the unconsolidated Quaternary sediments, fractured karst aquifers of the carbonate rocks, and fractured aquifers in the clastic and intrusive rocks. Precipitation infiltration and lateral seepage of surface water are the most common forms of groundwater recharge, while the primary modes of discharge are evaporation and groundwater extraction [7]. As one of the major freshwater ecosystems and water resource reserves in northern China, the Nansi Lake Basin is highly populated and economically developed. Anthropogenic activities that include coal mining, intensive agriculture, the release of urban wastewater, and aquaculture are widespread [8]. The combined effect of natural environments and human activities has resulted in various groundwater environmental issues in the basin, such as the presence of nitrates. The Nansi Lake Basin was selected as the study area for three main reasons. First, the basin is a representative lacustrine plain region in northern China, where shallow pore water is the primary source of drinking and irrigation water for local communities. Second, the co-existence of multiple anthropogenic pressures—coal mining, intensive agriculture, urban wastewater discharge, and aquaculture—creates a complex setting for nitrate contamination, making it an ideal natural laboratory for investigating source apportionment and driving mechanisms. Third, despite previous studies on surface water and general groundwater quality, no research has specifically focused on pore water nitrate in this basin, resulting in a critical knowledge gap for targeted pollution control. Therefore, understanding the sources and driving mechanisms of nitrate contamination in pore water around Nansi Lake is essential for developing effective groundwater management strategies in similar lacustrine plain regions. Nevertheless, this intricate interplay between groundwater and surface water, coupled with the collective effects of agricultural, industrial, and domestic processes, makes it particularly challenging to decipher the sources and regulatory processes of nitrate in groundwater.
Relatively limited research has specifically examined the sources of nitrates in this area. Wang et al. [9] studied the spatial distribution, contamination analysis, and source of major nutrients in the surface sediments of Nansi Lake and identified the sources and distribution of nitrogen and phosphorus. Iqbal et al. [10] measured nitrate levels in groundwater across the basin and interpreted the connection between nitrate levels and land use while utilizing machine learning models to estimate the spatial distribution of the nitrate contamination. Gao et al. [7] evaluated the groundwater of the Nansi Lake Basin and the underlying health risks of nitrate. Nevertheless, existing research has mostly focused on the overall hydrogeochemical properties of groundwater in the basin, with limited direct attention paid to pore water nitrate. Specifically, none of the above studies targeted pore water nitrate, leaving a critical knowledge gap that hampers the formulation of targeted pollution control policies. It has been demonstrated that agriculture, urban wastewater discharge, livestock rearing, and industrial activities may all contribute to the groundwater nitrate contamination [8,11,12,13]. The Nansi Lake Basin is characterized by large lakeside agricultural plains, high urban growth areas, intensive livestock farming, mining of coal, and lands along major rivers flowing into the lake—all of which pose potential threats of groundwater nitrate pollution. In an attempt to explain the sources and origins of nitrate pollution in pore water surrounding Nansi Lake, this research collected 54 pore water samples from systematically selected sites.
The primary objectives of this study are fourfold: First, to characterize the spatial distribution of nitrate in pore water around Nansi Lake; Second, to identify and apportion the main sources of nitrate contamination (agricultural, domestic, industrial, or natural) using hydrogeochemical analysis and ionic ratios; Third, to quantify the driving mechanisms controlling nitrate variability through principal component analysis (PCA). Fourth, to assess the potential non-carcinogenic health risks posed by nitrate in drinking water to local residents, with particular attention to vulnerable groups such as children. Achieving these objectives will establish a scientific foundation for targeted groundwater pollution control and sustainable water resource management in the Nansi Lake Basin and similar lacustrine plain regions.
Through hydrogeochemical analysis, Gibbs diagrams, ionic ratio analysis, and principal component analysis (PCA) [14,15,16], this study described the spatial distribution of nitrate and its association with other hydrogeochemical parameters, quantitatively defined the primary sources of pollution, and elucidated the key factors governing the spatial distribution of nitrate. The results of this work provide a scientific basis for preventing and controlling nitrate contamination and managing water resources sustainably in the Nansi Lake Basin [17].

2. Materials and Methods

2.1. Study Area

2.1.1. Physical Geography

The Nansi Lake Basin is situated in the southwestern part of Shandong Province and consists of four interconnected lakes, including Nanyang, Dushan, Zhaoyang, and Weishan. The basin is oriented northwest–southeast and is shaped like a dumbbell, located between 34°27′–35°20′ N and 116°34′–117°21′ E. The lake area extends 126 km north–south and 5–25 km east–west, with an average depth of 1.46 m and a maximum surface area of 1266 km2. The basin receives drainage from 32 counties (cities, districts) from Jiangsu, Shandong, Henan, and Anhui provinces via 53 rivers, draining a total area of approximately 30,453 km2, with most of the upper region lying within Jining city. The Hanzhuang, Yinjiahe, and Linjiaba sluices regulate lake outflow, which flows southward into the mainstream of the Huaihe River and eventually to the Yellow Sea.

2.1.2. Hydrology and Meteorology

The Nansi Lake Basin is characterized by a warm, temperate, semi-humid monsoon climate throughout the year, mild temperatures, concurrent precipitation and high temperatures, and abundant solar radiation. Precipitation is governed by monsoon circulation with heavy rainfall in summer and minimal precipitation in winter. Precipitation decreases spatially east–west and south–north. According to the Shandong Provincial Water Resources Comprehensive Planning Report, the long-term average annual rainfall is 725.5 mm in the eastern area of the lake region, but 654.1 mm in the western area. The highest annual precipitation on record was 1045.4 mm (2003), and the lowest was 493.5 mm (1988).

2.1.3. Geology and Hydrogeology

The topography of the basin is an east–west downslope area with diverse landforms. The eastern region comprises the piedmont alluvial plain of the Taiyi Mountains, whereas the western region is part of the Yellow River alluvial plain. Various lithological formations in the basin include Quaternary unconsolidated sediments, Paleozoic Cambrian-Ordovician carbonate rocks, and Archean Taishan Group metamorphic rocks. The aquifers in the region can be categorized into three types based on the media and lithology: (1) Porous aquifers of the unconsolidated Quaternary sediments consisting of silt, fine to coarse sand, and gravel, with thicknesses ranging from 6 to 10 m; (2) Fractured karst aquifer of carbonate rocks where dolomite and limestone are predominant, with moderate-to-high yields of 600–1200 m3/(d·m); and (3) Fractured aquifers in clastic and intrusive rocks, showing relatively low water yields generally below 100 m3/(d·m) and weathering zones extending to depths of 5–30 m. In terms of spatial distribution, porous aquifers are primarily developed in the western alluvial-lacustrine plain (Yellow River alluvial plain) and the eastern piedmont alluvial plain, while fractured karst aquifers are mainly distributed in the eastern low-hill areas where Cambrian-Ordovician carbonate rocks are exposed or shallowly buried [18]. The porous aquifer in the lakeside plain has a mean thickness of approximately 8–10 m, with a shallow groundwater table depth of 2–18 m; the fractured karst aquifer exhibits strong heterogeneity in hydraulic conductivity due to the development of karstic fissures [7,18]. Based on the regional hydrogeological survey data of the Nansi Lake area (Shandong Provincial Bureau of Geology & Mineral Resources, unpublished internal data, 1991) and borehole lithology data from surrounding coalfields, the Quaternary stratigraphy in the lakeside plain can be inferred as follows (from top to bottom): (1) topsoil (0–0.5 m), mainly silty clay; (2) shallow clay aquitard (0.5–1.5 m), grey-yellow clay with low permeability; (3) main pore water aquifer (1.5–10 m), consisting of unconsolidated silt, fine sand, and interbedded thin layers of silty clay, with a groundwater table depth of 2–8 m; (4) lower clay aquitard (10–15 m), grey-black clay, acting as a regional confining layer; (5) underlying bedrock (below 15 m), comprising Carboniferous-Permian sandstone and mudstone or Ordovician limestone. The pore water samples collected in this study were taken from the main pore water aquifer (depths of 2–8 m), representing the unconfined Quaternary pore water in the lakeside accumulation plain. This inferred stratigraphic framework is consistent with the regional geological setting and supports the interpretation that pore water is derived from the unconsolidated sediments of the Yellow River alluvial plain, rather than from an intermountain basin. The flow of regional groundwater is regulated by lithology, topography, and human activities, generally moving from west to east toward Nansi Lake. Recharge predominantly occurs through the precipitation infiltration and lateral seepage of surface water, while discharge is primarily through evaporation and underground water extraction.

2.2. Methodology

2.2.1. Sample Collection and Laboratory Analysis

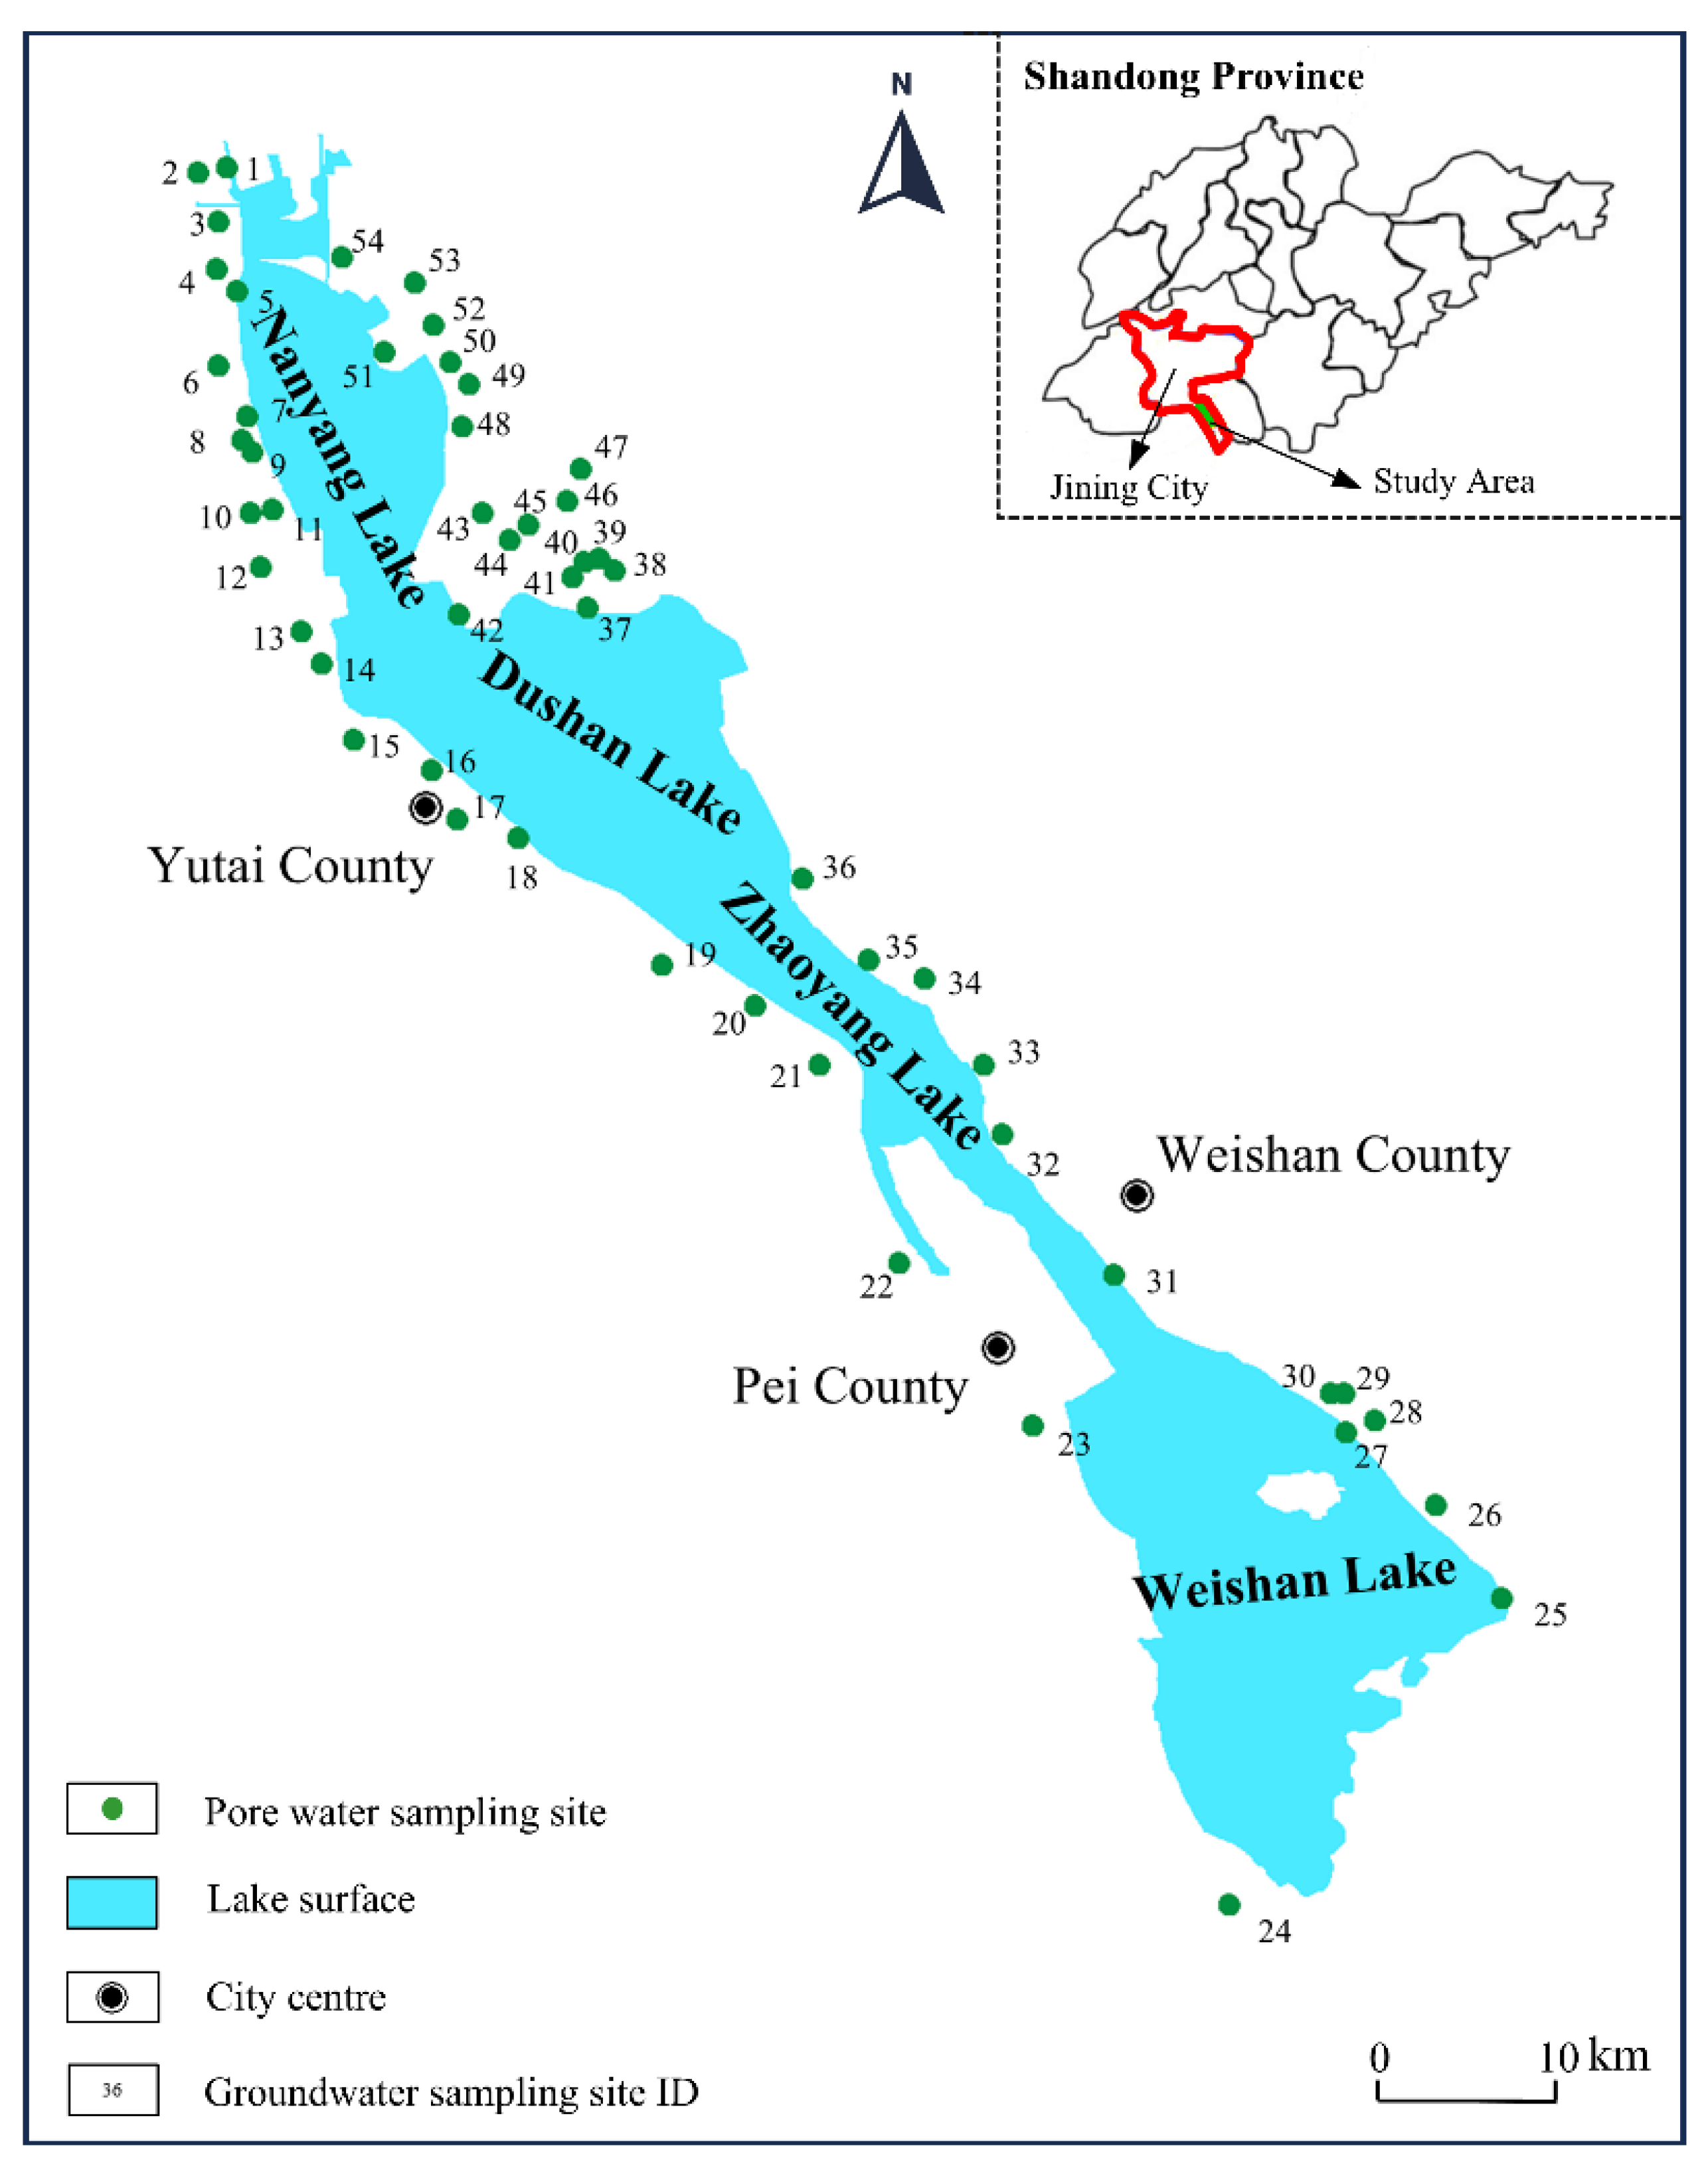
Shallow pore water samples were collected in August 2023 from 54 wells and piezometers distributed in the plain areas of the Nansi Lake Basin surrounding Nansi Lake. The sampling locations are illustrated in Figure 1. Sampling points were strategically selected to account for the distribution of coal mining areas, lands along major rivers flowing into the lake, and pore aquifer characteristics, ensuring that the collected samples were highly representative. Wells with practical utility were selected, and all sampling depths exceeded 1.5 m (ranging from 2 to 8 m below the ground surface). For each sampling point, 2000 mL of pore water was collected in pre-cleaned polyethylene bottles. Before sampling, polyethylene bottles were washed thrice using the water to be sampled to eliminate potential contamination from the containers. After collection, water samples were instantly screened via 0.45 μm membrane filters and transferred into clean polyethylene bottles. Samples were then sealed with Parafilm, preserved below 4 °C, and transported to the laboratory for analysis. Sampling and preservation followed the Methods for Analysis of Groundwater Quality (DZ/T 0064–2021) [19]. For cation analysis, samples were acidified to pH < 2 using ultrapure nitric acid to inhibit metal precipitation. All samples were preserved at low temperatures and delivered to the laboratory for analysis within 24 h. The analyzed parameters included K+, Mg2+, Na+, Ca2+, NH4+, pH, F, Cl, NO2, NO3, HCO3, SO42−, total dissolved solids (TDS), and total hardness (TH). The total hardness (TH) was determined using the gravimetric titration method, and total dissolved solids (TDS) were measured by the weighing method. Bicarbonate (HCO3) and carbonate (CO32−) were determined via acid-base titration. Following the Water Quality—Determination of Water-Soluble Cations by Ion Chromatography (HJ 812–2016) standard [20], Na+, K+, Ca2+, and Mg2+ were analyzed using ion chromatography (Aquion, Thermo Fisher Scientific, Waltham, MA, USA). The detection limits for Na+, K+, Ca2+, and Mg2+ were 0.02, 0.02, 0.03, and 0.02 mg/L, respectively. According to the Water Quality—Determination of Inorganic Anions by Ion Chromatography (HJ 84–2016) standard [21], Cl and SO42− were measured using the same ion chromatograph. The detection limits for Cl and SO42− were 0.007 mg/L and 0.018 mg/L, respectively. All nitrate concentrations reported in this study are expressed as NO3-N. In accordance with the Water Quality—Determination of Ammonium Nitrogen by Flow Injection Analysis (FIA) and Salicylic Acid Spectrophotometry (HJ 666–2013) standard [22], NH4+ concentrations were determined using salicylic acid spectrophotometry, performed on a UV-visible spectrophotometer (TU-1900, Beijing Puxi General Instrument Co., Ltd., Beijing, China) and an automated flow injection analyzer (BDFIA-8000, Beijing Baode Instruments Co., Ltd., Beijing, China). The NH4+ detection limit is 0.01 mg/L. pH values were measured in situ using a portable pH meter (Model HI98128, Hanna Instruments, Woonsocket, RI, USA). F, NO2, and NO3 were also analyzed by ion chromatography (IC, Thermo Scientific Dionex ICS-6000, Sunnyvale, CA, USA) following HJ 84–2016. Duplicate analyses were performed for all samples; the relative error between duplicates was less than the preset threshold of 10%, indicating that the analytical results were reliable and met the quality control requirements.

2.2.2. Gibbs Diagram Analysis

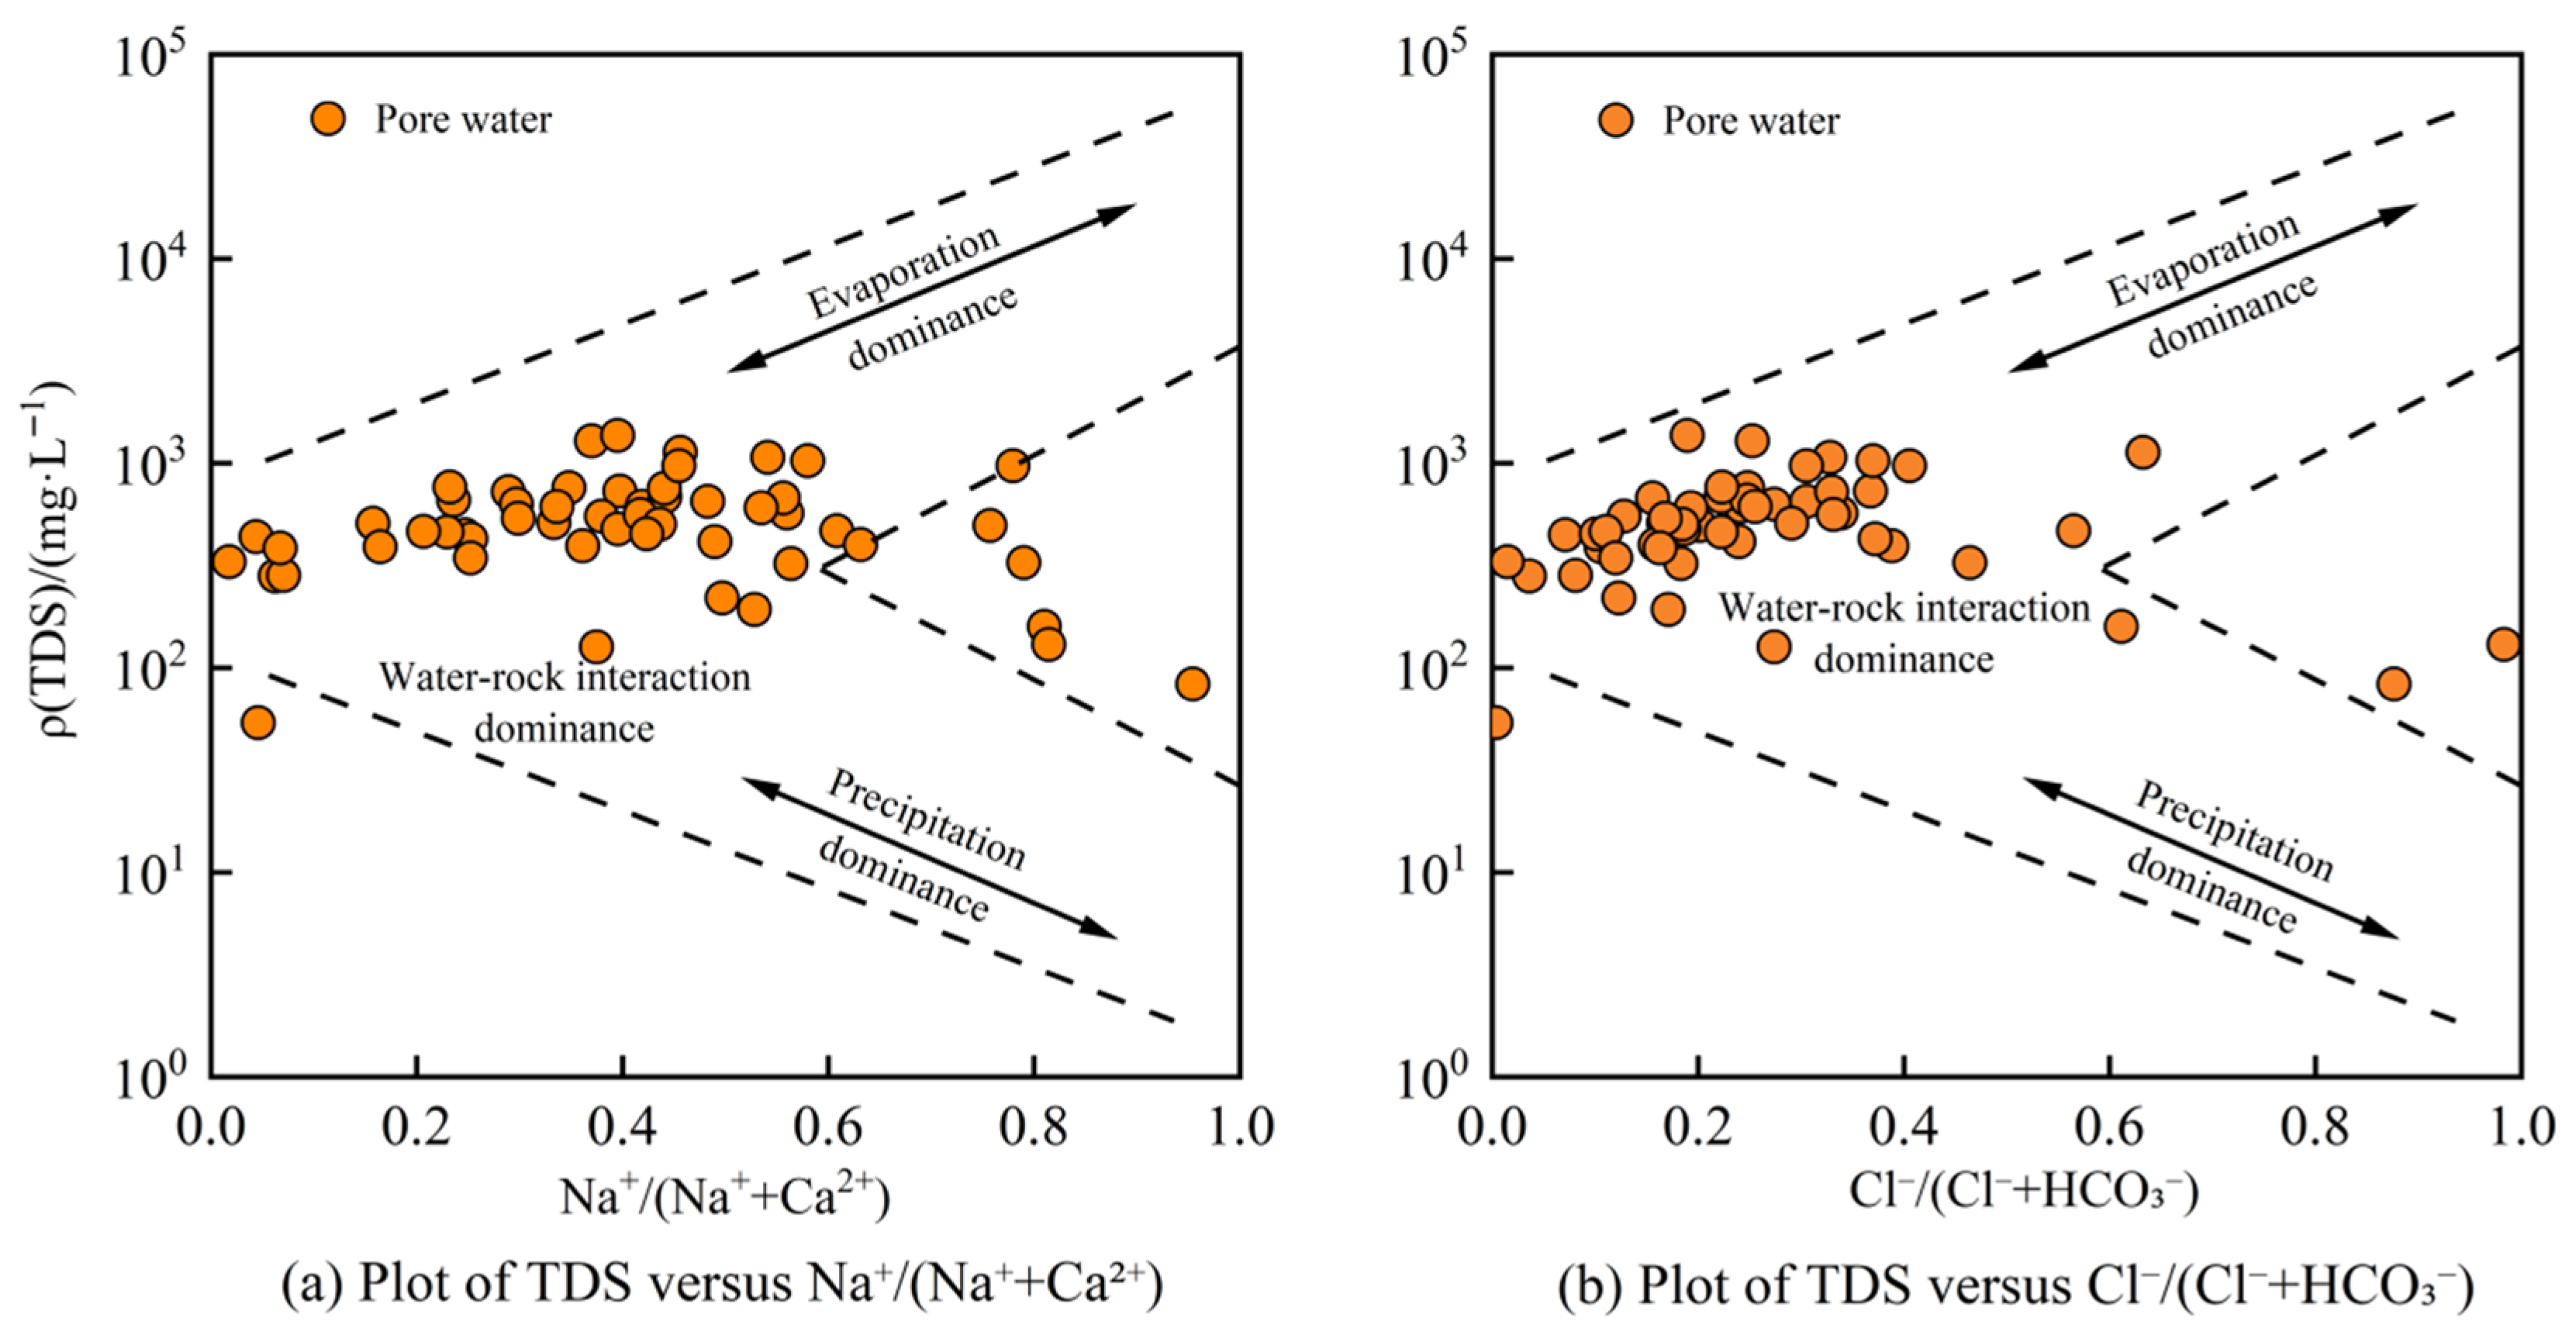
Gibbs diagrams, based on the concentration ratios of Na+/(Na+ + Ca2+) and Cl/(Cl + HCO3), were utilized for identifying the dominant processes controlling hydrogeochemical composition, including rock weathering, precipitation, and evaporation concentration [23,24].

2.2.3. Ionic Ratio Analysis

Ionic ratio analysis, using characteristic ratios such as NO3/Cl and SO42−/Na+, was applied to trace specific sources of nitrate contamination based on correlations among ions [25,26].

2.2.4. Principal Component Analysis

Principal component analysis (PCA) was performed using IBM SPSS Statistics for Windows, version 26.0 (IBM Corp., Armonk, NY, USA). The Kaiser-Meyer-Olkin test and Bartlett’s test of sphericity were applied to verify data suitability. Factor rotation was implemented via the Kaiser normalization varimax method to extract the key factors controlling hydrogeochemical characteristics and nitrate distribution. Factor loadings and variance contribution rates were used to quantify the influence of each factor, clearly revealing the core driving mechanisms without the need for complex formulas [27].

2.2.5. Health Risk Evaluation

The potential health risks posed by nitrate contamination within groundwater were evaluated through the human health risk assessment model proposed by the United States Environmental Protection Agency (USEPA) [28]. Nitrate is classified as a non-carcinogenic contaminant, and the primary exposure pathway considered in this study is oral ingestion via drinking water. The non-carcinogenic hazard is characterized by the hazard quotient (HQ), which is calculated as follows:
H Q = C D I R f D
Here, C D I is the chronic daily intake (mg·kg−1·d−1) and R f D is the reference dose (mg·kg−1·d−1). The C D I is estimated using the equation:
C D I = C × I R × E F × E D B W × A T
In this equation, C represents the nitrate-nitrogen concentration in groundwater (mg·L−1); I R is the daily water ingestion rate (L·d−1); E F denotes the exposure frequency (d·a−1); E D is the exposure duration (a); B W denotes the mean body weight (kg); and A T is the averaging time (d). For non-carcinogenic effects, A T = E D × 365 .
The exposure parameters were assigned based on the Exposure Factors Handbook of the Chinese Population and relevant USEPA guidance [29]. For adults: I R = 2.0   L · d 1 , B W = 70   kg ; for children: I R = 1.0   L · d 1 , B W = 15   kg . The exposure frequency is E F = 365   d · a 1 , and the exposure duration is E D = 30   a for adults and E D = 6   a for children. The reference dose for nitrate-nitrogen is R f D = 1.6   mg · kg 1 · d 1 . An H Q value exceeding 1 denotes a possible non-carcinogenic health risk, and the risk increases with higher H Q values.

3. Results and Discussion

3.1. Hydrogeochemical Characteristics

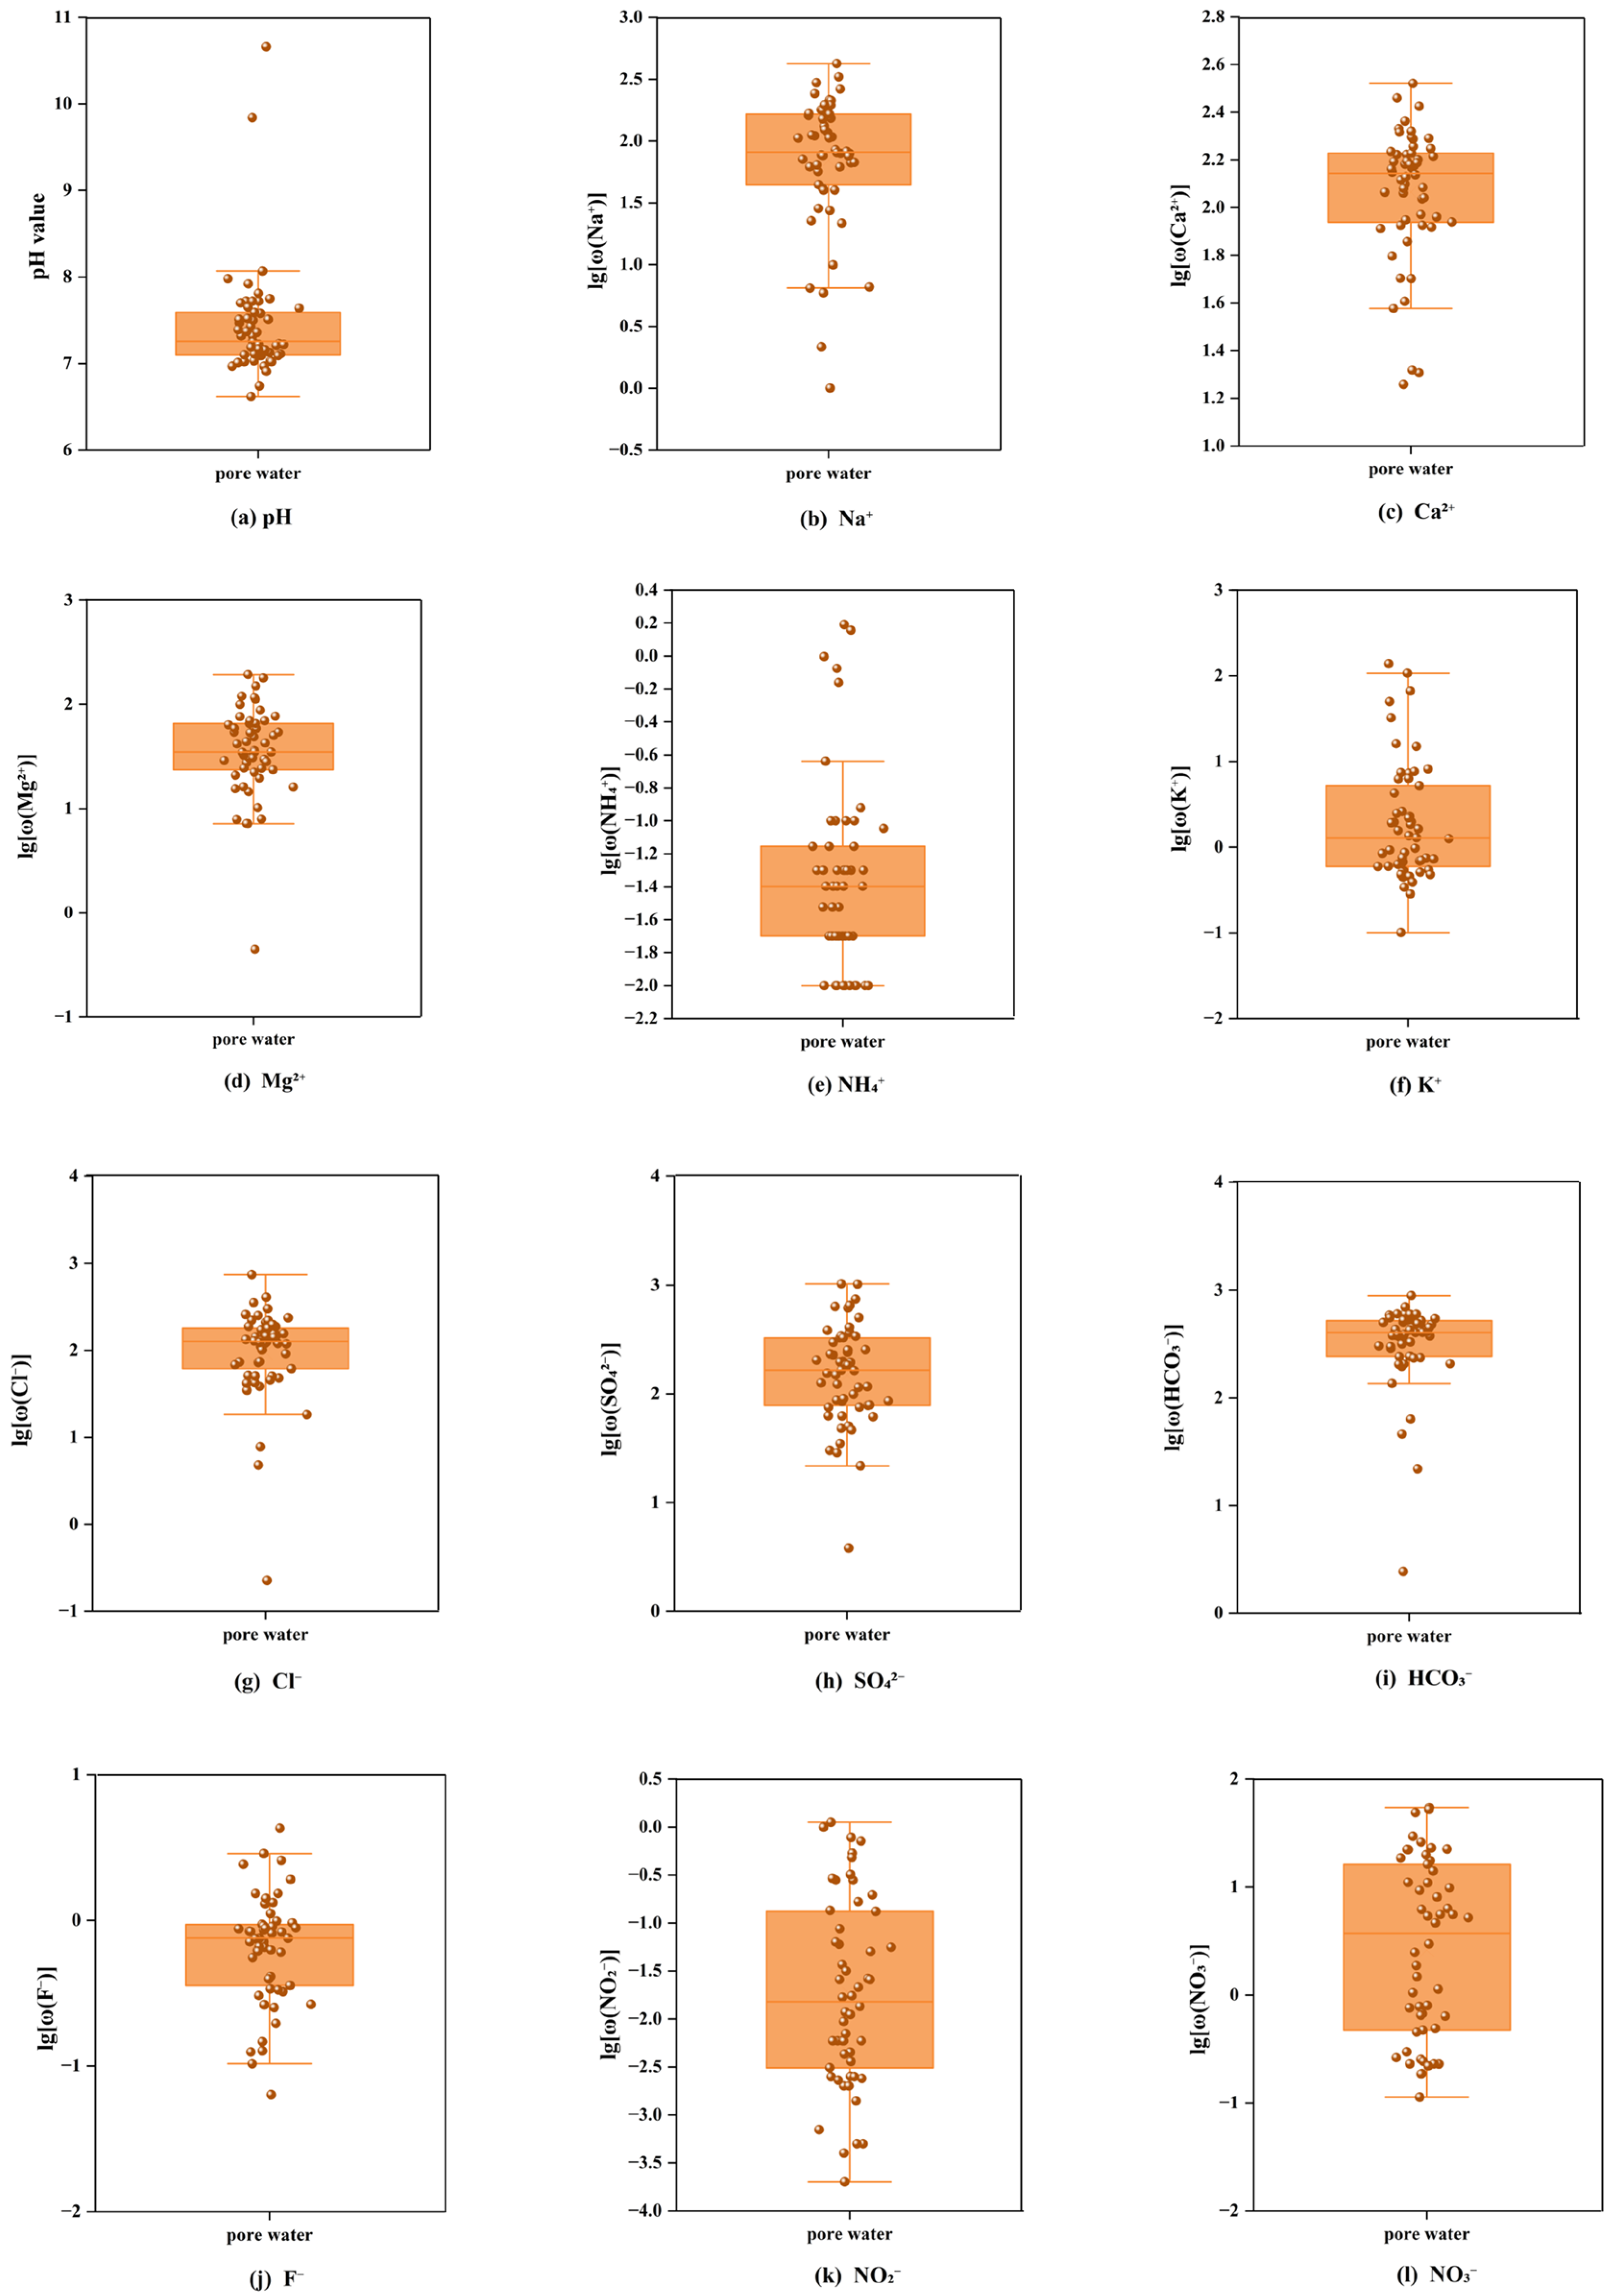
The major hydrogeochemical constituents of pore water in the study area are presented as box plots in Figure 2, with Figure 2b–l showing the logarithmic values of ion concentrations. The pH of the pore water ranges from 6.62 to 10.66, with most samples falling between 6.91 and 8.07. This phenomenon illustrates predominantly weakly alkaline water, although a few areas exhibit acidic conditions. The dominant cations within the pore water are Ca2+ and Na+, following the order Ca2+ > Na+ > Mg2+ > K+ > NH4+, with mean concentrations of 135.69 mg·L−1, 111.29 mg·L−1, 50.11 mg·L−1, 9.58 mg·L−1, and 0.14 mg·L−1, respectively. Ammonium (NH4+) concentrations are generally low, with elevated levels observed only at localized sites where nitrate concentrations are correspondingly low, reflecting nitrate transformation and consumption under reducing conditions [30]. The dominant anions are HCO3 and SO42−, following the order HCO3 > SO42− > Cl > NO3 > F > NO2, with mean concentrations of 391.90 mg·L−1, 235.15 mg·L−1, 141.83 mg·L−1, 9.46 mg·L−1, 0.88 mg·L−1, and 0.13 mg·L−1, respectively. According to the “Groundwater Quality Standard” (GB/T 14848–2017) [31], in the research area, all samples fell into Classes I–III for NH4+ and NO2, with none exceeding the Class IV limit. For NO3, most samples also fell into Classes I–III, with only four groundwater samples exceeding the Class III limit, corresponding to an exceedance rate of 18.52%. As the primary focus of this study, nitrate-nitrogen (NO3-N) concentrations range from 0.82 to 54.31 mg·L−1. Importantly, a coefficient of variation (CV) of 1.41—higher than that of most other ions—indicates significant influence from external inputs. For comparison, the coefficients of variation for other major ions are: Ca2+ 0.48, Mg2+ 0.86, Cl 0.90, SO42− 1.03, and NH4+ 1.71, with only NH4+ showing a higher CV due to localized reducing conditions. Nitrite (NO2), an intermediate product of NO3 reduction, exhibits a positive relationship with NO3, further validating the occurrence of denitrification within some areas and providing direction for subsequent identification of nitrate pollution sources [32]. In the pore water, the dominant cations and anions exhibit considerable regional variation, with coefficients of variation ranging from 0.45 to 2.34. This suggests complex water-rock interaction mechanisms during groundwater recharge and transport in the study area [33]. As an indicator sensitive to external disturbances, the concentration characteristics of NO3 and its relationships with other ions highlight the impact of anthropogenic activities upon the hydrogeochemical composition, laying a foundation for subsequent source identification.
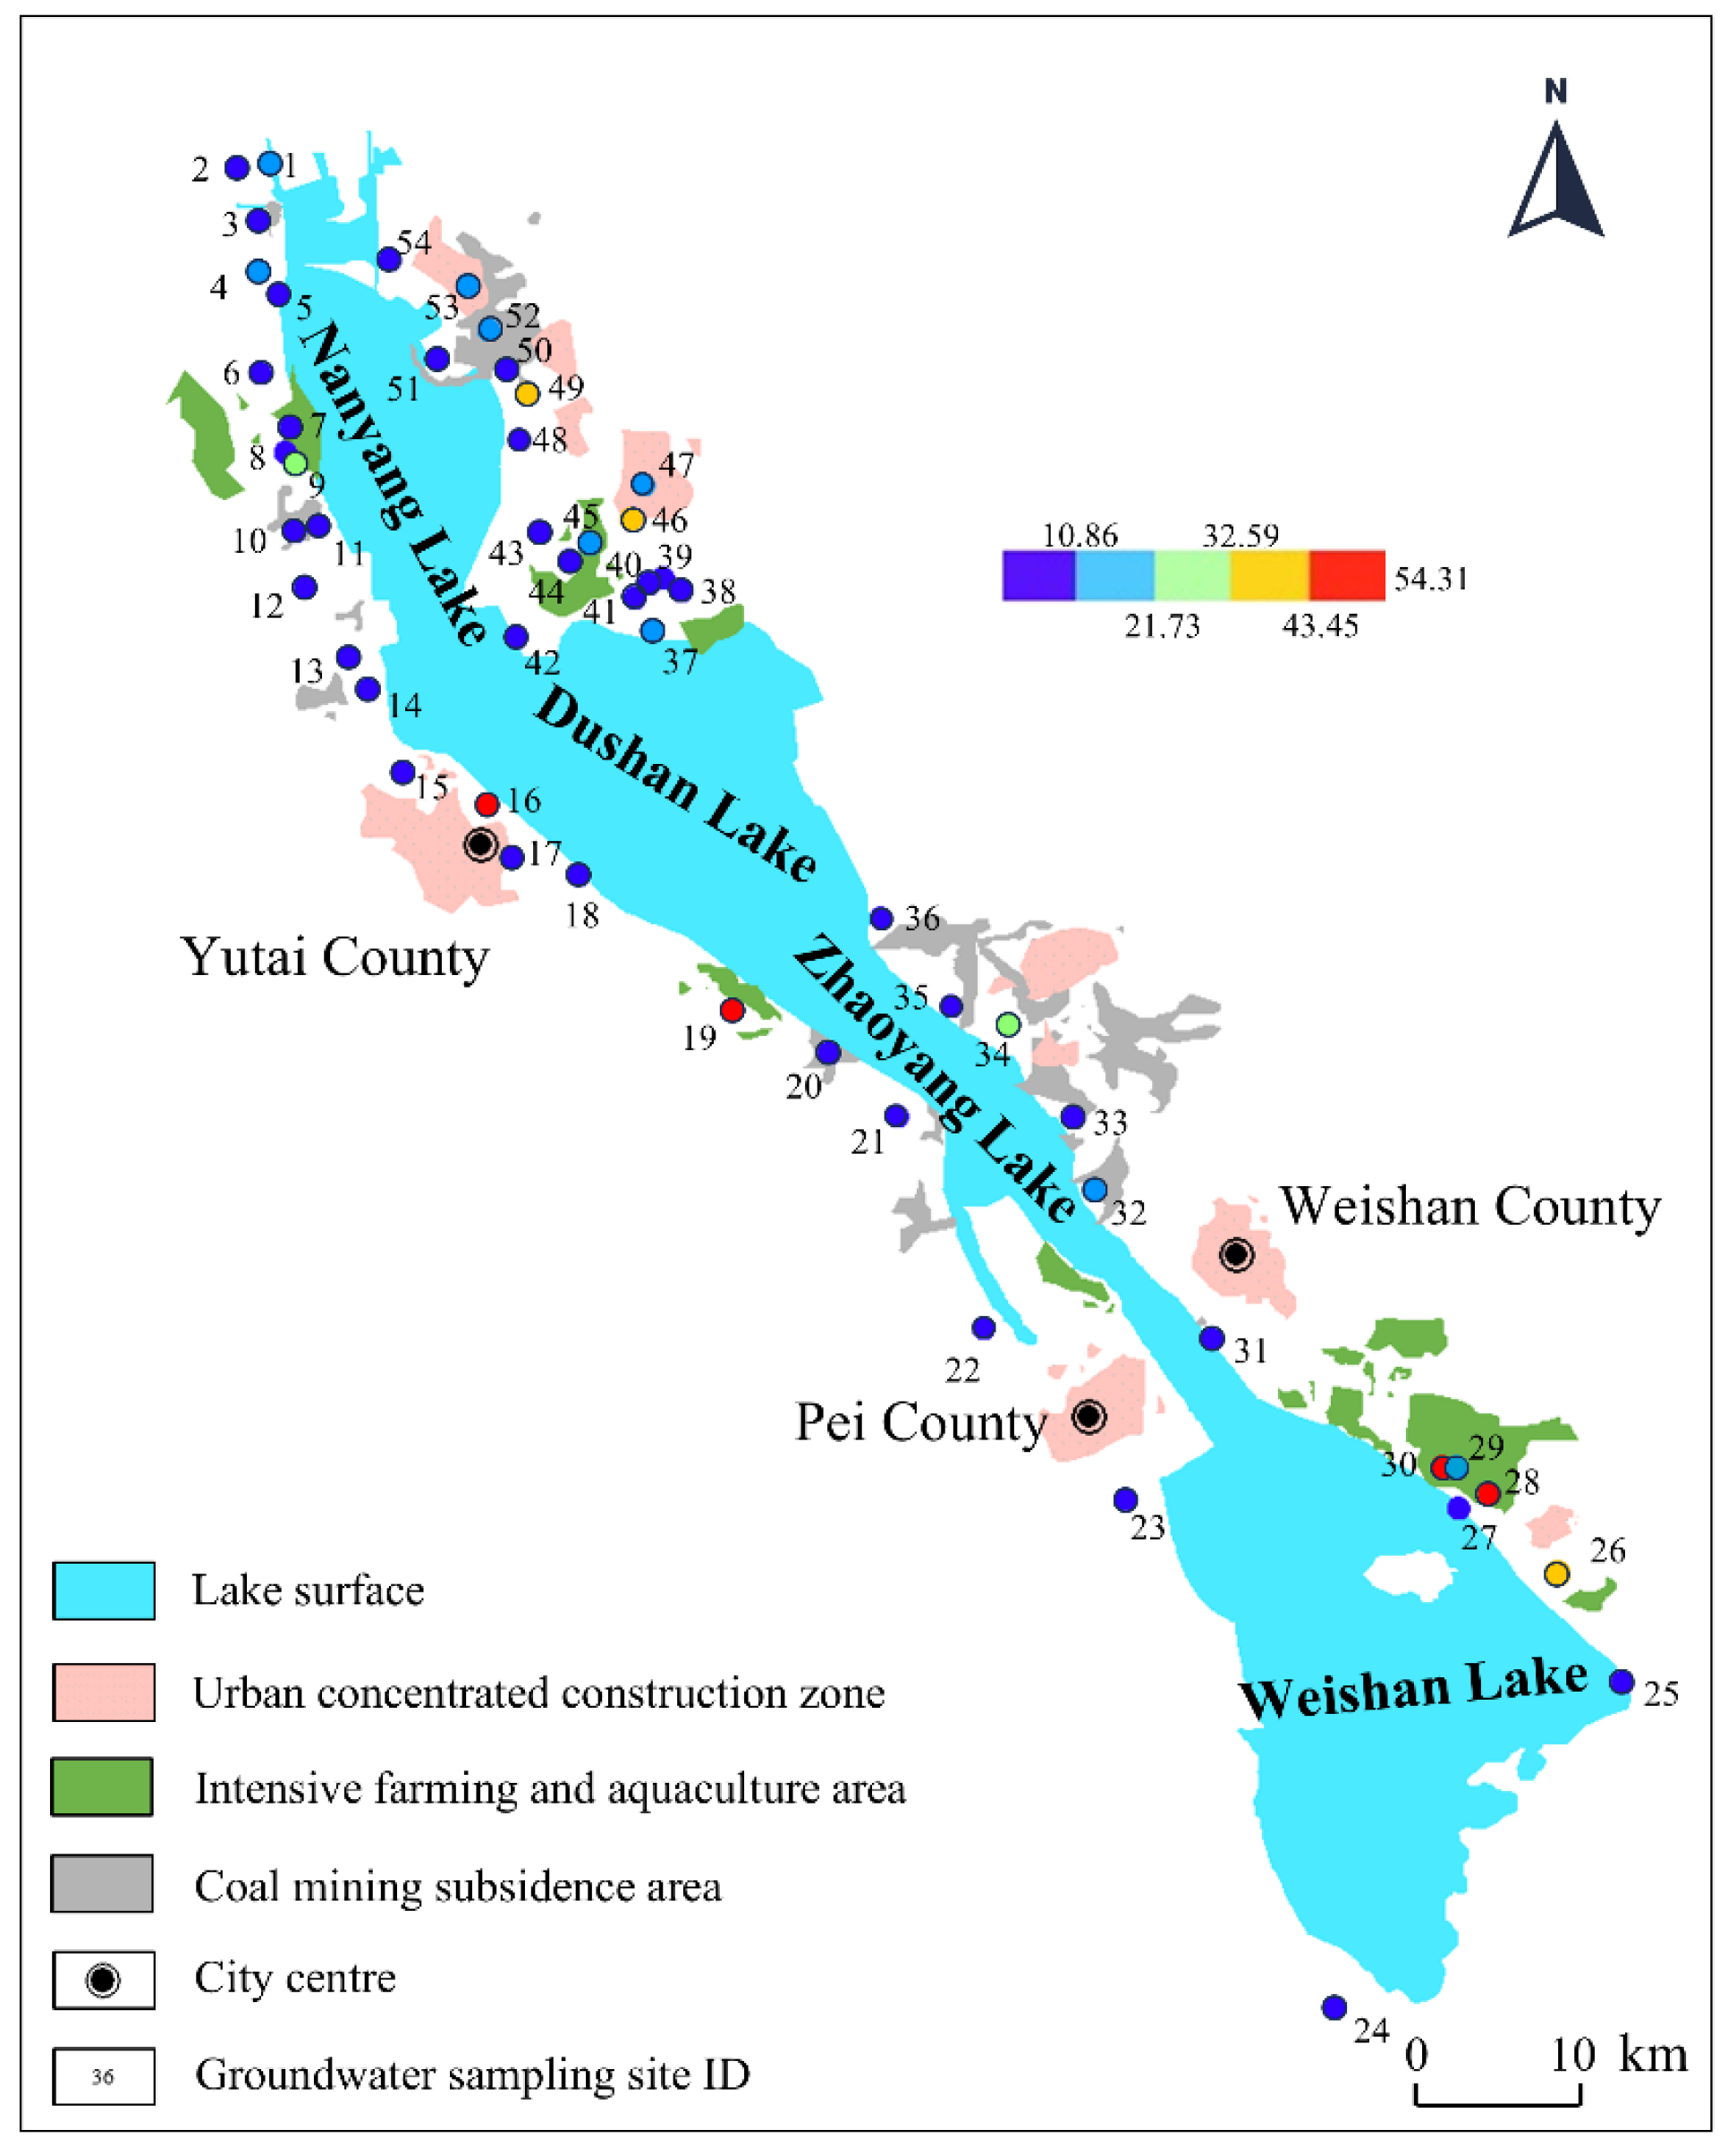
In order to characterize the spatial distribution of the nitrate, a map of the distribution of nitrate concentration (Figure 3) was generated based on data at 54 pore water sampling points, integrated with land use and hydrogeological conditions of the study area. All maps (Figure 1 and Figure 3) were generated using ArcGIS Desktop version 10.8 (Esri, Redlands, CA, USA). Figure 3 shows that there is a clear spatial variation in the concentrations of nitrate. High-concentration neighborhoods (marked by yellow and red hues in the map) are concentrated in the intensive farming and aquaculture area of southern Weishan County and the urbanized zones of northern Yutai County. Sampling sites 30 and 16 represent these two areas, respectively, both characterized by intense anthropogenic activity. The low-concentration regions (purple markers) are mostly located around the coal mining subsidence area in the northwestern part of the Nansi Lake, with the sampling points 10 and 11 being typical examples. Medium-concentration regions (blue and green markers) demonstrate transitional distribution, concentrated primarily in the urban outskirts and the aquaculture regions, with 9 and 45 sampling sites being typical representatives of this group. In general, the spatial distribution of the nitrate in the study area is highly regionalized. High-concentration zones significantly overlap with areas of high human activity, such as urban development, agricultural production, and aquaculture. Low-concentration zones occur in relatively low-intensity areas of direct human disturbance, including coal mining subsidence zones. Medium-concentration zones, which act as transition zones between high- and low-concentration zones, are widely spread, and this represents a space-based trend of nitrate pollution radiating from core polluted regions.

3.2. Hydrogeochemical Types

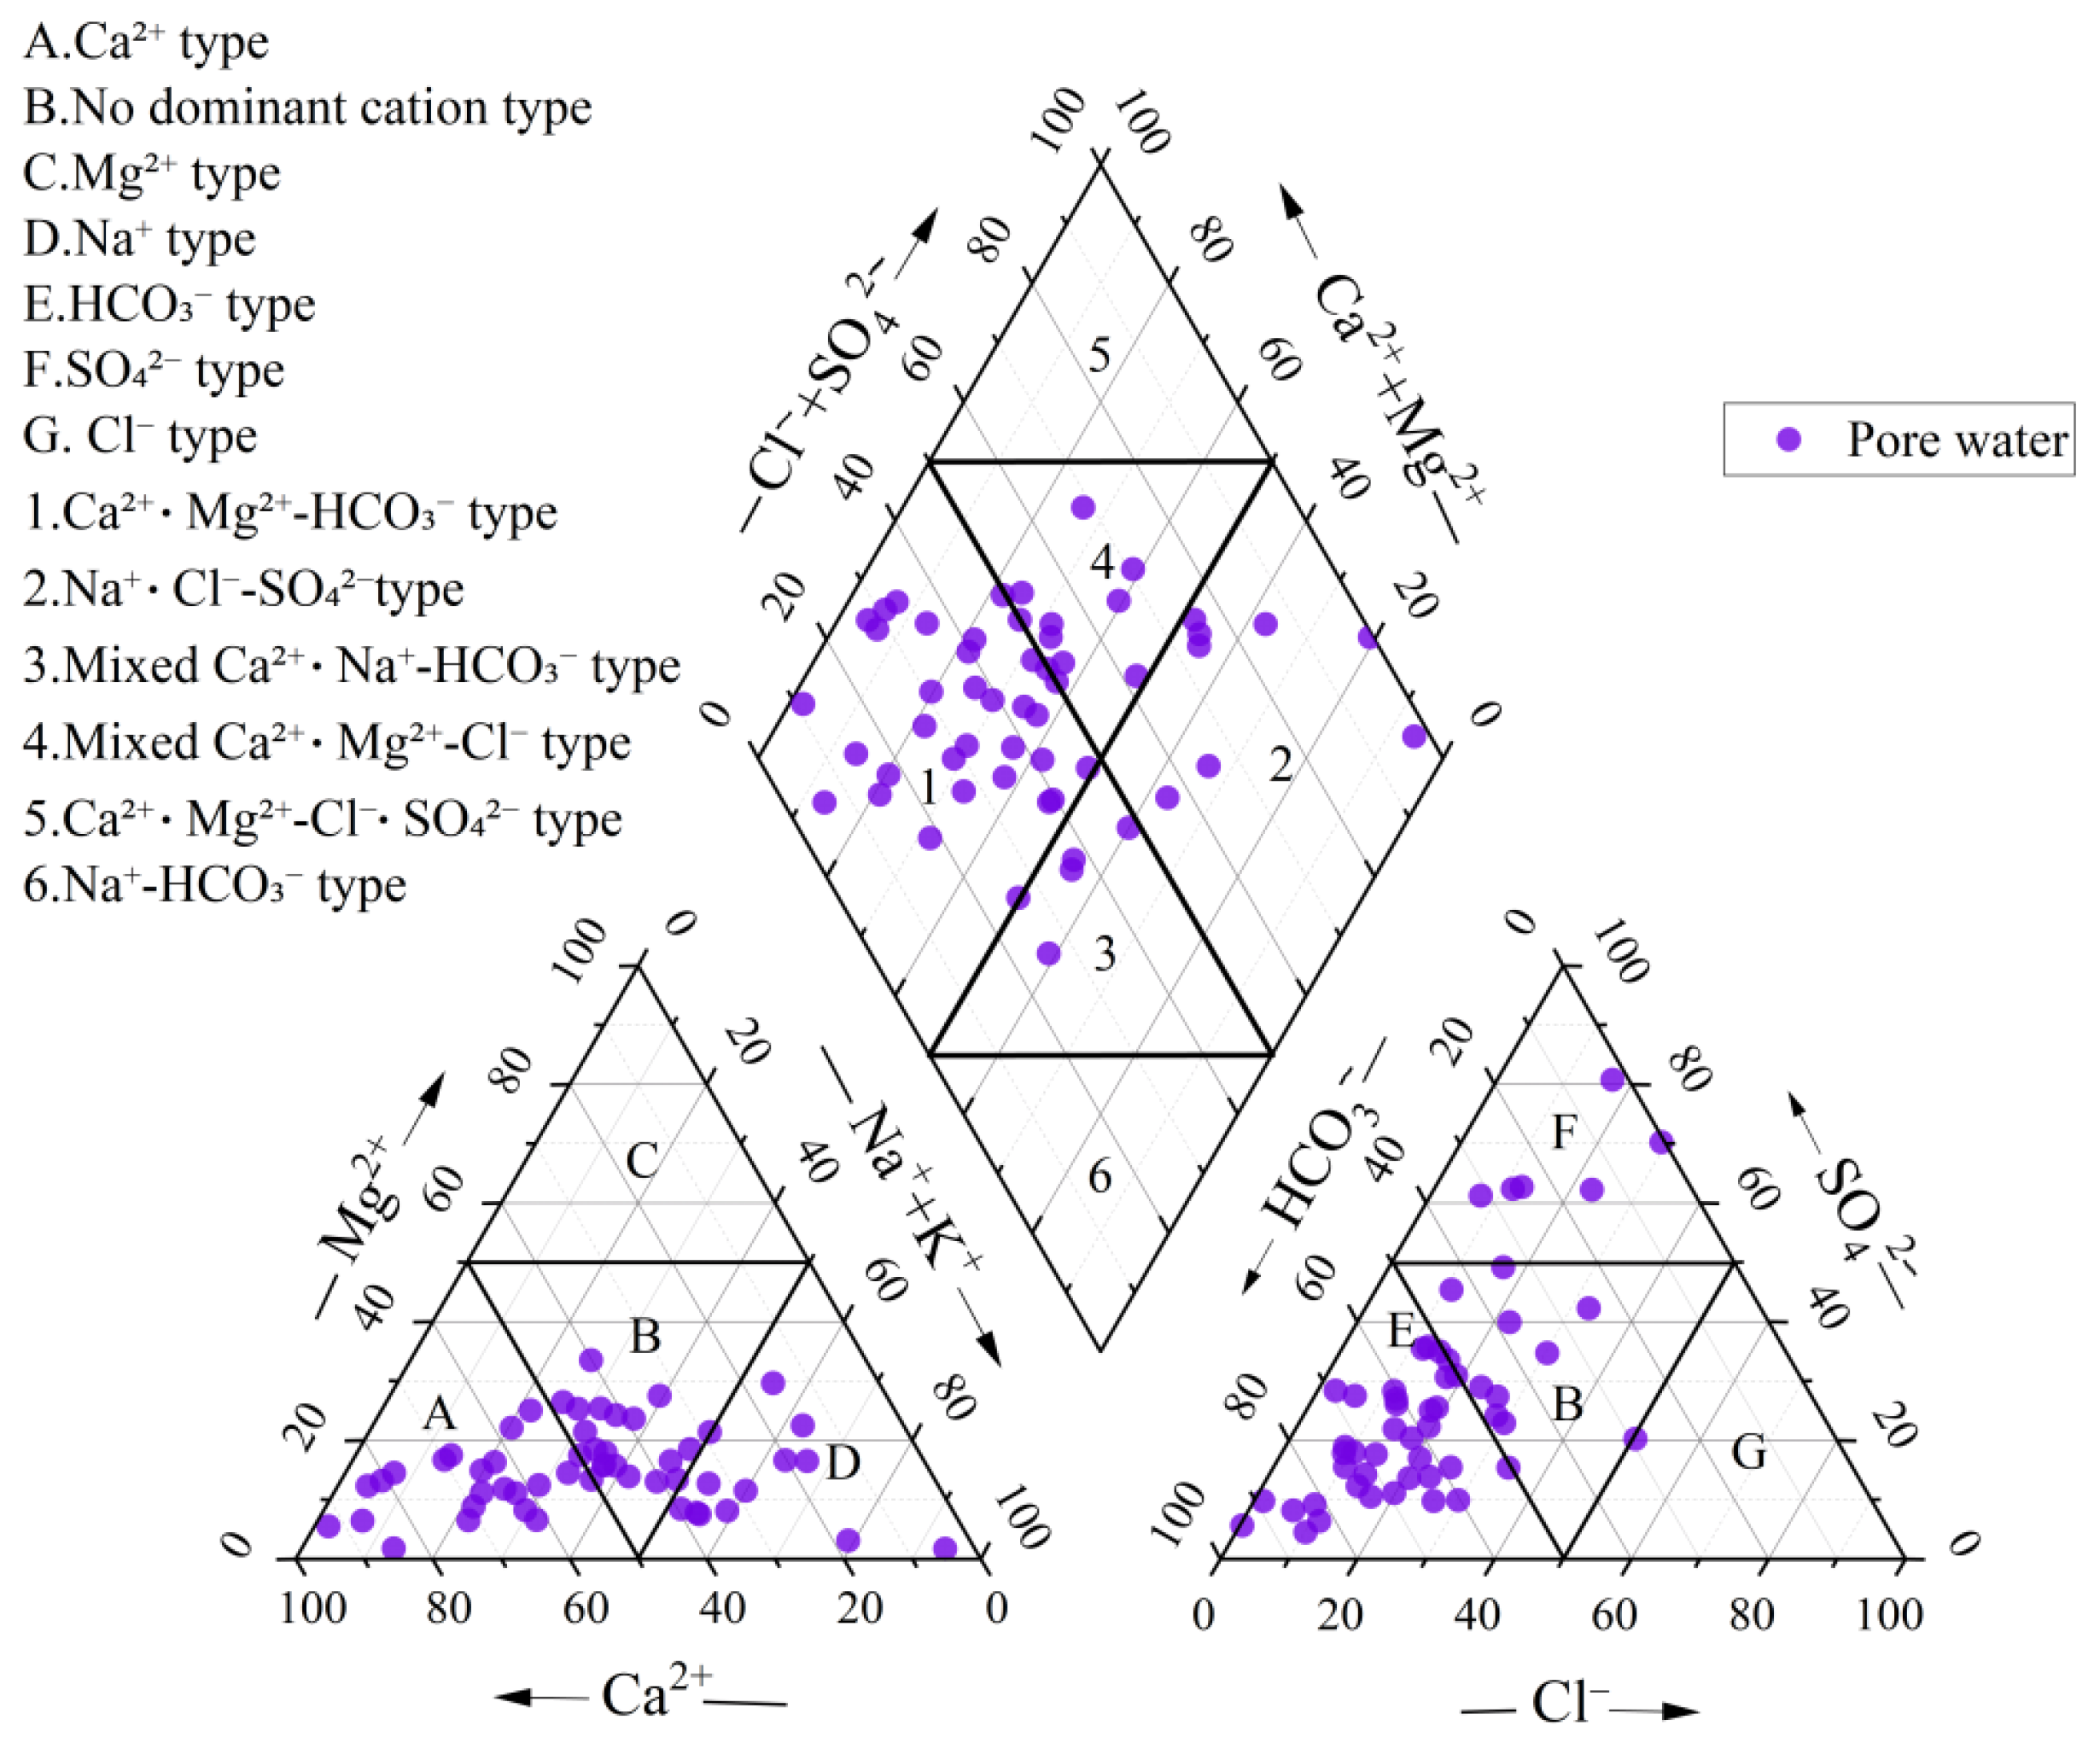
The Piper diagram for the groundwater in the study area (Figure 4) reveals the predominant hydrogeochemical facies: Ca2+·Mg2+-HCO3 type, mixed Ca2+·Mg2+-Cl type, Na+·Cl-SO42− type, and mixed Ca2+·Na+-HCO3 type, accounting for 63.33%, 16.67%, 13.33%, and 6.67% of the samples, respectively. The pore water’s cation end-members primarily cluster in the Ca2+ type (zone A), the no-dominant-cation zone (Zone B), and Na+ type (zone D), with Ca2+ and Na+ serving as the primary cation sources. The anion end-members are predominantly concentrated in the HCO3 type (zone E), with a small proportion in the SO42− type (zone F). Overall, HCO3 is the dominant anion, and the pore water mainly shows Ca2+·Mg2+-HCO3 type, followed by minor occurrences of mixed Ca2+·Mg2+-Cl type, Na+·Cl-SO42− type, and mixed Ca2+·Na+-HCO3 type.

3.3. Source Identification

The primary origins of dissolved ions in groundwater include atmospheric precipitation recharge, lateral seepage from surface water, and the weathering and hydrolysis of minerals in sediments and soils [34,35]. Besides these natural sources, anthropogenic activities also exert significant impacts [36,37]. In this section, multiple analytical techniques—including Gibbs diagrams, ionic ratio analysis, and PCA—are integrated to systematically recognize the groundwater nitrate’s pollution sources and driving mechanisms by analyzing water-rock interactions, tracer ion characterization, and extraction of key controlling factors [14,15,16].

3.3.1. Gibbs Diagrams and NO3/Cl Relationships

Gibbs diagrams, based on the equal concentration ratios of Na+/(Na+ + Ca2+) and Cl/(Cl + HCO3), can rapidly discriminate the formation mechanisms of natural waters and assess the influence of processes such as precipitation, evaporation-crystallization, rock weathering, and water mixing. In the area surrounding Nansi Lake, the Na+/(Na+ + Ca2+) and Cl/(Cl + HCO3) weight ratios for most pore water samples are predominantly concentrated in the range below 0.5, closely aligned with the rock-weathering dominance region. No significant trend toward the precipitation dominance or evaporation dominance end-members is observed, suggesting that the pore water’s hydrogeochemical composition is primarily controlled by rock weathering and leaching, with precipitation dilution and evaporation playing relatively minor roles in the overall hydrogeochemical evolution. Meanwhile, the pore water samples exhibit a relatively wide distribution in both Gibbs diagrams (Figure 5a,b), generally located in the middle-right part of the water-rock interaction-controlled region, with some samples showing a slight shift toward the evaporation dominance end-member. This characteristic reflects a hydrogeochemical origin fundamentally shaped by carbonate weathering and leaching, superimposed with external inputs and evaporation-concentration effects from the shallow environment.
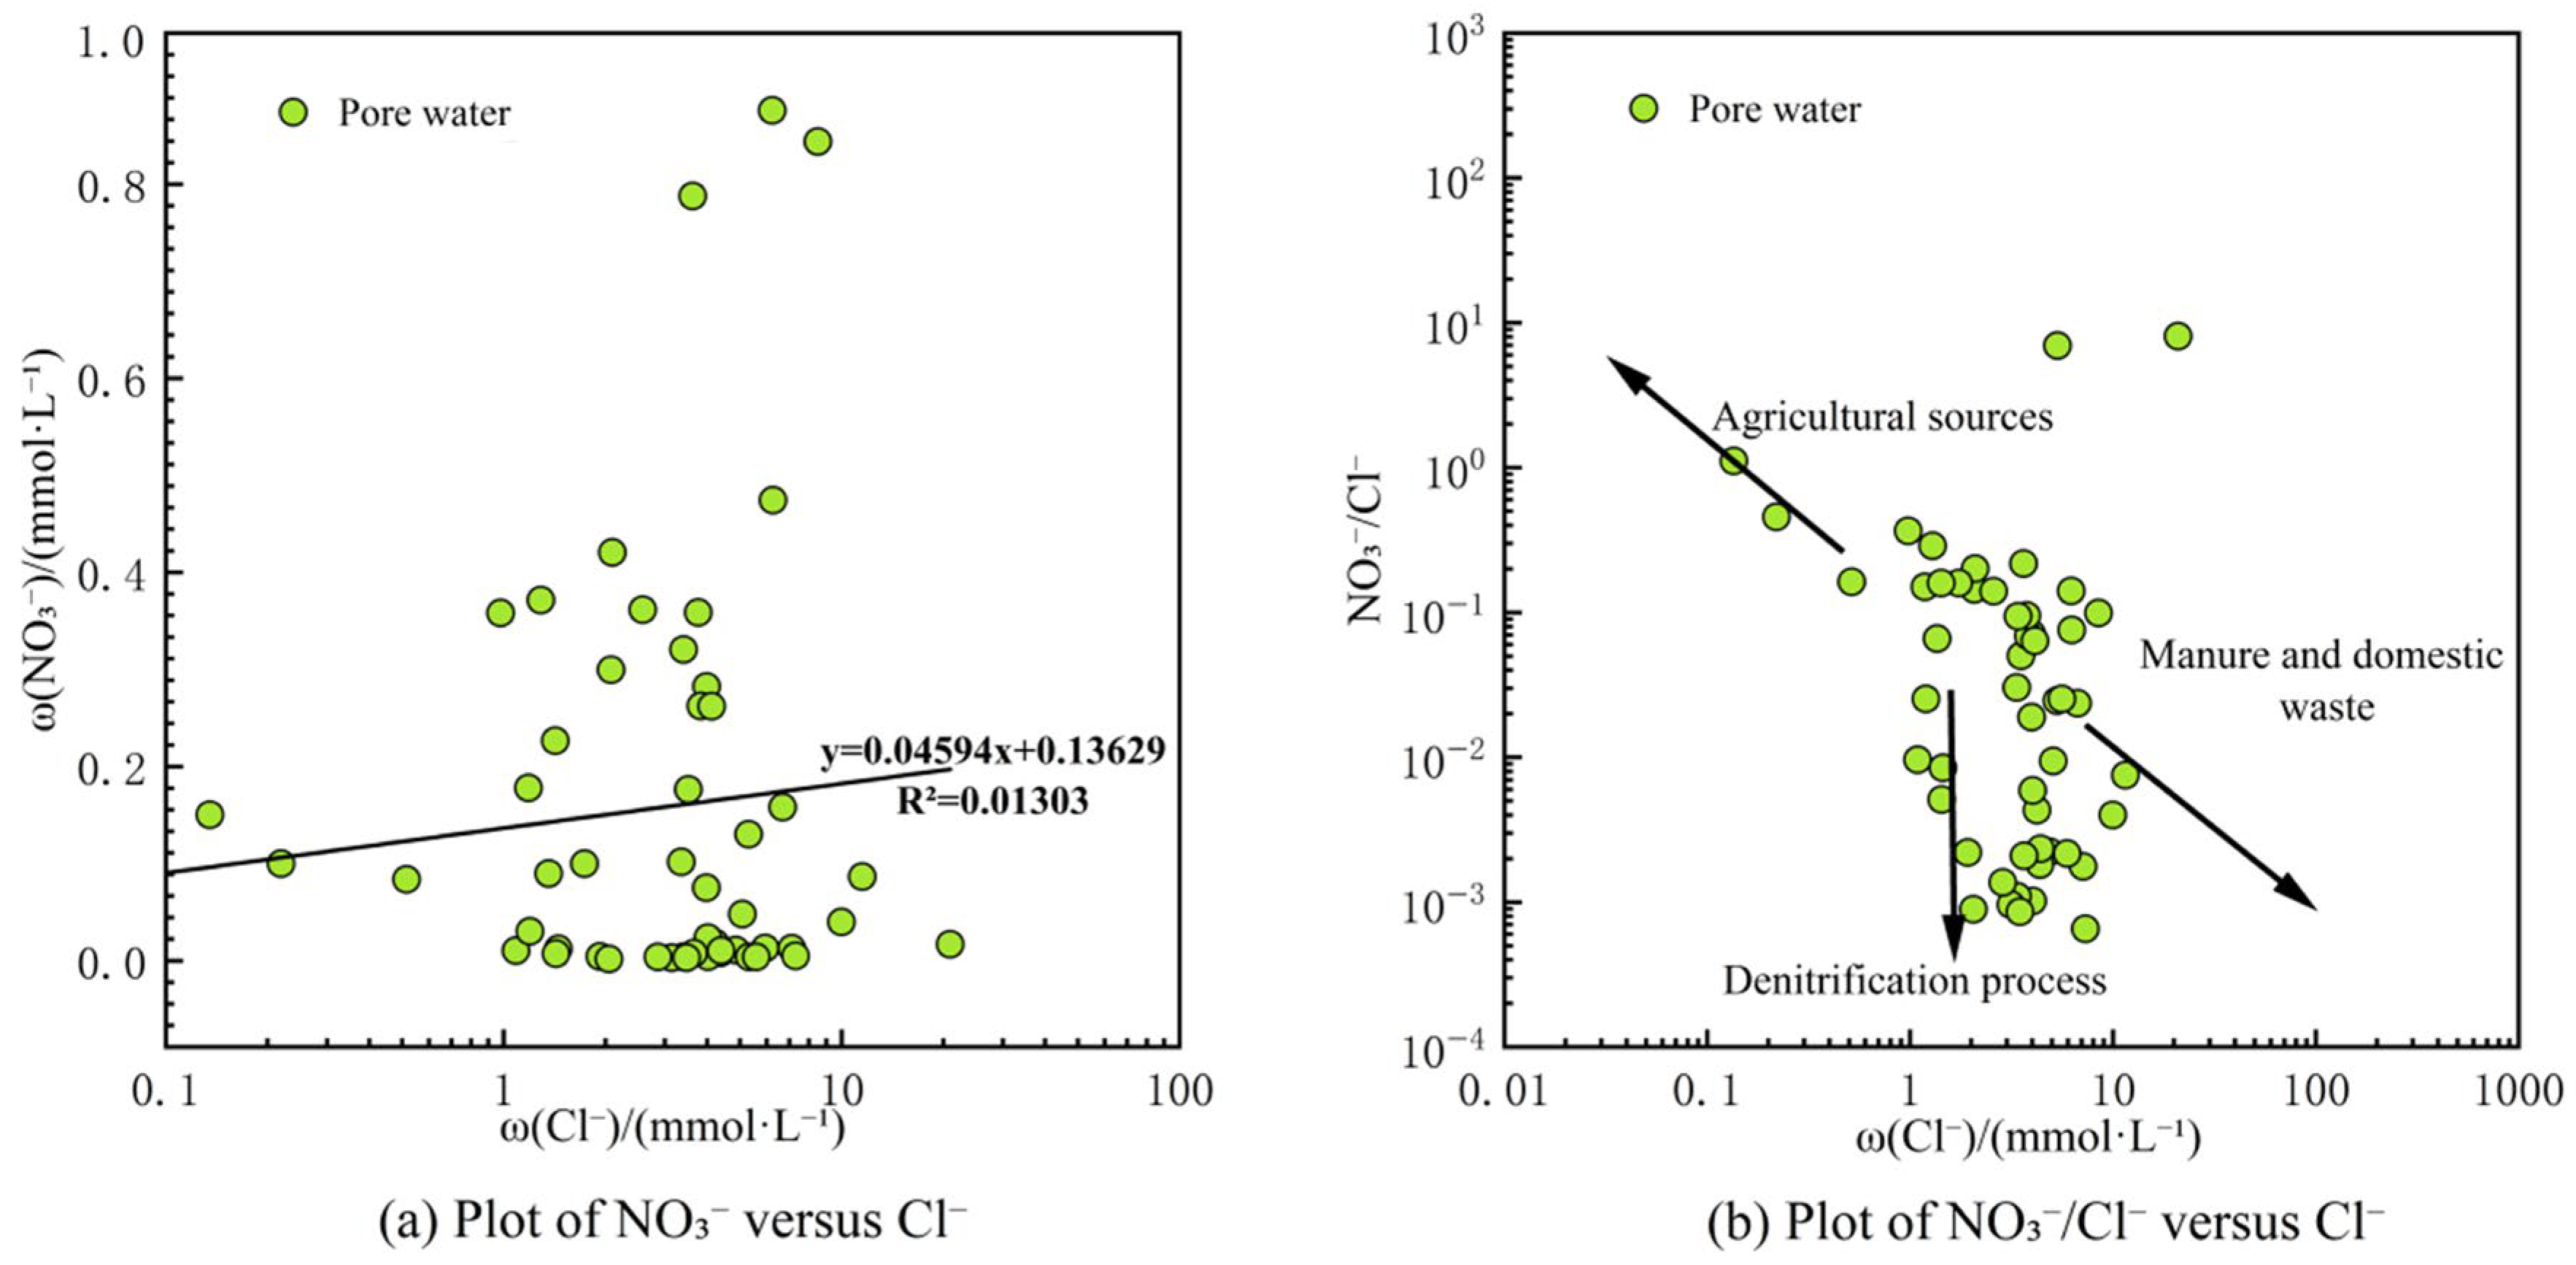
Pore water nitrate is formed as a result of atmospheric deposition, soil organic nitrogen, and nitrogen-bearing emissions from anthropogenic processes, the latter being the primary cause of nitrate contamination. Chloride (Cl) is stable in water and serves as an excellent tracer to determine the sources of pollution [38]. There is no significant linear correlation between NO3 and Cl in the pore water within the study area (Figure 6a), suggesting that these two ions are of different origins. This indicates that the NO3 is not chiefly produced by natural processes such as halite dissolution or lake water, but by external sources. Further analysis combining the NO3/Cl ratio with Cl concentration enables more precise identification of specific nitrate pollution sources [25,39]. Chemical fertilizers typically contain high concentrations of NO3 but low Cl, corresponding to high NO3/Cl ratios. In contrast, when Cl concentrations are high and NO3/Cl ratios are low, the pollution source is more likely to be domestic sewage or manure.
Overall, the pore water samples exhibit distinct clustering in the plot, covering two main ranges: low Cl with high NO3/Cl, and high Cl showing low NO3/Cl. Samples with low Cl and high NO3/Cl ratios are distributed along the “agricultural fertilizer” trend line, indicating that nitrate in these samples is primarily derived from fertilizer application. These samples are mainly located in low-mountain and hilly areas characterized by dry farmland, orchards, and scattered agricultural plots, where planting scales are limited by topography and fertilizer application intensities are relatively low, resulting in only slight nitrate enrichment with generally low concentrations. In contrast, samples with high Cl and low NO3/Cl ratios are distributed near the “manure and domestic waste” trend line, with some showing a shift toward the denitrification direction. This suggests that nitrate contamination mainly originates from the infiltration of domestic sewage and aquaculture wastewater. Our samples are located in lakeside plain areas where land use is dominated by urban construction land, contiguous farmland, and aquaculture zones. Domestic sewage and aquaculture wastewater enter the groundwater system through surface infiltration or lateral seepage from rivers and canals. The shallow groundwater in these regions is predominantly under reducing conditions, promoting partial denitrification. High permeability of the vadose zone facilitates the rapid infiltration of nitrogen-bearing pollutants and organic matter of domestic sewage, aquaculture wastewater, etc. Microorganisms living in the groundwater decompose the infiltrated organic matter and use large quantities of dissolved oxygen, converting the groundwater into reducing conditions. This creates favorable conditions for denitrification, leading to the consumption of some nitrate and ultimately manifesting as the observed high Cl and low NO3/Cl characteristics. This finding corroborates the earlier hydrogeochemical characterization showing that localized high NH4+ concentrations correspond to low nitrate levels and that NO2 is positively correlated with NO3, further confirming the occurrence of denitrification under reducing conditions in the study area.

3.3.2. Relationships Among SO42−/Na+, Cl/Na+ and NO3/Na+

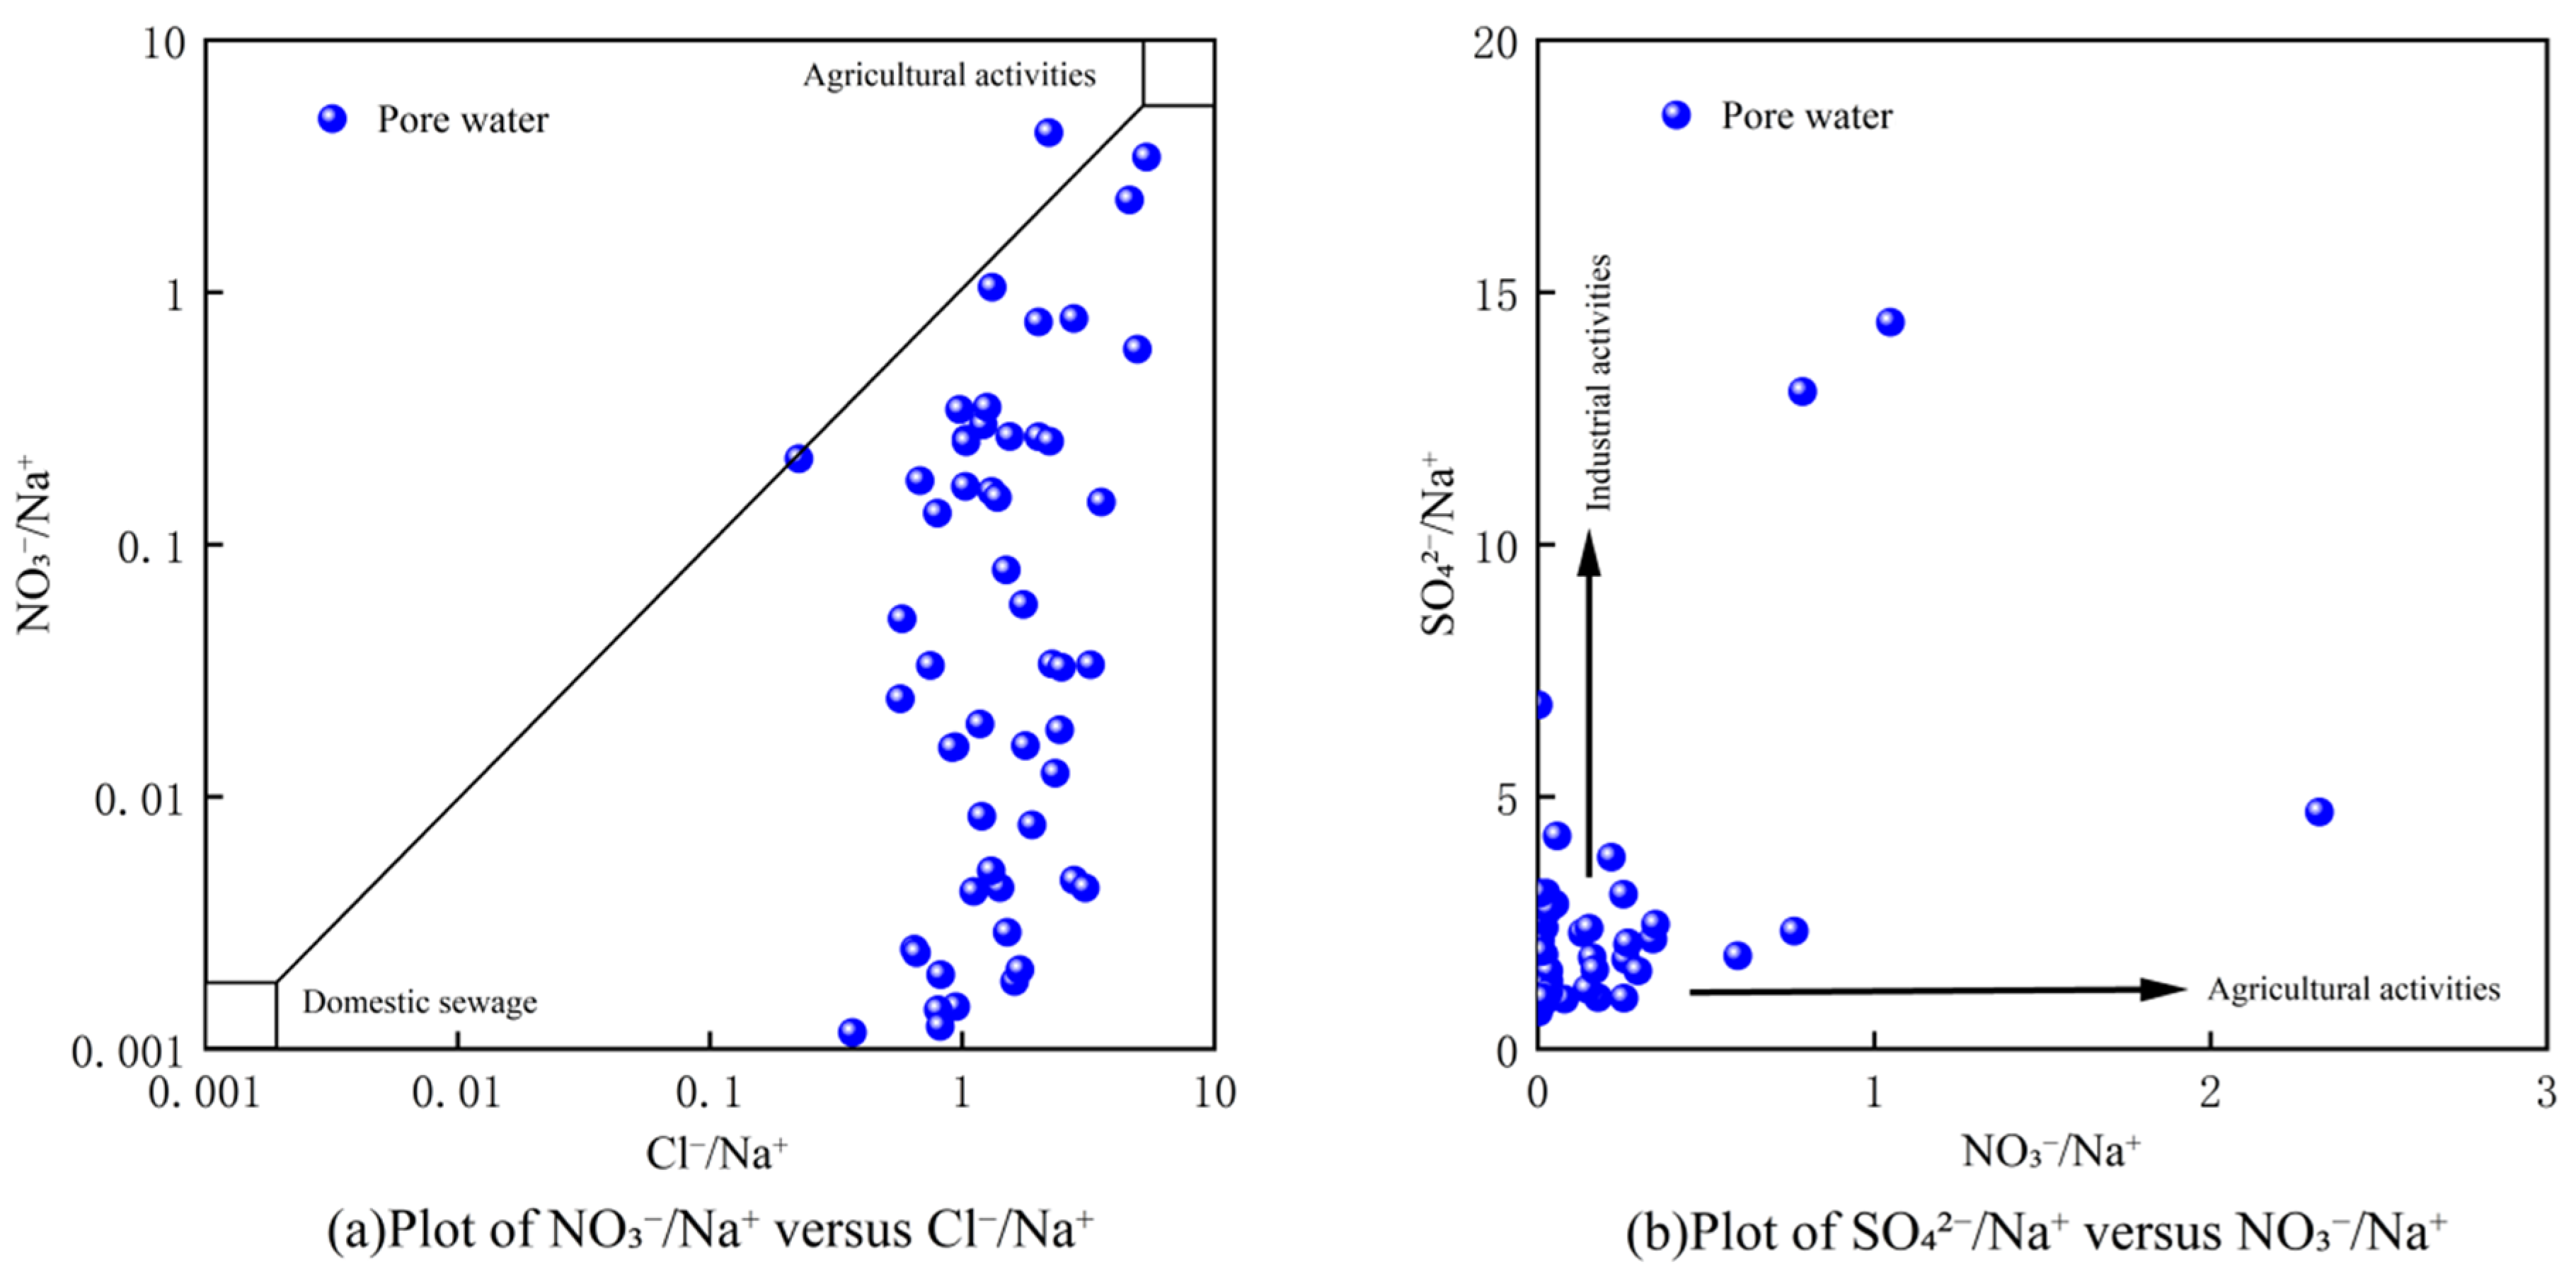
In groundwater studies of the Nansi Lake region, ionic ratios provide an effective approach for identifying nitrate pollution sources. Research by Liu et al. [40] has demonstrated that the ratios of SO42−/Na+, Cl/Na+, and NO3/Na+ could be utilized for differentiating the impacts of agricultural and industrial activities on groundwater nitrate levels. Unlike the Weibei Plain, where industrial activities were identified as a secondary nitrate source [40], our ionic ratio analysis (Figure 7a) shows that most pore water samples plot above the y = x line, indicating that agricultural non-point sources, rather than industrial discharge, are the primary drivers of elevated Cl/Na+ and NO3/Na+ ratios in the Nansi Lake Basin. Increased intensity of human activities typically elevates Cl, NO3, and SO42− concentrations in groundwater, with nitrate inputs primarily originating from agricultural production and domestic sewage discharge [41]. In contrast to the natural weathering-dominated signature observed in the Loess Plateau rivers [41], our ionic ratio analysis (Figure 7a) reveals that anthropogenic agricultural inputs, rather than natural weathering, serve as the primary drivers of elevated NO3/Na+ and Cl/Na+ ratios in the pore water of the Nansi Lake lakeside plain. Groundwater affected by anthropogenic pollution generally exhibits elevated Cl/Na+ and NO3/Na+ ratios. In Figure 7a, most pore water samples are in the upper-right region relative to the y = x line, a characteristic pattern indicative of anthropogenic disturbance. This distribution suggests that agricultural activities are the primary contributors to groundwater nitrate. Only a small number of samples exhibit features indicative of industrial influence, indicating that industrial pollution is not the dominant factor driving groundwater nitrate contamination in the Nansi Lake Basin at present.

3.3.3. Principal Component Analysis Results

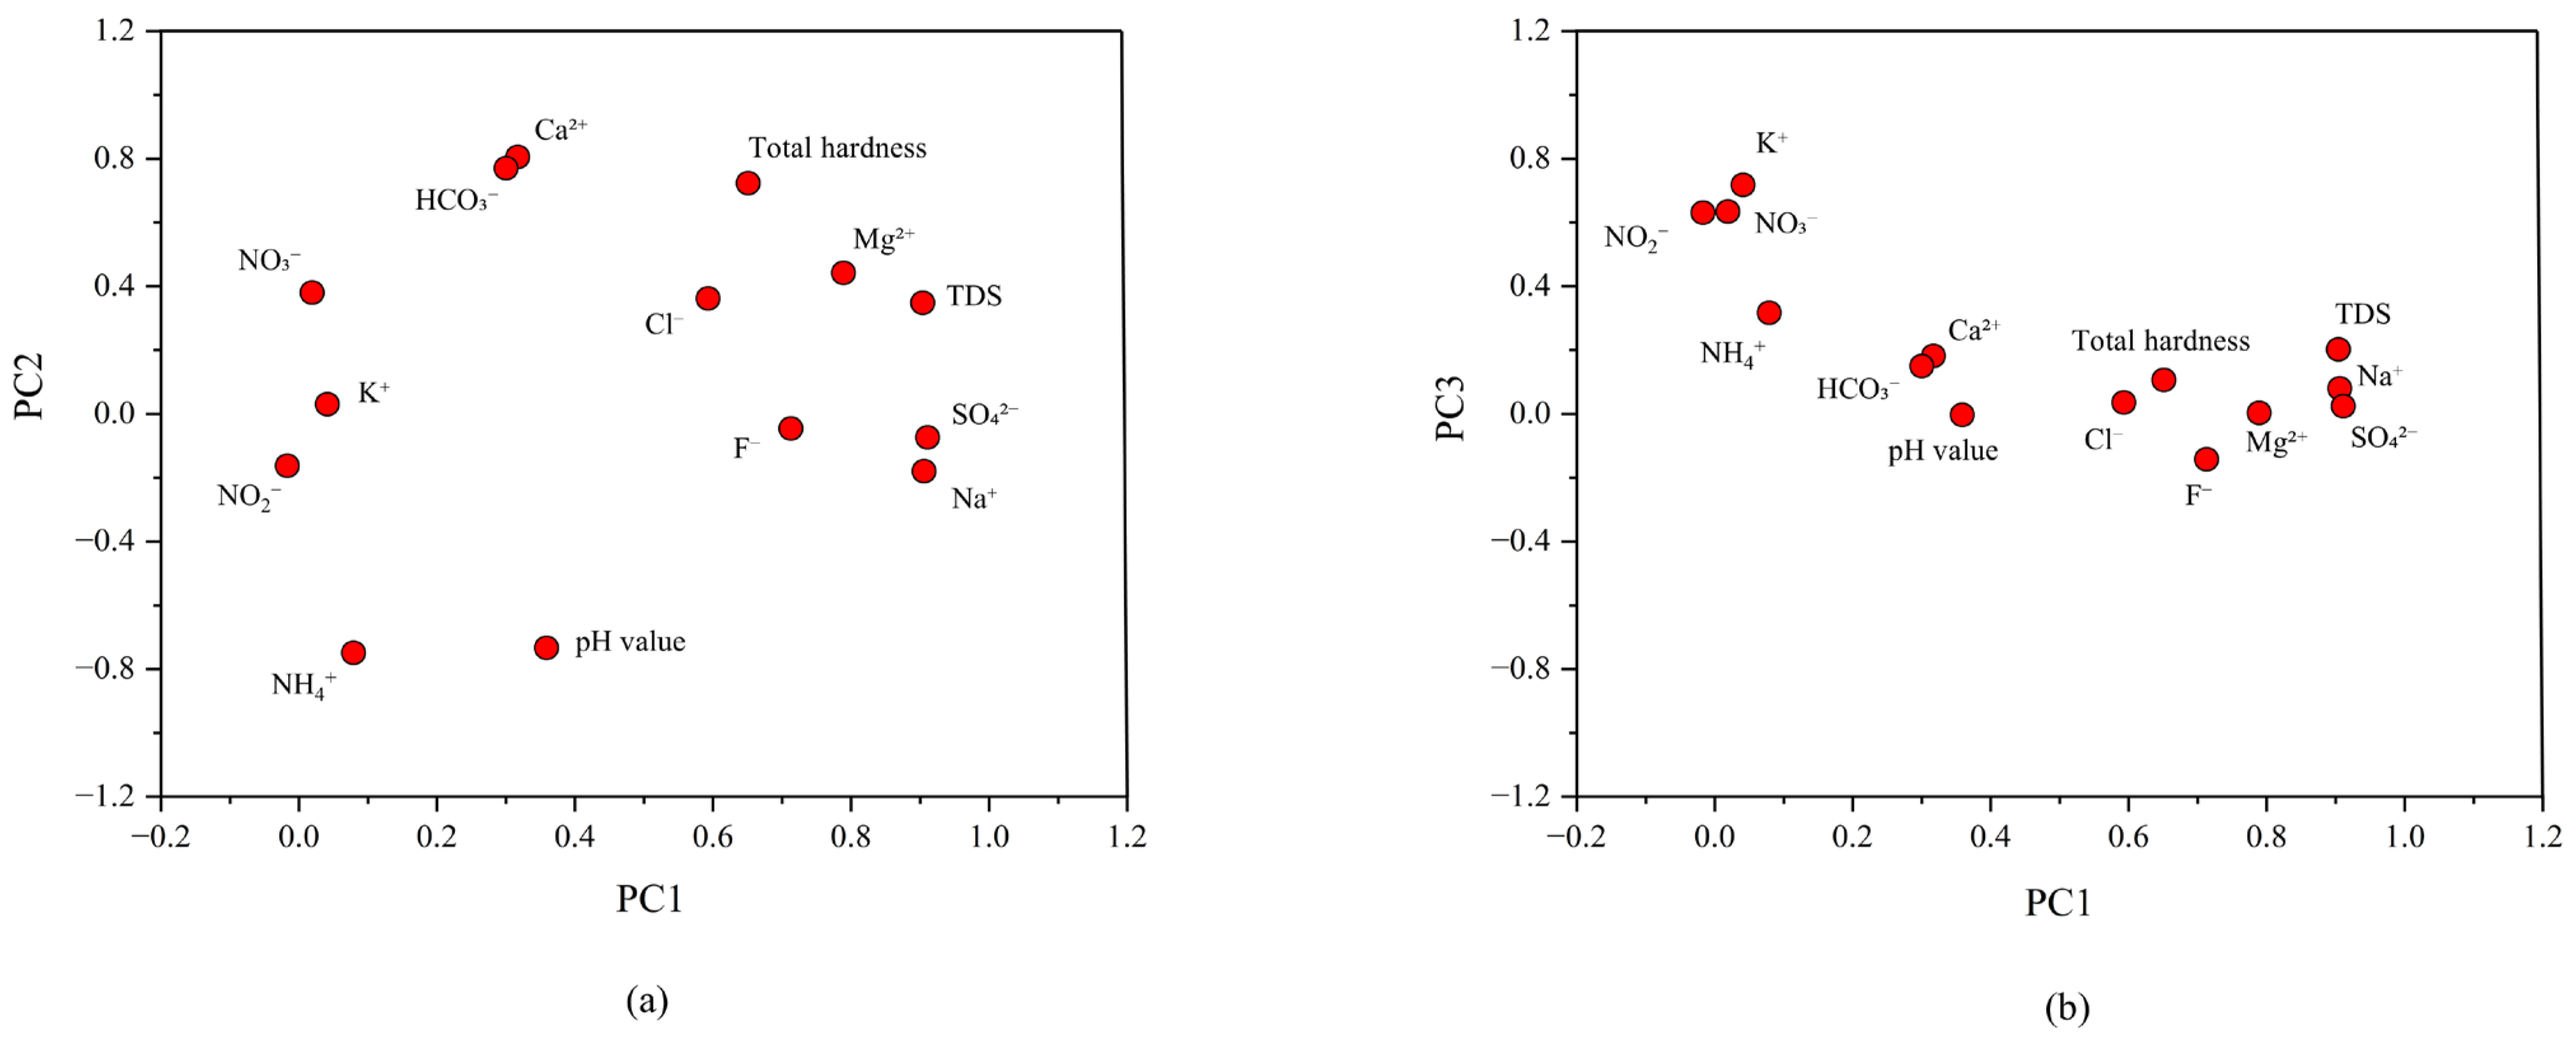
To elucidate the factors influencing groundwater hydrochemistry in the study area, PCA was conducted on 11 major ions that significantly affect groundwater quality. The Kaiser-Meyer-Olkin (KMO) measure of sampling adequacy yielded a value of 0.709, with Bartlett’s test of sphericity reaching statistical significance (χ2 = 1269.20, p < 0.001). This illuminates the suitability of the PCA data. Factor rotation was performed through the Kaiser normalization varimax method. Based on the criterion of eigenvalues exceeding 1, three principal factors affecting groundwater quality were obtained, accounting for a cumulative variance contribution of 69.81%, effectively representing the essential hydrogeochemical information within the research region (Table 1, Figure 8).
PC1, with a variance contribution rate of 39.82%, is the dominant factor influencing the groundwater hydrogeochemical structure within the research region. This component shows a strong positive loading for TDS, Na+, Mg2+, SO42−, Cl, F, and total hardness (TH). This predominantly reflects the impact of intense anthropogenic activities, particularly the combined effects of coal mining and pollution inputs from industrial and domestic sources. The area of the study, Nansi Lake Basin, possesses abundant coal resources and numerous active mines. Mining drainage and coal gangue leachate can significantly increase SO42−, Cl, and Na+ levels in groundwater. Moreover, the release of industrial and domestic wastewater related to urbanization in the area is also a significant source of TDS and the mentioned ions.
PC2, which has a variance contribution rate of 19.44%, is a secondary factor that affects groundwater hydrogeochemical characteristics. This component displays an extremely high positive loading of TH, Ca2+, and HCO3, which evidently reflects the prevailing influence of natural hydrogeochemical processes, specifically the dissolution and weathering of carbonate rocks. Cambrian-Ordovician carbonate formations are scattered in the eastern and northeastern areas of the research area. Their weathering and dissolution contribute large amounts of Ca2+ and HCO3 to the groundwater, which essentially defines the mostly calcium bicarbonate hydrogeochemical type of the regional groundwater.
PC3, which has a variance contribution rate of 10.55%, is mostly representative of the effects of agricultural activities. This element is highly related to K+, NO3, and NO2. NO3 and NO2 are characteristic signs of agricultural non-point source pollution, and their sources primarily indicate intensive use of fertilizers on farmlands, livestock rearing, and sewage infiltration into the basin. This element verifies the major contribution of agricultural operations to nitrogen contamination in groundwater.
Overall, the above three major components contribute to a cumulative variance rate of 69.81%, which explains the formation processes of the hydrogeochemical characteristics of the groundwater in the Nansi Lake Basin in a systematic manner. The primary driver is anthropogenic pollution input from coal mining, industries, and domestic sewage discharge. The secondary controlling factor is the natural geological background of carbonate rock weathering in the region. The most significant process influencing nitrogen components in the groundwater is agricultural non-point source contamination. To further indicate the patterns of spatial differentiation of these main controlling factors in the study area, scores of the three main components were computed using each of the 54 sampling points (Table 2). Results demonstrate that the spatial distribution of the principal component scores has a close relationship with the nitrate concentration pattern (Figure 3) and land use categories.
High principal component 1 (PC1) scores are primarily concentrated at sampling sites 15, 16, 17, 18, 22, 23, 31, 34, 46, 47, 49, 53, and 54. The location of these sites is primarily in the urban construction area of northern Yutai County (e.g., site 16) and in the vicinity of coal mining subsidence (e.g., sites 46, 49, and 53). Site 16, located in the city center, exhibits an exceptionally high PC1 score of 2.8, which indicates a significant contribution from industrial and domestic sewage. Sites 49 and 53, which lie at the interface between coal mining subsidence and urban concentrated construction, also display PC1 scores above 2.2, meaning that mining activities have severely disturbed the groundwater chemistry. Even though certain coal mining subsidence locations have relatively little nitrate (e.g., sites 10 and 11), they have a high PC1 score, which proves the presence of other contaminants in them, including SO42− and Cl, proving the overall environmental effects of coal mining.
High PC2 values are widely distributed across the periphery of coal mining subsidence zones and natural background areas and cover sampling sites 1–5, 10–14, 20–21, 24–25, 32–33, 35–36, and 50–52. The scores are especially high in sites 10, 11, 50, and 51. These regions are remote from urban centers and intensive agricultural and aquaculture lands. The chemical composition of groundwater is mostly governed by carbonate weathering and leaching, characterized by Ca2+ and HCO3, and the nitrate levels are usually low. This distribution pattern shows that natural weathering processes still have a pervasive effect in the study area, especially in areas where anthropogenic disturbance is less significant, where they predominate the basic hydrogeochemical nature of groundwater.
The distribution of high PC3 scores is concentrated in the intensive farming and aquaculture region of southern Weishan County and the lakeside plain transitional zone, which includes the sampling sites 6–9, 19, 26–30, 37–45, and 48. Sites 9, 19, 26, 28, and 30 are characterized by PC3 scores exceeding 2.0, corresponding directly to elevated nitrate concentrations. This affirms that the application of agricultural fertilizers and livestock wastewater emerges as the primary sources of nitrate in these regions. Relatively high scores are also observed in Sites 26, 27, and 37–45, and this creates a continuous belt-like distribution that indicates the spatial continuity of agricultural non-point source pollution. It is important to note that sites 9 and 19 fall within high PC3 areas, but with low PC2 scores (0.3–0.4). This implies that, even with great agricultural inputs in these regions, the natural background contribution of carbonate weathering is insignificant. This feature also shows that the agricultural activities’ contribution to nitrates is heavily clustered- pollution is predominantly concentrated in discrete zones of the landmass (farmland, aquaculture, etc.) without having a homogenizing effect on the total groundwater chemical background of the region. It is also indicative of the spatial autonomy of the controlling factors in the study area.

3.3.4. Analysis of Nitrate Sources in Groundwater

Based on the multi-dimensional results of the Gibbs diagrams, ionic ratios analysis, and PCA shown above, the main sources of pollution and the spatial differentiation trends of nitrate in pore water in the Nansi Lake Basin can be systematically identified.
In terms of ionic ratios, the pore water samples show specific spatial clustering, with two core ranges, including low Cl with high NO3/Cl, and high Cl with low NO3/Cl. The distribution patterns of low Cl and high NO3/Cl samples are consistent with the chemical signature of agricultural fertilizer input. Fertilizers contain high levels of NO3 but very little Cl and so the NO3/Cl ratios are high. This characteristic supports the high association between NO3, NO2, and K+ in the third principal component, further validating agricultural fertilizer as the main source of nitrates in these regions. The samples that have high Cl and low NO3/Cl have the domestic sewage and aquaculture wastewater pollution traits. Not only does such wastewater contain significant amounts of nitrogenous contaminants, but it also has high levels of Cl derived from detergents and disinfectants. Chloride is stable chemically and not easily resistant to migration or transformation, but NO3 in shallow reducing conditions is prone to depletion via denitrification, which, finally, results in low NO3/Cl ratios. This observation is consistent with the stable relationship of Cl, SO42−, and NO3 in the former principal component, which is a reflection of the joint input of domestic sewage and aquaculture wastewater into pollution. Industrial processes play a minor role in the nitrate content of pore water. Few samples have concomitant increases of NO3 and SO42−, and these do not create a widespread pattern of pollution, suggesting industrial operations such as coal mining are not the primary sources of nitrate. In terms of natural sources, Gibbs diagrams indicate that in the study area, the hydrogeochemical structure of the pore water is mainly regulated by rock weathering and leaching, with less effect of precipitation dilution. In addition, the volume of nitrate produced by the mineralization of soil organic nitrogen is very insignificant, and its contribution to the total nitrate levels is also insignificant.
To conclude, the nitrate in pore water of the Nansi Lake Basin has significant anthropogenic sources and pronounced spatial heterogeneity. Areas with low Cl and high NO3/Cl ratios are primarily driven by agricultural fertilizer use, and areas with high Cl and low NO3/Cl ratios are largely contributed to by domestic sewage and aquaculture wastewater pollution. There is a relatively small contribution from the industrial activities and natural sources.

3.3.5. Health Risk Evaluation of Nitrate Contamination

Nitrate contamination in groundwater around Nansi Lake has garnered increasing attention. Long-term consumption of such groundwater poses substantial health risks, potentially leading to conditions such as methemoglobinemia [42,43]. The spatial variation of nitrate contamination within the area directly determines the pattern of health risk distribution. To quantitatively appraise the possible health risks of nitrate contamination in groundwater of the study area, our work employed the health risk evaluation model suggested by the USEPA, evaluating non-carcinogenic hazards through the drinking water pathway. Table 3 presents the hazard quotients for representative sites. The selected sites encompass those with the highest nitrate concentrations (sites 30, 28, 16), sites with moderate concentrations in transitional zones (sites 19, 26, 46, 49, 9, 34), and a baseline site exhibiting the minimum nitrate concentration (site 10). This selection covers the full range of nitrate levels and spatial patterns (intensive farming, urban construction, lakeside plain transition, and coal mining subsidence areas), thereby providing a comprehensive picture of health risks across different land use types.
Adult HQ values range from 0.015 to 0.97, showing an average of 0.17. The HQ values of all the sampling points were less than 1, indicating no severe non-carcinogenic health risk due to nitrate contamination among adults. The values of child HQ range between 0.034 and 2.26, with an average of 0.41. Nine sampling sites (16.67% of all sites) had a child HQ value greater than 1. These high-risk sites were mainly in the intensive farming and aquaculture area of the southern region of Weishan County, the urban construction area of the northern region of Yutai County, and the transitional areas of the lakeside plain, which is also in line with the spatial distribution of high PC3 and PC1 score areas. Spatially (Figure 3), high child HQ values were clustered in areas with high concentrations of nitrate. The highest values were found in sites in the intensive farming and aquaculture region of southern Weishan County, including site 30 (HQ = 2.26), site 28 (HQ = 2.09), and site 26 (HQ = 1.46), which perfectly matched the areas of high PC3 scores. This substantiates that in these areas, the leading sources of nitrates are the agricultural fertilizers and livestock wastewater, which pose significant health risks to children. The urban construction zone in the northern Yutai County area site 16 (HQ = 1.99) has been found to be located within the high PC1 score, and this is indicative of the accumulation of nitrates due to intensive industrial and domestic sewage discharge from industries and households. Transitional zone sites—including site 19 (HQ = 1.64), site 46 (HQ = 1.43), site 49 (HQ = 1.38), site 9 (HQ = 1.36), and site 34 (HQ = 1.33)—also exhibited relatively high risk. Both agricultural activity and urban sewage discharge affect these sites, as demonstrated in the high PC3 and PC1 scores. The values of child HQ in high-risk areas were between 1.25 and 2.26, with sites 30 and 28 recording HQ > 2.0, indicating a non-carcinogenic hazard exceeding the threshold (HQ > 1). These results indicate that the contamination of nitrates in these regions presents a significant health risk to vulnerable groups, especially children. In terms of sources of pollution and transport features, the combination of agricultural non-point sources and domestic point sources is the main cause of nitrate contamination in these high-risk areas. Overuse of fertilizers and inefficient irrigation have resulted in significant levels of nitrogen infiltration and deposition [44], whereas leakage of domestic sewage and aquaculture wastewater has increased pollution levels. This trend corresponds to the hydrogeochemical features of high Cl and low NO3/Cl ratios found within the region. In the meantime, shallow groundwater within the study site is mostly in reducing conditions. Although denitrification consumes some nitrate, it also influences the spatial distribution of nitrogen pollution [45]. Combined with insufficient wastewater treatment plants and the absence of pollution control mechanisms in certain localities, these factors have ensured that the concentration of nitrates remains at very high levels within the core high-value areas.
Extreme nitrate levels pose fundamental and complex risks to human health, with vulnerable populations such as infants and pregnant women being the most affected. When consumed, nitrate can be reduced to nitrite within the human body, which reacts with hemoglobin to form methemoglobin, disabling the ability of the blood to transport oxygen. This can lead to methemoglobinemia (blue baby syndrome), which can cause respiratory distress and even death in extreme situations [46]. Moreover, chronic exposure to high-nitrate water sources can significantly increase the risk of digestive system and cardiovascular diseases, particularly raising the incidence of digestive system cancers, including gastric and esophageal cancer [42]. Consistent with the general risk patterns summarized by Ward et al. (2018) [42], our site-specific HQ calculations further demonstrate that children in intensive farming and urban construction zones (e.g., sites 28 and 30) face the highest non-carcinogenic hazards, with HQ values exceeding 2.0.
Considering the causes, spatial variation, and possible health risks of nitrate pollution mentioned above, targeted interventions tailored to specific pollution sources in Weishan, Yutai, and Pei counties are required to respond to the real case of nitrate pollution in the area. Strict management of nitrogen fertilizer application and control of aquaculture wastewater discharge practices in areas with concentrated agricultural and aquaculture activities are needed. Wastewater treatment facilities in urban construction areas should be improved to treat the waste discharged and remove direct discharging and leakage at the source. At the same time, ecological buffer zones and drainage ditches must be created according to the lakeside plain conditions to reduce nitrogen flux to shallow groundwater. The core lakeside regions of the three counties should be equipped with a dynamic groundwater monitoring network with zone-based management strategies. Such systematic prevention and control measures will effectively mitigate the level of nitrate pollution and, thereby, its impact on human health.

4. Conclusions

Based on a systematic characterization of the groundwater hydrochemistry of the Nansi Lake Basin, this research used hydrogeochemical analysis, Gibbs diagram, ionic ratio analysis, and PCA to identify the pollution sources and key factors controlling nitrate in groundwater. Results provided a framework for preventing and managing contamination of nitrates and implementing sustainable development of water resources in the Nansi Lake Basin. The primary findings are as follows:
The pH of pore water in the research area ranges between 6.62 and 10.66. The majority of samples lie between 6.91 and 8.07. Clearly, there is mainly weakly alkaline water, although localized acidic conditions occur. The dominant cations are Ca2+ and Na+, following the order Ca2+ > Na+ > Mg2+ > K+ > NH4+. The dominant anions are HCO3 and SO42−, following the order HCO3 > SO42− > Cl > NO3 > F > NO2. Nitrate-nitrogen (NO3-N) concentrations range from 0.82 to 54.31 mg·L−1, showing a coefficient of variation of 1.41—higher than that of most other ions—indicating a strong influence from external inputs. There is a positive correlation between NO2 and NO3.
Nitrate concentrations exhibit distinct spatial variations. The intensive farming and aquaculture zone of the southern Weishan County and the urban concentrated construction zone of the western Yutai County are the main areas of high concentration. The low-concentration regions are localized in the northwestern portion of Nansi Lake surrounding the coal mining subsidence zones. Areas of medium concentration are intermittently located in the outskirts of urban centers and in the aquaculture areas around them. This geographic distribution, with higher concentrations in urban, agricultural, and aquaculture regions and lower concentrations in coal mining subsidence regions, is indicative of a tendency of nitrate pollution to escape the centrally polluted regions in an outwards direction, with concentrations gradually decreasing.
Within the research area, the hydrogeochemical categories of pore water are Ca2+·Mg2+-HCO3 type, mixed Ca2+·Mg2+-Cl type, Na+·Cl-SO42− type, and mixed Ca2+·Na+-HCO3 type, occupying 63.33%, 16.67%, 13.33%, and 6.67% of the total samples, respectively. The Ca2+·Mg2+-HCO3 type works as the dominant hydrogeochemical type, reflecting the natural geological background of carbonate rock weathering and leaching in the region.
Three major factors are concurrently controlling the hydrogeochemical properties and the distribution of nitrates in groundwater and have a cumulative variance contribution rate of 69.81%. The primary factor is the input of pollutants caused by coal mining and industrial/domestic sources (39.82%). The secondary controlling factor is the natural geological process of weathering and dissolution of carbonate rock (19.44%). The most significant process influencing nitrogen components in groundwater is agricultural activities such as the application of fertilizers and livestock farming (10.55%). Spatial patterns of principal component scores indicate that regions with All chemical reagents were of analytical grade and purchased from Sinopharm coincide with urban construction and mining areas, high PC2 scores coincide with natural weathering background areas, and high PC3 scores coincide with areas where agricultural activities are intensive. This distribution is highly consistent with the spatial patterns of nitrate concentrations and land use types. This is the first study to quantitatively apportion nitrate sources in pore water of the Nansi Lake Basin using PCA, and to explicitly separate a coal mining/industrial factor (PC1, 39.82%) that was not distinguished in previous regional groundwater studies.
Sources of nitrates in pore water are predominantly anthropogenic and spatially heterogeneous. Groundwater in regions with high human activity, such as the intensive farming and aquaculture zone in southern Weishan County and the urban construction zone in northern Yutai County, has a high Cl and low NO3/Cl ratio. In these areas, a primary source of nitrate is the infiltration of aquaculture wastewater and domestic sewage. In certain places, nitrate concentrations are partially reduced due to denitrification in the reducing conditions of shallow groundwater. In intermediate zones along city edges and aquaculture regions, where Cl is low and NO3/Cl is high, nitrate primarily originates from agricultural fertilizer application, and its concentrations are moderate. Industrial sources, such as coal mining, and natural sources, such as atmospheric deposition and soil organic mineralization of nitrogen, contribute comparatively minor amounts and are not large-scale sources of pollution.
Health risk assessment shows that nitrate in groundwater is not a significant health risk to adults in the study area. Nevertheless, there are localized potential risks to children. There were 9 sampling sites (16.67% of the total sites) where the child hazard quotient (HQ) exceeded 1, and these sites were concentrated in the intensive farming and aquaculture area of the southern Weishan County, the urban construction area of the northern Yutai County, and the lakeside plain transitions. Child HQ scores in these high-risk areas were between 1.25 and 2.26, with sites 30 and 28 recording HQ > 2.0. By integrating nitrate spatial distribution (Figure 3) with site-specific HQ calculations, this study identifies precise high-risk locations (e.g., sites 28 and 30) where children face HQ > 2.0, a level of spatial detail not provided in previous regional health risk assessments. The primary drivers of nitrate contamination include agricultural non-point sources and domestic point sources. Nitrogen build-up as a result of the overuse of fertilizers and sewage leakage has caused health hazards to vulnerable groups, especially infants. Accordingly, zone-based management strategies are proposed: strict fertilizer control and regulated wastewater discharge in agricultural areas; upgraded wastewater treatment infrastructure in urban areas; and establishment of ecological buffer zones and dynamic monitoring networks in the lakeside plain to reduce pollution levels and mitigate health risks.

Author Contributions

Conceptualization, survey, methodology, first draft, H.Z. and W.Z.; methodology, review and editing, supervision, M.W.; methodology, survey, first draft, M.W.; methodology, data management, validation, C.S. and X.S. All authors have agreed to the final version. All authors have read and agreed to the published version of the manuscript.

Funding

This study was supported by a 2023 special scientific research project of Shandong Coalfield Geology Bureau, China, grant number LMDK[2023]10.

Institutional Review Board Statement

Not applicable.

Informed Consent Statement

Not applicable.

Data Availability Statement

Data will be available upon reasonable request from the corresponding author.

Conflicts of Interest

The authors declare no conflicts of interest.

References

  1. Yao, Y.; Guo, S.; Andrews, C.B.; Zhang, F.; Lancia, M.; Kuang, X.; Zheng, C. Seeing China’s invisible groundwater: Advances and challenges. Water Resour. Res. 2025, 61, e2024WR038980. [Google Scholar] [CrossRef]
  2. Kim, H.; Lim, C. Strategies to Assure the Sustainability of Groundwater Resources. Sustainability 2020, 12, 9183. [Google Scholar] [CrossRef]
  3. Thomas, R.; Christine, K.; Markus, Q. Legacy nitrate and trace metal (Mn, Ni, As, Cd, U) pollution in anaerobic groundwater: Quantifying potential health risk from “the other nitrate problem”. Appl. Geochem. 2022, 141, 105254. [Google Scholar] [CrossRef]
  4. Aarnoudse, E.; Bluemling, B.; Qu, W.; Herzfeld, T. Groundwater regulation in case of overdraft: National groundwater policy implementation in north-west China. Int. J. Water Resour. Dev. 2019, 35, 264–282. [Google Scholar] [CrossRef]
  5. Essien, E.E.; Said Abasse, K.; Côté, A.; Mohamed, K.S.; Baig, M.M.F.A.; Habib, M.; Naveed, M.; Yu, X.; Xie, W.; Jinfang, S.; et al. Drinking-water nitrate and cancer risk: A systematic review and meta-analysis. Arch. Environ. Occup. Health 2022, 77, 51–67. [Google Scholar] [CrossRef] [PubMed]
  6. Fewtrell, L. Drinking-water nitrate, methemoglobinemia, and global burden of disease: A discussion. Environ. Health Perspect. 2004, 112, 1371–1374. [Google Scholar] [CrossRef] [PubMed]
  7. Gao, Z.; Han, C.; Yuan, S.; Liu, J.; Peng, Y.; Li, C. Assessment of the hydrochemistry, water quality, and human health risk of groundwater in the northwest of Nansi Lake Catchment, north China. Environ. Geochem. Health 2022, 44, 961–977. [Google Scholar] [CrossRef]
  8. Yan, B.; Lv, X.; Wang, T.; Wang, M.; Zhang, R.; Song, C.; Shen, X.; Zhao, H. Assessment of groundwater environmental quality and analysis of the sources of hydrochemical components in the Nansi Lake, China. Water 2025, 17, 3398. [Google Scholar] [CrossRef]
  9. Wang, L.; Xia, J.; Yu, J.; Yang, L.; Zhan, C.; Qiao, Y.; Lu, H. Spatial variation, pollution assessment and source identification of major nutrients in surface sediments of Nansi Lake, China. Water 2017, 9, 444. [Google Scholar] [CrossRef]
  10. Iqbal, J.; Su, C.; Abbas, H.; Jiang, J.; Han, Z.; Baloch, M.Y.J.; Xie, X. Prediction of nitrate concentration and the impact of land use types on groundwater in the Nansi Lake Basin. J. Hazard. Mater. 2025, 487, 137185. [Google Scholar] [CrossRef] [PubMed]
  11. Hou, H.; Ding, Z.; Zhang, S.; Chen, Z.; Wang, X.; Sun, A.; An, S.; Xiong, J. Targeting the influences of under-lake coal mining based on the value of wetland ecosystem services: What and how? Land 2022, 11, 2166. [Google Scholar] [CrossRef]
  12. Zhang, W.; Zhou, Z.; Dong, H.; Ding, S.; Xiong, Y.; Wang, J.; Huang, Y.; Zhang, Y.; Wang, X. Comparative analysis of nitrate sources in surface and groundwater within a karst watershed utilizing nitrogen and oxygen isotopes. Groundw. Sustain. Dev. 2026, 32, 101580. [Google Scholar] [CrossRef]
  13. Lee, J.M.; Kwon, E.H.; Woo, N.C. Natural and Human-Induced Drivers of Groundwater Sustainability: A Case Study of the Mangyeong River Basin in Korea. Sustainability 2019, 11, 1486. [Google Scholar] [CrossRef]
  14. Ebrahimi, M.; Kazemi, H.; Ehtashemi, M.; Rockaway, T.D. Assessment of groundwater quantity and quality and saltwater intrusion in the Damghan basin, Iran. Geochemistry 2016, 76, 227–241. [Google Scholar] [CrossRef]
  15. Kou, X.; Zhao, Z.; Duan, L.; Sun, Y. Hydrogeochemical behavior of shallow groundwater around Hancheng mining area, Guanzhong Basin, China. Water 2024, 16, 660. [Google Scholar] [CrossRef]
  16. Zhang, X.; Zhao, R.; Wu, X.; Mu, W. Hydrogeochemistry, identification of hydrogeochemical evolution mechanisms, and assessment of groundwater quality in the southwestern Ordos Basin, China. Environ. Sci. Pollut. Res. 2022, 29, 901–921. [Google Scholar] [CrossRef] [PubMed]
  17. Soetaert, F.; Wanke, H.; Dupuy, A.; Lusuekikio, V.; Gaucher, E.C.; Bordmann, V.; Fleury, J.-M.; Franceschi, M. Toward the Sustainable Use of Groundwater Springs: A Case Study from Namibia. Sustainability 2022, 14, 3995. [Google Scholar] [CrossRef]
  18. Su, C.; Wang, M.; Xie, X.; Han, Z.; Jiang, J.; Wang, Z.; Xiao, D. Natural and anthropogenic factors regulating fluoride enrichment in groundwater of the Nansi Lake Basin, Northern China. Sci. Total Environ. 2023, 904, 166699. [Google Scholar] [CrossRef]
  19. DZ/T 0064–2021; Methods for Analysis of Groundwater Quality. Ministry of Natural Resources of the People’s Republic of China: Beijing, China, 2021.
  20. HJ 812–2016; Water Quality-Determination of Water Soluble Cations (Li+, Na+, NH4+, K+, Ca2+, Mg2+)-Ion Chromatography. Ministry of Ecology and Environment of the People’s Republic of China: Beijing, China, 2016.
  21. HJ 84–2016; Water Quality-Determination of Inorganic Anions (F, Cl, NO2, Br, NO3, PO43−, SO32−, SO42−)-Ion Chromatography. Ministry of Ecology and Environment of the People’s Republic of China: Beijing, China, 2016.
  22. HJ 666–2013; Water Quality-Determination of Ammonium Nitrogen by Flow Injection Analysis (FIA) and Salicylic Acid Spectrophotometry. Ministry of Ecology and Environment of the People’s Republic of China: Beijing, China, 2013.
  23. Gibbs, R.J. Mechanisms controlling world water chemistry. Science 1970, 170, 1088–1090. [Google Scholar] [CrossRef]
  24. Subrata, H.; Kumar, M.J. Hydrogeologic and geochemical investigations in a coastal basin of West Bengal. Arab. J. Geosci. 2023, 16, 11494. [Google Scholar] [CrossRef]
  25. Ke, S.; Chen, J.; Zheng, X.; Sun, X. Reference ion method: A simple and fast method for quantitatively identifying the source of nitrate and denitrification rate in groundwater. Sci. Total Environ. 2021, 769, 144555. [Google Scholar] [CrossRef] [PubMed]
  26. Degnan, J.R.; Bohlke, J.K.; Pelham, K.; Langlais, D.M.; Walsh, G.J. Identification of groundwater nitrate contamination from explosives used in road construction: Isotopic, chemical, and hydrologic evidence. Environ. Sci. Technol. 2016, 50, 593–603. [Google Scholar] [CrossRef] [PubMed]
  27. Laoufi, A.; Boudjema, A.; Guettaia, S.; Derdour, A.; Almaliki, A.H. Integrated Simulation of Groundwater Flow and Nitrate Transport in an Alluvial Aquifer Using MODFLOW and MT3D: Insights into Pollution Dynamics and Management Strategies. Sustainability 2024, 16, 10777. [Google Scholar] [CrossRef]
  28. USEPA. Risk Assessment Guidance for Superfund: Volume I—Human Health Evaluation Manual (Part A); Office of Emergency and Remedial Response: Washington, DC, USA, 1990. [Google Scholar]
  29. USEPA. 2011 Edition of the Drinking Water Standards and Health Advisories; Office of Water, US Environmental Protection Agency: Washington, DC, USA, 2011. [Google Scholar]
  30. Izbicki, J.A. Fate of nutrients in shallow groundwater receiving treated septage, Malibu, CA. Groundwater 2014, 52, 218–233. [Google Scholar] [CrossRef] [PubMed]
  31. GB/T 14848–2017; Standard for Groundwater Quality. Ministry of Natural Resources of the People’s Republic of China: Beijing, China, 2017.
  32. Smith, R.L.; Böhlke, J.K.; Garabedian, S.P.; Revesz, K.M.; Yoshinari, T. Assessing denitrification in groundwater using natural gradient tracer tests with 15N: In situ measurement of a sequential multistep reaction. Water Resour. Res. 2004, 40, W07101. [Google Scholar] [CrossRef]
  33. Yan, M.; Wang, L.; Wang, Q.; Liu, Z. Hydrochemical characteristics and origin analysis of groundwater in Nanling County, Anhui Province. Water 2024, 16, 1579. [Google Scholar] [CrossRef]
  34. Yang, Z.; Hu, L.; Ma, H.; Zhang, W. Hydrochemical characteristics of groundwater and their significance in arid inland hydrology. Water 2023, 15, 1641. [Google Scholar] [CrossRef]
  35. Islam, R.; Kushwah, V.K.; Gupta, N.; Kumar, A.; Goyal, R.; Berwal, P.; Alfaisal, F.M.; Majdi, A.; Al-Sareji, O.J.; Alsubih, M. Integrated evaluation of groundwater hydrochemistry using multivariate statistics and irrigation-based water quality indices. Sci. Rep. 2025, 15, 24923. [Google Scholar] [CrossRef]
  36. Mahvi, A.H.; Nouri, J.; Babaei, A.A.; Nabizadeh, R. Agricultural activities impact on groundwater nitrate pollution. Int. J. Environ. Sci. Technol. 2005, 2, 41–47. [Google Scholar] [CrossRef]
  37. Chaudhary, I.J.; Chauhan, R.; Kale, S.S.; Gosavi, S.; Rathore, D.; Dwivedi, V.; Singh, S.; Yadav, V.K. Groundwater nitrate contamination and its effect on human health: A review. Water Conserv. Sci. Eng. 2025, 10, 33. [Google Scholar] [CrossRef]
  38. Gao, H.; Wang, G.; Fan, Y.; Wu, J.; Yao, M.; Zhu, X.; Guo, X.; Long, B.; Zhao, J. Tracing groundwater nitrate sources in an intensive agricultural region integrated of a self-organizing map and end-member mixing model tool. Sci. Rep. 2024, 14, 16873. [Google Scholar] [CrossRef] [PubMed]
  39. Puig, R.; Soler, A.; Widory, D.; Mas-Pla, J.; Domènech, C.; Otero, N. Characterizing sources and natural attenuation of nitrate contamination in the Baix Ter aquifer system (NE Spain) using a multi-isotope approach. Sci. Total Environ. 2017, 580, 518–532. [Google Scholar] [CrossRef] [PubMed]
  40. Liu, J.; Peng, Y.; Li, C.; Gao, Z.; Chen, S. Characterization of the hydrochemistry of water resources of the Weibei Plain, Northern China, as well as an assessment of the risk of high groundwater nitrate levels to human health. Environ. Pollut. 2020, 267, 115947. [Google Scholar] [CrossRef]
  41. Xiao, J.; Zhang, F.; Jin, Z. Spatial characteristics and controlling factors of chemical weathering of loess in the dry season in the middle Loess Plateau, China. Hydrol. Process. 2016, 30, 4855–4869. [Google Scholar] [CrossRef]
  42. Ward, M.H.; Jones, R.R.; Brender, J.D.; De Kok, T.M.; Weyer, P.J.; Nolan, B.T.; Van Breda, S.G. Drinking water nitrate and human health: An updated review. Int. J. Environ. Res. Public Health 2018, 15, 1557. [Google Scholar] [CrossRef] [PubMed]
  43. Bancheri, M.; Basile, A.; Botta, M.; Langella, G.; Cavaliere, F.; Bonfante, A.; Ferraro, G.; Acutis, M.; Perego, A. The Nitrate Fate Tool: A Decision Support System for the Assessment of the Groundwater Vulnerability to Nitrate in Support of Sustainable Development Goals. Sustainability 2023, 15, 14164. [Google Scholar] [CrossRef]
  44. Craswell, E. Fertilizers and nitrate pollution of surface and ground water: An increasingly pervasive global problem. SN Appl. Sci. 2021, 3, 518. [Google Scholar] [CrossRef]
  45. Pan, Y.; She, D.; Ding, J.; Abulaiti, A.; Zhao, J.; Wang, Y.; Xia, Y. Coping with groundwater pollution in high-nitrate leaching areas: The efficacy of denitrification. Environ. Res. 2024, 250, 118484. [Google Scholar] [CrossRef] [PubMed]
  46. Bryan, N.S.; Loscalzo, J. (Eds.) Nitrite and Nitrate in Human Health and Disease; CRC Press: Boca Raton, FL, USA, 2017. [Google Scholar] [CrossRef]
Figure 1. Groundwater sampling site distribution within the research area.
Sustainability 18 03981 g001
Figure 2. Box plots of major hydrogeochemical constituents in the study area’s groundwater.
Sustainability 18 03981 g002
Figure 3. Spatial distribution of nitrate concentrations at sampling sites within the research area.
Sustainability 18 03981 g003
Figure 4. Piper diagram for groundwater in the study area.
Sustainability 18 03981 g004
Figure 5. Gibbs diagrams for groundwater within the research region.
Sustainability 18 03981 g005
Figure 6. Relationships between major ions in the groundwater.
Sustainability 18 03981 g006
Figure 7. Ionic ratios in the groundwater.
Sustainability 18 03981 g007
Figure 8. Principal component analysis (PCA) loading plots for major ions in the groundwater: (a) PC1 vs. PC2; (b) PC1 vs. PC3.
Sustainability 18 03981 g008
Table 1. Principal component analysis loading matrix for major ions in the groundwater.
Principal Component 1 (PC1)Principal Component 2 (PC2)Principal Component 3 (PC3)
pH value0.359−0.733−0.003
Total hardness0.6510.7230.106
TDS0.9040.3480.202
K+0.0410.0300.718
Na+0.906−0.1800.080
Ca2+0.3170.8050.182
Mg2+0.7890.4420.003
NH4+0.079−0.7490.317
Cl0.5930.3620.036
SO42−0.911−0.0740.024
HCO30.3000.7700.150
F0.713−0.046−0.142
NO30.0190.3800.634
NO2−0.017−0.1630.631
Variance contribution rate/%39.8219.4410.55
Cumulative variance contribution rate/%39.8259.2669.81
Table 2. Principal component scores of groundwater sampling sites within the research area.
Sampling Site IDPC1PC2PC3Sampling Site IDPC1PC2PC3
1−1.22.0−0.328−1.3−0.42.2
2−1.11.9−0.229−1.1−0.21.9
3−1.32.1−0.430−1.4−0.52.1
4−1.01.8−0.1312.1−1.1−0.2
5−0.91.70.032−1.01.9−0.1
6−0.80.21.633−1.12.0−0.2
7−0.90.11.7342.8−1.4−0.4
8−0.70.31.535−0.71.60.1
9−1.40.42.236−0.61.50.2
10−1.52.3−0.537−0.90.21.6
11−1.42.2−0.438−0.80.31.5
12−1.22.0−0.239−0.70.41.4
13−1.11.9−0.140−0.60.51.3
14−1.01.80.041−0.70.41.4
152.2−1.2−0.342−0.80.31.5
162.9−1.5−0.543−0.90.21.6
172.1−1.1−0.244−1.00.11.7
182.3−1.3−0.445−1.10.01.8
19−1.30.32.1462.7−1.3−0.3
20−0.81.60.1471.8−0.80.1
21−0.71.50.248−0.80.31.5
222.0−1.0−0.1492.8−1.4−0.4
231.9−0.90.050−1.32.2−0.3
24−0.91.8−0.151−1.22.1−0.2
25−0.81.70.052−1.12.0−0.1
26−1.2−0.32.0532.2−1.2−0.3
27−1.0−0.11.8542.0−1.0−0.1
Table 3. Health risk evaluation results of groundwater nitrate within the research region (representative sites).
Sampling Site IDNitrate-Nitrogen Concentration (mg·L−1)Hazard Quotient (HQ) for AdultsHazard Quotient (HQ) for Children
3054.310.972.26
2850.230.902.09
1647.860.851.99
1939.470.701.64
2635.120.631.46
4634.280.611.43
4933.090.591.38
932.590.581.36
3431.950.571.33
2921.730.390.91
100.820.0150.034
Other sites0.82~21.730.015~0.390.034~0.91
Disclaimer/Publisher’s Note: The statements, opinions and data contained in all publications are solely those of the individual author(s) and contributor(s) and not of MDPI and/or the editor(s). MDPI and/or the editor(s) disclaim responsibility for any injury to people or property resulting from any ideas, methods, instructions or products referred to in the content.