Article

Digital Economy, Agricultural Technological Innovation, and Agricultural Economic Resilience: A Sustainable Agricultural Development Perspective


College of Economics and Management, Northeast Agricultural University, No. 600, Changjiang Road, Xiangfang District, Harbin 150030, China
*
Author to whom correspondence should be addressed.
Sustainability 2026, 18(8), 3973; https://doi.org/10.3390/su18083973
Submission received: 17 March 2026 / Revised: 12 April 2026 / Accepted: 15 April 2026 / Published: 16 April 2026

Abstract

Digital economy and agricultural technological innovation are key drivers of agricultural economic resilience and sustainable development. However, existing research has yet to clarify how they jointly affect agricultural economic resilience, particularly through potential nonlinear patterns and spatial spillover effects. Using panel data from 30 Chinese provinces, this study measures digital economy development and agricultural economic resilience via the entropy weight method. It systematically examines the direct impact, transmission mechanisms, threshold effects, and spatial spillover effects using two-way fixed effects, mediation, threshold regression, and spatial Durbin models. The findings are as follows. First, the digital economy significantly improves agricultural economic resilience, a result robust to various tests and endogeneity treatments. Second, agricultural technological innovation plays a partial mediating role, accounting for 19.37% of the total effect. Third, the resilience-enhancing effect of agricultural technological innovation exhibits a double-threshold pattern: its positive impact gradually strengthens as the digital economy develops to a higher level. Fourth, the digital economy generates a positive spatial spillover effect on agricultural economic resilience. Fifth, although the digital economy and agricultural technological innovation show synergistic development, their coupling coordination degree remains relatively low, indicating substantial untapped potential for synergy. From a sustainable development perspective, this study reveals the mechanisms through which the digital economy and agricultural technological innovation enhance agricultural economic resilience, providing empirical evidence and policy insights for strengthening agricultural risk resistance and achieving agricultural sustainability via digital transformation and technological progress.

1. Introduction

Sustainable agricultural development is a core safeguard for national food security, rural revitalization, and socio-economic stability. In 2024, China’s grain output reached 707 million metric tons, marking 21 consecutive years of bumper harvests. Over the past decade, China’s total grain output increased from 661 million tons to 707 million tons, while the sown area remained relatively stable at around 116–120 million hectares. Consequently, the average grain yield per unit area rose from 5.55 t/ha to 5.92 t/ha. For major staple crops, rice yield reached 7.15 t/ha in 2024, wheat 5.92 t/ha, and maize 6.58 t/ha, all showing steady annual improvements. For a long time, China’s domestic production of rice and wheat has consistently met over 95% of its domestic consumption needs. Nevertheless, the agricultural sector inevitably faces natural risks and market risks, which have brought tremendous uncertainty to the agricultural economy and the production and operation of farmers, further exacerbating the inherent vulnerability of agriculture and emerging as a critical bottleneck restricting agricultural sustainable development. The most effective strategy to address these risks and challenges is to enhance agricultural economic resilience (AER) [1]. Boosting AER, giving full play to agriculture‘s role as an economic stabilizer and ballast, and strengthening the agricultural system’s capacity to resist, recover from, and restructure in the face of external shocks not only act as pivotal driving forces for realizing sustainable agricultural development [2], but also represent crucial approaches to implementing the requirements of agricultural development. Accordingly, how to enhance AER has become a research issue worthy of in-depth attention.
With the rapid development of technology, digital transformation is advancing at an accelerated pace across all sectors, making the digital economy (DE) an indispensable engine driving the development of various industries. However, monitoring data from China’s Ministry of Agriculture and Rural Affairs show that the DE penetration rate in China’s agricultural sector currently stands at only about 10%, which is considerably lower than in industry and services. This gap constrains the digital transformation of agriculture. Relative to urban regions, rural regions still have notably underdeveloped digital infrastructure. The significant urban–rural gap in DE development has, to a certain degree, restricted the spillover effects of the DE on the agricultural sector [3]. However, with the ongoing evolution and widespread adoption of digital technologies, DE is gradually integrating with the traditional economy and penetrating into all fields of agriculture [4]. By extensively acquiring and utilizing data, the DE has improved agricultural production efficiency, driven the gradual transformation of the agricultural economy toward digitalization, intellectualization, intensification, and green development, introduced vitality into agricultural production, and continuously empowered the development of agriculture [5]. The sustained development of the DE has not only brought new opportunities to the agricultural economy, but also exerted profound implications for agricultural innovation. The 2025 Central Government No. 1 Document stresses the need to boost scientific and technological backing for agriculture, further highlighting the pivotal role of agricultural technology in agricultural production. DE helps lower the costs of agricultural technological innovation (ATI) [6], boost the vitality of ATI [7], improve innovation resource allocation efficiency [8], and optimize the innovation ecosystem [9]. In this way, it promotes the upgrading of agricultural technological capacity, thereby exerting a profound influence on the growth of the agricultural economy.
The research on AER has evolved from the concept of “resilience” to “economic resilience” and finally to “agricultural economic resilience.” In terms of evolutionary resilience, resilience goes beyond a static capacity for resistance and recovery; it also embodies the ability to continuously adjust to changing external conditions, thereby maintaining the sustainable development of a region [10]. Resilience as a concept first originated in the disciplines of engineering and ecology, and was later adopted by agricultural research. Previous studies have mainly concentrated on examining the resilience of the entire agricultural system [11,12,13,14] and other related dimensions of agricultural systems, such as agricultural climate resilience, agricultural water resource resilience, and crop production resilience [15,16,17]. However, within the agricultural field, research specifically on AER remains relatively scarce. Prior research has indicated that AER is affected by multiple factors, such as digital inclusive finance [18], industrial agglomeration [19], digital technology [20], rural workforce [21], rural industrial integration [22], and smart supply chains [23]. Meanwhile, the majority of previous research has concentrated on how DE affects other dimensions of agricultural systems, such as rural household resilience, food production resilience, and agricultural industrial chain resilience, while research concerning DE’s effect on AER is still relatively insufficient [24,25,26]. Therefore, this study systematically analyzes the influence of DE on AER, as well as its functional mechanisms, explores effective pathways to enhance AER, and provides theoretical foundations and policy references for sustainable agricultural development.
The literature shows that previous studies have provided important theoretical foundations and empirical references for examining the relationship between DE and AER. Nevertheless, several notable gaps remain. First, existing research on resilience in the agricultural sector has largely focused on the overall agricultural system and its external supporting conditions, with relatively limited attention paid specifically to the economic dimension of resilience. Second, even though a growing number of scholars have begun analyzing the drivers of AER from traditional viewpoints, only a few have incorporated DE as a core explanatory factor. Among the limited studies that address both DE and AER, most rely on qualitative descriptions or single-dimensional empirical analyses, and thus do not reveal how DE affects AER mechanistically. Third, given the inherently spatially mobile and diffusive nature of DE, existing research has not sufficiently investigated its spatial spillover effects on AER. Finally, ATI is a practical carrier of digital technologies in agriculture and also serves as a critical bridge linking DE and AER. However, the current literature has not fully explored this transmission channel, resulting in a lack of comprehensive analysis of the interrelationships among DE, ATI, and AER.
Based on the above, this study makes several contributions. First, it enriches the economic dimension research on AER, clarifies its core connotations and dimensional structure, and refines the analytical framework of AER. Unlike previous studies that mainly focused on the overall agricultural system and its non-economic dimensions, this study centers on the resistance, recovery, and restructuring capacities of the agricultural economic system, thus providing a more targeted research perspective for AER. Second, it addresses the insufficient exploration of the link between DE and AER by integrating ATI into a unified framework. This study systematically identifies the direct effect, spatial spillover effect, and regional heterogeneity of DE on AER, as well as the mediating role of ATI, the threshold effect of DE, and the coupling coordination between DE and ATI, which deepens the understanding of their underlying mechanisms. Third, from the perspective of sustainable development, it reveals the interactive mechanisms among DE, ATI, and AER, clarifies how DE and ATI jointly empower agricultural economic resilience, and puts forward targeted policy implications based on empirical evidence.

2. Theoretical Background and Hypothesis Development

2.1. Definition of Agricultural Economic Resilience

Resilience as a concept primarily describes the capacity of a system to resist and recover when facing external shocks and disturbances. Martin et al. defined regional economic resilience as a region’s ability to resist market shocks, competition, and environmental impacts that affect its economy, and to restore its prior economic status or achieve an improved structural state [27]. Building on the concept of economic resilience, subsequent researchers have further conceptualized AER as the capability of the agricultural economic system to resist and recover when confronted with external impacts and disturbances [28]. However, a gap remains in the literature: while the aforementioned definitions of regional economic resilience and AER recognize resistance and recovery as core components, they overlook the system’s ability to achieve breakthroughs and upgrades after being impacted. With the aim of bridging this research gap, this study starts from the core connotation of regional economic resilience and conceptualizes AER as the capacity of the agricultural economic system to resist, recover, and restructure when facing external shocks and the associated uncertainties in agricultural economic development. Specifically, resistance embodies the inherent capacity of the agricultural economic system to effectively withstand external shocks and uncertainties, serving as the foundation for improving AER. Recovery refers to the capacity of the system to restore its prior state following shock-induced damage, and represents a key indicator of improved AER. Restructuring, by contrast, refers to the system’s capability to readjust and restructure to achieve a better state after being impacted, acting as a key driver for improving AER.

2.2. Direct Effect of the Digital Economy on Agricultural Economic Resilience

The rapid growth of the DE has endowed the agricultural economy with fresh vitality. The convergence between digital technologies and traditional agriculture has gradually deepened. DE drives agriculture’s transformation toward digitalization, enabling agricultural output to achieve timely information acquisition, improved agricultural governance, and optimized resource allocation, thereby enhancing AER and providing stable support for sustainable agricultural development. Subsequently, this study carries out an analysis from the three dimensions of AER.
From the perspective of the resistance capacity of AER, incomplete information has long been a persistent problem in agricultural production [29]. Due to limited information acquisition channels and insufficient information processing capabilities, farmers often struggle to obtain accurate and timely key information such as market dynamics, climate conditions, and plant diseases and insect pests, which increases the risks and uncertainties of agricultural production. Compared with the traditional economy, the DE has broken geographical and spatial constraints [30], enabling rapid and efficient dissemination and sharing of information through the Internet. Digital platforms can connect all links of the agricultural product supply chain [31], realize rapid matching of supply and demand information, and lower transaction costs [32]. In addition, with the help of technological means, farmers can access more information sources, grasp real-time market conditions, and make timely adjustments to agricultural production activities based on the obtained information, thereby effectively reducing the risks caused by incomplete information.
From the perspective of the recovery capacity of AER, the DE can promote the intelligence and automation of fields such as soil and water loss control and land desertification control [33]. Digital technologies improve the level and efficiency of governance equipment through intelligent control, guide farmers in irrigation, fertilization and other operations, and reduce the application of agrochemicals, thereby protecting soil and the ecological environment, promoting the greening and environmental protection of agricultural production, and advancing sustainable agricultural development. In addition, digital technologies can also perform real-time monitoring of environmental factors such as soil and climate, providing reliable support for agricultural production and thus enhancing its stability. Through industrial integration effects, resource matching effects, and technological multiplier effects, the DE has significantly promoted the optimal allocation of products and factor resources [34], which helps improve agricultural economic recovery efficiency and maintain production stability.
From the perspective of the restructuring capacity of AER, after the agricultural sector suffers external shocks, the DE can effectively and quickly allocate resources such as labor through information dissemination via information platforms [35], thereby rapidly promoting the adjustment of the agricultural economy. Farmers can use digital platforms to obtain real-time information on agricultural policies formulated by the government, respond quickly to policy orientations, and effectively alleviate potential lag problems in policy dissemination. This helps ensure the timeliness and effectiveness of agricultural policies, enhances the efficiency of government agricultural regulation, and assists the agricultural economy in better adjustment and reconstruction after shocks.
In summary, DE empowers AER through three dimensions. Therefore, this study proposes the following Hypothesis 1:
H1: 
DE is conducive to enhancing AER.

2.3. Mediating Effect of the Digital Economy on Agricultural Economic Resilience

With its strong knowledge diffusion effect, DE has greatly stimulated innovation vitality, leading to a significant rise in various patents [36]. This innovation vitality inevitably affects ATI. DE drives both the development of ATI achievements and the efficient transformation and adoption of such results [37]. With the help of digital platforms, ATI achievements can be disseminated and promoted more quickly to realize technology sharing. This efficient dissemination mechanism enables innovation achievements to be rapidly transformed into actual productivity, driving progress in agricultural production. In addition, the technological innovation effect of the DE provides a technical path for the integration of domestic and foreign trade [38], and the diversification of agricultural product transaction forms also broadens farmers’ income-increasing channels. DE has also expanded financing channels, provided financial support for ATI, improved innovation efficiency, and shortened the research and development (R&D) cycle [39]. Social media and online e-commerce enable agricultural products to face consumers more directly, and consumer demands and feedback can also be quickly transmitted to producers. This efficient circulation of transaction information helps make ATI achievements more in line with market demands, improving their practicality and market competitiveness. ATI can increase farmers’ income by improving production efficiency and quality. Moreover, the implementation of new technological tools can raise the standard of mechanized planting and reduce production expenditures [40], thereby making agriculture more stable in the face of external shocks.
In summary, DE facilitates ATI across multiple stages, which in turn enhances the agricultural system’s resistance, recovery, and restructuring capacities. Building on the direct positive effect of DE on AER, we argue that ATI serves as a key channel through which DE affects AER. Therefore, we propose Hypothesis 2:
H2: 
The DE enhances AER through ATI.

2.4. Threshold Effect of Agricultural Technological Innovation on Agricultural Economic Resilience

The enhancing effect of ATI on AER largely depends on whether innovation outcomes can be rapidly, widely, and cost-effectively disseminated, adopted, and applied [41]. This is precisely where the core advantage of DE lies. Digital technologies can significantly reduce information asymmetry, shorten the distance from R&D to application [39], and accelerate the diffusion and commercialization of agricultural technological achievements. However, the full realization of this function requires a certain level of digital support systems and digital technology applications. In the early stages of DE, rural regions often suffer from insufficient network coverage, a lack of digital devices, and low levels of digital literacy among farmers. Under such circumstances, even if breakthroughs in ATI are achieved, these outcomes can hardly be effectively promoted or disseminated through digital platforms, leading to low technology adoption rates and narrow application scopes, thereby limiting the impact of ATI on AER. As the DE develops to higher levels, digital infrastructure keeps improving, and digital technologies are integrating more deeply into agriculture. Farmers can conveniently access agricultural technology information via smartphones and internet platforms [42], participate in online training, and receive remote guidance; agricultural technology extension agencies can also leverage big data to accurately identify farmers‘ needs and deliver personalized recommendations. At this stage, the dissemination speed of ATI outcomes accelerates, their coverage expands, adoption costs decline, and their positive effect on AER gradually strengthens.
In summary, DE plays a nonlinear threshold role in the process through which ATI enhances AER. Based on this, this study proposes Hypothesis 3:
H3: 
DE exerts a threshold effect in the process of ATI enhancing AER, such that when DE improves, ATI exerts a larger effect on enhancing AER.

2.5. Spatial Spillover Effect of the Digital Economy on Agricultural Economic Resilience

Leveraging the replicable and easily transmittable nature of data, DE breaks down the geographical constraints of traditional agriculture [6]. It not only enhances AER at the local level but also yields positive spillover effects on adjacent areas through cross-regional information transfers, technological diffusion, and industrial collaboration. Specifically, this spatial spillover is realized through four main channels. First, the radiating effect of infrastructure [43]: Digital facilities built in core regions naturally extend their network coverage to surrounding areas, reducing the cost of digital transformation for neighboring agriculture and laying a resilience foundation for them. Second, the diffusion of technology and knowledge: Advanced agricultural technologies and smart agriculture models from developed regions can be efficiently disseminated to other areas via online platforms, remote training, and other means, thereby improving their technological level and risk response capabilities. Third, the efficient flow of production factors [44]: DE platforms enable precise matching of information on agricultural products, capital, talent, and more across a wider scope, promoting regional complementarity and strengthening the collective ability of agriculture in different regions to resist market fluctuations. Fourth, the regional coordination of agricultural industrial chains [45]: Digital platforms connect production, processing, distribution, and sales across different regions, forming cross-regional industrial chains that allow risk-sharing and resource-sharing in the face of shocks, thus enabling the whole region to become more resilient.
In summary, this study proposes the following Hypothesis 4:
H4: 
DE has a positive spatial spillover effect on AER.

3. Materials and Methods

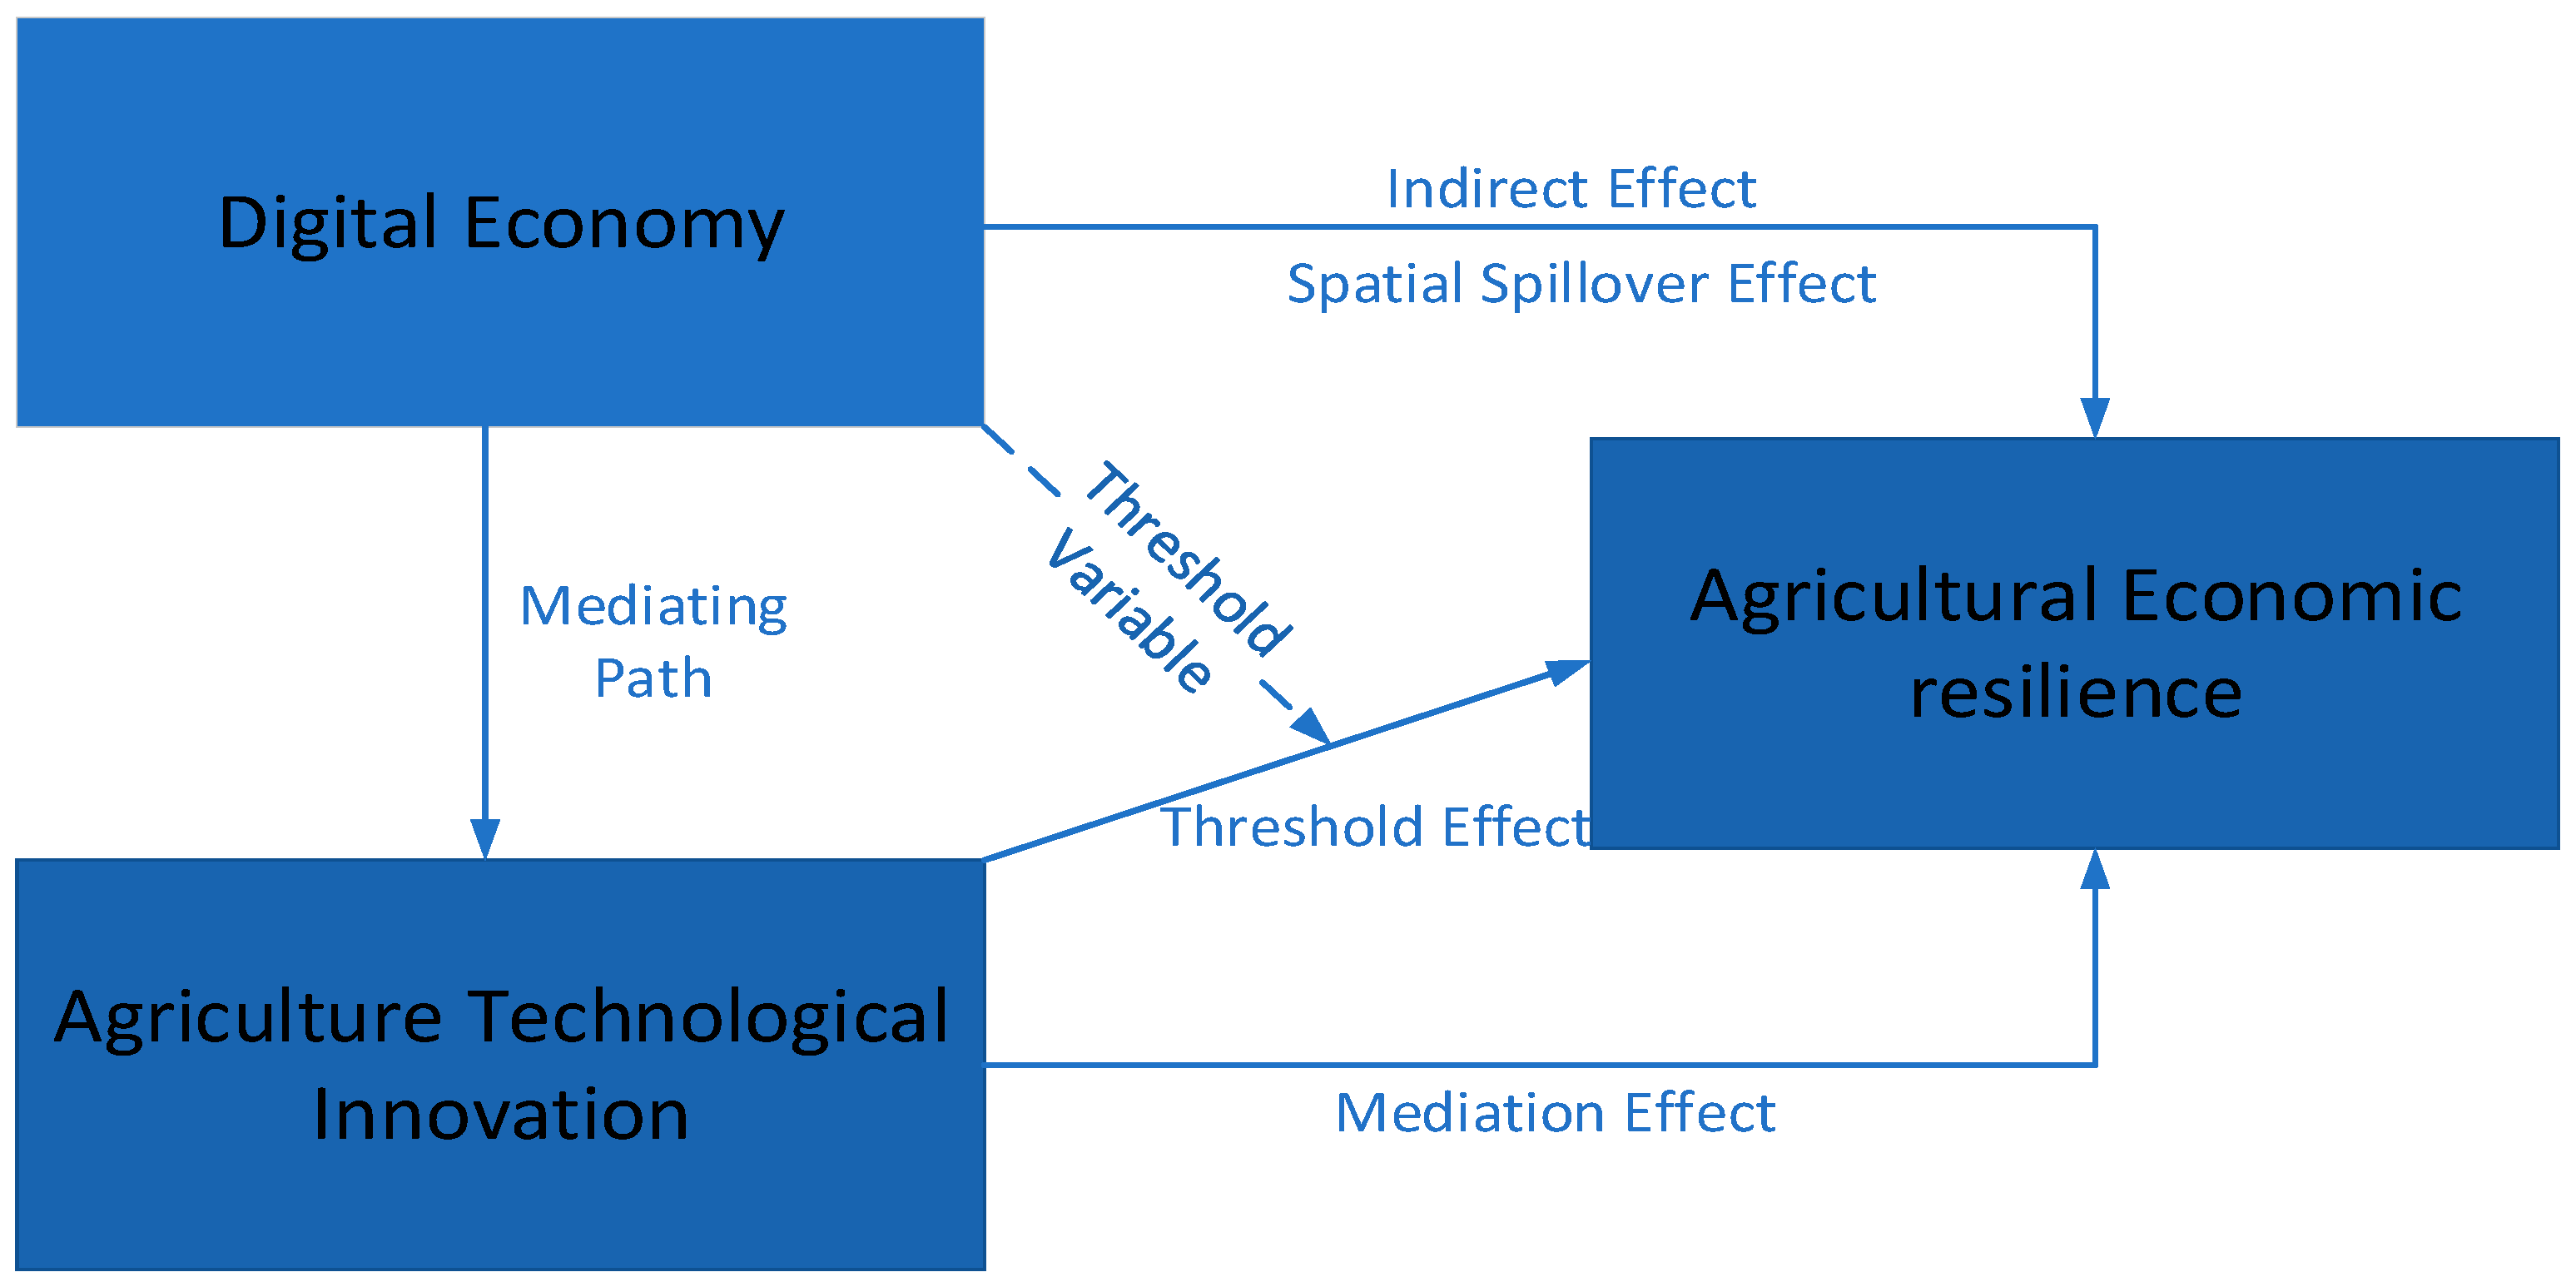
To test the above hypotheses, this section systematically investigates the interactive relationships among DE, ATI, and AER by applying two-way fixed effects models, mediation effect models, threshold effect models, and spatial econometric models. The theoretical mechanism is illustrated in Figure 1.

3.1. Model Design

To test the DE’s impact on AER and the mediating role of ATI, this study constructs a two-way fixed effects model and a mediation effect model through stepwise regression for empirical research [46].
First, this study examines the direct impact of the DE on AER and constructs Model (1), which is shown as follows:
A E R i t = α 0 + α 1 D E i t + X i t + μ i + σ t + ε i t
where AERit represents the level of agricultural economic resilience; DEit denotes digital economy; α 1 is the estimated coefficient of DE; X i t are control variables; α 0 is the intercept term; α 0 represents the individual fixed effect; σ t denotes the time fixed effect; and ε i t is the random error term of the model.
Second, to examine the impact of the DE on ATI, Model (2) is constructed as follows:
A T I i t = β 0 + β 1 D E i t + X i t + μ i + σ t + ε i t
where ATIit represents the level of agricultural technological innovation; β 1 is the estimated coefficient of ATI; and β 0 is the intercept term. Finally, to explore the mediating effect of ATI and simultaneously examine the impacts of the DE and ATI on AER, this study constructs Model (3), which is shown as follows:
A E R i t = γ 0 + γ 1 D E i t + γ 2 A T I i t + X i t + μ i + σ t + ε i t
where γ 1 is the estimated coefficient of the DE; γ 2 denotes the estimated coefficient of ATI; and γ 0 is the intercept term.
A non-linear correlation may exist between ATI and AER, and the DE is likely to exert a threshold effect in this relationship. To further verify this, the following threshold model is constructed (taking the single threshold model as an example) [47]:
A E R i t = α 0 + α 1 A T I i t ( D E γ ) + α 2 A T I i t ( D E > γ ) + X i t + ε i t
where DE is the threshold variable; γ is the threshold value; α 1 and α 2 are the estimated coefficients of ATI when D E γ and D E > γ , respectively.
Based on the preceding analysis, DE may have spatial spillover effects on AER. To further verify this, the following spatial econometric model is constructed (taking the spatial Durbin model as an example):
A E R i t = β 0 + β 1 D E i t + β 2 X i t + ρ W × A E R i t + θ W × D E i t + δ W × X i t + μ i + σ t + ε i t
where ρ is the spatial autoregressive coefficient; W is the spatial weight matrix; θ is the coefficient of the spatial interaction term of DE; and δ is the coefficient of the spatial interaction term of the control variables.

3.2. Variable Settings

3.2.1. Dependent Variable

AER. Existing studies have mainly adopted two approaches to measure resilience. The first approach is the sensitivity index, a single indicator [48]. Although this approach can reflect the performance of the economic system following external shocks, it cannot fully capture the connotation of resilience and thus has certain limitations. Moreover, as a relative change measure, the sensitivity index tends to produce biased evaluation results. Therefore, this study adopts the second approach: the comprehensive index method. Following previous studies [19,49] and based on the definition of AER proposed in this study, we measure AER from the following dimensions. The indicator system for evaluating AER is presented in Table 1.
(1) Resistance capacity: This dimension is closely tied to the basic stability of agricultural production and food supply security, corresponding to the economic and livelihood foundation of sustainable development. This study selects indicators such as the proportion of employees in the primary industry and grain output per unit sown area as positive indicators, reflecting the basic conditions and output efficiency of agricultural production. The degree of disaster impact is selected as a negative indicator, reflecting the direct damage of natural disasters to agricultural production. These indicators collectively measure the “stress-resistance” capacity of the response of the agricultural system to shocks, and their improvement helps ensure uninterrupted food production during crises and maintain the basic functioning of the agricultural economy.
(2) Recovery capacity: The recovery process depends not only on production conditions but also on environmental pressures and farmer welfare. This dimension corresponds to the environmental dimension of sustainable development as well as the social welfare dimension. This study selects indicators such as pesticide use per unit sown area as negative indicators, because higher values indicate greater environmental burdens, which slow down the recovery speed. Meanwhile, per capita disposable income of rural residents and per capita consumption expenditure of rural residents are selected as positive indicators, reflecting the economic welfare and consumption capacity of farm households. The higher the welfare level, the more resources farmers can mobilize for post-disaster recovery, and the stronger the recovery capacity. Thus, recovery capacity essentially embodies the ability of the agricultural system to achieve environmentally friendly restoration and livelihood rehabilitation after shocks.
(3) Restructuring capacity: This depends on human capital, policy support, and investment capacity. This dimension corresponds to the long-term inclusive growth dimension of sustainable development. This study selects rural education level to reflect human capital, fiscal support for agriculture and fixed asset investment in agriculture to reflect government support and infrastructure investment, and agricultural insurance support to reflect risk-sharing mechanisms. The higher these indicators, the stronger the agricultural system’s ability to adjust its structure, upgrade technologies, and enhance resilience after disasters. Restructuring capacity reflects the potential of the agricultural economic system to shift from passively responding to shocks to actively adapting and achieving high-quality development.
In summary, each indicator in the AER evaluation system constructed in this study is selected based on the connotations of the above three capacities and their corresponding sustainable development dimensions. This ensures that the measurement of resilience is theoretically grounded in the concept of system recoverability and aligns with the multiple requirements of sustainable agricultural development (food security, environmental sustainability, farmer welfare, and innovation-driven transformation).

3.2.2. Independent Variable

DE. This study uses the entropy method to synthesize indicators into a DE indicator, which includes three dimensions: First, drawing on Zhao Tao’s indicator system [50], an Internet development indicator is constructed; second, drawing on Guo Feng’s method [51], a digital inclusive finance indicator is formed; third, drawing on Liu Jun’s indicator system [52], a digital transaction development indicator is constructed, including per capita e-commerce sales and per capita e-commerce purchases. The indicator system for the DE is presented in Table 2.

3.2.3. Mediating Variable

ATI. This study draws on the measurement method of ATI level proposed by Tian et al. and Tan et al. [53,54]. Specifically, the annual total of agricultural patents (in 10,000 pieces) in each province is adopted to measure ATI.

3.2.4. Control Variables

To ensure the rationality of this study, the control variables are selected as follows: environmental regulation (Env), urban-rural income gap (Inc), marketization level (Mar), rural electricity consumption (Ele), and transportation level (Tra).
Specifically, Env can reduce agricultural pollution and thereby lower ecological risks, which may improve the resistance capacity of AER. This indicator is defined as the ratio of industrial pollution control investment to gross industrial output value.
Inc has the potential to affect the migration of funds and talent between cities and the countryside, thus influencing AER. It is measured as the ratio of urban to rural per capita disposable income.
Mar may affect the supply of agricultural materials and the restart of production after disasters, thus influencing the recovery and restructuring capacities of AER. It is measured by the marketization index [55].
A higher Ele corresponds to a higher degree of modern agricultural development and stronger AER. It is represented by per capita rural electricity consumption.
Tra affects the circulation and industrial chain stability of agricultural products, which may influence AER. It is measured by highway mileage.

3.3. Data Sources

Based on data availability, this study selected panel data from 30 provinces in China (excluding Hong Kong, Macao, Taiwan regions and the Tibet Autonomous Region) for empirical analysis spanning 2013 to 2022. The data were sourced from the China Statistical Yearbook, China Rural Statistical Yearbook, China Patent Database, and statistical yearbooks of various provinces in China. Individual missing values were handled with linear interpolation. Table 3 reports sample descriptive statistics.

4. Empirical Results and Discussion

4.1. Baseline Test Results Analysis

Baseline regression estimates are presented in Table 4. Columns (1)–(3) show the results without control variables, while columns (4)–(6) include the full set of controls.
As shown in Columns (1) and (4), DE exerts a direct impact on AER, with its coefficients significantly positive in both columns. After including the control variables, a one-unit rise in DE is associated with a 0.1678-unit increase in AER. This indicates that the DE can accelerate information flow, improve agricultural governance, and optimize resource allocation, thereby enhancing AER, which verifies Hypothesis 1. As shown in Columns (2) and (5), the DE has estimated effects of 0.8444 and 0.8691 on ATI, respectively, indicating that the DE can stimulate innovation vitality, accelerate the application of agricultural innovation achievements, and enhance ATI. Columns (3) and (6) show the combined impact of DE and ATI on AER, with both regression results being significantly positive. As shown in Columns (4)–(6), ATI acts as a mediating variable in the pathway from DE to AER. Specifically, the direct effect coefficient of DE on AER is 0.1678, and its direct impact coefficient on ATI is 0.8691. After adding the mediating variable (ATI), the effect size of DE on AER is 0.1353, and the coefficient of innovation on AER is 0.0374. It can be inferred that ATI serves as a partial mediator, and this mediating effect constitutes 19.37% of the total effect. Hypothesis 2 is therefore confirmed.
With respect to the control variables, Env significantly and positively promotes AER. The main reason is that the environment possesses the characteristic of public goods, and farmers inevitably generate negative externalities in agricultural production. Env assists farmers in decreasing the input of high-pollution-intensity production factors, such as fertilizers and chemical pesticides, reducing over-development and environmental pollution [56], and boosting the agricultural economy’s resistance capacity. Additionally, Ele has a significantly positive impact on AER. The main reason is the accelerated advancement of rural electrification transformation, which has led to the rapid growth of electricity consumption in the primary industry. This improves the efficiency of agricultural production, raises farmers’ income, and enhances agriculture’s capacity to resist natural disasters [57]. Tra has a significant effect on improving AER. Favorable transportation conditions serve as the primary driver, as they can foster industrial agglomeration, promote rural labor mobility, and advance the rational allocation of agricultural resources—factors that jointly support the effective implementation of both agricultural and non-agricultural activities. This not only increases farmers’ agricultural and non-agricultural income but also improves the efficiency of agricultural activities [58], thereby enhancing AER.

4.2. Robustness Tests

We conducted five robustness tests on the baseline regression model. As shown in Table 5, first, we winsorized the sample data at the 1% quantile and re-ran the regression analysis. Second, we adopted the evaluation indicator system proposed by Zhao et al. to measure DE, replaced the previous index [50], re-measured it using the entropy weight method, and performed the regression again. Third, considering the unique characteristics of municipalities directly under the central government, we re-ran the regression after removing the sample data of the municipalities. Fourth, to alleviate potential concerns about the robustness of the entropy weight method, we re-constructed the composite indices of DE and AER using principal component analysis (PCA) and re-conducted the regression. Fifth, because AER is a dynamically evolving concept, we employed the system generalized method of moments (system GMM) to re-estimate the model, which incorporates the one-period lagged AER to capture dynamic persistence. The significantly positive coefficient of the lagged AER reveals strong inertia in AER. The p-values of the AR (2) test and the Hansen test support the validity of the system GMM specification. Therefore, after accounting for the dynamic characteristics of AER, our main conclusions remain robust. The regression results from all five methods confirm the robustness of DE’s effect on AER.

4.3. Endogeneity Test

To mitigate potential endogeneity concerns, this study employs the two-stage least squares (2SLS) method for estimation [59]. Digital development exhibits strong persistence and is correlated with unobserved regional characteristics, which may lead to weak instrument problems and make it difficult to satisfy the exogeneity requirement of instrumental variables. To address this issue, this study draws on previous research [60] and constructs an instrumental variable by interacting the number of fixed-line telephone subscribers per 100 people in each province in 1984 with the national information technology service revenue of the previous year. The rationale for this instrumental variable is twofold. First, the fixed-line telephone penetration rate in 1984, as a historical cross-sectional data point, is not affected by current AER and thus has strong exogeneity with respect to the current period’s AER. Second, by interacting with the national-level information technology service revenue, time-varying characteristics are introduced, effectively capturing the dynamic trends of DE development.
Table 6 reports the estimation results of the 2SLS method to validate the effectiveness of the instrumental variable and the robustness of the core conclusions. The instrumental variable is valid: its coefficient is significantly positive, and the F and LM tests confirm no weak instrument or under-identification problems. The coefficient of DE remains significantly positive, further verifying the positive promoting effect of DE on AER.

4.4. Heterogeneity Test

4.4.1. Regional Heterogeneity

China’s eastern, central, and western regions exhibit significant regional gradient differences in agricultural development levels and industrial structures. The eastern region, with a strong economic foundation and advanced technology and equipment, has a relatively high overall level of agricultural modernization. Its industrial structure is characterized by high-value-added and intensive features. The region has a relatively high proportion of facility agriculture, horticultural crops, agricultural product processing, and leisure agriculture, while the share of grain production is relatively low, placing greater emphasis on quality, efficiency, and green development. The central region, as a major national grain-producing area, focuses its agricultural development on ensuring food security. The planting industry dominates the industrial structure, with the sown area and output of grain crops accounting for a relatively high share nationwide. The livestock industry and agricultural product processing are steadily developing, and the level of scale and mechanization continues to improve, presenting a development pattern that stabilizes grain production, increases efficiency, and integrates crop cultivation with livestock farming. The western region, constrained by natural conditions, topography, and ecological limitations, has a relatively lagging agricultural development level, with insufficient investment in infrastructure and modern production factors. Its industrial structure is more characterized by ecological and distinctive features, with a low degree of scale and intensification, shorter industrial chains, and considerable room for increasing value added.
Based on the above analysis, the 30 provinces are grouped into eastern, central, and western regions according to China’s classification. Table 7 shows that the DE coefficient in the eastern region is positive yet not significant, indicating that the promoting effect of DE on AER is weak in this region. However, in the central and western regions, DE’s coefficients are significant, indicating that DE markedly improves AER in these areas. The potential reasons for such regional heterogeneity are as follows: due to its advanced digital technologies, sound rural industrial chains, and high agricultural modernization, the marginal contribution of DE to enhancing AER in the eastern region is relatively modest. In contrast, the central and western regions have backward production conditions, weak agricultural foundations, and great room for improving AER. In addition, DE development began late in the central and western regions, where digital infrastructure remains weak. With policy support, DE has developed rapidly, continuously releasing momentum for enhancing AER, resulting in a larger marginal effect of DE on improving AER.

4.4.2. Multidimensional Heterogeneity Analysis

To thoroughly examine the heterogeneity of the impact of DE on AER, we conduct subgroup tests from three dimensions: income level, digital infrastructure, and agricultural intensity. These dimensions are selected for the following reasons: income level serves as a direct indicator of a region’s economic development stage, and the agricultural digitalization foundation and application capacity vary significantly across regions with different income levels; digital infrastructure is an essential foundation for DE to empower agriculture, and its coverage level directly affects the permeation impact of digital technologies; agricultural intensity reflects the degree of regional economic dependence on agriculture, and there may be fundamental differences in resilience enhancement pathways between agriculture-dominated provinces and diversified economies.
(1) Income level. We measure income level by rural per capita disposable income. For each province, we calculate the average income over the sample period. The sample median serves as the threshold: provinces above it are classified as high-income, and those below as low-income.
(2) Digital infrastructure. Following relevant studies [61], we use the average proportion of “Broadband China” pilot cities in each province as a proxy for digital infrastructure. For each province, we calculate the average proportion over the sample period. The sample median serves as the threshold: provinces above it are classified as the high digital infrastructure group, and those below as the low digital infrastructure group.
(3) Agricultural intensity. We measure agricultural intensity by the share of agriculture in GDP. For each province, we calculate the average over the sample period. The sample median serves as the threshold: provinces above it are classified as high agricultural intensity, and those below as low agricultural intensity.
Table 8 shows that DE’s promoting effect on AER is significantly positive for the low-income group but not for the high-income group. This indicates that DE is more impactful in less developed regions, where the marginal benefits of digitalization are higher. Second, in terms of digital infrastructure, DE significantly improves AER in low-infrastructure regions but not in high-infrastructure ones. This result may be explained by the fact that AER in high-infrastructure regions is already at a relatively high level, leaving limited marginal room for improvement by DE; in contrast, low-infrastructure regions, driven by policy support, experience more significant resilience improvements from the introduction of DE. Moreover, high-infrastructure regions may face more complex industrial structures, requiring a longer time for the dividends of DE to transmit to the agricultural sector. Third, regarding agricultural intensity, the impact of DE is significant in both the high- and low-intensity groups, but the high-intensity group exhibits a larger coefficient and higher significance level than the low-intensity group. This implies that the contribution of DE to AER is more prominent in provinces with higher agricultural dependence.
Overall, these heterogeneity analyses show that DE’s effect on AER is not uniformly distributed but systematically varies with income level, digital infrastructure, and agricultural intensity.

4.5. Threshold Effect Test

To verify whether ATI non-linearly affects AER, the bootstrap method with 300 repetitions is employed. We test the sample to determine the number of significant thresholds, as shown in Model (1) of Table 9. The results reveal that DE exerts a dual-threshold effect on the relationship between ATI and AER.
The estimated thresholds are 0.1592 and 0.2944. In 2013, looking at the time dimension, only Beijing and Shanghai surpassed the first threshold, while the remaining 28 provinces remained in the low-level category. This implies that during the initial phase of the sample period, most regions in China had weak digital infrastructure and nearly blank agricultural digital applications, meaning that the DE did not yet have the basic conditions to effectively support ATI. By 2022, significant regional disparities persisted: 12 provinces were still below the first threshold, 12 provinces were between the two thresholds, and 6 provinces were above the second threshold. When DE exceeds 0.2944, the DE enters a mature stage, where 5G and the Internet of Things cover major agricultural production areas, and agricultural data platforms achieve full-chain digitalization of production, supply, and marketing.
Table 10 presents the two estimated thresholds: 0.1592 and 0.2944. When DE is below 0.1592, ATI’s coefficient is positive yet insignificant, showing that ATI does not notably enhance AER at low DE levels. When DE lies between 0.1592 and 0.2944, the coefficient of ATI rises to 0.0679 and is significant at the 1% level, implying that for each one-unit increase in ATI, AER increases by 0.0679 units, and the positive effect of ATI on AER begins to emerge. Furthermore, when DE exceeds 0.2944, the coefficient of ATI further increases to 0.1119, also significant at the 1% level, indicating that for each one-unit increase in ATI, AER increases by 0.1119 units. This further increase in the coefficient demonstrates that under a higher level of DE, ATI boosts AER more effectively. In summary, ATI nonlinearly affects AER, with DE exerting a double-threshold influence. A higher DE level strengthens ATI’s positive effect on AER. Thus, Hypothesis 3 is verified, revealing from a nonlinear perspective the law of synergistic empowerment of sustainable agricultural development by DE and ATI.
The possible reasons for this non-linear relationship between ATI and AER are as follows: in the initial stage, digital infrastructure remains underdeveloped, digital technologies are not widespread, and digital awareness is relatively weak. Consequently, the effect of DE on ATI is limited, and digital technologies cannot be fully applied to ATI. Thus, the coupling relationship between the DE and ATI is weak, leading to an unobvious effect of ATI on improving AER. With digital infrastructure being progressively strengthened, the diffusion of digital technologies enables farmers to adapt better to market and technological changes. The DE provides broader application scenarios and more convenient dissemination channels for ATI, and ATI achievements are accelerated in application under the DE environment. Driven by the DE, ATI achievements can penetrate into all links of agricultural activities more quickly, thereby better enhancing AER.
Further combining with China’s DE development level, it is found that only 18 provinces had a DE development level exceeding the first threshold value in 2022, among which 6 provinces (Beijing, Shanghai, Guangdong, Jiangsu, Shandong, and Zhejiang) had a DE development level exceeding the second threshold value. The current situation fails to fully unleash the positive effect of ATI on enhancing AER, and has become a major constraint on agricultural sustainable development.
To explore whether the aforementioned threshold effect is robust and to control for endogeneity issues, the lagged one period of the DE is used as the new threshold variable. Threshold effect test results are shown in Table 9, Model (2), with corresponding regression estimates in Table 10, Column (2). These findings further validate the threshold effect of the DE in the process whereby ATI promotes AER.

4.6. Spatial Spillover Effect Test

4.6.1. Spatial Autocorrelation Test

To explore whether spatial effects of DE on AER exist and whether spatial econometric models can be selected for empirical testing, this study adopts the spatial distance matrix as the spatial weight matrix and first conducts a spatial autocorrelation test on AER of each province using Moran’s I index. Table 11 shows that, based on the spatial distance matrix, the Moran’s I indices of provincial AER are all positive and significant at the 1% level, indicating strong spatial correlation. Hence, spatial econometric models are justified for further analysis.

4.6.2. Spatial Spillover Effect Analysis

To select an appropriate spatial model, this study performs validity tests. Table 12 reports the results, leading to the selection of the spatial Durbin model. The results of SDM are presented in Table 13. The model reports the main effects, the spatial interaction term, and the effect decomposition.
First, the coefficient of DE in the main effect is 0.2053 and significant, indicating that local DE significantly improves local AER. The spatial interaction term has a coefficient of 0.5877 and is also significant, suggesting that DE in neighboring regions positively affects local AER. This provides preliminary evidence of spatial spillovers.
Second, the effect decomposition shows that the direct, indirect, and total effects are 0.1955, 0.3555, and 0.5510, respectively, and all are significant. This indicates that the impact of DE has clear spatial spillover characteristics: for each one-unit increase in local DE development, AER in neighboring regions increases by approximately 0.3555 units. This result confirms that DE can transcend administrative boundaries through information diffusion, industrial linkages, and factor flows, generating positive spillover effects on surrounding areas. Thus, Hypothesis H4 is verified.

5. Coupling Coordination Analysis Between Digital Economy and Agricultural Technological Innovation

The above results indicate that the DE enhances AER through multiple channels. On the one hand, the DE promotes AER both directly and indirectly. On the other hand, the DE exerts a double-threshold effect in the process whereby ATI improves AER. From the perspective of sustainable agricultural development, the coordinated development of the DE and ATI is the premise for their joint empowerment of AER, and their coupling coordination degree (CCD) directly determines the effect of synergistically promoting sustainable agricultural development. That is to say, when the DE and ATI are coordinated, the improvement effect of the DE on AER is maximized. Therefore, this study further explores the coupling and coordination relationship between DE and ATI by constructing a CCD model. The model is specified as follows:
C = U 1 U 2 ( U 1 + U 2 ) 2 , C [ 0 ,   1 ]
D = ( C T ) ,   D [ 0 ,   1 ] ;   Τ = α U 1 + β U 2 ,   T [ 0 ,   1 ]
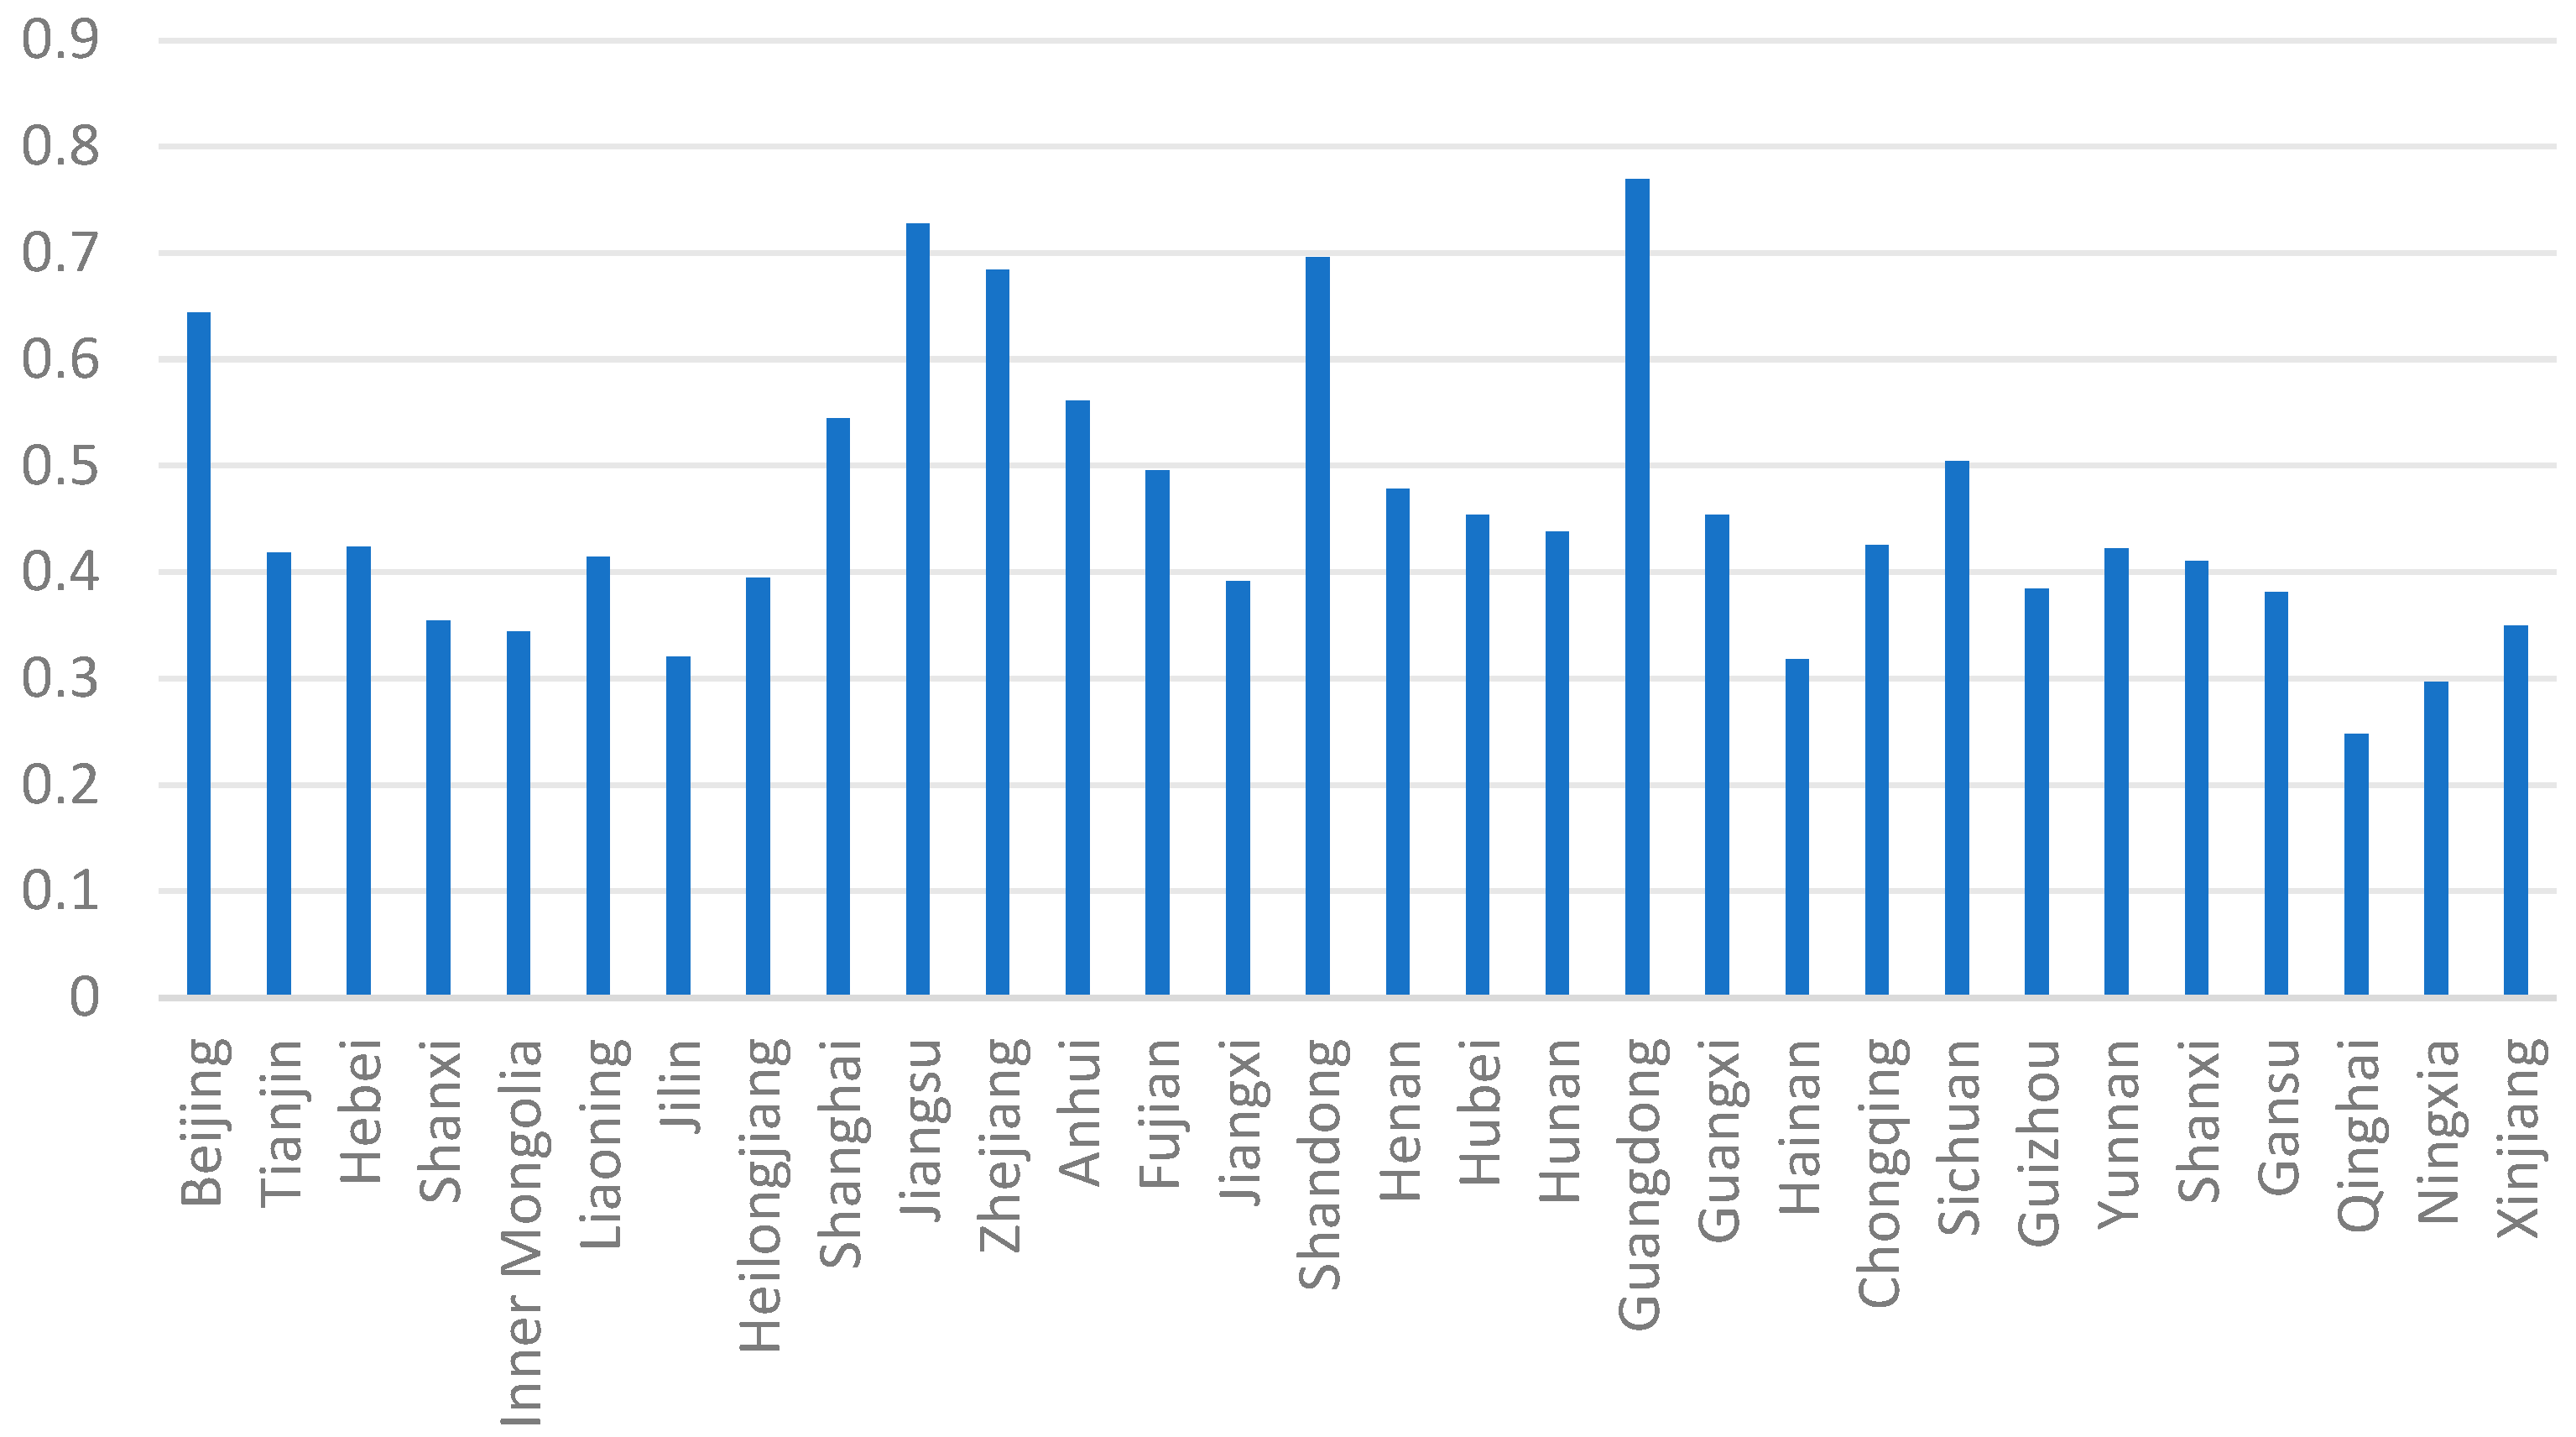
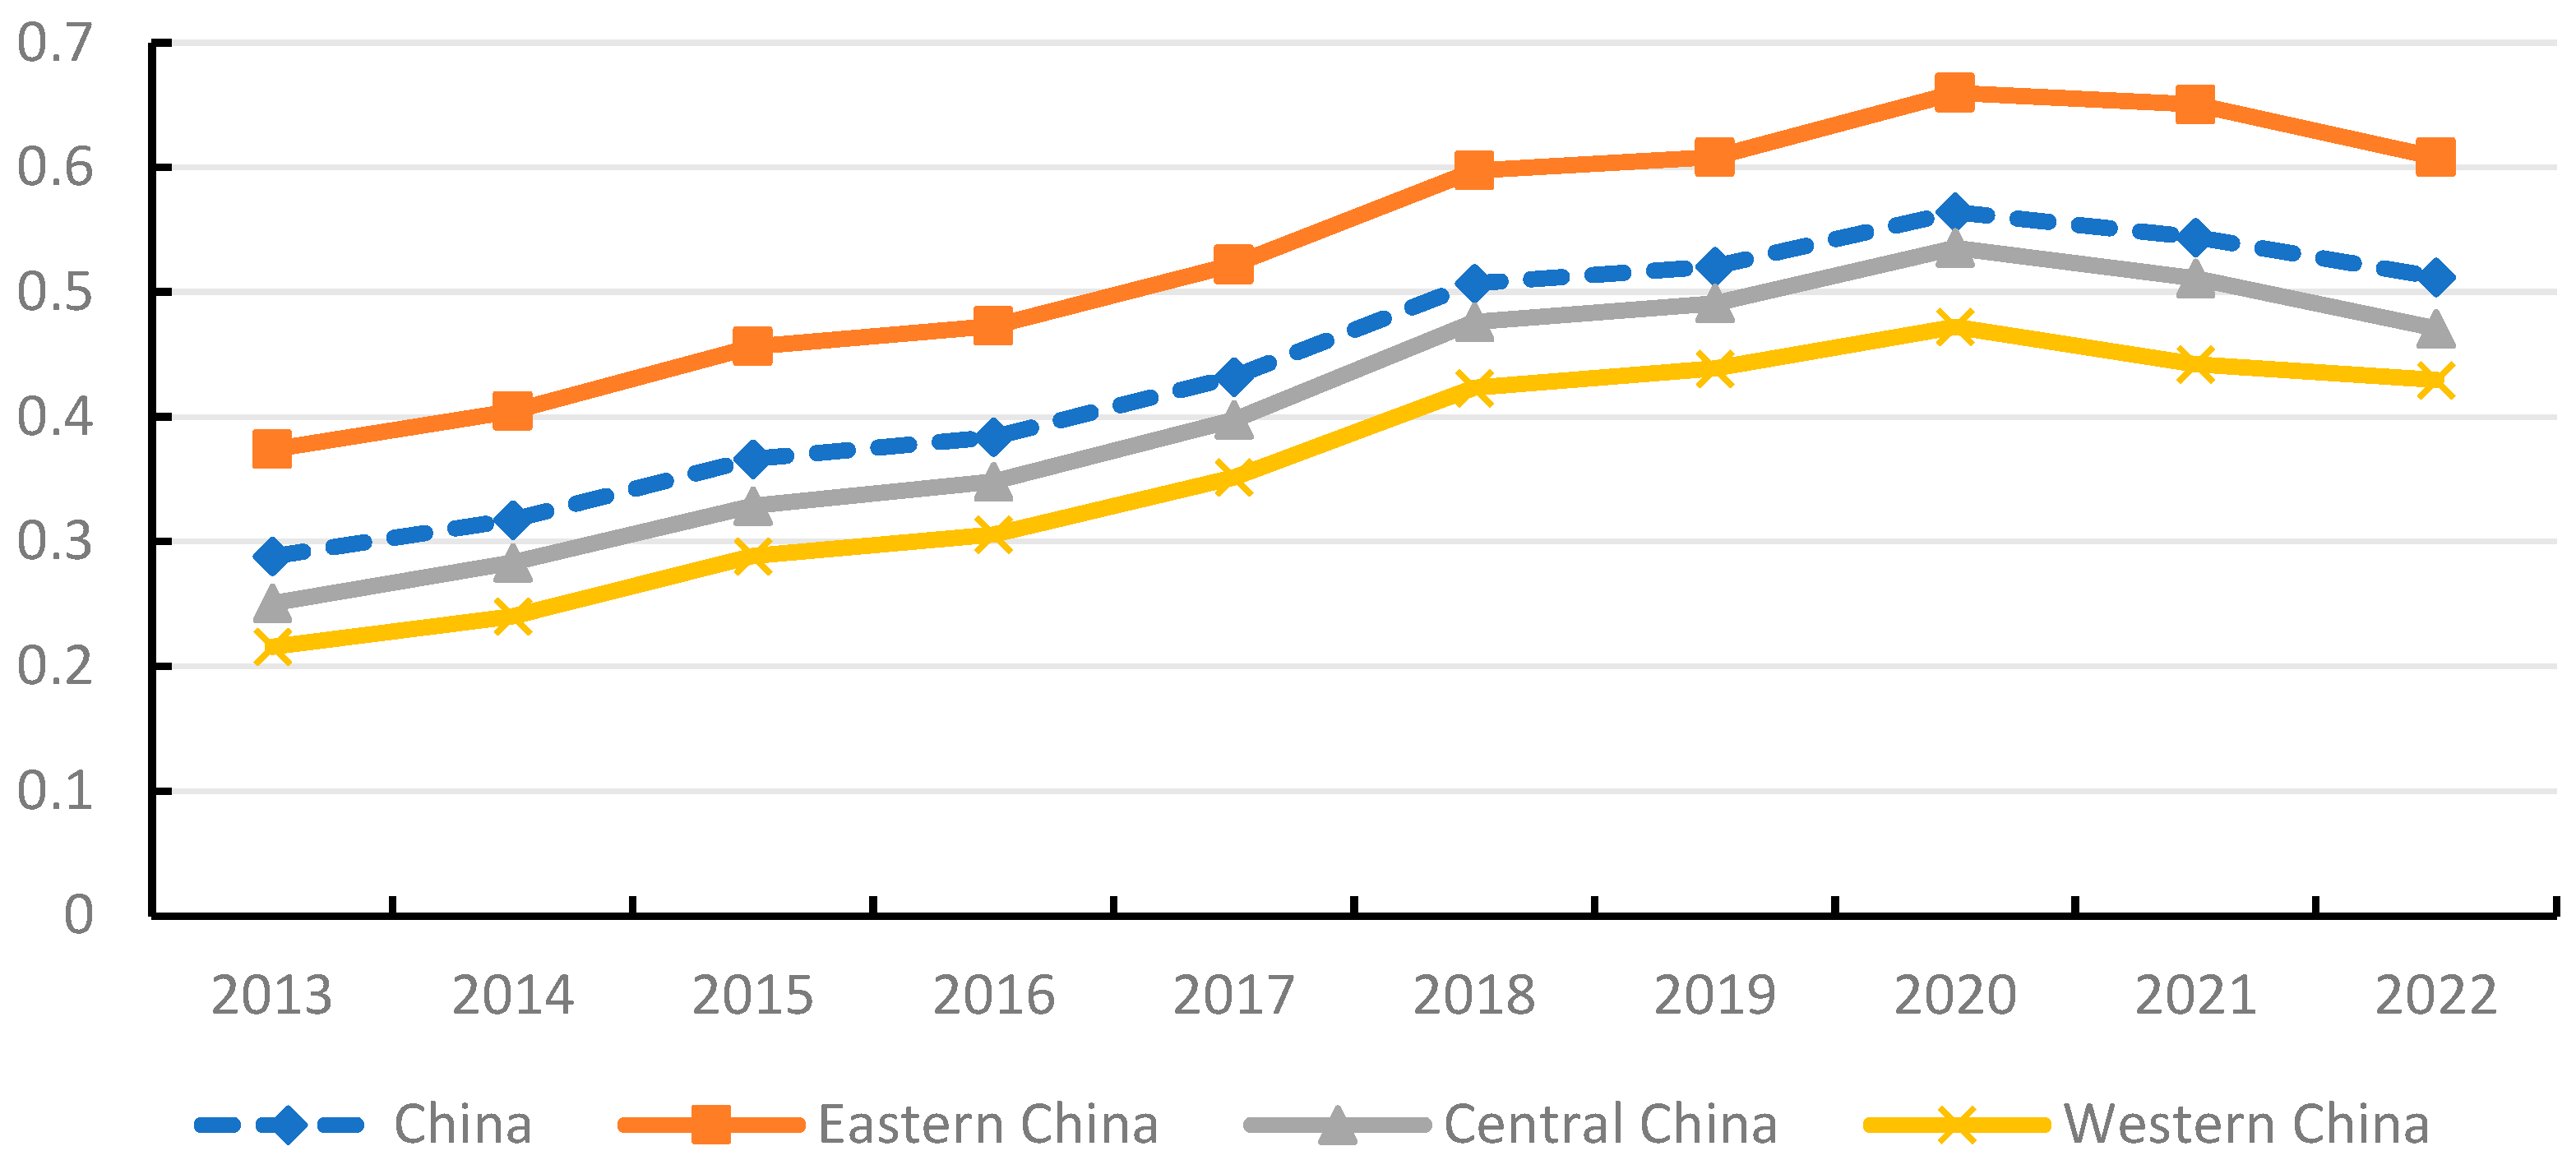
Among them, C is the coupling degree; U1 and U2 are the comprehensive development indexes of DE and ATI from 2013 to 2022 after standardization, respectively; D is the CCD; T is the coordination index; α and β are the coefficients of DE and ATI, both set to 0.5. This study calculates the geometric mean of the development levels of DE and ATI from 2013 to 2022, and then uses the coupling coordination degree model to conduct coupling coordination analysis on DE and ATI for each province in China. The CCD between DE and ATI for each province is shown in Figure 2, and the CCD for China and its various regions is shown in Figure 3.
As shown in Figure 2, only Guangdong and Jiangsu provinces have a CCD between DE and ATI exceeding 0.7, reaching the intermediate coordination level. Shandong, Zhejiang, and Beijing have a CCD greater than 0.6, reaching the primary coordination level. Anhui, Shanghai, and Sichuan have a CCD greater than 0.5, reaching the barely coordinated level. The remaining provinces are all below 0.5, falling into the levels of moderate imbalance, mild imbalance, and near imbalance. Overall, the CCD between DE and ATI is not high in most provinces, implying that their joint effect on AER is limited.
As shown in Figure 3, the CCD between DE and ATI in China as a whole and across regions shows an overall upward trend, with the east highest, the central second, and the west lowest. This is mainly because the eastern region is more economically advanced, with well-established digital infrastructure and a strong industrial base. The DE provides strong economic support for ATI and effectively promotes their coordinated development. In contrast, the central region lags behind the eastern region in terms of DE level, talent, capital, and technology, which results in a relatively lower level of ATI. Moreover, the lower DE level in the central region makes it difficult to fully leverage the role of DE in knowledge sharing and innovation-driven growth. The western region has a weak DE foundation, a relatively backward talent pool and technological level, and a weak linkage between DE and ATI; hence, its CCD is the lowest.

6. Conclusions

6.1. Summary of the Findings

From the perspective of sustainable agricultural development and the Sustainable Development Goals, this study selects panel data from 30 Chinese provinces for the period 2013–2022 and employs multiple empirical models to analyze the direct, indirect, and spatial spillover effects of DE on AER. It further explores the threshold effect and coupling coordination relationship between DE and ATI. The main findings are summarized as follows:
(1) The DE exerts a significantly positive effect on AER, and this finding remains robust after a series of robustness tests and endogeneity treatments. Specifically, it can break geographical barriers, optimize the allocation efficiency of agricultural resources, and enhance the resistance, recovery capacity, and restructuring ability of the agricultural economic system. In turn, this promotes agricultural sustainable development and provides strong support for the realization of the Sustainable Development Goals.
(2) The impact of DE on AER exhibits significant heterogeneity, with the core underlying reasons being diminishing marginal effects and differences in development stages. In the eastern region, where DE and agricultural modernization have matured, the marginal room for digital empowerment is limited, resulting in an insignificant effect on AER. In contrast, the central and western regions, low-income areas, regions with weak digital infrastructure, and highly agriculture-dependent areas are still in a period of rapid digital dividend release, with larger marginal effects. In these regions, DE exerts a significant and strong positive impact on AER.
(3) ATI serves as a partial mediator in the mechanism through which DE promotes AER, and the mediating effect constitutes 19.37% of the total effect. The DE can stimulate the vitality of ATI entities, accelerate the transformation and application of their achievements, and thereby enhance AER.
(4) The impact of ATI on AER is non-linear, and the DE exerts a dual-threshold effect in this process. The estimated values of the first and second thresholds are 0.1592 and 0.2944, respectively. When the level of DE is lower than the first threshold, the effect of ATI on improving AER is not obvious. Between the two thresholds, the positive effect starts to emerge; when it exceeds the second threshold, the positive effect is significantly amplified.
(5) DE has a positive spatial spillover effect on AER. DE can transcend administrative boundaries through information diffusion, industrial linkages, and factor flows, generating positive spillover effects on surrounding areas.
(6) The CCD between the DE and ATI in China shows a steady upward trend, but its overall level remains low, with substantial regional disparities. The unbalanced development of the DE restricts the synergistic effect between the two, and further hinders their joint empowerment of AER and sustainable development.

6.2. Managerial and Policy Implications

Based on the above research findings and considering the requirements of agricultural sustainable development, we propose the following policy recommendations for China:
(1) For the 12 provinces with DE levels below the first threshold (0.1592), priority should be given to basic network coverage and digital literacy training to help them cross the first threshold. For the 12 provinces with DE levels between 0.1592 and 0.2944, policies should focus on integrating digital platforms with ATI extension services to strengthen the mediating channel. For the six provinces with DE levels above 0.2944, advanced applications such as agricultural big data and AI-driven early warning systems should be promoted to maximize the enhancing effect of ATI on AER.
(2) Given that ATI plays a mediating role in the impact of DE on AER, policies should not only increase patent output but also improve technology adoption. Farmer-friendly digital extension platforms should be established, informal innovation (e.g., farmer-led experiments) should be supported, and R&D subsidies should be linked to adoption metrics.
(3) Spatial spillover effects should be leveraged to promote regional coordination. Cross-provincial digital infrastructure should be encouraged, along with interregional risk-sharing mechanisms. Eastern provinces should lead technology diffusion to the central and western regions. In low-income and low-infrastructure regions where the impact of DE is strongest, priority should be given to basic digital access. In high-agricultural-intensity provinces where the coefficient of DE is larger, digitalization should be integrated with food security and supply chain resilience programs.

6.3. Limitations and Future Research Directions

Based on the design and empirical analysis process of this study, there are the following limitations:
(1) This study focuses on the impact of DE and ATI on AER. However, due to research boundary constraints, other important factors that may affect AER, such as climate variability and subsidy policies, are not incorporated into the empirical model. These factors may theoretically have significant effects on AER: climate variability directly affects the stability of agricultural production, while agricultural subsidies can mitigate farmer risks and facilitate recovery. The omission of these factors may result in biased estimates and limit a comprehensive understanding of the complex mechanisms influencing AER. Future research may incorporate these variables into the analytical framework when data conditions permit, to further reveal the formation and evolution of AER under the interaction of multiple factors.
(2) This study uses the total annual agricultural science and technology patents of each province as an ATI proxy. Although this measure captures formal innovation output, it has certain limitations. First, patent counts mainly reflect outcomes at the R&D stage and cannot fully capture informal innovation widely present in agricultural production, such as farmers’ spontaneous technological improvements. Second, this indicator overlooks technology adoption behavior, i.e., whether farmers actually apply innovative technologies in production, as well as the effectiveness of technology extension and diffusion. Due to limited micro-level data, this study fails to incorporate the above dimensions, which may result in an incomplete depiction of the mechanism through which ATI operates.
(3) The generalizability of the findings beyond China is limited. Although this study provides in-depth evidence from China, the extent to which the findings can be extrapolated to other developing countries remains untested. The estimated threshold values and the mediating effect size are contingent upon China’s unique institutional, economic, and digital development context. Future research should conduct comparative case studies across multiple developing countries (e.g., India, Vietnam, Nigeria) using harmonized measurement frameworks to assess the cross-national robustness of our conclusions. Moreover, meta-analytical approaches could help synthesize heterogeneous effects across different regional settings.
Given these limitations, further research could be pursued in the following areas:
(1) Future research should integrate other important drivers that may influence AER, including climate variability and agricultural subsidy policies, into the analytical framework. This would allow for a more comprehensive understanding of the formation and evolution of AER under the interaction of multiple factors, thereby allowing more precise estimation of the net effects of DE and ATI.
(2) Future research should combine micro-level survey data and adopt more diverse measurement approaches to capture the multidimensional connotations of ATI, covering informal innovation (e.g., farmers’ spontaneous technological improvements) and technology adoption behavior (e.g., farmers’ actual application of new technologies), so as to more comprehensively depict the mechanism through which ATI affects AER.
(3) Future research should test the generalizability of our findings in a broader range of developing countries to examine the stability of the results across varying institutional, economic, and digital development contexts, thereby enhancing the external validity of the conclusions and providing more targeted policy references for countries with different development conditions.

Author Contributions

Conceptualization, X.M. and Z.C.; methodology, X.M.; software, X.M.; validation, X.M. and Z.C.; formal analysis, X.M.; investigation, X.M.; resources, X.M.; data curation, X.M.; writing—original draft preparation, X.M.; writing—review and editing, X.M. and Z.C.; visualization, X.M.; supervision, Z.C.; project administration, Z.C.; funding acquisition, Z.C. All authors have read and agreed to the published version of the manuscript.

Funding

The authors thank the financial support provided by the National Social Science Foundation of China (23BJY188), Philosophy and Social Science Foundation Project of Heilongjiang Province(24LJE001).

Institutional Review Board Statement

Not applicable.

Informed Consent Statement

Not applicable.

Data Availability Statement

The raw data supporting the conclusions of this article will be made available by the authors on request.

Conflicts of Interest

The authors declare no conflicts of interest.

References

  1. Ye, Y.; Zou, P.; Zhang, W.; Liu, X.; Liu, B.; Kang, X. Spatial–Temporal Evolution Characteristics of Agricultural Economic Resilience: Evidence from Jiangxi Province, China. Agronomy 2022, 12, 3144. [Google Scholar] [CrossRef] [Scilit]
  2. Gai, M.; Yang, Q. Synergistic Study of the Green Efficiency and Economic Resilience of Agriculture from a Sustainable Development Perspective: Evidence from Northeast China. Environ. Sci. Pollut. Res. 2023, 30, 77568–77592. [Google Scholar] [CrossRef] [Scilit]
  3. Zhu, Y.; Xu, Q.; Hao, C.; Geng, S.; Li, B. Synergistic Evolution or Competitive Disruption? Analysing the Dynamic Interaction Between Digital and Real Economies in Henan, China, Based on Panel Data. Data 2025, 10, 126. [Google Scholar] [CrossRef] [Scilit]
  4. Putsenteilo, P.R.; Humeniuk, O.O. Digital Economy as the Modern Vector of Reconstruction of the Traditional Economy. Innov. Econ. 2018, 75, 131–143. [Google Scholar]
  5. Wang, Y.; Peng, Q.; Jin, C.; Ren, J.; Fu, Y.; Yue, X. Whether the Digital Economy Will Successfully Encourage the Integration of Urban and Rural Development: A Case Study in China. Chin. J. Popul. Resour. Environ. 2023, 21, 13–25. [Google Scholar] [CrossRef] [Scilit]
  6. Liang, J.; Qiao, C. Digital Economy and High-Quality Agricultural Development: Mechanisms of Technological Innovation and Spatial Spillover Effects. Sustainability 2025, 17, 3639. [Google Scholar] [CrossRef] [Scilit]
  7. Ye, L. Digital Economy and High-Quality Agricultural Development. Int. Rev. Econ. Financ. 2025, 99, 104028. [Google Scholar] [CrossRef] [Scilit]
  8. Jiang, L.; Zhang, M.; Hu, S. Digital Economy, Green Innovation and Regional Resource Allocation Efficiency: Evidence from 257 Cities in China. Front. Environ. Sci. 2025, 13, 1529946. [Google Scholar] [CrossRef] [Scilit]
  9. Yang, S.; Jia, J. Digital Economy, Technological Innovation, and Environmental Quality Improvement. Sustainability 2022, 14, 15289. [Google Scholar] [CrossRef] [Scilit]
  10. Reggiani, A. Network Resilience for Transport Security: Some Methodological Considerations. Transp. Policy 2013, 28, 63–68. [Google Scholar] [CrossRef] [Scilit]
  11. Gil, J.D.; Cohn, A.S.; Duncan, J.; Newton, P.; Vermeulen, S. The Resilience of Integrated Agricultural Systems to Climate Change. Wiley Interdiscip. Rev. Clim. Change 2017, 8, e461. [Google Scholar] [CrossRef] [Scilit]
  12. Lin, B.B. Resilience in Agriculture through Crop Diversification: Adaptive Management for Environmental Change. BioScience 2011, 61, 183–193. [Google Scholar] [CrossRef] [Scilit]
  13. Yang, Y.; Feng, P.; Guo, J. How Does Agricultural Resilience in China Vary by Region? Ecol. Indic. 2025, 174, 113513. [Google Scholar] [CrossRef] [Scilit]
  14. Zhang, S.; Zhang, H.; Xie, F.; Wu, D. Climate Change and Sustainable Agriculture: Assessment of Climate Change Impact on Agricultural Resilience. Sustainability 2025, 17, 7376. [Google Scholar] [CrossRef] [Scilit]
  15. Ward, F.A. Enhancing Climate Resilience of Irrigated Agriculture: A Review. J. Environ. Manag. 2022, 302, 114032. [Google Scholar] [CrossRef] [Scilit]
  16. Basche, A.D.; Edelson, O.F. Improving Water Resilience with More Perennially Based Agriculture. Agroecol. Sustain. Food Syst. 2017, 41, 799–824. [Google Scholar] [CrossRef] [Scilit]
  17. Venkateswarlu, B.; Shanker, A.K. Dryland Agriculture: Bringing Resilience to Crop Production under Changing Climate. In Crop Stress and Its Management: Perspectives and Strategies; Springer: Dordrecht, The Netherlands, 2011; pp. 19–44. [Google Scholar]
  18. Gao, Q.; Sun, M.; Chen, L. The Impact of Digital Inclusive Finance on Agricultural Economic Resilience. Financ. Res. Lett. 2024, 66, 105679. [Google Scholar] [CrossRef] [Scilit]
  19. Yao, R.; Ma, Z.; Wu, H.; Xie, Y. Mechanism and Measurement of the Effects of Industrial Agglomeration on Agricultural Economic Resilience. Agriculture 2024, 14, 337. [Google Scholar] [CrossRef] [Scilit]
  20. Quan, T.; Zhang, H.; Quan, T.; Yu, Y. Unveiling the Impact and Mechanism of Digital Technology on Agricultural Economic Resilience. Chin. J. Popul. Resour. Environ. 2024, 22, 136–145. [Google Scholar] [CrossRef] [Scilit]
  21. Zhang, H.; Li, J.; Quan, T. Strengthening or Weakening: The Impact of an Aging Rural Workforce on Agricultural Economic Resilience in China. Agriculture 2023, 13, 1436. [Google Scholar] [CrossRef] [Scilit]
  22. Zhou, J.; Chen, H.; Bai, Q.; Liu, L.; Li, G.; Shen, Q. Can the Integration of Rural Industries Help Strengthen China’s Agricultural Economic Resilience? Agriculture 2023, 13, 1813. [Google Scholar] [CrossRef] [Scilit]
  23. Zhang, D.; Jiang, D.; He, B. Empowering Agricultural Economic Resilience with Smart Supply Chain: Theoretical Mechanism and Action Path. Sustainability 2025, 17, 2930. [Google Scholar] [CrossRef] [Scilit]
  24. Xu, J.; Wang, C.; Yin, X.; Wang, W. Digital Economy and Rural Household Resilience: Evidence from China. Agric. Econ. 2024, 70, 5. [Google Scholar] [CrossRef] [Scilit]
  25. Xie, Y.; Yao, R.; Wu, H.; Li, M. Digital Economy, Factor Allocation, and Resilience of Food Production. Land 2025, 14, 139. [Google Scholar] [CrossRef] [Scilit]
  26. Bao, A.; He, M.; Zhou, Q.; Gao, H. The Impact of Industrial Policies Oriented toward the Digital Economy on the Resilience of the Agricultural Industrial Chain. Front. Sustain. Food Syst. 2025, 9, 1634474. [Google Scholar] [CrossRef] [Scilit]
  27. Martin, R.; Sunley, P. On the Notion of Regional Economic Resilience: Conceptualization and Explanation. J. Econ. Geogr. 2015, 15, 1–42. [Google Scholar] [CrossRef] [Scilit]
  28. Morkūnas, M.; Žičkienė, A.; Volkov, A.; Skvarciany, V. What Do We (Not) Know about Agricultural Economic Resilience? Insights from the Systematic Literature Review. Bus. Theory Pract. 2025, 26, 287–304. [Google Scholar] [CrossRef] [Scilit]
  29. Liao, C.N.; Chen, Y.J. Farmers’ Information Management in Developing Countries—A Highly Asymmetric Information Structure. Prod. Oper. Manag. 2017, 26, 1207–1220. [Google Scholar] [CrossRef] [Scilit]
  30. Zhu, W.; Chen, J. The Spatial Analysis of Digital Economy and Urban Development: A Case Study in Hangzhou, China. Cities 2022, 123, 103563. [Google Scholar] [CrossRef] [Scilit]
  31. Shen, F.; Jiang, F. The Resilience of Agricultural Product Supply Chain: An Empirical Analysis Based on Spatial Spillover and Threshold Effects. Sustainability 2026, 18, 1975. [Google Scholar] [CrossRef] [Scilit]
  32. Akbar, Y.H.; Tracogna, A. The Digital Economy and the Growth Dynamics of Sharing Platforms: A Transaction Cost Economics Assessment. J. Digit. Econ. 2022, 1, 209–226. [Google Scholar] [CrossRef] [Scilit]
  33. Hou, J.; Li, X.; Chen, F.; Hou, B. The Effect of Digital Economy on Rural Environmental Governance: Evidence from China. Agriculture 2024, 14, 1974. [Google Scholar] [CrossRef] [Scilit]
  34. Qi, L.; Yang, L.; Ta, M. The Impact of Digital Economy on Regional Resource Allocation Efficiency: An Analysis Based on Resource Flow Speed and Direction. Financ. Res. Lett. 2025, 82, 107644. [Google Scholar] [CrossRef] [Scilit]
  35. Li, J. Research on the Impact of Digital Economy on Labor Resource Allocation: Evidence from China. PLoS ONE 2024, 19, e0297449. [Google Scholar]
  36. Dou, Q.; Gao, X. The Double-Edged Role of the Digital Economy in Firm Green Innovation: Micro-Evidence from Chinese Manufacturing Industry. Environ. Sci. Pollut. Res. 2022, 29, 67856–67874. [Google Scholar] [CrossRef] [Scilit]
  37. Zhang, Y.F.; Ji, M.X.; Zheng, X.Z. Digital Economy, Agricultural Technology Innovation, and Agricultural Green Total Factor Productivity. Sage Open 2023, 13, 21582440231194388. [Google Scholar] [CrossRef] [Scilit]
  38. Fan, X. Digital Economy Development, International Trade Efficiency and Trade Uncertainty. China Financ. Econ. Rev. 2021, 10, 89–110. [Google Scholar] [CrossRef] [Scilit]
  39. Xu, G.; Shan, J.; Li, C.; Chen, X.; Zhou, N. Study on the Innovation-Driven Effect of Digital Economy on Real Economy—A Theoretical and Empirical Analysis from an R&D Perspective. Sustainability 2023, 15, 15370. [Google Scholar]
  40. Guo, J.; Lyu, J. The Digital Economy and Agricultural Modernization in China: Measurement, Mechanisms, and Implications. Sustainability 2024, 16, 4949. [Google Scholar] [CrossRef] [Scilit]
  41. Wang, Q.; Chen, R.; Li, J.; Khan, N. Toward a Sustainable Agricultural System in China: Exploring the Nexus between Agricultural Science and Technology Innovation, Agricultural Resilience and Fiscal Policies Supporting Agriculture. Front. Sustain. Food Syst. 2024, 8, 1390014. [Google Scholar] [CrossRef] [Scilit]
  42. Luo, C.; Wei, D.; Su, W.; Lu, J. Association between Regional Digitalization and High-Quality Economic Development. Sustainability 2023, 15, 1909. [Google Scholar] [CrossRef] [Scilit]
  43. Li, C.; Wen, M.; Jiang, S.; Wang, H. Assessing the Effect of Urban Digital Infrastructure on Green Innovation: Mechanism Identification and Spatial-Temporal Characteristics. Humanit. Soc. Sci. Commun. 2024, 11, 320. [Google Scholar] [CrossRef] [Scilit]
  44. Qiao, X.; He, Y.; Du, Q. How Does the Urban Digital Economy Drive Labor Allocation in China?—A Perspective of Factor Mobility between Digital and Non-Digital Enterprises. Econ. Anal. Policy 2025, 85, 1159–1175. [Google Scholar] [CrossRef] [Scilit]
  45. Tombe, R.; Smuts, H. Agricultural Social Networks: An Agricultural Value Chain-Based Digitalization Framework for an Inclusive Digital Economy. Appl. Sci. 2023, 13, 6382. [Google Scholar] [CrossRef] [Scilit]
  46. Wen, Z.; Ye, B. Analyses of Mediating Effects: The Development of Methods and Models. Adv. Psychol. Sci. 2014, 22, 731. [Google Scholar] [CrossRef] [Scilit]
  47. Lobonț, O.-R.; Nicolescu, A.-C.; Costea, F.; Li, Z.-Z.; Țăran, A.-M.; Davidescu, A. A Panel Threshold Model to Capture the Nonlinear Nexus between Public Policy and Entrepreneurial Activities in EU Countries. Mathematics 2022, 10, 1265. [Google Scholar] [CrossRef] [Scilit]
  48. Hennebry, B. The Determinants of Economic Resilience in Rural Regions. An Examination of the Portuguese Case. Misc. Geogr. Reg. Stud. Dev. 2020, 24, 24–29. [Google Scholar] [CrossRef] [Scilit]
  49. Zhang, H.; Bai, X.; Zhao, M. How Socialized Services Affect Agricultural Economic Resilience—Empirical Evidence from China. Agriculture 2024, 14, 1773. [Google Scholar] [CrossRef] [Scilit]
  50. Zhao, T.; Zhang, Z.; Liang, S. Digital Economy, Entrepreneurship, and High-Quality Economic Development: Empirical Evidence from Urban China. Front. Econ. China 2022, 17, 393–442. [Google Scholar]
  51. Guo, F. Measuring China’s Digital Financial Inclusion: Index Compilation and Spatial Characteristics. China Econ. Q. 2020, 19, 1401–1418. [Google Scholar]
  52. Liu, J.; Yang, Y.; Zhang, S. Research on the Measurement and Driving Factors of China’s Digital Economy. Shanghai J. Econ. 2020, 6, 81–96. [Google Scholar]
  53. Tian, X.; Wang, T. Tolerance for Failure and Corporate Innovation. Rev. Financ. Stud. 2014, 27, 211–255. [Google Scholar] [CrossRef] [Scilit]
  54. Tan, Y.; Tian, X.; Zhang, X.; Zhao, H. The Real Effect of Partial Privatization on Corporate Innovation: Evidence from China’s Split Share Structure Reform. J. Corp. Financ. 2020, 10, 1661. [Google Scholar] [CrossRef] [Scilit]
  55. Fan, G.; Wang, X.; Ma, G. The Contribution of Marketization to China’s Economic Growth. China Econ. 2012, 7, 4. [Google Scholar]
  56. Wang, Y.; Shen, N. Environmental Regulation and Environmental Productivity: The Case of China. Renew. Sustain. Energy Rev. 2016, 62, 758–766. [Google Scholar] [CrossRef] [Scilit]
  57. Kuntke, F.; Linsner, S.; Steinbrink, E.; Franken, J.; Reuter, C. Resilience in Agriculture: Communication and Energy Infrastructure Dependencies of German Farmers. Int. J. Disaster Risk Sci. 2022, 13, 214–229. [Google Scholar] [CrossRef] [Scilit]
  58. Khan, M.A.; Ni, G.; Man, T.; Saud, S. Impacts of Transport Infrastructure on Agricultural Total Factor Productivity in Asian Countries. Transp. Policy 2025, 171, 18–27. [Google Scholar] [CrossRef] [Scilit]
  59. James, L.R.; Singh, B.K. An Introduction to the Logic, Assumptions, and Basic Analytic Procedures of Two-Stage Least Squares. Psychol. Bull. 1978, 85, 1104. [Google Scholar] [CrossRef]
  60. Gao, L.; Wen, H. Digital Economy and Environmental Sustainability: Analysis of Cross-Country Coordination. Sustainability 2025, 17, 1840. [Google Scholar] [CrossRef] [Scilit]
  61. Lv, K.; Li, J.; Zhao, Y. Can Internet Construction Promote Urban Green Development? A Quasi-Natural Experiment from the “Broadband China”. Int. J. Environ. Res. Public Health 2023, 20, 4709. [Google Scholar] [CrossRef] [Scilit]
Figure 1. Theoretical mechanism diagram.
Sustainability 18 03973 g001
Figure 2. Coupling Coordination Degree of Digital Economy and Agricultural Technological Innovation in Provinces of China.
Sustainability 18 03973 g002
Figure 3. Coupling Coordination Degree between Digital Economy and Agricultural Technological Innovation in China and Its Regions.
Sustainability 18 03973 g003
Table 1. Construction of an index system of AER.
Primary IndicatorsSecondary IndicatorsIndicator ExplanationAttribute
Resistance CapacityPer capita agricultural added valueAgricultural gross output value/number of agricultural employees+
Agricultural employment shareNumber of agricultural employees/Total rural population+
Effective irrigation rateEffective irrigation area/Cultivated land area+
Multiple cropping indexSown area/Cultivated land area+
Grain yield per unit sown areaGrain output /Sown area of crops+
Agricultural machinery power per unit areaAgricultural machinery power/Sown area of crops+
Disaster-affected degreeAffected crop area/Disaster-stricken area
Recovery CapacityPesticide usage per unit sown areaPesticide usage/Sown area of crops
Agricultural plastic film usage per unit sown areaAgricultural plastic film usage/Sown area of crops
Chemical fertilizer application per unit sown areaPure chemical fertilizer application/Sown area of crops
Agricultural diesel usage per unit sown areaAgricultural diesel usage/Sown area of crops
Rural per capita disposable incomePer capita disposable income of rural residents+
Rural consumption expenditurePer capita consumption expenditure of rural residents+
Engel coefficient of rural householdsFood expenditure/Household consumption expenditure-
Restructuring CapacityRural education levelAverage years of education per rural resident+
fiscal support for agricultureLocal fiscal expenditure on agriculture, forestry and water affairs+
Intensity of fixed asset investment in agricultureFixed asset investment in agriculture, forestry, animal husbandry, and fishery by rural households/number of employees in primary industry+
Agricultural insurance supportAgricultural insurance payouts+
Table 2. Construction of an index system of DE.
Primary IndicatorsSecondary IndicatorsIndicator ExplanationAttribute
Internet DevelopmentInternet penetration rateBroadband users per 100 inhabitants+
Employees in Internet industryShare of workforce in computer and software services+
Internet-related outputTelecom business volume per capita+
Mobile network subscribersMobile phone owners per 100 persons+
Digital Inclusive FinanceDigital inclusive finance developmentPeking University Digital Financial Inclusion Index+
Digital Transaction DevelopmentPer capita e-commerce salesE-commerce sales/Total population+
Per capita e-commerce purchasesE-commerce purchases/Total population+
Table 3. Descriptive statistics.
VariablesObsMeanStd. Dev.MinMax
AER3000.33370.09380.14450.6374
DE3000.17060.13510.02030.7516
ATI3000.33980.32190.00781.6651
Env3000.25520.28490.00442.4510
Inc3002.51060.36171.82663.5557
Mar3008.35151.88243.580012.8640
Ele3000.21890.54940.01554.1275
Tra30015.86778.44401.260040.5400
Table 4. Baseline Regression Results.
Variable(1)(2)(3)(4)(5)(6)
AERATIAERAERATIAER
DE0.1127 ***
(0.0329)
0.8444 ***
(0.1974)
0.0785 **
(0.0331)
0.1678 ***
(0.0392)
0.8691 ***
(0.2408)
0.1353 ***
(0.0392)
ATI 0.0405 ***
(0.0100)
0.0374 ***
(0.0099)
Env 0.0136 *
(0.0069)
0.0620
(0.0426)
0.0113 *
(0.0068)
Inc 0.0070
(0.0265)
0.0537
(0.1629)
0.0049
(0.0258)
Mar −0.0025
(0.0028)
0.0309 *
(0.0170)
−0.0036
(0.0027)
Ele 0.0141 ***
(0.0043)
0.0349
(0.0263)
0.0127 ***
(0.0042)
Tra 0.0019
(0.0012)
−0.0020
(0.0073)
0.0020 *
(0.0012)
_cons0.2465 ***
(0.0043)
0.0981 ***
(0.0260)
0.2425 ***
(0.0043)
0.2070 ***
(0.0749)
−0.2879
(0.4605)
0.2178 ***
(0.0731)
Individual fixed effectYESYESYESYESYESYES
Time fixed effectYESYESYESYESYESYES
Obs300300300300300300
R20.90950.51050.91480.91630.52480.9207
Note: ***, **, * represent significance levels of 1%, 5% and 10%, respectively.
Table 5. Robustness Test Results.
VariableWinsorizeReplace Independent VariableExclude SamplesPCASystem GMM
AERAERAERAERAER
L.AER 0.8823 ***
(0.0908)
DE0.1942 ***
(0.0389)
0.1185 **
(0.0535)
0.3265 ***
(0.0477)
0.3196 ***
(0.0738)
0.1467 ***
(0.0441)
Env0.0161 **
(0.0077)
0.0196 ***
(0.0071)
0.0147 **
(0.0066)
0.2972 ***
(0.1106)
0.0091 *
(0.0048)
Inc−0.0029
(0.0247)
0.0310
(0.0263)
0.0264
(0.0272)
0.5421
(0.4189)
−0.0491 **
(0.0242)
Mar−0.0033
(0.0026)
−0.0018
(0.0028)
−0.0107 ***
(0.0029)
−0.0360
(0.0448)
−0.0067 **
(0.0033)
Ele0.0158 ***
(0.0042)
0.0082 **
(0.0041)
−0.0550 ***
(0.0206)
0.0994
(0.0739)
−0.0167
(0.0107)
Tra0.0024 *
(0.0012)
0.0014
(0.0012)
0.0024 **
(0.0012)
−0.0054
(0.0189)
0.0026 ***
(0.0001)
_cons0.2304 ***
(0.0707)
0.1446 *
(0.0752)
0.2036 ***
(0.0751)
−1.7040
(1.2204)
0.1630 **
(0.0827)
Individual fixed effectYESYESYESYESYES
Time fixed effectYESYESYESYESYES
Obs300300260300270
R20.92560.91200.93420.8772
AR (1) 0.043
AR (2) 0.120
Hansen test 0.187
Note: ***, **, * represent significance levels of 1%, 5% and 10%, respectively.
Table 6. Endogeneity Test Results.
VariableThe First StageThe Second Stage
DEDE
Instrumental variable0.0664 ***
(0.0057)
DE 0.3549 ***
(0.0423)
Control variablesYESYES
Kleibergen–Paap rk LM22.799 ***
Kleibergen–Paap rk Wald F134.944
Stock–Yogo weak ID test critical values16.38
Note: *** represents significance level of 1%.
Table 7. Regional Heterogeneity Test Results.
VariableEastern ChinaCentral ChinaWestern China
(1)(2)(3)
AERAERAER
DE0.0767
(0.0630)
0.4919 *
(0.2592)
0.2338 **
(0.0913)
_cons0.2809
(0.2192)
0.4276 **
(0.1851)
0.1971 **
(0.0968)
Control variablesYESYESYES
Individual fixed effectYESYESYES
Time fixed effectYESYESYES
Obs11080110
R20.91170.93250.9595
Note: **, * represent significance levels of 5% and 10%, respectively.
Table 8. Multidimensional Heterogeneity Test Results.
VariableIncome LevelDigital InfrastructureAgricultural Intensity
(1)(2)(3)(4)(5)(6)
LowHighLowHighLowHigh
DE0.2573 ***
(0.0908)
0.0742
(0.0521)
0.2602 ***
(0.0624)
0.0445
(0.0451)
0.1104 *
(0.0564)
0.4019 ***
(0.1071)
_cons0.2781 ***
(0.0967)
0.1803
(0.1280)
0.3808 **
(0.1325)
0.1518
(0.1919)
−0.1483
(0.1704)
0.2486 ***
(0.0777)
Control variablesYESYESYESYESYESYES
Individual fixed effectYESYESYESYESYESYES
Time fixed effectYESYESYESYESYESYES
Obs150150150150150150
R20.94310.92030.91900.94430.90390.9528
Note: ***, **, * represent significance levels of 1%, 5% and 10%, respectively.
Table 9. Threshold Effect Test Results.
ModelThreshold VariableNumber of
Thresholds
F Statisticp-ValueBootstrap Replications
(1)DESingle threshold51.130.0000300
Double threshold23.620.0067300
Triple threshold11.500.6833300
(2)L.DESingle threshold41.360.0000300
Double threshold19.660.0400300
Triple threshold13.600.6800300
Table 10. Threshold Regression Results.
Variable(1)(2)
AERAER
ATI (DE ≤ The first threshold value)0.0110
(0.0152)
0.0153
(0.0160)
ATI (The first threshold value < DE ≤ The second threshold value)0.0679 ***
(0.0133)
0.0717 ***
(0.0144)
ATI (DE > The second threshold value)0.1119 ***
(0.0116)
0.1126 ***
(0.0131)
Env−0.0166 *
(0.0087)
−0.0190 **
(0.0093)
Inc−0.2822 ***
(0.0230)
−0.2649 ***
(0.0256)
Mar0.0077 **
(0.0036)
0.0086 **
(0.0041)
Ele−0.0043
(0.0052)
−0.0033
(0.0054)
Tra0.0066 ***
(0.0016)
0.0063 ***
(0.0018)
_cons0.8590 ***
(0.0825)
0.8131 ***
(0.0919)
Obs300270
Note: ***, **, * represent significance levels of 1%, 5% and 10%, respectively.
Table 11. Spatial Autocorrelation Test Results.
YearIzp-Value
20130.1755.7280.000
20140.1715.6220.000
20150.1615.3340.000
20160.1635.4040.000
20170.1244.3080.000
20180.1093.9300.000
20190.0933.4760.001
20200.0933.5270.000
20210.0843.2380.001
20220.1053.8450.000
Table 12. Model Validity Test Results.
Testing MethodStatisticp-Value
LM-lag29.4330.000
R- LM-lag14.5170.000
LM-err61.8060.000
R-LM-err46.8900.000
LR-both/ind72.780.000
LR-both/time494.980.0000
LR-SDM-SAR116.900.0000
LR-SDM-SEM116.950.0000
Wald-SDM/SAR145.200.0000
Wald-SDM/SEM144.130.0000
Table 13. Results of the Spatial Durbin Model.
Variable(1)(2)(3)(4)(5)
Main Wx Direct IndirectTotal
DE0.2053 ***
(0.0313)
0.5877 ***
(0.2152)
0.1955 ***
(0.0319)
0.3555 **
(0.1659)
0.5510 ***
(0.1612)
Env0.0049
(0.0056)
0.0876 **
(0.0390)
0.0026
(0.0051)
0.0553 **
(0.0253)
0.0580 **
(0.0243)
Inc−0.0573 **
(0.0228)
−0.0327
(0.1432)
−0.0552 **
(0.0240)
−0.0094
(0.0985)
−0.0646
(0.0949)
Mar−0.0033
(0.0023)
−0.0094
(0.0163)
−0.0030
(0.0026)
−0.0069
(0.0115)
−0.0099
(0.0115)
Ele0.0111 ***
(0.0036)
−0.1630 ***
(0.0203)
0.0139 ***
(0.0039)
−0.1185 ***
(0.0203)
−0.1046 ***
(0.0203)
Tra0.0027 ***
(0.0010)
0.0189 **
(0.0076)
0.0024 **
(0.0010)
0.0128 **
(0.0051)
0.0152 ***
(0.0052)
Individual fixed effectYESYESYESYESYES
Time fixed effectYESYESYESYESYES
N300300300300300
Note: ***, ** represent significance levels of 1% and 5%, respectively.
Disclaimer/Publisher’s Note: The statements, opinions and data contained in all publications are solely those of the individual author(s) and contributor(s) and not of MDPI and/or the editor(s). MDPI and/or the editor(s) disclaim responsibility for any injury to people or property resulting from any ideas, methods, instructions or products referred to in the content.