Article

A Three-Step System (Biochar and Sand Filtration with Chlorination) for Handwashing Wastewater Treatment and Possible Water Reuse in Rural Schools

1
Centre for Agroecology, Water and Resilience, Coventry University, Wolston Ln, Ryton-on-Dunsmore, Coventry CV8 3LG, UK
2
Centre for Urban Sustainability and Resilience, Department of Civil, Environmental and Geomatic Engineering, University College London, Gower St., London WC1E 6BT, UK
3
UK Biochar Research Centre, School of GeoSciences, University of Edinburgh, King’s Building, Edinburgh EH9 3FF, UK
*
Author to whom correspondence should be addressed.
Sustainability 2026, 18(8), 3964; https://doi.org/10.3390/su18083964
Submission received: 19 January 2026 / Revised: 29 March 2026 / Accepted: 3 April 2026 / Published: 16 April 2026

Abstract

School handwashing facilities in rural areas without piped water and drainage systems often discharge wastewater directly into the ground, leading to environmental contamination and loss of a valuable water resource, particularly in water-scarce regions. This study evaluates a decentralised three-stage handwashing wastewater treatment system combining biochar and sand filtration with chlorination. The integrated system effectively improved water quality by reducing turbidity, colour, suspended solids, nutrients, organic matter, and microbial contamination. While biochar and sand filtration provided substantial physicochemical treatment, chlorination was essential to ensure complete microbial inactivation. The treated water met several water quality standards for potable use (handwashing only) set by the World Health Organization (WHO) and the United States Environmental Protection Agency (USEPA) standards. Additionally, it complied with international guidelines for greywater reuse in toilet flushing, irrigation, and floor washing. This innovative water treatment strategy could help clean and reuse handwashing wastewater on-site. This could provide rural schools with clean water to support water needs in water shortage periods, such as hand hygiene, garden irrigation, toilet flushing, and floor washing. Overall, integrating biochar and sand filtration with disinfection could help remote rural schools recover water, advancing towards the achievement of the Sustainable Development Goals (SDG) for good health (SDG 3), clean water and sanitation (SDG 6), and sustainable communities (SDG 11).

1. Introduction

Nearly 4 billion people face critical water shortages for at least one month every year [1]. Each year, more people are affected as global freshwater scarcity intensifies due to climate change, severe droughts, increasing population, higher demand, and inadequate water management [2]. Global water shortages currently restrict access to clean water for potable practices [3]. Globally, one in three people lacks access to safe potable water [4]. Within rural areas, 50% of the population faces issues with having readily available water on-site, and a staggering 80% are without access to uncontaminated water [4]. Unfortunately, the fast depletion of freshwater resources combined with limited access to clean potable water constrains fundamental hygiene routines, such as handwashing in rural schools, thereby increasing the prevalence of waterborne diseases among children in these areas.
By the year 2019, approximately 820 million children worldwide did not have access to handwashing facilities at school with soap and clean water [5]. Among global rural schools, only 34% of them had basic hygiene services [6]. Children living in rural areas are at higher risk of infection with waterborne diseases like cholera, typhoid fever, and diarrhoea, than children in urban areas. For instance, diarrhoea causes illness and mortality in 760,000 children under the age of five worldwide [7]. To overcome this scenario, several efforts have focused on increasing the amount of basic fixed or mobile group handwashing facilities at schools such as sinks with taps, buckets with taps, and tippy-tap designs [8]. Although these types of handwashing facilities contribute to ensuring handwashing practices, the handling and disposal of the wastewater produced from handwashing have begun to attract attention lately.
In rural locations without piped drainage infrastructure, the handwashing wastewater from sinks with taps, buckets equipped with taps, or tippy-taps at schools is typically discharged on the ground [9]. This damages the soil quality, contaminates both surface and groundwater sources, and fosters breeding conditions for disease-carrying mosquitoes, posing risks to public health [10]. Given the ongoing water scarcity in the world and the restricted access to safely managed water for hygiene practices, the discharge of untreated handwashing wastewater directly onto the ground constitutes a waste of low-pollution water [11]. Within the framework of a circular water economy, handwashing wastewater could undergo on-site treatment to eliminate impurities and restore its quality for further water reuse, particularly in rural school settings grappling with water shortages and insufficient access to clean water [12]. However, to this point, there has been limited research dedicated to exploring, deploying, and conducting field tests on on-site handwashing wastewater treatment systems designed for the reuse of treated water in public areas without piped drainage infrastructure.
Internationally, pioneering developments in portable handwashing units with integrated on-site wastewater treatment for urban settings have emerged from France (Gravit’eau), Switzerland (Autarky), and Japan (WOTA) [13,14,15]. Typically, handwashing wastewater undergoes a multi-stage treatment process that encompasses a sediment or grease trap, membrane filtration, reverse osmosis, physical filtration, and disinfection [14]. This comprehensive approach ensures the production of high-quality water, suitable for reuse in handwashing activities. Nonetheless, the use of such multi-stage treatment systems is predominantly feasible in high-income countries due to their reliance on advanced and costly water purification technologies. These systems are usually energy-intensive, require significant maintenance, rely on piped clean water and drainage networks, and their application is further constrained by local regulations governing the reuse of treated water [16]. Therefore, there is a need to explore and develop alternative handwashing wastewater treatment systems for communities located in areas facing water scarcity and lacking water and drainage infrastructure, particularly in low- and middle-income nations. Contrary to current treatment systems, alternative handwashing wastewater treatment systems should be cost-effective, utilise bio-based materials sourced locally, require minimal to no energy and maintenance, and adhere not just to a single country’s regulations but also to international standards for clean water quality.
Biochar filtration employs biochar, a carbon-dense, porous material created through the thermal breakdown of organic waste biomass (agriculture and forestry residues) without oxygen [17]. Biochar filtration relies on the valuable physicochemical properties of biochar for wastewater treatment such as high surface area, high porosity, high cation exchange capacity, mineral composition, and abundant reactive surface functional groups [18]. These attributes make it highly effective in adsorbing a wide range of contaminants, including organic and inorganic materials, as well as pathogens, from wastewater. Recent research found biochar filtration is effective at removing physical (colour, turbidity, and suspended solids) and chemical (organic matter, hardness, nitrates, and phosphates) pollution from handwashing wastewater [19]. Nevertheless, eliminating and inactivating pathogens like E. coli, especially when present in high concentrations in handwashing wastewater, remains a significant challenge. Biochar represents a particularly promising material for decentralised water treatment due to its low cost and the widespread availability of feedstocks [20]. It can be produced from locally available agricultural residues such as rice husk, coconut shells, wheat straw, sugarcane bagasse, soybean stalks, and other biomass waste using small-scale pyrolysis unit reactors [21,22]. This makes biochar highly suitable for rural areas and low- and middle-income countries, where access to centralised or/and advanced treatment technologies is limited. In addition, biochar production contributes to waste valorisation and circular economy practices, enhancing environmental sustainability while providing an accessible treatment material [23].
Conversely, sand filtration is recognised for its ability to eliminate pathogens (including bacteria, viruses, and protozoa) and suspended solids from water. This method is popular in developing countries because of its straightforward design, ease of operation, minimal energy and chemical needs, and lack of recurring expenses [24]. Recent research has shown that sand filtration successfully removes 4 log E. coli from an influent greywater load, meeting the South African standards for potable water quality [25]. Despite this, to date, the study of a small-scale, low-cost, and sustainable treatment system consisting of biochar filtration and sand filtration for handwashing wastewater cleaning has not been fully explored.
Therefore, the main goal of this study is to evaluate the removal efficiency of a three-step treatment system consisting of biochar filtration, sand filtration, and chlorination in removing physical, chemical, and microbial pollutants from handwashing wastewater for possible water reuse in rural schools. Given the need to recover water from reusable sources in rural areas, this study seeks to determine if the quality of the treated water is suitable for reuse in handwashing purposes, according to the potable water quality standards established by the World Health Organization (WHO) and the United States Environmental Protection Agency (USEPA). Moreover, this research aims to evaluate whether the treated water meets the criteria for reuse in restricted activities such as toilet flushing, garden irrigation, and floor washing, adhering to international guidelines for greywater reuse.
This research has the potential to aid rural school communities in low- and middle-income regions suffering from water scarcity and the absence of piped water and drainage infrastructure. It could ensure the availability of clean water for hand hygiene, reducing the incidence of waterborne diseases among rural schoolchildren, and provide water to supply rural schools’ water needs for toilet flushing, garden irrigation, and floor washing. Additionally, this study could demonstrate the potential of using local resources such as agricultural by-products to produce biochar and use it as a bio-based adsorbent material to treat handwashing wastewater on-site. Overall, this approach could enable these communities to reclaim water resources following the circular water economy model, thereby facilitating progress towards the Sustainable Development Goals (SDGs) focused on ensuring good health (SDG 3), access to clean water and sanitation (SDG 6), and the development of sustainable cities and communities (SDG 11).

2. Materials and Methods

2.1. Filtration Media Selection and Characterisation

The filtration media consisted of gravel, silica sand, glass wool, and wheat straw biochar. Commercially available gravel with particle sizes ranging from 0.25 to 0.5 mm was obtained from Sakana, UK. White silica sand (99.7% SiO2) of 0.25–0.5 mm particle size and 40–160 m2/g surface area was sourced from Trustleaf, Leaf Crafts Ltd., Cambridgeshire, UK. Glass wool, comprised of nitrile rubber fibres with diameters ranging from 15 to 25 µm, was acquired from Merck Life Science UK Limited, Gillingham, Dorset, UK. Wheat straw biochar was chosen for its effective physicochemical properties in removing pollutants from handwashing wastewater [19]. Biochar production took place in a pilot-scale pyrolysis reactor at the UK Biochar Research Centre (University of Edinburgh, UK) using wheat straw residues as feedstock material. The choice of wheat straw as the feedstock material for biochar production was driven by the ample availability of this agricultural waste during the harvesting season in numerous low- and middle-income countries [20]. The biochar was produced under the following conditions: a temperature of 550 °C, a heating rate of 80 °C/min, and a residence time of 15 min. Biochar pellets, sized between 10 and 15 mm, were produced at 550 °C to achieve desirable physicochemical properties for wastewater treatment such as high surface area, high porosity, and abundant surface functional groups [26]. The biochar pellets were ground to a preferred particle size of 1.25 mm, in agreement with the reported optimised biochar particle size for handwashing treatment [19]. The BET surface area of wheat straw biochar was 26.40 m2/g. The gravel, silica sand, and biochar materials were rinsed with deionised water to eliminate impurities, dried at 60 °C for 24 h, and allowed to cool in a desiccator at room temperature (20 °C) for 1 h before use. Fourier-transform infrared spectroscopy (FTIR) was employed to identify the surface functional groups of the filtration media (biochar sample) before and after the handwashing wastewater treatment. The characterisation methods for the filtration materials and the full details of their characteristics can be found in Bautista Quispe et al. [19]. The natural properties of the biochar and silica sand were deliberately maintained by avoiding chemical processes like activation. This choice was made to keep the production and utilisation of these materials economically sustainable, ultimately increasing their accessibility for communities in low and middle-income countries.

2.2. Synthetic Handwashing Wastewater

A mixture of chemical substances, commercial products, and microbial culture was employed to recreate the characteristics of generic handwashing wastewater from sinks. Synthetic greywater recipes developed and used for testing purposes by different researchers were adapted and modified to formulate a customised recipe for synthetic handwashing wastewater [27,28]. The recipe included sodium dodecyl sulphate (100 mg/L), kaolin clay (150 mg/L), cellulose (55 mg/L), glycerol (75 mg/L), lactic acid (30 mg/L), sodium hydrogen carbonate (25 mg/L), sodium chloride (20 mg/L), and E. coli DH5α strain (10 mL/L). These ingredients were selected for their capacity to imitate the common components present in real handwashing wastewater such as anionic surfactants, suspended solids, moisturising agents, naturally occurring skin acids, and pathogens [29]. The ingredients were mixed in tap water at room temperature (20 °C) until all the powdered components were entirely dissolved. The E. coli inoculum was given time to reach room temperature before being added to the mixture. This was done to minimise the risk of damage resulting from abrupt temperature fluctuations. Synthetic handwashing wastewater was prepared and used on the same day without storage. This prevented any alterations in the physicochemical and microbial properties of the wastewater [30].

2.3. Experimental Set-Up and Operation of Filters

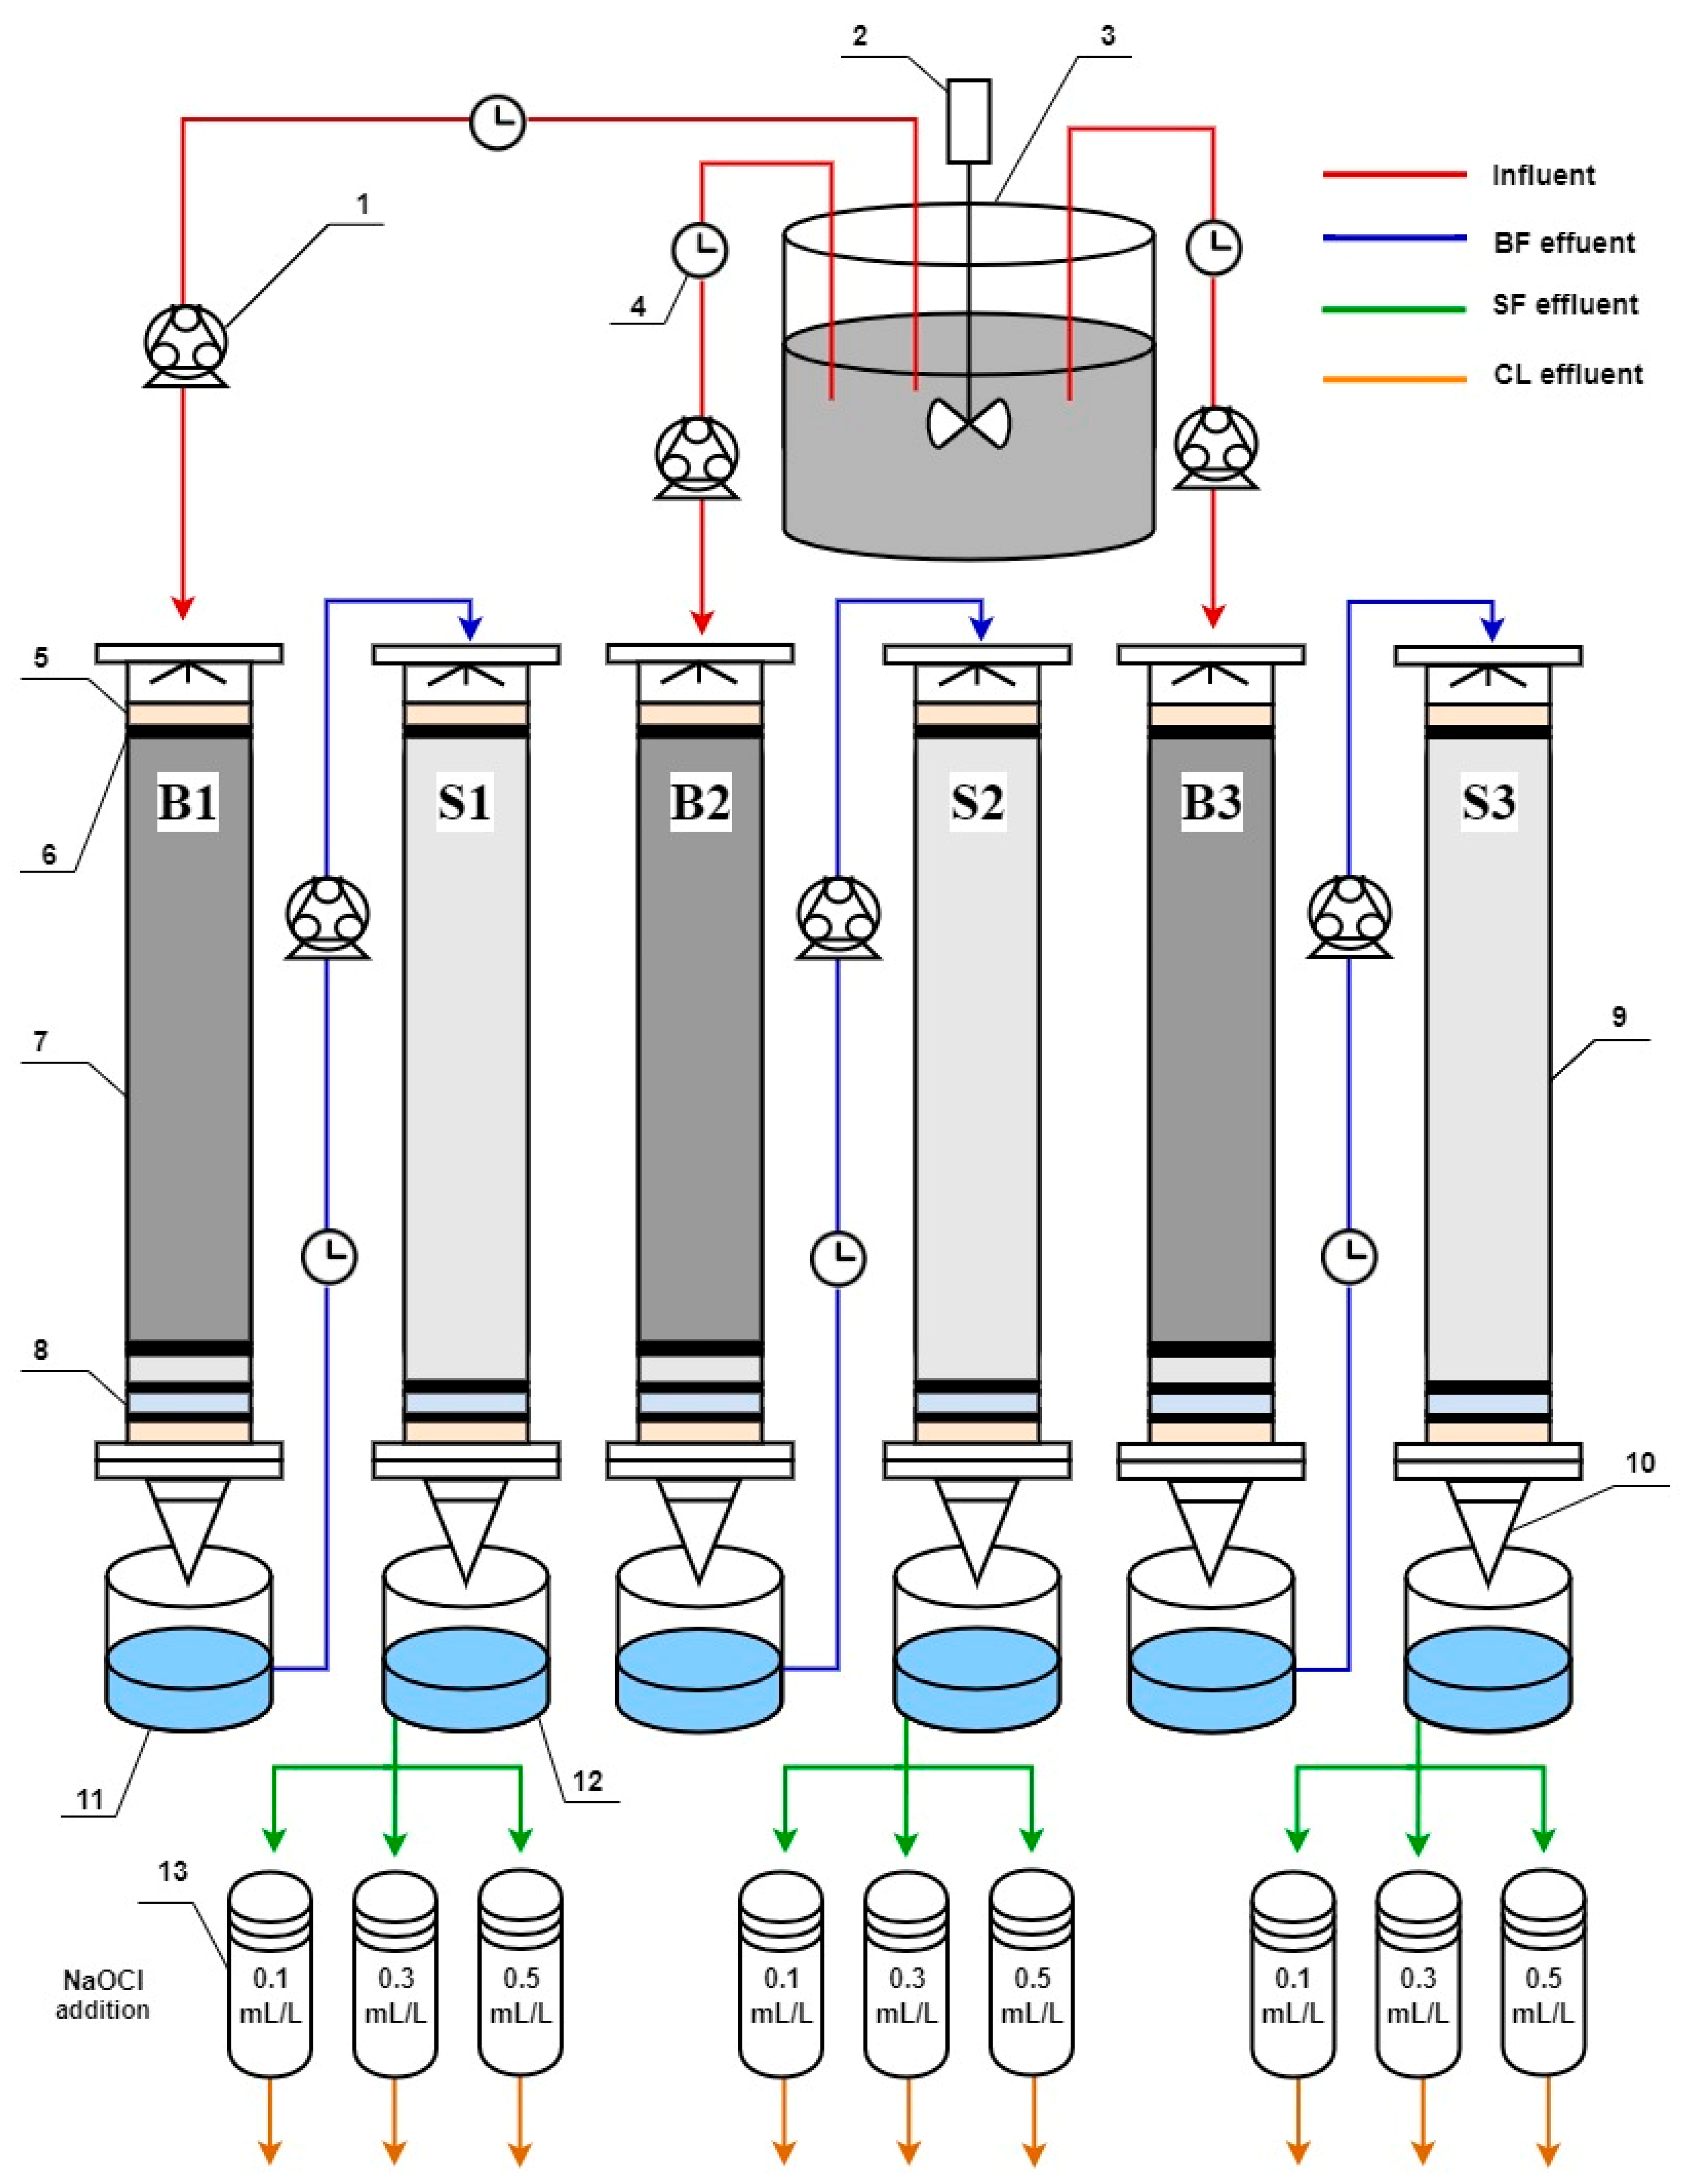
Figure 1 illustrates the experimental configuration and setup. The treatment system for synthetic handwashing wastewater is comprised of sequential processes operated as a continuous-flow system, starting with biochar filtration as the primary step, followed by sand filtration as the secondary step, and chlorine-based disinfection as the tertiary step. Each treatment step was performed in triplicate. Biochar filtration targets the removal of dissolved organic matter, nutrients, suspended solids, and E. coli in wastewater [18]. Sand filtration serves to polish the biochar filter effluent; thus, it targets the removal of the residual suspended solids, E. coli, and particulate matter [24]. Meanwhile, chlorination targets the elimination of any residual E. coli.

2.3.1. Biochar and Sand Filters

A set of three biochar filters and three sand filters were established for this experiment. The biochar filter was constructed according to an optimised configuration previously reported [18]. The biochar filter was fabricated from an acrylic tube with a length of 50 cm and a diameter of 4.5 cm. The upper part of the biochar filter contained a 2.5 cm layer of gravel (50 g), while the lower section was structured with layers from bottom to top: 2.5 cm of washed gravel (80 g), followed by a 2 cm layer of glass wool (4 g), and a 4 cm layer of silica sand (90 g). Placing gravel at the top facilitated even distribution of the influent, prevented the flotation of biochar particles, and minimised water evaporation. Meanwhile, the gravel at the bottom promoted smoother effluent flow [31,32]. The middle section was packed with a 30 cm layer of biochar media of 1.25 mm particle size (220 g). The sand filter was constructed using the same material and dimensions as the biochar filter. The setup of media layers in the sand filter was similar to that in the biochar filter. The upper and lower sections each contained a 2.5 cm layer of gravel. The middle part contained a 30 cm layer of small, washed sand media sized between 0.25 and 0.5 mm (650 g) [33]. The lower section included a 2.5 cm layer of washed gravel, followed by a 2 cm layer of glass wool. In both types of filters, a circular stainless-steel wire mesh of 4.5 cm diameter was positioned as a separator between layers to prevent the displacement of smaller particle-size media [34]. Before the formal filtration experiments, all filtration columns were preconditioned by flushing with deionised water, ensuring the removal of loosely bound particles and the stabilisation of the filter media prior to operation. Aluminium foil was utilised to envelop the biochar and sand filters, preventing the transmission of light that could otherwise promote the growth of algae [35]. A sterile plastic funnel with a 6 cm diameter was securely attached to the lower section of all filters using jubilee clips. The filters were supported on metal laboratory stands. The three biochar filters were labelled as B1, B2, and B3, whereas the three sand filters were identified as S1, S2, and S3 (Figure 1).
Figure 1. Schematic diagram of the experimental set-up. BF: biochar filter; SF: sand filter; CL: chlorination. Components: (1) peristaltic pump; (2) stirrer; (3) container for influent handwashing wastewater; (4) timer; (5) 2.5 cm gravel layer; (6) stainless-steel wire mesh; (7) 30 cm biochar layer; (8) 2 cm glass wool layer; (9) 30 cm silica sand layer; (10) funnel; (11) container for biochar filtration effluent; (12) container for sand filtration effluent; and (13) container for chlorination tests.
Sustainability 18 03964 g001

2.3.2. Feeding of Synthetic Handwashing Wastewater

The synthetic handwashing wastewater was prepared and stored in a 10 L cylindrical container. To prevent solid precipitation on the container floor and maintain the uniform properties of the synthetic handwashing wastewater during filter feeding, the synthetic handwashing wastewater was stirred every 10 min. The filters were fed synthetic handwashing wastewater daily, except on weekends, over 31 days. The set of three biochar filters (B1, B2, and B3) were continuously fed under non-saturated conditions with 3 L of synthetic handwashing wastewater at a constant flow rate of 1 L/h through a silicone tube of 4 mm diameter. The selection of flow rate was based on optimal values reported in previous studies [19]. The calculated hydraulic retention time (HRT) for the biochar-based filter is 0.65 h. Each effluent from the set of three biochar filters was stored in a separate sterile container and simultaneously fed into the set of three sand filters (S1, S2, and S3). The sand filters were fed at the same flow rate as the biochar filters. The calculated hydraulic retention time (HRT) for the sand-based filter is 0.59 h. Likewise, the effluent from the group of three sand filters was collected in separate containers, sealed, and subsequently employed in chlorination experiments. The water effluent samples (1 L) from both biochar and sand filtration were analysed either upon collection or within a 24 h timeframe. When refrigeration was necessary, the samples were stored at a temperature of 4 °C. Given that this study aims to treat handwashing wastewater for reuse in handwashing (a lack of specific water quality standards for the reuse of treated handwashing wastewater), the experiment was stopped when the visual characteristics (e.g., colour and turbidity) of the treated water seemed to change, suggesting an approximation to the maximum acceptable limits for potable water.

2.3.3. Disinfection Trials with Sodium Hypochlorite

The disinfection experiments were carried out on the secondary treated effluents from the sand filters using domestic sodium hypochlorite (NaOCl). NaOCl provides a wide spectrum of antimicrobial effectiveness, high solubility in water, and a relatively low level of toxicity to humans at recommended concentrations; it is also readily available and cost-effective for many households [36,37]. E. coli was selected as an indicator organism of the disinfection efficiency of NaOCl [38]. Several experimental trials were established to assess the quantity of NaOCl (4.53% wt/vol) needed for E. coli inactivation. The studied NaOCl concentrations were 0.1 mL/L, 0.3 mL/L, and 0.5 mL/L. The desired range of the final residual chlorine concentration ranges from 0.5 mg/L to 5 mg/L, according to the potable water quality standard from WHO (Table 1). Based on previous studies, this range of residual chlorine concentration reduces the risks of microbial regrowth and recontamination [37].
The disinfection of the secondary treated effluents from the sand filters was performed immediately after collection. All experimental trials were performed in triplicate. The three different doses of NaOCl were added to three sterile glass beakers containing 200 mL of secondary treated effluent. The contents were mixed thoroughly for 30 min using an orbital shaker Megafuge 16R (Thermo Fisher Scientific Inc., Waltham, MA, USA) at 100 rpm mixing speed [47]. A volume of 10 mL of the disinfected effluent was poured into a sterile beaker to analyse the free residual chlorine. A 0.1 mL volume of a 10% solution of sodium thiosulphate (Na2S2O3) was added to the remaining secondary treated effluent. This neutralised the bactericidal impact of any residual chlorine and allowed the determination of the actual E. coli concentration in the water sample [48]. To maintain sterility, all materials utilised in the experiments underwent autoclaving at 121 °C for 15 min. The experiments were conducted at room temperature.

2.4. Influent and Effluent Quality Analysis

The water samples analysis took place at the High-performance Analytical Hub at the Centre for Agroecology, Water and Resilience (Coventry University, UK). The removal efficiency of the combined treatment system was determined through water quality analysis of both the influent and effluent samples. The physical parameters analysed were temperature, pH, electrical conductivity, colour, turbidity, and total suspended solids (TSS). Temperature, pH, and electrical conductivity measurements were conducted using a laboratory pH meter from Hanna Instruments Ltd., Leighton Buzzard, Bedfordshire, UK. These parameters monitored the stability of the treatment system throughout the testing period. Turbidity and colour were assessed photoelectrically (Palintest Water Technologies, Gateshead Tyne & Wear, UK), whereas TSS were examined through gravimetric analysis [49]. These parameters monitored variations in the visual characteristics (appearance) of the treated effluents. The chemical parameters analysed were pH, chemical oxygen demand (COD), and hardness. The concentration of these parameters was established through the photometry method using Palintest water test kits from Palintest Water Technologies, Gateshead Tyne & Wear, UK. COD measured the amount of organic matter, both biodegradable and non-biodegradable. Hardness removal served as an indirect indicator of the capacity of the treated water to form foam when in contact with soap. This is relevant to allow the reuse of the treated water for cleaning purposes, including handwashing and floor washing.
The nutrient content was measured through the analysis of phosphates (PO43−) and nitrates (NO3). Both parameters were determined through the photometry method (Palintest Water Technologies, Gateshead Tyne & Wear, UK). The examination of nutrients aimed to comprehend the capacity of the treatment system to retain nutrients, particularly through the biochar filtration process. This can provide insights into the feasibility of repurposing the utilised biochar media in agricultural applications. The microbial parameter analysed was the E. coli count. A volume of 1 mL from the water sample was inoculated into a 3M Petrifilm plate and subsequently incubated at a temperature of 42 °C ± 1 °C for 24 h ± 2 h (3M, Bracknell, UK). The pH of the sample was adjusted to the range of 6.5–7.5 for optimal E. coli growth, by adding 0.1 M solutions of hydrochloric acid (HCl) or sodium hydroxide (NaOH). The enumeration of E. coli colonies served as a microbial indicator of faecal contamination in the water samples. To ensure physiological adaptation and growth, E. coli was given a one-week acclimation period. Consequently, the analysis of E. coli count commenced one week later than the examination of other water quality parameters. The removal efficiency of the coupled treatment system for the water quality parameters, excluding E. coli, was calculated using Equation (1). The reduction of E. coli was determined using Equation (2).
R e m o v a l   % = [ ( C i C f ) / C i ] × 100
L o g   R e d u c t i o n = L o g 10 i n f l u e n t L o g 10 e f f l u e n t  
where Ci indicates the influent concentration and Cf indicates the effluent concentration.
The present study identified a lack of specific water quality standards for the reuse of treated handwashing wastewater. Therefore, guidelines for good-quality water (such as potable water) and improved-quality water (such as treated greywater) were employed as reference guidelines to assess the quality of the treated synthetic handwashing wastewater and its suitability for water reuse applications. Potable water guidelines from WHO and USEPA served as the reference standards of good-quality water for handwashing purposes. Similarly, given the lack of guidelines for treated greywater reuse in restricted activities such as toilet flushing, garden irrigation, and floor washing, this study used international guidelines as the reference standards for improved-quality water. These included available guidelines from China, Japan, the United States of America (USA), Malaysia, Jordan, Italy, Canada, Tunisia, and Oman.

2.5. Statistical Analysis

Descriptive analyses identified the mean and standard deviation values of removal efficiency by the biochar filtration, sand filtration, and chlorination steps. A t-test was conducted to assess the significance of differences between the untreated influent and the biochar filter effluent. Another t-test was conducted to assess the significance of differences between the biochar filter effluent and the sand filter effluent. This was carried out to identify significant removal efficiencies across the treatment stages. Additionally, a one-way ANOVA test measured the overall variation between and within the proposed chlorination treatments for the secondary treated effluent. The significance level for all the statistical tests was 5% (p < 0.05).

3. Results and Discussion

3.1. Characteristics of Untreated Synthetic Handwashing Wastewater

Table 2 provides the minimum, maximum, and average concentration for the physical, chemical, and microbial characteristics of untreated synthetic handwashing wastewater. Regarding the physical characteristics, the average temperature, turbidity, colour, and TSS were 18.5 ± 0.0 °C, 245.2 ± 14.0 NTU, 1305.7 ± 341.5 Pt/Co and 388.5 ± 17.4 mg/L, respectively. In terms of chemical composition, the average pH, electrical conductivity, hardness, and COD were 8.1 ± 0.0, 585.4 ± 0.4 μS/cm, 327.4 ± 19.1 mg/L CaCO3 and 455.5 ± 26.8 mg/L, respectively. The average content of nitrates and phosphates was 11.2 ± 0.4 mg/L NO3 and 94.3 ± 7.8 mg/L PO43−, respectively. Concerning microbial contamination, the average E. coli concentration was 6.1 ± 0.0 Log10 CFU/mL (Table 1). As anticipated, the concentration of pollutants in the synthetic handwashing wastewater was lower than other types of greywaters such as from bathrooms [50], washing machines [51], and kitchen sinks [52]. The characteristics of the synthetic handwashing wastewater aligned with the ranges found in existing studies for actual handwashing wastewater (Table 1). This is observed for most of the water quality parameters such as turbidity, colour, COD, and TSS. This implied that the elaborated recipe for synthetic handwashing wastewater could accurately replicate the characteristics of real handwashing wastewater. Regarding temperature and electrical conductivity, existing literature fails to report the values for these parameters, making comparison a challenge. The concentrations of phosphates and hardness were above the real values in the reported literature. This can be related to the use of salts for the preparation of synthetic handwashing wastewater (e.g., sodium hydrogen carbonate and sodium chloride). Similarly, the E. coli concentration (6.1 Log10 CFU/mL) was found to be above the reported values of up to 2543 CFU/100 mL (3.4 Log10 CFU/mL). The high influent concentration of phosphates, hardness, and E. coli were used as indicators for extreme pollution scenarios. In general, the untreated synthetic handwashing wastewater exhibited quality levels that exceeded the acceptable limits outlined for potable water use in handwashing, as per guidelines from WHO and USEPA. Furthermore, the influent characteristics exceeded the acceptable quality standards for water reuse in toilet flushing, garden irrigation, and floor washing, as per global guidelines for the reuse of treated greywater (Table 1).

3.2. Performance of the Integrated Biochar and Filtration Systems

3.2.1. Appearance

This study assessed the removal of turbidity, colour, and TSS as indicators of changes in the visual quality of handwashing wastewater. Handwashing wastewater is usually of cloudy and soapy appearance. Anionic surfactants from soap, suspended solids, and dissolved matter (inorganic and organic) are the primary contaminants associated with the appearance of handwashing wastewater [62]. In this study, the cloudy and soapy appearance of the synthetically prepared handwashing wastewater was attributed to the presence of sodium dodecyl sulphate (serving as an anionic surfactant), kaolin clay (representing inorganic matter), and cellulose (indicating organic matter).
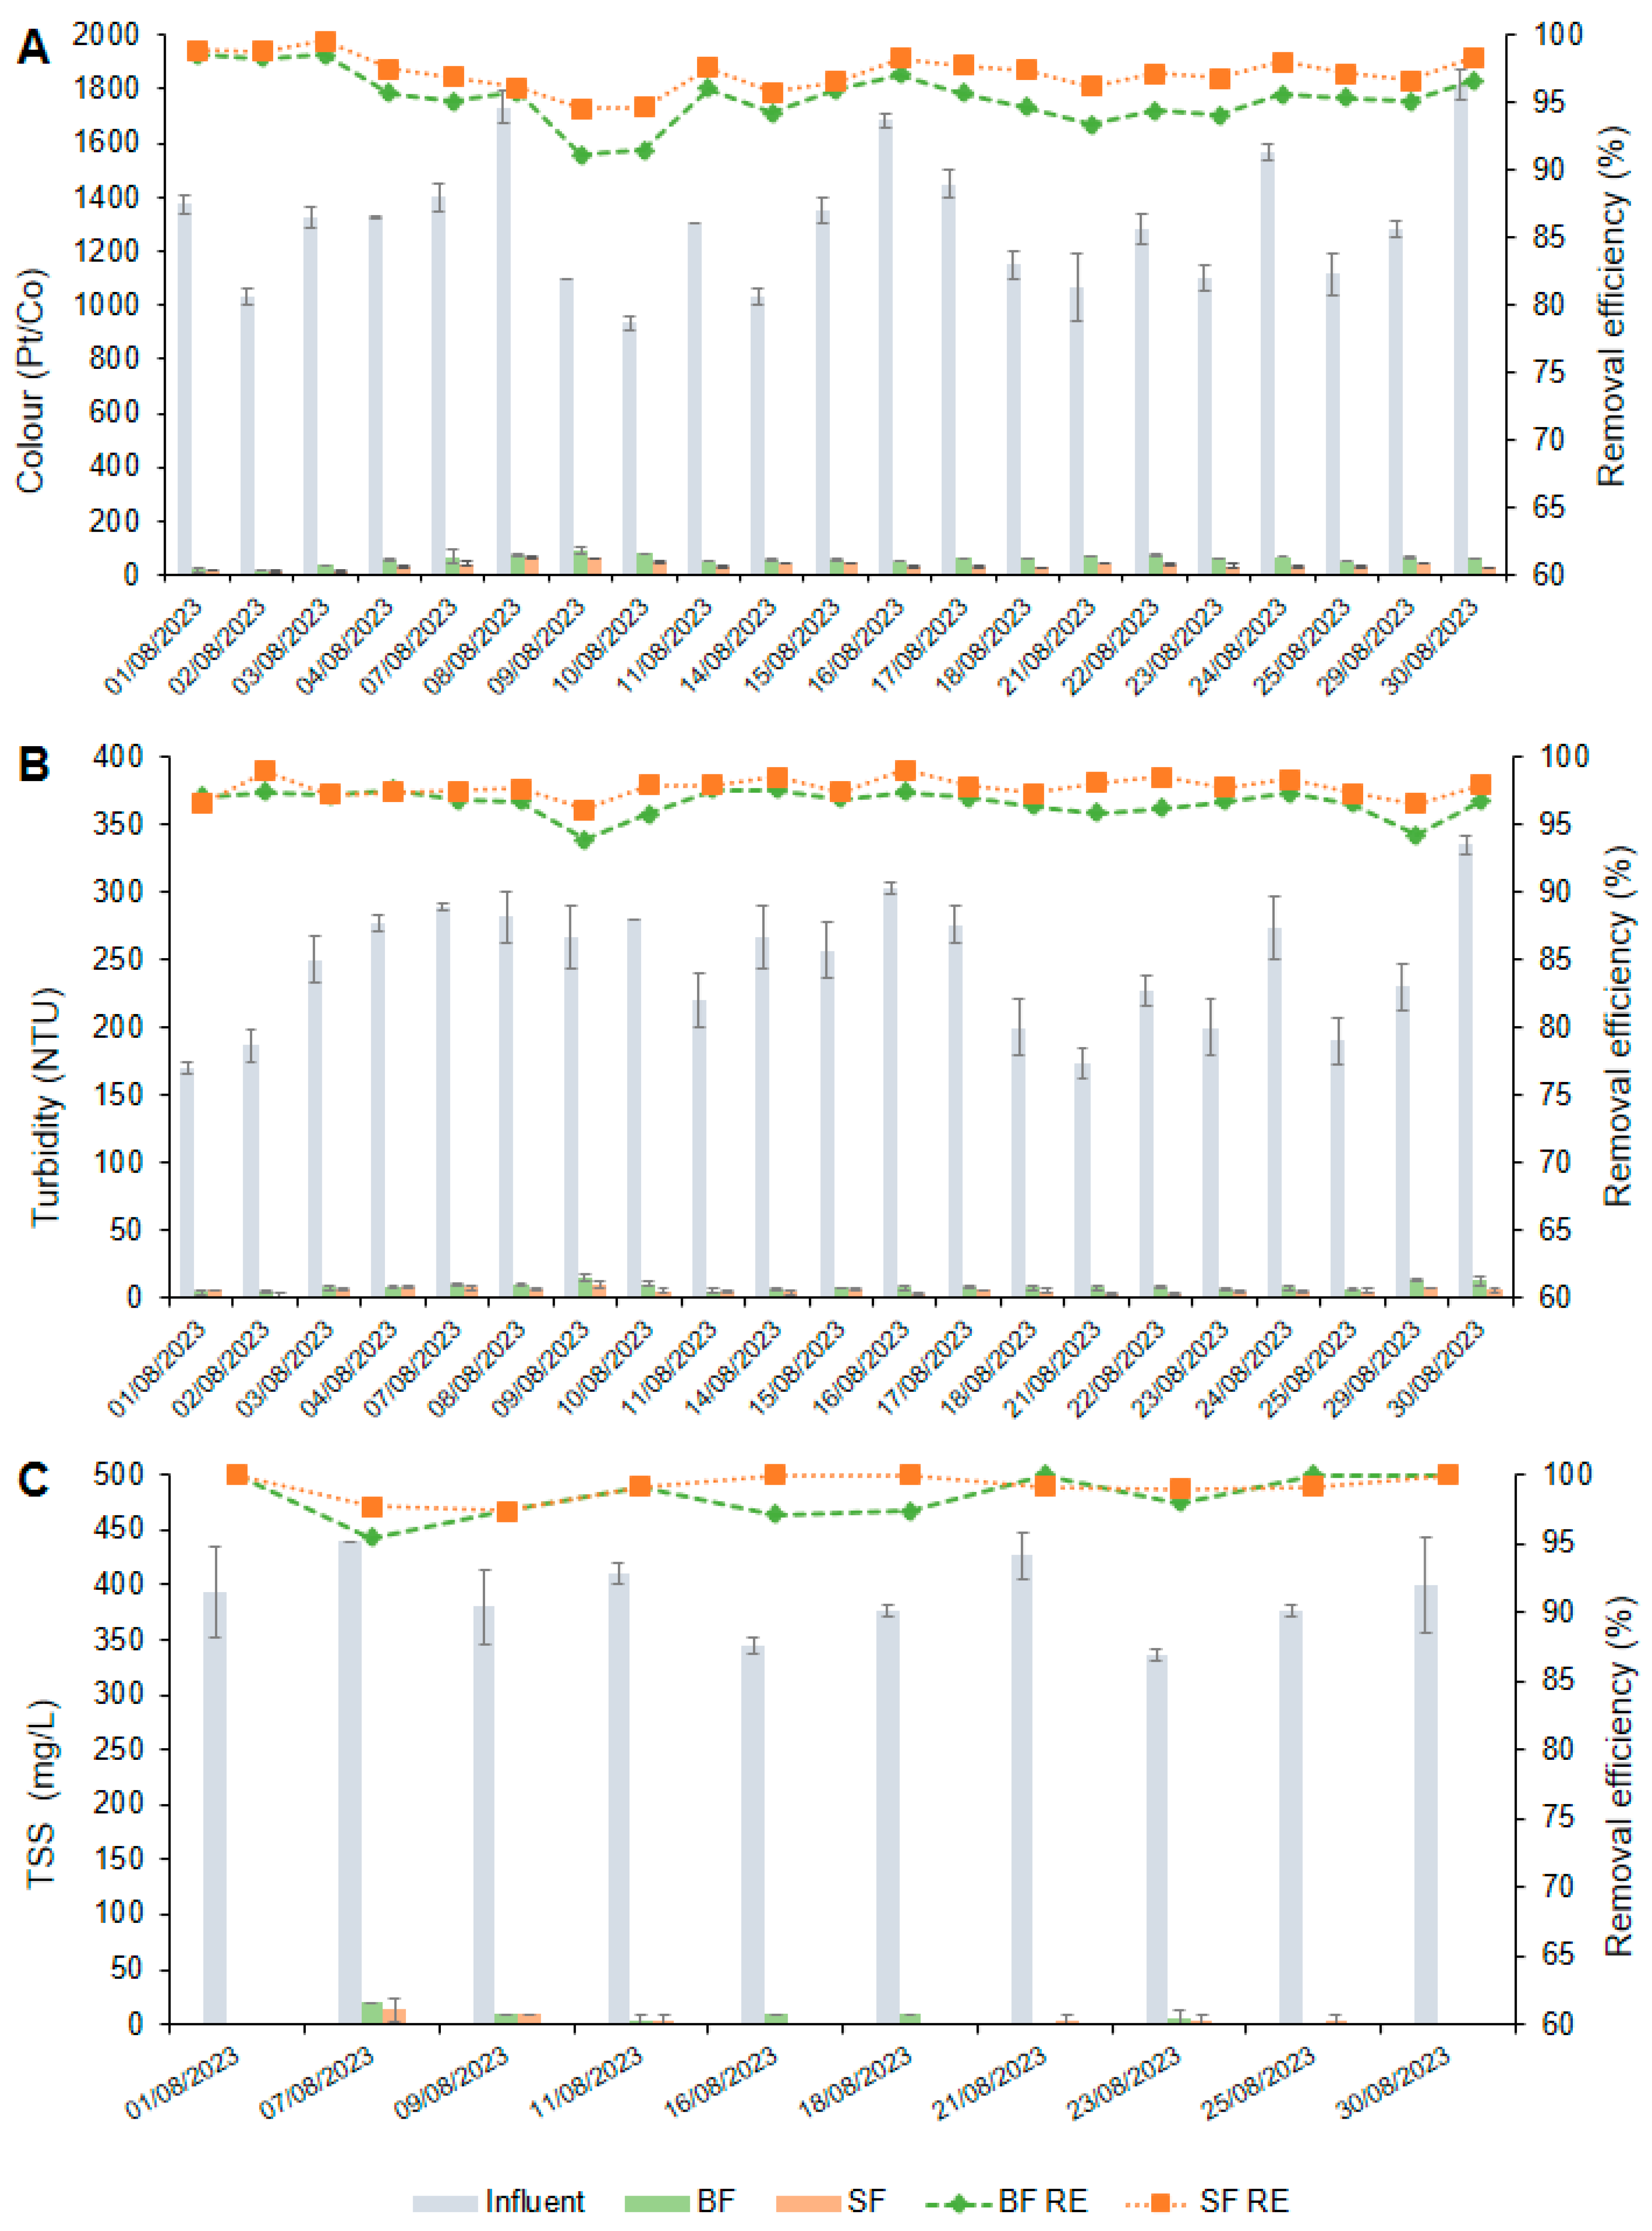
In terms of colour, the influent colour showed fluctuations over time, with a minimum and maximum level of 933.3 Pt/Co and 1816.7 Pt/Co, respectively (Figure 2A). Overall, the effluent colour from the biochar and sand filters remained stable over the testing period. The minimum and maximum colour levels reported in the biochar filter effluent were 17.5 Pt/Co and 91.7 Pt/Co; meanwhile, the sand filter effluent reported minimum and maximum colour values of 11.7 Pt/Co and 66.7 Pt/Co, respectively (Figure 2A; Table S1). The average effluent colour from the biochar filter was 59 ± 4.6 Pt/Co, compared to an average of 35.9 ± 2.9 Pt/Co in the effluent from the sand filter (Table 3). The primary treatment with biochar filtration removed 95.5% of colour from the average influent (1305.7 ± 341.5 Pt/Co). Meanwhile, the secondary treatment with sand filtration removed 39.2% of the colour from the biochar filter effluent (Table 3). In the case of turbidity, the influent turbidity ranged from 170 NTU to 335 NTU (Figure 2B). The effluent turbidity from the biochar and sand filters ranged from 4 NTU to 14.7 NTU and from 2 NTU to 10 NTU, respectively (Figure 2B; Table S1). Overall, the effluent turbidity in both effluents remained stable over time. Turbidity was on average 8.3 ± 1.4 NTU and 5.6 ± 1.2 NTU in the biochar filter effluent and sand filter effluent, respectively (Table 3). Biochar filtration achieved a 96.6% reduction in turbidity, while sand filtration was responsible for a 32.5% decrease. Overall, the role of both biochar and sand filtration systems in eliminating colour and turbidity proved statistically significant (p < 0.0001) (Table 3). Concerning TSS, the influent concentration showed low fluctuation over time, as the range reported was 336.7 mg/L to 440 mg/L (Figure 2C). The effluent TSS showed slight fluctuations at the beginning of the experiment but remained consistent throughout the studied period. Effluent TSS from the biochar and sand filters ranged from 0 to 20 mg/L and from 0 to 13 mg/L, respectively (Figure 2C; Table S1). TSS was on average 6.0 ± 1.2 mg/L and 3.7 ± 3.5 mg/L in the effluents of biochar and sand, respectively. This represented a 98.4% and 38.3% reduction, respectively (Table 3).
In this study, the removal of colour, turbidity, and TSS occurred mainly in the biochar filter (>95%). It is believed that biochar filtration reduces the content of suspended solids and dissolved matter (inorganic and organic) through the mechanisms of agglomeration, precipitation, surface filtration, straining, adsorption, hydrolysis, biofilm adsorption, and biofilm straining [29]. Given the synthetic composition of the handwashing wastewater used, a reduction in these parameters could be associated with the surface filtration and straining of kaolin and the adsorption of sodium dodecyl sulphate onto the biochar surface [62]. In the literature, a limited number of technologies have been studied for treating handwashing wastewater from public spaces such as food markets, taxi parks, schools, and households. Olupot et al. [56] evaluated a two-step system composed of mixed filtration (silica sand, zeolite, and granular activated carbon) and chlorine-based disinfection in Uganda. Reynaert et al. [14] studied a four-step treatment system composed of a biologically activated membrane bioreactor (BAMBi), filtration (granular activated carbon), and electrolysis-based disinfection in Switzerland. Subramanian et al. [63] developed a four-step system consisting of gravel and sand biofiltration, sand biofiltration, aeration, and ozone-based disinfection in India. Overall, the integration of biochar and sand filters achieved comparable effluent quality to the reported literature (Table 3).
Regarding colour, the average concentration observed in the final effluent (35.9 ± 2.9 Pt/Co) was somewhat higher than the results achieved by Olupot et al. [56] and Reynaert et al. [14] who reduced the colour concentration to 10 mg/L Pt/Co (98.1% reduction) and 0 mg/L Pt/Co (100% reduction). The average turbidity of 5.6 ± 1.2 NTU observed after the application of biochar and sand filtration was slightly higher than the final turbidity levels reported by Subramanian et al. [63]. Their treatment system managed to reduce turbidity from 196 NTU to 1.96 NTU, accounting for a reduction of 99%. Furthermore, the average effluent turbidity reported in the present study was comparable to the 5 NTU effluent turbidity (98.5% reduction) from the system studied by Olupot et al. [56], which treated an influent with a turbidity of 348 NTU. Regarding TSS, the average concentration achieved after treatment with biochar and sand filters (3.7 ± 3.5 mg/L) was marginally lower than that reported by Olupot et al. [11], who reduced TSS from 471.6 mg/L to 9.0 mg/L (96% reduction). Overall, combining biochar and sand filtration has proven effective in enhancing the visual qualities of treated water, achieving results comparable to those of recent treatment systems in the literature.
The improvement of the appearance of handwashing wastewater is critical to allow its reuse for handwashing activities and other restricted activities such as garden irrigation, toilet flushing and floor washing. Prior research has indicated that treated greywater with an unappealing appearance tends to be less socially accepted for reuse [64]. Figure 2 and Figure S1 show the levels of colour, turbidity, and TSS in the influent and effluents from biochar and sand filters and their compliance with the acceptable limits for potable water use in handwashing and treated greywater reuse in restricted applications. Overall, the levels of colour in the effluent from biochar filtration exceeded the acceptable limits for potable water (WHO and USEPA: ≤10 Pt/Co) and greywater reuse in toilet flushing and general irrigation (China: ≤30 Pt/Co). However, after additional treatment through the sand filter, the colour level dropped to just above the permissible range for greywater reuse yet remained too high for potable use. In terms of turbidity, biochar filtration improved the quality of the influent to permissible levels for treated greywater reuse in the irrigation of cooked vegetables and playgrounds (Jordan: ≤10 NTU). Meanwhile, sand filtration continued improving the quality of the biochar filter effluent to desirable levels for potable purposes (WHO: ≤5 NTU) during the tested period (Figure S1). As anticipated, the effluent quality from the biochar and sand filters improved at the start of the second week of testing. This improvement could be linked to the initial flushing out of fine biochar and sand particles during the early days of exposure to handwashing wastewater. It is important to highlight that the sand filter appeared to reach its maximum capacity to remove turbidity to a desirable level of up to 5 NTU for potable water for handwashing, by the fourth week of testing (Figure S1). This is because the turbidity content in the effluent from the sand filter was observed to rise and be above the limit range for potable purposes by the end of the testing period. The concentrations of TSS in the effluents from both the biochar and sand filters were below the permissible levels for potable water, as defined by WHO (≤25 mg/L), and for treated greywater reuse in applications such as floor washing (Canada: ≤10 mg/L). Additionally, these concentrations met the water quality standards for the irrigation of vegetables likely to be eaten raw (Oman: ≤15 mg/L) or those destined to be cooked or processed (Oman: ≤30 mg/L). Overall, the results demonstrate that a two-step system of biochar and sand filtration can effectively treat handwashing wastewater while ensuring that colour, turbidity, and TSS remain below the acceptable water quality standards for potable water for handwashing and treated greywater reuse in restricted activities.

3.2.2. Chemical Composition

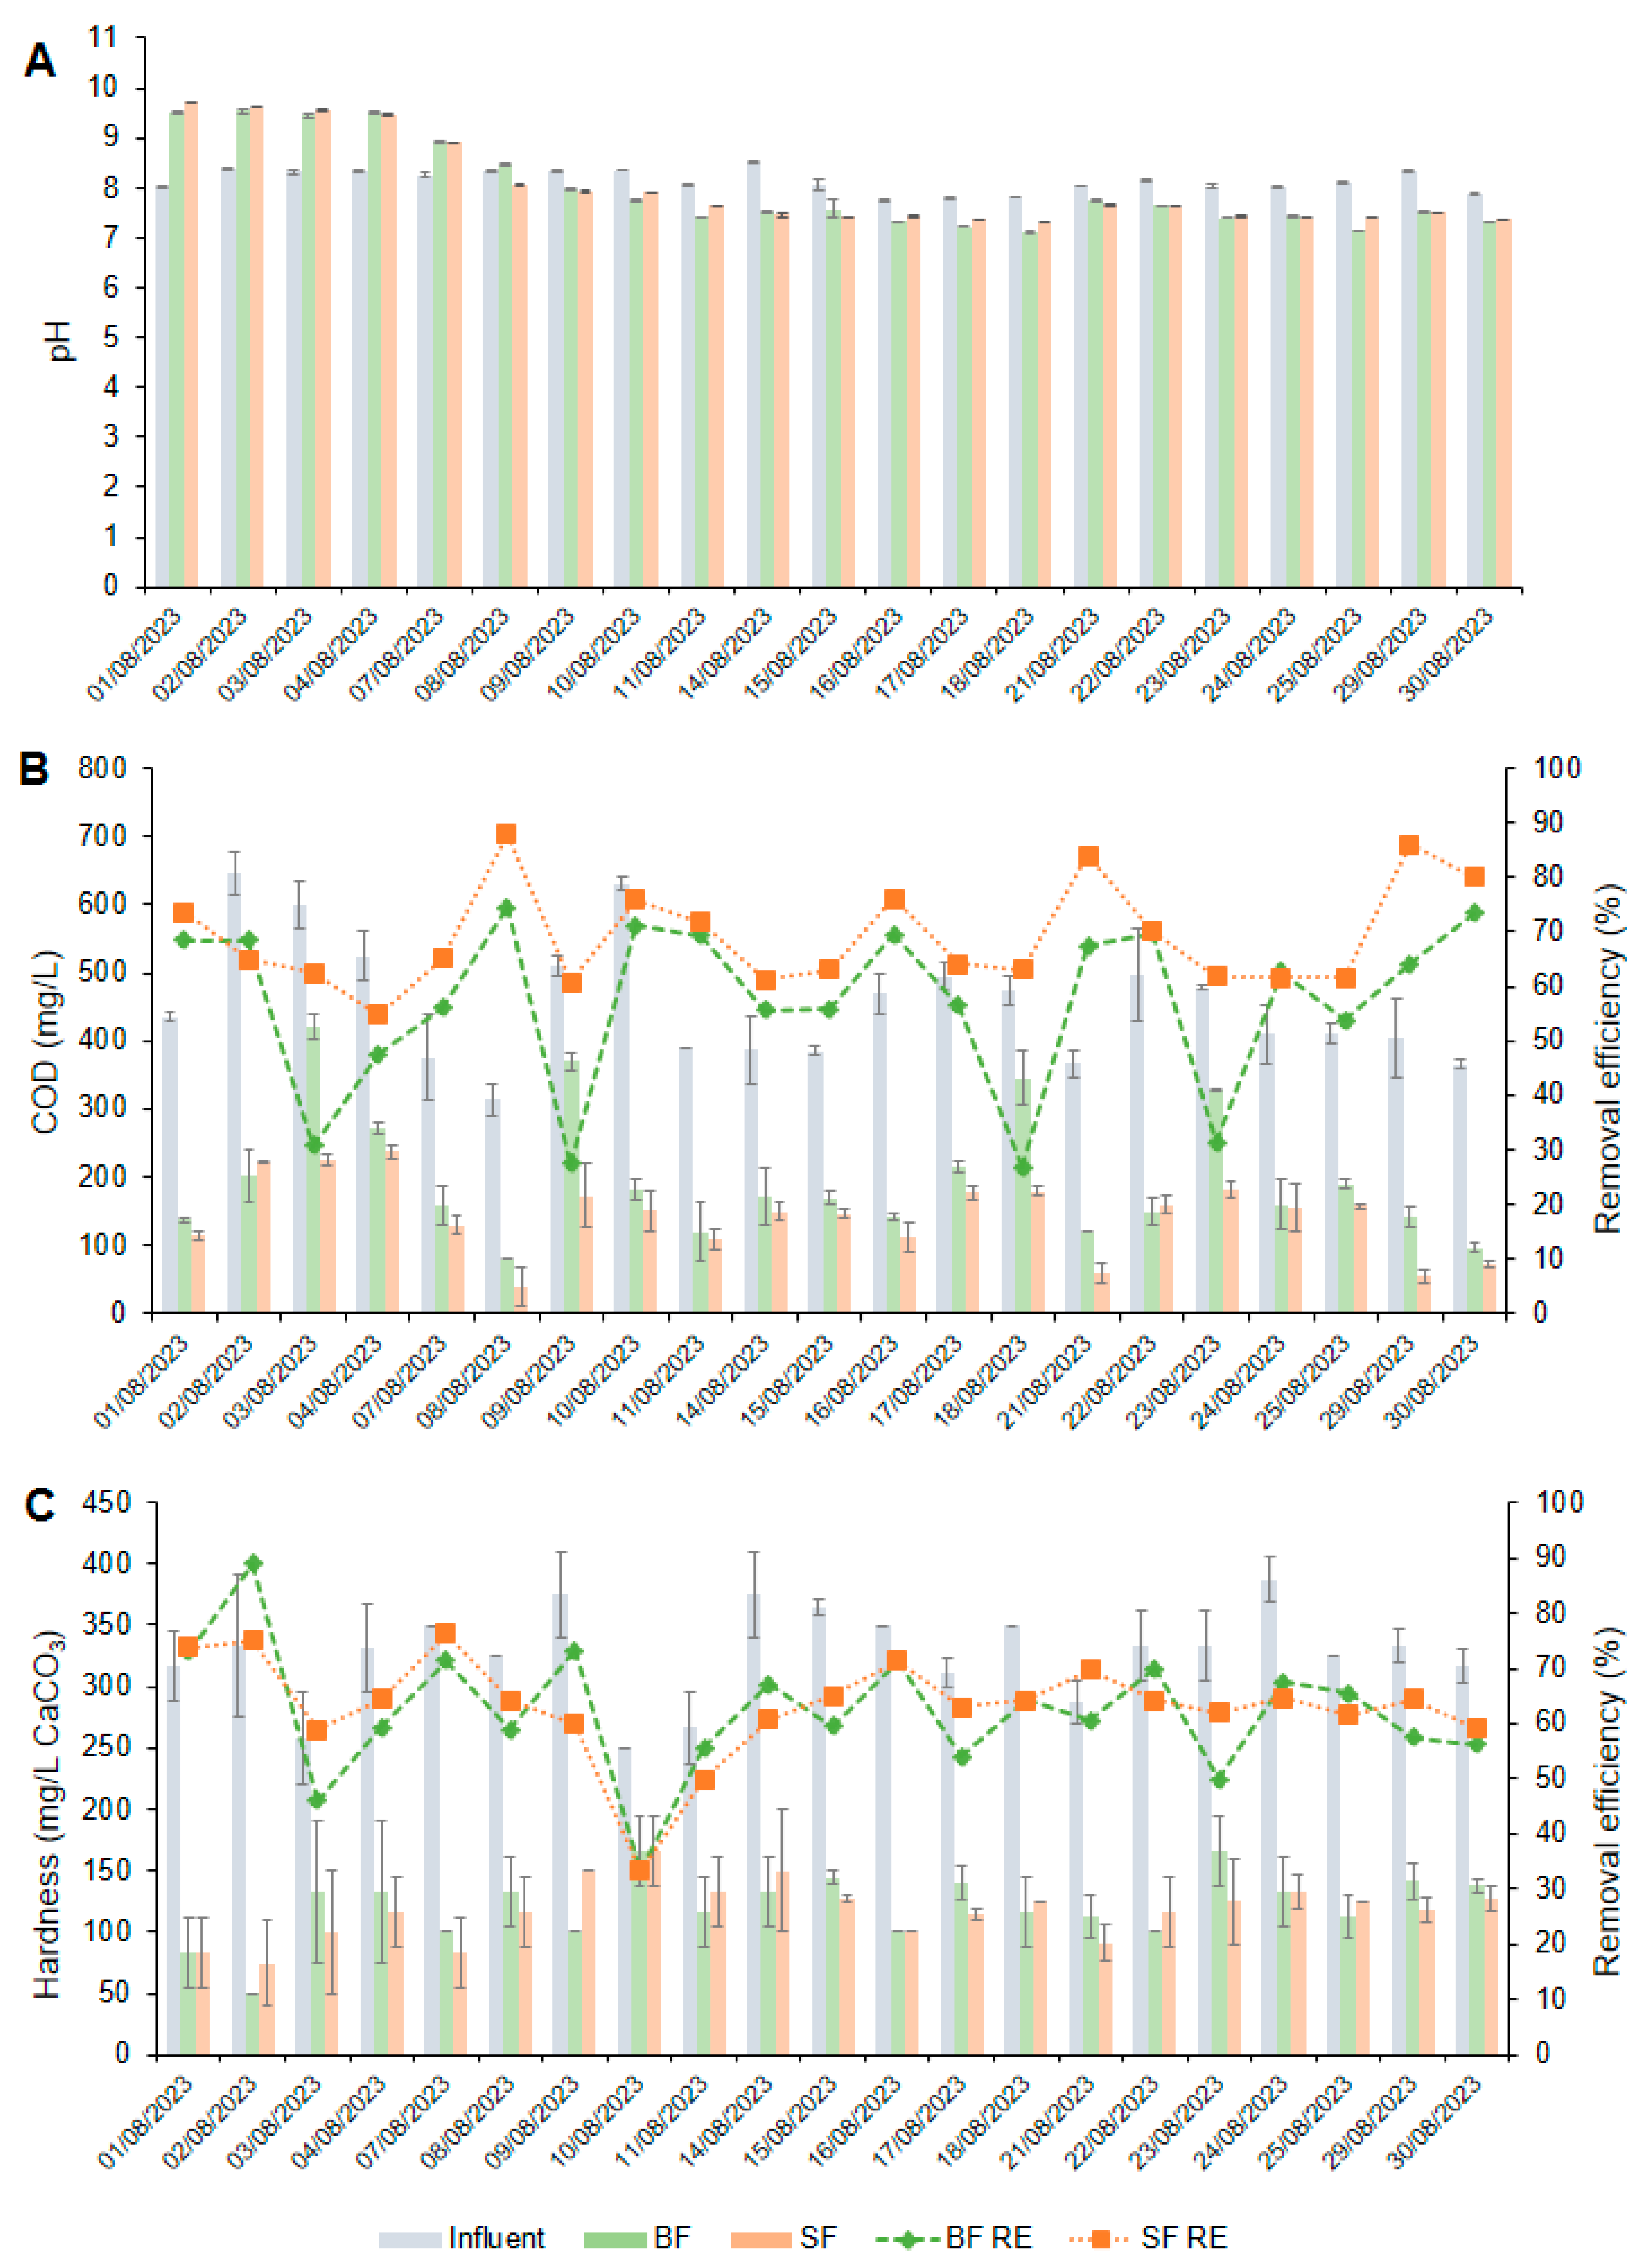
Figure 3 displays the pH, COD, and hardness levels in the influent and treated water after biochar and sand filtration systems and their removal efficiencies (except for pH). The pH value of the influent showed low fluctuations over the whole testing period (Figure 3A). The lowest and highest pH values were 7.7 and 8.5, respectively. During the testing period, the effluent pH values from the filters were consistently maintained. The highest effluent pH values were 9.5 and 9.7 for the biochar and sand filters, respectively (Figure 3A). It is worth mentioning that during the early days of testing, both filters reported pH values higher than the average influent pH value of 8.1 (Table 2). It is believed that the alkaline pH of the biochar (pH 9.94) used in the experiment contributed to the high pH observed in the effluent pH value from both filters. These ranges of pH slightly exceeded the maximum permissible range for potable purposes (WHO and USEPA: 6.0–8.5) and greywater reuse in toilet flushing, floor washing, and irrigation (China, Canada, Oman, and the USA: pH range of 6.0–9.0) (Figure S1, Table 2). However, the effluent pH value in both filters tended to decrease from the second week of testing. The pH values decreased to a minimum of 7.1 and 7.3, in the biochar and sand filters, respectively (Figure 3A). The biochar and sand filters both exhibited an average pH value of 8.0. Thus, no significant difference could be found in pH between the influent and biochar filter effluent (p = 0.4259) and between the latter and sand filtration (p = 0.9041) (Table 3). When compared to previous investigations, the reported average pH was higher than the final effluent pH value of 6.87 observed by Olupot et al. [11]. Nevertheless, it matched the final effluent pH of 8.0 reported by Reynaert et al. [14]. Overall, the biochar and sand filters showed pH values lower than the maximum permissible range for potable purposes (6.0–8.5) and greywater reuse (6.0–9.0) for most of the testing period, suggesting the possibility of reusing the water effluent for handwashing, toilet flushing, garden irrigation, and floor washing (Figure S1).
Regarding COD, the reported average COD concentration in the influent was 455.5 ± 26.8 mg/L (Table 2). The influent COD changed over the study period. The minimum and maximum influent COD was 313.3 mg/L and 646.7 mg/L, respectively (Figure 3B). The average influent COD surpassed the water quality standards for potable water use in handwashing (WHO: ≤20 mg/L) and for treated greywater reuse in the irrigation of vegetables eaten cooked according to the water quality standards from Malaysia, Jordan, and Italy (≤100 mg/L), Tunisia (≤90 mg/L), and Oman (≤200 mg/L) (Table 1). The biochar filter reported a minimum, maximum, and average effluent COD of 80 mg/L, 420 mg/L, and 199 ± 16.9 mg/L, respectively. Meanwhile, the sand filter reported values of 40 mg/L, 237 mg/L and 143.5 ± 14.8 mg/L, respectively. The biochar filter reduced on average 57.1% of COD from the inlet, meanwhile, the sand filter reduced an average of 28.1% of COD from the biochar filter effluent (p < 0.05) (Figure 3B and Table 3). Overall, the biochar filter was more efficient than the sand filter in decreasing the COD level. This suggests that future studies could explore the effectiveness of in-series biochar filtration for enhanced COD removal. Overall, the performance of the biochar and sand filters in reducing the COD level was sufficient to allow the reuse of their effluents for restricted activities (e.g., garden irrigation, toilet flushing, and floor washing). Nevertheless, the effluent COD from the biochar and sand filters remained higher than the acceptable range for quality intended for potable uses such as handwashing (Figure S1). In the literature, Reynaert et al. [14] achieved a remarkable reduction in COD, reducing the initial concentration from 510 mg/L to just 9.1 mg/L, which represents a 99.7% decrease. In contrast, the COD level in the sand filtration effluent (secondary effluent) was notably higher at 143.5 mg/L. This significant discrepancy can be attributed to Reynaert et al. [14]’s use of membrane filtration, which enhances the removal of organic matter.
Hard water can react with soap to produce insoluble calcium or magnesium salts, which hinder the soap’s ability to foam or lather, thereby diminishing its effectiveness in pathogen removal through handwashing [65]. Considering this investigation aims to reuse the treated water for handwashing, this study monitored the reduction of hardness level in the effluent water from the biochar and sand filters. As can be seen in Figure 3C, the influent hardness exhibited stability across the study period. The minimum and maximum influent hardness levels were 250 mg/L CaCO3 and 387.5 mg/L CaCO3, respectively. Meanwhile, the average concentration was 327.4 ± 19.1 mg/L CaCO3 (Table 2). The influent wastewater showed a hardness concentration beyond WHO’s acceptable limits for potable water (WHO: ≤200 mg/L CaCO3) and treated greywater reuse in irrigation (Jordan: ≤300 mg/L CaCO3). After primary treatment with biochar filtration, the average concentration decreased to 127.1 mg/L CaCO3 (62.1% reduction). After secondary treatment with sand filtration, the concentration was barely reduced to 118.1 mg/L CaCO3 (3% reduction). This suggested that biochar filtration significantly decreased hardness levels from the inlet wastewater (p < 0.0001) in contrast to sand filtration (Table 3).
Despite the low hardness reduction achieved by sand filtration, Figure S1 shows that biochar filtration alone can treat the inlet wastewater to optimal hardness levels for water reuse in handwashing and irrigation. This is because the quality of the treated water remained below the acceptable limits for potable water for handwashing and irrigation. The minimum and maximum hardness levels in the biochar filter effluent were 50 mg/L CaCO3 and 166.7 mg/L CaCO3, respectively (Figure 3C). The removal of hardness ions (Ca2+ and Mg2+) observed in this study can be attributed to a combination of adsorption, ion exchange, precipitation (e.g., carbonate, phosphate), surface complexation mechanisms. For example, the effective reduction of hardness by biochar filtration could be due to the negatively charged surface of biochar, which has a strong binding affinity for Ca2+ and Mg2+ through electrostatic interactions [66]. The biochar used in this study was characterised using FTIR spectroscopy to identify surface functional groups relevant to adsorption processes (see details in Section 3.3 and [19,62]). The spectra indicated the presence of hydroxyl (–OH) and carboxyl (–COOH) functional groups, which are known to facilitate adsorption and ion exchange interactions with dissolved cations like Ca2+ and Mg2+. Also, the porous structure of the biochar further enhances contact between the aqueous phase and active sites, promoting efficient removal. These combined mechanisms explain the observed reduction in hardness following biochar filtration. The observed high removal performance of biochar filtration, coupled with no evidence of increased hardness at the end of the testing period, suggests its potential effectiveness in softening handwashing wastewater through the adsorption of Ca2+ and Mg2+ ions. This observation is of great relevance as the used biochar in the filtration process could be reused in soil application, thereby minimising the generation of waste residues along the handwashing treatment process [67]. This study is the first to assess the reduction of hardness in handwashing wastewater. Consequently, comparing the effectiveness of this treatment system with others focused on handwashing wastewater is currently difficult.

3.2.3. Nutrient Removal

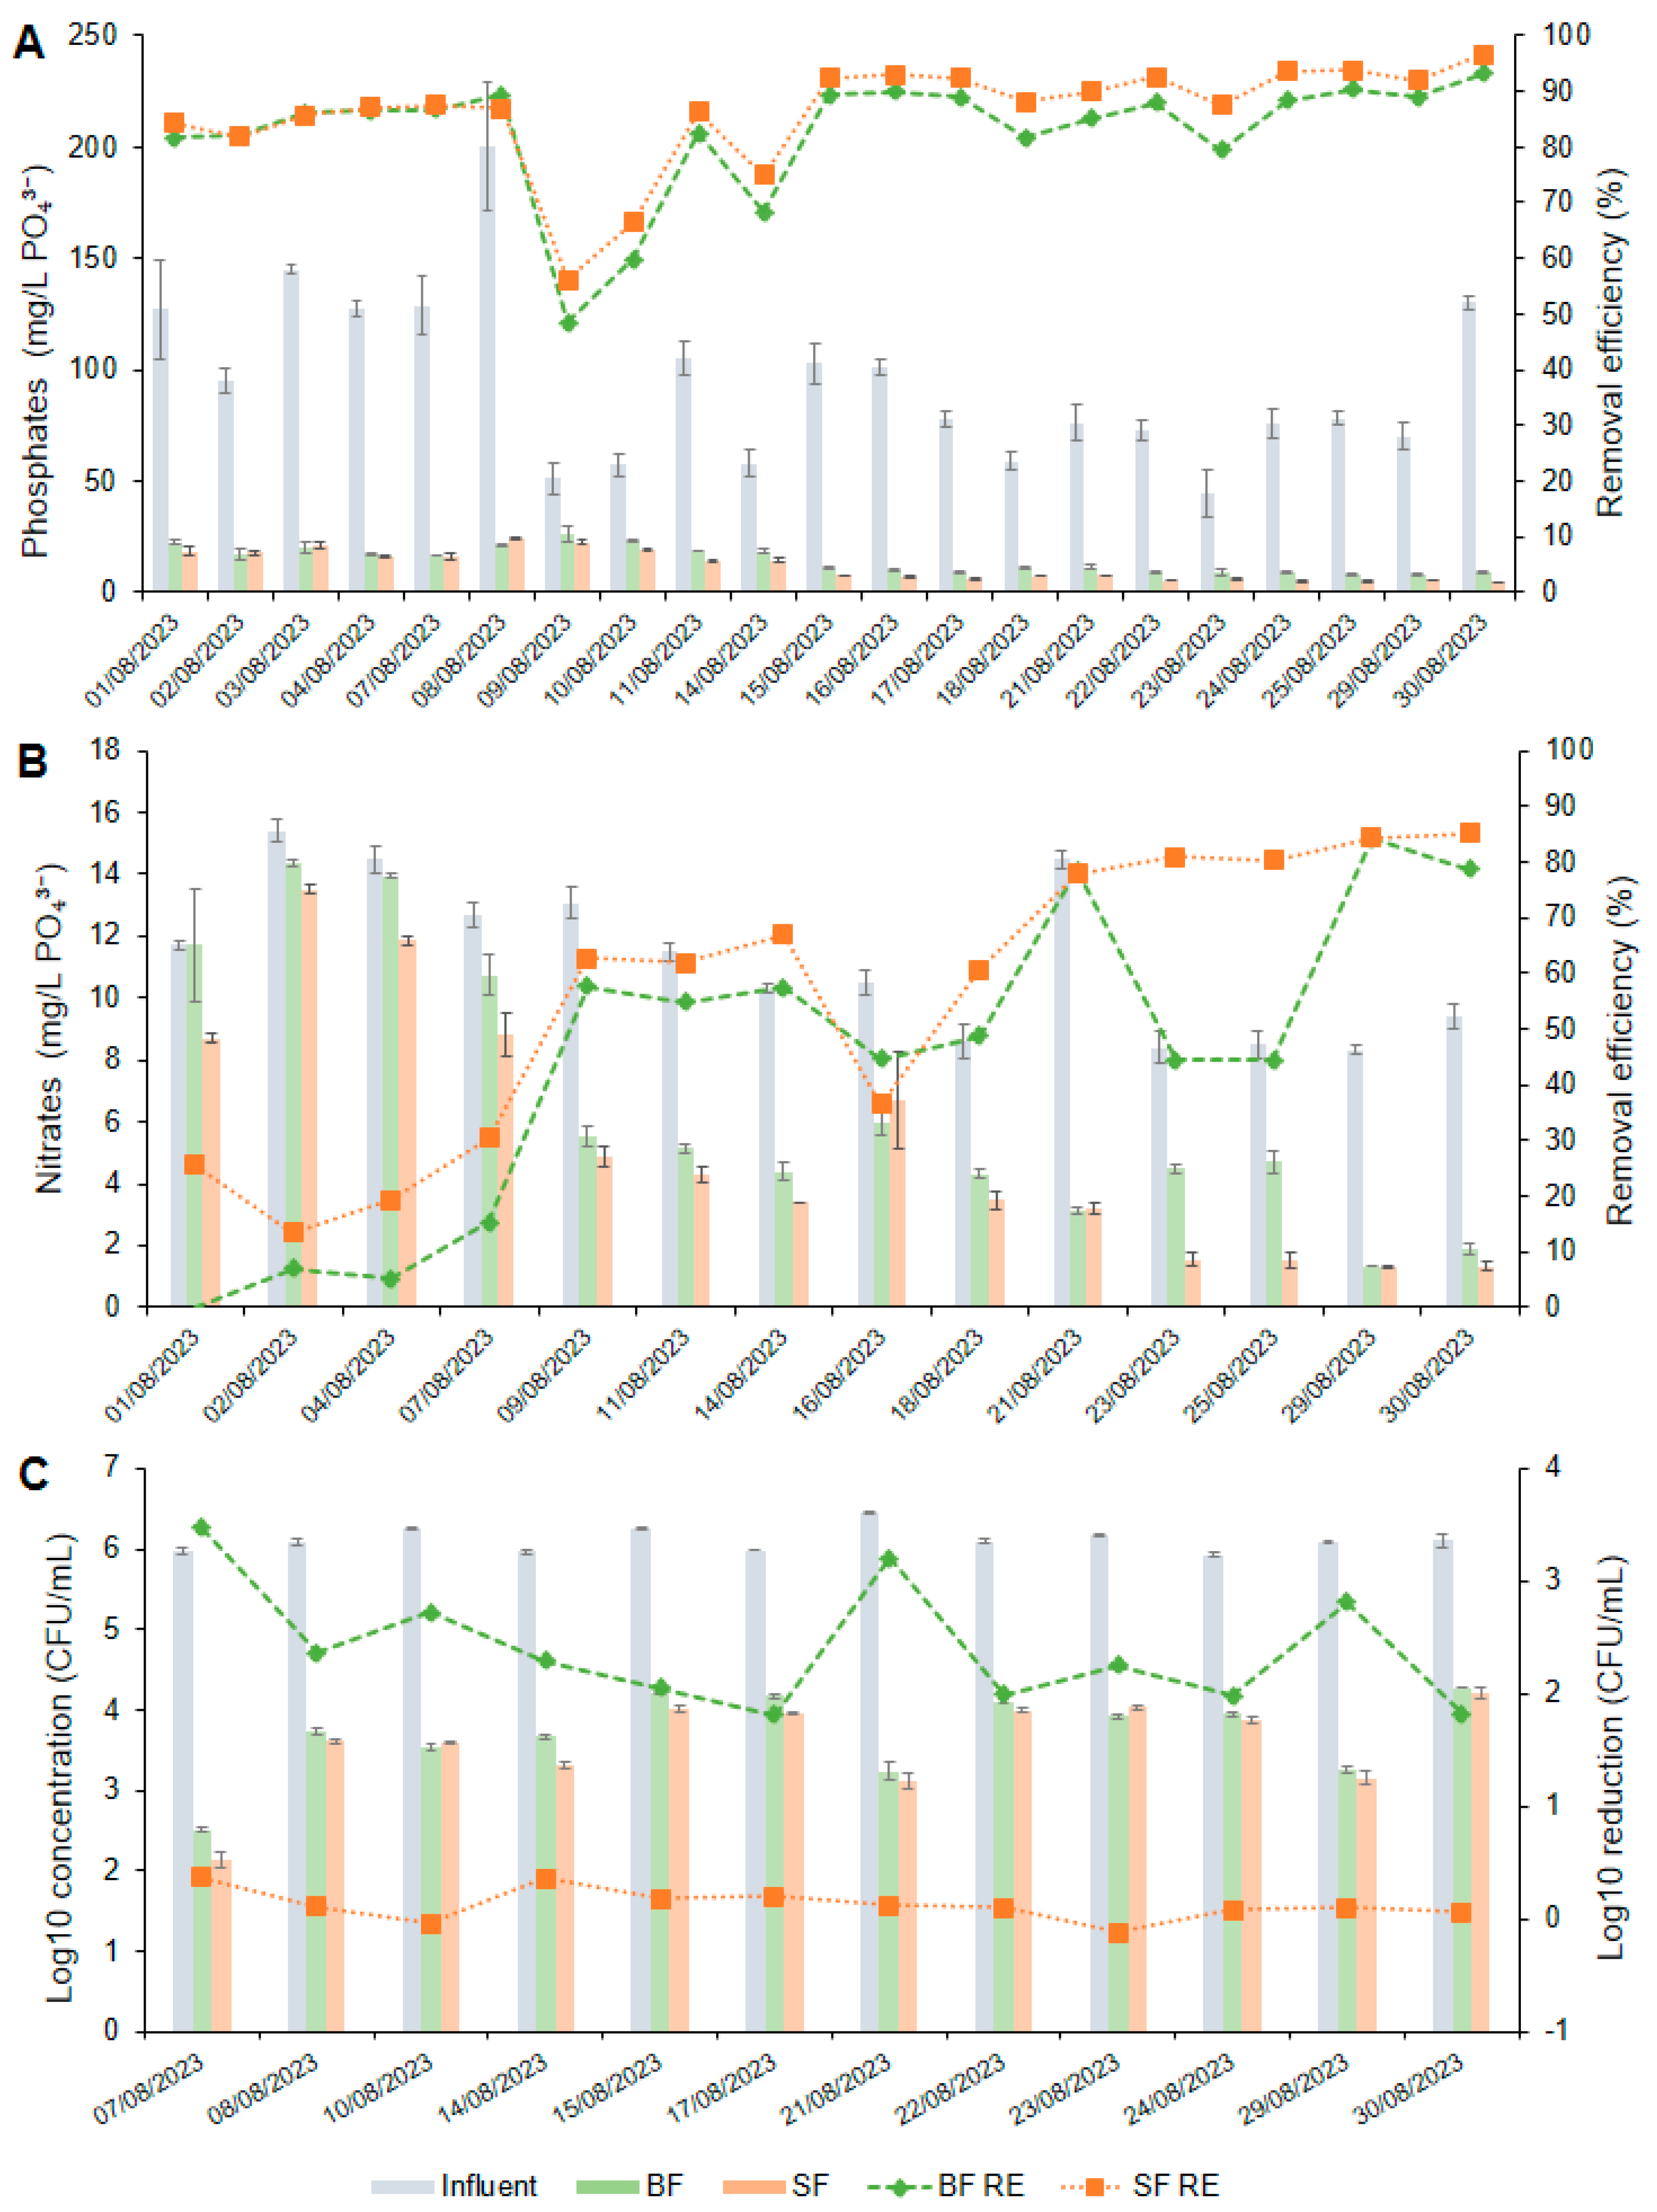
The phosphate concentration in the influent wastewater ranged from 44.3 mg/L PO43− to 200.7 mg/L PO43− (Figure 4A). The average concentration was 94.3 ± 7.8 mg/L PO43− throughout the study period (Table 2). The influent phosphate level was beyond the acceptable level for potable water for handwashing (WHO: ≤0.4 mg/L PO43−) and treated greywater reuse in irrigation of vegetables eaten cooked and playgrounds (Jordan: <30 mg/L PO43−) (Table 1). The effluent phosphate from the biochar filter ranged from 7.7 mg/L PO43− to 26.1 mg/L PO43− (Figure 4A). Biochar filtration significantly removed phosphate content by an average of 82.6% to achieve an average concentration of 14.4 ± 0.9 mg/L PO43− in the primary effluent (p < 0.0001). The effluent phosphate from the sand filter ranged from 4.5 mg/L PO43− to 24.1 mg/L PO43− (Figure 4A). The secondary treatment with sand filtration removed 17.4% to achieve an average concentration of 11.9 ± 0.6 mg/L PO43− in the final effluent. Overall, sand filtration did not significantly contribute to reducing phosphate levels (p = 0.2022) (Table 3). The decreased efficiency of the sand filter in phosphate removal is due to the low levels of biodegradable organic matter (COD) present in the effluent from the biochar filter entering the sand filter, which affects the growth of phosphorus-accumulating microorganisms [68]. In contrast, the elevated phosphate reduction observed in the biochar filter might be attributed to the precipitation of the phosphate ions onto the surface of the biochar media containing Ca2+ and Mg2+. This occurs naturally when the biochar media is exposed to an influent with high hardness levels [69]. An alternative explanation might be that phosphates are assimilated by the biofilm living within the biochar media, which incorporates the phosphates into its cellular biomass [70]. According to Figure 4A, the phosphate removal slightly increased after the second week of testing and showed no changes throughout the experiment. The rise in phosphate adsorption could imply that the biofilm attached to the biochar media reached maturity by this time, contributing to the enhanced uptake of phosphates (Figure 4A). The significant removal of phosphates by the biochar filter indicates the potential advantage of reusing the phosphate-enriched biochar as a soil quality improver and a phosphate nutrient source for crops [71].
Biochar filtration successfully reduced phosphate levels to a quality suitable for greywater reuse in irrigation (Jordan: ≤30 mg/L PO43−). However, sand filtration as a secondary treatment did not effectively reduce phosphate levels to the quality required for potable use in handwashing (WHO: ≤0.4 mg/L PO43−) (Figure S1). In the literature, Reynaert et al. [14] reported a phosphates reduction from 8.4 mg/L PO43− to 4.2 mg/L PO43−. Although the integrated biochar and sand filtration system yielded a final effluent with an average phosphate concentration slightly elevated at 11.9 ± 0.6 mg/L PO43−, it effectively processed handwashing wastewater that had influent phosphate levels eleven times greater (94.3 ± 7.8 mg/L PO43−) than those in the influent treated by Reynaert et al. [14], as detailed in Table 3. This suggests the high efficiency of the biochar filter in removing high levels of phosphates from handwashing wastewater.
The nitrates content in the inlet wastewater ranged from 8.3 mg/L NO3 to 15.4 mg/L NO3 (Figure 4B), with an average concentration of 11.2 ± 0.4 mg/L NO3 (Table 2). The influent nitrates were within the permissible limits for greywater reuse in irrigation (Jordan: ≤30 mg/L NO3) and above the required maximum concentration for water use in handwashing (WHO and USEPA: ≤10 mg/L NO3) (Figure S1). The effluent nitrates from the biochar and sand filters ranged from 1.3 mg/L NO3 to 14.3 mg/L NO3 and from 1.3 mg/L NO3 to 13.5 mg/L NO3, respectively (Figure 4B). Biochar filtration reduced the nitrates concentration to an average of 6.5 ± 0.3 mg/L NO3; meanwhile, sand filtration reduced it to 5.3 ± 0.3 mg/L NO3 (Table 3). Generally, the nitrates in the effluent from both filters were below the permissible limit for potable water for handwashing and exhibited stability across the testing period (Figure S1). These results indicate that biochar filtration effectively reduced nitrate levels from the inlet (p < 0.0020), in contrast to sand filtration, which did not play a significant role in decreasing nitrate concentrations from the biochar filter effluent (p = 0.4419) (Table 3).
The high nitrate uptake observed in the biochar filter could be attributed to the potential of biochar to absorb nitrates through several mechanisms including Van der Waals’ force, electrostatic interaction, and intraparticle diffusion [72]. Moreover, considering the use of E. coli in the formulation of the synthetic handwashing wastewater for this study, it is hypothesised that the E. coli colonies attached to the biochar media in the saturated (anaerobic) zones of the biochar filter used the nitrates as a terminal electron acceptor for microbial growth [73]. Increased uptake of nitrates was observed from the second week of the testing, suggesting that E. coli communities needed some time to adapt to the inner biochar filter condition before reducing nitrate to grow (Figure 4B). This finding is notably significant for the recovery of nitrate as a nutrient for plants. The application of nitrate-loaded biochar into the soil could slowly release nitrates, making them available for assimilation by plants [72].
Conversely, the low uptake of nitrates in the sand filter could be attributed to the influent of low alkalinity levels in biochar filter effluent on the denitrification process. Li and Irvin [74] linked insufficient denitrification to an inlet alkalinity of about 100 mg/L CaCO3, which causes a drop in pH that can decelerate or hinder the activity of denitrifying bacteria. Another potential reason for the limited absorption of nitrates could be related to their high solubility, which limits nitrate retention in the sand filter, enabling easy washout (Figure 4B) [75]. Overall, the performance of biochar filtration was sufficient to keep the nitrates level below the maximum limits for potable purposes (WHO and USEPA: ≤10 mg/L NO3). This indicates that contamination from nitrates was minimised, making the treated water potentially suitable for reuse in handwashing and irrigation applications (Figure S1).

3.2.4. Hygiene Indicator

The E. coli concentration in the influent ranged from 5.9 Log10 CFU/mL to 6.4 Log10 CFU/mL (Figure 4C). The average influent concentration was 6.1 ± 0.0 Log10 CFU/mL (Table 2). The concentration of E. coli in the synthetic handwashing wastewater treated in this study was significantly higher than levels documented for actual handwashing wastewater in existing literature (Table 3). This method was employed to assess the efficacy of the biochar and sand filter system in eliminating E. coli from influents with high levels of E. coli pollution. The purpose of this was to evaluate the E. coli inactivation performance of the filters when exposed to handwashing wastewater simulating severe faecal contamination scenarios that could occur under real-life conditions. As expected, the influent E. coli concentration did not comply with the requirement of E. coli absence in water for potable purposes in handwashing (WHO and USEPA: 0 CFU/100 mL) (Figure S1). The E. coli concentration in the biochar filter effluent ranged from 2.5 log to 4.3 log, and the average level was 3.7 log (Figure 4C, Table 3). The biochar filter removed an average 2.4 log concentration of E. coli in the influent. The sand filter effluent reported an E. coli concentration in the range of 2.1 log–4.2 log, and the average level was 3.6 log (Figure 4C, Table 3). The sand filter barely removed a 0.1 log concentration of E. coli in the biochar filter influent. These results indicated that biochar filtration significantly reduced E. coli from the inlet (p < 0.0001), in contrast to sand filtration, which did not significantly reduce the E. coli concentration from the biochar filter effluent (p = 0.5699) (Table 3).
Bautista Quispe et al. [18] noted that biochar filters can eliminate E. coli from greywater through the electrostatic attraction between the E. coli and the biofilm formed on the biochar surface. Moreover, E. coli inactivation is facilitated by the biofilm layers on the biochar, which decrease the space between biochar particles, aiding in the straining of E. coli. It is still unclear to what extent the presence of nutrients (e.g., N and P) from nitrates and phosphates available in the influent wastewater could enhance E. coli growth within the biochar filter media. Therefore, further studies should explore how nutrient-rich handwashing wastewater could limit the reduction of microbial pollution. This holds significant relevance for research focused on treating and reusing handwashing wastewater in low- and middle-income countries, especially in regions where regulations prohibiting the use of phosphates in cleaning products like handwashing soap that are still in development. The insufficient removal of E. coli following biochar filtration can be explained by the physicochemical properties of the biochar. For example, the pore size of biochar may be larger than bacterial cells, limiting effective removal. Additionally, under neutral pH conditions, both biochar surfaces and bacterial cells typically carry negative charges, resulting in electrostatic repulsion and reduced attachment efficiency.
The causes for the limited removal of E. coli in the sand filter remain uncertain. However, a potential reason could be the high E. coli concentration (3.7 log) in the biochar filter effluent fed to the sand filter, which depleted the bacterial adhesion points within the sand filter. This led to a reduced number of attachment sites for the subsequent bacterial flow into the sand filter. Qian et al. [76] similarly reported a decline in E. coli inactivation efficiency in a biological sand filter for sewage treatment when fed with higher influent concentrations of E. coli. Another explanation could be that the biochar filter’s high efficiency in removing nutrients (nitrates and phosphates) led to a nutrient-deficient influent entering the sand filter. Consequently, this diminished the nutrient supply necessary for biofilm growth within the sand filter, thereby restricting E. coli inactivation through both biofilm adsorption and straining [77]. An alternative explanation could be the influence of the solution pH in the sand filter on the isoelectric point (pI) of E. coli (solution pH where E. coli is chargeless). As the pI of E. coli is predominantly acidic (pI 4–7), it is assumed the E. coli surface was predominantly negatively charged under the alkali condition (pH 8) observed in the sand filter. Therefore, it is believed that E. coli exhibited repulsive forces with the negatively charged sand media [32,78].
In the literature, previous treatment systems have been found to perform better at removing E. coli. Bolton and Randall [25] achieved a total removal of 4 log in a system combining a constructed wetland microbial fuel cell and a biological sand filter. Reynaert et al. [14] reported less than 1 MPN/100 mL in the effluent samples after electrolysis-based disinfection. Even though the biochar filter seemed to remove E. coli, it was still able to achieve a 2.4 log reduction from a highly polluted influent without disinfection methods. As can be seen in Figure S1, the quality of the treated water after the biochar and sand filtration steps did not satisfy the requirement in the water quality standards for potable purposes (WHO and USEPA: undetectable count in 100 mL) and treated greywater reuse for irrigation of vegetables eaten cooked, playgrounds, plenteous trees, and green areas (Jordan: 1000 CFU/100 mL). This outcome suggests the need for an extra tertiary treatment phase to improve E. coli inactivation, ensuring compliance with water quality guidelines for handwashing and expanding the possibilities for treated greywater reuse.

3.2.5. Treatment Capacity

Figure S1 displays the changes in the effluent characteristics of the biochar and sand filter against the treated volume of handwashing wastewater and their compliance with water quality standards for potable water use in handwashing and greywater reuse in restricted activities. The filters treated up to 63 L of volume while meeting the turbidity and TSS permissible limits for potable water (WHO: ≤5 NTU and ≤25 mg/L, respectively) and international greywater reuse standard for irrigation (Jordan: ≤10 NTU, and Tunisia and Oman: ≤30 mg/L, respectively) (Figure S1B,C). In the case of colour, the filter treated up to 12 L of volume while still complying with the quality criteria from both water quality standards. However, at increased loads of handwashing wastewater, the sand filter effluent showed levels slightly above the permissible range for treated greywater reuse in toilet flushing and irrigation (China: <30 Pt/Co) (Figure S1A). In contrast, the filters showed promising capacity to treat beyond 63 L of influent wastewater and produce treated water with pH (Figure S1D), electrical conductivity (Figure S1E), and hardness (Figure S1G) below the permissible limits for potable water (WHO and USEPA: 6–8.5, ≤1500 µS/cm, and ≤200 mg/L CaCO3, respectively). The filters could not produce treated water in compliance with COD (Figure S1F) and phosphates (Figure S1H) requirements for potable water (WHO and USEPA: ≤10 mg/L and ≤0.4 mg/L PO43−, respectively). However, they showed promising capacity to treat beyond 63 L of volume while removing COD and phosphates below acceptable ranges for greywater reuse in the irrigation of plenteous trees, green areas, and field crops (Jordan: ≤500 mg/L and ≤30 mg/L PO43−, respectively). Similarly, the filters showed the potential to treat beyond 63 L of volume with resulting nitrate levels below the water quality standards for both potable water (WHO and USEPA: ≤10 mg/L NO3) and greywater reuse in irrigation (Jordan: ≤30 mg/L NO3) (Figure S1I). Nevertheless, none of the filters could treat the volume of wastewater to regulatory microbial quality standards levels from WHO and USEPA for potable water (0 CFU/100 mL) and greywater reuse in irrigation (1000 CFU/100 mL) (Figure S1J).
It is crucial to note that while these results indicate the potential of the treatment system to improve handwashing wastewater quality to acceptable levels, the determination of its maximum removal efficiency depends on its intended use, whether for reusing water for handwashing or restricted activities such as toilets flushing, garden irrigation, and floor washing. Overall, the reported findings suggest that the system can treat more than 63 L of water for water reuse in handwashing purposes in compliance with the potable water quality standard. However, the determination of the maximum volume of wastewater that can be treated by the system for greywater reuse requires further investigation. Furthermore, given the lack of specific water quality standards for the reuse of treated handwashing wastewater, it is important that further studies focus on determining the most relevant water quality parameter for compliance if treated handwashing is to be reused for handwashing applications. This is because, while this study utilised well-established potable water quality standards to evaluate the quality of water treated for handwashing, the permissible limits appear overly stringent for the reuse of water for such activity. Nonetheless, the findings shown in Figure S1 underscore the significant potential for the treated water to be repurposed for various uses.

3.2.6. Results of the Disinfection Trials with Sodium Hypochlorite

This research conducted disinfection experiments on the secondary effluent from sand filtration to determine an optimal low dosage of NaClO (mL/L) capable of eliminating E. coli. The purpose of this was to enhance the quality of the secondary effluent for potential reuse in handwashing and restricted activities. NaClO is one of the most frequently used water-disinfecting agents in developing countries [79]. The three evaluated doses of NaClO (0.1, 0.3, and 0.5 mL/L) achieved an undetectable E. coli count in 100 mL (n = 12). This indicated that a low dose of 0.1 mL/L NaClO could remove up to 3.6 log of E. coli concentration in the sand filter effluent (Table 4). The average free chlorine in the effluent disinfected with 0.1 mL/L NaClO was 1.1 mg/L Cl2. The amount of free chlorine is within the required range of Cl2 concentration from 0.5 mg/L to 5 mg/L according to the water quality guidelines from WHO (Table 1). This is important because maintaining free chlorine within the required range ensures effective water disinfection while minimising health risks. At 0.5 mg/L, free chlorine is sufficient to eliminate most bacteria and viruses, ensuring microbial safety. The upper limit of 5 mg/L is critical, as exceeding this concentration may lead to the formation of harmful disinfection by-products and potential health hazards, such as irritation or toxicity [20].
The absence of E. coli and acceptable chlorine residual in the treated water could allow its reuse for handwashing purposes without risks to human health. It is important to note that while this study applied potable water quality standards to assess the microbial quality of the treated water, the treated water cannot be reused for drinking purposes. This is because drinking water must comply with strict permissible limits of inorganic and organic chemicals, microbiological and parasitological, organoleptic qualities, and radioactivity levels. Therefore, any hand-to-mouth contact should be strictly avoided to minimise the risk of infection [80]. This precaution is essential to ensure that while the water is safe for external use, potential health hazards are mitigated, particularly in scenarios where accidental ingestion might occur.
In the literature, Oloput et al. [11] reported that a dose of 0.5 mL/L NaClO (3.5% wt/vol) completely deactivated the pathogens in the effluent of a mixed (silica sand, zeolite, and granular activated carbon) filtration system treating handwashing wastewater. The present study reported a low dose of NaClO needed to reach a complete deactivation of E. coli. However, this could be attributed to the higher concentration of NaOCl solution (4.53% wt/vol) used in the disinfection trials, indicating that optimising the concentration of disinfectants is critical for enhancing disinfection efficiency while potentially reducing chemical costs and environmental impact. Furthermore, as can be seen in Table 4, there was no significant difference (p > 0.05) in the quality of the sand filter effluent when exposed to the different doses of NaClO (n = 3). These findings indicated that a low dose of 0.1 mL/L NaClO could be added as a tertiary step for the treatment of handwashing wastewater without having any implication on the physical, chemical, and microbial characteristics of the treated water.
Chlorine is widely available and inexpensive, making it accessible to rural communities with limited financial resources [81]. The chlorination process is straightforward, requiring minimal training and essential equipment for implementation. Furthermore, chlorine provides residual protection, which continues disinfecting even after application, helping control microbial regrowth in the distribution system. This residual effect is particularly valuable in rural areas where water may be stored before use. Additionally, chlorine is effective against many pathogens, including bacteria, viruses, and protozoa, ensuring high microbial control. However, there are some drawbacks to chlorine disinfection. The process can lead to the formation of harmful disinfection by-products (DBPs), such as trihalomethanes (THMs) and haloacetic acids (HAAs), which may pose health risks [82]. Additionally, chlorine can impart an undesirable taste and odour to the water, which users may not receive well. Furthermore, although this research did not measure DBPs concentration in treated water with the different doses of NaClO under testing, previous research has established a direct correlation between higher doses of NaClO and the increased formation of DBPs, notably THMs and HAAs [83]. These DBPs can significantly alter treated water’s physical and chemical properties, including its colour, turbidity, odour, and pH. For instance, THMs and HAAs can impart a yellowish shade to the water and contribute to its turbidity, affecting its aesthetic quality [84]. Additionally, these by-products can lead to undesirable odours, which may deter end-users from consuming or utilising the treated water [84]. Given these implications, the dosage of NaClO becomes a critical factor in water treatment processes. It is essential to balance effectively reducing microbial load and minimising the formation of harmful DBPs. A previous study from Elsaidy et al. [85] suggests that maintaining chlorine doses within the range of 0.5–3 mg/L is effective for completely removing pathogens without significantly increasing concentrations of DBPs. This range highlights the importance of precise dosing and careful monitoring of chlorination practices to ensure optimal water quality.
As illustrated in Table 4, the experimental results demonstrated that there was no significant difference (p > 0.05) in the quality of sand filter effluent when exposed to varying doses of NaClO (n = 3). This finding suggests that adding chlorine at lower doses, particularly at 0.1 mL/L, is a practical tertiary treatment step for handwashing wastewater without adversely affecting the treated water’s physical, chemical, or nutrient characteristics. The implications of these findings are noteworthy for rural settings, where access to safe water for handwashing hygiene is often limited. By utilising a low dose of NaClO, it is possible to enhance the microbiological safety of handwashing wastewater while preserving its overall quality. This approach not only aligns with public health objectives but also promotes sustainability by minimising the introduction of harmful chemicals into the water supply. In conclusion, the ability to achieve adequate disinfection while minimising DBPs formation underscores the necessity for ongoing research and development in this area.

3.3. FTIR Analysis Across the Biochar Filter

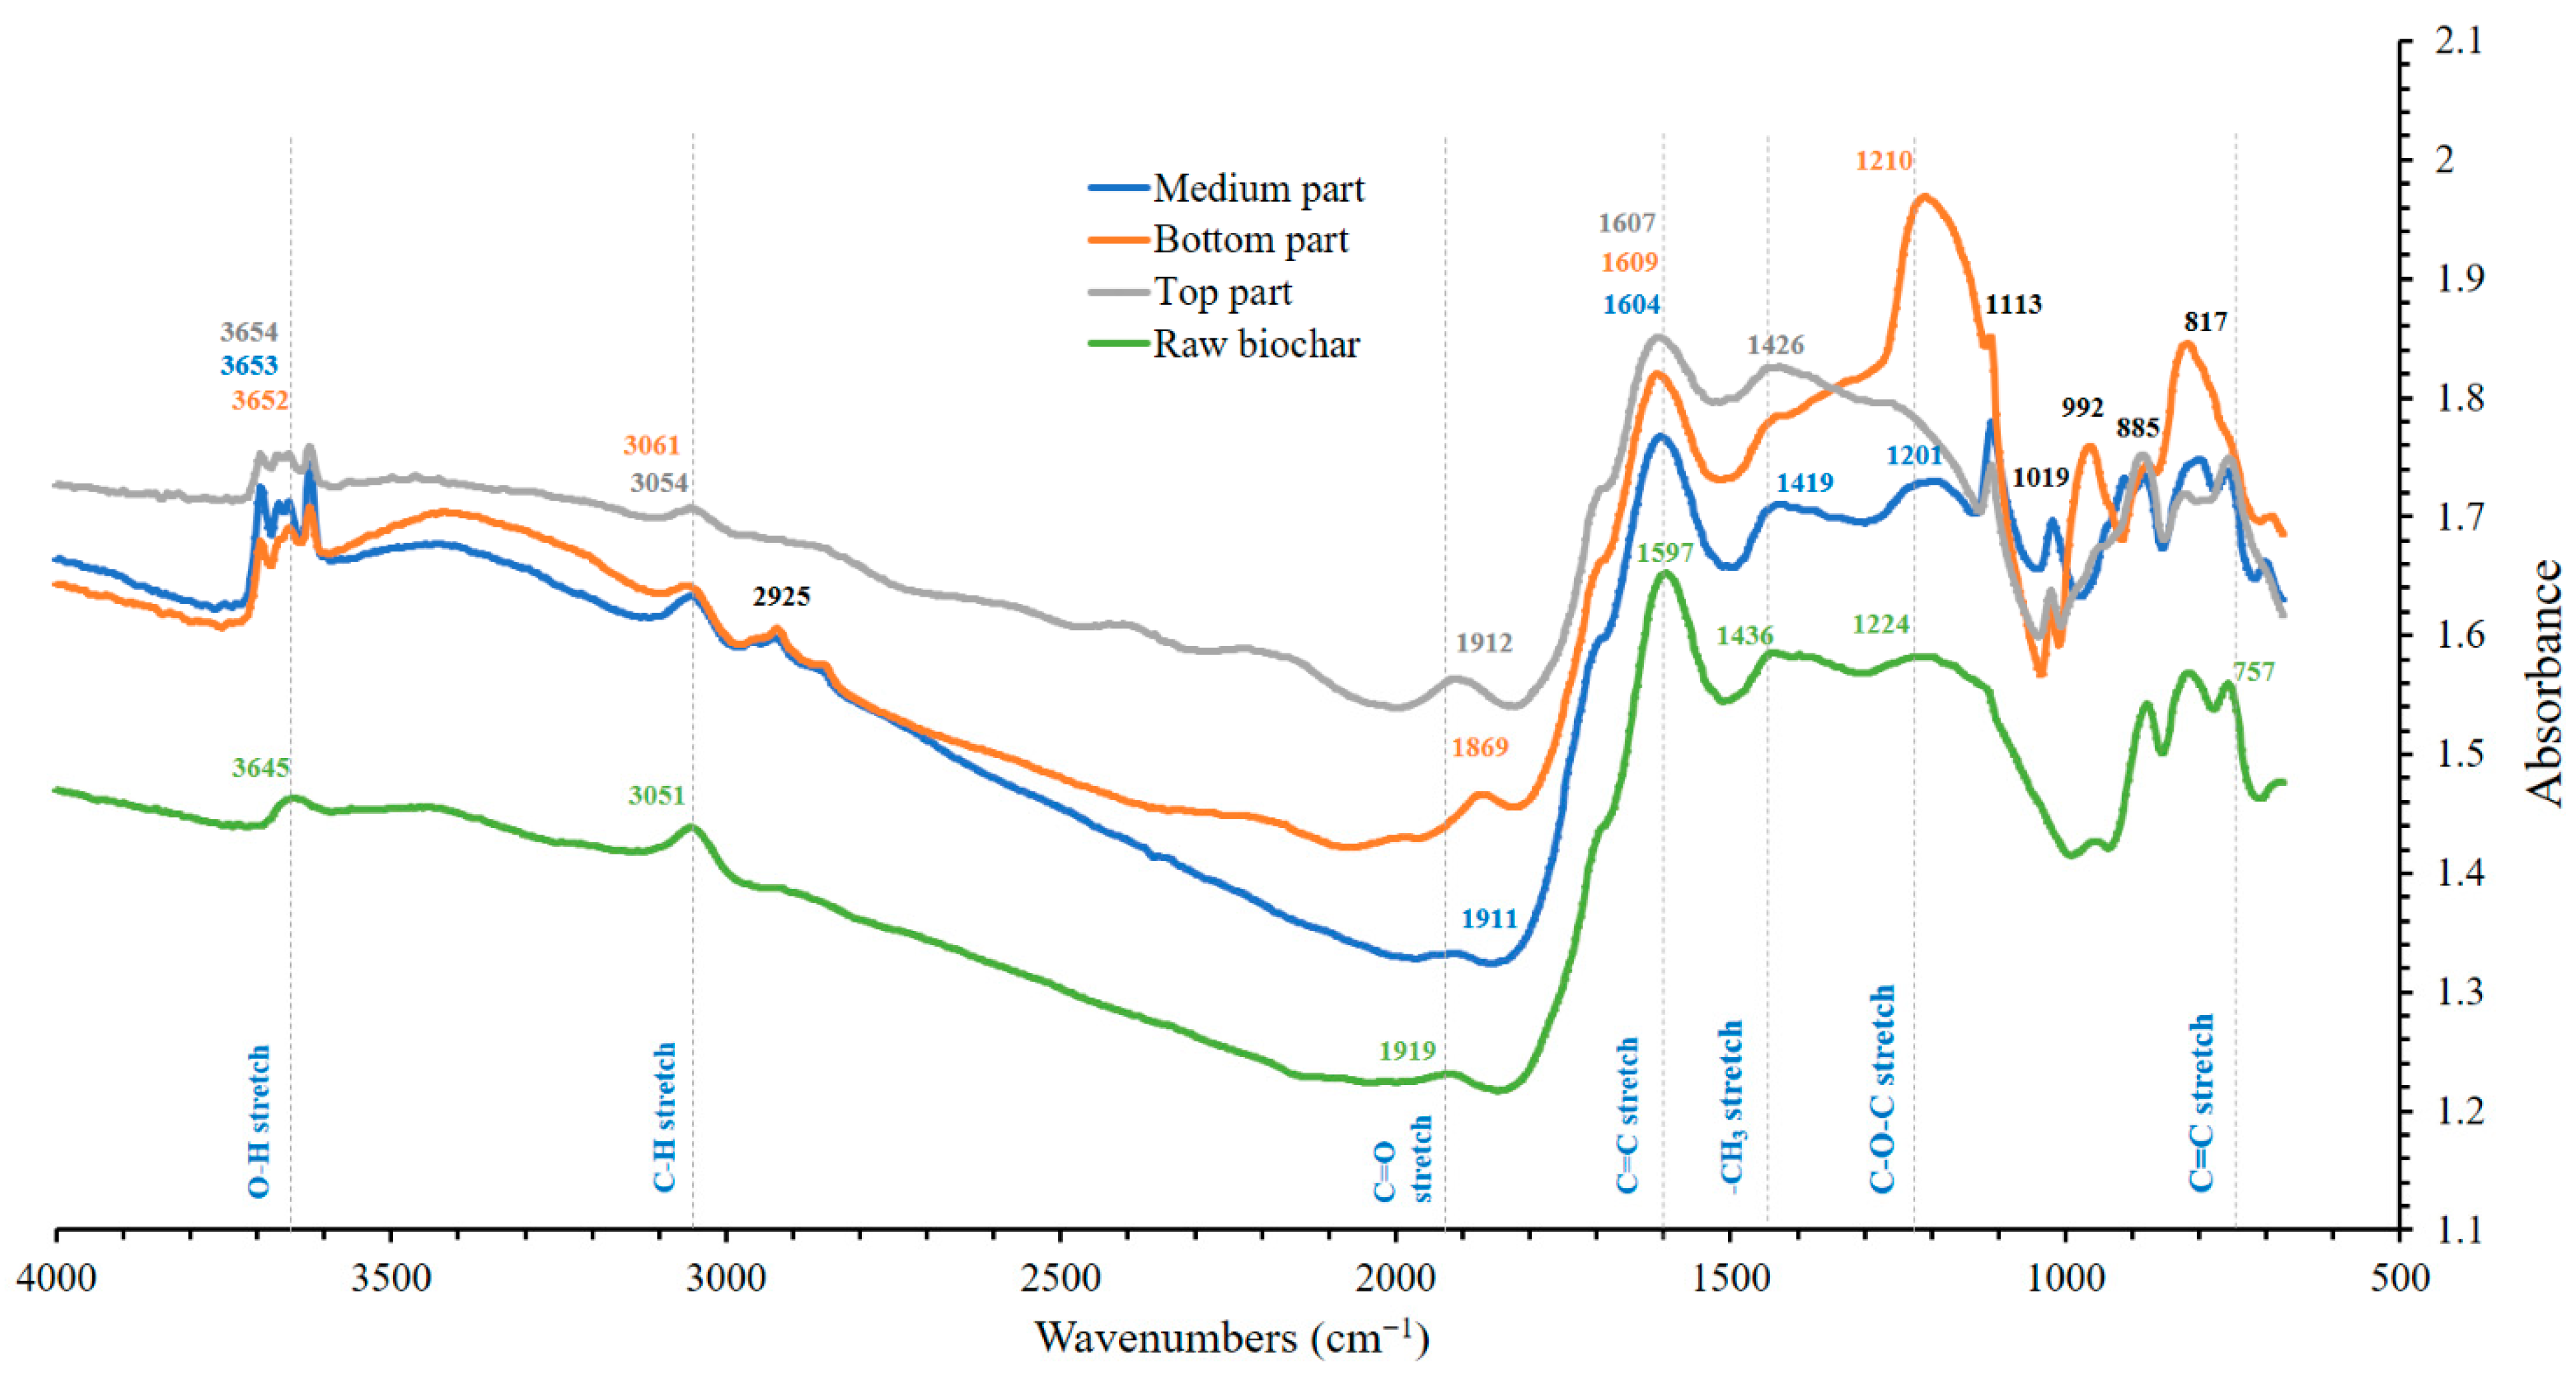
Given the high efficiency of biochar filtration in pollutant removal over sand filtration, Figure 5 presents the FTIR spectra of the biochar media along the filter zones (top, medium, and bottom) before and after handwashing wastewater treatment. Raw wheat straw biochar material showed peak of functional groups such as O-H alcohol group (3645 cm−1), C-H aromatic group (3051 cm−1), C=O carbonyl group (1919 cm−1), C=C aromatic group (1597 cm−1), -C-H3 alkene group (1436 cm−1), C-O-C aromatic group (1224 cm−1), and =C-H aromatic group (757 cm−1) [86]. Results of the FTIR spectra for biochar samples collected in the bottom, medium, and top part of the experimental set-up showed an increased change in the absorption intensity, indicating an increase in functional groups, attached to the molecular bond [87]. Furthermore, the FTIR spectra revealed shifts in the absorption peaks of functional groups of the samples from the bottom, medium, and top parts in the biochar filter, suggesting modifications in the electron distribution of the molecular bonds. For instance, a shift in the wavenumber of the absorption peaks of functional groups was observed for the O-H alcohol group, C-H aromatic group, C=O carbonyl group, C=C aromatic group, -C-H3 group, and C-O-C group [88]. New absorption bands within the wavenumber spectrum from 817 to 2925 cm−1 demonstrated the presence of pollutants of interest to the surface of the biochar media [89]. The new absorption bands can be seen highlighted in bold in Figure 5. The identified compounds were nitrates (817–835 cm−1), sulphates (~1109 cm−1), phosphates (1003–1048 cm−1), amorphous calcium phosphate (~992 cm−1), and calcium carbonate (~885 cm−1). These results confirmed the high efficiency of the biochar filtration process in removing pollutants of interest in handwashing wastewater.

3.4. The Potential Reuse of the Treated Water in Handwashing Applications

This research examined the efficiency of a two-step treatment system, composed of biochar and sand filters, in restoring handwashing wastewater for its potential reuse in handwashing and restricted activities including toilet flushing, garden irrigation, and floor cleaning. To accomplish this, this study compared the quality of the treated water against both potable water quality standards from WHO and USEPA and international treated greywater reuse guidelines (Table 1). The treated water complied with the permissible limits of several quality parameters for potable water. These included parameters such as temperature, electrical conductivity, turbidity, TSS, pH, nitrates, and hardness. Furthermore, the treated water met the allowable limits for COD and phosphates, making it also suitable for reuse in restricted applications (Figure S1). While the effluent quality fell within the acceptable limit for potable water use, such as handwashing, it is crucial to acknowledge the absence of specific guidelines for the reuse of treated handwashing wastewater in handwashing purposes worldwide, as of the current date. Currently, regulatory efforts have concentrated on general greywater reuse. Yet, considering handwashing wastewater is a less contaminated type of greywater, there is a need to develop water quality standards for reusing treated handwashing wastewater. This is crucial for promoting decentralised wastewater cleaning technologies in communities without or with limited access to piped clean water and drainage networks.
As of today, the available handwashing stations with water recovery systems rely on the compliance of microbial water quality parameters to reuse water for handwashing purposes. A shared characteristic among the Autarky, Gravit’eau, and WOTA handwashing units is their inclusion of treatment processes, such as membrane filtration and disinfection, aimed at reducing pathogens like E. coli to undetectable levels. The present investigation found that the primary treatment of handwashing wastewater using biochar filtration, followed by a secondary sand filtration process, reduced the E. coli concentration by a total of 2.5 log CFU/mL from an influent level of 6.1 log CFU/mL (resembling a scenario of extreme faecal contamination) (Table 3). The present study revealed that disinfecting the secondary effluent with 0.1 mg/L of NaClO resulted in the complete elimination of E. coli. This implies that the addition of disinfection as a tertiary treatment step to the sand filter effluent could potentially achieve a microbial water quality of similar characteristics to that of the Autarky, Gravit’eau, and WOTA handwashing units. Furthermore, the addition of disinfection as a tertiary treatment could minimise health risks associated with using the treated water for handwashing, garden irrigation, and floor washing purposes.
It is crucial to note that the conclusions of this study regarding the feasibility of reusing treated water for handwashing are confined to the selected water quality parameters and the synthetic handwashing wastewater used for this investigation. It is pertinent to note that addressing a more comprehensive range of water quality parameters remains a requirement for practical handwashing wastewater treatment and reuse. For instance, future research should focus on investigating the removal of several microbial (e.g., total coliforms, heterotrophic bacteria) and parasitological (e.g., helminth eggs and larvae, protozoan pathogens) parameters. However, the results of this study signify progress in investigating and assessing alternative bio-based and cost-effective technologies for restoring handwashing wastewater, making them reusable for resource-limited communities in low- and middle-income countries. The utilisation of biochar filtration, sand filtration, and chlorination appeared to enhance the quality of handwashing wastewater for reuse, according to worldwide-known water quality standards (e.g., WHO and USEPA). Nevertheless, it is worth mentioning that practical implementation in the field is crucial to evaluate the long-term efficacy of this small-scale technology alongside existing handwashing units in rural communities.

3.5. The Role of Sand Filtration as a Secondary Treatment

This study incorporated sand filtration as a secondary step in the treatment of handwashing wastewater. According to Table 3, sand filtration was not efficient in removing TSS, phosphates, nitrates, hardness, and E. coli, as no significant difference was found between the average concentration from the biochar filter effluent and the sand filter effluent. Surprisingly, this study found significant differences in terms of the concentration of colour, turbidity, and COD. This suggested that the sand filter contributed to reducing the levels of parameters associated with the appearance and organic matter content in the treated water. However, sand filtration could not remove colour and COD to levels below the permissible limits for potable purposes (Figure S1). Although previous research has reported the effectiveness of sand filtration in eliminating pathogens and suspended solids from water [25,63], this research reported that sand filtration is not efficient in removing E. coli from the severely polluted handwashing wastewater. The reasons linked to the low E. coli inactivation efficiency are still unclear. Nonetheless, the influent concentrations of E. coli and nutrients, along with the isoelectric point of E. coli, are likely significant factors contributing to the sand filter’s limited efficacy in removing E. coli. Concerning the influence of the influent pH on the pI of E. coli, if sand filtration is employed as a secondary treatment to eliminate E. coli from alkaline handwashing wastewater, identifying sustainable and affordable additives to modify the influent wastewater’s pH to match the isoelectric point (pI) of the target microbes is advisable. Furthermore, strategies to reduce the pH value of the alkaline influent wastewater at the point of generation could benefit the E. coli adsorption rate. For instance, the use of a soapy solution, made by mixing water with liquid or powdered soap, as an alternative to pure liquid or bar soap could result in the generation of less alkaline handwashing wastewater. Future studies might examine the incorporation of a biochar and sand filtration system in series, succeeded by a step of chlorination treatment.

3.6. Possible Scenario of Implementation in Rural School Settings

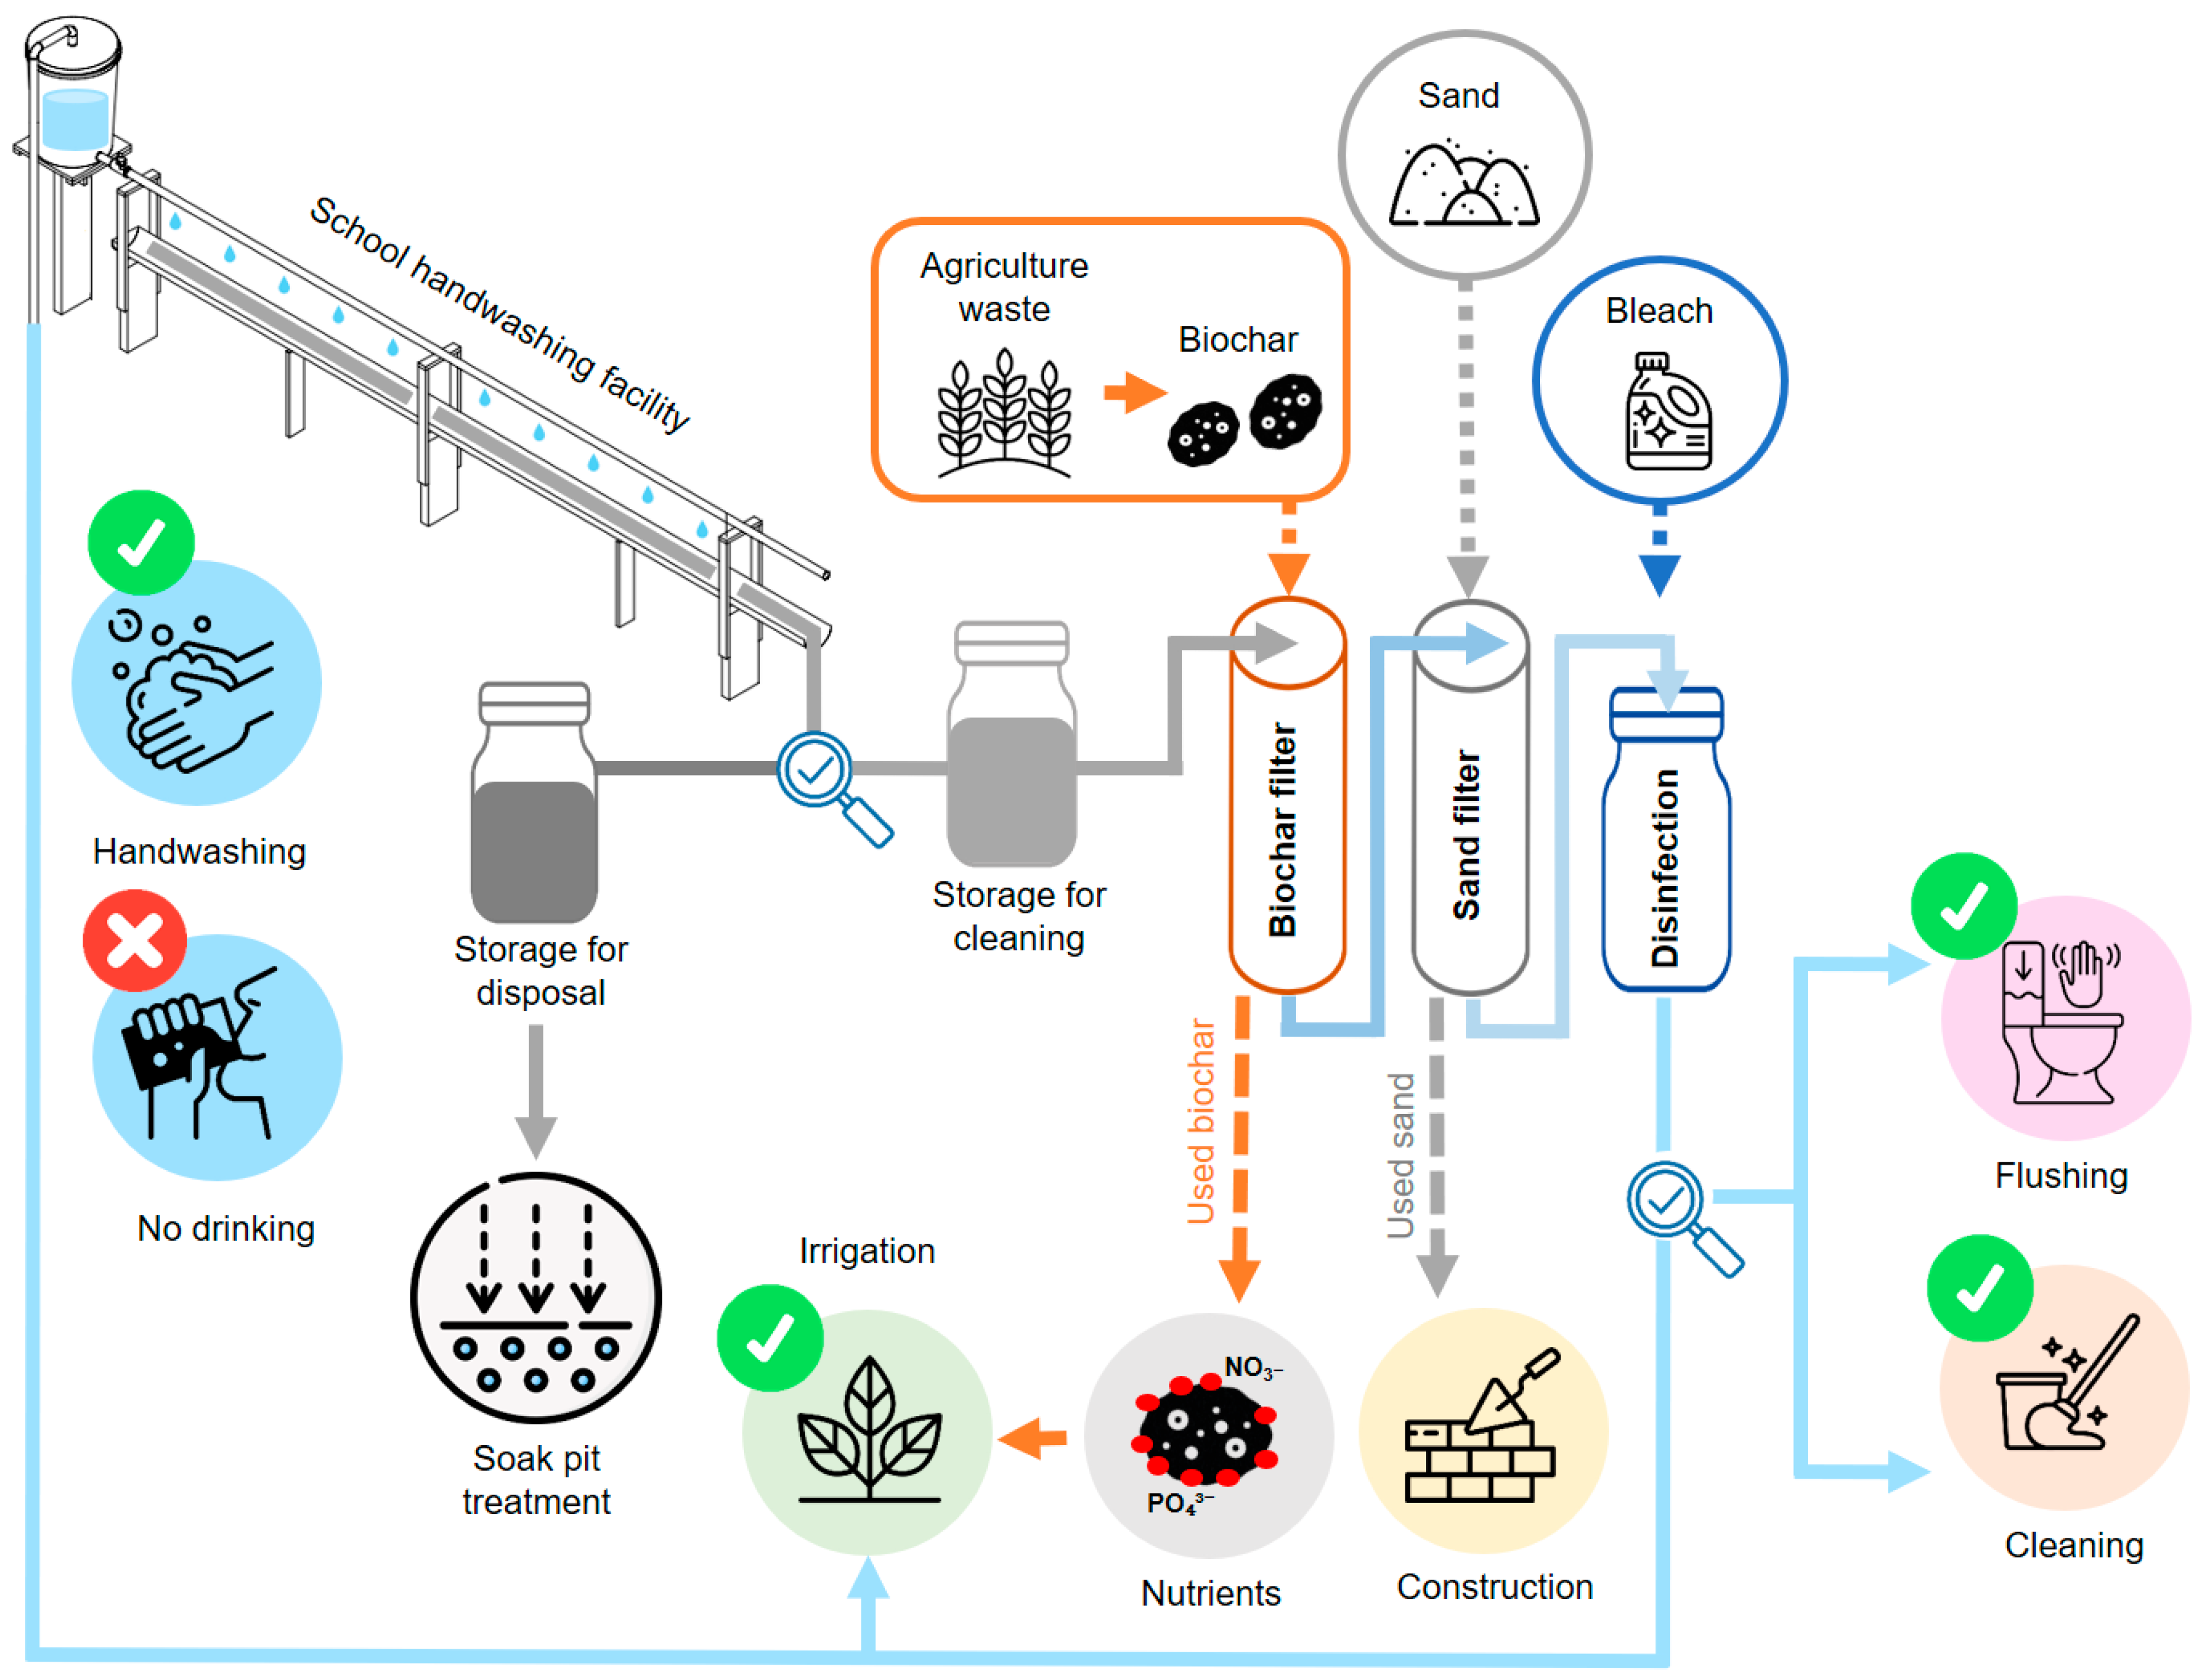
Rural schools situated in regions facing water shortages and with minimal or no access to piped clean water and sewage systems could benefit from a treatment system designed for treating and reusing handwashing wastewater [79]. This approach could help reduce the use of scarce freshwater resources and ensure available clean water for handwashing hygiene, flushing toilets, watering gardens, and floor washing. Figure 6 shows a possible scenario of implementation within rural school communities. According to UNICEF and GIZ [8], rural schools lacking a piped water network typically feature group handwashing stations equipped with buckets of 40 L volume that serve as water reservoirs. Nearly 2.5 L of wastewater is produced during the handwashing activity of one group of eleven students in a group handwashing station having 11 water outlets (perforation of 1.5 mm). However, this water is often discharged untreated onto the ground due to a lack of drainage systems. It is proposed that handwashing stations could be adapted to allow the collection of handwashing wastewater, avoiding discharge on the ground. The design of the water outlets could incorporate water-saving taps to minimise water consumption and handwashing wastewater generation.
Based on the findings from this study, the collected handwashing wastewater could be treated through a successive system including biochar filtration, sand filtration, and chlorination to regenerate the water quality for further water reuse. Biochar could be produced using local agricultural or forestry residue in small-scale pyrolysis unit reactors [21]. The present investigation demonstrated that the use of wheat straw biochar in the biochar filtration process could be efficient in removing a wide range of water pollutants of interest. As an abundant and annually available by-product in rural areas, wheat straw could be locally sourced and used for biochar production. Sand could also be sourced locally as it is a common and accessible construction material in many developing countries. The integrated biochar and sand filtration systems were proven to regenerate up to 63 L of handwashing wastewater while still maintaining the quality below the acceptable water quality standards for potable water use for handwashing purposes as set by WHO and USEPA. Furthermore, the treated water can be repurposed for school activities such as watering gardens, flushing toilets, and floor cleaning, thus minimising the freshwater demand at rural schools. When the biochar and sand filtration media reach their maximum pollutant removal capacities and can no longer clean water to desired water quality standard levels for water reuse, both materials can be repurposed to reduce waste generation in the cleaning process. The nutrient-enriched biochar could serve as a soil enhancer and a nutrient supplier for the school gardens [71]. The potential reuse of spent biochar as a soil enhancer and/or fertiliser depends on compliance with relevant regulatory and safety standards. In the context of handwashing wastewater treatment, used biochar may accumulate contaminants, primarily organic pollutants and pathogens, which could limit its safe application in agricultural settings. Thermal treatment methods (e.g., pyrolysis or incineration) may decompose organic contaminants and eliminate pathogens, and the resulting material could potentially be considered for use in soil application. However, appropriate risk assessment and full compliance with regulatory requirements are essential before any such reuse can be recommended. On the other hand, the sand media could undergo thermal treatment before being reused in local construction projects. Furthermore, if the quality of regenerated water could no longer meet the water quality standard for handwashing and greywater reuse applications, it could be safely disposed of in a soak-pit system [90]. The soak-pit system could filter the polluted regenerated handwashing wastewater avoiding groundwater contamination in rural areas without centralised wastewater treatment plants. This approach could effectively prevent direct human contact, reduce unpleasant odours, and inhibit the breeding of vector mosquitoes that would result from discharging the wastewater into the open ground [10]. It is important to note that this outline of potential implementation in rural school settings has not yet undergone field testing. As such, future research should concentrate on this aspect.

3.7. The Limitations of the Current Study

It is essential to acknowledge that the efficiency in pollutant removal achieved by the studied small-scale treatment system is limited to the type of feedstock used for biochar production (wheat straw), the characteristics of the inlet handwashing wastewater, the operational conditions, and the configuration of the treatment system. Thus, these conditions should be considered when performing field-test studies of the studied small-scale treatment system. By mimicking actual greywater compositions, the research ensures that the findings are not limited to specific lab formulation but are relevant to similar wastewater sources in different geographic locations. However, further test studies on real handwashing wastewater are essential. The duration of the study was limited, and long-term operational stability was not extensively evaluated. The sample size and monitoring frequency, while sufficient for initial assessment, could be expanded in future studies to improve statistical robustness. The current study did not implement and test the small-scale treatment system studied in real field situations. Further field-test studies are crucial to collect data on the technology’s performance under real environmental conditions (e.g., temperature, water quality) and to assess user interaction and acceptance, sustainability (e.g., Life Cycle Analysis), compliance with local regulatory standards and guidelines (if available), techno-economic viability, and long-term durability. Regarding scalability, the study’s results suggest that the biochar filtration system can be scaled up, such as treating higher volumes of handwashing wastewater in rural or/and decentralised areas. However, future studies are needed to investigate the system’s long-term durability, operational stability, and performance under more challenging water conditions, such as understanding media replacement frequency and potential performance decline over time.

4. Conclusions

This study evaluated the performance of a three-stage treatment system combining biochar, sand filtration, and disinfection for handwashing wastewater cleaning and reuse. The primary treatment with biochar filtration achieved significant reductions in turbidity, colour, COD, TSS, phosphates, nitrates, hardness, and E. coli by 96.6%, 95.5%, 56.3%, 98.4%, 84.7%, 41.9%, 62.8%, and 2.4 log, respectively. The secondary treatment with sand filtration further reduced these pollutants by 32.5%, 39.2%, 28.1%, 38.3%, 17.4%, 18.5%, 3.0% and 0.1 log, respectively. Overall, biochar filtration showed a better removal performance than sand filtration in improving water quality parameters associated with appearance, hygiene, chemical composition, and nutrient content. As E. coli was still present in the effluent water after the use of the biochar and sand filtration systems, disinfection with chlorine was implemented as a tertiary treatment targeting E. coli inactivation. Experimental trials demonstrated that a low dose of 0.1 mL/L NaClO could reduce 3.6 log of E. coli concentration to undetectable levels. The system treated 63 L of handwashing wastewater that met WHO and USEPA water quality standards of interest for reusing the treated water for handwashing purposes. Furthermore, the quality of the treated water met the acceptable water quality standards for reuse in restricted activities like garden irrigation, toilet flushing, and floor washing, following international greywater reuse guidelines.
This innovative water treatment strategy could help clean handwashing wastewater on-site in rural school communities of low- and middle-income regions suffering from water scarcity and the absence of water and drainage infrastructure. This could provide rural schoolchildren with clean water to support handwashing and schools’ water needs during periods of water shortage. Treating and reusing handwashing wastewater on-site could empower rural school communities to locally reclaim water in line with the circular water economy approach, contributing to the fulfilment of Sustainable Development Goals (SDGs). The proposed system directly contributes to SDG 6 (Clean Water and Sanitation), particularly Target 6.3, by improving water quality through the reduction of pollutants and enabling safe water reuse, as well as Target 6.1, by supporting access to safe and affordable water through low-cost and locally adaptable water treatment solutions. The use of biochar derived from locally available biomass further enhances accessibility and promotes sustainable resource utilisation in line with circular economy principles. The findings also support SDG 3 (Good Health and Well-being) by reducing exposure to microbial contaminants, including E. coli, lowering the risk of waterborne diseases. Safe water for hygiene purposes, such as handwashing, is critical for preventing disease transmission and protecting public health. Furthermore, the decentralised and resource-efficient nature of the system aligns with SDG 11 (Sustainable Cities and Communities), particularly in promoting sustainable infrastructure and reducing environmental impacts associated with untreated wastewater discharge.
Further studies should explore the long-term performance of the studied treatment system exposed to real handwashing wastewater of different compositions (e.g., nutrient-rich, faecal microbes-rich, suspended solids-rich). Additionally, studies should investigate the effectiveness of in-series biochar and sand filtration systems to enhance the colour, COD, and phosphates removal. Furthermore, future social studies are needed to understand the willingness, motivations, and concerns of rural school communities towards the implementation of an on-site treatment system for handwashing wastewater reuse. These topics of research could optimise the performance of the studied integrated system and boost social acceptance. This approach could ease adoption in rural school communities located in resource-limited countries facing water scarcity and without or limited water and drainage infrastructure.

Supplementary Materials

The following supporting information can be downloaded at: https://www.mdpi.com/article/10.3390/su18083964/s1, Figure S1: Characteristics of the effluent colour (A), turbidity (B), TSS (C), pH (D), electrical conductivity (EC) (E), COD (F), hardness (G), phosphates (H), nitrates (I), and E. coli (J) from biochar and sand filters and their compliance with acceptable limit ranges (LR) for potable water (yellow area) and greywater reuse in restricted activities (purple area); Table S1: Colour (A), turbidity (B), and TSS (C) levels in the effluents from the biochar filter (BF) and sand filter (SF) over the study period. RE is the percentage removal efficiency of BF and SF (to support Figure 2).

Author Contributions

J.I.B.Q.: methodology, data collection, data visualisation, artwork, writing of original draft. A.B.: conceptualisation, supervision, methodology, funding, resources, data collection, writing, review, and editing. L.C.C.: supervision, review, and editing. O.M.: supervision, review, editing, and resources (biochar). All authors have read and agreed to the published version of the manuscript.

Funding

This research was funded by [Coventry University] grant number [13911-06].

Data Availability Statement

Data will be made available on request.

Acknowledgments

Our sincere gratitude to the Centre for Agroecology, Water, and Resilience at Coventry University for the postgraduate scholarship grant (Project Code 13911-06), the UK Biochar Research Centre for the biochar samples, and Sam Towers for technical assistance.

Conflicts of Interest

The authors declared no potential conflicts of interest.

References

  1. Mekonnen, M.M.; Hoekstra, A.Y. Four billion people facing severe water scarcity. Sci. Adv. 2016, 2, e1500323. [Google Scholar] [CrossRef] [Scilit]
  2. Procházka, P.; Hönig, V.; Maitah, M.; Pljučarská, I.; Kleindienst, J. Evaluation of water scarcity in selected countries of the Middle East. Water 2018, 10, 1482. [Google Scholar] [CrossRef] [Scilit]
  3. Lee, E.J.; Schwab, K.J. Deficiencies in drinking water distribution systems in developing countries. J. Water Health 2005, 3, 109–127. [Google Scholar] [CrossRef] [Scilit] [PubMed]
  4. United Nations Children’s Fund (UNICEF); World Health Organization (WHO). Progress on Household Drinking Water, Sanitation and Hygiene, 2000–2017. Special Focus on Inequalities. 2019. Available online: https://www.who.int/publications/i/item/9789241516235 (accessed on 12 January 2024).
  5. United Nations Children’s Fund (UNICEF). 2 in 5 Schools Around the World Lacked Basic Handwashing Facilities Prior to COVID-19 Pandemic. 2020. Available online: https://www.unicef.org/press-releases/2-5-schools-around-world-lacked-basic-handwashing-facilities-prior-covid-19-pandemic (accessed on 2 February 2024).
  6. United Nations Children’s Fund (UNICEF); World Health Organization (WHO). State of the World’s Hand Hygiene: A Global Call to Action to Make Hand Hygiene a Priority in Policy and Practice. 2021. Available online: https://www.who.int/publications/i/item/9789240036444 (accessed on 2 February 2024).
  7. Adane, M.; Mengistie, B.; Mulat, W.; Medhin, G.; Kloos, H. The Most Important Recommended Times of Hand Washing with Soap and Water in Preventing the Occurrence of Acute Diarrhea Among Children Under Five Years of Age in Slums of Addis Ababa, Ethiopia. J. Community Health 2018, 43, 400–405. [Google Scholar] [CrossRef] [Scilit]
  8. United Nations Children’s Fund (UNICEF); World Health Organization (WHO); Deutsche Gesellschaft für Internationale Zusammenarbeit (GIZ). Scaling Up Group Handwashing in Schools: Compendium of Group Washing Facilities Across the Globe, Sanitation Learning Hub, New York, Eschborn. 2016. Available online: https://sanitationlearninghub.org/resource/scaling-up-group-handwashing-in-schools-compendium-of-group-washing-facilities-across-the-globe/ (accessed on 2 December 2023).
  9. Tiruneh, A.T.; Ndlela, W.N.; Heikkilä, J. Development of “press tap” hand washing technology: Design, construction and operational aspects. Int. J. Sci. Technol. Soc. 2016, 4, 48–56. [Google Scholar] [CrossRef] [Scilit]
  10. Mousavi, S.A.; Khodadoost, F. Effects of detergents on natural ecosystems and wastewater treatment processes: A review. Environ. Sci. Pollut. Res. 2019, 26, 26439–26448. [Google Scholar] [CrossRef] [Scilit]
  11. Olupot, P.W.; Menya, E.; Jjagwe, J.; Wakatuntu, J.; Kavuma, T.; Wabwire, A.; Kavuma, S.; Mcmondo, S.O.; Nabuuma, B.; Kalibbala, H.M. Development and appraisal of handwash-wastewater treatment system for water recycling as a resilient response to COVID-19. J. Environ. Chem. Eng. 2021, 9, 106113. [Google Scholar] [CrossRef] [Scilit]
  12. Sgroi, M.; Vagliasindi, F.G.A.; Roccaro, P. Feasibility, sustainability and circular economy concepts in water reuse. Curr. Opin. Environ. Sci. Health 2018, 2, 20–25. [Google Scholar] [CrossRef] [Scilit]
  13. Gravit’eau. Drinking Water Treatment and Greywater Recycling Technologies. 2023. Available online: https://www.graviteau.ch/ (accessed on 20 February 2023).
  14. Reynaert, E.; Greenwood, E.E.; Ndwandwe, B.; Riechmann, M.E.; Sindall, R.C.; Udert, K.M.; Morgenroth, E. Practical implementation of true on-site water recycling systems for hand washing and toilet flushing. Water Res. X 2020, 7, 100051. [Google Scholar] [CrossRef] [Scilit]
  15. WOTA. Water Freedom for Everyone, Everywhere. 2022. Available online: https://wota.co.jp/en/wosh/ (accessed on 21 February 2023).
  16. Boano, F.; Caruso, A.; Costamagna, E.; Ridolfi, L.; Fiore, S.; Demichelis, F.; Galvao, A.; Pisoeiro, J.; Rizzo, A.; Masi, F. A review of nature-based solutions for greywater treatment: Applications, hydraulic design, and environmental benefits. Sci. Total Environ. 2020, 711, 134731. [Google Scholar] [CrossRef] [Scilit]
  17. Alam, M.d.S.; Alessi, D.S. Chapter 4—Modeling the Surface Chemistry of Biochars. In Biochar from Biomass and Waste; Ok, Y.S., Tsang, D.C.W., Bolan, N., Novak, J.M., Eds.; Elsevier: Amsterdam, The Netherlands, 2019; pp. 59–72. [Google Scholar] [CrossRef] [Scilit]
  18. Bautista Quispe, J.I.; Campos, L.C.; Mašek, O.; Bogush, A. Use of biochar-based column filtration systems for greywater treatment: A systematic literature review. J. Water Process. Eng. 2022, 48, 102908. [Google Scholar] [CrossRef] [Scilit]
  19. Bautista Quispe, J.I.; Campos, L.C.; Mašek, O.; Bogush, A. Optimisation of biochar filter for handwashing wastewater treatment and potential treated water reuse for handwashing. J. Water Process. Eng. 2023, 54, 104001. [Google Scholar] [CrossRef] [Scilit]
  20. Kim, S.; Dale, B.E. Global potential bioethanol production from wasted crops and crop residues. Biomass Bioenergy 2004, 26, 361–375. [Google Scholar] [CrossRef] [Scilit]
  21. Brownsort, P.A.; Mašek, O. Small-scale Continuous Pyrolysis Apparatus: Capabilities and initial results. In Poster Session Presented at Biochar 2011, 3rd UKBRC Annual Conference, Edinburgh, UK; University of Edinburgh: Edinburgh, UK, 2011. [Google Scholar]
  22. Ghosh, S.; Nandasana, M.; Webster, T.J.; Thongmee, S. Agrowaste-generated biochar for the sustainable remediation of refractory pollutants. Front. Chem. 2023, 11, 1266556. [Google Scholar] [CrossRef] [Scilit]
  23. Afshar, M.; Mofatteh, S. Biochar for a sustainable future: Environmentally friendly production and diverse applications. Results Eng. 2024, 23, 102433. [Google Scholar] [CrossRef] [Scilit]
  24. Verma, S.; Daverey, A.; Sharma, A. Slow sand filtration for water and wastewater treatment—A review. Environ. Technol. Rev. 2017, 6, 47–48. [Google Scholar] [CrossRef] [Scilit]
  25. Bolton, C.R.; Randall, D.G. Development of an integrated wetland microbial fuel cell and sand filtration system for greywater treatment. J. Environ. Chem. Eng. 2019, 7, 103249. [Google Scholar] [CrossRef] [Scilit]
  26. Mašek, O.; Buss, W.; Roy-Poirier, A.; Lowe, W.; Peters, C.; Brownsort, P.; Mignard, D.; Pritchard, C.; Sohi, S. Consistency of biochar properties over time and production scales: A characterisation of standard materials. J. Anal. Appl. Pyrolysis 2018, 132, 200–210. [Google Scholar] [CrossRef] [Scilit]
  27. Hourlier, F.; Masse, A.; Jaouen, P.; Lakel, A.; Gerente, C.; Faur, C.; Cloirec, L.P. Formulation of synthetic greywater as an evaluation tool for wastewater recycling technologies. Environ. Technol. 2010, 31, 215–223. [Google Scholar] [CrossRef] [Scilit] [PubMed]
  28. Surendran, S.; Wheatley, A.D. Grey-water reclamation for non-potable re-use. Water Environ. J. 2007, 12, 406–413. [Google Scholar] [CrossRef] [Scilit]
  29. Ziemba, C.; Larivé, O.; Reynaert, E.; Morgenroth, E. Chemical composition, nutrient-balancing and biological treatment of hand washing greywater. Water Res. 2018, 1, 752–762. [Google Scholar] [CrossRef] [Scilit]
  30. Abed, S.N.; Scholz, M. Chemical simulation of greywater. Environ. Technol. 2016, 37, 1631–1646. [Google Scholar] [CrossRef] [Scilit] [PubMed]
  31. Dalahmeh, S. Capacity of Biochar Filters for Wastewater Treatment in Onsite Systems; Technical Report; Swedish University of Agricultural Sciences: Uppsala, Sweden, 2016; Available online: https://pub.epsilon.slu.se/14611/7/Dalahmeh_s_171005.pdf (accessed on 2 February 2024).
  32. Perez-Mercado, L.F.; Lalander, C.; Joel, A.; Ottoson, J.; Dalahmeh, S.; Vinnerås, B. Biochar filters as an on-farm treatment to reduce pathogens when irrigating with wastewater-polluted sources. J. Environ. Manag. 2019, 248, 109295. [Google Scholar] [CrossRef] [Scilit] [PubMed]
  33. Shaikh, I.N.; Ahammed, M.M. Sand filtration for greywater treatment: Long-term performance evaluation and optimization by response surface methodology. Urban Water J. 2023, 20, 450–464. [Google Scholar] [CrossRef] [Scilit]
  34. Adonadaga, M.-G.; Alimoh, S.C.; Ampadu, B. Effectiveness of some selected natural filter media for on-site small-scale treatment of medium strength greywater. J. Appl. Sci. Environ. Manag. 2020, 24, 887–893. [Google Scholar] [CrossRef] [Scilit]
  35. Berger, C. Biochar and Activated Carbon Filters for Greywater Treatment. Master’s Thesis, Swedish University of Agricultural Sciences, Uppsala, Sweden, 2012. Available online: https://stud.epsilon.slu.se/5183/ (accessed on 2 December 2023).
  36. Mokoena, M.M.; Mudau, L.S.; Mokgobu, M.I.; Mukhola, M.S. The use of sodium hypochlorite at point-of-use to remove microcystins from water containers. Toxins 2021, 13, 207. [Google Scholar] [CrossRef] [Scilit]
  37. Adebisi, O.O.; Obuekwe, I.S.; Akinsolu, F.T.; Olayemi, A.B. Evaluation of Escherichia coli as indicator of point-of-use chlorination efficiency of drinking water. J. Appl. Sci. Environ. Manag. 2017, 20, 955. [Google Scholar] [CrossRef] [Scilit]
  38. United States Environmental Protection Agency (USEPA). National Primary Drinking Water Regulations. 2023. Available online: https://www.epa.gov/ground-water-and-drinking-water/national-primary-drinking-water-regulations (accessed on 21 February 2023).
  39. World Health Organization (WHO). Guidelines for Drinking-Water Quality, 3rd ed.; Volume 1—Recommendations Incorporating the First and Second Addenda; WHO: Geneva, Switzerland, 2008. Available online: https://www.who.int/publications/i/item/9789241547611 (accessed on 18 November 2023).
  40. Ernst, M.; Sperlich, A.; Zheng, X.; Gan, Y.; Hu, J.; Zhao, X.; Wang, J.; Jekel, M. An integrated wastewater treatment and reuse concept for the Olympic Park 2008 Beijing. Desalination 2007, 202, 221–234. [Google Scholar] [CrossRef] [Scilit]
  41. Pidou, M.; Memon, F.A.; Stephenson, T.; Jefferson, B.; Jeffrey, P. Greywater recycling: A review of treatment options and applications. Eng. Sustain. 2007, 160, 119–131. [Google Scholar] [CrossRef] [Scilit]
  42. Asano, T. Water Reuse: Issues, Technologies, and Applications; McGraw-Hill Professional Publishing: New York, NY, USA, 2007. [Google Scholar]
  43. Roslan, N.A.; Saji, N. A prototype design of water filtration system and recycling system for flushing toilet progress. Eng. Appl. Technol. 2020, 1, 1–12. [Google Scholar]
  44. Chaillou, K.; Gérente, C.; Andrès, Y.; Wolbert, D. Bathroom greywater characterization and potential treatments for reuse. Water Air Soil Pollut. 2009, 215, 31–42. [Google Scholar] [CrossRef] [Scilit]
  45. Ministry of Health. Canadian Guidelines for Domestic Reclaimed Water for Use in Toilet and Urinal Flushing; Government of Canada: Ottawa, ON, Canada, 2010. Available online: https://www.canada.ca/content/dam/canada/health-canada/migration/healthy-canadians/publications/healthy-living-vie-saine/water-reclaimed-recyclee-eau/alt/reclaimed-water-eaux-recyclees-eng.pdf (accessed on 12 November 2023).
  46. World Health Organization (WHO). A Compendium of Standards for Wastewater Reuse in the Eastern Mediterranean Region; Regional Office for the Eastern Mediterranean: Cairo, Egypt, 2006. Available online: https://iris.who.int/bitstream/handle/10665/116515/dsa1184.pdf?sequence=1&isAllowed=y (accessed on 12 November 2023).
  47. Zerva, I.; Remmas, N.; Kagalou, I.; Melidis, P.; Ariantsi, M.; Sylaios, G.; Ntougias, S. Effect of Chlorination on Microbiological Quality of Effluent of a Full-Scale Wastewater Treatment Plant. Life 2021, 11, 68. [Google Scholar] [CrossRef] [Scilit]
  48. Wang, X.; Hu, X.; Wang, H.; Hu, C. Synergistic effect of the sequential use of UV irradiation and chlorine to disinfect reclaimed water. Water Res. 2012, 46, 1225–1232. [Google Scholar] [CrossRef] [Scilit]
  49. American Public Health Association (APHA). Standard Methods for Examination of Water and Wastewater, 22nd ed.; American Public Health Association: Washington, DC, USA, 2012; 1360p, ISBN 978-087553-013-0. [Google Scholar]
  50. Abd Rahman, M.M.; Kaamin, M.; Mohamad, M.A.H.; Mohmad Omar, M.H. ReWudhuk: A sustainable device to reuse Musta’mal water for ablution purpose. Adv. Sci. Lett. 2016, 22, 2170–2173. [Google Scholar] [CrossRef] [Scilit]
  51. Yaseen, Z.M.; Zigale, T.T.; Tiyasha, D.R.K.; Salih, S.Q.; Awasthi, S.; Tung, T.M.; Al-Ansari, N.; Bhagat, S.K. Laundry wastewater treatment using a combination of sand filter, bio-char and teff straw media. Sci. Rep. 2019, 9, 18709. [Google Scholar] [CrossRef] [Scilit] [PubMed]
  52. Kadenge, N. Design and Application of Meso-Scale Greywater Treatment System. Master’s Thesis, Botswana International University of Science and Technology, Palapye, Botswana, 2019. [Google Scholar] [CrossRef]
  53. Almeida, M.C.; Butler, D.; Friedler, E. At-source domestic wastewater quality. Urban Water 1999, 1, 49–55. [Google Scholar] [CrossRef] [Scilit]
  54. Laak, R. Relative pollution strength of undiluted waste materials discharge in household and the dilution waste used for each. In Manual of Gray Water Treatment Practice; Winneberger, J.H.T., Ed.; Ann Arbor Science: Ann Arbor, MI, USA, 1974; pp. 68–78. [Google Scholar]
  55. Bracher, G.H.; Carissimi, E.; Wolff, D.B.; Graepin, C.; Hubner, A.P. Optimization of an electrocoagulation-flotation system for domestic wastewater treatment and reuse. Environ. Technol. 2021, 42, 2669–2679. [Google Scholar] [CrossRef] [Scilit]
  56. Friedler, E. Quality of individual domestic greywater streams and its implication for on-site treatment and reuse possibilities. Environ. Technol. 2004, 25, 997–1008. [Google Scholar] [CrossRef] [Scilit] [PubMed]
  57. Jefferson, B.; Palmer, A.; Jeffrey, P.; Stuetz, R.; Judd, S. Grey water characterisation and its impact on the selection and operation of technologies for urban reuse. Water Sci. Technol. 2004, 50, 157–164. [Google Scholar] [CrossRef] [Scilit] [PubMed]
  58. Jamrah, A.; Al-Futaisi, A.; Prathapar, S.; Harrasi, A.A. Evaluating greywater reuse potential for sustainable water resources management in Oman. Environ. Monit. Assess. 2008, 137, 315–327. [Google Scholar] [CrossRef] [Scilit]
  59. Olupot, P.W.; Menya, E.; Jjagwe, J.; Wakatuntu, J.; Román, F.; Hensel, O. Optimization of roughing filtration unit for a handwashing wastewater recirculation point-of-use system. Water Sci. Technol. 2022, 86, 2528–2544. [Google Scholar] [CrossRef] [Scilit]
  60. Turyasingura, M.; Wakatuntu, J.; Lubwama, M.; Jjagwe, J.; Hensel, O.; Olupot, P.W. Optimisation of eggshell-zeolite composite as a potential surfactant adsorbent for hand-washing wastewater. Case Stud. Chem. Environ. Eng. 2023, 7, 100284. [Google Scholar] [CrossRef] [Scilit]
  61. Desale, V.; Hemant, W.; Mali, D. Characterisation of greywater & pollutant load for residential building—Economic analysis. Int. J. Adv. Res. Sci. Eng. 2017, 6, 678–682. Available online: http://www.ijarse.com/images/fullpdf/1490340479_N1086ijarse.pdf (accessed on 1 December 2023).
  62. Bautista Quispe, J.I.; Campos, L.C.; Mašek, O.; Bogush, A. Removal of anionic surfactant from aqueous solutions by adsorption onto biochars: Characterisation, kinetics, and mechanism. Environ Technol. 2024, 45, 5723–5744. [Google Scholar] [CrossRef] [Scilit]
  63. Subramanian, P.S.G.; Raj, A.V.; Jamwal, P.; Connelly, S.; Yeluripati, J.; Richards, S.; Ellis, R.; Rao, L. Decentralized treatment and recycling of greywater from a school in rural India. J. Water Process Eng. 2020, 38, 101695. [Google Scholar] [CrossRef] [Scilit]
  64. Neubrand, W.; Heiser, J.; Schindler, A.; Treberspurg, M.; Hofbauer, W.; Czaya, H. Greywater Recycling: Field Experience. In Water Resources Quality; Rubin, H., Shamir, U., Nachtnebel, P., Fürst, J., Eds.; Springer: Berlin, Germany, 2002; pp. 359–369. [Google Scholar] [CrossRef] [Scilit]
  65. Myers, E.G. Soap and Detergents. In Inedible Meat by-Products; Pearson, A.M., Dutson, T.R., Eds.; Advances in Meat Research Series; Springer: Dordrecht, The Netherlands, 1992; pp. 149–176. [Google Scholar] [CrossRef] [Scilit]
  66. Mahmoud, M.E.; Abdelfattah, A.M.; Tharwat, R.M.; Nabil, G.M. Adsorption of negatively charged food tartrazine and sunset yellow dyes onto positively charged triethylenetetramine biochar: Optimization, kinetics and thermodynamic study. J. Mol. Liq. 2020, 318, 114297. [Google Scholar] [CrossRef] [Scilit]
  67. Kamali, M.; Sweygers, N.; Al-Salem, S.; Appels, L.; Aminabhavi, T.M.; Dewil, R. Biochar for soil applications-sustainability aspects, challenges and future prospects. J. Chem. Eng. 2022, 428, 131189. [Google Scholar] [CrossRef] [Scilit]
  68. Papp, L.A.; Cardinali-Rezende, J.; de Souza Júdice, W.A.; Sanchez, M.B.; Araújo, W.L. Low biological phosphorus removal from effluents treated by slow sand filters. Appl. Microbiol. Biotechnol. 2022, 106, 5797–5809. [Google Scholar] [CrossRef] [Scilit]
  69. Samaraweera, H.; Palansooriya, K.N.; Dissanayaka, P.D.; Khan, A.H.; Sillanpää, M.; Mlsna, T. Sustainable phosphate removal using Mg/Ca-biochar hybrids: Current trends and future outlooks. Case Stud. Chem. Environ. Eng. 2023, 8, 100528. [Google Scholar] [CrossRef] [Scilit]
  70. Keating, C.; Chin, J.P.; Hughes, D.; Manesiotis, P.; Cysneiros, D.; Mahony, T.; Smith, C.J.; McGrath, J.W.; O’Flaherty, V. Biological Phosphorus Removal During High-Rate, Low-Temperature, Anaerobic Digestion of Wastewater. Front. Microbiol. 2016, 7, 226. [Google Scholar] [CrossRef] [Scilit]
  71. Almanassra, I.W.; Mckay, G.; Kochkodan, V.; Atieh, M.A.; Al-Ansari, T. A state of the art review on phosphate removal from water by biochars. Chem. Eng. J. 2021, 409, 128211. [Google Scholar] [CrossRef] [Scilit]
  72. He, Z.; Wang, C.; Cao, H.; Liang, J.; Pei, S.; Li, Z. Nitrate Absorption and Desorption by Biochar. Agronomy 2023, 13, 2440. [Google Scholar] [CrossRef] [Scilit]
  73. Martín-Rodríguez, A.J.; Rhen, M.; Melican, K.; Richter-Dahlfors, A. Nitrate Metabolism Modulates Biosynthesis of Biofilm Components in Uropathogenic Escherichia coli and Acts as a Fitness Factor During Experimental Urinary Tract Infection. Front. Microbiol. 2020, 11, 26. [Google Scholar] [CrossRef] [Scilit]
  74. Li, B.; Irvin, S. The comparison of alkalinity and ORP as indicators for nitrification and denitrification in a sequencing batch reactor (SBR). Biochem. Eng. J. 2007, 34, 248–255. [Google Scholar] [CrossRef] [Scilit]
  75. Nujić, M.; Milinković, D.; Habuda-Stanić, M. Nitrate removal from water by ion exchange. Croat. J. Food Sci. Technol. 2017, 9, 182–186. [Google Scholar] [CrossRef] [Scilit]
  76. Qian, S.; Hou, R.; Yuan, R.; Zhou, B.; Chen, Z.; Chen, H. Removal of Escherichia coli from domestic sewage using biological sand filters: Reduction effect and microbial community analysis. Environ. Res. 2022, 209, 112908. [Google Scholar] [CrossRef] [Scilit]
  77. Afrooz, A.R.; Boehm, A.B. Escherichia coli Removal in Biochar-Modified Biofilters: Effects of Biofilm. PLoS ONE 2016, 11, e0167489. [Google Scholar] [CrossRef] [Scilit]
  78. Lalander, C.; Dalahmeh, S.; Jönsson, H.; Vinnerås, B. Hygienic quality of artificial greywater subjected to aerobic treatment: A comparison of three filter media at increasing organic loading rates. Environ. Technol. 2013, 34, 2657–2662. [Google Scholar] [CrossRef] [Scilit] [PubMed]
  79. Treacy, J. Drinking Water Treatment and Challenges in Developing Countries; IntechOpen Limited: London, UK, 2019. [Google Scholar] [CrossRef] [Scilit]
  80. Verbyla, M.E.; Pitol, A.K.; Navab-Daneshmand, T.; Marks, S.J.; Julian, T.R. Safely Managed Hygiene: A Risk-Based Assessment of Handwashing Water Quality. Environ. Sci. Technol. 2019, 53, 2852–2861. [Google Scholar] [CrossRef] [Scilit] [PubMed]
  81. Nielsen, A.M.; Garcia, L.A.T.; Silva, K.J.S.; Sabogal-Paz, L.P.; Hincapié, M.M.; Montoya, L.J.; Galeano, L.; Galdos-Balzategui, A.; Reygadas, F.; Herrera, C.; et al. Chlorination for low-cost household water disinfection—A critical review and status in three Latin American countries. Int. J. Hyg. Environ. Health 2022, 244, 114004. [Google Scholar] [CrossRef] [Scilit]
  82. Sharma, V.K.; Zboril, R.; McDonald, T.J. Formation and toxicity of brominated disinfection byproducts during chlorination and chloramination of water: A review. J. Environ. Sci. Health Part B 2013, 49, 212–228. [Google Scholar] [CrossRef] [Scilit]
  83. Bernstein, A.; Siebner, H.; Kaufman, A.G.; Gross, A. Onsite Chlorination of Greywater in a Vertical Flow Constructed Wetland—Significance of Trihalomethane Formation. Water 2021, 13, 903. [Google Scholar] [CrossRef] [Scilit]
  84. Agus, E.; Voutchkov, N.; Sedlak, D.L. Disinfection by-products and their potential impact on the quality of water produced by desalination systems: A literature review. Desalination 2009, 237, 214–237. [Google Scholar] [CrossRef] [Scilit]
  85. Elsaidy, N.R.; Elleboudy, N.S.; Alkhedaide, A.; Abouelenien, F.A.; Abdelrahman, M.H.; Soliman, M.M.; Shukry, M. Enhancement Effects of Water Magnetization and/or Disinfection by Sodium Hypochlorite on Secondary Slaughterhouse Wastewater Effluent Quality and Disinfection By-Products. Processes 2022, 10, 1589. [Google Scholar] [CrossRef] [Scilit]
  86. Zhao, J.J.; Shen, X.J.; Domene, X.; Alcañiz, J.M.; Liao, X.; Palet, C. Comparison of biochars derived from different types of feedstock and their potential for heavy metal removal in multiple-metal solutions. Sci. Rep. 2019, 9, 9869. [Google Scholar] [CrossRef] [Scilit] [PubMed]
  87. Janu, R.; Mrlik, V.; Ribitsch, D.; Hofman, J.; Sedláček, P.; Bielská, L.; Soja, G. Biochar surface functional groups as affected by biomass feedstock, biochar composition and pyrolysis temperature. Carbon Resour. Convers. 2021, 4, 36–46. [Google Scholar] [CrossRef] [Scilit]
  88. Veres, P. FTIR Analysis of Particulate Matter Collected on Teflon Filters in Columbus, OH. Undergraduate Thesis, The Ohio State University, Columbus, OH, USA, 2005. Available online: https://research.cbc.osu.edu/allen.697/wp-content/uploads/2011/09/thesis-Veres-2005.pdf (accessed on 1 December 2023).
  89. Putra, W.P.; Kamari, A.; Yusoff, S.N.M.; Ishak, C.F.; Mohamed, A.; Hashim, N.; Isa, I.M. Biosorption of Cu(II), Pb(II) and Zn(II) ions from aqueous solutions using selected waste materials: Adsorption and characterisation studies. J. Encapsulation Adsorpt. Sci. 2014, 4, 25–35. [Google Scholar] [CrossRef]
  90. Knight, J.; Kontos, L.; Da Cunha Forte, J.; Muktadir, G.; Gautam, O.P. Technical Guide for Handwashing Facilities in Public Places and Buildings. 2020. Available online: https://washmatters.wateraid.org/sites/g/files/jkxoof256/files/technical-guide-for-handwashing-facilities-in-public-places-and-buildings.pdf (accessed on 11 December 2023).
Figure 2. Colour (A), turbidity (B), and TSS (C) levels in the influent and effluents from the biochar filter (BF) and sand filter (SF) over the study period. RE is the percentage removal efficiency of BF and SF.
Sustainability 18 03964 g002
Figure 3. pH (A), COD (B), and hardness (C) levels in the influent and effluents from the biochar filter (BF) and sand filter (SF) over the study period. RE is the percentage removal efficiency of BF and SF.
Sustainability 18 03964 g003
Figure 4. Phosphates (A), nitrates (B), and E. coli levels (C) in the influent and effluents from the biochar filter (BF) and sand filter (SF) over the study period. RE is the percentage removal efficiency of BF and SF. CFU is colony-forming unit.
Sustainability 18 03964 g004
Figure 5. FTIR spectra of the raw biochar and samples across the biochar filter.
Sustainability 18 03964 g005
Figure 6. Possible implementation strategy for rural school settings. The image is not scaled proportionally.
Sustainability 18 03964 g006
Table 1. International guidelines for potable water and greywater reuse.
ParameterUnitsPotable Water Quality StandardTreated Greywater Reuse Standards
WHOUSEPA ChinaJapan USAMalaysia Jordan ItalyCanadaTunisiaOman
Temperature°C12–25
ColourPt/Co<10<10<30
TurbidityNTU<50.5–1<5 g <20 h<2<2 <10 c <2
TSSmg/L<25 <10<10<30<15 k 30 l
pH 6.0–8.56.5–8.56–95.8–8.66–96–9 b6–96–9.5 6.5–8.56–9
ECµS/cm<1500<1000 <6000 b<1500 <7000<2000 k <2700 l
CODmg/L<20 <100 b<100 c <500 d,e<100 <90<150 k <200 l
Hardnessmg CaCO3/L<200 <300 f
Residual chlorinemg/L Cl20.5–5 >0.2 i >1 j >1 >0.5
Nitratesmg NO3/L<10<10 <30 c
Phosphatesmg PO43−/L<0.4 <30
E. coliCFU/100 mL00 0 b<100 c <1000 d<10
Reuse purpose PPTF, IRTFFWIRIRIRFWIRIR
Reference [39][38][40][41][42][43][35][44][45][46][46]
WHO: World Health Organization; USEPA: United States Environmental Protection Agency; TSS: total suspended solids; EC: electrical conductivity; COD: chemical oxygen demand; P: potable; TF: toilet flushing; IR: irrigation; FW: floor washing. b Malaysian water quality standards for irrigation water. c Cooked vegetables, parking areas, playgrounds, and side of roads inside cities. d Plenteous trees and green areas, side of roads outside cities. e Field crops, industrial crops, and forestry. f HCO3 as CaCO3 is equivalent to HCO3 mg/L/1.22. g Chinese water quality standards for reclamation in toilet flushing. h Chinese water quality standards for reclamation in irrigation of greens. i After 30 min. j At point of use. k Vegetables likely to be eaten raw. l Vegetables to be cooked or processed.
Table 2. Characteristics of the influent handwashing wastewater and comparison with the available literature.
ParameterUnit nInfluentLiterature
MinMaxMean SD[28][53][54][55][56][57][58][59][60][11][14] [61]
Temperature °C2116.920.618.50.0
EC μS/cm21487.2658.2585.40.4
pH 217.78.58.10.08.1 7.277.327.26.628.15.55 7.6
TurbidityNTU21170.0335.0245.214.0102 84.3 164211775289348.3 180.1
ColourPt/Co21933.31816.71305.7341.5 8508.65502614.7
CODmg/L21313.3646.7455.526.8433298383340.5386587110 562 510 a225.3
TSS mg/L10336.7440.0388.517.440181 89.2259153318288.8204471.7 90.3
Phosphates mg/L PO43−2144.3200.794.37.845.513.3 14150.4
Nitrates mg/L NO3148.315.411.20.40.3460.280.06 10.2
Hardness mg/L CaCO321250.0387.5327.419.1 47.2 14.4
E. coliLog10 CFU/mL125.96.46.10.0 10 * 2543 *1030 * 8 *
SD: standard deviation; EC: electrical conductivity; COD: chemical oxygen demand; TSS: total suspended solids. a Values reported for the handwashing facility in Durban. * Values expressed as CFU/100 mL.
Table 3. Removal efficiency performance of the biochar and sand filtration systems in comparison to other treatment systems reported in the literature.
ParameterUnitsnThis StudyOlupot et al. [56]Reynaert et al. [14]Olupot et al. [11]Bolton and Randall [21]Subramanian et al. [63]
Biochar Filtration (BF) and Sand Filtration (SF)Silica Sand FiltrationMembrane Filtration, Filtration (Granular Activated Carbon) and DisinfectionMixed Filtration (Silica Sand, Zeolite, and Granular Activated Carbon) and DisinfectionWetland Microbial Fuel Cell and Sand FiltrationSand Biofiltration, Anaerobic Sludge Bioreactor, Aeration, and Disinfection
BF Effluent
Mean SD
SF Effluent
Mean SD
RE
BF
RE
SF
p-Value
IF vs. BF
p-Value
BF vs. SF
IFEFREIFEFREIFEFRE IFEFREIFEFRE
Temperature °C2118.30.118.40.1 0.38410.6118
EC μS/cm21639.52.0634.50.4 0.00360.7852 2490
pH 218.00.08.00.0 0.42590.90416.766.87 8 5.55
TurbidityNTU218.31.45.61.296.632.5<0.0001<0.000171633755 0.4 348598.5 1961.999
ColourPt/Co2159.04.635.92.995.539.2<0.0001<0.00017378591619.81 0 637.331098.1
CODmg/L21199.016.9143.514.856.328.1<0.00010.0260799757.55.195109.199.7 4324.329964325.796
TSS mg/L106.01.23.73.598.438.3<0.00010.3730288.8151.652.51 1.7 471.67996.9 351798
Phosphates mg/L PO43−2114.40.911.90.684.717.4<0.00010.2022 4.499.9
Nitrates mg/L NO3146.50.35.30.341.918.50.00200.4419 5.5 3411.666
Hardness mg/L CaCO321121.720.1118.120.562.83.0<0.00010.6440
E. coliLog10 CFU/mL123.70.03.60.02.4 *0.1 *<0.00010.5699 <1 β n.d.1004n.d.100
RE: removal efficiency (%); IF: influent; EF: effluent; SD: standard deviation; EC: electrical conductivity; COD: chemical oxygen demand; TSS: total suspended solids. The p-values highlighted in green represent statistically significant differences. The p-values highlighted in red indicate a lack of statistically significant differences. * Reduction is expressed in terms of log reductions. β Value in MPN/100 mL.
Table 4. Characteristics of tertiary effluent after disinfection with NaClO.
ParameterUnit nDose of NaClO (mL/L)
0.1SD0.3SD0.5SDp-Value
Temperature °C319.70.020.00.020.00.00.7697
pHμS/cm38.60.08.60.08.60.00.9979
EC 3742.40.4739.80.120.00.20.9840
ColourPt/Co343.32.940.11.551.78.20.9049
TurbidityNTU35.52.05.40.95.81.50.9946
CODmg/L3119.930.2104.35.7113.312.40.6384
Phosphates mg/L PO43−312.40.212.30.512.11.00.9981
Nitrates mg/L NO333.10.23.30.23.50.50.9536
Hardness mg/L CaCO33111.117.1124.48.5112.217.20.8523
E. coliLog10 CFU/mL12n.d.-n.d.-n.d.--
SD: standard deviation; EC: electrical conductivity; COD: chemical oxygen demand; n.d.: not detected.
Disclaimer/Publisher’s Note: The statements, opinions and data contained in all publications are solely those of the individual author(s) and contributor(s) and not of MDPI and/or the editor(s). MDPI and/or the editor(s) disclaim responsibility for any injury to people or property resulting from any ideas, methods, instructions or products referred to in the content.