Article

Integrating Agro-Hydrological Modeling with Index-Based Vulnerability Assessment for Nitrate-Contaminated Groundwater


by
Dawid Potrykus
1,2,
Adam Szymkiewicz
2,*,
Beata Jaworska-Szulc
2,
Gianluigi Busico
3,
Anna Gumuła-Kawęcka
2,
Wioletta Gorczewska-Langner
2 and
Micol Mastrocicco
3
1
Polish Geological Institute—National Research Institute, Marine Geology Branch, Koscierska 5, 80-328 Gdansk, Poland
2
Faculty of Civil and Environmental Engineering, Gdansk University of Technology, Narutowicza 11/12, 80-233 Gdansk, Poland
3
Department of Environmental, Biological and Pharmaceutical Sciences and Technologies, University of Campania “Luigi Vanvitelli”, Via A. Vivaldi 43, 81100 Caserta, Italy
*
Author to whom correspondence should be addressed.
Sustainability 2026, 18(2), 729; https://doi.org/10.3390/su18020729
Submission received: 22 October 2025 / Revised: 29 December 2025 / Accepted: 2 January 2026 / Published: 10 January 2026

Abstract

Protecting groundwater against pollution from agricultural sources is a key aspect of sustainable management of soil and water resources. Implementation of sustainable strategies for agricultural production can be supported by modeling tools, which allow us to quantify the effects of different agricultural practices in the context of groundwater vulnerability to contamination. In this study we present a method to assess groundwater vulnerability to nitrate pollution based on a combination of the SWAT agro-hydrological model and the DRASTIC index method. SWAT modeling was applied to assess different scenarios of agricultural practices and identify solutions for sustainable management of soil and groundwater and reduction of nitrate pollution. The developed method was implemented for groundwater resources in a study area (Puck Bay region, southern Baltic coast), which represented a complex multi-aquifer system formed in Quaternary fluvioglacial deposits (sand and gravel) separated by moraine tills. In order to investigate the effects of different agricultural practices, 12 scenarios have been defined, which were grouped into four classes: crop type, fertilizer management, tillage, and grazing. An overlay index structure was applied, and ratings and weights to several factors were assigned. All analyses were processed using GIS tools, and the results are presented in the form of maps, which categorize groundwater vulnerability to nitrate pollution into five classes, ranging from very low to very high. The results reveal significant variability in groundwater vulnerability to nitrate pollution in the study area. Agricultural practices have a very strong influence on groundwater vulnerability by controlling both recharge rates and nitrogen losses from the soil profile. The most pronounced increases in vulnerability were associated with scenarios involving excessive fertilization and intensive grazing. Among crop types, potato cultivation appears to pose the greatest risk to groundwater quality.

1. Introduction

Agriculture is an important sector of the global economy and produces food and other goods; however, it is also responsible for significant anthropogenic pressure worldwide [1,2,3]. It is especially important in the context of long-term global population growth, which will probably increase the expansion and intensification of agricultural production necessary to meet increasing food demands [4]. The motivation for agricultural production is indisputable. On the other hand, these activities have a profound impact on groundwater resources. A number of field studies show that agriculture can be the main source of groundwater pollution, exerting a predominant influence on the dynamics and direction of hydrogeochemical change [5,6,7,8,9,10,11,12,13]. Protecting groundwater against pollution from agricultural sources is a key aspect of sustainable management of soil and water resources. Implementation of sustainable strategies for agricultural production can be supported by modeling tools, which allow us to quantify the effects of different agricultural practices in the context of groundwater vulnerability to contamination.
Nitrate (NO3) is a widely recognized indicator of agricultural pollution in groundwater, as it is associated with the terminal stage of organic matter biodegradation. NO3 concentrations in the aquifers typically do not exceed several tens of mg/L, whereas under natural conditions they are generally limited to a few mg/L [14]. At low concentrations, NO3 can migrate to the most mobile substances, which is an effect of minimal adsorption capacity [15]. As a result, they can be transported over considerable distances from the contamination source at rates comparable to those of conservative contaminants [16]. Being both highly mobile and the most stable form of nitrogen, NO3 is usually readily leached from the soil profile into groundwater.
The assessment of groundwater vulnerability to pollution is a widely used approach for determining actions necessary for groundwater protection. However, this concept has been variously defined over the years and can be generally divided into intrinsic and specific vulnerability [17,18,19,20]. Intrinsic vulnerability determines the potential for contamination transport to the aquifer based on pivotal properties of a hydrogeological system. Specific vulnerability additionally includes information about pollutant type and load, area, and duration of the injection from the pollution source. Results of vulnerability assessments are typically presented in the form of maps, which have become valuable tools for decision-making by local governments, environmental agencies, spatial planners, and land users [21].
A number of methods have been developed for groundwater vulnerability assessment (e.g., [20,22,23,24,25]). The most common are index-overlay methods [26]—widely applied in many parts of the world—for either local or regional scales [27,28,29,30,31,32,33]. These methods are based on ranking and weighting systems assigned to a set of parameters that have the greatest influence on the potential migration of contaminants into the aquifer. The most frequently used ranking-based methods for porous media include DRASTIC [34], GOD [35], AVI [36], and SINTACS [37]. In contrast, for karstic regions, DIVERSITY [38], EPIK [39], and COP [27] are mainly applied methods. Beyond the well-known advantages, these methods can be affected by an intrinsic subjectivity of weights and rates or implementation of static and redundant parameters. To improve their effectiveness, they are often modified by adjusting weights and rankings or incorporating additional parameters into the computational algorithm [40]. In recent research, groundwater vulnerability to NO3 pollution was assessed by adapting the widely used DRASTIC method [34]. Various alternative approaches have been developed for this purpose, such as CD [41], NV [42], SI [43], and DRASTIC-PA [31]. However, these methods include agricultural practices in general, typically by incorporating some parameter related to land use.
In this study we develop a method to assess groundwater-specific vulnerability to NO3 pollution based on a combination of SWAT agro-hydrological model and the modified DRASTIC index method. This study aimed to improve the reliability and representativeness of groundwater vulnerability to NO3, with a particular focus on various agricultural practices. Recent studies proposed incorporation of SWAT model outputs into the DRASTIC method [44,45,46,47,48,49], but these efforts largely focused on groundwater recharge estimations or effects of land use changes.
The SWAT modeling presented in this study was applied to investigate the impact of different scenarios of agricultural practices on groundwater quality, which was further used for setting guidelines for soil and groundwater sustainable management, including reduction of NO3 pollution. The method was employed for a complex multi-aquifer system in the Puck Bay region (southern Baltic coast).

2. Study Area

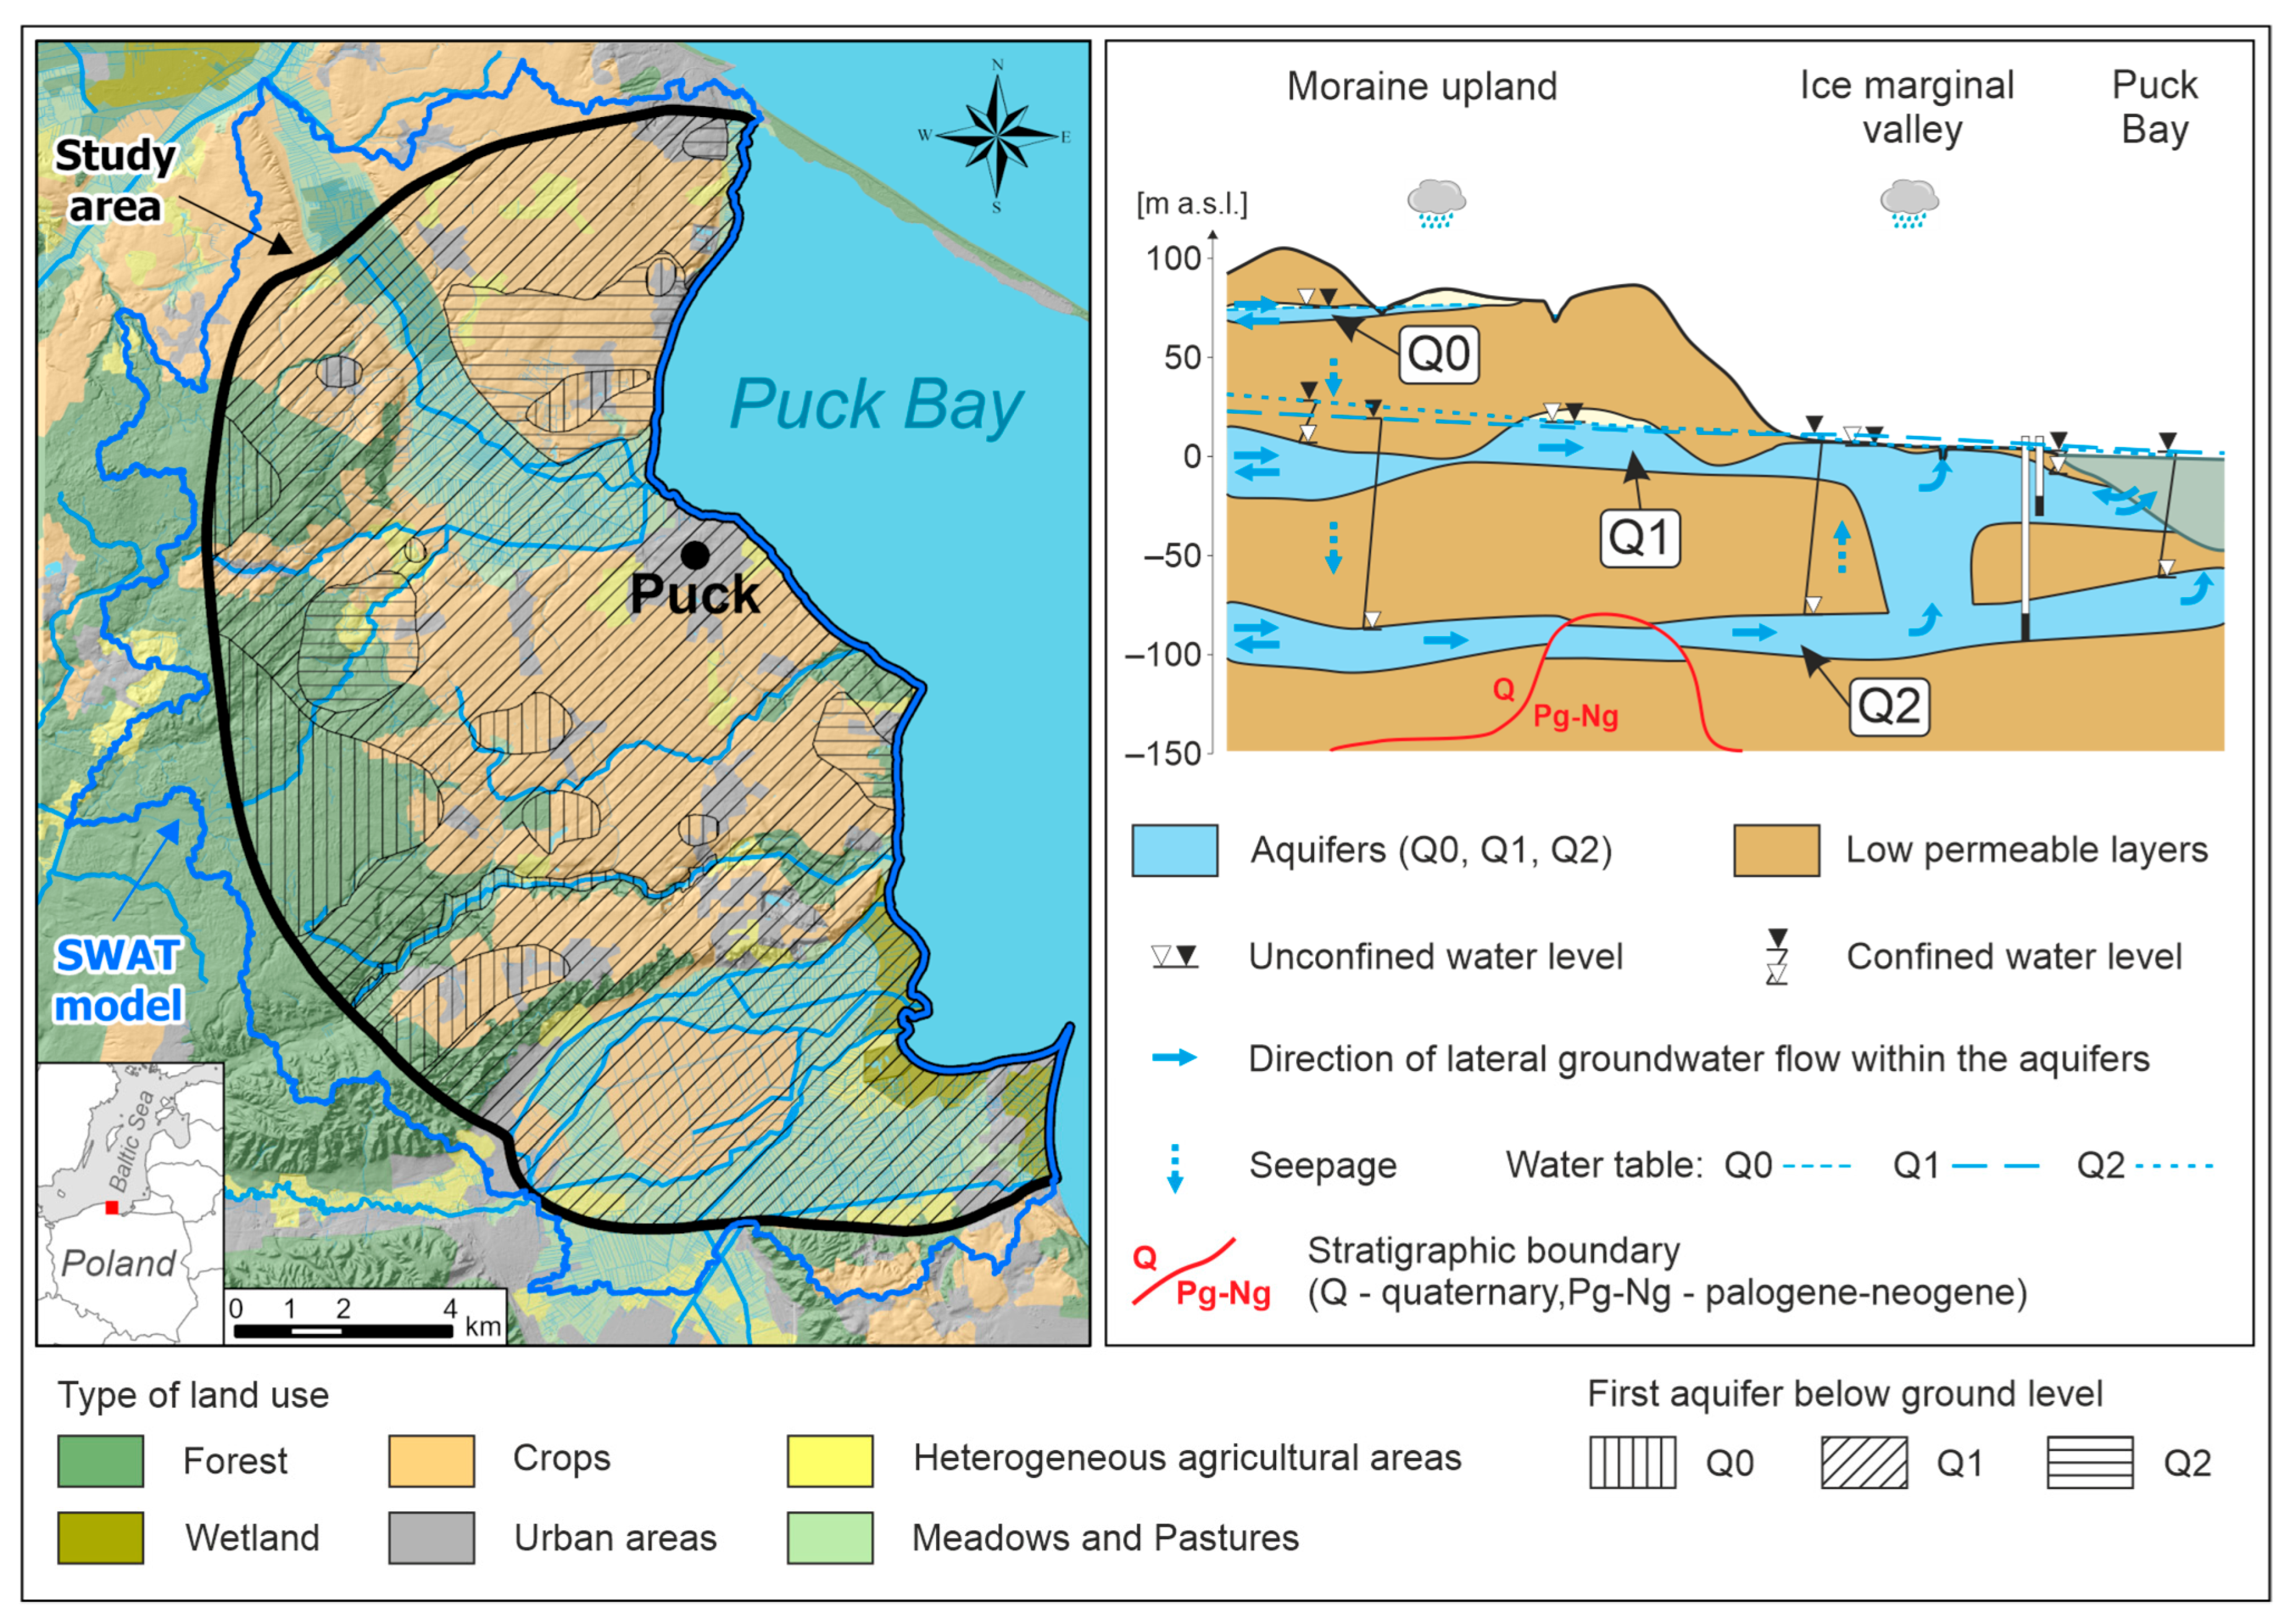
The study area is located in northern Poland, in the Puck Bay region (southern Baltic coast) (Figure 1). The area is characterized by post-glacial geological forms: fragments of a moraine plateau separated from each other by relatively deep valleys. The soil textural types are mostly represented by sandy loams, loamy sands (weathered glacial till), sand, and peat (near streams and rivers.
A complex multi-aquifer system is drained mainly by the adjacent Puck Bay. The discharge occurs either in the subsurface as the submarine groundwater discharge (SGD) or through streams and rivers. In the study area, two aquifers are the main sources of water supply—the sub-moraine (lower) aquifer (Q2) and the inter-moraine (upper) aquifer (Q1), locally exposed in the river valleys. The aquifers consist of Quaternary glaciofluvial deposits (sand and gravel) and are separated by low-permeable moraine till sediments. Locally, groundwater occurs in small, perched aquifers (Q0) formed within sand lenses enclosed in the shallow parts of the moraine deposits, up to 5 m below ground level (Figure 1). In the moraine plateau, the inter-moraine aquifer occurs from −10 to 20 m above mean sea level (a.m.s.l.). The thickness is generally about 20 m, but locally it can reach up to 50 m. The sub-moraine aquifer is located below, from −75 to −40 m a.m.s.l., with a thickness of 10–35 m. These two main aquifers are mostly confined and hydraulically connected. In the ice-marginal valley, groundwater (Q1) occurs shallow, a few meters below the ground surface, and is indirectly connected to surface waters. In that area, aquifer Q1 has a thickness between 20 and 40 m, and it is unconfined or semi-confined by organic sediments (muds and peats). In some parts of the valley, subsurface aquifer Q1 is hydraulically connected with deeper aquifer Q2. The groundwater head ranges from approximately 45 m a.m.s.l. and declines to 0 m at the sea level. Shallow aquifers are replenished mostly by rainfall infiltration, whereas the deeper ones are supplied with water by lateral inflow from the west and vertical seepage from overlying layers [50,51,52,53].
Figure 1. Map of Puck Bay region and general scheme of groundwater flow in the study area (modified from [51]).
Sustainability 18 00729 g001
The groundwater quality within the study area is diversified. Local anthropogenic pollution is observed, affecting shallow perched aquifers (Q0) as well as the inter-moraine and valley (Q1) aquifers. The groundwater contamination results in higher concentrations of nitrogen compounds, phosphates, and potassium, which are the primary components of agricultural fertilizers. Other agricultural pollution indicators, such as elevated concentrations of NH4+, NO2, NO3, PO43−, and K+ ions, were found locally. In some parts of the Puck Bay area, a hydrogeochemical inversion occurs [54].
The research area is influenced by a distinct marine climate, with both winters and summers relatively mild. The mean annual air temperature is approximately 7.4 °C, and average annual precipitation in the period 2001–2010 was 646.5 mm. The region has a population of about 25,000 inhabitants, and about 11,000 of them reside in its largest town, Puck. The study area covers 202.3 km2 and is mostly used for agricultural purposes (about 65%); crops are cultivated mainly in deforested upland zones, while meadows and pastures are present in the river valleys. The dominant crops, ranked by importance, include: winter wheat, winter triticale (a wheat-rye hybrid), silage corn, canola, mixed spring cereals, potatoes, and peas (Pisum). Crop rotation is a common practice among local farmers [55].

3. Materials and Methods

3.1. Method for Groundwater Vulnerability Assessment

In this section we briefly describe the original DRASTIC method and its modification, DRASTIC-AGRO, introduced in this study. The DRASTIC method [34] for estimation of groundwater vulnerability to contamination includes seven parameters: depth to water table (D), net recharge (R), aquifer media (A), soil media (S), topography (T), impact of the vadose zone (I), and hydraulic conductivity of the aquifer (C). To each parameter a weight is assigned, ranging from 1 to 5. Ratings (r) from 1 to 10 are assigned to each parameter. The method assumption is based on vertical waterborne pollutant transport from the land surface through the unsaturated zone into a porous aquifer, and it is recommended for areas larger than ~0.5 km2. The original DRASTIC method includes two versions: (i) one for evaluating intrinsic vulnerability and (ii) the second for specific vulnerability, specifically for pesticides. In that method, four vulnerability classes are distinguished: low (<100), moderate (101–140), high (141–200), and very high (>200). Vulnerability is determined by using a calculation algorithm, which is the sum of the ratings and weights of the parameters:
DRASTICindex = 5 × Dr + 4 × Rr + 3 × Ar + 2 × Sr + 1 × Tr + 5 × Ir + 3 × Cr
In this study, we introduced a modification of the original DRASTIC method to directly include agricultural impact (DRASTIC-AGRO). This method can be applied to evaluate the specific vulnerability of porous aquifers to NO3, with explicit consideration of agricultural practices. To improve the reliability, qualitative parameters were replaced with quantitative ones, and uncertainty related to the subjective assignment of ratings and weights was minimized using statistical methods. This approach has been successfully introduced and tested in recent studies [31,56]. An additional parameter reflecting agricultural practices was introduced into the computational algorithm, given that farming activities are a significant source of nitrogen loads in soils, often resulting in high concentrations of NO3 in groundwater (Figure 2). Agricultural practices within the study area were implemented using the SWAT model, which gave a detailed description of land use and watershed management [57]. In this study, the DRASTIC-AGRO was applied to the present agricultural land use in the case study (W0) and to other possible management scenarios (S1–S12).
In the original DRASTIC method, the soil parameter (S) is related to soil texture and represents groundwater contamination potential in a simplified way, assuming that NO3 behaves as a conservative substance. However, in our case study, it is necessary to include all nitrogen transformation processes, such as mineralization, immobilization, nitrification, and denitrification, determined by microorganisms’ activity [16,58,59]. The balance of nitrogen transformations in the soil profile plays a significant role in nitrogen uptake by plants, its volatilization to the atmosphere via denitrification, and transport in groundwater [60,61]. Therefore, in the DRASTIC-AGRO method, the soil parameter (S) was replaced with N-NO3 load leaching from the soil profile (NL). This parameter is closely linked to land use and management strategies, especially agricultural activity. Estimating the NL parameter using the SWAT model enables a more comprehensive representation of the diverse processes governing the nitrogen cycle in soils. Furthermore, incorporating N-NO3 leaching allows for a quantitative differentiation of the soil’s contribution to vulnerability assessment, even under conditions where a single soil texture is present. Similarly, the aquifer media (A), which in the original method represents the aquifer’s capacity to attenuate potential contaminants, was replaced with aquifer thickness (AT). The thickness of the aquifer is an important factor in estimating the aquifer’s ability to dilute and attenuate nitrate contaminant concentrations [62] and was distinguished and applied in other studies of groundwater vulnerability [31,63]. Kazakis and Voudouris [31] pointed out that AT is a quantitative and measurable parameter as opposed to A, which is qualititative. In the DRASTIC-AGRO method, hydraulic resistance of vadose zone layers (HR) was introduced, replacing depth to groundwater (D) and impact of vadose zone (I) from the original DRASTIC method. The HR parameter is defined as a ratio between the thickness and vertical hydraulic conductivity of each soil layer above the water table. It provides a quantitative description of the vadose zone and expresses the difficulty with which pollutants migrate from the land surface to the aquifer. This parameter can be interpreted as an approximation of the vertical travel time of water through the unsaturated zone [36]. Similarly to AT, the introduction of HR decreases subjectivity of parameters, as HR is a quantitative parameter in contrast to qualitative parameters D and I, which partially overlap. High hydraulic resistance slows vertical water movement, thereby reducing vulnerability by limited contaminant infiltration. Conversely, lower resistance causes faster infiltration and increases contamination risk. The vadose zone plays a critical role in reducing pollution transport to the aquifer by filtration, dispersion, and sorption processes. However, in the original DRASTIC method, it is represented qualitatively by parameter D, which suggests that contamination seepage through the unsaturated zone depends only on water table depth. Such an approach can significantly increase uncertainty, especially for porous soil material, where permeability can vary greatly depending on soil type, depth, and the presence of a root zone. The HR factor more accurately represents the role of vadose zone in pollution transport and was successfully applied to the estimation of groundwater vulnerability [31,56]. For the saturated zone hydraulic conductivity (C) was replaced with the groundwater velocity (GV) since some recent studies [31,63,64] showed limited correlation between NO3 concentrations and hydraulic conductivity. Groundwater velocity, in contrast, directly influences NO3 transport. The higher the groundwater velocity, the more rapidly pollutants propagate within the aquifer, resulting in an increased aquifer vulnerability. The topographic slope (T) parameter was excluded from the DRASTIC-AGRO method. Although it can indicate areas with fast and slow infiltration, topography was already incorporated into the SWAT model, and it was indirectly included in the parameters describing the groundwater recharge and N-NO3 load leaching through the unsaturated zone. Groundwater recharge (GR) remains an essential factor in assessing groundwater vulnerability, since it determines the amount of potential pollutants transported to the aquifer.

3.1.1. Data Collection

Groundwater vulnerability assessment was based on a combination of prepared datasets for each parameter. A complete database was prepared, which contained all the data essential for specific groundwater vulnerability to NO3 assessment. The data was sourced from national databases, hydrogeological maps, and results of previous research (Table 1). The spatial layers for each parameter used in the DRASTIC-AGRO method were converted into a raster format. This conversion was performed using GIS tools within ArcGIS Pro (version 3.4.2) at a cell resolution of 50 × 50 m. This resolution was appropriate for representing the spatial variability of groundwater vulnerability to nitrate pollution within the investigated area. Using input data of the same resolution in the SWAT model ensured consistency across the results and enabled an accurate representation of the main topographic features. The adopted raster resolution was also determined by data availability and by the scale of the source materials used in the analysis. Table 1 provides a summary of all data utilized in the analysis, along with their references.
Hydraulic resistance (HR) of the vadose zone is calculated as a ratio between the thickness and vertical hydraulic conductivity of soil layers in the unsaturated zone, as follows:
HR = ∑di/ki
The thickness of the vadose zone layers (d) was determined from available borehole profiles, while the hydraulic conductivity (k) of these sediments was assigned based on literature [65,66,67,68]. A spatial GIS layer of HR was generated using the Inverse Distance Weighting (IDW) interpolation, based on 430 points. Groundwater recharge (GR) and N-NO3 load leaching through the unsaturated zone (NL) were estimated based on simulation results obtained from the developed SWAT model, which calculates water balance and nitrogen transformations within the vadose zone. According to the simulation results, it was assumed that the quantity of water and NO3 in the water outflowing from the root zone is equivalent to the amount of these components delivered to the first aquifer at the water table level. Both parameters, GR and NL, were modified for each management scenario based on separated SWAT simulations. Details of the SWAT model calculations and a description of agricultural scenarios are presented in Section 3.2. A spatial GIS layer for both parameters was generated based on average monthly values simulated for the corresponding hydrological response units (HRUs). Aquifer thickness (AT) was estimated using data from borehole logs compiled in the national hydrogeological database (Bank HYDRO) managed by the Polish Geological Institute-National Research Institute (PGI-NRI). A spatial GIS layer for this parameter was generated through interpolation using the Inverse Distance Weighting (IDW) method, based on 430 points. Groundwater velocity (GV) was calculated from the results of a multi-layer numerical MODFLOW model, developed for the study area within the WaterPUCK project [51,53]. The SWAT model was coupled with the MODFLOW-MT3DMS model using a one-way coupling scheme, where the daily recharge fluxes and nitrate loads to the aquifer obtained from SWAT are transferred to the MODFLOW and MT3DMS models. MODFLOW simulates groundwater flow, while MT3DMS simulates nitrate transport in groundwater, accounting for advection, hydrodynamic dispersion, and denitrification (modeled as a first-order reaction). For more details the reader is referred to [51,53]. A corresponding spatial layer was generated from these modeling results. Information on NO3 concentration in groundwater was prepared for parameter classification and validation of the obtained results. These values were measured using a pHotoFlex STD photometer (WTW Xylem Analytics, Weilheim, Germany) during field surveys conducted since 2017. Measurements were taken at 49 points located in the research area.

3.1.2. Adjustment of Parameters Classification and DRASTIC-AGRO Index

Statistical methods were applied to adjust the weights and class range of each parameter, as proposed in several studies towards improving the reliability and accuracy of vulnerability assessment methods [31,56,63,69,70]. To define the optimal class range of each parameter, as well as the final vulnerability index to NO3, grading methods including natural breaks, equal interval, quantile, and geometrical intervals [63] were applied. This selection was based on the method yielding the highest correlation with NO3 concentrations. The calibration procedure involved analyzing the relationship between observed NO3 concentrations within the study area, which was generated using the IDW method. Subsequently, a regular point grid (fishnet) with a resolution suitable for the area was created, and the class values of each parameter were extracted to these points. Data comparison was performed using Pearson’s correlation coefficient [71]. However, this method assumes a normal distribution of NO3 concentrations [31,69,72]. Consequently, the correlation analysis was performed using logarithmically transformed data. The weight of each parameter was calculated using the following equation, based on a scale from 1 to 10:
W = r i 5 5 r i × 10
where W is weight of the parameter and r is related to its correlation with NO3 concentration. The rank of each parameter, ranging from 1 to 10, was assigned either in ascending or descending order, depending on the relationship between the parameter value and NO3 migration potential. Higher values indicate greater vulnerability to NO3 contamination. The grading method of each parameter was selected according to the highest correlation with NO3 concentration (Table 2). The ranges and ratings of original DRASTIC and DRASTIC-AGRO parameters are presented in Table 3.
Based on modified parameters’ classification for the DRASTIC-AGRO index (DA), specific vulnerability of the porous aquifer to NO3 pollution can be calculated by applying the following algorithm:
DA = 6.00 × HR + 0.15 × GR + 1.10 × NL + 2.34 × AT + 0.41 × GV
where HR is the hydraulic resistance of the unsaturated zone, GR is groundwater recharge, NL is N-NO3 load leaching through the vadose zone, AT is aquifer thickness, and GV is groundwater velocity. The obtained vulnerability map was classified into five categories: very low, low, medium, high, and very high.

3.1.3. Sensitivity Analysis

An effective tool for assessing the accuracy of vulnerability maps, as well as for their verification and calibration, is sensitivity analysis [30,73,74]. In this study, the single-parameter method was applied. It consists of analyzing the sensitivity of each parameter individually to determine its influence on the final vulnerability index value [75]. Sensitivity analysis offers valuable insights into how the rating and weighting values assigned to each parameter affect the results, thereby helping to evaluate the significance of subjective elements [31,56,63,76]. The effective weights of the parameters were calculated using the following equation:
W = P r × P w V × 100
where W is the effective weight of the parameter, P r is the rating value, P w is the weighting value of each parameter, and V is the overall index value.

3.2. SWAT Model

The Soil and Water Assessment Tool (SWAT) is a computational model widely used to evaluate the influence of various factors on the catchment hydrological cycle, soil quality, and crop yields [57]. It enables simulations of individual components of the water balance, sediment transport within the catchment, nutrient cycling, crop growth, and other more complex processes. For the purposes of this study, the primary SWAT model outputs were groundwater recharge and the NO3 nitrogen (N-NO3) load leached from the soil profile. These results were used to evaluate the impact of agricultural practices on the variability of groundwater vulnerability to pollution.
Groundwater recharge was defined as an amount of water percolating below the root zone in the vadose zone profile, determined by soil moisture content and percolation time. This relationship is expressed by the following equations:
w p e r c = S W l y × 1 e x p Δ t T T p e r c
T T p e r c = S A T l y F C l y K s a t
where w p e r c is the amount of water percolating to the underlying soil layer (mm H2O), S W l y is the drainable volume of water in the soil layer (mm H2O), Δ t is the length of the time step (h), T T p e r c is the travel time of percolation (h), S A T l y is the amount of water in the soil layer under full saturation (mm H2O), FCly is the water content of the soil layer at field capacity (mm H2O) and K s a t is the saturated hydraulic conductivity for the layer (mm/h).
The values obtained from the above equation were corrected for water losses resulting from evaporation, diffusion, and uptake by deep-rooted plants. This adjustment is particularly important in areas where the groundwater table occurs close to the land surface. The final value was calculated using the following equation:
w r e v a p = β r e v × E 0
where w r e v a p is the actual amount of water moving upward in the vadose zone in response to low negative pressure head (dry conditions) in the upper part of the profile (mm H2O), β r e v is the revap coefficient (-), and E 0 is the potential evapotranspiration for the day (mm H2O).
Transport of nutrients (including NO3) in the SWAT model is associated with surface runoff, subsurface flow, or infiltration. To determine NO3 nitrogen load leaching from the unsaturated zone, the concentration in percolating water and the volume of percolating water are necessary, based on the following equations:
N O 3 p e r c = N O 3 l y 1 e x p w m o b i l e ( 1 θ e ) × S A T l y w m o b i l e × w p e r c
where N O 3 p e r c is the NO3 moved from the soil profile by percolation (kgN/ha), NO3ly is the amount of NO3 in the soil layer (kgN/ha), w m o b i l e is the amount of mobile water in the layer (mm H2O), θ e is a fraction of porosity which anions are excluded from (-). The amount of mobile water in the layer is the amount of water remaining after surface runoff, lateral flow, or percolation:
w m o b i l e = Q s u r f + Q l a t + w p e r c       for   top   soil   ( < 10   mm   deep )
w m o b i l e = Q l a t + w p e r c       for   lower   soil   layers   ( > 10   mm   deep )
where Q s u r f is the surface runoff (mm H2O), Q l a t is the water discharged from the layer by lateral flow (mm H2O).

3.2.1. Input Data and Model Setup

The developed SWAT model represents an extended version of the model created within the WaterPUCK project and is based on the same model concept [77].
The input data for the model were prepared in the form of spatial (GIS) data and text files, which were subsequently imported into SWAT. The scope of input data is presented in Table 4. A first step in model setup was the delineation of streams and catchments. For this purpose, a digital elevation model (DEM) was used, generalized to a raster cell size of 50 × 50 m. The adopted DEM resolution minimized problems related to the proper parameterization of the delineated catchment. Sub-catchments were generated based on the existing stream network, which was expanded to include additional surface water contributing to areas in the coastal zone. The final model domain covered an area of 243.5 km2, subdivided into 27 sub-catchments.
Additional data on land use and soil cover were then imported and adjusted to the structure of the SWAT database. Land-use data were reclassified, while soil properties were defined using several parameters, primarily related to their physical characteristics, based on literature values [84]. A slope layer was derived from the DEM introduced at an earlier stage. The integration of land-use, soil, and slope data resulted in 564 HRUs (hydrological response units) across the catchment, which represent the basic computational elements of the model.
Meteorological input data included daily precipitation, maximum and minimum air temperature, mean daily relative humidity, daily solar radiation, and mean daily wind speed. The analysis used meteorological records from 1998 to 2010 obtained from the IMGW-PIB database and the CFSR system.
The SWAT model was also applied to define current land use and agricultural management practices (baseline scenario), based on the results of a survey conducted among local farmers [55]. On this basis, an agricultural management calendar was developed and incorporated into the SWAT model [51,85]. For all agricultural areas, the same crop rotation was assumed, including silage corn, canola, and winter wheat, which represent the dominant crops in the region. Tillage depth varied depending on the method applied, ranging from 25 mm to 150 mm. For grasslands a uniform set of practices was assigned (permanent plant cover, fescue species, two hay cuts per year). Forests were modeled as permanent plant cover, with pine selected as the representative species.
Unsteady-state simulations were carried out with a daily time step for the period 2001–2010 (10 years). A three-year model warm-up period (1998–2000) was applied to stabilize soil and groundwater conditions. For groundwater vulnerability assessment, monthly averages of groundwater recharge and N-NO3 leaching loads, calculated from daily SWAT outputs for each HRU, were used as input data.

3.2.2. Calibration and Validation Processes

Calibration and validation of the developed SWAT model were carried out according to the methodology described in previous publications [51,77], which was adopted for the implementation of the WaterPUCK project.
A manual multi-parameter calibration (trial-and-error method) was performed with respect to groundwater recharge, evapotranspiration, and forest biomass. Groundwater recharge, defined as the effective infiltration of precipitation, was determined based on climatic and geological conditions typical for Quaternary sediments in northern Poland [86,87]. The reference value for mean annual evapotranspiration was set in the range of 450–495 mm, corresponding to areas with similar climatic conditions and land use in the use case area [88]. For forest biomass production, the reference value was set between 4.2 and 12.1 tons of dry matter per hectare per year [89]. During calibration, the following parameters were adjusted: the curve number (CN), describing the balance between runoff and infiltration; maximum plant water storage (CANMX); groundwater “REVAP” coefficient (GW_REVAP); and pine growth parameters in the plant.dat database (BLAI, FRGRW1, LAIMX1, FRGRW2, ALAI_MIN). A detailed description of these parameters can be found in the SWAT user manual [90].
Model validation was carried out using values of total catchment runoff, crop yields for the main cultivated species (winter wheat, canola, silage corn), and meadow fescue biomass from grasslands. Validation against crop yields is widely applied in SWAT-based studies [91,92,93,94,95], as it provides realistic estimates of evapotranspiration and increases the reliability of simulations concerning other components of the hydrological system [96]. Simulation results were compared with the information obtained from local farmers as well as statistical datasets and literature sources. The agreement between SWAT-simulated results and available reference data for the analyzed parameters was found to be satisfying (Table 5).
An important output of the SWAT model for this study is the N-NO3 load leaching through the unsaturated zone. Unfortunately, due to the lack of suitable data, direct calibration and validation of this parameter could not be performed, which may represent a certain limitation. The SWAT model developed in our previous studies [51,77] was calibrated in parallel with the MODFLOW-MT3DMS model, and the details of the calibration are provided in those publications. In this study the model area was extended, and the model was recalibrated following the same procedure. A satisfactory agreement was obtained between the measured nitrate concentrations in groundwater and those calculated by the coupled modeling system.

3.2.3. Defining Agricultural Management Scenarios

In order to investigate the effects of different agricultural practices on variability of groundwater recharge and N-NO3 loads leaching through the unsaturated zone, as well as specific groundwater vulnerability to NO3 pollution, we defined 12 possible management scenarios (grouped into 4 classes) regarding: crop type, fertilizer management, tillage, and grazing at pastures (Table 6). All defined scenarios were based on assumptions made for the current land use and agricultural management (W0).
In scenarios S1–S6, we assumed only one type of crop grown on agricultural lands, without any rotation. Scenarios S7 and S8 represent major shifts in fertilizer management. Scenarios S9 and S10 include changes in the depth of tillage. Scenarios S11 and S12 were focused on grazing at pastures. In scenarios S11 and S12, the use of meadows and pastures was changed from their previous usage for collecting meadow fescue (for silage) to grazing dairy cattle. In this case, changes were made to the agricultural calendar affecting meadows and pastures in the baseline variant. The cattle grazing period was set at 120 days and began each year at the beginning of May. During the grazing season, no fertilization or collection of fescues from meadows and pastures was assumed. These areas were mown once (each year) after the end of the grazing season in September.

4. Results

4.1. Groundwater Recharge and N-NO3 Load Leaching Through Unsaturated Zone (SWAT Model)

The simulations allowed us to quantify the overall water balance in the studied catchment. With an average annual precipitation of 647 mm, 68% was lost through evapotranspiration, 19% contributed to surface and subsurface runoff, and 13% infiltrated soil, recharging groundwater. The analysis focused specifically on groundwater recharge and N-NO3 load leaching, based on daily data for the period 2001–2010.
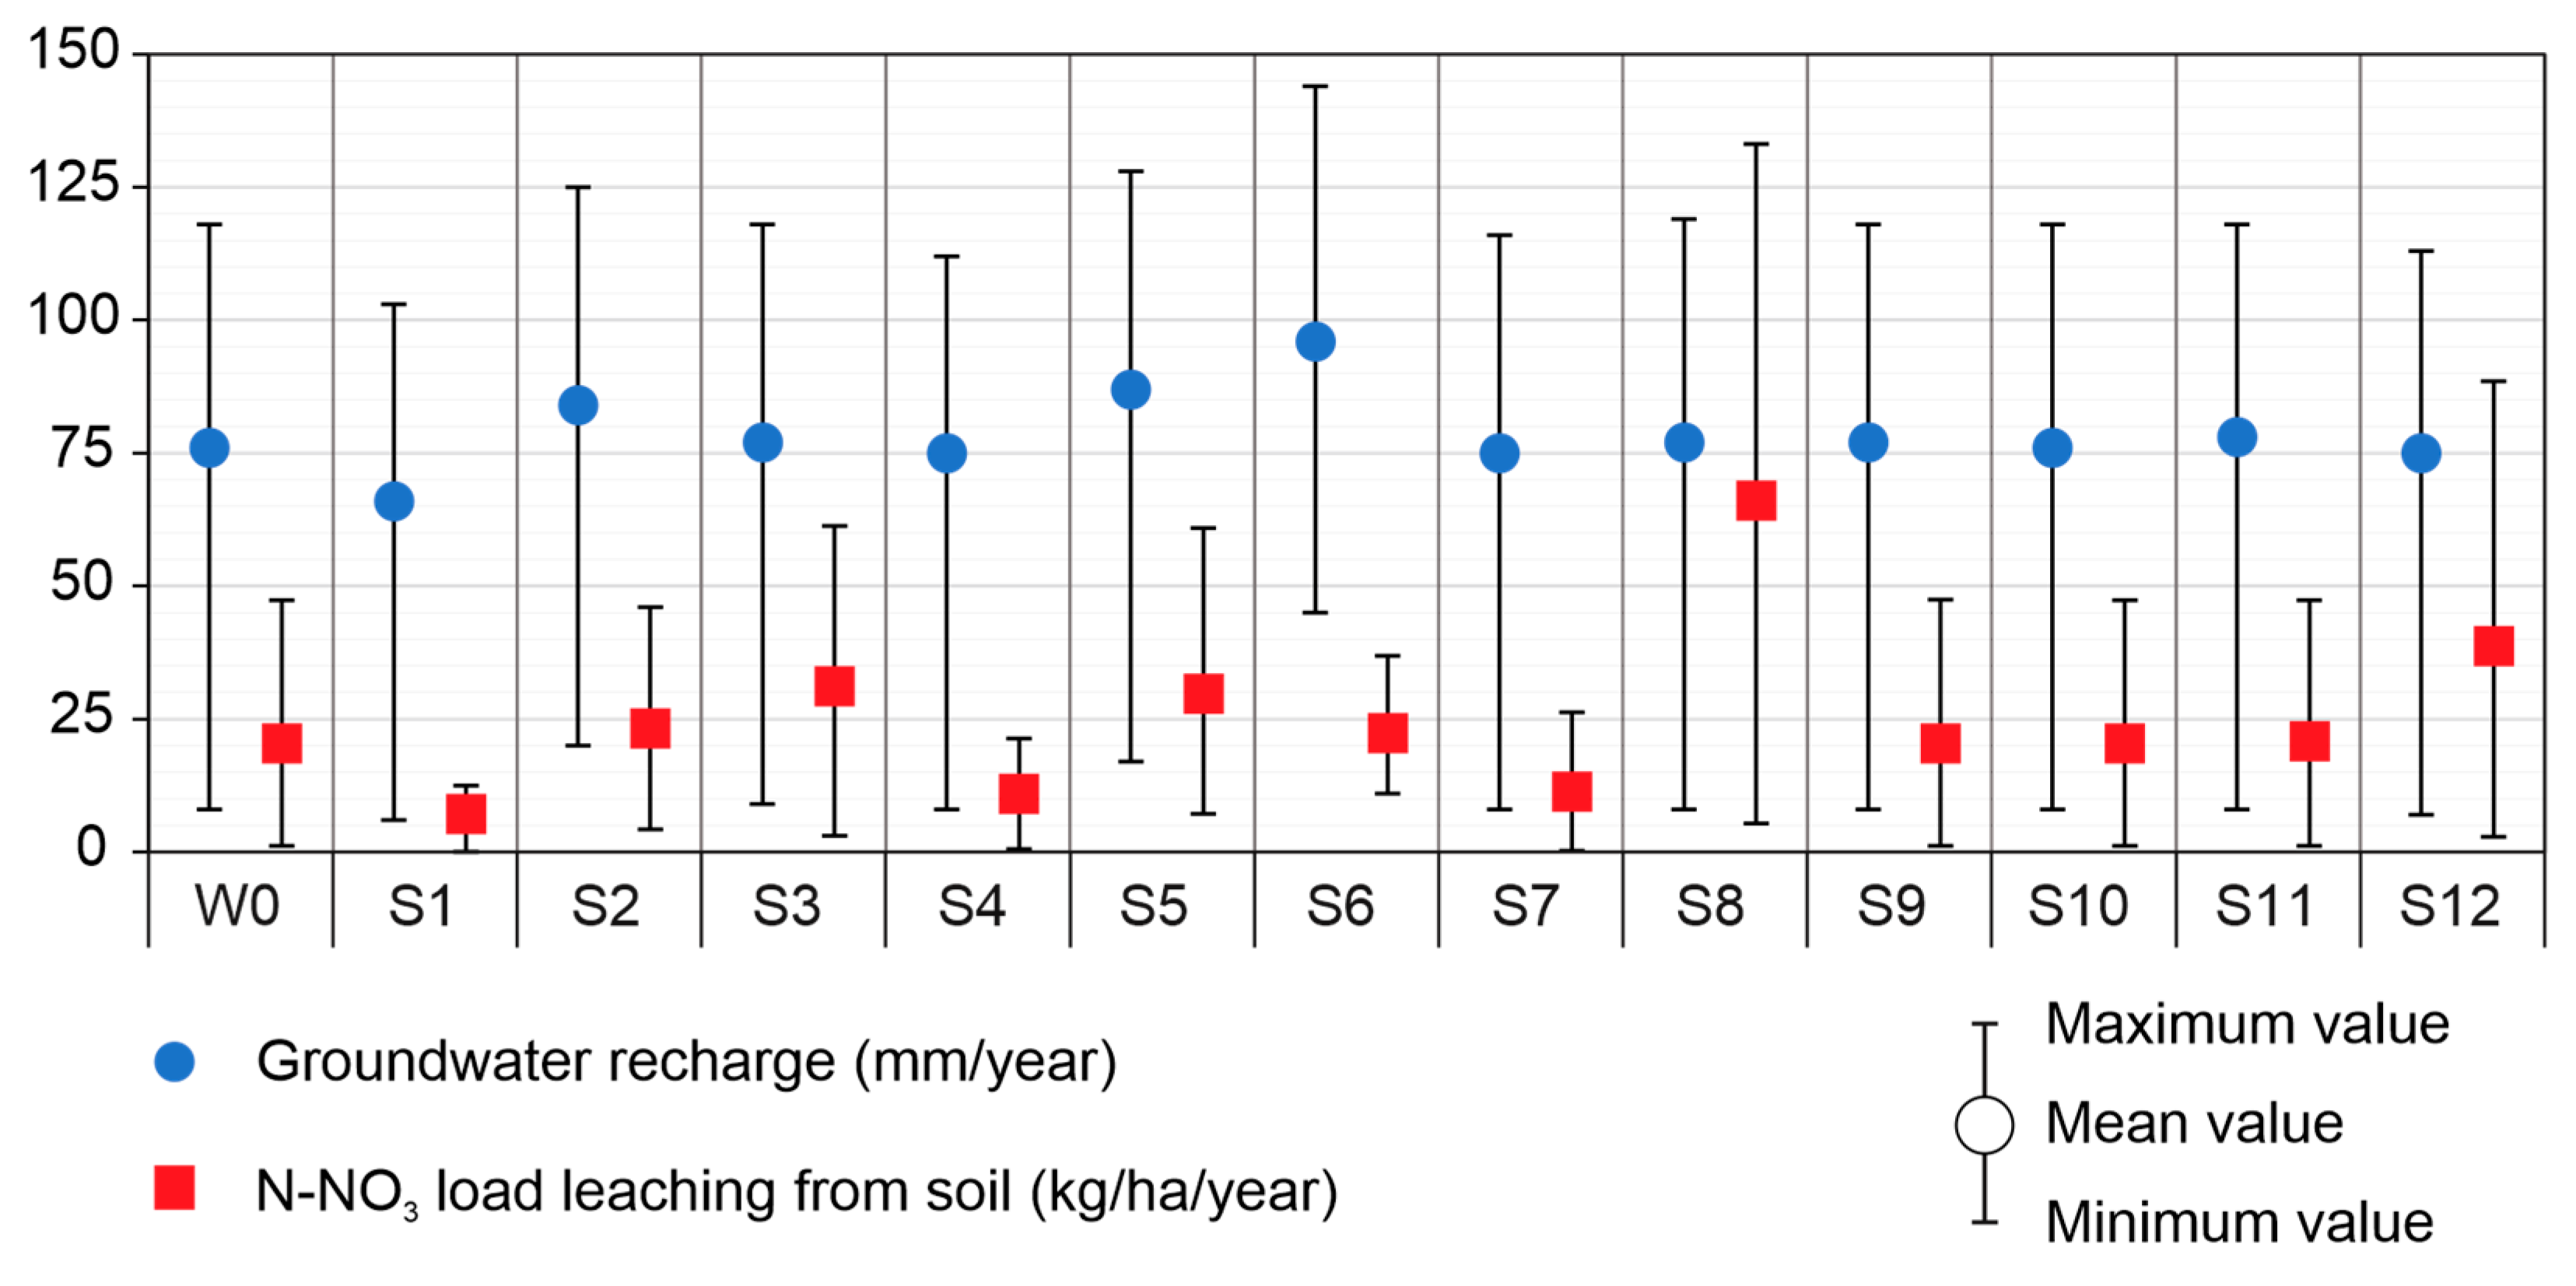
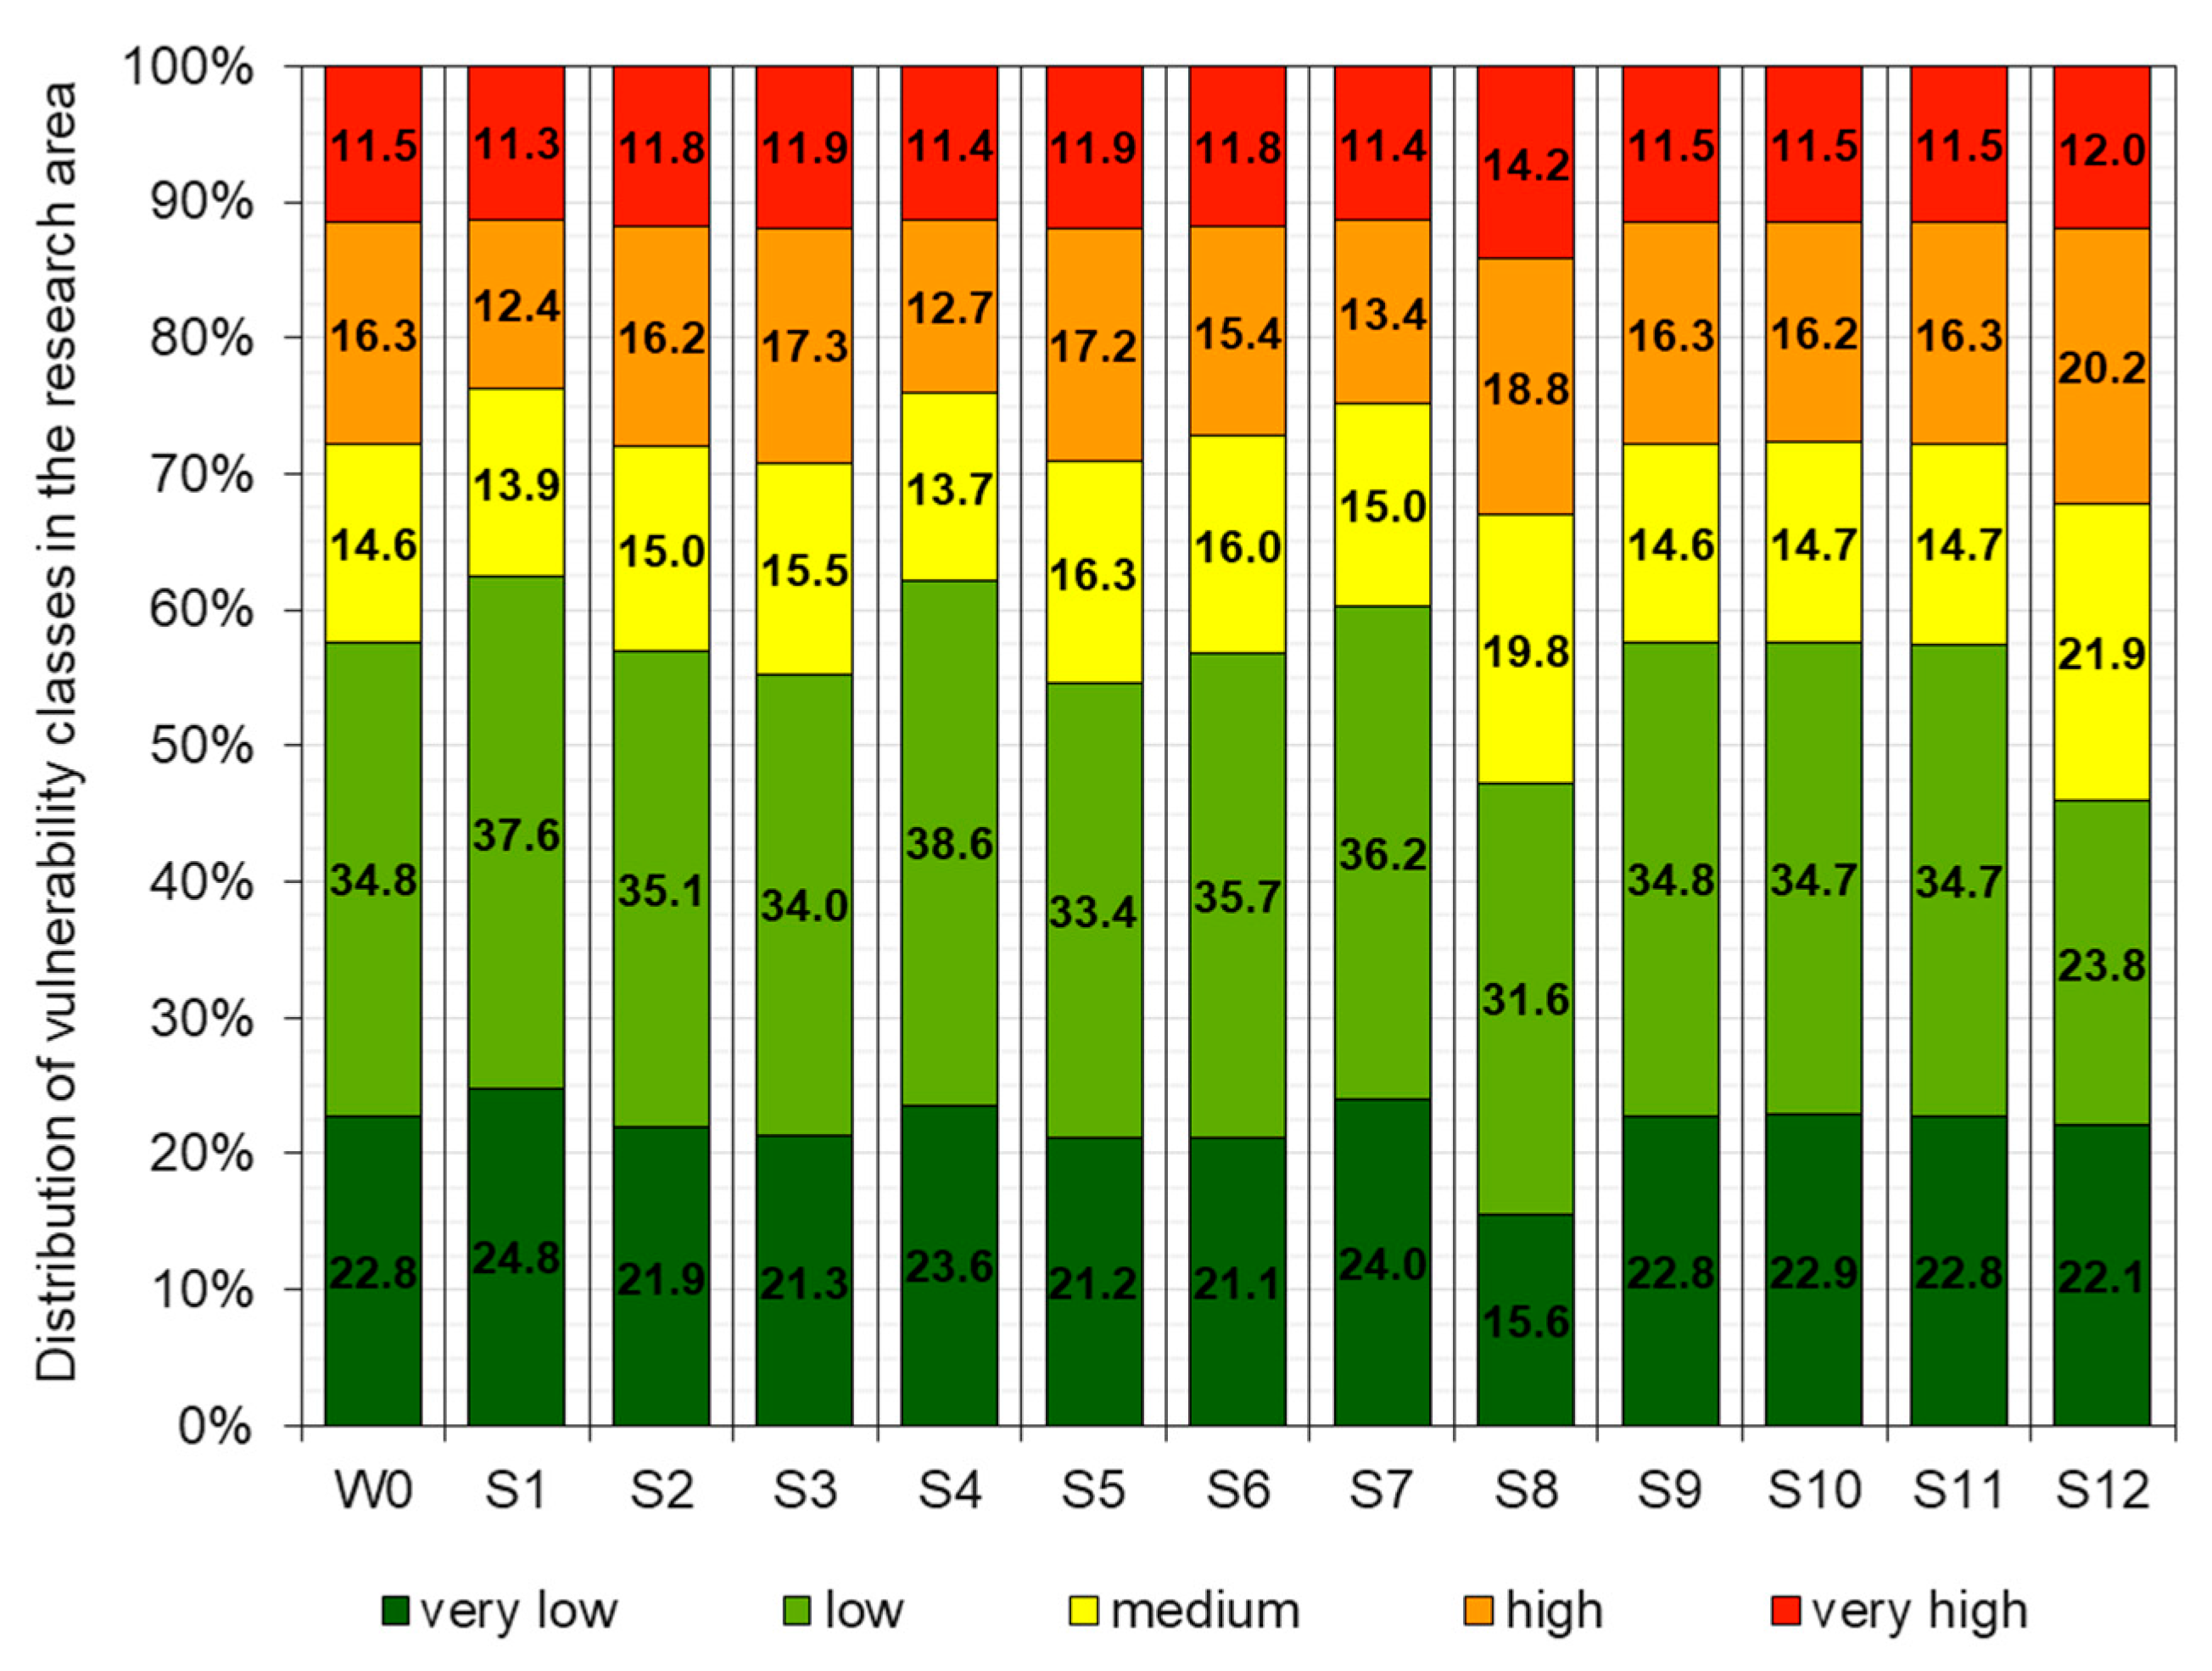
Average annual values of groundwater recharge and N-NO3 leaching for each agricultural practice scenario are shown in Figure 3. In the baseline scenario (W0), groundwater recharge averaged 76 mm/year, while N-NO3 leaching reached 21.1 kg/ha/year. The average N-NO3 leaching simulated under current management (W0) is consistent with typical values for predominantly agricultural catchments. It aligns well with comparable studies in Poland, which report leaching rates of 21 kg/ha at the catchment scale and 31 kg/ha for agricultural land specifically [99]. Furthermore, our results are comparable to total N-leaching reported in previous research for agricultural fields in the Puck region (20.3 kg N/ha/year) [61]. Among crop types (S1–S6), the lowest recharge and N-NO3 losses occurred under winter wheat (S1), at 66 mm/year and 7.8 kg/ha/year, respectively. Conversely, the highest values did not coincide; recharge peaked at 96 mm/year under peas (Pisum) (S6), whereas maximum N-NO3 leaching (31.7 kg/ha/year) occurred under canola (S3). Fertilizer management (S7–S8) produced the most significant variation in N-NO3 leaching. Compared with W0, halving the fertilizer dose reduced leaching to 12.0 kg/ha/year, while doubling the dose increased it sharply to 66.5 kg/ha/year. Groundwater recharge was unaffected, remaining at 76 mm/year in both cases. Tillage depth (S9–S10) had no effect on either groundwater recharge (76 mm/year) or N-NO3 leaching (21.1 kg/ha/year). In contrast, cattle grazing intensity (S11–S12) strongly influenced N-NO3 losses. With one cow per hectare (S11), leaching was 21.4 kg/ha/year, whereas five cows per hectare (S12) increased leaching to 39.2 kg/ha/year. Groundwater recharge remained similar between the two scenarios (78 and 75 mm/year, respectively).

4.2. Assessment of Groundwater Vulnerability to Pollution

The calculated DA index values ranged from 15.9 to 94.2. The final map’s vulnerability classes were graded using the geometrical interval method due to its strong correlation with NO3 concentration (r = 0.754). Consequently, five vulnerability classes were distinguished: very low (<39.3), low (39.3–51.7), medium (51.7–58.4), high (58.4–70.8), and very high (>70.8). Basic statistics for groundwater NO3 concentration within each vulnerability class are summarized in Table 7. The results indicate an increasing trend in NO3 concentration with increasing vulnerability.
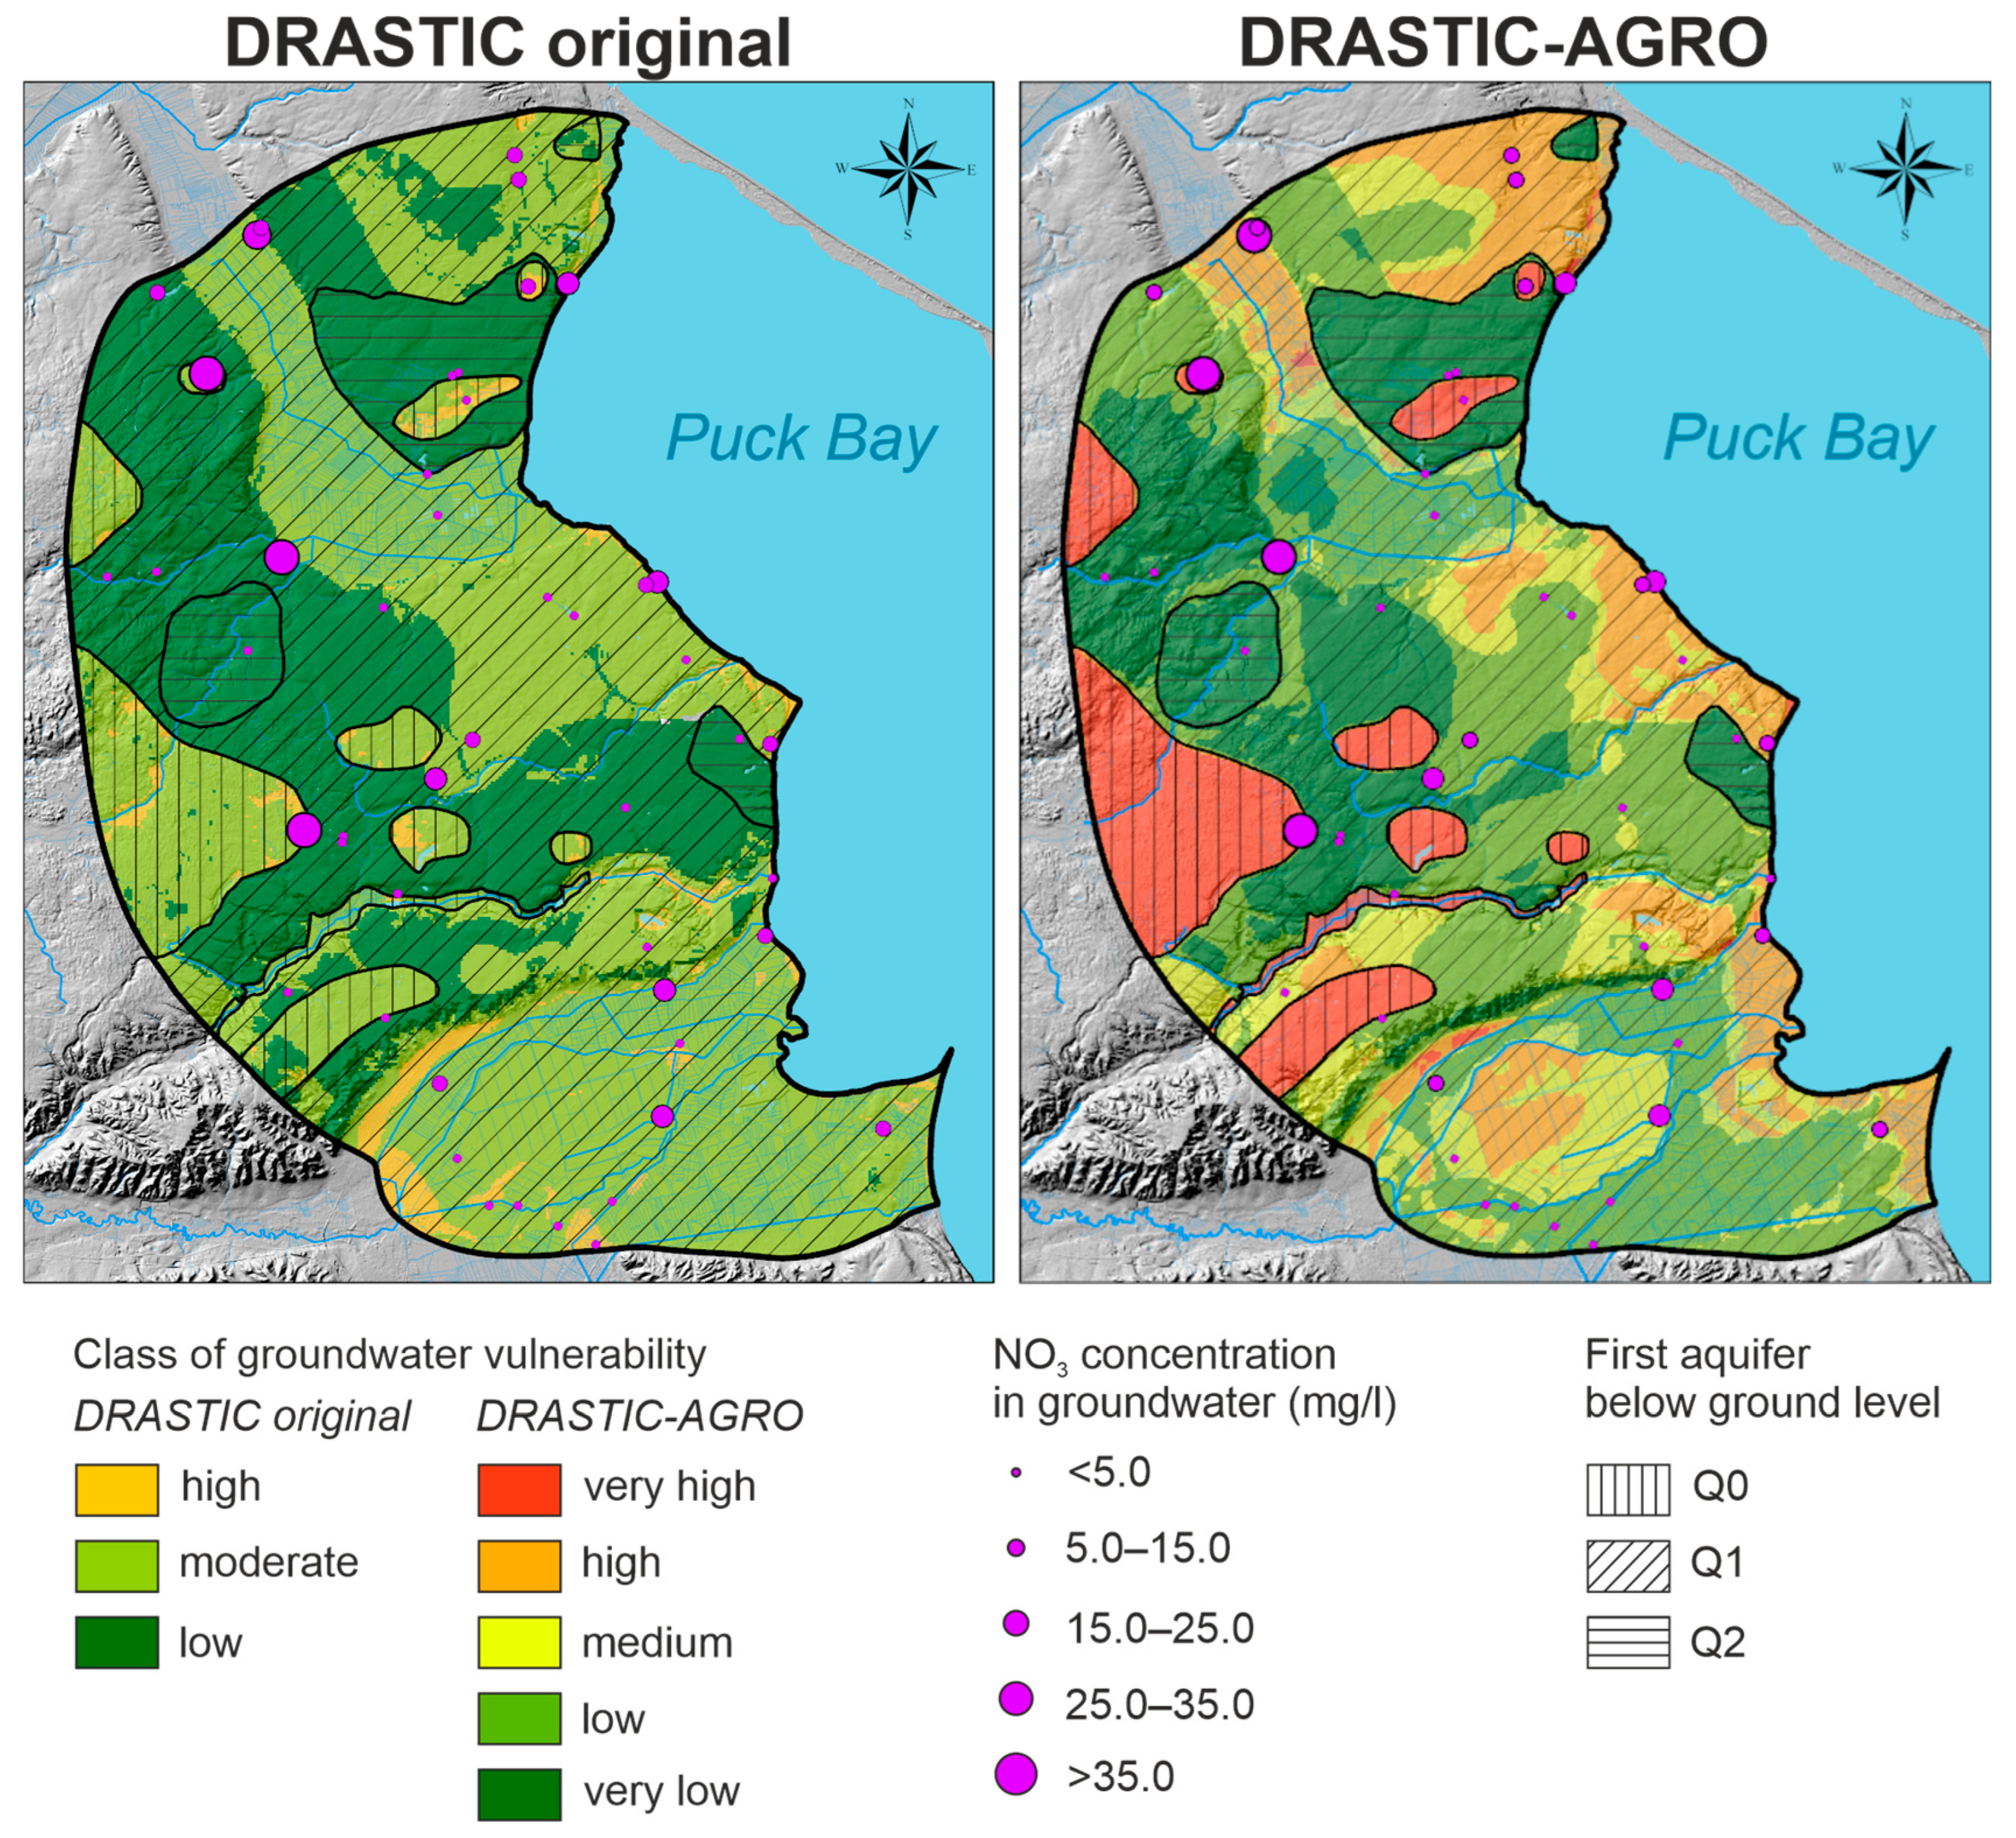
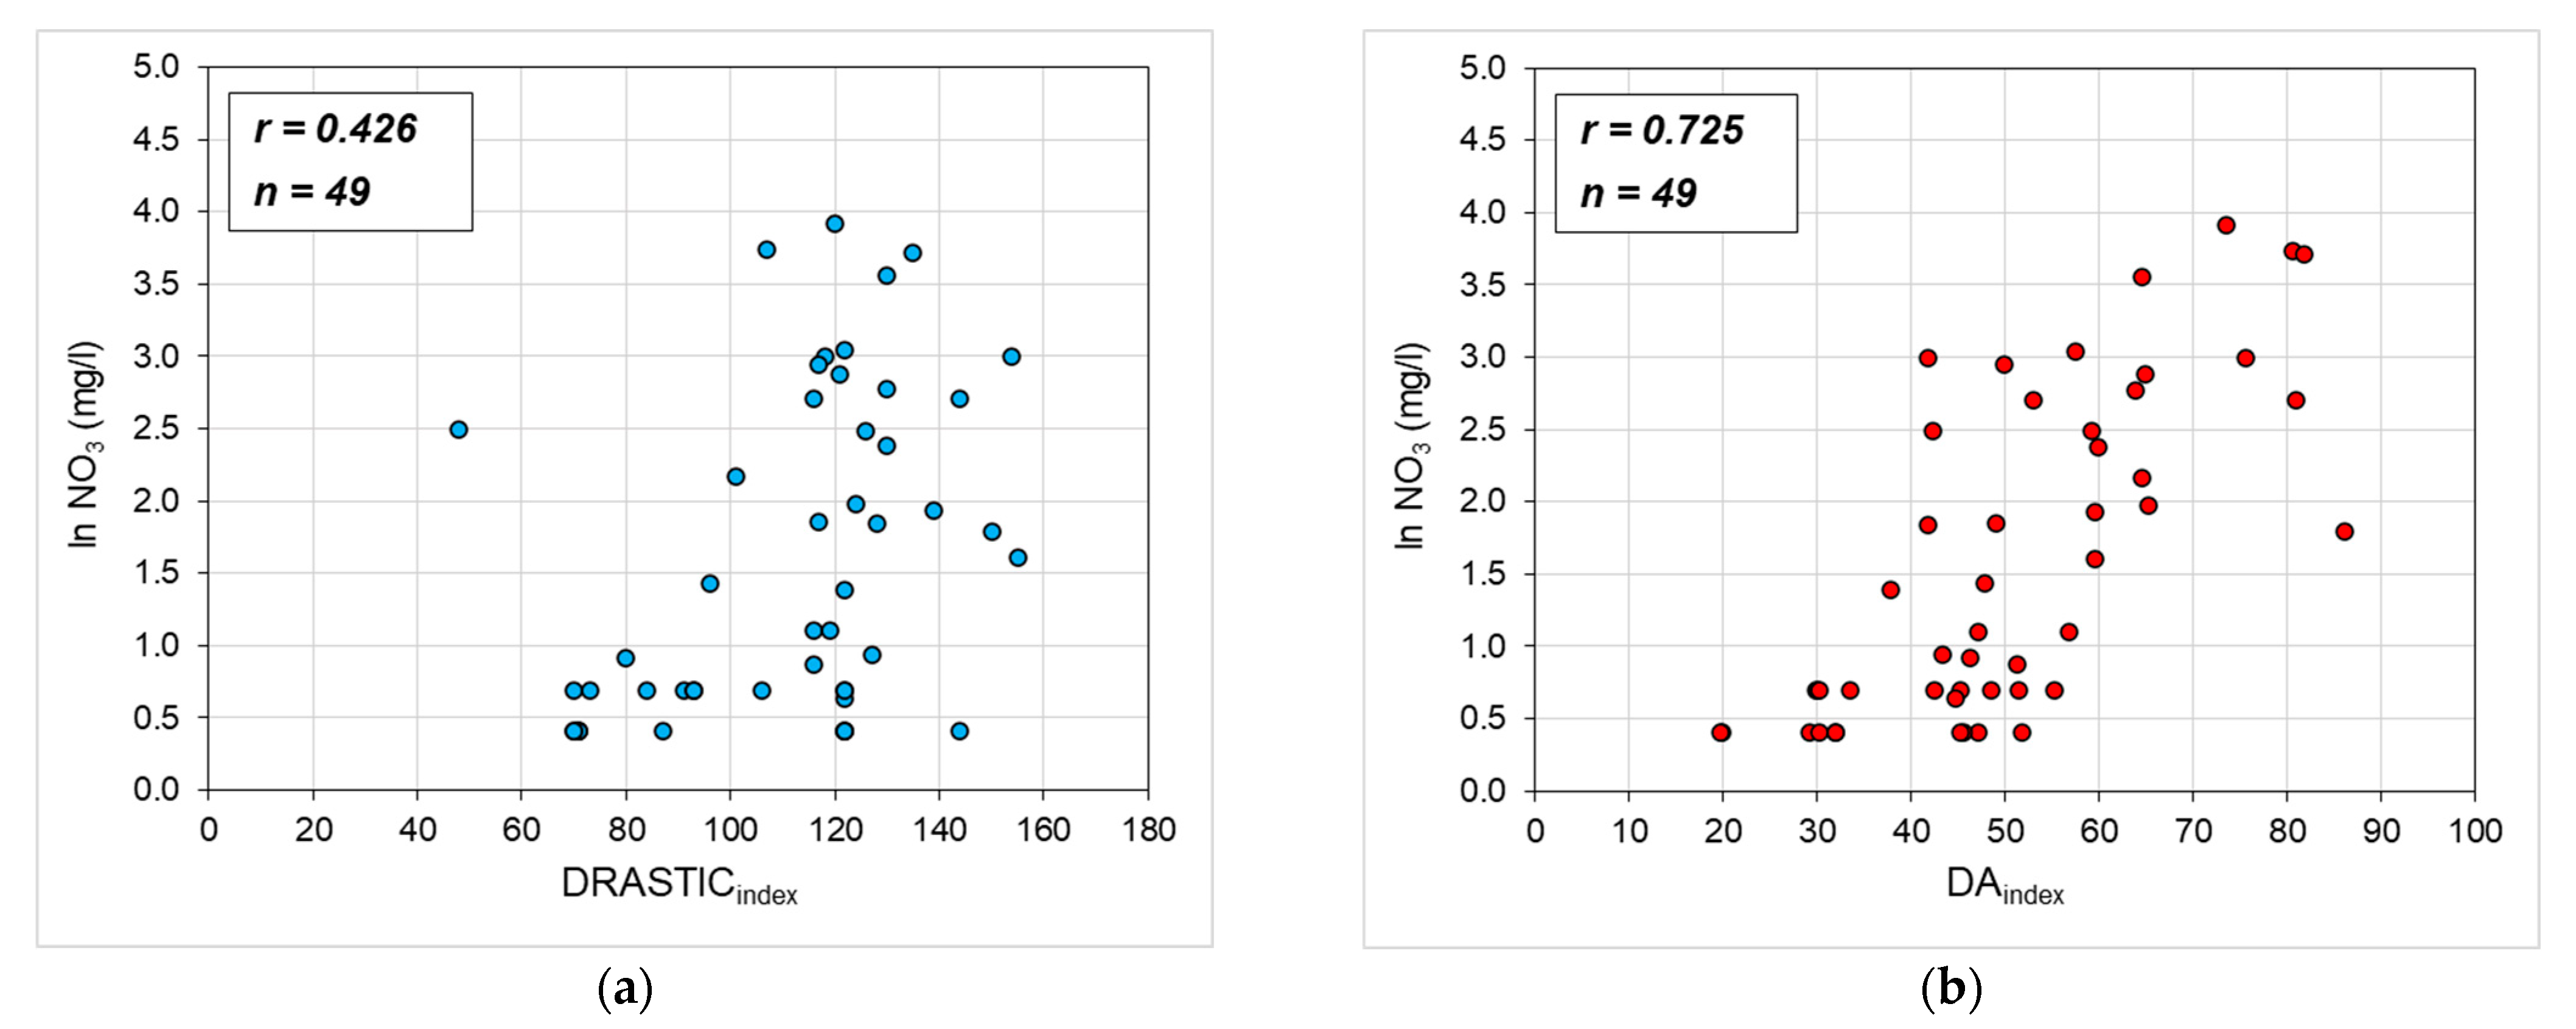
Calculations indicate that low and very low vulnerability classes dominate the research area, covering 34.7% and 22.8% of its total surface, respectively. The remaining area is distributed relatively evenly among the medium (14.6%), high (16.3%), and very high (11.6%) vulnerability classes. Figure 4 presents the specific groundwater vulnerability map generated using the DRASTIC-AGRO method alongside the map prepared using the original DRASTIC method. A comparison of the two approaches reveals that the original DRASTIC method exhibited a significantly lower correlation with NO3 concentrations (r = 0.426) (Figure 5).
The single-parameter sensitivity analysis (Table 8) revealed average effective weights ranging from 1.39% to 61.30%, indicating noticeable variation in the influence of five parameters on the vulnerability assessment. The effective weights align with the NO3 correlation, as the hydraulic resistance of the vadose zone exhibited the highest value, followed by aquifer thickness, N-NO3 load leaching from soil, groundwater velocity, and groundwater recharge. It can be inferred that the high variability of the hydraulic resistance of the vadose zone results in the highest weighting. The significance of these indicators—particularly hydraulic resistance of the vadose zone and aquifer thickness—highlights the importance of and need for accurate and detailed data regarding these factors. Furthermore, a similarity can be observed between the preliminary weight assignment obtained from the statistical analysis and the results of the sensitivity analysis. Consequently, the sensitivity analysis supports the applied calibration methodology and the spatial refinement of the method.

4.3. Scenarios of Agriculture Practice Impact on Groundwater Vulnerability

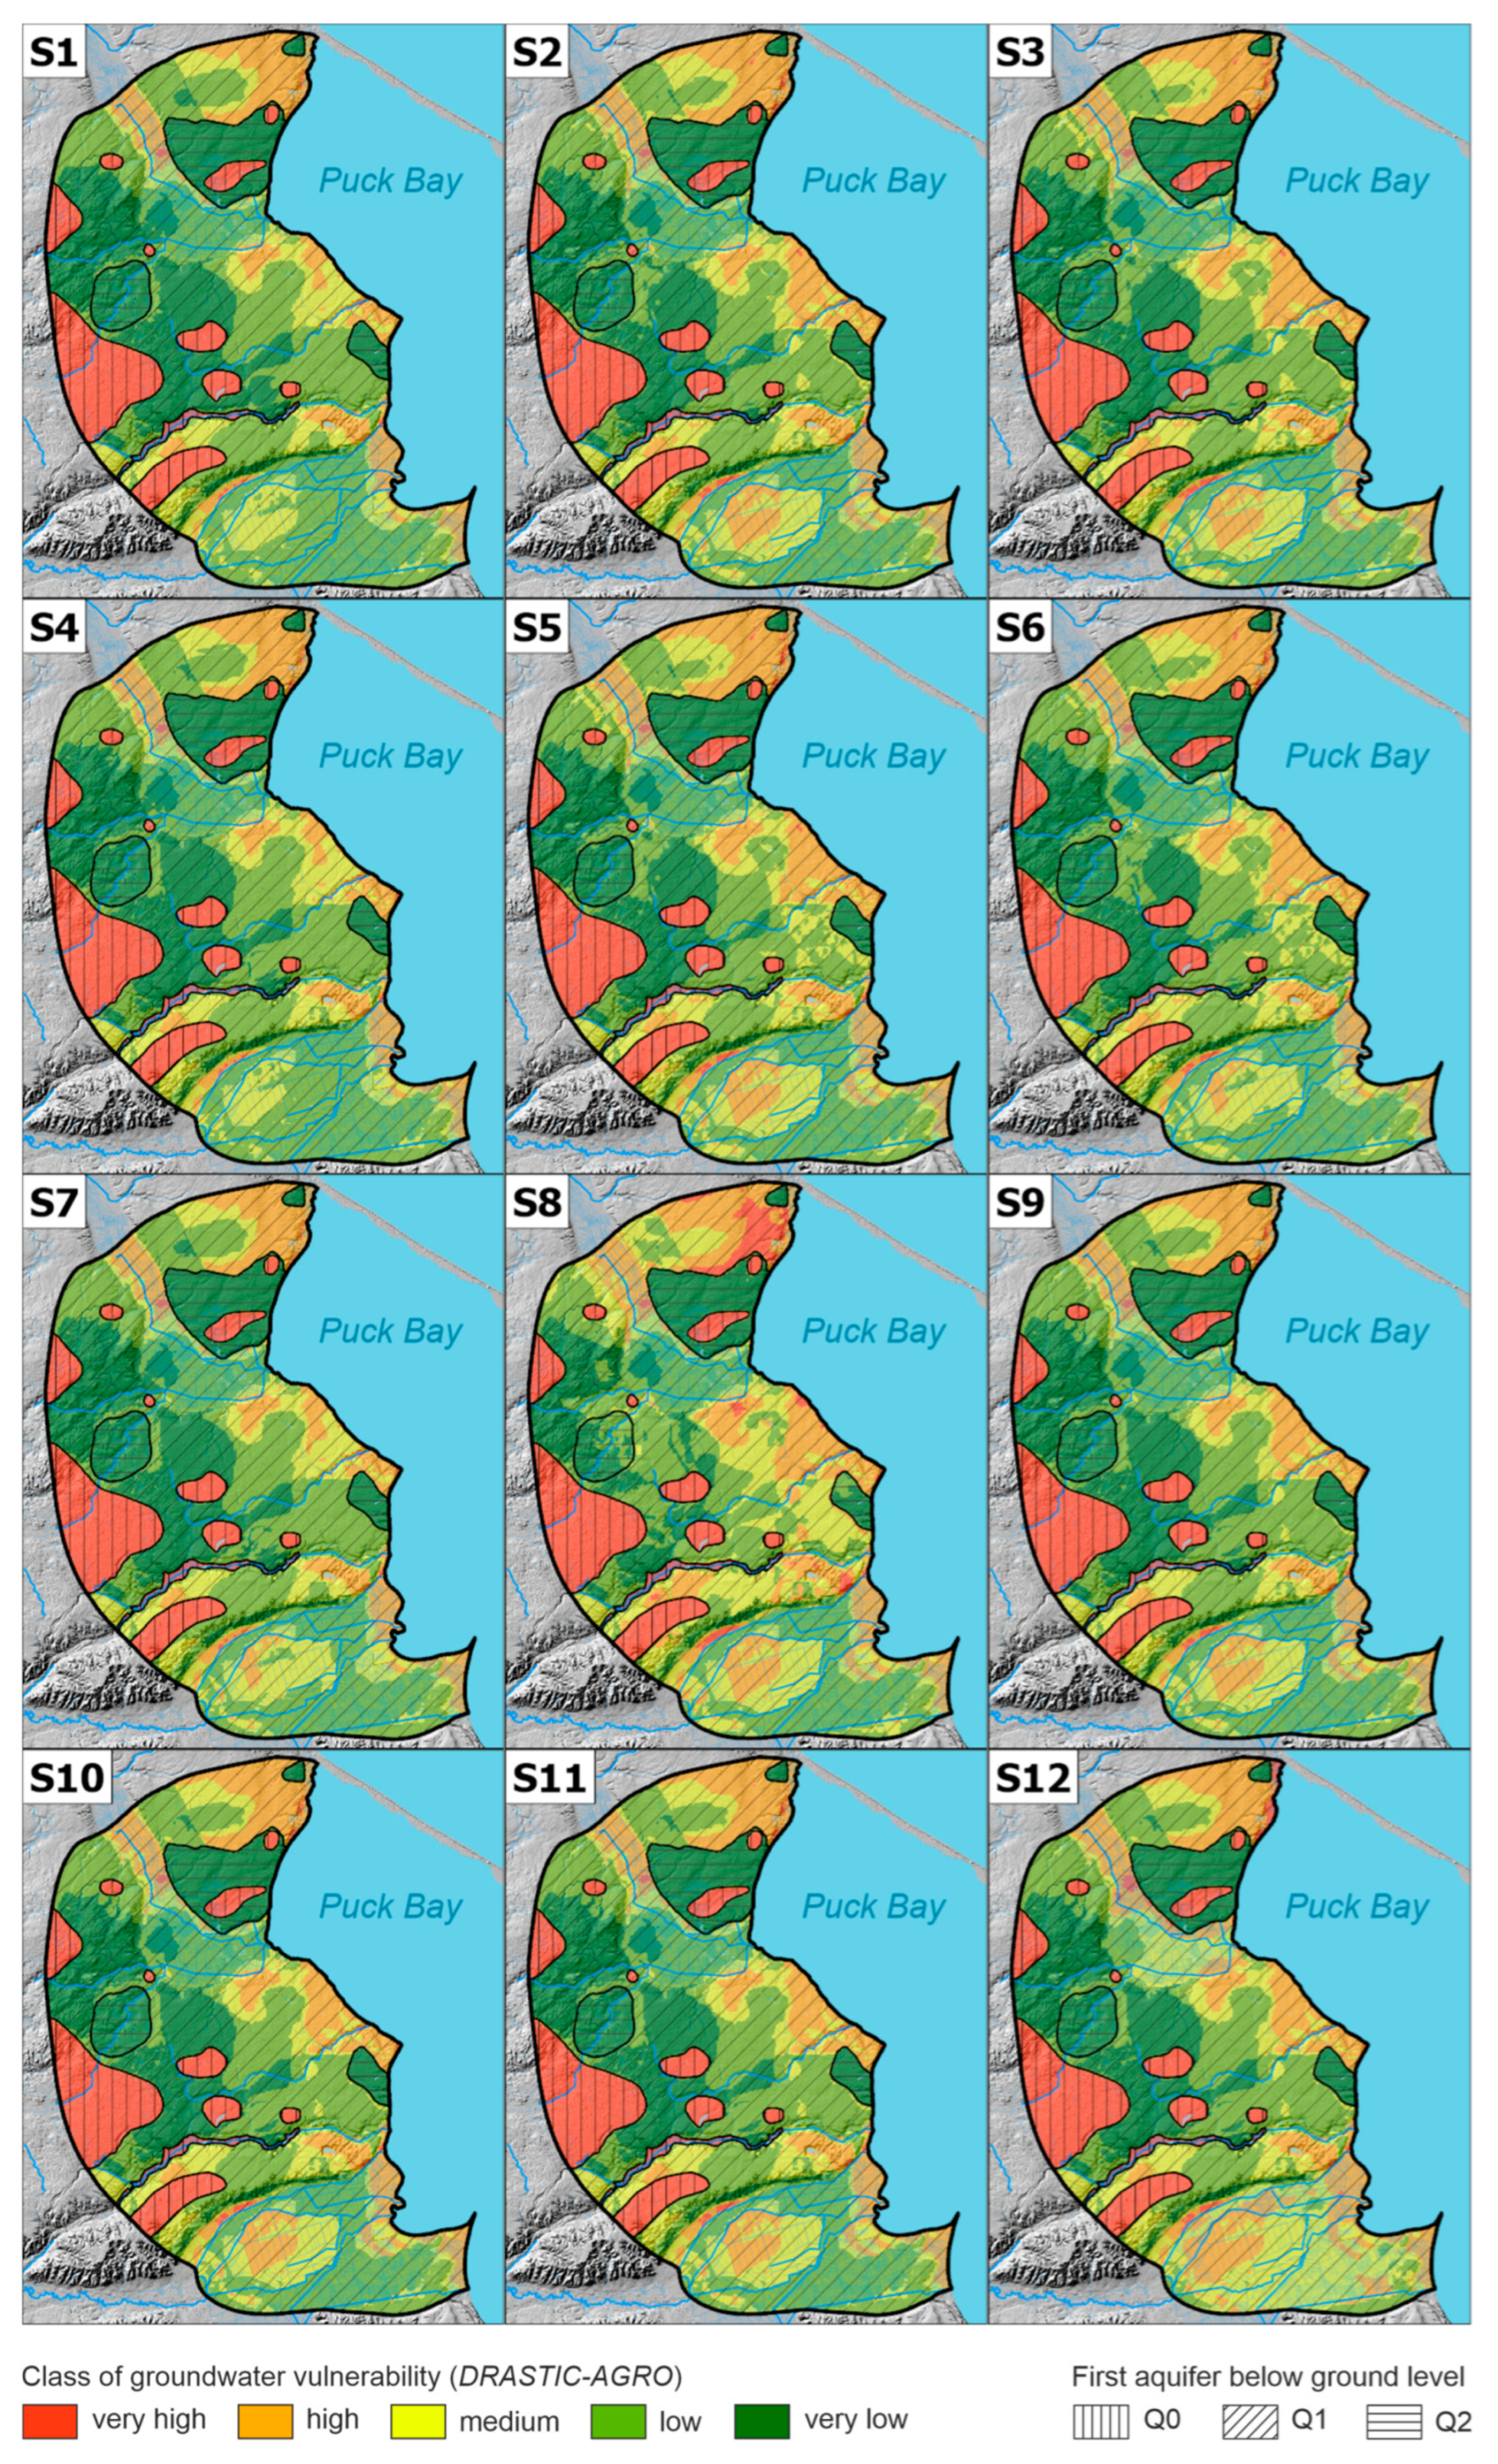
The DA vulnerability index calculations reveal distinct spatial patterns in the distribution of vulnerability classes within the research area, corresponding to each scenario (Figure 6). The observed variations between scenarios are directly driven by the specific agricultural activities defined in each case. Consequently, these activities modify both the load of N-NO3 leaching through the unsaturated zone and the groundwater recharge.
Crop type (S1–S6) significantly impacts the spatial variability of groundwater vulnerability to NO3. Scenarios featuring winter wheat (S1) and spring cereal mix (S4) are dominated by low and very low vulnerability classes, covering 62.4% and 62.2% of the study area, respectively. Conversely, the cultivation of canola (S3) and potatoes (S5) shifts the distribution toward high and very high vulnerability, constituting the largest portion of the area (29.2% and 29.1%, respectively). Fertilizer management (S7 and S8) also exerted a strong influence. In scenario S7, halving the fertilizer dose increased the coverage of low and very low vulnerability areas to 60.3%. In contrast, doubling the dose (S8) led to a distinct expansion of high and very high vulnerability zones to 33.0%. No significant changes in the spatial distribution of vulnerability classes were observed for the tillage (S9 and S10) compared to the baseline variant (W0), suggesting that tillage depth has a marginal impact on NO3 transport to groundwater in the research case. In scenarios S11 and S12, which assumed the grazing of dairy cattle on meadows and pastures, the results indicate that grazing density can significantly increase groundwater vulnerability to NO3. Scenario S12 (5 cows/ha) resulted in a significant increase in high and very high vulnerability areas (32.2%). This impact is particularly evident in ice-marginal valleys, which are typically used as meadows and pastures (Figure 1). The resulting vulnerability maps for each scenario are presented in Figure 7.

5. Discussion

The proposed hybrid vulnerability assessment, combining an Index-Based Method with Agro-Hydrological modeling, proved to be an effective tool for determining aquifer protection against nitrate pollution. A distinct advantage of this approach is the reduction of subjectivity by substituting qualitative with quantitative parameters and applying statistical methods, as confirmed by similar studies (e.g., [31,56]). Furthermore, optimizing parameter weights based on the correlation between class ranges and observed NO3 concentrations allowed for a precise determination of each factor’s impact on groundwater vulnerability. The datasets were log-transformed to address the non-normal distribution (typical of environmental parameters). This transformation satisfied the assumptions of the Pearson correlation method (linearity and normality), ensuring the statistical robustness of the calculated weights. Additionally, the single-parameter sensitivity analysis verified the assigned parameter weights, confirming that the selected weights effectively capture the vulnerability trends. This procedure enabled the rational adjustment of parameter importance to the specific conditions of the study area, significantly enhancing the reliability of the final vulnerability assessment. In contrast to the original DRASTIC method, which relies on the subjective selection of weights and ratings, the DRASTIC-AGRO method demonstrates significantly higher agreement with observed groundwater NO3 concentrations. By integrating with the SWAT model, the solution explicitly accounts for complex nitrogen cycle processes and diverse agricultural practice scenarios.
The adjustment of parameter classification in the DRASTIC-AGRO identified the hydraulic resistance of the vadose zone as the most influential factor, followed by aquifer thickness, N-NO3 load leaching from soil, groundwater velocity, and groundwater recharge. Consequently, high weights were assigned to HR, AT, and NL, which was consistent with similar methodologies in which their significant role in groundwater vulnerability assessment was highlighted (e.g., [9,31,56,63]). Notably, GR and GV received relatively low weights despite their recognized importance in NO3 transport (e.g., [31,63]). However, these weights are justified by the specific hydrogeological conditions of the study area and low spatial variability. SWAT results indicate that while recharge is controlled by soil type (high in sands, low in peat valleys) and land use, there is no straightforward spatial relationship between recharge and leaching. For instance, forested areas on sandy-gravel deposits show moderate-to-high recharge but low nitrate leaching. Conversely, agricultural areas and wetlands on peat deposits exhibit limited recharge but release large amounts of organic nitrogen through mineralization and nitrification, leading to high nitrate migration. However, a potential limitation of the obtained SWAT results is the lack of direct calibration data for nitrogen load leaching from the soil. While the exact absolute values of NL may carry some uncertainty, the SWAT model demonstrated high performance in the calibration of hydrology and crop yields, providing confidence in the transport mechanisms driving N-leaching. Furthermore, the primary role of the NL factor in the DRASTIC-AGRO method is to differentiate zones of high and low agricultural pressure on groundwater, rather than to predict exact concentrations. Therefore, the relative spatial distribution remains robust. Consequently, in the study area, the variability of HR plays a more dominant role in preventing contamination than the variability of GR. While recharge drives the transport, the hydraulic resistance of the vadose zone determines if and when the pollutant reaches the groundwater table. This finding suggests that future data collection should prioritize detailed lithological logging of the vadose zone to reduce uncertainty. Additionally, the highest groundwater velocities occur along river valley margins where strong hydraulic gradients develop. However, due to the absence of monitoring wells, these zones could not be sampled for nitrates, preventing their inclusion in the correlation analysis. Furthermore, as GV exhibits high homogeneity across the catchment, the statistical correlation method naturally assigns it a lower weight because it does not explain the spatial variance in observed nitrate concentrations. Consequently, both GR and GV exhibit weak statistical correlations with observed NO3 compared to other parameters, though additional data would likely result in only minor refinements to the weights. We note that despite the relatively low importance of GR, climate change might have some effect on the estimated groundwater vulnerability. Climate change may alter recharge fluxes due to increased evapotranspiration (driven by higher air temperatures) and different precipitation patterns. However, quantification of these effects is beyond the scope of our study.
The developed DRASTIC-AGRO method enabled the evaluation of specific groundwater vulnerability to NO3 pollution while explicitly considering the conditions of current agricultural practices. The vulnerability index highlights distinct spatial patterns concerning aquifer types. The perched aquifer (Q0) is assigned to the very high vulnerability class due to its shallow depth, lack of adequate protection from the surface, and limited thickness of the aquifer. Conversely, the deeper aquifer (Q2) exhibits very low vulnerability, protected by significant depth and overlying low-permeability deposits. The shallow aquifer (Q1) shows the greatest variability: very low vulnerability characterizes the western and central moraine upland (due to thick glacial tills), whereas vulnerability increases in the eastern part of the research area near the coast, where the unsaturated zone thins to a few meters of sandy deposits. In ice-marginal valleys, vulnerability is largely land-cover dependent, with medium and high classes found primarily in wetland and crop areas.
The analysis confirmed that specific agricultural practices strongly affect groundwater vulnerability to NO3 pollution. From Figure 6 and Figure 7, it can be seen that differences in vulnerability are linked to crop type and associated agricultural practices (scenarios S1–S6). The differences in vulnerability between scenarios are closely related to varying groundwater recharge and the nitrate load to groundwater, as shown in Figure 3. A critical role is played by the water demands of crops [100]. Crop water requirements vary throughout the growing season, reaching their maximum during the late vegetative stage and the onset of reproductive organ formation [101]. Depending on crop type, adequate amounts and proportions of nutrients are also necessary for growth, development, and yield formation [102]. Nitrogen is the primary structural nutrient, taken up by plants in NO3 and NH4 forms through roots and leaves [103]. Nutrients not used by plants leach from the soil profile and ultimately migrate into groundwater. Results indicate that cultivating winter wheat and spring barley could reduce NO3 leaching by up to 63%, although this would concurrently reduce aquifer recharge by approximately 13%.
Soil fertility rarely fully meets crop nutritional demands, necessitating the application of fertilizers [103]. However, increased fertilization does not always translate into higher yields. Consequently, nutrient surpluses often lead to significant losses. The relationship between the fertilizer dose and the leached nitrate is nonlinear. The results from scenarios S7 and S8 demonstrate that while halving the fertilizer dose reduces leaching moderately, doubling the dose leads to a nearly threefold increase in NO3 leaching. This indicates that beyond a certain threshold, the plants’ uptake capacity becomes saturated, and the excess nitrogen is rapidly leached into the groundwater. Therefore, fertilizer doses must be carefully matched to crop type and soil conditions to minimize groundwater pollution without compromising yields.
Scenarios S9 and S10 indicate that tillage depth exerts a negligible influence on groundwater recharge and NO3 leaching. Consequently, it does not significantly affect groundwater vulnerability in the area under investigation. This limited impact is attributed to both the prevailing hydro-pedological conditions and the relatively small magnitude of the assumed tillage modifications. Tillage affects only the top soil layer (0–30 cm), which is negligible compared to the total thickness of the vadose zone in the study area (often exceeding several meters). This suggests that the limited impact of tillage depth observed here is likely generalizable to aquifers with thick vadose zones, whereas in shallow groundwater systems, tillage management might play a more significant role. In the SWAT model, tillage depth determines the fraction of the soil layer that is mixed by a tillage operation. While this parameter theoretically influences nutrient redistribution, soil organic matter decomposition rate, and moisture conditions [90], its impact in the analyzed case was minimal. This indicates that while SWAT simulates the mixing of nutrients during tillage operations, the major driver of leaching in this catchment is the infiltration rate determined by precipitation and soil texture, which remains constant across the tested tillage scenarios. However, the impact on recharge rates and NO3 leaching in agricultural areas may be complex and ambiguous, as it largely depends on factors such as the type of soil deposits and crop type. Simulations show that increasing tillage depth slightly reduced groundwater recharge, whereas shallower tillage enhanced soil water retention and infiltration, primarily by altering evapotranspiration rates. These findings are consistent with previous studies [104]. The response of N-NO3 migration was more complex and largely dependent on the Hydrologic Soil Group (A, B, C, D), with soil erodibility (USLE_K) being particularly influential. For sandy soils (groups A and B), deeper tillage increased NO3 leaching, whereas shallower tillage limited losses. Conversely, in peat and clay soils (Groups C and D), the trend was reversed due to differences in organic matter decomposition and nutrient redistribution. Critically, at the catchment scale, these contrasting soil-specific responses effectively offset each other because the agricultural land comprises a balanced mix of these soil groups. Similar relationships between soil hydrologic groups and nitrogen leaching have been documented in previous studies [105,106]. From an agronomic perspective, adequate soil loosening is essential for porosity, thereby improving plant growth conditions and resulting in higher yields [107]. In contrast, insufficient tillage can restrict water and nutrient uptake [101]. The absence of significant differences between scenarios S9 and S10 suggests that small variations in the implemented tillage depth were too minor to disrupt these processes, given that tillage timing and frequency remained constant. However, it is worth noting that tillage frequency—particularly in early autumn—may substantially increase NO3 leaching [61]. Further research is needed to compare the effects of tillage between SWAT and other agro-hydrological models.
Scenarios S11 and S12 show that converting meadows and pastures entirely to dairy cattle grazing leads to significant increases in NO3 leaching, thereby elevating groundwater vulnerability. The magnitude of this effect strongly depends on livestock density—higher cattle numbers generate greater nitrogen loads. However, this relationship is not proportional. Figure 6 shows that a five-fold increase in cattle density causes almost a two-fold increase in the load of nitrate to groundwater. Shallow groundwater tables further enhance the risk of nitrogen migration into aquifers.

6. Conclusions

This study evaluated specific groundwater vulnerability to NO3 pollution in the context of agricultural practices. The modification of the original DRASTIC method, which incorporated outputs from the SWAT model, significantly enhanced both the accuracy and reliability of the assessment. Key to this improvement was the replacement of qualitative parameters with quantitative ones, alongside the application of statistical methods to optimize parameter weights and class ranges. The developed DRASTIC-AGRO method successfully assessed the vulnerability of the first aquifer to NO3 pollution in the Puck Bay catchment. The analysis revealed distinct spatial variability driven primarily by aquifer properties and local hydrogeological conditions. However, agricultural practices have a very strong influence on groundwater vulnerability by controlling both recharge rates and nitrogen losses from the soil profile. Among all the considered scenarios, the largest increase in vulnerability with respect to the baseline (W0) was observed for S8 (doubling the fertilizer dose) and S12 (livestock density 5 cows/ha). On the other hand, the lowest vulnerability occurred in S1 (winter wheat) and S4 (barley/spring cereals). The changes in vulnerability are strongly related to the changes in nitrate load leached from soil to groundwater. These results provide some suggestions on how to reduce groundwater vulnerability and improve the sustainability of land use. An increase in fertilizer doses should be avoided. In areas with the highest groundwater vulnerability, farming of cereals (wheat, barley) should be preferred over other crops, and the reduction of cattle density should be encouraged. Among crop types, potato cultivation appears to pose the greatest risk to groundwater quality.
The SWAT model demonstrated high utility in integrating detailed land-use and agricultural practice data into vulnerability assessments. By simulating diverse agricultural scenarios, the tool facilitates the identification of sustainable management strategies. Importantly, this integration transforms the vulnerability assessment from a purely diagnostic instrument into a prognostic aid for land-use planning. It identifies not only where the aquifer is vulnerable, but specifically which practices pose the greatest threat. Consequently, it allows decision-makers to predict how changes in crop type, fertilization, tillage, and grazing will impact groundwater. These findings provide a robust basis for developing management plans, delineating protection zones, and the placement of new hydrogeological wells.
While the proposed method is applicable to similar agricultural regions, accuracy remains dependent on the resolution of agricultural data and aquifer characterization. Future studies should focus on refining parameterization and acquiring more extensive NO3 concentration datasets for enhanced calibration. A promising avenue is the integration of satellite remote sensing to precisely monitor land-use changes and crop type distribution. Additionally, future research should incorporate advanced mathematical models to better estimate percolation time through the vadose zone—a critical factor in contaminant transport. The results will be compared with outcomes of the ongoing DATASET project [108], which utilizes global databases to assess agricultural pollution risks.

Author Contributions

Conceptualization, D.P., B.J.-S. and A.S.; methodology, D.P. and G.B.; software, D.P. and B.J.-S.; validation, D.P. and G.B.; formal analysis, D.P.; investigation, D.P., B.J.-S., A.G.-K. and W.G.-L.; resources, D.P. and B.J.-S.; data curation, D.P., A.G.-K. and W.G.-L.; writing—original draft preparation, D.P.; writing—review and editing, B.J.-S., A.S., G.B. and M.M.; visualization, D.P.; supervision, M.M.; project administration, M.M. and B.J.-S.; funding acquisition, M.M. and B.J.-S. All authors have read and agreed to the published version of the manuscript.

Funding

The authors would like to thank the European Commission and National Centre for Research and Development (NCBR) for funding in the frame of the collaborative international consortium DATASET (Groundwater salinization and pollution assessment tool: a holistic approach for coastal areas, Water4All_00084), financed under the 2022 Joint call of the European Partnership 101060874—Water4All. This research was partly based on the results obtained in the framework of the project BIOSTRATEG3/343927/3/NCBR/2017 “Modelling of the impact of the agricultural holdings and land-use structure on the quality of inland and coastal waters of the Baltic Sea set up on the example of the Municipality of Puck region—Integrated info-prediction Web Service WaterPUCK”, BIOSTRATEG Programme, funded by the National Centre for Research and Development, Poland.

Institutional Review Board Statement

Not applicable.

Informed Consent Statement

Not applicable.

Data Availability Statement

The data presented in this study are available on request from the first author.

Conflicts of Interest

The authors declare no conflicts of interest.

References

  1. Sapek, A. Rolnictwo polskie i ochrona jakości wody, zwłaszcza wody Bałtyku. Woda-Sr.-Obsz. Wiej. 2010, 10, 175–200. [Google Scholar]
  2. Højberg, A.L.; Hansen, A.L.; Wachniew, P.; Żurek, A.J.; Virtanen, S.; Arustiene, J.; Strömqvist, J.; Rankinen, K.; Refsgaard, J.C. Review and assessment of nitrate reduction in groundwater in the Baltic Sea Basin. J. Hydrol. Reg. Stud. 2017, 12, 50–68. [Google Scholar] [CrossRef] [Scilit]
  3. Thodsen, H.; Farkas, C.; Chormanski, J.; Trolle, D.; Blicher-Mathiesen, G.; Grant, R.; Engebretsen, A.; Kardel, I.; Andersen, H.E. Modelling Nutrient Load Changes from Fertilizer Application Scenarios in Six Catchments around the Baltic Sea. Agriculture 2017, 7, 41. [Google Scholar] [CrossRef] [Scilit]
  4. Mateo-Sagasta, J.; Zadeh, S.M.; Turral, H.; Burke, J. Water Pollution from Agriculture: A Global Review. Executive Summary; FAO: Rome, Italy; IWMI: Colombo, Sri Lanka, 2017. [Google Scholar]
  5. Macioszczyk, A.; Bagińska, B. Związki azotu występujące w wodach sandru kurpiowskiego i interpretacja ich stężeń w aspekcie zanieczyszczenia rolniczego regionu. Przegląd Geol. 1991, 39, 21–24. [Google Scholar]
  6. Mikołajków, J. Migracja związków azotu w strefie aeracji jako wskaźnika zanieczyszczenia wód podziemnych w sandrowych obszarach rolniczych. WPH 1995, 7, 323–329. [Google Scholar]
  7. Czajkowska, A. Stopień zanieczyszczenia związkami biogennymi płytkich wód podziemnych w zagospodarowanej rolniczo części zlewni Bierawki. Górnictwo i Geol. 2010, 5, 91–103. [Google Scholar]
  8. Zabłocki, S. Prognozowanie zmian zagrożenia azotanami wód podziemnych poziomów użytkowych na obszarach użytkowanych rolniczo. MPWP 2014, VI, 151–157. [Google Scholar]
  9. Zabłocki, S. Podatność naturalna i specyficzna wód podziemnych na obszarach rolniczych. Przegląd Geol. 2015, 63, 1135–1139. [Google Scholar]
  10. Holden, J.; Haygarth, P.M.; MacDonald, J.; Jenkins, A.; Sapiets, A.; Orr, H.G.; Dunn, N.; Harris, B.; Pearson, P.L.; McGonigle, D.; et al. Agriculture’s Impacts on Water Quality; Global Food Security: Belfast, UK, 2015. [Google Scholar]
  11. Dragon, K. Application of factor analysis to study contamination of a semi-confined aquifer (Wielkopolska Buried Valley aquifer, Poland). J. Hydrol. 2016, 331, 272–279. [Google Scholar] [CrossRef] [Scilit]
  12. Malki, M.; Bouchaou, L.; Hirich, A.; Brahim, Y.A.; Choukr-Allah, R. Impact of agricultural practices on groundwater quality in intensive irrigated area of Chtouka-Massa, Morocco. Sci. Total Environ. 2017, 574, 760–770. [Google Scholar] [CrossRef] [Scilit] [PubMed]
  13. Lwimbo, Z.D.; Komakech, H.C.; Muzuka, A.N.N. Impacts of Emerging Agricultural Practices on Groundwater Quality in Kahe Catchment, Tanzania. Water 2019, 11, 2263. [Google Scholar] [CrossRef] [Scilit]
  14. Witczak, S.; Kania, J.; Kmiecik, E. Katalog Wybranych Fizycznych i Chemicznych Wskaźników Zanieczyszczeń Wód Podziemnych i Metod Ich Oznaczania; Biblioteka Monitoringu Środowiska: Warszawa, Poland, 2013. [Google Scholar]
  15. Macioszczyk, A. Hydrogeochemia; Wydawnictwa Geologiczne: Warszawa, Poland, 1987. [Google Scholar]
  16. Żurek, A. Azotany w wodach podziemnych. Biul. Państw. Inst. Geol. 2002, 400, 115–141. [Google Scholar]
  17. Vrba, J.; Zaporozec, A. Guidebook on Mapping Groundwater Vulnerability; International Association of Hydrogeologists: Hannover, Germany, 1994; Volume 16. [Google Scholar]
  18. Gogu, R.C.; Dassargues, A. Current trends and future challenges in groundwater vulnerability assessment using overlay and index methods. Environ. Geol. 2000, 39, 549–559. [Google Scholar] [CrossRef] [Scilit]
  19. Krogulec, E. Intrinsic and Specific Vulnerability of Groundwater in a River Valley—Assessment, Verification and Analysis of Uncertainty. J. Earth Sci. Clim. Change 2013, 4, 159. [Google Scholar]
  20. Machiwal, D.; Jha, M.K.; Singh, V.P.; Mohan, C. Assessment and mapping of groundwater vulnerability to pollution: Current status and challenges. Earth-Sci. Rev. 2018, 185, 901–927. [Google Scholar] [CrossRef] [Scilit]
  21. Foster, S.; Hirata, R.; Andreo, B. The aquifer pollution vulnerability concept: Aid or impediment in promoting groundwater protection? Hydrogeol. J. 2013, 21, 1389–1392. [Google Scholar] [CrossRef] [Scilit]
  22. Focazio, M.J.; Reilly, T.E.; Rupert, M.G.; Helsel, D.R. Assessing Ground-Water Vulnerability to Contamination: Providing Scientifically Defensible Information for Decision Makers; U.S. Geological Survey: Reston, VA, USA, 2002.
  23. Krogulec, E. Ocena Podatności Wód Podziemnych na Zanieczyszczenia w Dolinie Rzecznej na Podstawie Przesłanek Hydrodynamicznych; Wydawnictwa Uniwersytetu Warszawskiego: Warszawa, Poland, 2004. [Google Scholar]
  24. Wachniew, P.; Żurek, A.J.; Stumpp, C.; Gemitzi, A.; Gargini, A.; Filippini, M.; Rozanski, K.; Meeks, J.; Kværner, J.; Witczak, S. Toward operational methods for the assessment of intrinsic groundwater vulnerability: A review. Crit. Rev. Environ. Sci. Technol. 2016, 46, 827–884. [Google Scholar] [CrossRef] [Scilit]
  25. Moges, S.S.; Dinka, M.O. Assessment of groundwater vulnerability mapping methods for sustainable water resource management: An overview. J. Water Land Dev. 2022, 52, 186–198. [Google Scholar] [CrossRef] [Scilit]
  26. Kumar, P.; Bansod, B.K.S.; Debnath, S.K.; Thakur, P.K.; Ghanshyam, C. Index-based groundwater vulnerability mapping models using hydrogeological settings: A critical evaluation. Environ. Impact Assess. Rev. 2015, 51, 38–49. [Google Scholar] [CrossRef] [Scilit]
  27. Vías, J.; Andreo, B.; Perles, M.; Carrasco, F.; Vadillo, I.; Jiménez, P. Proposed method for groundwater vulnerability mapping in carbonate (karstic) aquifers: The COP method. Hydrogeol. J. 2006, 14, 912–925. [Google Scholar] [CrossRef] [Scilit]
  28. Rahman, A. A GIS based DRASTIC model for assessing groundwater vulnerability in shallow aquifer in Aligarh, India. Appl. Geogr. 2008, 28, 32–53. [Google Scholar] [CrossRef] [Scilit]
  29. Wen, X.; Wu, J.; Si, J. A GIS-based DRASTIC model for assessing shallow groundwater vulnerability in the Zhangye Basin, northwestern China. Environ. Geol. 2009, 57, 1435–1442. [Google Scholar] [CrossRef] [Scilit]
  30. Saidi, S.; Bouri, S.; Dhia, H.B. Sensitivity analysis in groundwater vulnerability assessment based on GIS in the Mahdia-Ksour Essaf aquifer, Tunisia: A validation study. Hydrol. Sci. J. 2011, 56, 288–304. [Google Scholar] [CrossRef] [Scilit]
  31. Kazakis, N.; Voudouris, K.S. Groundwater vulnerability and pollution risk assessment of porous aquifers to nitrate: Modifying the DRASTIC method using quantitative parameters. J. Hydrol. 2015, 525, 13–25. [Google Scholar] [CrossRef] [Scilit]
  32. Luoma, S.; Okkonen, J.; Korkka-Niemi, K. Comparison of the AVI, modified SINTACS and GALDIT vulnerability methods under future climate-change scenarios for a shallow low-lying coastal aquifer in southern Finland. Hydrogeol. J. 2016, 25, 203–222. [Google Scholar] [CrossRef] [Scilit]
  33. Pruszkowska-Caceres, M.; Potrykus, D. Warunki hydrogeochemiczne i podatność na zanieczyszczenie wód podziemnych w zlewni górnej Raduni. Przegląd Geol. 2017, 65, 1350–1355. [Google Scholar]
  34. Aller, L.; Bennett, T.; Lehr, J.H.; Petty, R.J.; Hackett, G. DRASTIC: A Standardized System for Evaluating Ground Water Pollution Potential Using Hydrogeologic Settings; EPA/600/2-85-018; US Environmental Protection Agency: Ada, OK, USA, 1987.
  35. Foster, S.S.D. Fundamental concepts in aquifer vulnerability, pollution risk and protection strategy. In Proceedings of the International Conference, Vulnerability of Soil and Groundwater to Pollutants, Noordwijk Aan Zee, The Netherlands, 30 March–3 April 1987. [Google Scholar]
  36. van Stempvoort, D.; Ewert, L.; Wassenaar, L. Aquifer Vulnerability Index: A GIS compatible method for groundwater vulnerability mapping. Can. Water Resour. J. 1993, 18, 25–37. [Google Scholar] [CrossRef] [Scilit]
  37. Civita, M. Le Carte Della Vulnerabilità degli Acquiferi all’Inquinamento: Teoria e Pratica; Pitagora Editrice: Bologna, Italy, 1994. [Google Scholar]
  38. Ray, J.A.; O’Dell, P.W. DIVERSITY: A new method for evaluating sensitivity of groundwater to contamination. Environ. Geol. 1993, 22, 345–352. [Google Scholar] [CrossRef] [Scilit]
  39. Doerfliger, N.; Jeannin, P.Y.; Zwahlen, F. Water vulnerability assessment in karst environments: A new method of defining protection areas using a multi-attribute approach and GIS tools (EPIK method). Environ. Geol. 1999, 39, 165–176. [Google Scholar] [CrossRef] [Scilit]
  40. Barbulescu, A. Assessing Groundwater Vulnerability: DRASTIC and DRASTIC-Like Methods: A Review. Water 2020, 12, 1356. [Google Scholar] [CrossRef] [Scilit]
  41. Secunda, S.; Collin, M.L.; Melloul, A.J. Groundwater vulnerability assessment using a composite model combining DRASTIC with extensive agricultural land use in Israel’s Sharon region. J. Environ. Manag. 1998, 54, 39–57. [Google Scholar] [CrossRef] [Scilit]
  42. Martinez-Bastida, J.J.; Arauzo, M.; Valladolid, M. Intrinsic and specific vulnerability of groundwater in central Spain: The risk of nitrate pollution. Hydrogeol. J. 2010, 18, 681–698. [Google Scholar] [CrossRef] [Scilit]
  43. Ribeiro, L. SI: A New Index of Aquifer Susceptibility to Agricultural Pollution; ERSHA/CVRM; Instituto Superior Técnico: Lisboa, Portugal, 2000. [Google Scholar]
  44. Ertürk, A.; Ekdal, A.; Gurel, M.; Karakaya, N.; Cuceloglu, G.; Gönenç, E. Model-based assessment of groundwater vulnerability for the Dalyan Region of southwestern Mediterranean Turkey. Reg. Environ. Change 2017, 17, 1193–1203. [Google Scholar] [CrossRef] [Scilit]
  45. Abunada, Z.; Kishawi, Y.; Alslaibi, T.M.; Kuhail, N.; Mittelstet, A. The application of SWAT-GIS tool to improve the recharge factor in the DRASTIC framework: Case Study. J. Hydrol. 2020, 592, 125613. [Google Scholar] [CrossRef] [Scilit]
  46. Umar, M.; Khan, S.N.; Arshad, A.; Aslam, R.A.; Khan, H.M.S.; Rashid, H.; Pham, Q.B.; Nasir, A.; Noor, R.; Khedher, K.M.; et al. A modified approach to quantify aquifer vulnerability to pollution towards sustainable groundwater management in Irrigated Indus Basin. Environ. Sci. Pollut. Res. 2022, 29, 27257–27278. [Google Scholar] [CrossRef] [Scilit] [PubMed]
  47. Özdemir, A. Determination of areas vulnerable to pollution in a karstic river basin in Turkey via a decision support system based on DRASTIC, SWAT and isotopes analysis. Hydrogeol. J. 2023, 31, 1209–1228. [Google Scholar] [CrossRef] [Scilit]
  48. Segura-Méndez, F.J.; Pérez-Sánchez, J.; López-Ballesteros, A.; Senent-Aparicio, J. A modelling approach combining swat with Gis-based DRASTIC techniques to assess aquifer vulnerability evolution in highly anthropised aquifers. Environ. Earth Sci. 2024, 83, 633. [Google Scholar] [CrossRef] [Scilit]
  49. Petpongpan, C.; Ekkawatpanit, C.; Kositgittiwong, D. Groundwater vulnerability assessment using modified DRASTIC method with integrated hydrological model. Groundw. Sustain. Dev. 2025, 29, 101416. [Google Scholar] [CrossRef] [Scilit]
  50. Piekarek-Jankowska, H. Zatoka Pucka Jako Obszar Drenażu Wód Podziemnych; Wydawnictwo Uniwersytetu Gdańskiego: Gdańsk, Poland, 1994. [Google Scholar]
  51. Szymkiewicz, A.; Potrykus, D.; Jaworska-Szulc, B.; Gumuła-Kawęcka, A.; Pruszkowska-Caceres, M.; Dzierzbicka-Głowacka, L. Evaluation of the Influence of Farming Practices and Land Use on Groundwater Resources in a Coastal Multi-Aquifer System in Puck Region (Northern Poland). Water 2020, 12, 1042. [Google Scholar] [CrossRef] [Scilit]
  52. Matciak, M.; Pruszkowska-Caceres, M.; Szymczycha, B.; Kobos, J.; Kłostowska, Ż.; Misiewicz, M.M.; Owsianny, P.M. Dopływ wód podziemnych do Zatoki Puckiej. In Zatoka Pucka; Wydawnictwo Uniwersytetu Gdańskiego: Gdańsk, Poland, 2022; Volume 1. [Google Scholar]
  53. Potrykus, D. The impact of agricultural practices on groundwater and nitrate discharge to Puck Bay, Poland. Przegląd Geol. 2024, 72, 15–25. [Google Scholar] [CrossRef] [Scilit]
  54. Potrykus, D.; Pruszkowska-Caceres, M.; Jaworska-Szulc, B.; Gumuła-Kawęcka, A.; Szymkiewicz, A. Skład chemiczny wód podziemnych dopływających z Pobrzeża Kaszubskiego do Zatoki Puckiej. Przegląd Geol. 2020, 68, 691–700. [Google Scholar] [CrossRef] [Scilit]
  55. Dzierzbicka-Głowacka, L.; Pietrzak, S.; Dybowski, D.; Białoskórski, M.; Marcinkowski, T.; Rossa, L.; Urbaniak, M.; Majewska, Z.; Juszkowska, D.; Nawalany, P.; et al. Impact of agricultural farms on the environment of the Puck Commune: Integrated agriculture calculator—CalcGosPuck. PeerJ 2019, 7, e6478. [Google Scholar] [CrossRef] [Scilit]
  56. Busico, G.; Kazakis, N.; Cuoco, E.; Colombani, N.; Tedesco, D.; Voudouris, K.; Mastrocicco, M. A novel hybrid method of specific vulnerability to anthropogenic pollution using multivariate statistical and regression analyses. Water Res. 2020, 170, 115386. [Google Scholar] [CrossRef] [Scilit]
  57. Neitsch, S.L.; Arnold, J.G.; Kiniry, J.R.; Williams, J.R. Soil and Water Assessment Tool Theoretical Documentation Version 2009; Texas Water Resources Institute: College Station, TX, USA, 2011. [Google Scholar]
  58. Busico, G.; Kazakis, N.; Colombani, N.; Khosravi, K.; Voudouris, K.; Mastrocicco, M. The Importance of Incorporating Denitrification in the Assessment of Groundwater Vulnerability. Appl. Sci. 2020, 10, 2328. [Google Scholar] [CrossRef] [Scilit]
  59. Busico, G.; Alessandrino, L.; Mastrocicco, M. Denitrification in Intrinsic and Specific Groundwater Vulnerability Assessment: A Review. Appl. Sci. 2021, 11, 10657. [Google Scholar] [CrossRef] [Scilit]
  60. Żurek, A. Ocena poziomu wymycia azotanów do wód podziemnych na podstawie badań w małych zlewniach rolniczych. Biul. Państw. Inst. Geol. 2009, 436, 589–596. [Google Scholar]
  61. Dybowski, D.; Dzierzbicka-Głowacka, L.; Pietrzak, S.; Juszkowska, D.; Puszkarczuk, T. Estimation of nitrogen leaching load from agricultural fields in the Puck Commune with an interactive calculator. PeerJ 2020, 8, e8899. [Google Scholar] [CrossRef] [Scilit]
  62. Zhong, Z.S. A discussion of groundwater vulnerability assessment methods. Earth Sci. Front. 2005, 12, 3–13. [Google Scholar]
  63. Huan, H.; Wang, J.; Teng, Y. Assessment and validation of groundwater vulnerability to nitrate based on a modified DRASTIC model: A case study in Jilin City of northeast China. Sci. Total Environ. 2012, 440, 14–23. [Google Scholar] [CrossRef] [Scilit]
  64. Sinan, M.; Razack, M. An extension to the DRASTIC model to assess groundwater vulnerability to pollution: Application to the Haouz aquifer of Marrakech (Morocco). Environ Geol. 2009, 57, 349–363. [Google Scholar] [CrossRef] [Scilit]
  65. Marciniak, M.; Przybyłek, J.; Herzig, J.; Szczepańska, J. Badania Współczynnika Filtracji Utworów Półprzepuszczalnych; Wydawnictwo Sorus: Poznań-Kraków, Poland, 1999. [Google Scholar]
  66. Schaap, M.G.; Leij, F.J.; van Genuchten, M.T. A bootstrap-neural network approach to predict soil hydraulic parameters. In Characterization and Measurements of the Hydraulic Properties of Unsaturated Porous Media; van Genuchten, M.T., Leij, F.J., Wu, L., Eds.; University of California: Riverside, CA, USA, 1999; pp. 1237–1250. [Google Scholar]
  67. Kellner, E. Effects of Variations in Hydraulic Conductivity and Flow Conditions on Groundwater Flow and Solute Transport in Peatlands; R-07-41; SKB, Department of Forest Ecology; University of Helsinki: Helsinki, Finland, 2007. [Google Scholar]
  68. Polańska, K.; Piekarek-Jankowska, H. Metoda odwzorowania współczynników filtracji zastosowana w modelu strefy brzegowej Zatoki Gdańskiej. Biul. Państw. Inst. Geol. 2008, 431, 179–186. [Google Scholar]
  69. Panagopoulos, G.; Antonakos, A.; Lambrakis, N. Optimization of the DRASTIC method for groundwater vulnerability assessment via the use of simple statistical methods and GIS. Hydrogeol. J. 2006, 14, 894–911. [Google Scholar] [CrossRef] [Scilit]
  70. Antonakos, A.K.; Lambrakis, N.J. Development and testing of three hybrid methods for the assessment of aquifer vulnerability to nitrates, based on the drastic model, an example from NE Korinthia, Greece. J. Hydrol. 2007, 333, 288–304. [Google Scholar] [CrossRef] [Scilit]
  71. Pearson, K. Mathematical contributions to the theory of evolution. III. Regression, heredity, and panmixia. Philos. Trans. R. Soc. Lond. A 1896, 187, 253–318. [Google Scholar] [CrossRef] [Scilit]
  72. Reimann, C.; Filzmoser, P. Normal and lognormal data distribution in geochemistry: Death of a myth. Consequences for the statistical treatment of geochemical and environmental data. Environ. Geol. 2000, 39, 1001–1014. [Google Scholar] [CrossRef] [Scilit]
  73. Krogulec, E.; Zabłocki, S.; Zadrożna, D. Variability of Intrinsic Groundwater Vulnerability to Pollution in River Valley due to Groundwater Depth and Recharge Changes. Appl. Sci. 2019, 9, 1133. [Google Scholar] [CrossRef] [Scilit]
  74. Maqsoom, A.; Aslam, B.; Khalil, U.; Ghorbanzadeh, O.; Ashraf, H.; Tufail, R.F.; Farooq, D.; Blaschke, T. A GIS-based DRASTIC Model and an Adjusted DRASTIC Model (DRASTICA) for Groundwater Susceptibility Assessment along the China–Pakistan Economic Corridor (CPEC) Route. ISPRS Int. J. Geo-Inf. 2020, 9, 332. [Google Scholar] [CrossRef] [Scilit]
  75. Napolitano, P.; Fabbri, A. Single-parameter sensitivity analysis for aquifer vulnerability assessment using DRASTIC and SINTACS. In HydroGIS 96: Application of Geographic Information Systems in Hydrology and Water Resources Management; IAHS: Vienna, Austria, 1996; Volume 235, pp. 559–566. [Google Scholar]
  76. Gogu, R.C.; Hallet, V.; Dassargues, A. Comparison of aquifer vulnerability assessment techniques. Application to the Néblon river basin (Belgium). Environ. Geol. 2003, 44, 881–892. [Google Scholar] [CrossRef] [Scilit]
  77. Dzierzbicka-Głowacka, L.; Dybowski, D.; Janecki, M.; Wojciechowska, E.; Szymczycha, B.; Potrykus, D.; Nowicki, A.; Szymkiewicz, A.; Zima, P.; Jaworska-Szulc, B.; et al. Modelling the impact of the agricultural holdings and land-use structure on the quality of inland and coastal waters with an innovative and interdisciplinary toolkit. Agric. Water Manag. 2022, 263, 107438. [Google Scholar] [CrossRef] [Scilit]
  78. Topographic Data. Available online: https://www.geoportal.gov.pl/ (accessed on 10 March 2025).
  79. CORINE Land Cover—CLC. Available online: https://clc.gios.gov.pl/ (accessed on 10 March 2025).
  80. Mojski, J.E. Szczegółowa Mapa Geologiczna Polski 1:50,000, Arkusz Gdynia (16); Instytut Geologiczny: Warszawa, Poland, 1978. [Google Scholar]
  81. Skompski, S. Szczegółowa Mapa Geologiczna Polski 1:50,000, Arkusz Puck (6); Państwowy Instytut Geologiczny: Warszawa, Poland, 1997. [Google Scholar]
  82. Pikies, R.; Zaleszkiewicz, L. Szczegółowa Mapa Geologiczna Polski 1:50,000, Arkusz Rumia (15); Państwowy Instytut Geologiczny: Warszawa, Poland, 2003. [Google Scholar]
  83. Global Weather Data. Available online: https://swat.tamu.edu/data/cfsr/ (accessed on 10 March 2025).
  84. Zawadzki, S. Gleboznawstwo; Państwowe Wydawnictwo Rolnicze i Leśne: Warszawa, Poland, 1999. [Google Scholar]
  85. Wielgat, P.; Kalinowska, D.; Szymkiewicz, A.; Zima, P.; Jaworska-Szulc, B.; Wojciechowska, E.; Nawrot, N.; Matej-Łukowicz, K.; Dzierzbicka-Głowacka, L. Towards a multi-basin SWAT model for the migration of nutrients and pesticides to Puck Bay (Southern Baltic Sea). PeerJ 2021, 9, e10938. [Google Scholar] [CrossRef] [Scilit] [PubMed]
  86. Duda, R.; Winid, B.; Zdechlik, R.; Stępień, M. Metodyka Wyboru Optymalnej Metody Wyznaczania Zasięgu Stref Ochronnych Ujęć Zwykłych Wód Podziemnych z Uwzględnieniem Warunków Hydrogeologicznych Obszaru RZGW w Krakowie; Akademia Górniczo-Hutnicza: Kraków, Poland, 2013. [Google Scholar]
  87. Jaworska-Szulc, B. Formowanie Się Zasobów Wód Podziemnych w Młodoglacjalnym, Wielopoziomowym Systemie Wodonośnym Na Przykładzie Pojezierza Kaszubskiego. Ph.D. Thesis, Politechnika Gdańska, Gdańsk, Poland, 2015. [Google Scholar]
  88. Czyżyk, F.; Steinhoff-Wrześniewska, A. Zróżnicowanie ewapotranspiracji niektórych gatunków roślin uprawnych w warunkach różnego nawożenia. Woda-Śr.-Obsz. Wiej. 2017, 17, 25–36. [Google Scholar]
  89. Orzeł, S.; Socha, J.; Forgiel, M.; Ochał, W. Biomasa i roczna produkcja drzewostanów mieszanych puszczy niepołomickiej. Acta Sci. Pol. Silv. Calendar. Ratio Ind. Lignar. 2005, 4, 63–79. [Google Scholar]
  90. Arnold, J.G.; Kiniry, J.R.; Srinivasan, R.; Williams, J.R.; Haney, E.B.; Neitsch, S.L. SWAT 2012 Input/Output Documentation; Texas Water Resources Institute: College Station, TX, USA, 2013. [Google Scholar]
  91. Nair, S.S.; King, K.W.; Witter, J.D.; Sohngen, B.L.; Fausey, N.R. Importance of crop yield in calibrating watershed water quality simulation tools. J. Am. Water Resour. Assoc. 2011, 47, 1285–1297. [Google Scholar] [CrossRef] [Scilit]
  92. Rafiei Emam, A.; Kappas, M.; Akhavan, S.; Hosseini, S.Z.; Abbaspour, K.C. Estimation of groundwater recharge and its relation to land degradation: Case study of a semi-arid river basin in Iran. Environ. Earth Sci. 2015, 74, 6791–6803. [Google Scholar] [CrossRef] [Scilit]
  93. Rafiei Emam, A.; Kappas, M.; Linh, N.H.K.; Renchin, T. Hydrological Modeling and Runoff Mitigation in an Ungauged Basin of Central Vietnam Using SWAT Model. Hydrology 2017, 4, 16. [Google Scholar] [CrossRef] [Scilit]
  94. Sinnathamby, S.; Douglas-Mankin, K.; Craige, C. Field-scale calibration of crop-yield parameters in the Soil and Water Assessment Tool (SWAT). Agric. Water Manag. 2017, 180, 61–69. [Google Scholar] [CrossRef] [Scilit]
  95. Merriman, K.R.; Russell, A.M.; Rachol, C.M.; Daggupati, P.; Srinivasan, R.; Hayhurst, B.; Stuntebeck, T.D. Calibration of a Field-Scale Soil and Water Assessment Tool (SWAT) Model with Field Placement of Best Management Practices in Alger Creek, Michigan. Sustainability 2018, 10, 851. [Google Scholar] [CrossRef] [Scilit]
  96. Mengistu, A.G.; van Rensburg, L.D.; Woyessa, Y.E. Techniques for calibration and validation of SWAT model in data scarce arid and semi-arid catchments in South Africa. J. Hydrol. Reg. Stud. 2019, 25, 100621. [Google Scholar] [CrossRef] [Scilit]
  97. Bogdanowicz, R.; Cysewski, A. Przestrzenna i czasowa zmienność transportu zanieczyszczeń w wybranych ciekach Nadmorskiego Parku Krajobrazowego. In Wody na Obszarach Chronionych; Pociask-Karteczka, J., Partyka, J., Eds.; Instytut Geografii i Gospodarki Przestrzennej UJ: Kraków, Poland, 2008; pp. 91–100. [Google Scholar]
  98. Jadczyszyn, T.; Kowalczyk, J.; Lipiński, W. Zalecenia Nawozowe Dla Roślin Uprawy Polowej i Trwałych Użytków Zielonych; Materiały szkoleniowe 95; IUNG-PIB: Puławy, Poland, 2010. [Google Scholar]
  99. Olesen, J.E.; Børgesen, C.D.; Hashemi, F.; Jabloun, M.; Bar-Michalczyk, D.; Wachniew, P.; Zurek, A.J.; Bartosova, A.; Bosshard, T.; Hansen, A.L.; et al. Nitrate leaching losses from two Baltic Sea catchments under scenarios of changes in land use, land management and climate. AMBIO 2019, 48, 1252–1263. [Google Scholar] [CrossRef] [Scilit]
  100. Chmura, K.; Chylińska, E.; Dmowski, Z.; Nowak, L. Rola czynnika wodnego w kształtowaniu plonu wybranych roślin polowych. Infrastrukt. i Ekol. Teren. Wiej. 2009, 9, 33–44. [Google Scholar]
  101. Kuś, J. Gospodarowanie wodą w rolnictwie. Stud. i Rap. IUNG-PIB 2016, 47, 83–104. [Google Scholar]
  102. Jadczyszyn, T. Bilans podstawą zrównoważonego zarządzania składnikami pokarmowymi. In Dobre Praktyki Rolnicze w Nawożeniu Użytków Rolnych; Igras, J., Ed.; Centrum Doradztwa Rolniczego w Brwinowie: Brwinów, Poland, 2013; pp. 6–14. [Google Scholar]
  103. Kocoń, A. Potrzeby pokarmowe roślin. Stud. I Rap. IUNG-PIB 2014, 37, 19–31. [Google Scholar]
  104. Busari, M.A.; Kukal, S.S.; Kaur, A.; Bhatt, R.; Dulazi, A.A. Conservation tillage impacts on soil, crop and the environment. Int. Soil Water Conserv. Res. 2015, 3, 119–129. [Google Scholar] [CrossRef] [Scilit]
  105. Gaines, T.P.; Gaines, S.T. Soil texture effect on nitrate leaching in soil percolates. Commun. Soil Sci. Plant Anal. 1994, 25, 2561–2570. [Google Scholar] [CrossRef] [Scilit]
  106. Li, J.; Hu, W.; Chau, H.W.; Beare, M.; Cichota, R.; Teixeira, E.; Moore, T.; Di, H.; Cameron, K.; Guo, J.; et al. Response of nitrate leaching to no-tillage is dependent on soil, climate, and management factors: A global meta-analysis. Glob. Change Biol. 2023, 29, 2172–2187. [Google Scholar] [CrossRef] [Scilit]
  107. Świętochowski, B.; Jabłoński, B.; Radomska, M.; Krężel, R. Ogólna Uprawa Roli i Roślin, 4th ed.; Państwowe Wydawnictwo Rolnicze i Leśne: Warszawa, Poland, 1996. [Google Scholar]
  108. DATASET Project. Available online: www.datasetw4all.info (accessed on 10 March 2025).
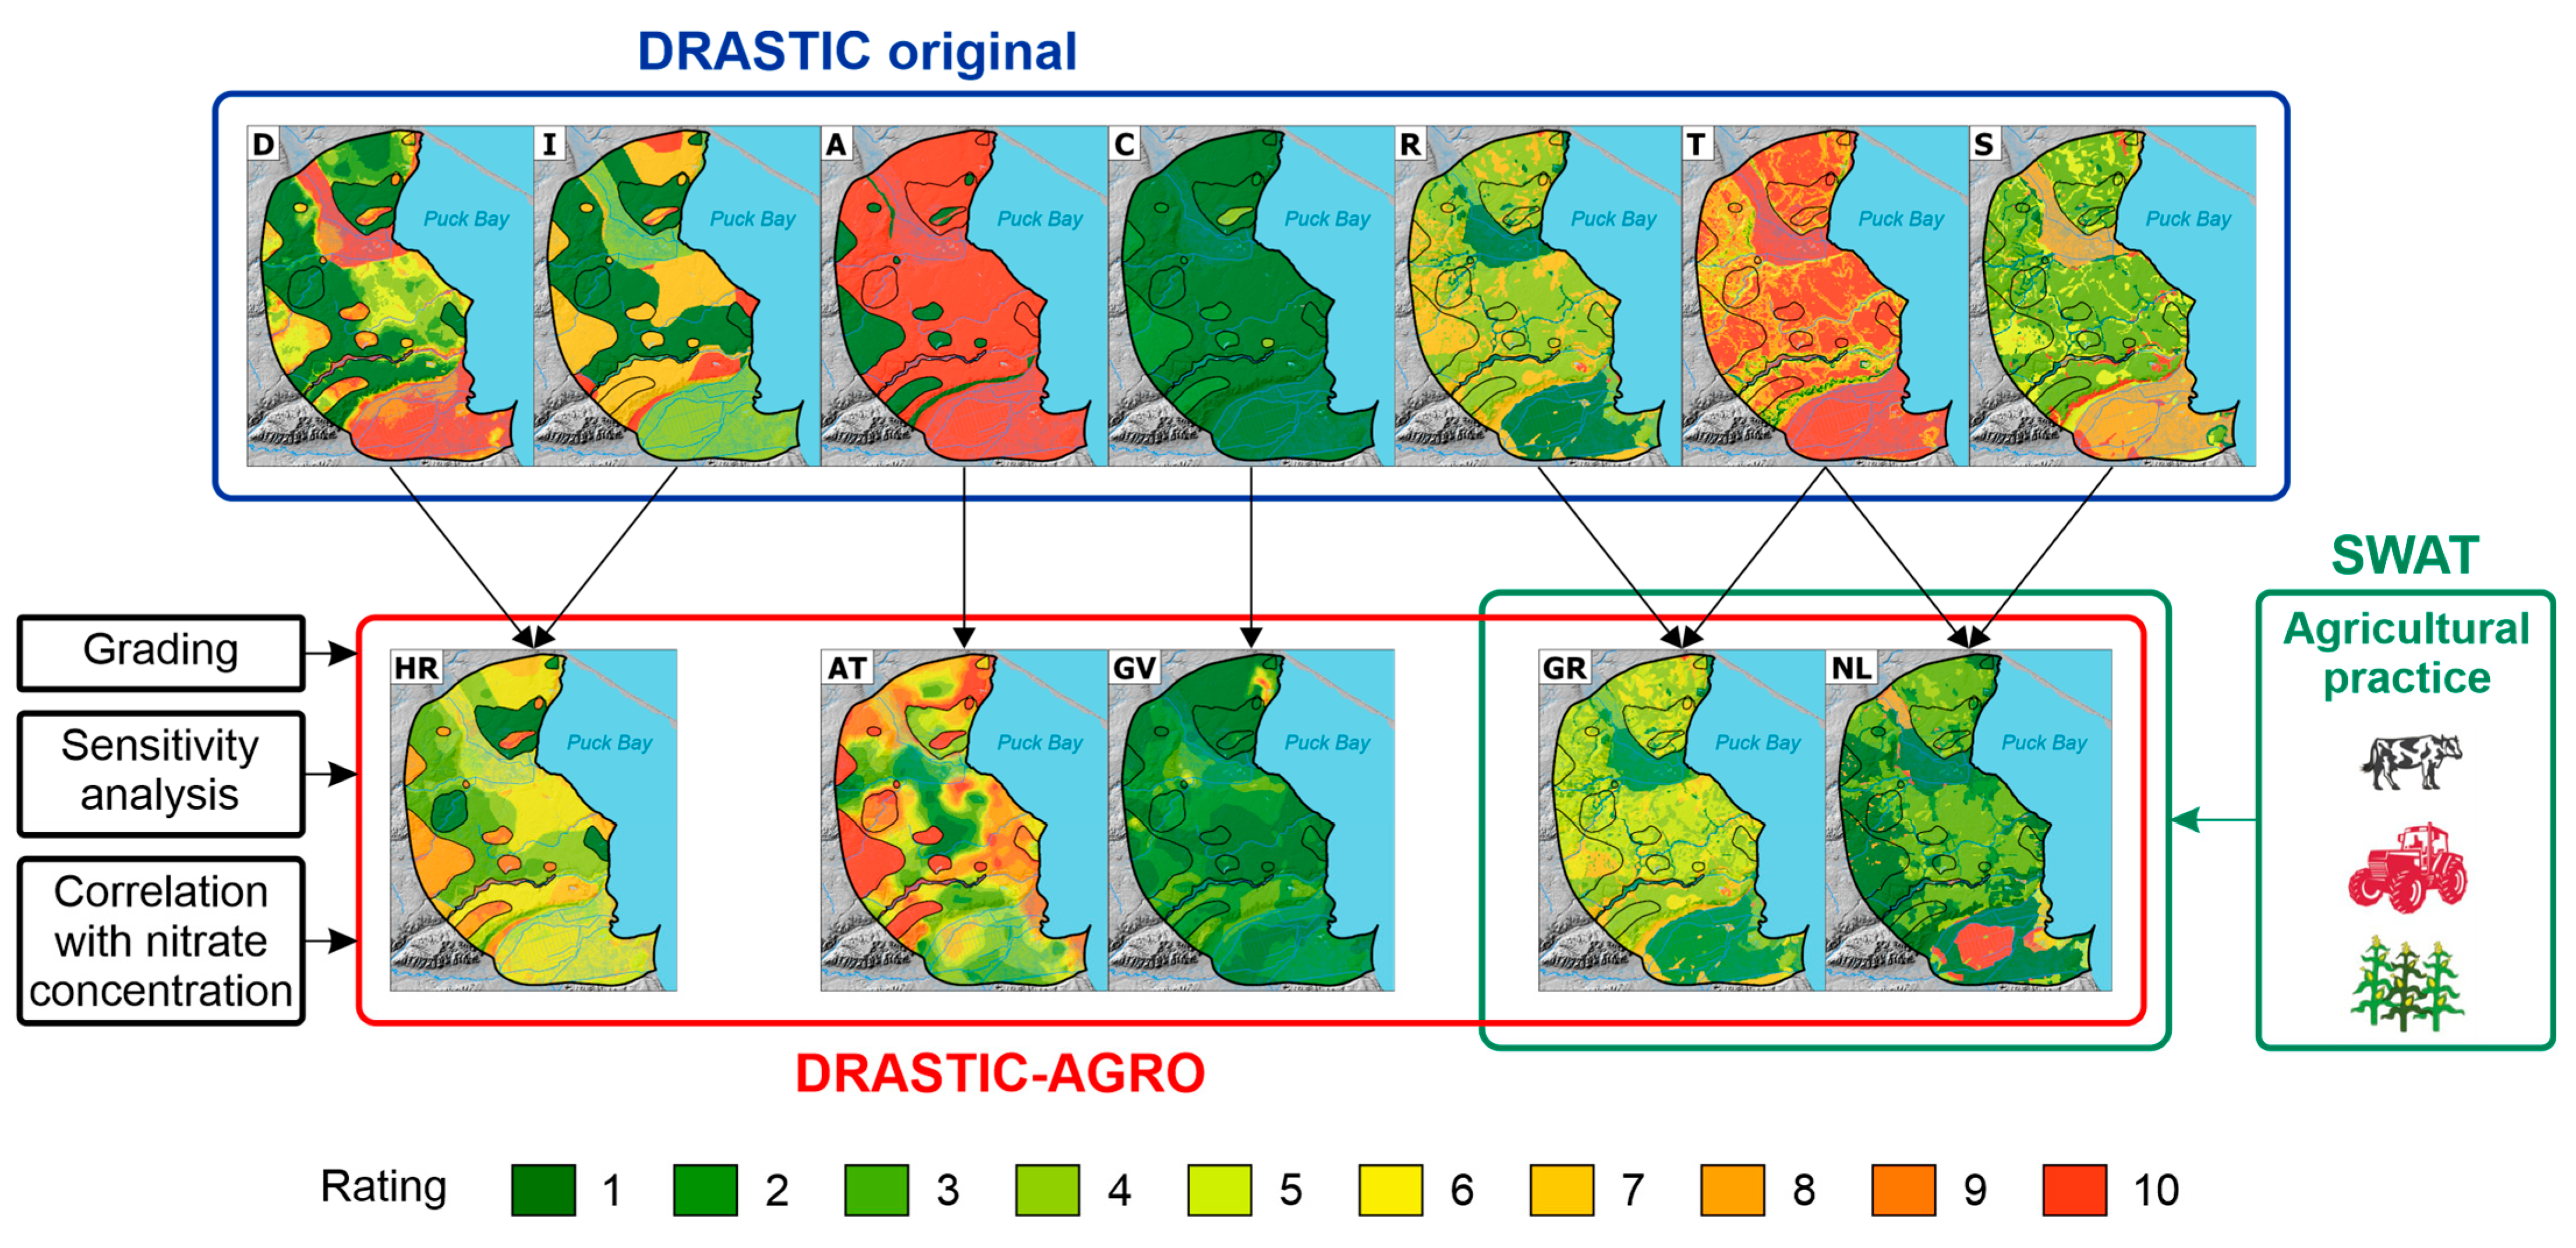
Figure 2. Scheme of the methodology used to modify the original DRASTIC method and to generate maps of specific parameters related to groundwater vulnerability. Explanation of abbreviations: D—depth to water table, R—net recharge, A—aquifer media, S—soil type, T—topography, I—impact of the vadose zone, C—hydraulic conductivity of the aquifer, HR—hydraulic resistance of the vadose zone layers, AT—aquifer thickness, GV—groundwater velocity, GR—groundwater recharge, and NL—N-NO3 load leaching from the soil profile.
Sustainability 18 00729 g002
Figure 3. Comparison of values of groundwater recharge and N-NO3 load leaching from soil for the scenarios of agricultural practice considered.
Sustainability 18 00729 g003
Figure 4. Comparison of groundwater vulnerability maps of original DRASTIC and DRASTIC–AGRO methods and distribution of nitrate concentration.
Sustainability 18 00729 g004
Figure 5. Correlation of nitrate concentration with vulnerability index in methods: (a) original DRASTIC; (b) DRASTIC-AGRO.
Sustainability 18 00729 g005
Figure 6. Distribution of vulnerability classes in the research area for the scenarios considered. Scenarios W0 and S1–S12 are defined in Table 6.
Sustainability 18 00729 g006
Figure 7. Comparison of groundwater vulnerability maps to nitrate contamination determined using the DRASTIC-AGRO method for different agricultural practice scenarios. Scenarios S1–S12 are defined in Table 6.
Sustainability 18 00729 g007
Table 1. Parameters used for DRASTIC and DRASTIC-AGRO.
DRASTICDRASTIC-AGROSource
Depth to groundwater table (D)Hydraulic resistance
of the vadose zone (HR)
Borehole profiles
Hydrogeological maps
Impact of the vadose zone (I)
Groundwater recharge (R)Groundwater recharge (GR)SWAT model output
Topography (T)
Topography (T)N-NO3 load leaching from
the unsaturated zone (NL)
Soil (S)
Aquifer media (A)Aquifer thickness (AT)Borehole profiles
Hydraulic conductivity (C)Groundwater velocity (GV)MODFLOW model output
Table 2. Calculated weight and selected grading method for DRASTIC-AGRO parameters and the correlation factor of each grading method.
ParameterGrading MethodCorrelation RankWeight
HRequal0.5086.00
GRequal0.0130.15
NLequal0.0931.10
ATgeometric0.1982.34
GVequal0.0350.41
Table 3. Ranges and ratings of original DRASTIC and DRASTIC-AGRO parameters in relation to research area characteristics.
DRASTICRatingDepth to
groundwater
(m)
Groundwater
recharge
(mm/year)
Aquifer
media
SoilTopography
(%)
Impact of
the vadose zone
Hydraulic
conductivity
(m/d)
100.0–1.5 Karst limestoneThin or absent/Gravel0–2Karst limestone>81.60
91.5–4.5>250BasaltSand2–6Basalt
8 180–250Sand and gravelPeat Sand and gravel40.80–81.60
74.5–9.0 Shrinking/Aggregated clay
6 100–180Massive limestone/SandstoneSandy loam Limestone/Sandstone/Sand and
gravel with significant silt and clay
28.56–40.80
59.0–15.0 Glacial tillLoam6–12
4 Weathered metamorphic/
Igneous
Silty loam Metamorphic/Igneous12.24–28.56
315.0–22.050–100Metamorphic/IgneousClay loam12–18Silt/Clay/Shale
222.0–30.0 Massive shaleMuck 4.08–12.24
1>30.00–50No shrinking/Aggregated clay>18Confining layer0.04–4.08
DRASTIC-AGRORatingHydraulic resistance
of the vadose zone layers (HR)
(log HR)
Groundwater
recharge
(mm/year)
N-NO3 load leaching from the unsaturated zone
(kg/ha/year)
Aquifer
thickness
(m)
Groundwater
velocity
(m/d)
10<−1.1>210.3>92.3<9.8>1.15
9−1.1–−0.2187.0–210.382.1–92.39.8–16.91.03–1.15
8−0.2–0.7163.6–187.071.8–82.116.9–22.20.91–1.03
70.7–1.7140.2–163.661.6–71.822.2–26.20.79–0.91
61.7–2.6116.9–140.251.3–61.626.2–29.10.65–0.79
52.6–3.593.5–116.941.0–51.329.1–32.00.53–0.65
43.5–4.570.1–93.530.8–41.032.0–35.90.41–0.53
34.5–5.446.7–70.120.5–30.835.9–41.20.29–0.41
25.4–6.323.4–46.710.3–20.541.2–48.40.14–0.29
1>6.3<23.4<10.3>48.4<0.14
Table 4. Input data used for SWAT model construction.
Data CategoryDataData Source
Thematic mapsDigital Elevation Model (DEM)GUGiK 1
Land useGIOŚ 2
Soil coverPIG-PIB 3
Weather dataDaily precipitationCFSR 4
IMGW-PIB 5
Daily max and min temperature
Mean daily relative humidity
Daily solar radiation sum
Mean daily wind speed
Agricultural practicesFarmer surveysWaterPUCK 6
1 GUGiK—data obtained from the resources of the Head Office of Geodesy and Cartography [78]. 2 GIOŚ—corine land cover data for 2018 (CLC2018), obtained from the resources of the Chief Inspectorate for Environmental Protection [79]. 3 PIG-PIB—data obtained from the Central Geological Database of the Polish Geological Institute-National Research Institute, compiled from selected sheets of the Detailed Geological Map of Poland (SMGP) at a scale of 1:50,000 [80,81,82]. 4 CFSR—meteorological data (temperature, humidity, solar radiation, and wind speed) obtained from the Climate Forecast System Reanalysis [83]. 5 IMGW-PIB—precipitation data from meteorological station for the years 1998–2010, obtained from the Institute of Meteorology and Water Management-National Research Institute. 6 WaterPUCK—data on agricultural practices derived from surveys conducted among local farmers [55].
Table 5. Comparison of calibrated SWAT model outputs with the reference values.
Output TypeUnitModel ValuesReference Values
CalibrationGroundwater rechargemm/y24–236 1
76 2
19–186 [86,87]
Evapotranspiration (incl. REVAP)mm/y453 2450–495 [88]
Forest biomass productiont/ha/y6–20 14.2–12.1 [89]
ValidationTotal runoffmm/y179 247–268 [97]
Yield: Winter wheatt/ha/y6.0–8.5 15.5 [55]
Yield: Canolat/ha/y2.9–3.1 13.4 [55]
Yield: Silage cornt/ha/y9.8–9.9 113.5 [55]
Yield: Hayt/ha/y2.2–9.2 14.0–10.0 [98]
1 Variability range depending on 564 hydrological response units (HRU). 2 Average for the whole model area.
Table 6. Considered agricultural management scenarios.
Scenario CategoryScenario No.Description
BaselineW0current land use and agricultural management
Crop typeS1winter wheat
S2silage corn
S3canola
S4mixture of spring cereals (represented by barley)
S5potatoes
S6peas (Pisum)
Fertilizer
management
S7two-fold dose reduction
S8doubling the dose
TillageS9minimum depth (reduced by half)
S10maximum depth (increased two-fold)
GrazingS111 cow/ha
S125 cows/ha
Table 7. Statistics of groundwater nitrate concentration by vulnerability class.
Groundwater Vulnerability ClassNO3 Concentration in Groundwater
MINMAXxδM
Very Low0.53.00.90.70.5
Low0.519.04.25.81.4
Medium0.520.07.58.92.0
High4.034.012.39.29.8
Very High5.049.028.017.729.5
MIN—minimum; MAX—maximum; x—arithmetic mean; δ—standard deviation; M—median.
Table 8. Statistics of the single-parameter sensitivity analysis.
DRASTIC-AGRO ParameterEffective Weight (%)
MINMAXxδ
HR14.7989.6361.3014.42
GR0.215.861.390.74
NL1.2840.646.224.87
AT4.6473.729.5913.01
GV0.448.751.510.79
Disclaimer/Publisher’s Note: The statements, opinions and data contained in all publications are solely those of the individual author(s) and contributor(s) and not of MDPI and/or the editor(s). MDPI and/or the editor(s) disclaim responsibility for any injury to people or property resulting from any ideas, methods, instructions or products referred to in the content.