1. Introduction
The COVID-19 pandemic was one of the most disruptive global events of the twenty-first century. Beyond its public-health crisis, it also changed how people, firms, and governments interacted with the financial system. As lockdowns and social-distancing measures limited access to physical branches, millions turned to digital options for payments, savings, and money transfers. Around the world, this shift marked what many researchers describe as a “digital tipping point”—a period when necessity pushed financial behaviour toward technology-based solutions [
1,
2].
Countries that had already invested in digital infrastructure and regulation were the ones best prepared for this transition. Global studies show that digital finance helped economies absorb the shock of the pandemic by sustaining consumption and enabling remote transactions [
3]. In many developing regions, mobile-payment systems and e-wallets expanded the use of digital financial services and access to essential transactions, improving financial resilience for people who had previously been excluded from formal finance [
4,
5].
Saudi Arabia provides a particularly interesting case. Unlike many emerging economies where digital adoption accelerated from relatively low initial levels, Saudi Arabia entered the pandemic with an already advanced and rapidly expanding digital payment ecosystem.
Long before COVID-19, the Kingdom had placed digital transformation at the heart of its Vision 2030 strategy. Through the Financial Sector Development Program (FSDP), the Saudi Central Bank (SAMA) promoted contactless and mobile payments, launched a regulatory sandbox for fintech firms, and expanded the national payment network mada. The FSDP also set a clear goal to increase the share of non-cash transactions to 70 percent by 2025. These efforts meant that when the pandemic began, Saudi Arabia already had the infrastructure and regulatory framework needed to support a rapid move toward digital payment adoption.
This makes Saudi Arabia analytically important, as it allows us to examine whether a large external shock such as COVID-19 changes the trajectory of digital payment usage even in a system that is already digitally prepared, rather than simply initiating adoption from a low base.
During March–April 2020, Saudi Arabia implemented nationwide restrictions, including temporary closure of non-essential retail outlets, suspension of in-person services, curfews, and mobility limitations across most regions of the Kingdom. These measures coincided with increases in contactless payment limits and accelerated merchant onboarding under the national mada payment network, which links banks and POS terminals across the country. Together, these developments created conditions that encouraged a rapid shift toward electronic payment channels.
Evidence from across the Gulf Cooperation Council (GCC) shows a similar pattern. Studies report that digital payment use and fintech innovation rose sharply during 2020–2021, especially in Saudi Arabia [
6]. Rather than initiating digital change, the pandemic appears to have accelerated pre-existing trends in digital payment usage. Bi et al. [
7], for instance, find that pre-existing investments in broadband networks and interoperable digital ID systems helped Gulf economies maintain strong digital transaction growth even after restrictions were lifted.
While it is widely recognized that digital payment usage increased during the pandemic, the existing literature provides limited evidence on how this change occurred—specifically, whether the pandemic led to a sustained acceleration in growth or a one-time structural shift in usage levels. This distinction is important for understanding the long-term implications of digital transformation and whether pandemic-driven changes represent temporary adjustments or permanent shifts in behavior.
Despite this progress, the literature still lacks high-frequency evidence that captures how the pandemic changed digital payment usage dynamics in real time. Much of the existing work relies on annual indicators such as the Global Findex, which cannot detect short-term or structural shifts [
8]. Moreover, few empirical studies focus directly on Saudi Arabia, even though its combination of regulatory innovation and rapid technological adoption offers a unique case study for understanding digital transitions.
To address this gap, this study uses monthly data from January 2019 to July 2025 and applies an Interrupted Time Series (ITS) framework to examine whether the COVID-19 period coincided with a temporary disruption or a more persistent shift in digital payment intensity (DPI), defined as the aggregate share of electronic point-of-sale (POS) transaction value relative to total POS-related transactions (electronic plus cash withdrawals). Importantly, DPI captures usage intensity rather than broader financial inclusion or access to financial services, allowing the analysis to focus on changes in behavior among existing users rather than access expansion. The ITS approach allows estimation of both the immediate level change at the onset of the pandemic and any subsequent change in trend over time [
9]. By combining high-frequency national data with a transparent empirical design, the paper contributes to the literature on how major crises can be associated with shifts in payment behavior, particularly in economies that had already invested in digital infrastructure, such as Saudi Arabia. In doing so, the study moves beyond the commonly accepted view that digital adoption simply increased during COVID-19 and instead provides evidence on the nature of that change—whether it reflects a structural break in levels or a shift in long-term growth dynamics.
This study hypothesizes that in digitally prepared economies, crisis-driven shocks such as COVID-19 lead to a discrete upward shift in digital payment usage rather than a sustained acceleration in its growth trajectory.
The rest of the paper is structured as follows.
Section 2 reviews the related literature.
Section 3 describes the data and econometric methodology.
Section 4 presents the empirical results, which are discussed in
Section 5.
Section 6 concludes the paper with key policy implications.
2. Literature Review
Over the past decade, the concept of financial inclusion has expanded beyond basic access to banking toward active participation in digital financial ecosystems. In the digital age, inclusion depends not only on the availability of bank accounts but also on how individuals and firms use digital payment instruments such as mobile banking, e-wallets, and online payment platforms. The COVID-19 pandemic accelerated this transformation, highlighting the role of digital technologies in sustaining economic activity during periods of severe disruption [
1,
2]. Evidence from Europe is mixed. While Kotkowski & Polasik [
10] document a widening gap between cash and cashless users during the pandemic, other studies suggest that cash usage partially rebounded once mobility restrictions eased [
11].
Beyond access, digital financial inclusion reflects the extent to which individuals and firms actively engage with digital financial services in their daily economic activities. In this broader sense, inclusion is multidimensional, encompassing access to formal payment instruments, the availability of digital infrastructure, and the intensity of digital transaction activity. Recent research emphasizes that inclusion in the digital era depends not only on account or card ownership, but also on the ability to transact electronically, substitute away from cash, and participate in digitally mediated markets [
3,
12].
In contrast to this broad conceptualization, the empirical measure used in this study captures a narrower construct—aggregate Digital Payment Intensity (DPI) at physical POS locations. DPI reflects substitution between electronic and cash payments at the point of sale and should therefore be interpreted as a usage-based, sector-specific indicator rather than a comprehensive measure of digital financial inclusion.
Importantly, this distinction is central to the empirical strategy of the study, as it allows the analysis to focus on behavioral changes in payment usage intensity rather than changes in access or account ownership. This aligns with recent literature emphasizing that digital finance increasingly operates as a complement to existing economic participation rather than a primary entry point into the financial system.
From a digital transformation perspective, such shifts can be understood through the lens of dynamic capabilities—the capacity of institutions, firms, and users to reconfigure routines and adopt new technologies in response to external shocks. Economies with strong regulatory coordination, interoperable payment systems, and prior investments in fintech infrastructure are therefore better positioned to translate crises into lasting behavioral and usage-based change [
13]. In this sense, COVID-19 acted less as an origin of digital inclusion than as a catalyst that accelerated pre-existing digital trajectories.
Recent work in the digital transformation literature further emphasizes the role of dynamic capabilities in shaping rapid behavioral and institutional change during periods of disruption. Saeedikiya et al. [
14] and Saeedikiya et al. [
15], for example, argue that digital transformation depends not only on technology adoption but also on the ability of organizations and systems to sense shocks, reconfigure routines, and redeploy digital resources in response to external pressures. This perspective reinforces the view that economies with pre-existing digital infrastructure and regulatory readiness—such as Saudi Arabia—were better positioned to translate the COVID-19 shock into sustained changes in digital financial behavior.
Several studies report that digital financial services are vital drivers of inclusion because they lower transaction costs and extend effective financial participation to underserved groups. For instance, Sahay et al. [
12] developed a global index of digital financial inclusion and showed that countries with strong digital infrastructure and regulatory support experienced faster and more inclusive growth. Similarly, Zins & Weill [
16] found that access to mobile money, cards, and point-of-sale networks significantly increased the likelihood of using formal financial services in African economies. These findings underscore the importance of technology-enabled financial tools as mechanisms for economic empowerment. From a policy perspective, COVID-19 also highlighted the role of fintech innovation, digital infrastructure, and consumer trust as key enablers of post-pandemic financial inclusion, particularly in developing and emerging economies [
17].
The COVID-19 pandemic magnified this connection between digital finance and inclusion. Cull et al. [
3] documented a rapid expansion in digital payment adoption worldwide, enabling millions of households to maintain access to essential services during lockdowns. Using Global Findex microdata across more than 120 countries, Niankara & Traoret [
18] further showed that formal financial inclusion significantly increased the likelihood of using digital payments during the pandemic, although adoption patterns differed across income, gender, and institutional contexts. In Latin America and the Caribbean, Kazemikhasragh & Pineda [
5] found that digital payments improved the financial resilience of low-income groups, while Cui et al. [
4] linked inclusive finance to broader sustainable development objectives such as renewable energy use. These studies suggest that digital payments are not just convenient tools but key infrastructure for economic continuity during crises.
A growing body of research emphasizes that the pandemic accelerated ongoing trends in digital transformation rather than creating them [
13]. This perspective is supported by recent integrative reviews that position digital payments as a mediating pathway through which pandemic shocks translate into financial inclusion outcomes under specific structural conditions [
19].
Fu & Mishra [
2] characterized COVID-19 as a “digital tipping point,” observing a sharp rise in fintech and mobile-payment app usage worldwide. Dluhopolskyi et al. [
20] showed that digital inclusion improved significantly during 2021, but the magnitude of progress varied across countries depending on their digital readiness and policy environment. Young & Young [
21] found that fintech expansion enhanced financial inclusion among low-income households, while Ha & Nguyen [
22] found that financial literacy amplified fintech’s benefits for youth inclusion. Siddika et al. [
23] further highlighted that behavioral changes induced by the pandemic—such as preferences for convenience and safety—led to persistent increase in digital financial usage even after restrictions were lifted.
The GCC region provides a distinctive case where digital transformation had already been embedded in national development strategies before the pandemic. Bi et al. [
7] noted that pre-existing investments in broadband infrastructure, digital identification, and payment interoperability positioned Gulf countries to sustain economic activity through digital channels during the crisis. Saudi Arabia stands out as a regional leader in this transition. Guided by Vision 2030’s Financial Sector Development Program, the Saudi Central Bank (SAMA) implemented regulatory sandboxes, expanded the mada payment network, and promoted contactless payment systems with a goal of achieving 70 percent non-cash transactions by 2025.
When COVID-19 hit, this groundwork enabled Saudi Arabia to shift rapidly toward a more cashless payment ecosystem. The Saudi Central Bank [
24] reported that the share of non-cash retail payments rose sharply during 2021, with non-cash transactions reaching 62 percent of all retail payments by volume. At the global and regional level, the Bank for International Settlements [
25] reported a similar acceleration in digital and contactless payments during the pandemic, particularly in regions with strong pre-existing digital infrastructures and supportive regulation. In the MENA region, Naz et al. [
26] found that COVID-19 stimulated fintech development and digital-finance adoption, reinforcing resilience and expanding financial access across the region. Together, this evidence supports viewing Saudi Arabia’s digital response not as an exception, but as a leading regional case where prior investment in payments infrastructure translated into a rapid and sustained increase in digital transaction activity during the crisis.
At the micro level, Shishah & Alhelaly [
27] observed that Saudi consumers embraced contactless payment primarily due to convenience and perceived health safety, turning digital transactions into a daily norm. Recent empirical evidence shows that Saudi SMEs increased their intention to adopt mobile commerce during the COVID-19 pandemic, with firms recognizing perceived benefits and environmental uncertainty as key drivers of m-commerce adoption in business operations [
28]. In the United Arab Emirates, Ghandour et al. [
29] identified consumer trust and clear government communication as crucial for sustaining the use of mobile payments beyond the crisis period. These findings confirm that the pandemic accelerated—not initiated—the region’s transition to digital financial ecosystems.
In addition to these broad drivers, the empirical literature also highlights the importance of specific determinants of digital payment usage that are directly related to the variables used in this study. The expansion of POS terminals is consistently identified as a key enabler of digital transactions by reducing frictions at the point of sale and increasing merchant acceptance. Conversely, cash access infrastructure—proxied by ATM usage—remains closely associated with continued reliance on cash-based transactions and can slow the transition toward digital payments. Macroeconomic conditions also play a role: inflation and income uncertainty may reduce transaction frequency and affect households’ willingness to engage in digital financial activity, particularly among lower-income groups. These factors provide a theoretical and empirical basis for the inclusion of POS infrastructure, ATM usage, and inflation as key explanatory variables in the analysis.
While global and regional studies provide important insights, most of them rely on cross-sectional or survey data, which do not capture month-to-month structural changes in digital payment behavior. Bernal et al. [
9] developed the ITS framework as an effective approach to quantify both immediate and long-term effects of major shocks or interventions. Despite its advantages, ITS analysis has rarely been applied to digital finance in the Middle East, leaving a gap in understanding how COVID-19 reshaped the temporal dynamics of DPI at the POS level.
In summary, the literature confirms that digital finance plays a central role in expanding inclusion and that the COVID-19 period coincided with an intensification of this process globally. For Saudi Arabia, the crisis period aligned with an already advanced digitalization agenda supported by Vision 2030 reforms. Yet, high-frequency empirical evidence on how this transformation unfolded over time remains scarce. By applying an ITS framework to monthly data from 2019 to 2025, this study aims to capture both the immediate changes associated with the pandemic period and the longer-term trajectory of POS-level DPI, offering new insights into how major shocks can reshape the financial landscape of digitally prepared economies.
3. Data and Methodology
3.1. Data Description
The study uses monthly data for Saudi Arabia from January 2019 to July 2025, yielding 78 observations. The period covers both the pre-pandemic phase and the COVID-19 shock and recovery phase, enabling the analysis of changes in payment behavior over time. The dependent variable is the Digital Payment Intensity (DPI) index, constructed to measure aggregate digital payment usage at physical point-of-sale (POS) locations. DPI is defined as the ratio of electronic POS transaction value to total POS-related transactions, where the denominator consists of electronic POS transactions and cash withdrawals. The index captures the relative intensity of electronic payments compared to cash usage at physical retail terminals.
Aggregate POS transaction value includes all card-based transactions at physical terminals as reported by the Saudi Central Bank (SAMA). Non-contact (NFC) transactions represent a technological subset of electronic POS payments and are therefore already included within aggregate POS transaction values.
The DPI measure is operationalized in a usage-based and sector-specific manner. It reflects substitution between electronic and cash payments at physical POS locations and does not capture broader dimensions of digital financial inclusion such as online banking, account ownership, credit access, or e-commerce transactions. Throughout the analysis, DPI is interpreted as an indicator of aggregate POS digital payment intensity.
A limitation of the measure arises from the use of cash withdrawals as a proxy for cash transactions. Withdrawn cash may not be immediately spent and can be held for precautionary purposes. During periods of heightened uncertainty—particularly in early 2020—temporary increases in cash withdrawals may mechanically reduce the index even if digital payments subsequently rise. This feature is taken into account when interpreting short-run fluctuations in the early phase of the pandemic.
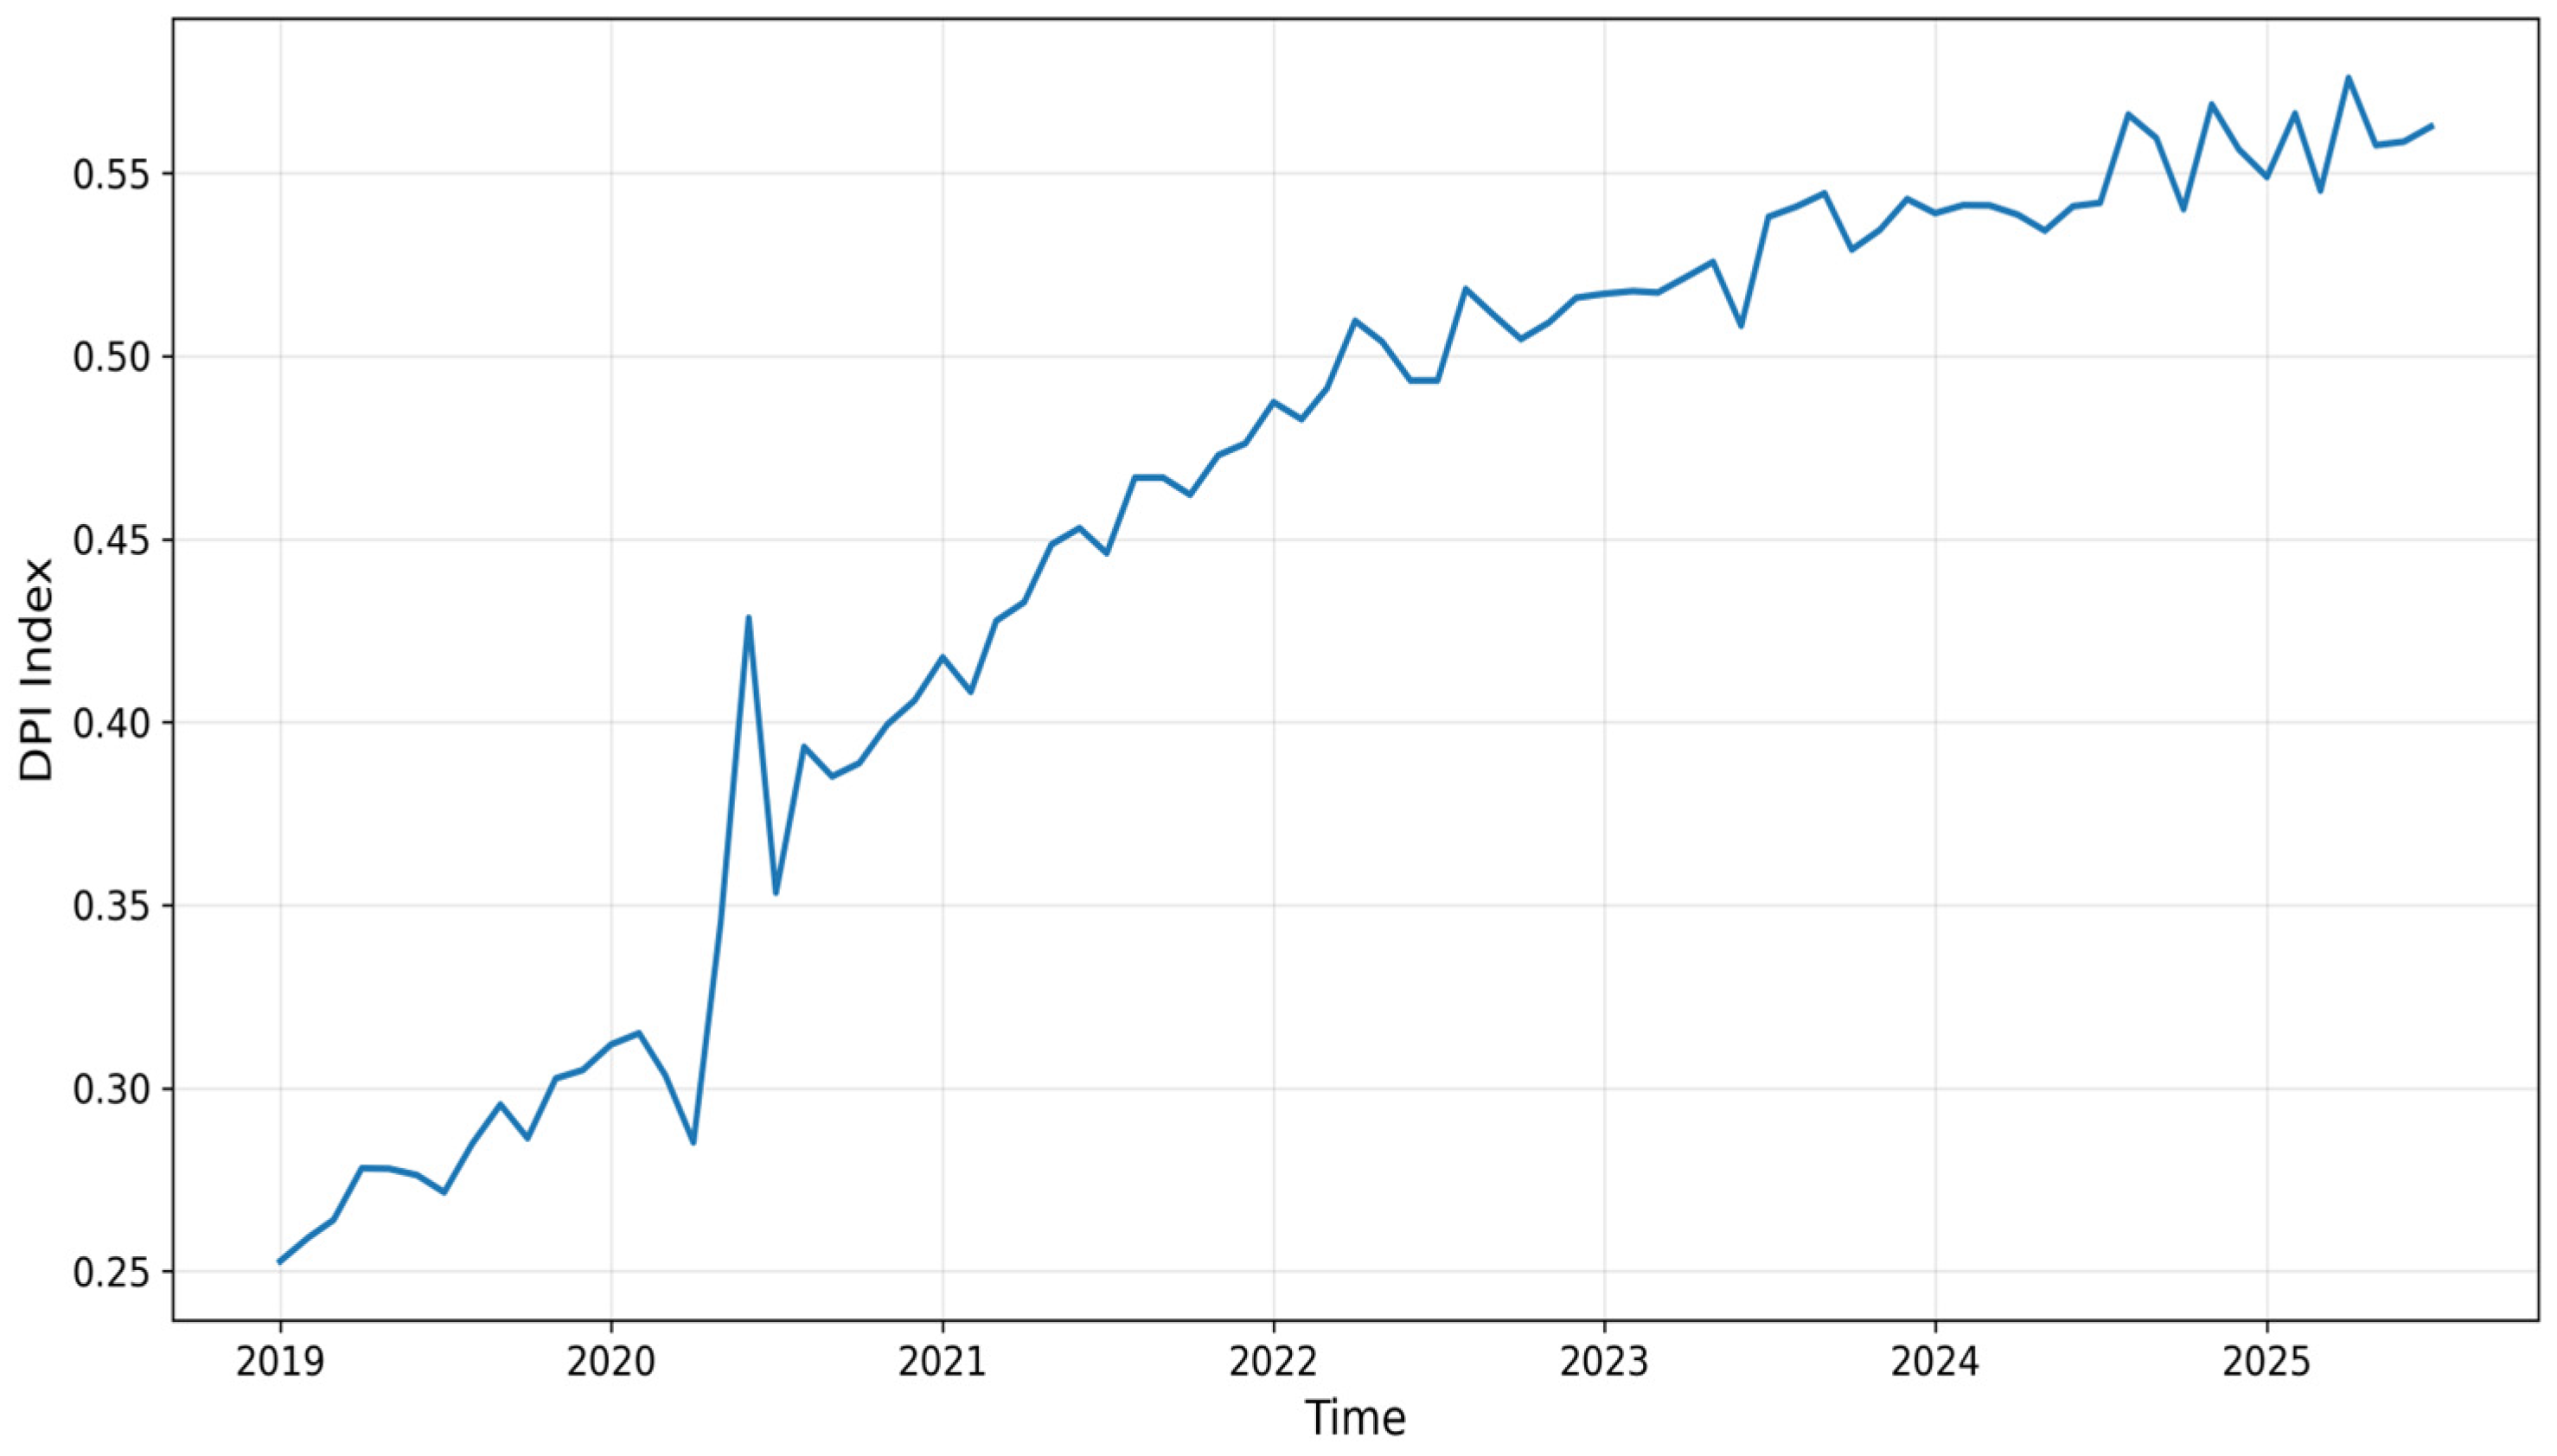
Table 1 reports descriptive statistics for the Digital Payment Intensity (DPI) Index before and after the onset of the COVID-19 pandemic. The mean DPI increased sharply from 0.28 in the pre-COVID period to 0.49 after March 2020, indicating a substantial upward shift in digital payment usage relative to cash. At the same time, the post-pandemic period exhibits greater dispersion, reflecting heterogeneity in digital engagement as usage intensified and stabilized at a higher level. These patterns provide preliminary descriptive evidence of a structural change in Saudi Arabia’s payment behavior around early 2020, which is examined more formally using the ITS framework.
Although the total number of observations (78 monthly data points) may appear limited from a cross-sectional perspective, this structure is fully consistent with best practices in Interrupted Time Series (ITS) analysis, where inference is based on temporal variation within a single unit rather than cross-sectional sample size. The dataset includes approximately 14 pre-intervention observations (January 2019–February 2020) and 64 post-intervention observations (March 2020–July 2025), providing sufficient temporal variation to identify both immediate level changes and post-intervention trend dynamics. Importantly, ITS designs rely on the number of time points and the stability of the pre-intervention trend rather than the number of cross-sectional units. The use of high-frequency monthly data further strengthens the analysis by allowing precise detection of short-term behavioral responses and structural shifts that would be obscured in lower-frequency datasets commonly used in the literature. In addition, multiple robustness checks—including alternative break dates, dynamic specifications, and parsimonious models—confirm the stability of the estimated effects.
The difference between pre- and post-pandemic mean values (0.284 vs. 0.491) reflects a clear structural shift in digital payment behavior, which is consistent with the type of regime change that the ITS framework is designed to identify. In this setting, such differences are expected and provide descriptive support for the presence of an intervention effect. Specifically, the model separates the pre-existing trend, the immediate level change at the onset of the pandemic, and any subsequent change in trend. The observed increase in the mean therefore corresponds to a discrete upward realignment in payment behavior, consistent with the estimated level effect. Importantly, this shift is explicitly modeled through the intervention dummy and post-intervention trend terms rather than being left as unexplained variation.
Figure 1 illustrates the monthly evolution of the DPI Index over the sample period. The figure shows a brief decline in early 2020 followed by a pronounced upward shift coinciding with the onset of the COVID-19 pandemic and associated containment measures. The temporary dip is consistent with short-run precautionary liquidity demand and elevated cash withdrawals during the initial uncertainty phase. After this adjustment, the index rises sharply and remains at a persistently higher level relative to the pre-pandemic trend. This visual evidence provides preliminary support for a structural break that is formally tested using the Interrupted Time Series (ITS) framework.
The empirical analysis includes six explanatory variables representing infrastructure and behavioral drivers of digital payment usage. These are: (i) NFC payment sales (in thousands), capturing the diffusion of contactless payment technology; (ii) e-commerce sales (in thousands), reflecting online transactional activity; (iii) cards issued, measured as the number of debit and credit cards in circulation; (iv) POS terminals, defined as the total number of installed terminals nationwide; (v) ATMs, measured as the number of active automated teller machines; and (vi) inflation, measured as the monthly percentage change in the Consumer Price Index.
Infrastructure variables such as POS terminals and ATMs are treated as determinants of payment usage rather than components of the DPI index. NFC and e-commerce variables capture changes in payment composition and channel dynamics within the broader transaction ecosystem.
These variables capture both infrastructure capacity and behavioral adoption within the payment ecosystem. The focus on usage-based indicators is supported by the literature. For example, Ocharive & Iworiso [
30] emphasize that digital payment services are a key driver of active financial usage and engagement, particularly in environments where access already exists. Moreover, including infrastructure variables such as POS terminals and ATMs is consistent with the “Access Opportunity Frontier” framework, which highlights the role of infrastructure and costs in shaping financial participation. Focusing on usage intensity also responds to the empirical gap identified by Shahen & Sharaf [
31], who show that much of the existing literature relies heavily on ownership or access indicators while under-emphasizing actual transaction behavior.
Data on all the variables is obtained from the Saudi Central Bank (SAMA). All variables are expressed in natural logarithmic form except inflation, which is a percentage.
3.2. Empirical Methods
An Interrupted Time Series (ITS) framework is used to examine whether the COVID-19 pandemic coincided with a temporary shock or a more lasting transformation in aggregate digital payment usage as captured by the DPI Index. This design estimates both the immediate level change following the onset of the pandemic and the change in the underlying trend afterwards. The ITS model is specified as in Equation (1):
where
denotes the digital payment intensity index at month
.
is a continuous variable representing the monthly trend from January 2019.
is a dummy variable equal to 0 before March 2020 and 1 thereafter, capturing the immediate impact of the pandemic.
equals 0 before March 2020 and counts the months after the outbreak, capturing the change in slope or trajectory.
is a vector of control variables (NFC, e-commerce sales, cards issued, POS terminals, ATMs, inflation).
is the error term.
The specification in Equation (1) allows the estimation of two key effects. The immediate change in digital payment usage coinciding with the onset of the pandemic period (level effect), measured by the coefficient , and the long-term change in trajectory following the shock (trend effect) measured by the coefficient . A statistically significant positive coefficient indicates an immediate increase in digital payment usage associated with pandemic-related restrictions, while a statistically significant positive coefficient would imply a sustained acceleration in usage growth beyond the pre-COVID trend.
Before estimating Equation (1), the time-series properties of all variables were examined using the Zivot–Andrews [
32] unit root test, which allows for one endogenous structural break in both the intercept and trend. This approach was preferred over the standard Augmented Dickey–Fuller (ADF) test because the latter assumes a stable data-generating process, whereas the pandemic likely induced a major structural shift around 2020.
The ITS model is estimated using Ordinary Least Squares (OLS) with Newey–West heteroskedasticity and autocorrelation-consistent (HAC) standard errors, allowing for up to 12 lags (one year) to correct for monthly autocorrelation. A Chow structural break test was also performed to statistically verify the existence of a break at the pandemic onset.
3.3. Robustness Checks
To ensure that the estimated COVID-19 effect is not sensitive to model specification, timing assumptions, or dynamic persistence, several complementary robustness checks were conducted by introducing three extensions that strengthen the validity of the baseline ITS model.
3.3.1. ITS Model with Seasonal Controls
The baseline ITS model in Equation (1) is extended by incorporating seasonal controls in the form of monthly dummies to capture recurring seasonal fluctuations in financial activity, such as those associated with Ramadan and summer travel. This extended ITS model with seasonal controls is presented in Equation (2).
3.3.2. Dynamic ITS Model
To capture inertia and persistence in digital payment usage, a dynamic ITS model is estimated by including a one-month lag of the dependent variable
as shown in Equation (3).
where
measures the degree of persistence in digital payment usage. A statistically significant positive coefficient indicates that the previous month’s digital payment usage level influences current payment usage intensity.
3.3.3. ITS Model with Alternative Break Date Specification
To test sensitivity to the assumed timing of the COVID shock, the interruption date was shifted one month forward to April 2020 instead of March 2020, to reflect the timing of full lockdowns and digital-policy implementation as shown in Equation (4).
where
and
capture the immediate and slope changes starting from April 2020.
3.3.4. Robustness to Alternative Model Specifications
To examine the stability of the baseline ITS estimates, additional specifications were estimated that vary the set of control variables included in the model.
First, alternative regressions were estimated excluding NFC transactions, excluding e-commerce transactions (ECOM), and excluding both variables simultaneously. These exercises allow assessment of whether the estimated COVID-period level shift depends on the inclusion of usage-oriented variables that may be closely related to aggregate POS activity.
Second, a parsimonious infrastructure-only specification was estimated. This model retains POS terminals, ATMs, inflation, and the full ITS time structure (time trend, COVID dummy, and post-intervention trend), while excluding usage-based controls. The purpose of this specification is to evaluate whether the identified structural break remains when the model is restricted to infrastructure and macroeconomic determinants of payment intensity.
These alternative specifications provide a systematic test of the robustness of the estimated COVID-period level effect to changes in model parsimony and control-variable composition.
4. Empirical Results
4.1. Results of the Stationarity and Structural Break Tests
Before estimating the ITS models, all variables are checked for unit roots using the Zivot–Andrews [
32] test, which allows for one endogenous structural break in both intercept and trend. This test is particularly suitable given the COVID-19 period may have coincided with a discrete behavioral shift in digital payment usage.
The results reported in
Table 2 show that, after accounting for possible structural breaks, most variables are stationary in levels, with break dates clustering between March and May 2020—corresponding to the onset of the pandemic and mobility restrictions. Specifically, DPI, NFC, and e-commerce transactions display statistically significant breaks during early 2020, indicating an abrupt change in digital payment usage rather than a smooth continuation of pre-existing trends. Other infrastructure variables such as POS terminals and cards issued exhibit later breaks, consistent with gradual post-pandemic infrastructure expansion rather than immediate behavioral change. Inflation and ATM usage show breaks around 2020 and 2021, reflecting macroeconomic adjustment and declining reliance on cash-based channels.
Overall, the ZA test results indicated that most series became stationary once a break is allowed—typically around March to May 2020—confirming that the pandemic coincided with a statistically identifiable regime shift in digital payment behavior. These findings support the use of an ITS framework with a 2020 interruption and suggest that the pandemic was associated with a discrete structural change rather than a gradual acceleration in digital payment usage trends.
4.2. Baseline ITS Regression Results
Table 3 reports the results of the baseline ITS regression without seasonal controls.
Results of the baseline ITS regression indicate that the COVID-19 period is associated with an immediate and statistically significant increase in DPI Index in Saudi Arabia. The estimated coefficient of the COVID dummy shows an 8.6% increase in the DPI index immediately after the pandemic’s onset. In contrast, the post-trend coefficient is small and statistically insignificant, suggesting that the pandemic period coincided with a one-time upward shift in digital payment usage rather than a persistent increase in the growth rate.
This result is consistent with the descriptive evidence reported in
Table 1, where a clear difference between pre- and post-pandemic mean values is observed. Importantly, within the ITS framework, this difference is formally captured through the estimated level change (COVID coefficient), indicating that the observed variation reflects a modeled structural break rather than unexplained heterogeneity. The magnitude of the estimated level effect aligns closely with the observed increase in the mean DPI, reinforcing the interpretation of a discrete upward shift in payment behavior.
Among the control variables, POS terminals exhibit a statistically significant positive association with DPI, while ATMs show a significant negative association. This pattern is consistent with a rebalancing of payment activity away from cash-based channels toward electronic point-of-sale transactions. Inflation also displays a small but statistically significant negative association with DPI, indicating that higher price levels may dampen transaction activity.
Overall, these results point to a rapid behavioral adjustment in Saudi Arabia’s payment system during the pandemic period, characterized by increased reliance on electronic payments and reduced dependence on cash, reflecting a shift in payment usage intensity rather than broader financial inclusion.
4.3. Results of the ITS Model with Seasonality Controls
Table 4 reports the ITS model results after including monthly dummies to control for seasonality.
The inclusion of seasonal controls does not materially alter the main results. The estimated COVID coefficient remains positive and statistically significant, corresponding to an approximate 9.9% increase in DPI at the onset of the pandemic period. The post trend coefficient remains negative but statistically insignificant, reinforcing the conclusion that the long-run trajectory of digital payment usage did not deviate substantially from its pre-pandemic trend.
POS terminals continue to exhibit the strongest positive association with DPI, while ATM usage remains a statistically significant negative correlate. E-commerce sales retain a negative and statistically significant association with DPI. This result is consistent with potential channel substitution dynamics between online and physical POS payments rather than a contraction in digitalization overall. At the aggregate level, the negative coefficient should be interpreted as evidence of channel reallocation between online and physical POS payments within the payment system. Because the DPI Index is constructed from physical POS transactions relative to cash withdrawals, increases in online e-commerce activity may reduce the relative share of physical POS transactions by construction, without implying a decline in overall digital payment activity. Given the use of aggregate national data, no inference is made regarding individual-level adoption or distributional effects. Because the analysis is based on aggregate national data, the results capture overall system-level changes in payment behavior and do not allow for direct inference about individual-level adoption patterns or disparities across population groups. Inflation also continues to show a negative association with DPI.
Seasonal effects are observed mainly in August and September, reflecting temporary increases in transaction intensity during Haj and summer travel periods.
Overall, the stability of coefficients across specifications reinforces the robustness of the association between the COVID-19 period and the observed shift in digital payment usage.
4.4. Dynamic ITS Model (Lagged Specification)
To account for persistence in payment behavior, a dynamic ITS model including a one-month lag of the dependent variable is estimated. Results are summarized in
Table 5.
Results of the dynamic ITS model include a one-month lag of the dependent variable to capture inertia in DPI behavior. The estimated lag coefficient is positive and statistically significant, indicating moderate persistence in digital payment usage, with approximately one-third of DPI from the previous month carries over to the current period.
Importantly, the COVID-19 coefficient remains positive and highly statistically significant, corresponding to an approximate 7.7% level increase in DPI at the onset of the pandemic period, even after accounting for inertia. This indicates that the observed level shift is not attributable to serial correlation alone and remains present after controlling for momentum in DPI.
The post trend term remains negative and statistically insignificant, suggesting that digital payment usage stabilized at a higher level rather than accelerating continuously over time. POS terminals continue to exhibit a statistically significant positive association with DPI, while ATM usage continues to show a statistically significant negative association. Inflation displays an even stronger negative and statistically significant association with digital payment usage, indicating that price pressures may reduce transaction frequency and digital payment usage. The positive seasonal effects in August and September also persist.
These findings indicate that the observed level shift is not driven by serial correlation alone and reflects a sustained structural adjustment in payment behavior during the pandemic period.
4.5. Results of the Alternative Break Date (April 2020)
As a robustness test, the interruption date was shifted one month forward (April 2020) to reflect the period of full lockdowns and intensified digital payment usage. The results are reported in
Table 6.
The results show that when the break date is shifted to April 2020, the immediate COVID-19 period coefficient remains positive and statistically significant and increases in magnitude to approximately 13%. The post trend coefficient becomes negative and statistically significant (−0.022), indicating that following the rapid initial adjustment, the growth rate of digital payment usage growth moderated as the system converged toward a new equilibrium. The coefficients on the control variables remain qualitatively unchanged across specifications. POS terminals continue to exhibit a strong positive association with DPI, ATM usage remains negatively associated, and inflation continues to exert a statistically significant dampening effect. This consistency suggests that the identified structural break is not sensitive to the precise timing of the intervention.
To further assess robustness, the ITS model was re-estimated using the Prais–Winsten transformation to account for potential first-order serial correlation AR (1) in the residuals. The estimated coefficients for the COVID dummy, POS terminals, ATMs, and inflation remain stable, indicating that the main results are not driven by autocorrelation or misspecification in the error structure In addition, a first-difference specification is estimated to focus on short-run monthly changes, and the direction and statistical significance of the COVID-period coefficient persist. Finally, a Chow structural-break test formally verified a significant break in March 2020, providing further statistical support for the ITS framework.
Across all specifications, the core finding remains unchanged where the COVID-19 period is associated with an immediate and statistically robust increase in digital payment usage in Saudi Arabia, ranging between 7% and 13% depending on model specification. The consistency of this pattern supports the interpretation of a discrete structural realignment in aggregate payment behavior during the pandemic period rather than a permanently higher growth trajectory.
4.6. Robustness to Alternative Specifications and Control Exclusion
To assess whether the estimated COVID-period level shift is sensitive to specification choices or potential overlap between control variables and the construction of the DPI index, the baseline ITS model was re-estimated under four alternative specifications. These include: (i) excluding NFC transactions, (ii) excluding e-commerce transactions, (iii) excluding both NFC and e-commerce simultaneously, and (iv) a parsimonious infrastructure-only specification retaining POS terminals, ATMs, inflation, and the ITS time structure. All models are estimated using Newey–West HAC standard errors (12 lags). Full results are reported in
Table 7.
Table 7 demonstrates that the estimated COVID-period coefficient remains positive in all specifications. Its magnitude ranges between 0.055 and 0.088 when NFC and/or ECOM are excluded and equals 0.0696 in the infrastructure-only model. The coefficient remains statistically significant in four of the five models. While precision declines when ECOM alone is excluded, the sign and economic magnitude remain stable. These results indicate modest sensitivity in statistical strength but not in direction or substantive interpretation, which continues to reflect changes in aggregate payment usage rather than access to financial services.
The results also show that the coefficients on POS terminals and ATMs exhibit strong stability. The POS coefficient remains positive and highly significant across all models, with magnitudes between 0.392 and 0.454. The ATM coefficient remains negative and statistically significant in every specification. No sign reversals occur. This consistency suggests that the substitution pattern away from cash-based channels toward electronic POS transactions is not driven by the inclusion of NFC or e-commerce controls.
In addition, variation in the time and post-trend coefficients across specifications reflects redistribution of explanatory power when trending usage variables are excluded. In reduced models, deterministic time components absorb part of the variation previously captured by NFC and ECOM. Importantly, these changes do not alter the estimated level shift associated with the COVID period.
Inflation retains a negative association with DPI in all specifications, with minor variation in statistical significance.
These results show that the increase in DPI during the pandemic is not driven by the way the index is constructed, by missing control variables, or by correlations among trending variables. The main result stays the same across all specifications that the COVID-19 period is linked to a clear one-time increase in DPI, rather than a permanent acceleration in its growth rate.
5. Discussion
This study examined the association between the COVID-19 pandemic and changes in digital payment intensity (DPI) in Saudi Arabia using monthly data from January 2019 to July 2025 and an Interrupted Time Series (ITS) approach. In this paper, DPI captures aggregate digital payment usage and substitution away from cash, rather than individual-level access or account ownership. The results provide consistent empirical evidence of a one-off, statistically significant upward shift in DPI coinciding with the onset of the pandemic, rather than a sustained acceleration in growth. Across all specifications—including baseline, seasonally adjusted, dynamic, and alternative break-date models—the ITS estimates consistently indicate an immediate level increase of about 7% to 13% in the DPI Index followed by a flatter post-pandemic trend at a higher level. This pattern suggests a discrete behavioral adjustment in payment usage rather than a permanent change in the growth rate of digital payment intensity.
A key question arising from these results is why the pandemic period is associated with a sharp increase in digital payment intensity followed by a relatively flat trajectory rather than continued acceleration. One possible explanation is that COVID-19 acted as a one-time behavioral shock that forced rapid adoption among individuals and merchants who were already capable of using digital payment systems. Cross-country evidence shows that digital financial adoption expanded rapidly during the pandemic but remained concentrated among already connected users, reflecting uneven diffusion across populations and reinforcing pre-existing digital divides [
33].
In this sense, the pandemic reduced frictions to adoption—such as habit persistence, perceived risk, and limited familiarity—leading to an immediate upward shift in usage. However, once this adjustment occurred, the system quickly approached a new equilibrium. Because digital payment adoption depends on infrastructure, user readiness, and transaction needs, the remaining population may face structural or behavioral constraints that prevent further rapid increases in usage. As a result, the growth rate returns to its pre-pandemic trajectory, even though the overall level remains permanently higher.
This pattern is not necessarily universal and appears to depend on country-specific conditions. Evidence from Europe suggests that while digital payments increased during the pandemic, cash usage partially rebounded once restrictions were lifted, indicating less persistent behavioral change [
11]. In contrast, countries in the Gulf Cooperation Council, including Saudi Arabia, experienced more sustained increases in digital transactions, largely due to stronger pre-existing infrastructure, regulatory coordination, and policy support. In many developing economies, adoption patterns were more uneven, reflecting disparities in access to digital infrastructure, financial literacy, and institutional trust. These differences suggest that the observed “level shift without sustained acceleration” is more likely to occur in economies where digital systems were already well established prior to the pandemic, allowing for rapid but bounded adjustment.
These findings are broadly consistent with the existing literature documenting a COVID-19–related acceleration in digital payment usage. Studies such as Fu and Mishra and Cull et al. describe the pandemic as a “digital tipping point,” where necessity drove a rapid shift toward electronic transactions. However, the results of this study provide a more nuanced perspective. While much of the literature emphasizes sustained growth in digital finance, the evidence here suggests that in the case of Saudi Arabia, the pandemic coincided with a discrete level shift rather than a persistent acceleration in the growth rate. This distinction indicates that COVID-19 reinforced and locked in pre-existing digital trends rather than fundamentally altering their trajectory, aligning more closely with studies that emphasize the role of pre-existing infrastructure and institutional readiness in shaping post-pandemic outcomes.
Importantly, the additional exclusion and parsimonious robustness checks confirm that this level shift is not sensitive to the inclusion of NFC, e-commerce, or other usage-oriented controls. When NFC, ECOM, or both variables are removed from the specification, the estimated COVID coefficient remains positive and statistically significant, with magnitudes closely aligned with the baseline model. The infrastructure-only specification—retaining only POS terminals, ATMs, inflation, and the ITS time structure—also yields a stable and statistically significant COVID effect. This stability suggests that the identified shift is unlikely to be driven by overlapping index components or model specification artifacts. The brief decline in the DPI Index visible in early 2020 should not be interpreted as a reversal of digital adoption.
Given the construction of the index, this temporary dip likely reflects precautionary increases in cash withdrawals during the onset of uncertainty rather than a genuine decline in digital payment usage. Evidence from financial market studies shows that the COVID-19 shock triggered a global “dash for cash,” where demand for liquidity surged sharply, leading to widespread market stress and temporary disruptions in financial activity [
34]. During the early stages of the pandemic, households increased their demand for liquidity as a buffer against income shocks, supply disruptions, and restricted access to financial services. As a result, cash withdrawals rose sharply even when actual cash spending did not increase proportionally.
Because the DPI index is constructed as the share of electronic POS transactions relative to total POS-related transactions (electronic payments plus cash withdrawals), this surge in withdrawals mechanically inflates the denominator and temporarily depresses the index. This effect reflects a short-term liquidity demand shock rather than a reversal in digital adoption behavior. As uncertainty subsided, cash withdrawal patterns normalized, and the DPI index rose sharply, consistent with a sustained shift toward electronic payment usage.
Although the post-pandemic trend slope was not statistically significant, the results suggest that the pandemic period coincided with a rapid rise in digital adoption followed by stabilization at a higher equilibrium in Saudi Arabia’s DPI trajectory. Even in specifications where the post-trend becomes statistically significant under alternative break timing, the qualitative interpretation remains unchanged: the pandemic produced an immediate upward adjustment, followed by moderation rather than continued acceleration. This short-run behavioral response is consistent with micro-level evidence showing that pandemic-related health concerns, convenience, and perceived safety drove temporary shifts in payment behavior rather than sustained changes in growth dynamics [
35]. From a digital transformation perspective, this pattern is consistent with a dynamic capability response, where pre-existing digital infrastructure and regulatory readiness enabled swift behavioral adjustment, but without continued post-crisis acceleration in aggregate usage.
The dominance of POS terminals as a positive driver of DPI and the negative coefficient for ATM transactions suggest a rebalancing away from cash-intensive channels toward digital payment infrastructure, rather than a complete substitution of cash. Because the dependent variable is constructed from aggregate transaction data, these results reflect changes in usage intensity among existing users rather than direct evidence of new financial inclusion. Because the analysis relies on aggregate national data, the results should be interpreted as reflecting system-level shifts in payment behavior rather than changes in inclusion at the individual or group level. As such, the findings cannot directly capture disparities related to the digital divide, including differences across income, gender, or geographic groups.
The digital divide literature conceptualizes these disparities as structural inequalities in access, usage, and capabilities, where differences across income, education, and geography systematically shape participation in digital financial systems [
36]. While the broader literature emphasizes distributional inequalities in access and usage, the present study complements this perspective by focusing on aggregate usage intensity, thereby providing a system-level view of how payment behavior responds to large-scale shocks such as COVID-19.
While the present analysis does not allow for direct identification of demographic disparities, existing evidence from Saudi Arabia and the broader GCC suggests that digital payment adoption is not uniform across population groups. Prior studies indicate that younger, more educated, and higher-income individuals are more likely to adopt digital financial services, while older populations, lower-income households, and individuals with limited digital literacy may face greater barriers to adoption [
6]. Gender gaps, although narrowing in the Gulf region, may still persist in certain segments due to differences in labor market participation and access to financial services. More broadly, fintech diffusion studies such as Kanga et al. [
37] show that adoption remains uneven across demographic and geographic groups, with persistent gaps between urban and rural areas and across income levels limiting inclusive participation despite overall growth in digital financial services.
These patterns suggest that the aggregate increase in digital payment intensity observed during the pandemic may have been driven disproportionately by already digitally engaged groups. As a result, policy efforts should not only focus on expanding infrastructure but also on improving digital literacy, financial capability, and inclusive access to ensure that the benefits of digital transformation are broadly shared across the population.
Notably, the positive association of POS terminals and the negative association of ATM usage remain stable across all robustness specifications, reinforcing the interpretation of structural channel reallocation rather than model-dependent artifacts.
Evidence from other emerging economies suggests that the impact of COVID-19 on digital financial services was uneven, with some services expanding while others experienced neutral or even negative effects, underscoring that digital adoption does not imply uniform gains in broader financial participation [
38].
This interpretation is consistent with the findings of Saudi Central Bank [
24] and Naz et al. [
26] who observed that Gulf economies—especially Saudi Arabia—experienced some of the fastest global growth in electronic payments during the pandemic. The negative and persistent association between inflation and DPI highlights the importance of macroeconomic stability for sustained digital payment usage. Rising prices may constrain real purchasing power and transaction frequency, particularly among lower-income users, thereby limiting active participation in digital payment systems. This interpretation aligns with Baerlocher [
39], who emphasized that price volatility disproportionately affects financial engagement among vulnerable groups.
More broadly, unmodeled macroeconomic forces—such as oil price fluctuations and pandemic-related government support measures—may also have shaped household spending patterns and transaction behavior during the study period. While these factors are not explicitly modeled in the ITS framework, their potential influence should be acknowledged when interpreting the magnitude and persistence of the estimated effects.
These findings are consistent with global evidence showing that the pandemic coincided with a discrete digital shift rather than a permanently higher growth path. For instance, Cull et al. [
3] found that digital payments expanded globally during lockdowns, enabling households to maintain access to finance even amid restrictions. Similarly, Dluhopolskyi et al. [
20] documented widespread improvements in digital financial service use in 2021, although progress varied across countries depending on infrastructure and regulation. In the Gulf context, Bi et al. [
7] reported that economies with established digital ecosystems showed greater resilience to pandemic shocks, and Banna & Alam [
40] linked fintech adoption during COVID-19 to banking stability and broader financial system development across the ASEAN countries.
Methodologically, this study contributes by applying an ITS framework to digital payment intensity analysis. This approach follows the guidance of Bernal et al. [
9], who demonstrated how segmented time-series models can detect both immediate and gradual changes following major interventions. The observed pattern—a sharp level increase followed by stabilization—demonstrates the usefulness of ITS models in distinguishing short-term behavioral responses from longer-term structural transformation in payment usage. While prior studies such as Sharaf et al. [
6] and Shishah & Alhelaly [
27] highlighted Saudi Arabia’s strong digital readiness and the broader policy environment supporting digital finance, the evidence presented here shows that the pandemic period coincided with a rapid but bounded transition toward a more cash-lean economy, facilitated by pre-existing digital infrastructure and Vision 2030–related regulatory reforms. Importantly, the timing of the COVID-19 shock overlapped with ongoing payment-system reforms under Vision 2030, making it difficult to fully disentangle reform effects from pandemic-driven behavioral changes.
Prior to the pandemic, Saudi Arabia expanded the Mada network, mandated POS interoperability, reduced merchant fees, and promoted contactless payment standards through coordinated initiatives led by SAMA. These efforts primarily focused on infrastructure rollout during 2019–early 2020. When containment measures were introduced in March–April 2020, these existing systems enabled a rapid behavioral shift toward digital payments. Accordingly, the estimated ITS effects should be interpreted as capturing the interaction between pandemic-related restrictions and pre-existing reforms rather than a purely exogenous policy intervention. While fully disentangling the effects of COVID-19 from ongoing Vision 2030 reforms is inherently challenging, the timing of the observed structural break provides useful identification insight. As highlighted by Ali & Salameh [
41], the expansion of digital payment systems in Saudi Arabia—particularly POS and electronic platforms—preceded the pandemic, facilitating a rapid behavioral transition toward cashless payments under COVID-19 conditions.
Most major payment infrastructure reforms—such as the expansion of the Mada network, reductions in merchant fees, and promotion of contactless payments—were implemented gradually during 2019 and early 2020. In contrast, the sharp increase in DPI occurs precisely around March–April 2020, coinciding with the introduction of lockdown measures, mobility restrictions, and public health guidance. This temporal alignment suggests that the observed level shift reflects a behavioral response to pandemic conditions operating on an already developed digital infrastructure, rather than a continuation of pre-existing reform trends alone.
From a policy perspective, the results underscore the importance of sustaining digital payment usage beyond crisis-driven adoption. The strong role of POS terminals highlights the continued relevance of merchant onboarding, interoperability standards, and payment-network expansion. The decline in ATM reliance suggests that targeted support for small-merchant digitalization and contactless payments remains critical, particularly outside major urban centers. The negative inflation–DPI relationship further reinforces that macroeconomic stability complements digital payment adoption. As post-pandemic growth flattened, policy emphasis should shift from rapid expansion toward consolidation, usage quality, and broad accessibility, ensuring that digital gains are durable and broadly shared. These implications align closely with Vision 2030’s Financial Sector Development Program, which emphasizes innovation, financial deepening, and inclusive growth [
24].
6. Conclusions
This study examined how the COVID-19 period is associated with changes in aggregate digital payment usage in Saudi Arabia, as measured by the Digital Payment Intensity (DPI) index, using an Interrupted Time Series framework and monthly data. The results indicate that the onset of the pandemic coincided with a statistically significant one-time increase—between 7% and 13%—in DPI, followed by stabilization at a higher level rather than continued acceleration. This pattern reflects intensified use of digital payment channels and substitution away from cash, rather than a permanent increase in the growth rate of digital payment intensity.
Importantly, this conclusion remains robust across alternative specifications. Excluding NFC transactions, excluding e-commerce transactions, excluding both simultaneously, and estimating a parsimonious infrastructure-only model all yield a positive and statistically significant COVID-period level shift with only modest variation in magnitude. This stability indicates that the estimated structural break is not driven by overlapping construction of the index, substitution effects within the numerator, or multicollinearity among trending infrastructure variables.
POS terminal expansion emerges as the strongest positive correlate of DPI, while ATM usage declines, suggesting a gradual reorientation of payment behavior toward digital infrastructure. The negative association between inflation and DPI further highlights the role of macroeconomic stability in sustaining active participation in digital finance, particularly among economically vulnerable users. At the same time, international evidence shows that pandemic-driven digitalization often widened disparities across gender, age, and income groups, even as aggregate digital usage increased [
42]. This underscores that aggregate digital expansion does not automatically translate into uniform improvements in broader financial participation.
Overall, the findings suggest that Saudi Arabia’s strong pre-pandemic digital infrastructure and regulatory reforms under Vision 2030 enabled the country to absorb a sudden digital shock and translate crisis conditions into rapid adoption of digital payments. However, the statistically insignificant change in post-pandemic trends indicates that sustaining digital progress requires continued policy effort beyond the initial adjustment phase.
The findings carry several policy implications. First, the strong positive association between POS infrastructure and digital payment intensity highlights the importance of continued investment in merchant acceptance networks, particularly among small- and medium-sized enterprises. Second, the negative relationship between ATM usage and digital payments suggests that policies aimed at reducing reliance on cash—such as expanding contactless limits and incentivizing digital transactions—remain effective. Third, the negative association between inflation and DPI underscores the importance of macroeconomic stability in sustaining digital payment usage. Together, these results suggest that policy efforts should move beyond initiating digital adoption and instead focus on reinforcing sustained usage, improving accessibility, and ensuring that digital gains are broadly shared across the population.
From a policy perspective, future progress will depend on moving beyond infrastructure expansion toward sustained usage quality and broader accessibility, including merchant digitalization, fintech–bank partnerships, consumer protection frameworks, and digital-literacy initiatives. Because national-level indicators may conceal gender, regional, and income disparities, policy design should explicitly address uneven adoption patterns to ensure that digital gains are broadly shared, consistent with the concerns raised in [
42].
Despite the contributions of the current study, several limitations should be acknowledged. First, the analysis relies on aggregate national data, which may mask differences across income levels, genders, or regions. Future studies using household-level datasets could reveal whether broader digital financial participation gains were equitably distributed. Second, while the ITS design isolates the timing of the pandemic shock, it cannot fully separate the effects of ongoing Vision 2030 reforms. Some observed improvements might reflect broader modernization trends rather than COVID-specific responses. In particular, the expansion of the Mada network and merchant digitalization initiatives began prior to 2020, but lockdown measures and public-health guidance substantially altered payment behavior during a narrow time window, making it possible to identify a discrete behavioral break even amid overlapping reforms. Third, the ITS framework applied in this study assumes linear pre- and post-intervention trends, which may not fully capture more complex or adaptive behavioral dynamics. Digital payment adoption may evolve in a non-linear manner, with phases of rapid uptake, saturation, and stabilization over time. Future research could extend this analysis by employing time-varying or non-linear ITS models to better capture these dynamic responses and potential structural adjustments in payment behavior. Finally, although inflation was included as a macroeconomic control, other relevant macroeconomic and policy factors were not modeled explicitly. In particular, oil price volatility may have influenced household income expectations and spending behavior in Saudi Arabia, while government support measures introduced during the pandemic may also have affected the timing and composition of transactions. These factors could have interacted with the observed shift in digital payment usage and should be examined more directly in future research.
In sum, the evidence indicates that the COVID-19 period coincided with a statistically identifiable and specification-robust upward shift in digital payment intensity in Saudi Arabia, representing a discrete structural adjustment in payment behavior rather than a sustained change in its growth trajectory.