1. Introduction
Recent climate warming and increasing traffic demand have intensified structural distress in conventional rural concrete pavements, leading to more frequent slab cracking, loss of support, faulting, pumping, and differential settlement. These problems substantially increase maintenance costs and shorten pavement service life. For low-volume and rural roads, the challenge is particularly pronounced because the pavement system is expected to remain economical while sustaining increasingly heavy and complex vehicle loading [
1,
2,
3,
4,
5,
6,
7].
Geocells are three-dimensional geosynthetic confinement systems that improve the load distribution capacity of infill materials by restricting lateral deformation and mobilizing passive confinement. In pavement engineering, geocell reinforcement has been widely shown to increase bearing capacity, improve structural stiffness, and reduce stress concentration in unbound base and subgrade layers [
8,
9]. Through the formation of a confined composite layer, geocells can redistribute localized stresses and enhance deformation compatibility within the pavement system [
10].
Recent studies have substantially advanced the understanding of geocell-reinforced pavement systems and demonstrated that geocell-reinforced RAP bases exhibited lower permanent deformation and reduced interface stresses under cyclic plate loading than weak subgrades [
11]. More recently, studies have reported that geocell geometry strongly affects rut depth and localized stress concentration under repeated loading but confirmed through field trials that geocell-reinforced pavements can improve bearing capacity and reduce subgrade vertical stress [
12,
13]. In addition, analytical studies have refined the estimation of settlement, stress propagation, and modulus improvement in geocell-reinforced layers [
14,
15]. However, these studies have mainly focused on flexible pavements, unbound granular layers, or subgrade systems, whereas the thermo-mechanical response of geocell-reinforced rigid concrete pavements remains largely unexplored. The authors of [
16] used large laboratory testing and finite element simulations to investigate the influence of geocell geometry on settlement trends in two-layer pavement structures, indicating that units with larger cell apertures produced better reinforcement performance under equivalent stress levels, while the authors of [
17] further showed, through full-scale field testing, that geocell reinforcement can increase the back-calculated elastic modulus of granular pavement layers. Additionally, Khan, A further confirmed through in situ non-destructive testing that geogrid-reinforced subgrades exhibited enhanced elastic modulus, and reduced settlement and stress concentration under traffic loads, whilst mitigating the progression of rutting and cracking [
18].
At the material level, systematic investigations have been conducted on the mechanical properties and temperature sensitivity of geocell materials. For instance, ref. [
19] experimentally analyzed the tensile behavior of geocell strips made from various polymers (e.g., HDPE, PP, and PET) under low-temperature conditions, revealing significant differences in stress–strain response and temperature sensitivity, which provide guidance for material selection in practical applications. Subsequent work by Lu and Zhao [
20,
21,
22] developed novel geocell materials and examined creep behavior under different loading conditions. Their results show that nonlinear three-parameter models, modified for temperature effects, accurately capture accelerated creep due to increased temperature. The authors of [
23] employed ABAQUS finite element software to model geocell-reinforced asphalt mixtures and explored optimal geocell configurations under various conditions.
Compared with flexible pavements, the behavior of geocell-reinforced rigid concrete pavements remains insufficiently understood. In particular, the structural response of such systems under coupled traffic and temperature actions has not yet been clarified. Concrete pavements are highly sensitive to temperature gradients because thermal warping modifies the support condition, stress distribution, and load transfer mechanism of the slab. When repeated traffic loading is superimposed on temperature-induced deformation, the resulting thermo-mechanical response may differ substantially from that under isolated loading conditions.
The available literature on geocell-reinforced concrete pavements is still limited. Existing studies suggest that geocell inclusion can improve slab stiffness, reduce settlement, and delay cracking, but most work has been restricted to static loading or simplified laboratory configurations. Systematic investigation of static, cyclic, thermal, and coupled loading conditions remains lacking, and the influence of geocell geometry on the response of rigid pavements has not been fully quantified [
24,
25,
26].
To address these gaps, this study combines scaled model testing with three-dimensional thermo-mechanically coupled finite element analysis to investigate the structural response of geocell-reinforced concrete pavements under static, traffic, thermal, and coupled temperature–loading conditions. The objectives are to (1) characterize the settlement, strain, and stress evolution of the reinforced structure under different loading conditions; (2) identify response-transition ranges associated with possible damage initiation under thermo-mechanical coupling; (3) compare the performance of geocell reinforcement with that of plain and doweled concrete pavements; and (4) determine the influence of geocell height on the reinforcing efficiency of the pavement system.
3. Test Results and Analysis
3.1. Analysis of Static Load Test Results
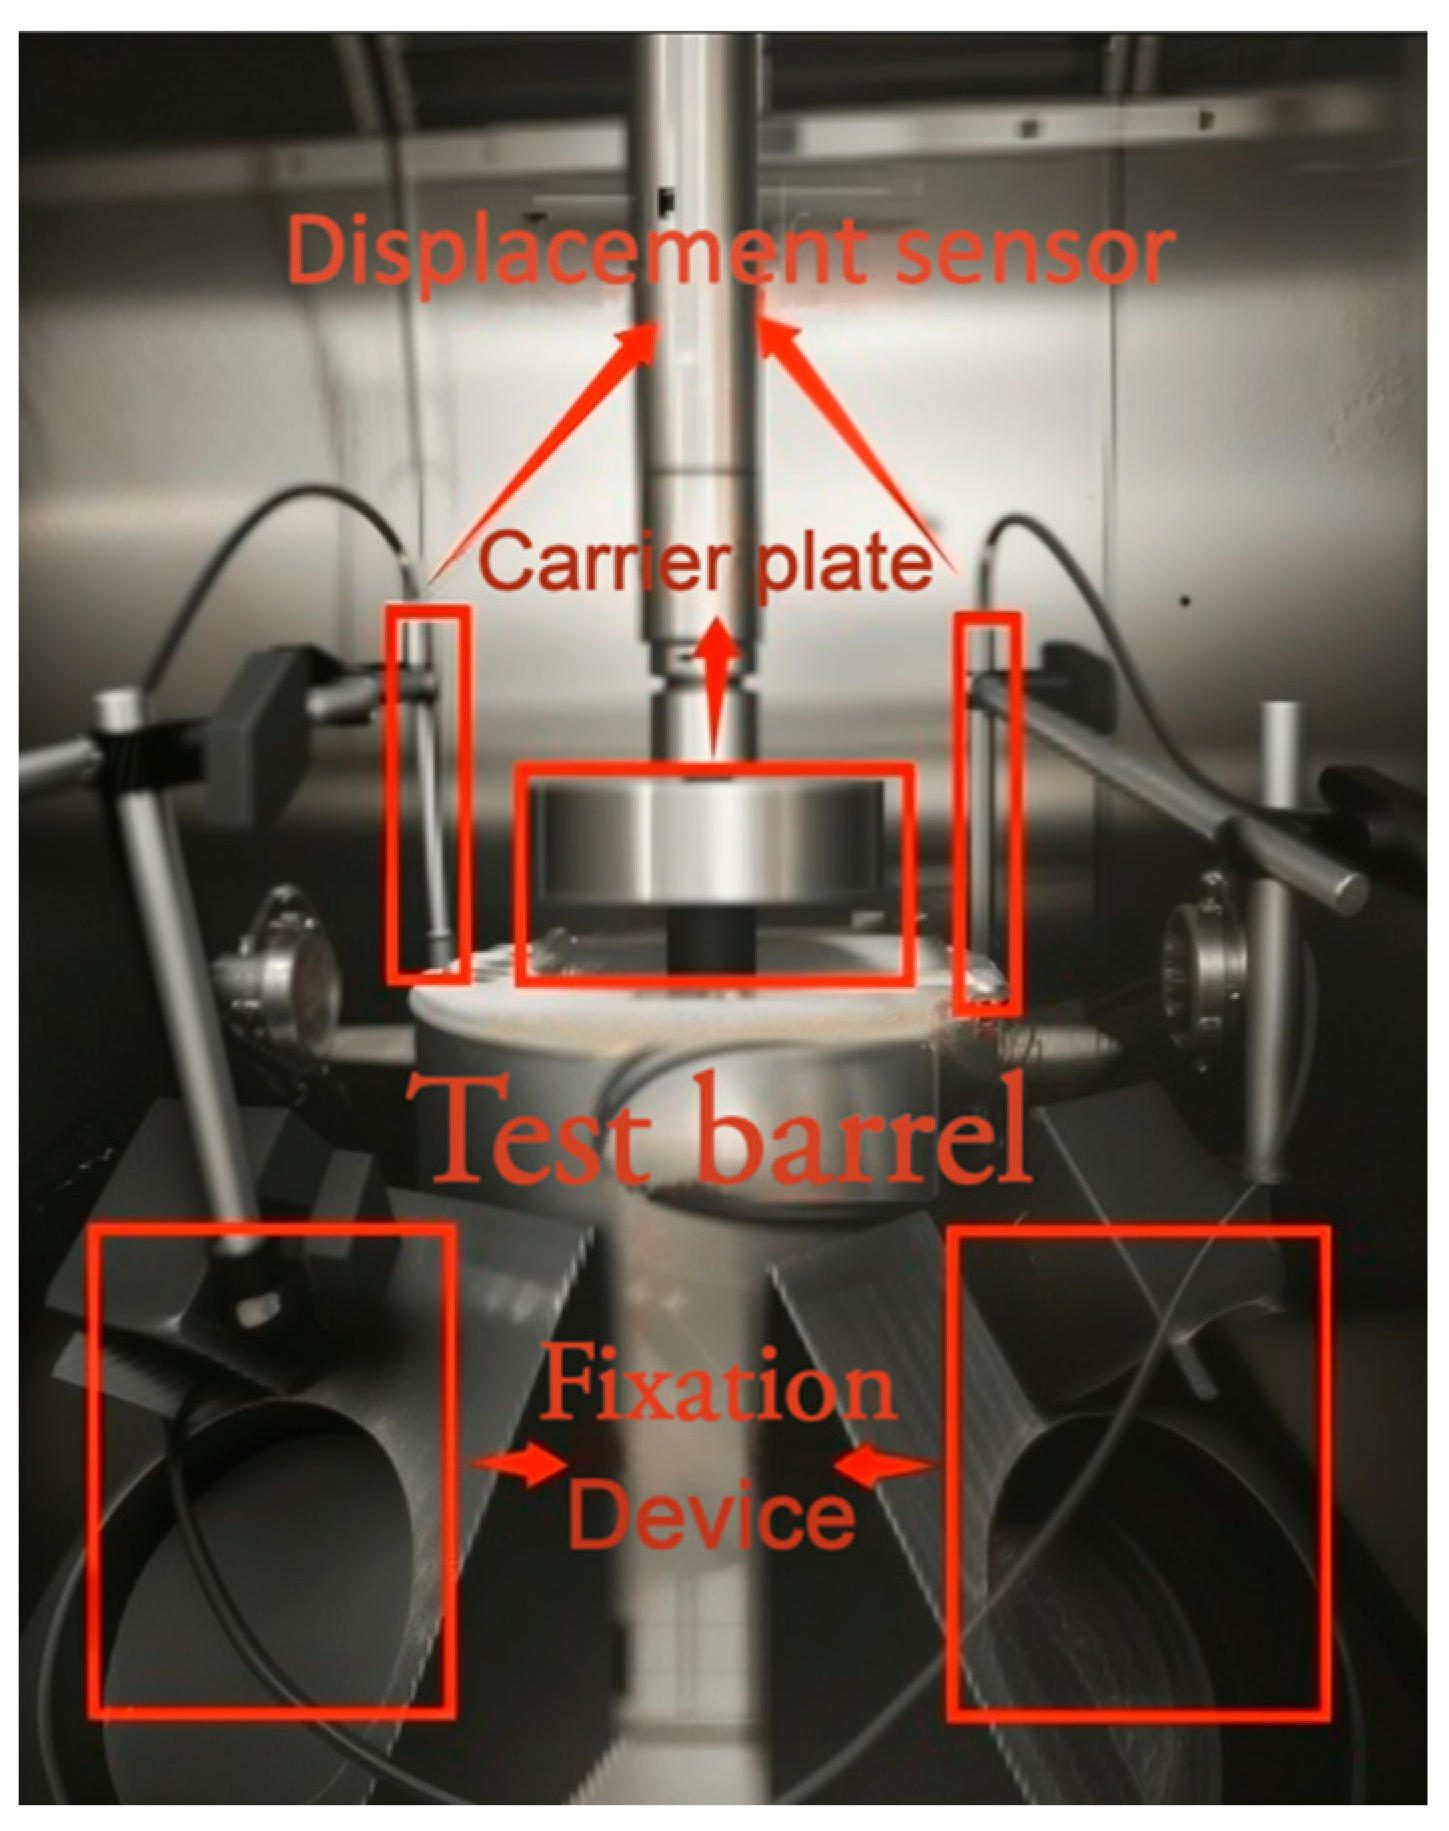
To investigate the mechanical response and load transfer characteristics of the pavement structure under static loading, a graded loading protocol was adopted in the present experimental program. Vertical loads were applied incrementally using the test loading apparatus until either structural failure of the pavement specimen occurred or the pre-established termination criteria were reached, thereby simulating the cumulative effects of long-term static loading.
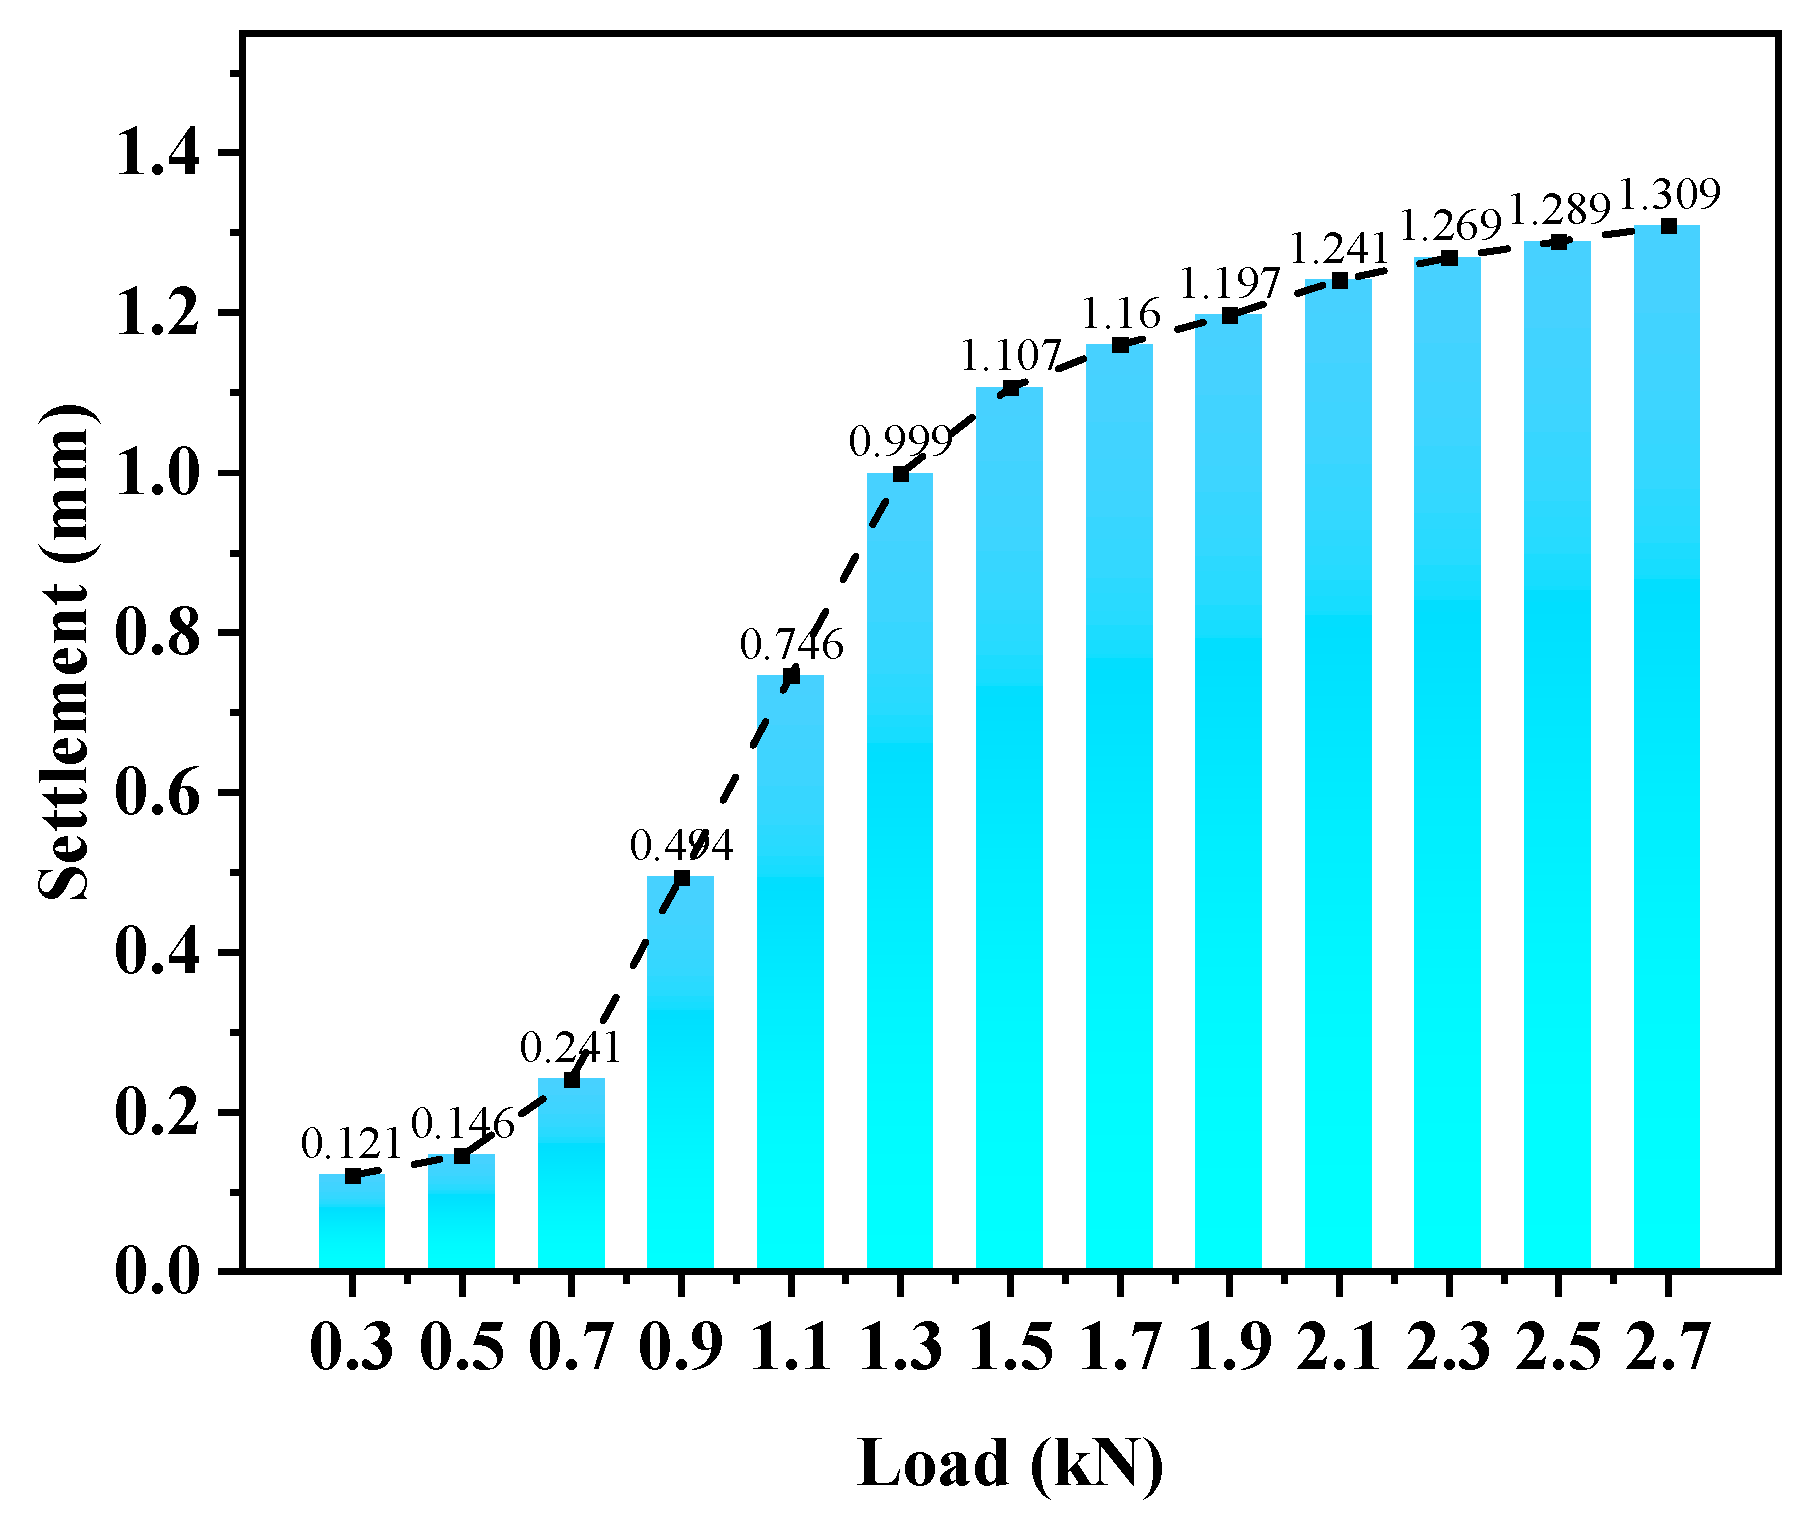
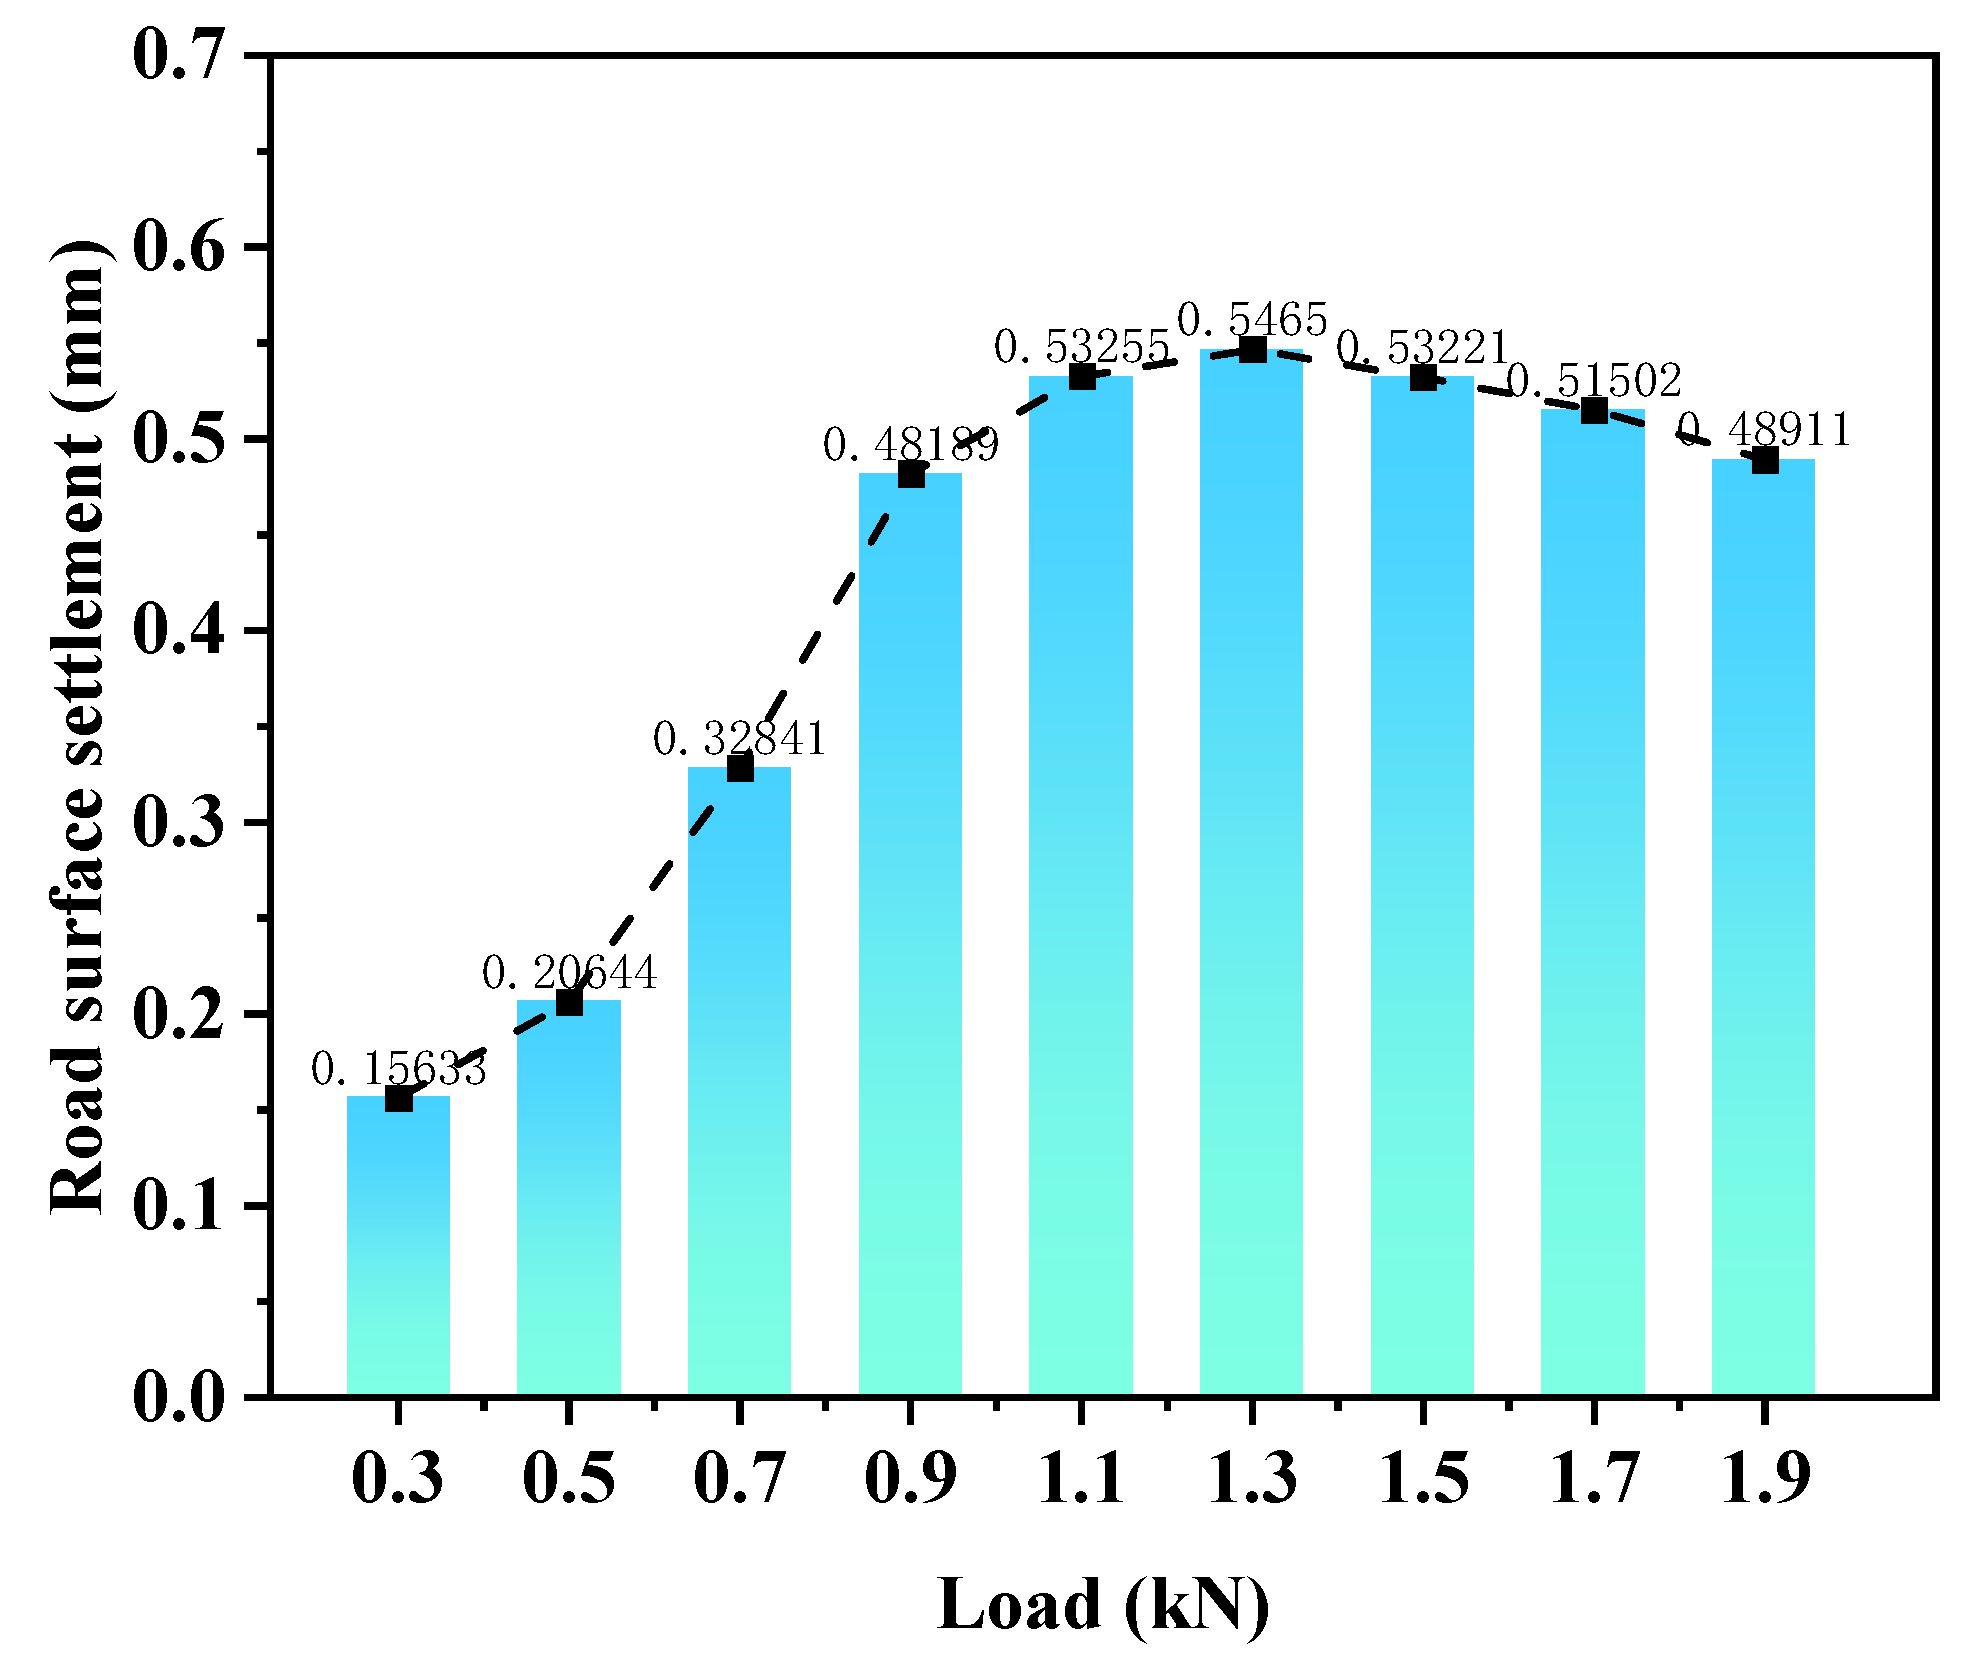
During graded loading, the settlement of the pavement surface course was recorded and is presented in
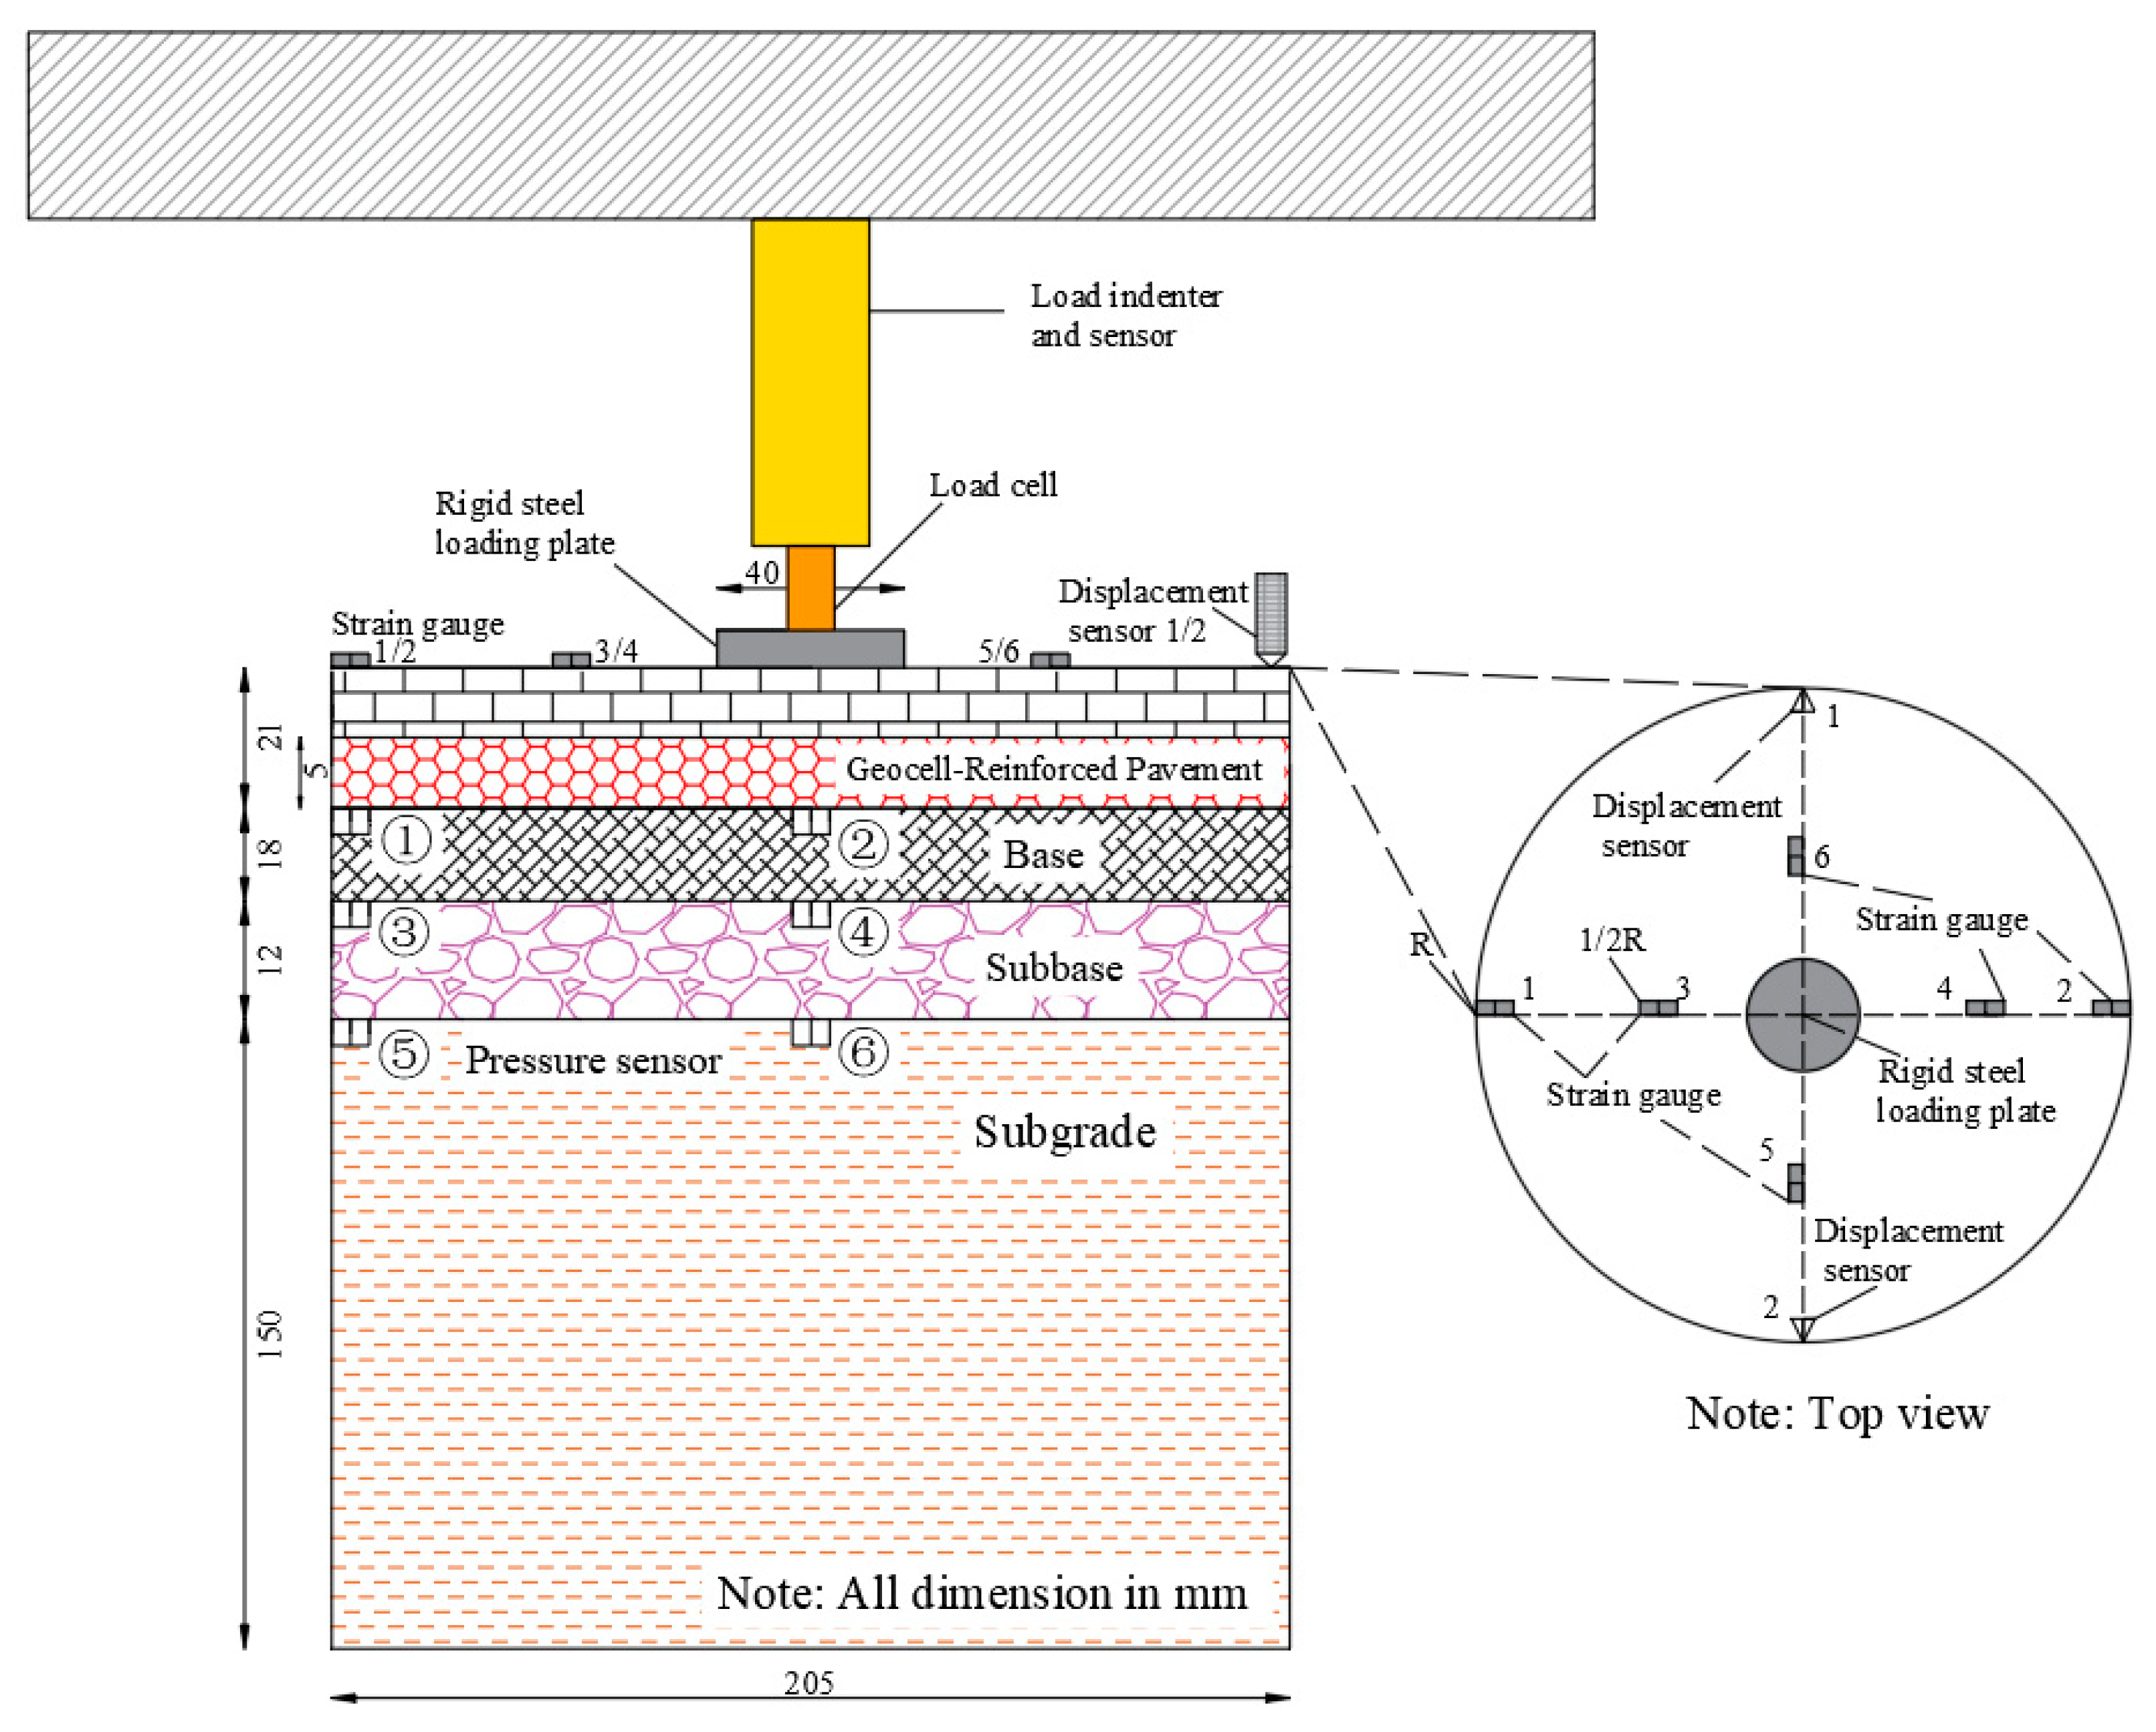
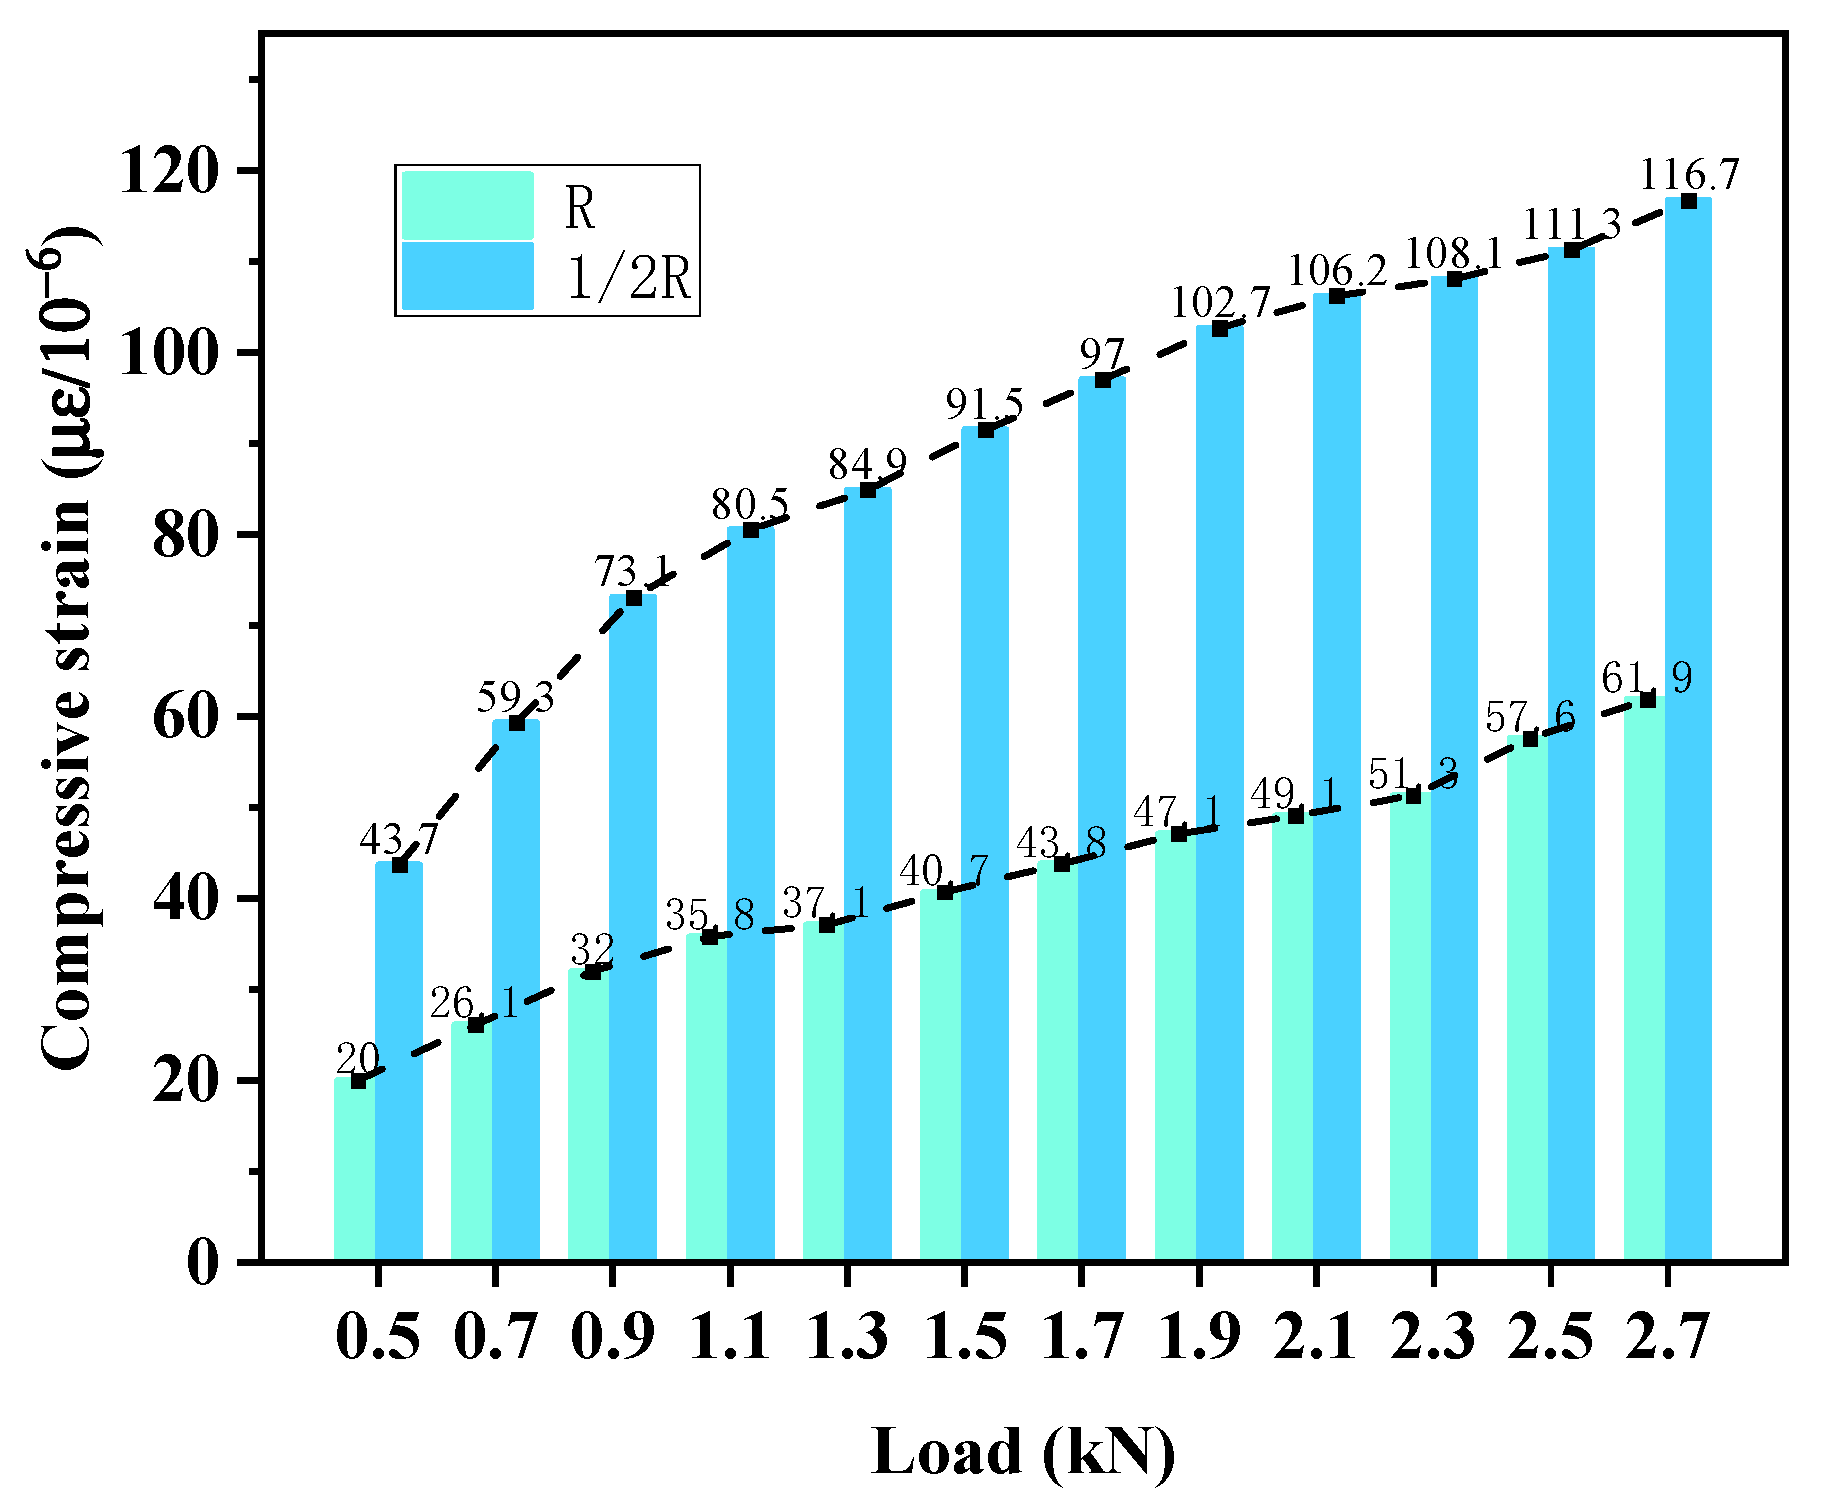
Figure 6. Additionally, the measured strain responses at the mid-span (1/2 R) and at the slab edge (R) of the surface course are shown in
Figure 7, illustrating the evolution of strain distributions in response to increasing static load levels.
The strain monitoring results of the pavement slab clearly reflect the load transfer and distribution within the slab. As shown in
Figure 7, with increasing applied load, the compressive strain measured within the slab exhibits an approximately linear increase, indicating that the geocell-reinforced concrete surface course remained within the linear elastic range throughout the applied load spectrum. Furthermore, the monitored strain values at the mid-span consistently exceeded those at the slab edge, directly demonstrating that the applied load is primarily transmitted downward through the slab center and subsequently diffused laterally. This resulted in a strain gradient from the slab center toward the edge, which directly reflects the stress distribution pattern under static loading. Such observations further confirm that the geocell reinforcement layer facilitates effective lateral load spreading and optimizes the stress state of the surface course, consistent with reported mechanisms of enhanced load diffusion in geocell-reinforced pavement systems.
The settlement profile of the pavement also reveals the deformation characteristics at different stages of loading. Based on the variation in settlement rate, the deformation process can be divided into three distinct phases. During the initial compaction stage (0.3–0.7 kN), the settlement rate was relatively slow (k1 = 0.3), primarily due to preliminary densification of the structural layers, with the system predominantly exhibiting elastic compression behavior. In the plastic development stage (0.7–1.5 kN), the settlement rate increased markedly (k2 = 1.26), indicating the onset of plastic deformation within the subgrade soil, representing a critical period of deformation progression. In the subsequent stabilization and stiffening stage (1.5–2.7 kN), the settlement rate slowed again (k3 = 0.168), a phenomenon closely associated with the reinforcing effect of the geocell layer. In this stage, the lateral confinement provided by the geocell became fully mobilized, resulting in a composite action between the geocell and the surrounding soil. This synergistic interaction significantly increased the overall stiffness of the structural system and restrained the continued rapid development of deformation.
3.2. Analysis of Traffic Load Test Results
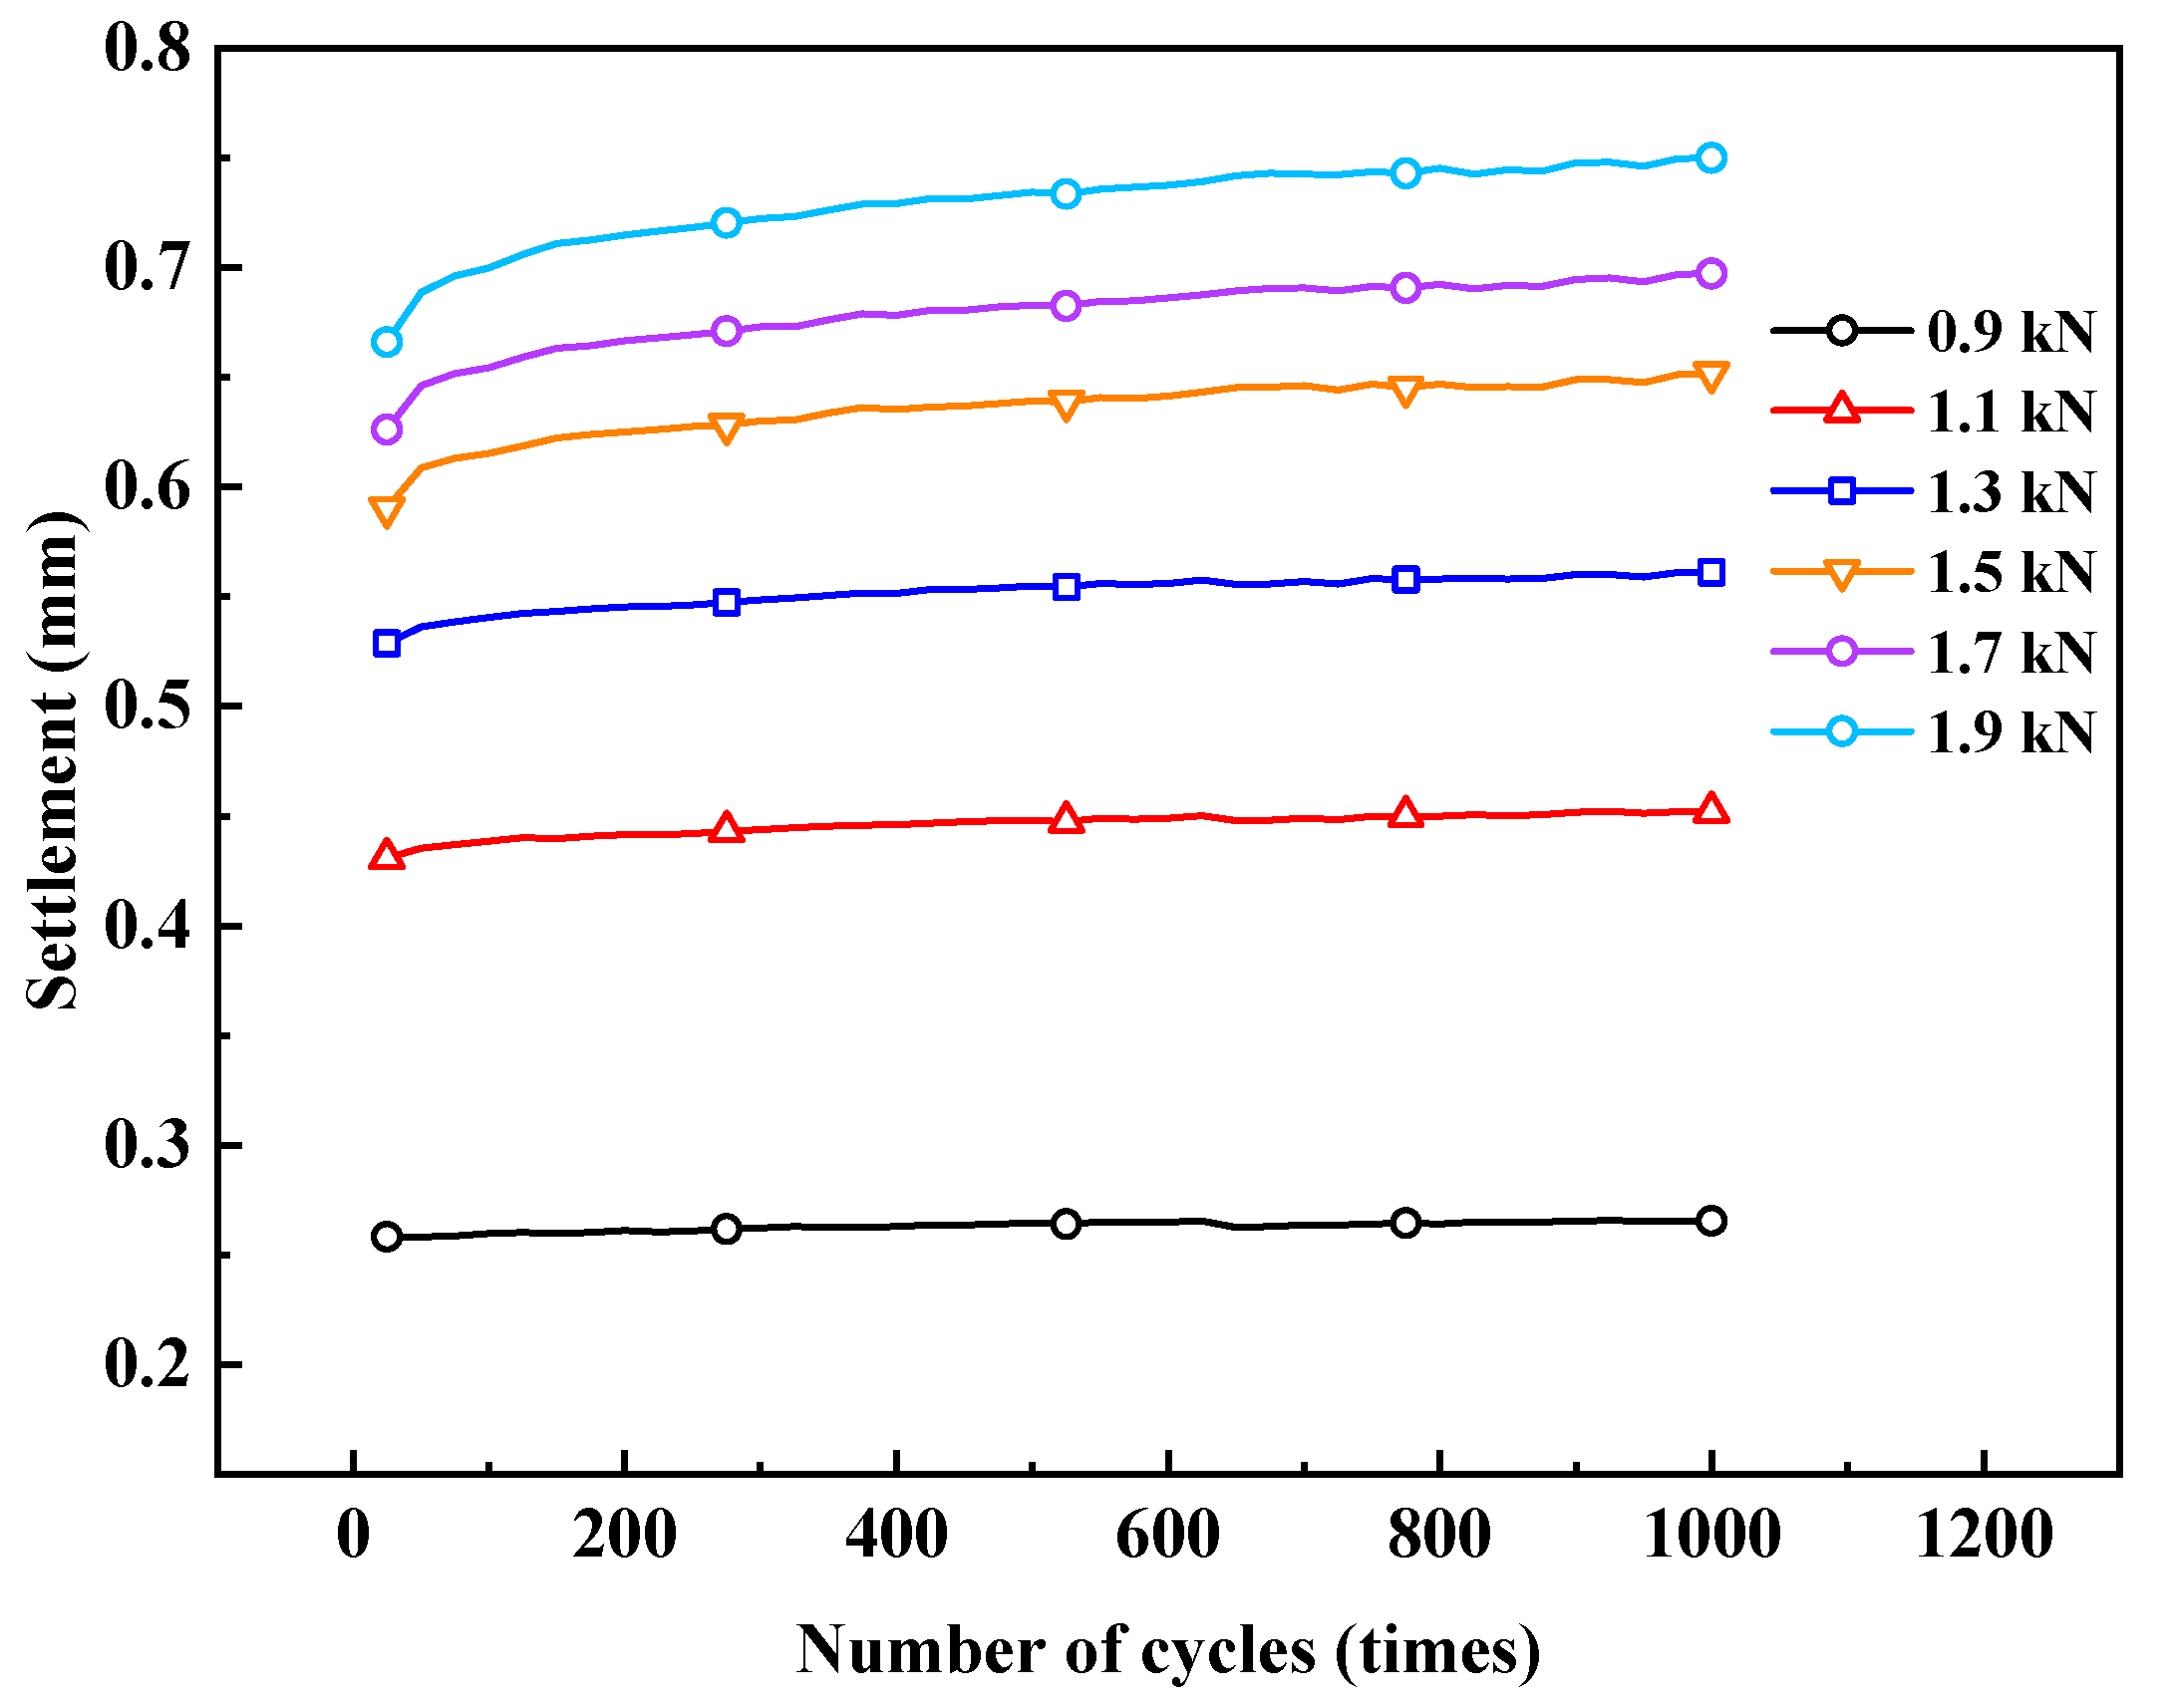
To investigate the service performance of the geocell-reinforced pavement under long-term traffic loading, traffic loads were simulated using a triangular wave with a frequency of 1.6 Hz. The variation in pavement displacement with respect to the number of loading cycles (ranging from 25 to 1000 cycles) was monitored for different load amplitudes between 0.9 kN and 1.9 kN, and the experimental results are presented in
Figure 8.
Under identical numbers of loading cycles, larger load amplitudes resulted in greater absolute settlement values. For a given load level, settlement accumulated progressively with increasing cycle count, but the rate of accumulation varied with load intensity. For instance, at a peak load of 1.9 kN, pavement displacement increased from −0.66604 mm after 25 cycles to −0.74997 mm after 1000 cycles, corresponding to an increase of approximately 12.6%, indicating a pronounced cumulative effect. In contrast, under a peak load of 0.9 kN, settlement only increased from −0.25835 mm to −0.26554 mm over the same cycle range, corresponding to an approximate 2.8% increase, whereas the 1.9 kN case exhibited a significantly larger accumulation. Similarly, at the 1000th cycle, the displacement at 0.9 kN was −0.26554 mm, while that at 1.9 kN increased to −0.74997 mm, representing an increase of approximately 182%. These results demonstrate that the magnitude of traffic loading is a critical factor controlling the deformation response of the pavement structure.
Moreover, the displacement–cycle relationship exhibited a similar evolutionary trend across all load levels: during the early loading phase (approximately the first 100 cycles), settlement accumulated rapidly; as the number of cycles continued to increase, the rate of settlement growth gradually decelerated and tended toward stabilization. This phenomenon reveals the adjustment and adaptation process of the pavement under traffic loading: an initial stage dominated by structural compaction and plastic deformation, followed by a stage characterized by stable elastic response. Although displacement tended toward stabilization in the later stages, permanent (irrecoverable) displacement occurred at all load levels from the initial cycles through to the 1000th cycle, indicating plastic deformation accumulation. Post-test crack observations under traffic loading further showed visible tensile cracking damage at the slab bottom, indicating that repeated loading resulted not only in permanent deformation accumulation but also in observable local damage. Nevertheless, because the present traffic loading test did not include a formal fatigue failure criterion, stiffness degradation analysis, or continuous crack-evolution monitoring, the results are more appropriately interpreted as representative repeated-loading response characteristics and comparative reinforcement effects.
Furthermore, higher load levels resulted in larger amounts of accumulated permanent deformation. For example, from the 25th to the 1000th cycle, the displacement increment under 0.9 kN loading was only 0.007 mm, whereas at 1.9 kN, the increment reached 0.084 mm, which is approximately 12 times greater than that under 0.9 kN loading. These quantitative observations indicate that elevated traffic load levels significantly exacerbate the accumulation of permanent structural damage in the pavement system.
3.3. Analysis of Temperature–Load Test Results
To investigate the response behavior of the geocell-reinforced cement concrete pavement under temperature variation, a series of environmental temperature loading tests were conducted. The test protocol simulated different ambient temperature conditions by incrementally increasing the temperature at a rate of 10 °C every 30 min, starting from an initial slab temperature of 35 °C. During the temperature loading process, strain at critical locations of the pavement slab was continuously monitored to analyze the evolution and spatial distribution characteristics of temperature-induced strain.
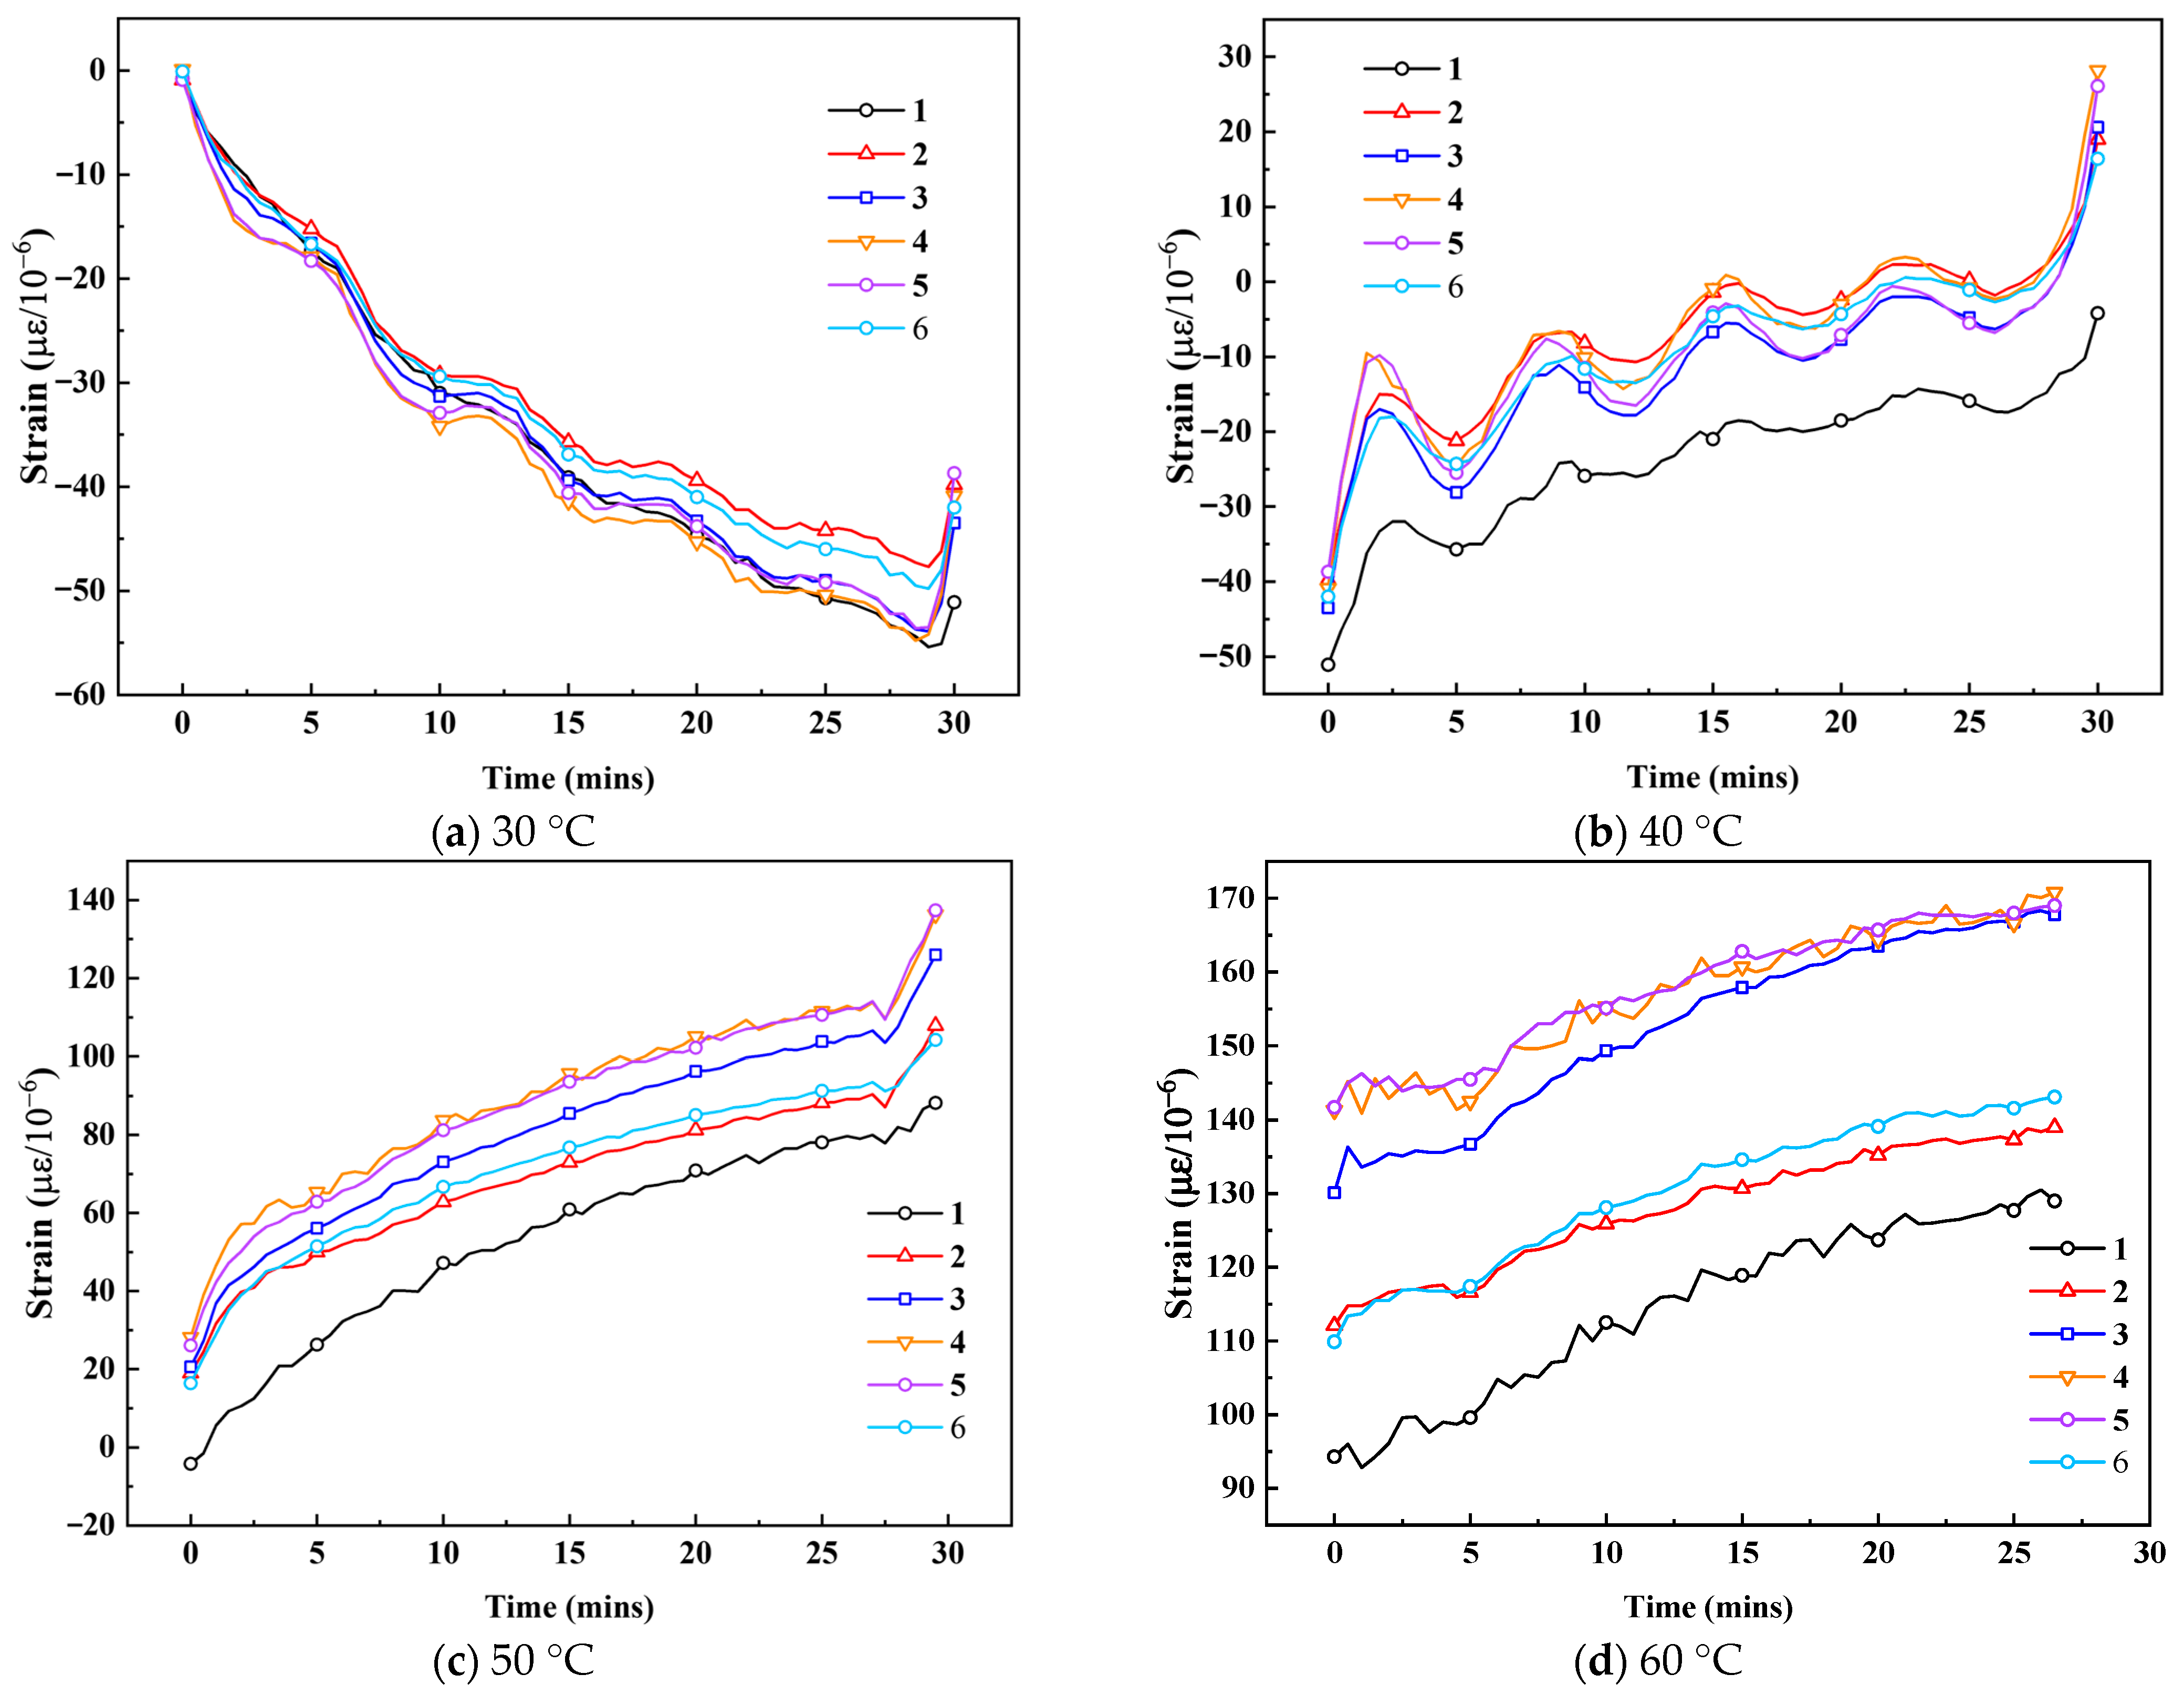
The average strain at different slab locations under varying temperature levels is summarized in
Figure 9.
As shown in
Figure 9, the strain response of the pavement slab exhibits a strong correlation with the history of temperature variation, and the overall evolution can be divided into four characteristic stages based on thermo-traffic behavior:
Stage I (0–30 min, 30 °C): Cooling-induced contraction stage. As the environmental temperature (30 °C) drops below the initial slab temperature (35 °C), the surface course undergoes cooling contraction. The concrete surface layer experiences compressive stresses due to thermal contraction, leading to a gradual development of compressive strain, with measured values increasing from 0 με to approximately −50 με.
Stage II (30–60 min, 40 °C): Warming recovery stage. When the environmental temperature rises to 40 °C, exceeding the initial slab temperature, the slab begins to heat up. The concrete in the surface course transitions from contraction to expansion, and tensile stresses progressively replace compressive stresses. Consequently, the strain fluctuates and returns toward zero.
Stage III (60–90 min, 50 °C): Stable warming tensile stage. With the temperature continuing to increase to 50 °C, the slab remains in a steady warming state. Tensile strain in the surface course continues to increase smoothly from near zero to approximately 100 με.
Stage IV (90–120 min, 60 °C): Sustained tensile stage. At an environmental temperature of 60 °C, the thermal expansion effect becomes more pronounced. Tensile strain continues to grow steadily, increasing from about 100 με to approximately 150 με.
Furthermore, a pronounced spatial gradient of temperature-induced strain was observed across the pavement slab. Monitoring data indicate that the strain fluctuation amplitude at monitoring points located near the slab edges (Points 1 and 2) was significantly smaller than at points positioned near the slab center and mid-width (Points 3, 4, 5, and 6). However, the center-to-edge strain ratio was not constant throughout the thermal process. Analysis of the measured data showed that the representative strain level at the slab center was generally about 1.2–1.3 times that at the slab edge during the stable thermal stage, whereas larger ratios could appear transiently during the response transition.
This phenomenon suggests that boundary constraints along the slab periphery strongly restrict free deformation. Such lateral constraints suppress upward deformation at the slab edges, preventing full release of temperature-induced stresses. In contrast, the slab center, being less constrained, is able to respond more freely to temperature changes and exhibits larger strain variations. This non-uniform strain distribution contributes significantly to thermal warping stresses and is recognized as a primary cause of temperature-induced distress in concrete pavements, which often initiates from central regions where deformation is less restrained.
Overall, the experimental results demonstrate that the geocell-reinforced cement concrete pavement exhibits pronounced thermal expansion and contraction behavior under temperature loading, with clear temporal and spatial heterogeneity in strain response. The central region of the slab, subjected to reduced boundary constraint, emerges as a sensitive zone and potential weakness for temperature-induced deformation.
3.4. Analysis of Thermal–Mechanical Test Results
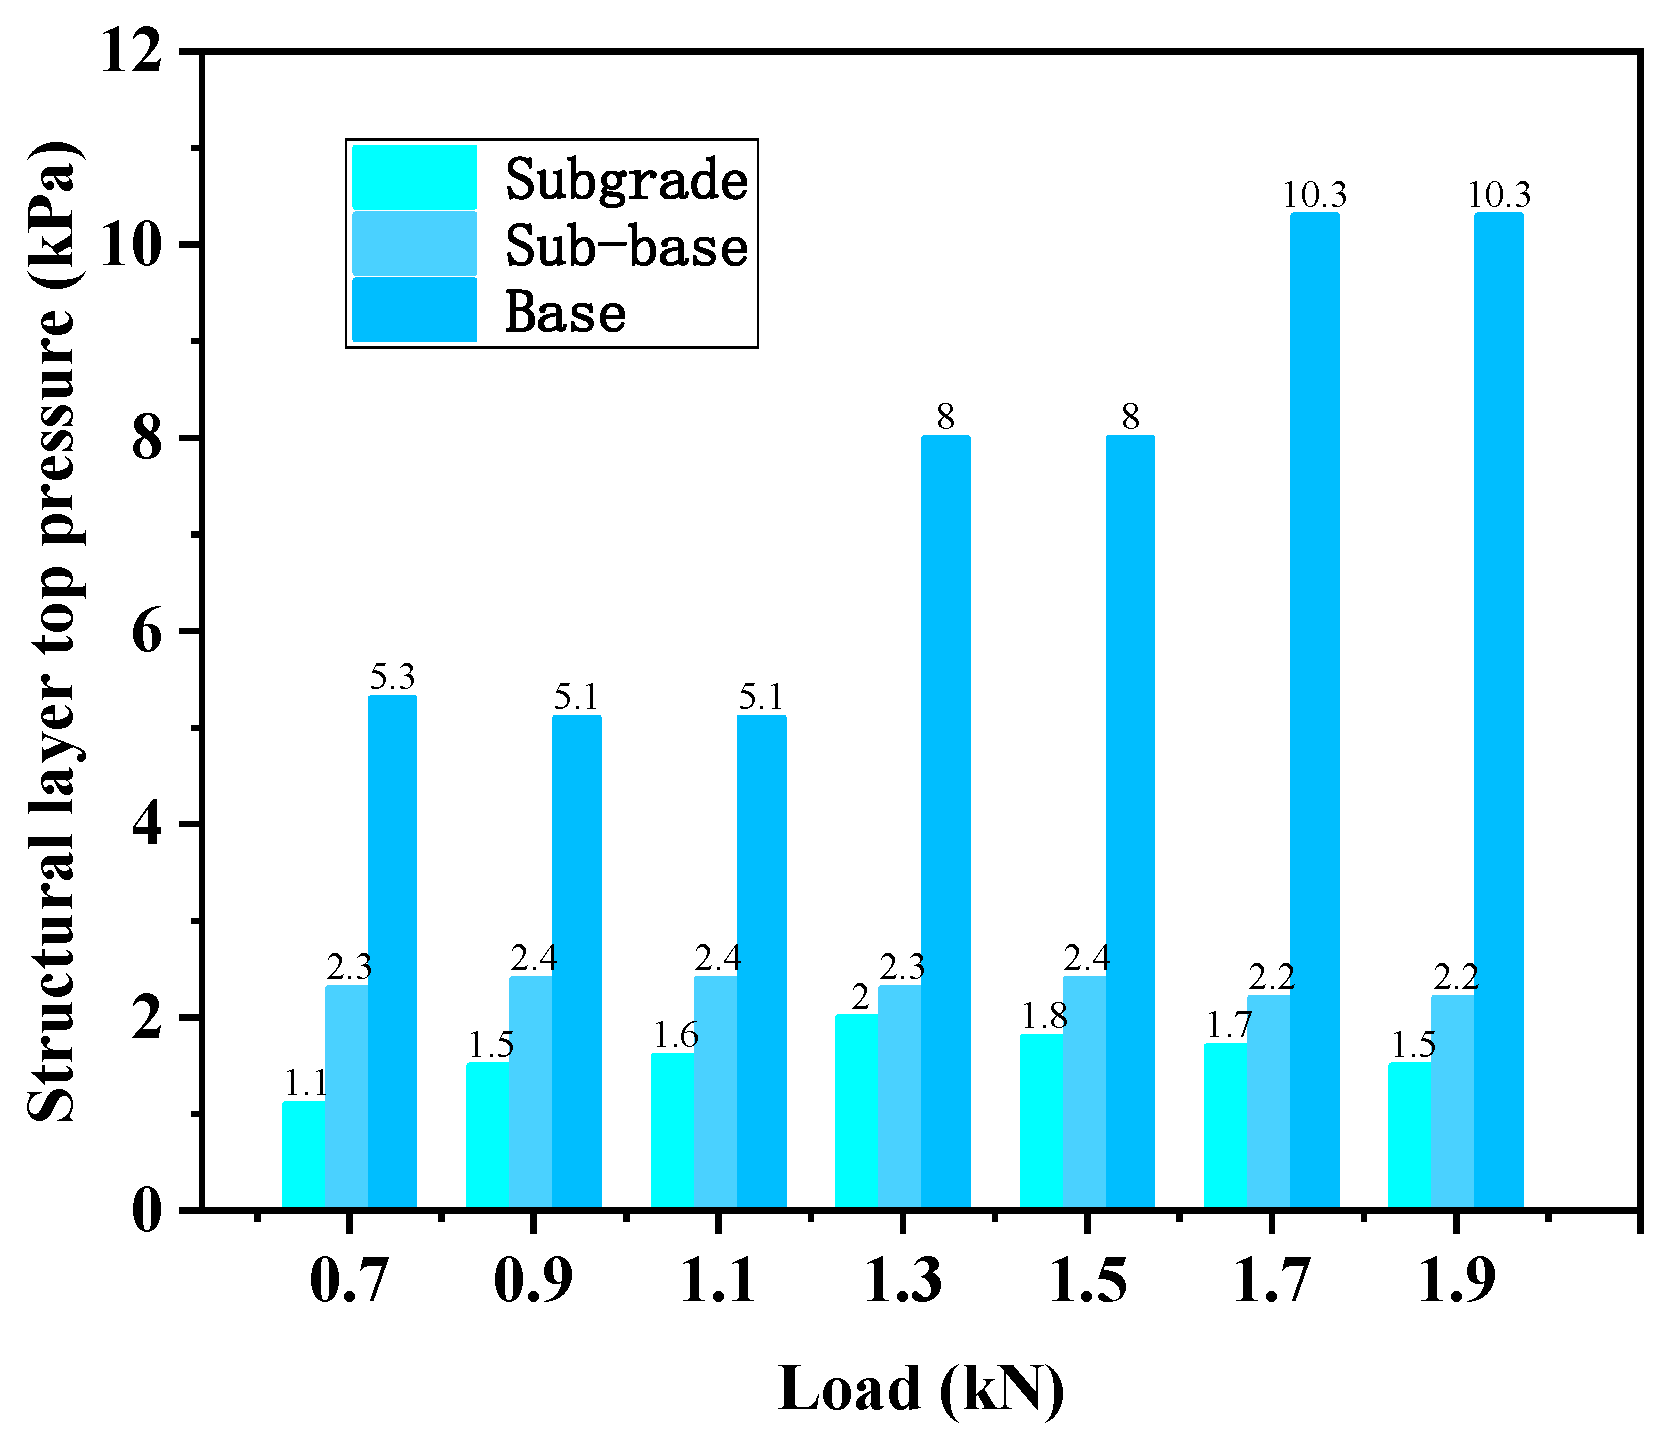
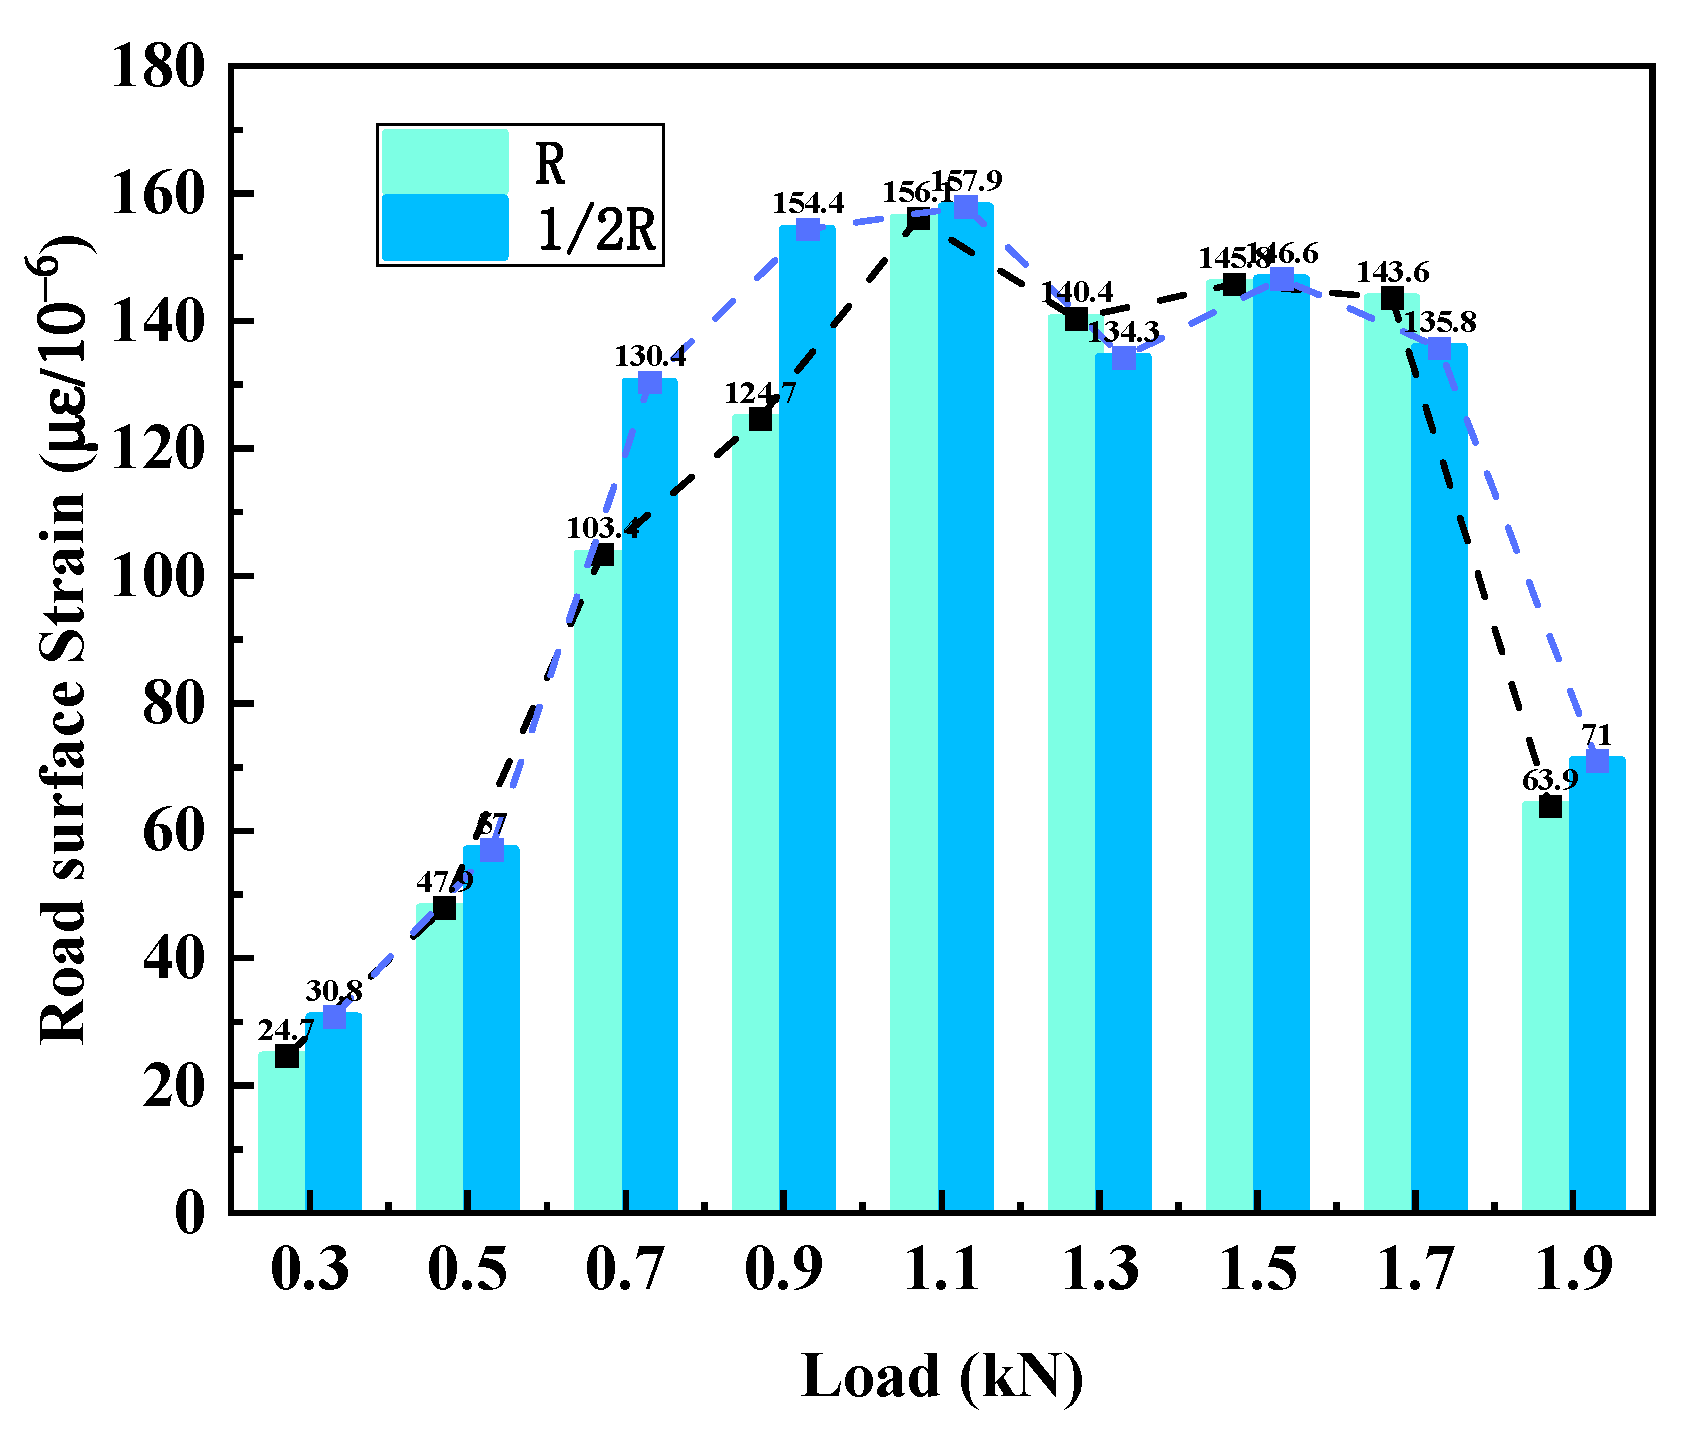
To investigate the comprehensive mechanical performance of the geocell-reinforced pavement under the combined effects of elevated temperature and static loading, the present experimental program simulated a 60 °C environmental temperature field coupled with graded static loads. During these coupled loading tests, key structural responses—including soil pressure within the pavement layers, strain responses of the surface slab, and settlement behavior—were continuously monitored and analyzed. The resulting soil pressure, slab strain, and settlement data obtained under the combined temperature and static load conditions are presented in
Figure 10,
Figure 11, and
Figure 12, respectively.
Under the coupled effects of elevated temperature and static loading, the load transfer mechanism of the geocell-reinforced pavement structure exhibited characteristics significantly different from those observed under purely static loading conditions. As shown in the test results, the soil pressure at the top of the cement-treated crushed stone base exhibited a stepwise, nonlinear increase with increasing load: when the load was increased from 0.7 kN to 1.1 kN, the soil pressure remained essentially constant; at 1.3 kN, it abruptly increased to approximately 8 kPa and remained relatively stable up to 1.5 kN; and a further increase to 1.7 kN caused soil pressure to rise again to approximately 10.3 kPa. This atypical trend can be attributed to the influence of high temperatures, which caused overall thermal expansion of the slab and slight upward bulging near the center of the slab, thereby altering the contact conditions with the underlying base layer. Under this condition, the geocell-reinforced layer and the bulged slab worked in synergy, enhancing lateral load spreading and temporarily increasing the structural load-bearing capacity in this stage, which resulted in alternating plateaus and jumps in the measured soil pressure data. The enhancement of load diffusion due to geocell confinement has been identified in previous studies as one of the principal mechanisms through which geocells improve pavement performance by developing lateral stresses on the cell walls and increasing bearing capacity.
In contrast, soil pressure measured at the interface between the graded crushed stone subbase and the soil subgrade exhibited only minor variations throughout the entire loading process and remained nearly constant. This finding suggests that, under coupled loading, the geocell reinforcement effectively mobilized its three-dimensional confinement mechanism, dissipating the majority of additional stresses within the upper structural layers and significantly reducing stress transmission to the lower layers. As a result, the overall stability and load-bearing capacity of the foundation were markedly enhanced. Previous research has similarly demonstrated that geocell confinement produces composite action between infill and cell walls, thereby reducing stress concentrations and improving stiffness and bearing performance.
The strain response of the surface slab under coupled loading was also more complex than under static loading alone. Strain measured at both the center of the slab (R) and at half-width (1/2 R) exhibited a non-monotonic trend with increasing load. Within the loading range from 0.3 kN to 1.1 kN, strain increased continuously and reached a peak at 1.1 kN, indicating that the geocell’s load diffusion effect became progressively more effective with increasing load. However, once the load exceeded 1.3 kN, the strains at both locations began to decrease. This anomalous drop in strain was not indicative of structural strengthening; rather, it suggests that the pavement structure may have entered an early stage of damage development, where the initiation and propagation of microcracks released a portion of the accumulated strain energy, leading to reduced measured strain values.
Settlement behavior also exhibited a unique response under coupled conditions: settlement peaked at a load of approximately 1.3 kN and subsequently decreased as the load increased from 1.3 kN to 1.9 kN, and the apparent rebound in settlement after 1.3 kN suggests a potential damage-initiation range rather than a definitively established damage threshold. Post-test crack observations under representative loading conditions further confirm that visible local cracking damage did occur in the slab. Therefore, this response transition is more reasonably interpreted as being associated with local damage initiation, contact-state alteration, and stress redistribution within the reinforced pavement system. Nevertheless, because continuous crack-evolution monitoring was not conducted throughout the loading history, the present evidence is still insufficient to establish a complete fracture-mechanics-based interpretation or an exact damage threshold.
3.5. Analysis of Cracks on the Underside of Concrete Pavement Slabs
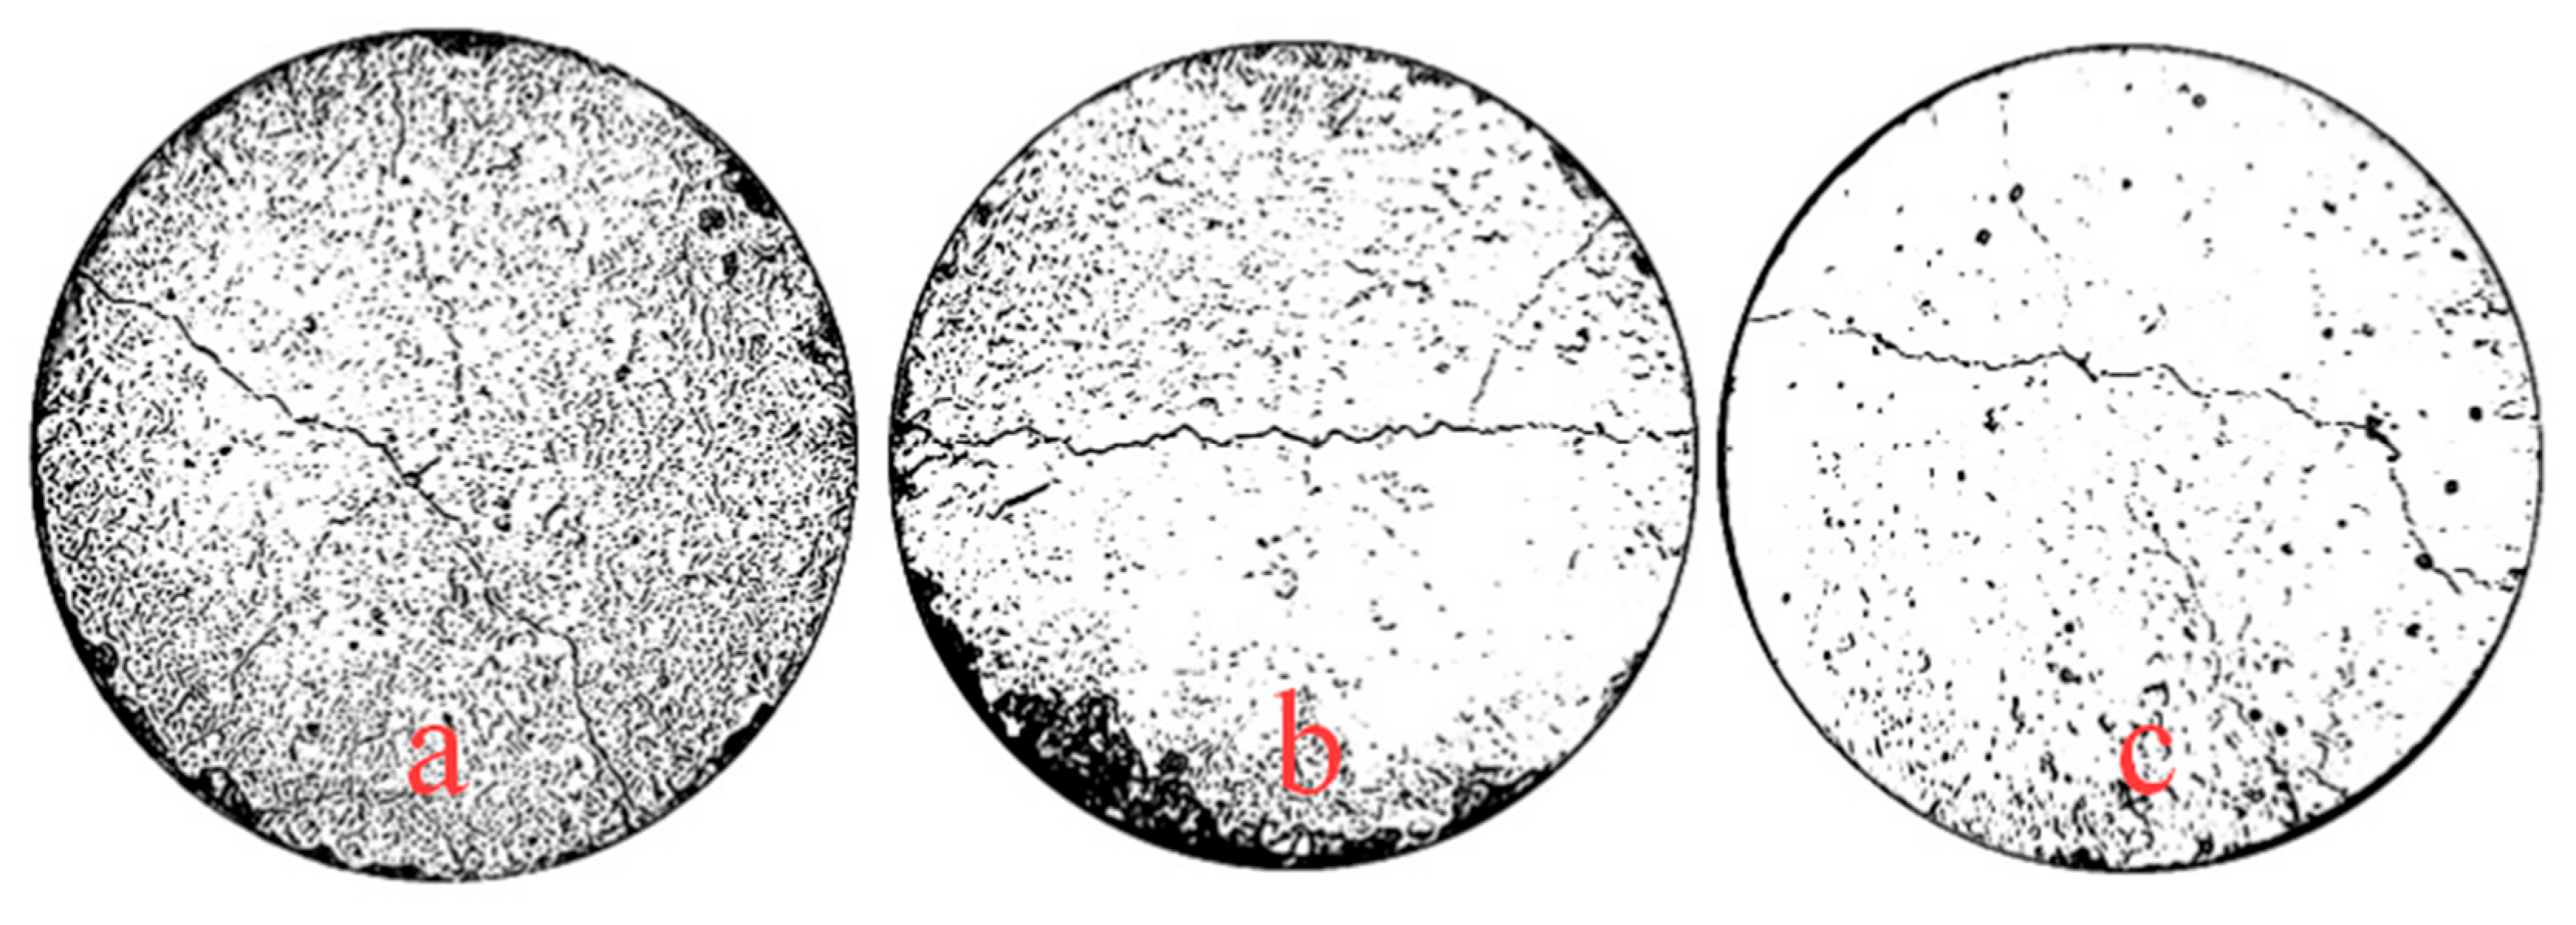
To further verify the occurrence of structural damage under representative loading conditions, post-test visual observations were conducted on the bottom surface of the concrete slab. Visible crack networks were observed after static loading, traffic loading, and coupled temperature–loading in
Figure 13. In particular, the slab bottom under the coupled condition exhibited a clearly developed major crack accompanied by localized secondary cracking, providing direct qualitative evidence that visible tensile cracking damage did occur in the slab. These post-test observations support the interpretation that the previously observed response transitions—such as the non-monotonic strain change, apparent settlement rebound, and accelerated cumulative deformation—were associated with local damage initiation and subsequent stress redistribution. At the same time, it should be noted that the present crack images are post-test macroscopic observations rather than continuous in-test crack monitoring; they support the occurrence of damage, but they are still insufficient on their own to establish the full crack-evolution path or an exact fracture-mechanics-based mechanism.
4. Finite Element Model
Although model tests can effectively capture pavement settlement, strain, and soil pressure variations, comprehensively quantifying the internal structural mechanisms—such as stress distribution beneath concrete slabs, cell–concrete interactions, and the coupled response of temperature gradients with mechanical loading—remains challenging through experimental means alone. Numerical simulation techniques overcome this limitation while also providing complementary validation for model tests. Building upon systematic observations from the aforementioned laboratory tests concerning the macroscopic mechanical response of geocell-reinforced pavements under temperature-load coupling, this study established a thermo-mechanical coupled numerical model to further elucidate the underlying mechanical mechanisms and stress transfer patterns.
4.1. Model Establishment
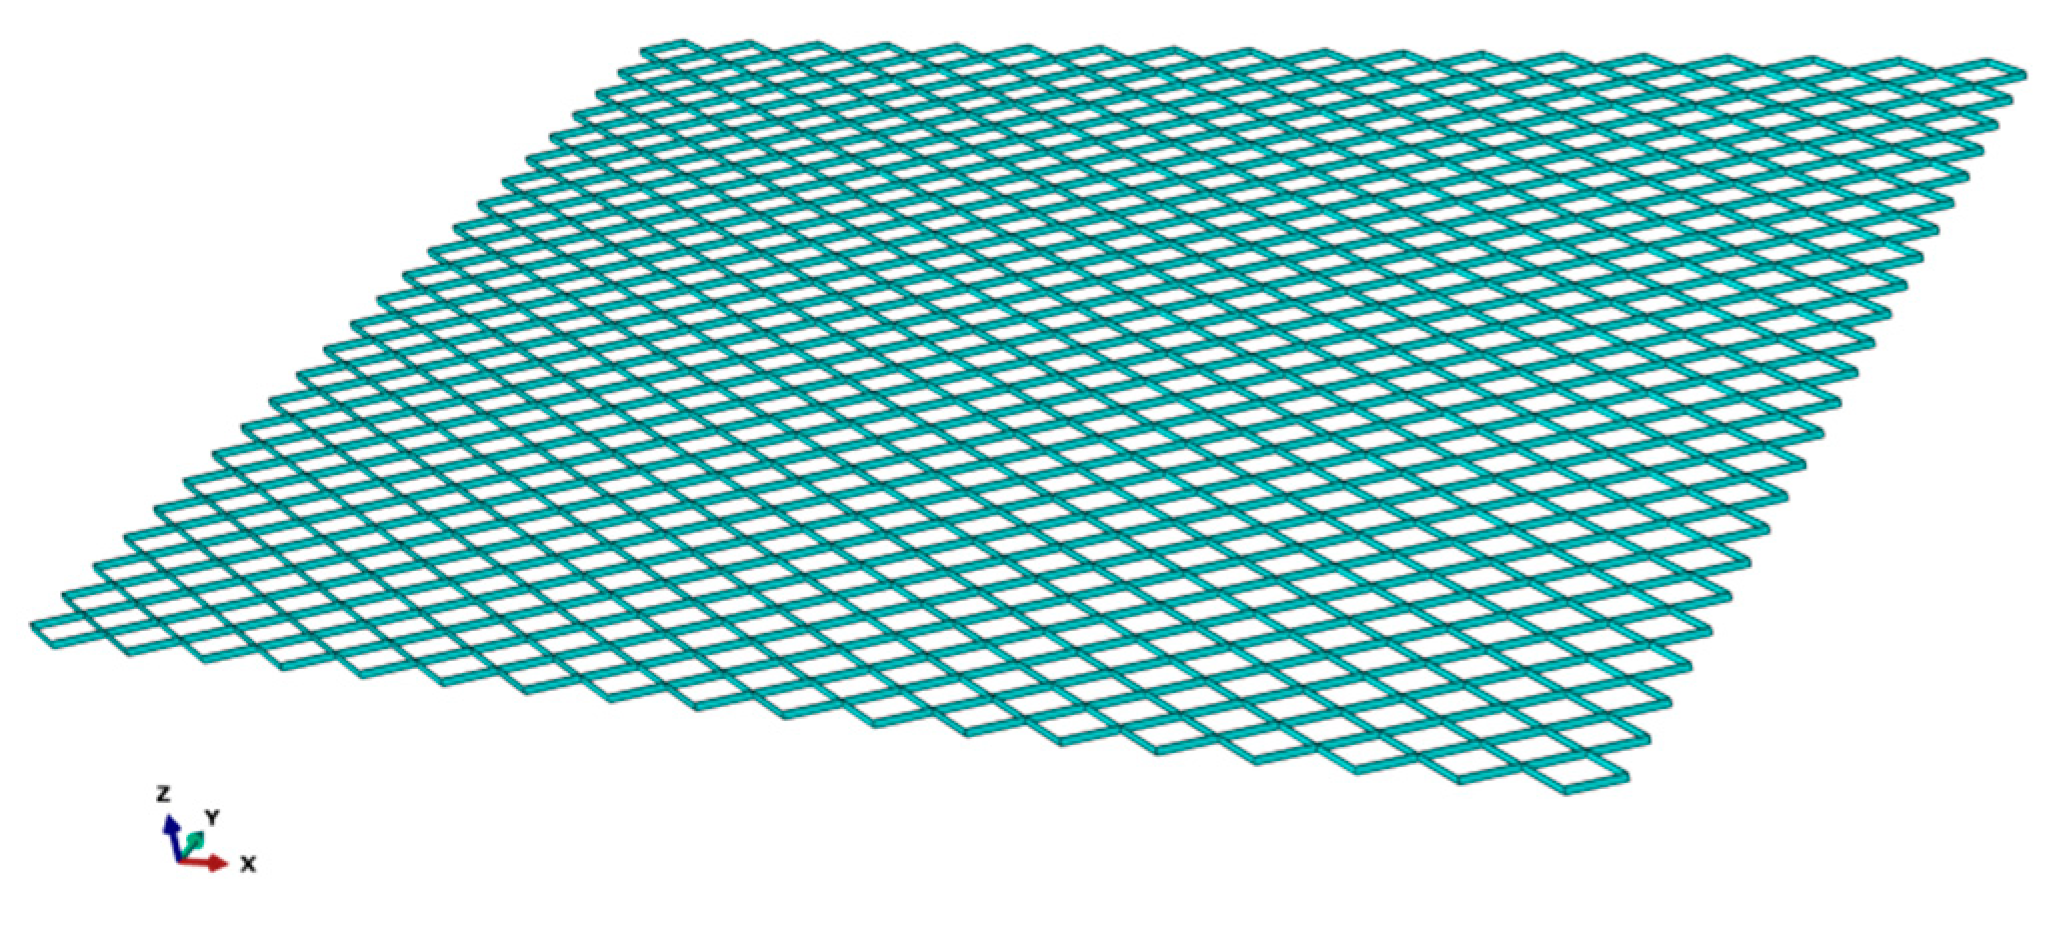
Based on the parameters obtained from the laboratory model tests, a three-dimensional finite element model was developed using the commercial software Abaqus CAE (2022) to simulate the thermo-mechanical response of the geocell-reinforced pavement. The primary concrete surface slab in the model had dimensions of 5.0 m × 4.0 m, while the overall computational domain was defined as 10.0 m × 8.0 m × 2.01 m to minimize the influence of boundary effects and ensure accurate stress and deformation predictions across the structural layers.
In order to conduct comparative analyses, a conventional cement concrete pavement model without geocell reinforcement was also constructed as a control case. This control model incorporated equivalent load transfer bars and tie rods to provide a baseline structural configuration for evaluating the reinforcement effects.
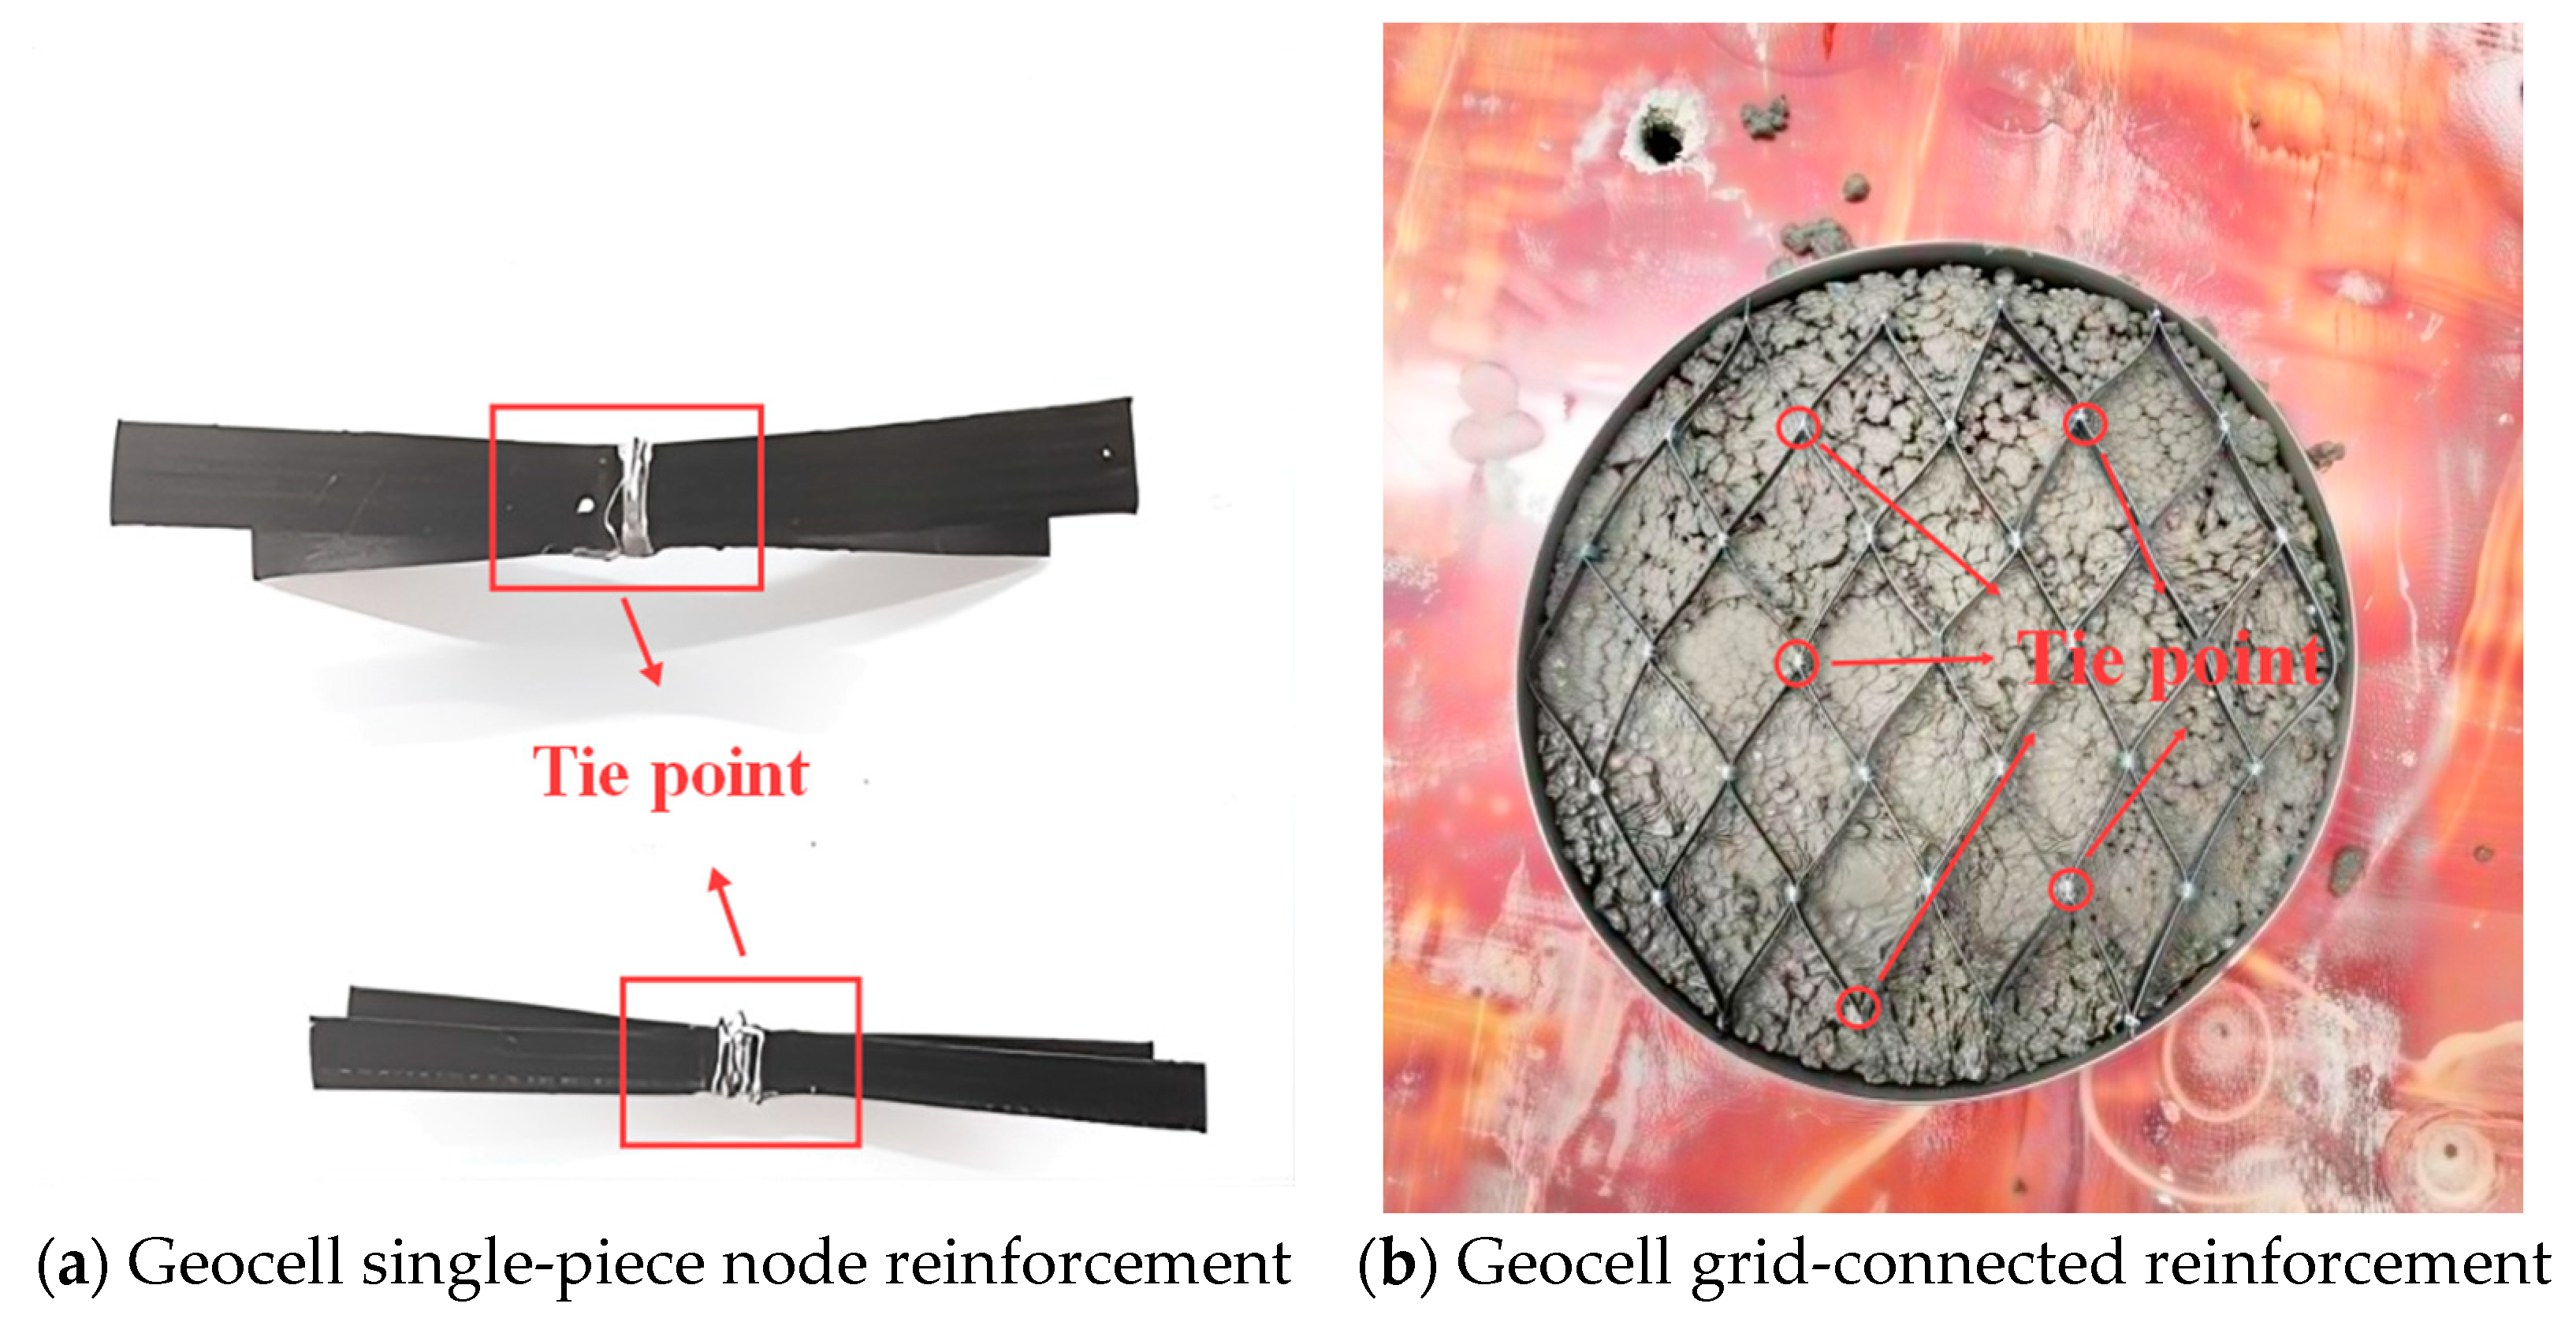
The geocell walls were modeled using membrane elements with continuous connectivity, such that the joints between adjacent cell walls were represented by an equivalent continuous connection rather than by explicitly modeling each discrete weld. The dowel bars were modeled using embedded-region contact with constraints. While this treatment cannot fully reproduce all local dowel–concrete interface effects, it is sufficient for comparative analysis of the global pavement response under the present loading conditions.
Following the finite element modeling approach proposed by [
23] for incompressible geocell representation, the three-dimensional geocell elements in this study were defined as incompressible materials. Each structural layer’s thickness and the corresponding mechanical properties of the materials used in the numerical model are summarized in
Table 5. The thermal conductivity and specific heat values adopted in
Table 5 for the concrete slab, cement-stabilized crushed stone base, graded crushed stone subbase, and soil subgrade were selected with reference to published finite element studies on pavement temperature fields and thermo-mechanical response [
23,
30] and were further checked for consistency with the observed response trends in the present study.
4.2. Constitutive Model and Boundary Conditions
Based on the aforementioned experimental observations, it was found that the reinforcing effect of the geocell became particularly pronounced when the concrete layer entered the plastic deformation regime. Therefore, in the finite element model, the cement concrete was assigned a plastic damage constitutive model to capture its inelastic behavior, whereas the remaining foundation materials (e.g., base, subbase, and subgrade) were characterized using the classical Mohr–Coulomb elastoplastic model.
The key plasticity parameters, including the dilation angle, eccentricity, fb0/fc0, Kc, and viscosity parameter, are summarized in
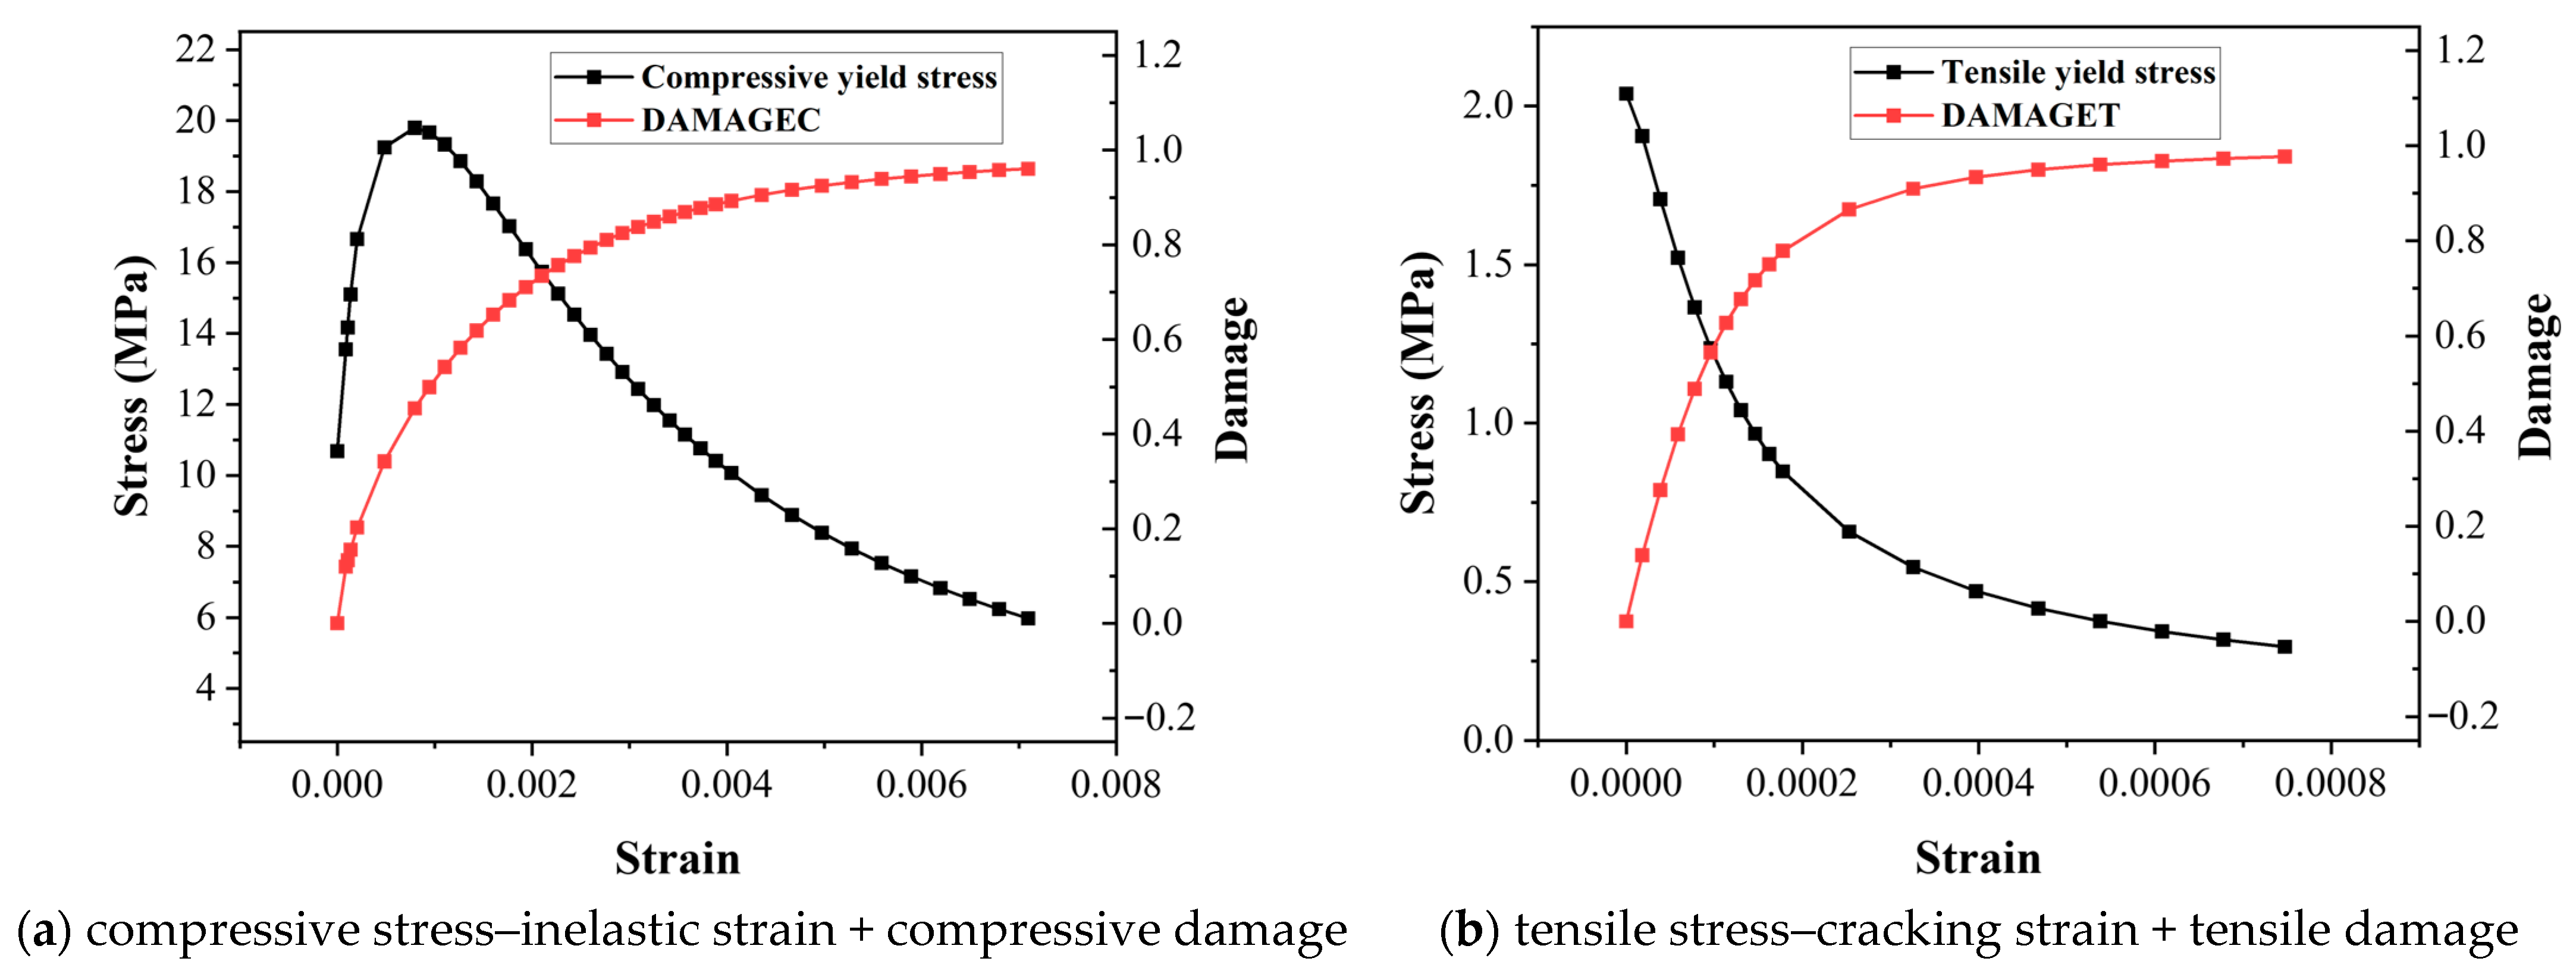
Table 6. The compressive stress–inelastic strain relation, tensile stress–cracking strain relation, and the corresponding compressive and tensile damage evolutions were established according to GB 50010-2010 [
31] and converted into the ABAQUS input format. For clarity, the constitutive input curves are plotted in
Figure 14.
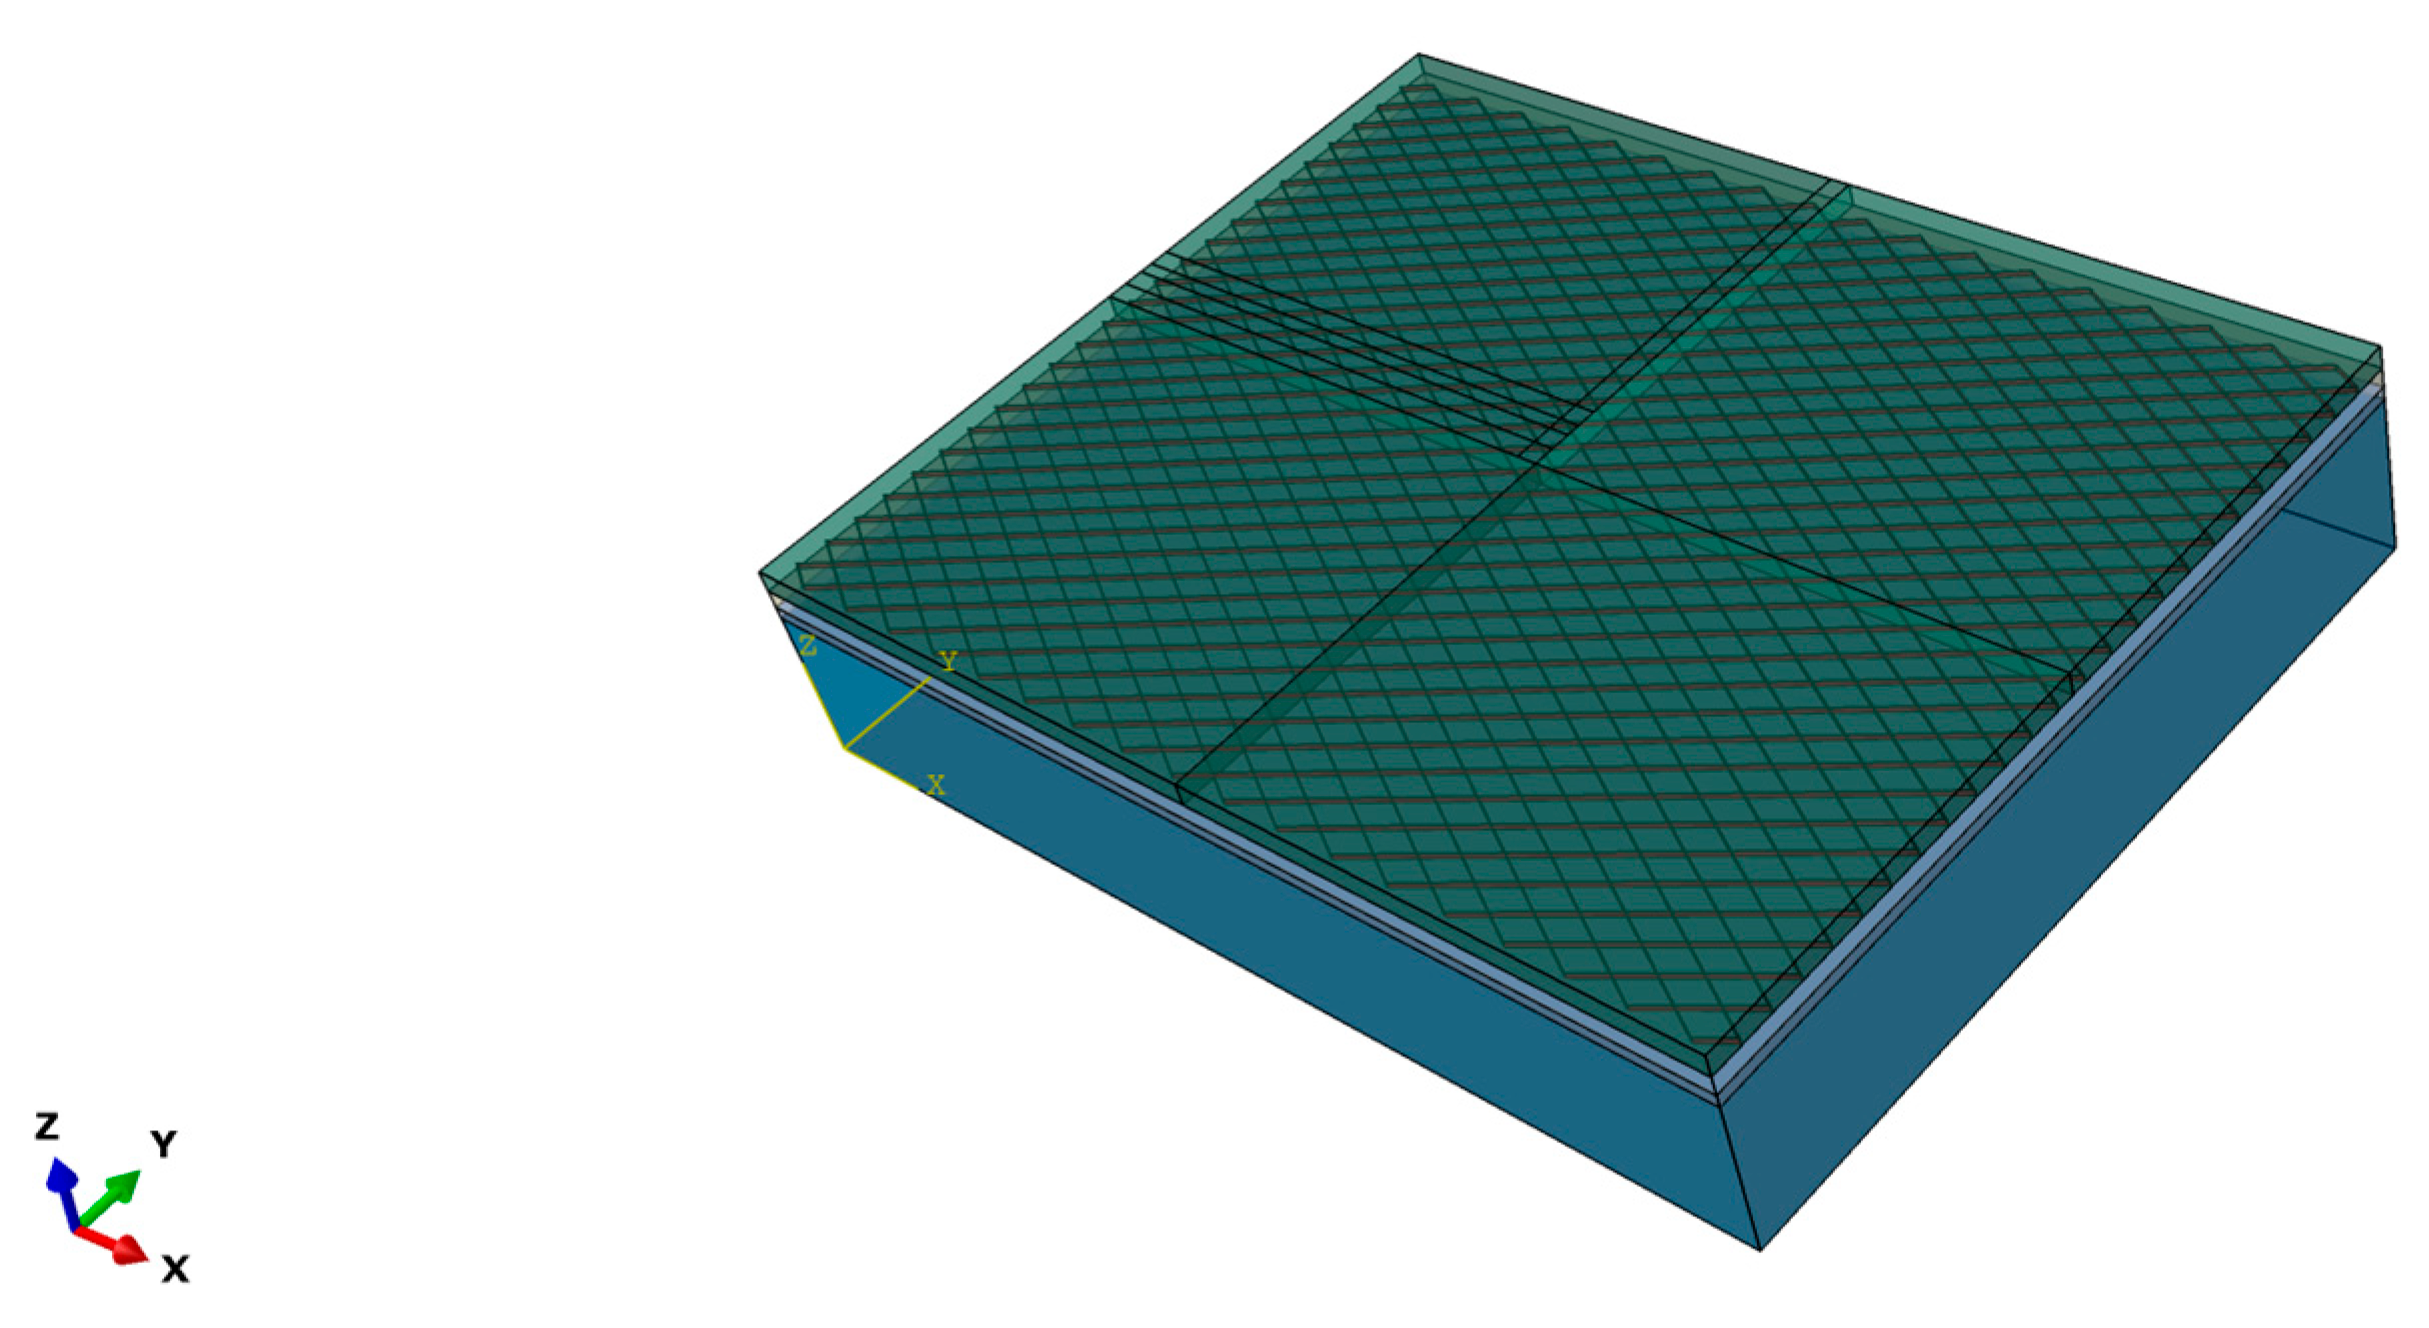
The boundary conditions of the numerical model were defined such that the bottom of the soil subgrade was fully constrained to prevent displacement, while lateral displacement constraints were applied to the concrete surface course, base, subbase, and subgrade layers, allowing only vertical movement. To replicate the coupled thermo-mechanical behavior of the pavement structure under extreme conditions, a steady-state temperature field of 60 °C and a static load equivalent to a 7 MPa wheel load were applied to the longitudinal joint region of the first concrete slab (as indicated in
Figure 15). This setup enables the three-dimensional mechanical response of the pavement system under combined high-temperature and heavy-load conditions to be reproduced numerically. The finite element model configurations are illustrated in
Figure 15 and
Figure 16.
4.3. Mesh Sensitivity Analysis
To verify the reliability of the finite element results and to determine an appropriate mesh density for subsequent analyses, a mesh sensitivity analysis was conducted for the concrete slab discretized by C3D8R elements. Three mesh sizes, namely 10 mm, 15 mm, and 20 mm, were considered under the same representative loading condition, while all other model parameters, including geometry, material properties, boundary conditions, and loading position, were kept unchanged. The maximum vertical displacement, maximum vertical stress, maximum equivalent plastic strain (PEEQ), and maximum damage parameter (DAMAGET) were selected as the evaluation indices.
The results are summarized in
Table 7. As the mesh was refined from 20 mm to 15 mm, the maximum displacement increased slightly from 2.536 mm to 2.601 mm, corresponding to a relative difference of about 2.6%, indicating that the displacement response was relatively stable. However, the maximum vertical stress increased from 1.046 MPa to 1.333 MPa, and the maximum PEEQ increased from 7.2 × 10
−5 to 1.18 × 10
−4, suggesting that the stress and local damage-related responses were more sensitive to mesh refinement than the displacement response. The maximum DAMAGET remained unchanged at 0.977 for both mesh sizes.
When the mesh was further refined to 10 mm, the maximum displacement, maximum vertical stress, maximum PEEQ, and maximum DAMAGET were 2.627 mm, 1.384 MPa, 1.271 × 10⁻⁴, and 0.977, respectively. Compared with the 15 mm mesh, the relative differences were 0.99%, 3.8%, and 7.8%. These results indicate that the variation between the 10 mm and 15 mm meshes was significantly smaller than that between the 20 mm and 15 mm meshes, demonstrating that the numerical results tended to converge as the mesh was refined.
Considering both computational accuracy and efficiency, the 15 mm mesh was selected for the subsequent simulations. Compared with the finer 10 mm mesh, the 15 mm mesh provided sufficiently close results for the key response indices while requiring a lower computational cost. Therefore, the selected mesh was considered appropriate for the present study.
4.4. Model Validation
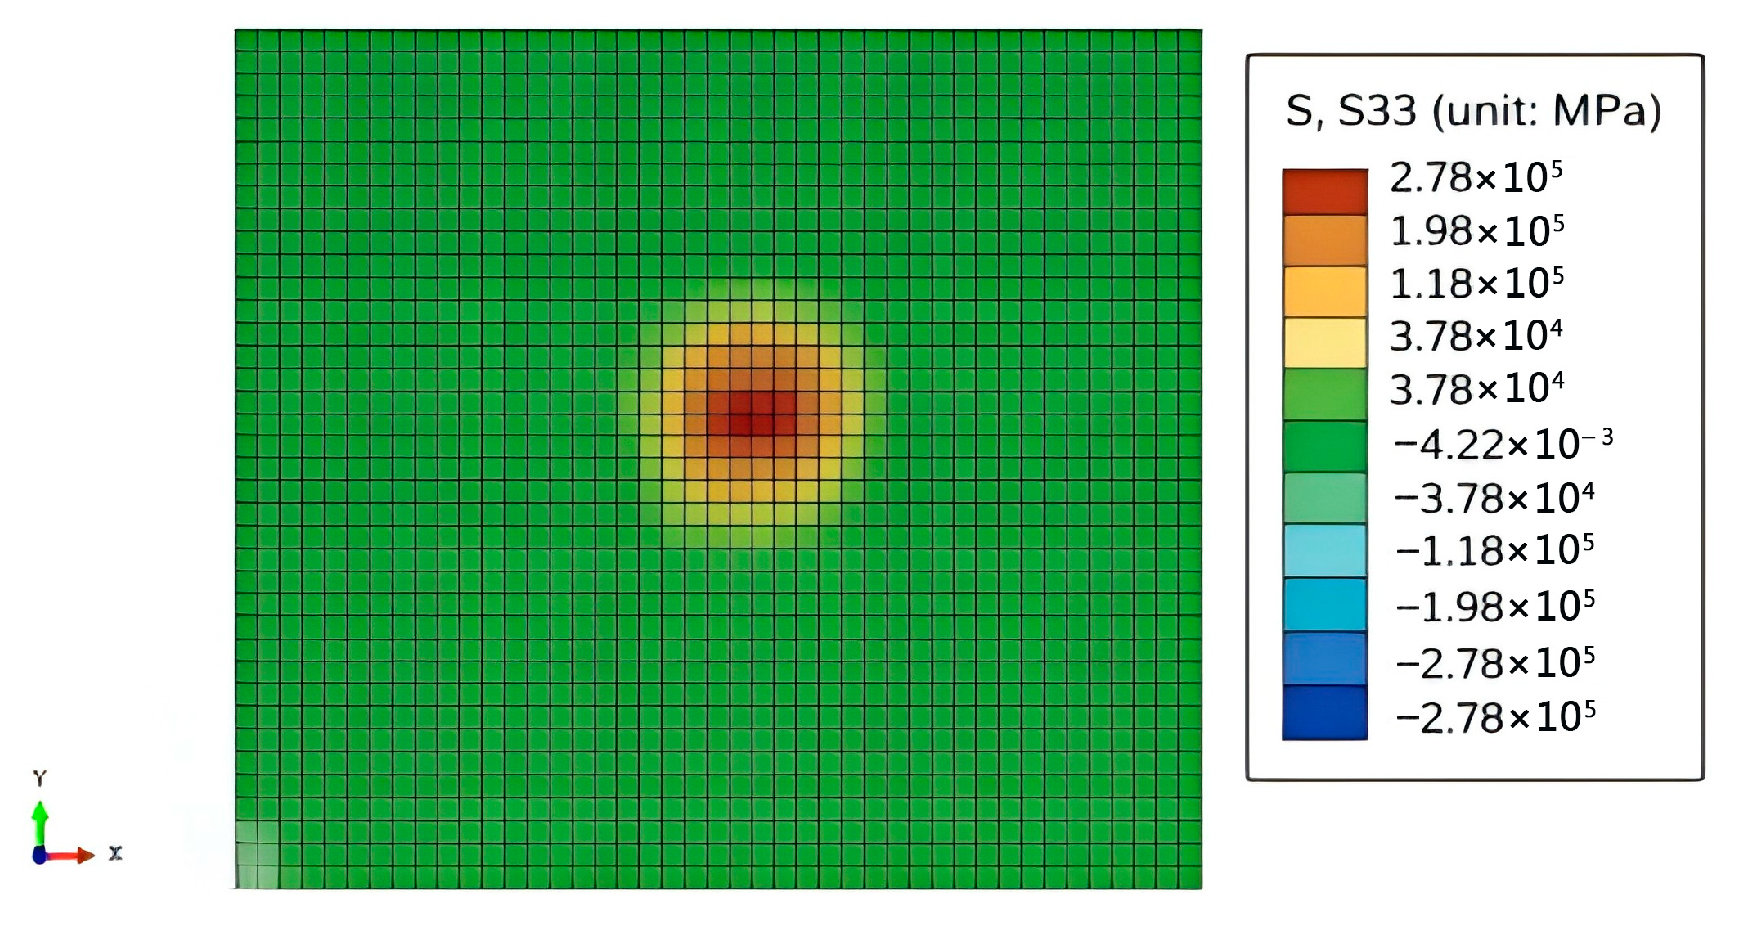
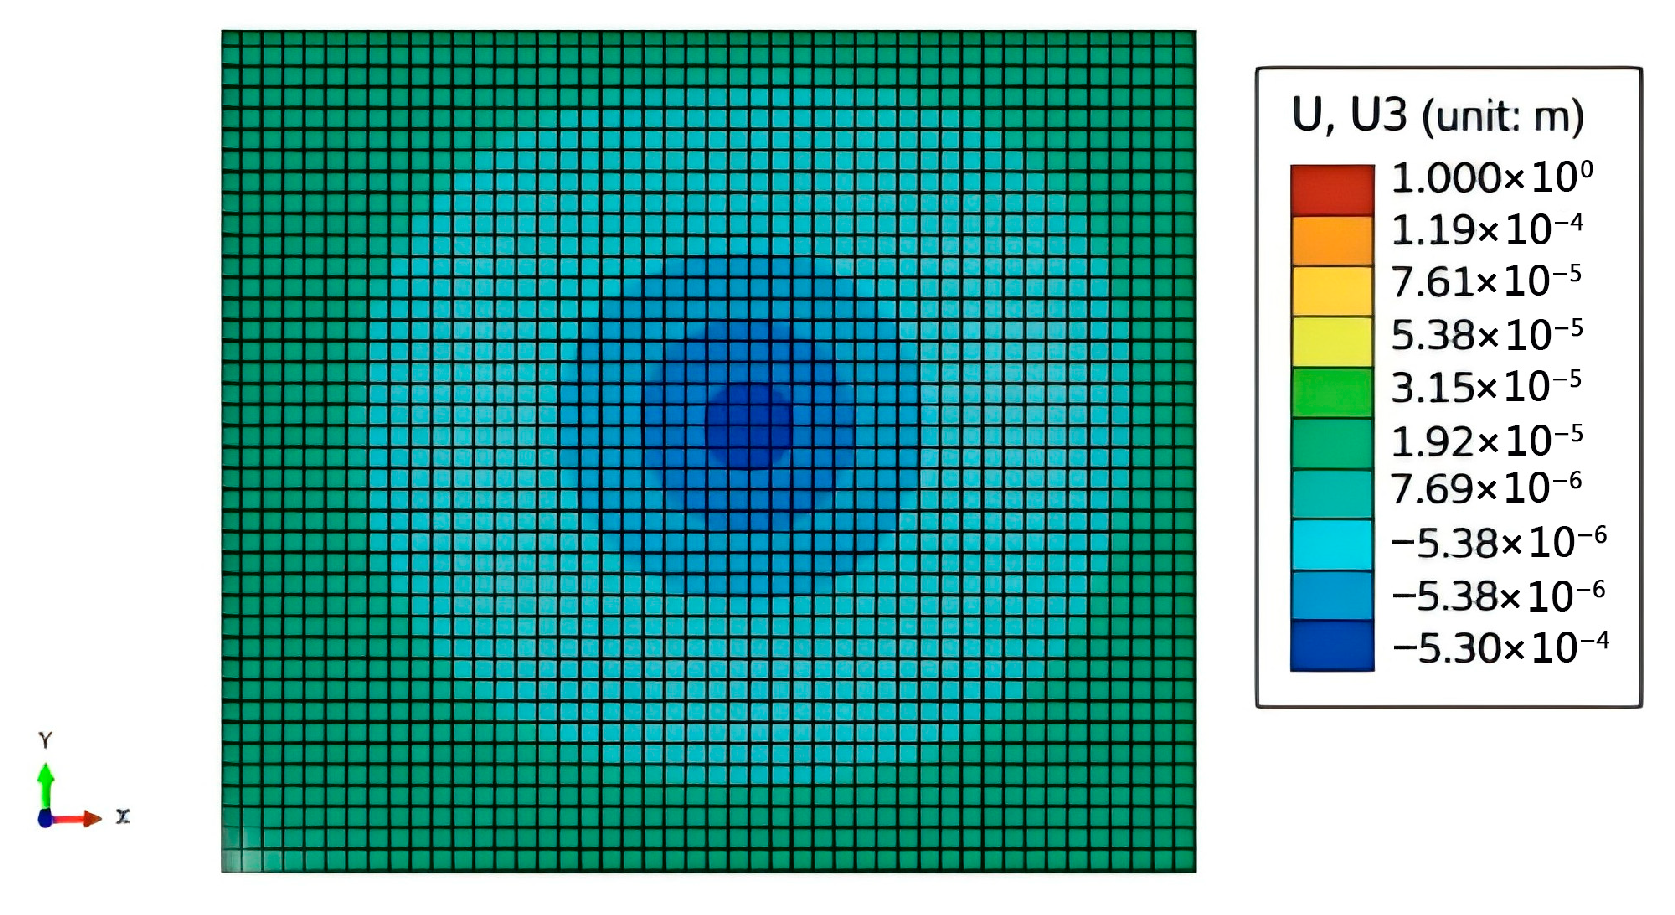
The settlement and peak tensile stress responses of the pavement slab under Loading Condition 4 were analyzed using the finite element model.
Figure 17 and
Figure 18 present the displacement and stress contour plots obtained from the numerical simulations, respectively, while
Table 8 summarizes a comparison between the finite element results and the corresponding measurements from the physical model tests.
As shown in
Table 8, the relative errors between the numerical and experimental results fall within acceptable engineering ranges, indicating satisfactory agreement between the finite element simulations and the laboratory observations. Moreover, both the magnitude and trend of the settlement and stress responses predicted by the numerical model are consistent with those recorded in the model tests. This consistency confirms the reliability of the finite element model in capturing the overall mechanical behavior of the reinforced pavement system under the specified loading conditions and supports its use for further analysis of internal structural responses.
Therefore, the validated numerical model can be reliably employed to investigate internal phenomena that are difficult to measure experimentally—such as stress distribution at the bottom of the concrete slab, interaction mechanisms between the geocell reinforcement and surrounding soil, and the complex coupled field arising from temperature gradients and mechanical loads. Such numerical analyses provide deeper insight into the internal load transfer mechanisms and structural responses beyond what can be directly observed from physical tests alone.
4.5. Performance Analysis of Reinforced Structures with Different Cell Heights
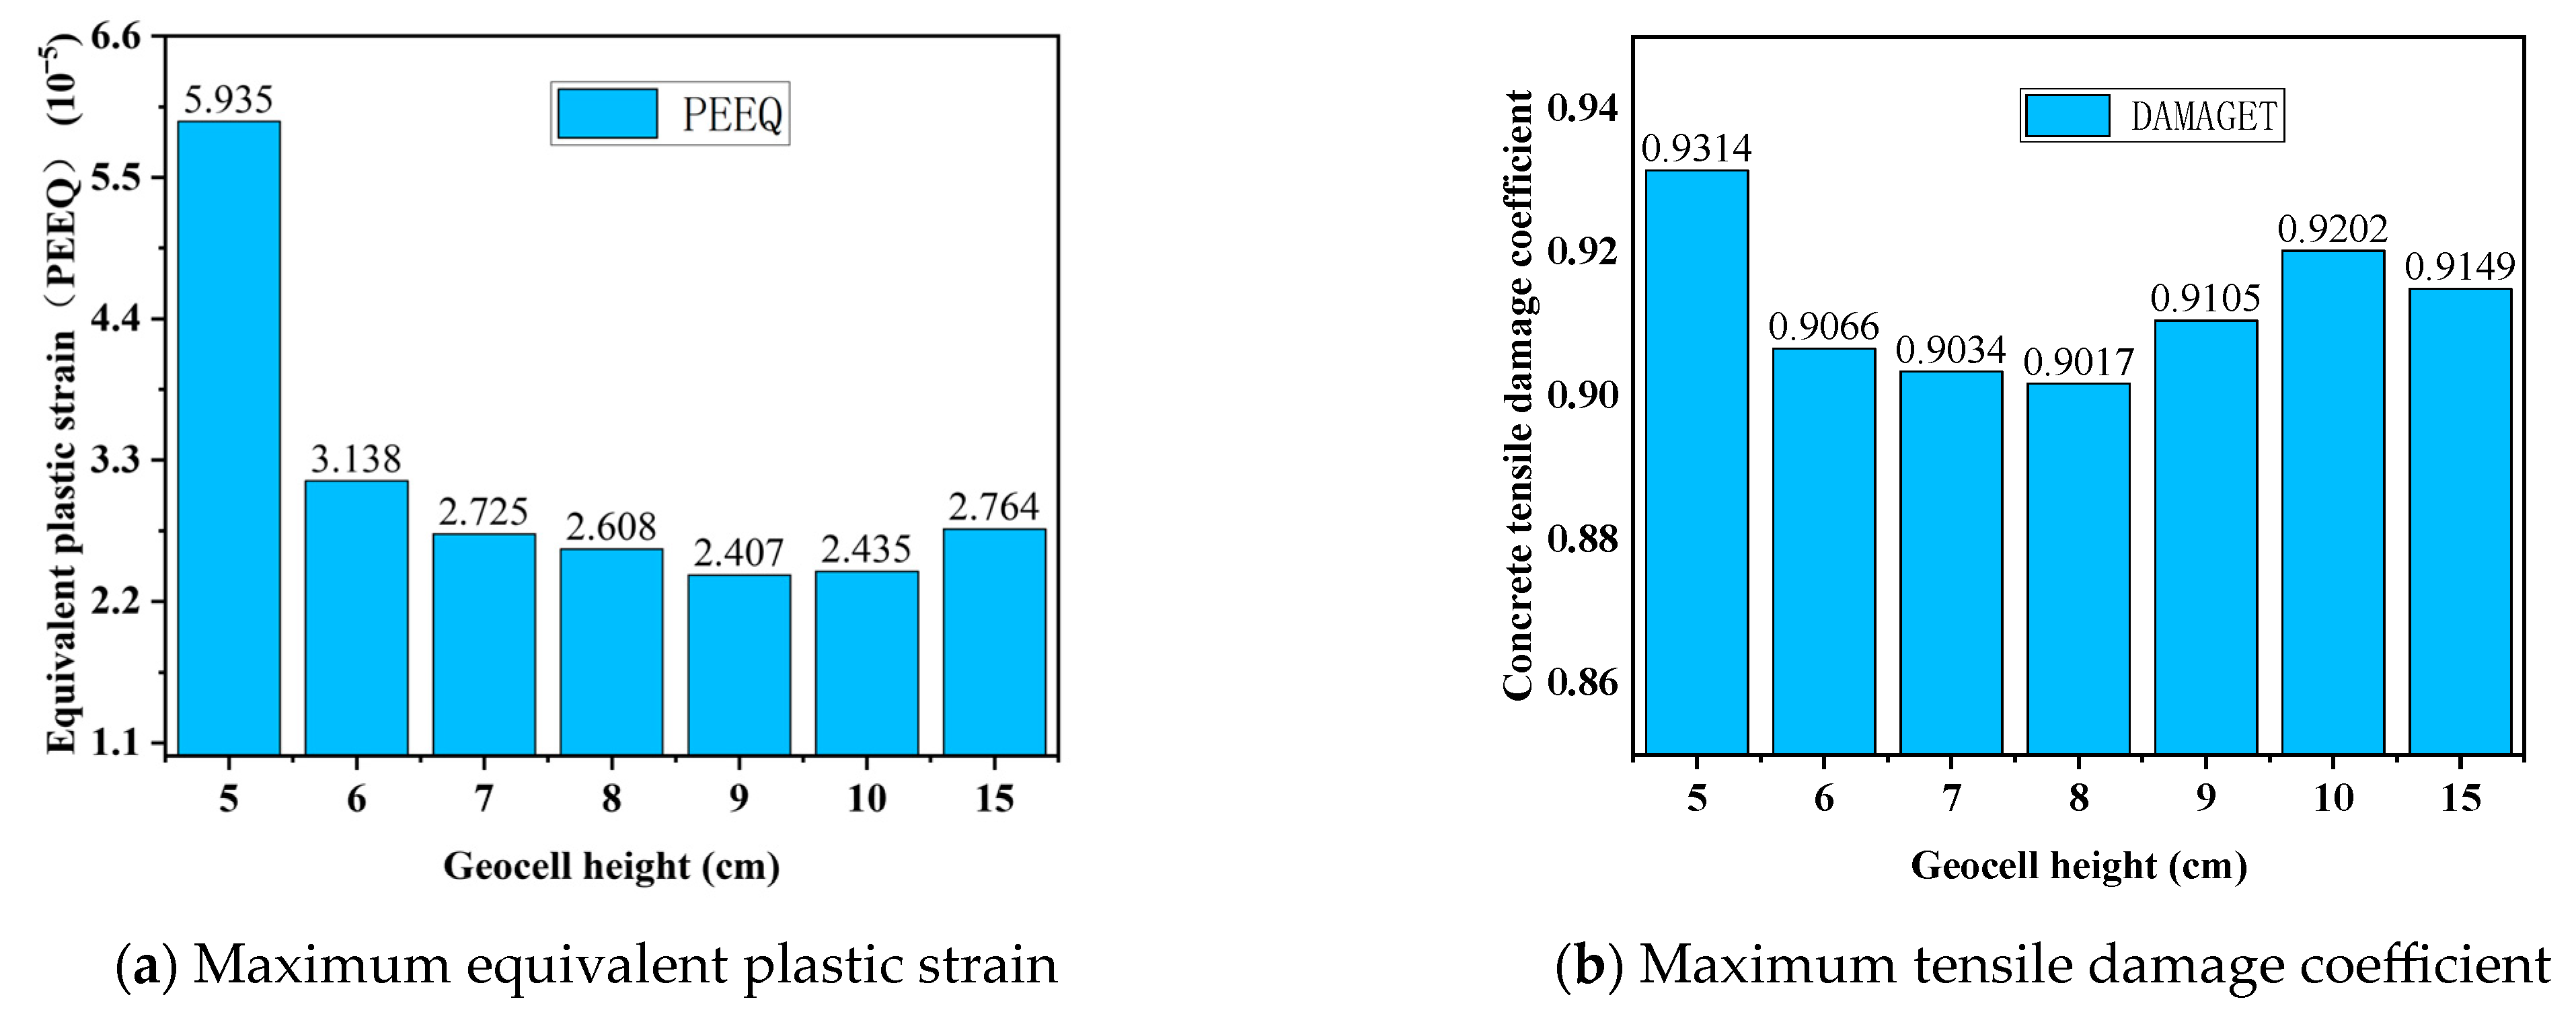
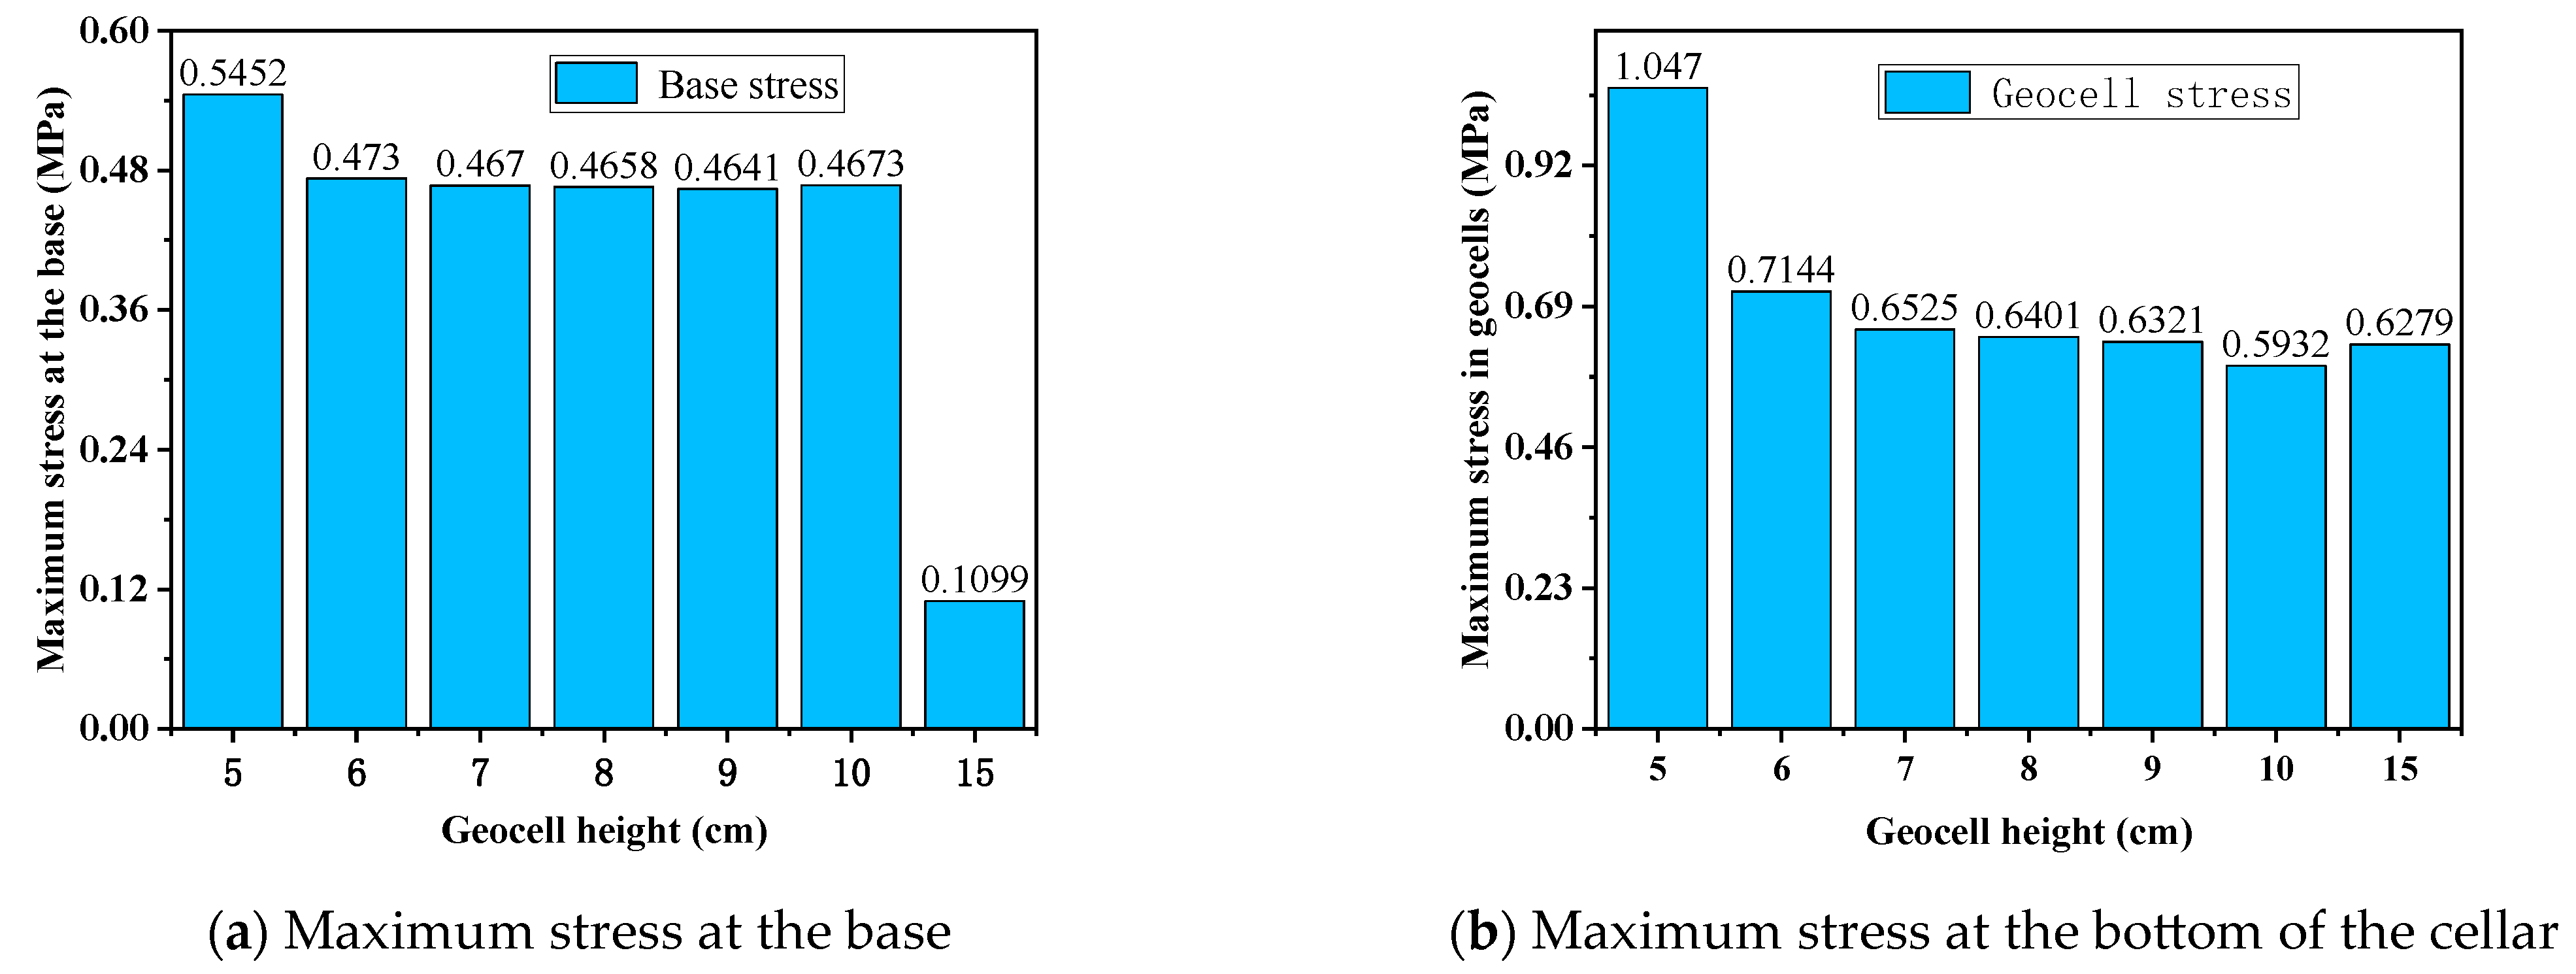
To quantify the effect of geocell height and identify the optimal combination of reinforcement parameters, a parametric analysis was conducted on the geocell height (H) while keeping the cell spacing (L) constant at 32 cm. The selected geocell heights were H = 5 cm, 6 cm, 7 cm, 8 cm, 9 cm, 10 cm, and 15 cm. Key response metrics relevant to rigid pavement design—namely, the equivalent plastic strain (PEEQ) of the concrete slab, the maximum damage coefficient (DAMAGET), the maximum stress at the base of the base course, and the maximum stress within the geocell material—were used to comprehensively evaluate the performance of each configuration, as shown in
Figure 19 and
Figure 20.
The results indicate that, for a fixed cell spacing (L = 32 cm), increasing the geocell height from 5 cm to 9 cm leads to a continuous reduction in PEEQ, which decreases from 5.935 × 10⁻⁵ at H = 5 cm to 2.407 × 10⁻⁵ at H = 9 cm, indicating that the geocell layer becomes increasingly effective in mitigating irreversible deformation within this range. A similar but not identical trend is observed for DAMAGET, which decreases from 0.9314 at H = 5 cm to a minimum of 0.9017 at H = 8 cm and then increases to 0.9105 at H = 9 cm, 0.9202 at H = 10 cm, and 0.9149 at H = 15 cm. This indicates that, in terms of tensile damage mitigation in the concrete slab, the most favorable response is achieved at H = 8 cm rather than at the maximum geocell height. Meanwhile, the maximum stress at the base course decreases from 0.5452 MPa at H = 5 cm to 0.4641 MPa at H = 9 cm, with only minor fluctuations at H = 7–10 cm, suggesting that increasing geocell height generally enhances the overall stiffness of the pavement system and reduces stress transmission to the supporting layers. Although the minimum base stress is observed at H = 15 cm (0.1099 MPa), this reduction does not coincide with improved damage control in the concrete slab.
The maximum stress within the geocell layer also decreases markedly as H increases, from 1.047 MPa at H = 5 cm to a minimum of 0.5932 MPa at H = 10 cm, before increasing slightly to 0.6279 MPa at H = 15 cm. This indicates that taller geocells generally provide stronger stress-diffusion capability within the reinforcement layer itself. However, this advantage does not directly translate into improved damage control in the concrete slab, because both PEEQ and DAMAGET cease to improve once the geocell height exceeds the moderate range. Therefore, the optimum geocell height depends on the response parameter considered: H = 9 cm gives the minimum PEEQ, H = 8 cm gives the minimum DAMAGET, H = 15 cm gives the minimum base stress, and H = 10 cm gives the minimum geocell stress. This indicates that no single height simultaneously optimizes all response indices. Considering the combined control of plastic deformation, tensile damage, support-layer stress, and engineering practicality, the recommended geocell height should be selected within the moderate range of approximately 7–9 cm, rather than being determined solely by the minimum value of any single parameter.
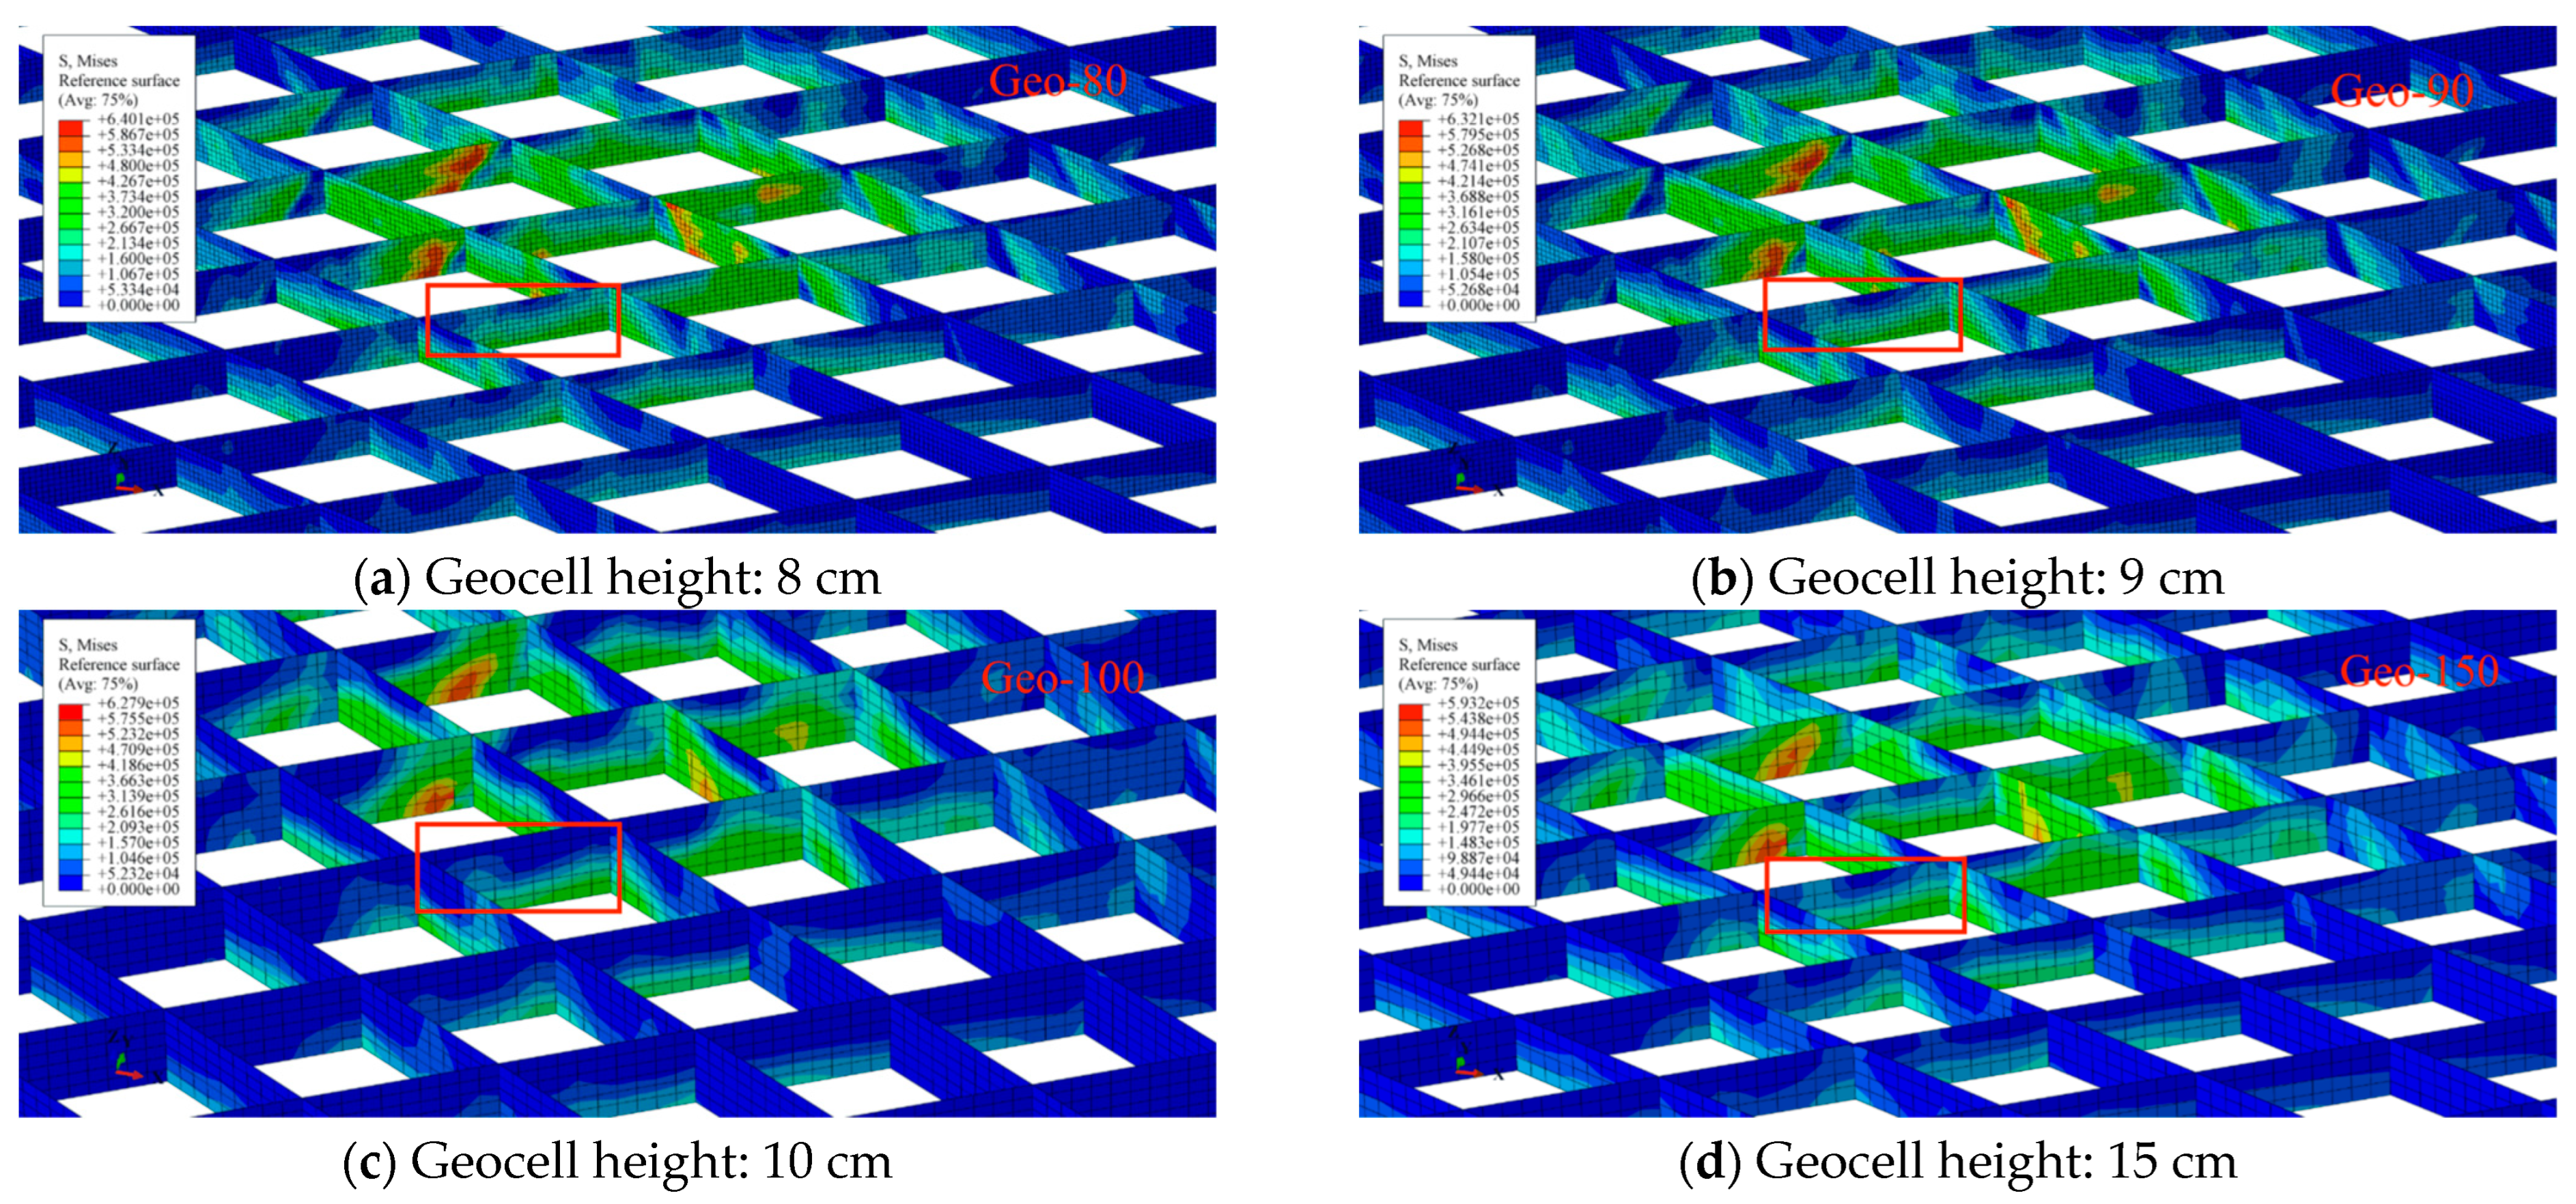
To elucidate the influence of geocell height on the stress mechanisms of the concrete pavement and to identify the optimal height range, stress contour plots in the load action zone were extracted for four representative heights—H = 8 cm, 9 cm, 10 cm, and 15 cm—as presented in
Figure 21. The results demonstrate that, as H increases, the “effective stress diffusion range” along the cell height direction progressively narrows, while the low-stress (near zero) region expands. The principal load-bearing and stress-diffusion zones tend to concentrate toward the lower portion of the geocell and spatially correspond to the tensile region of the concrete surface course. This suggests that the primary reinforcement action of the geocell occurs in the slab’s tensile zone.
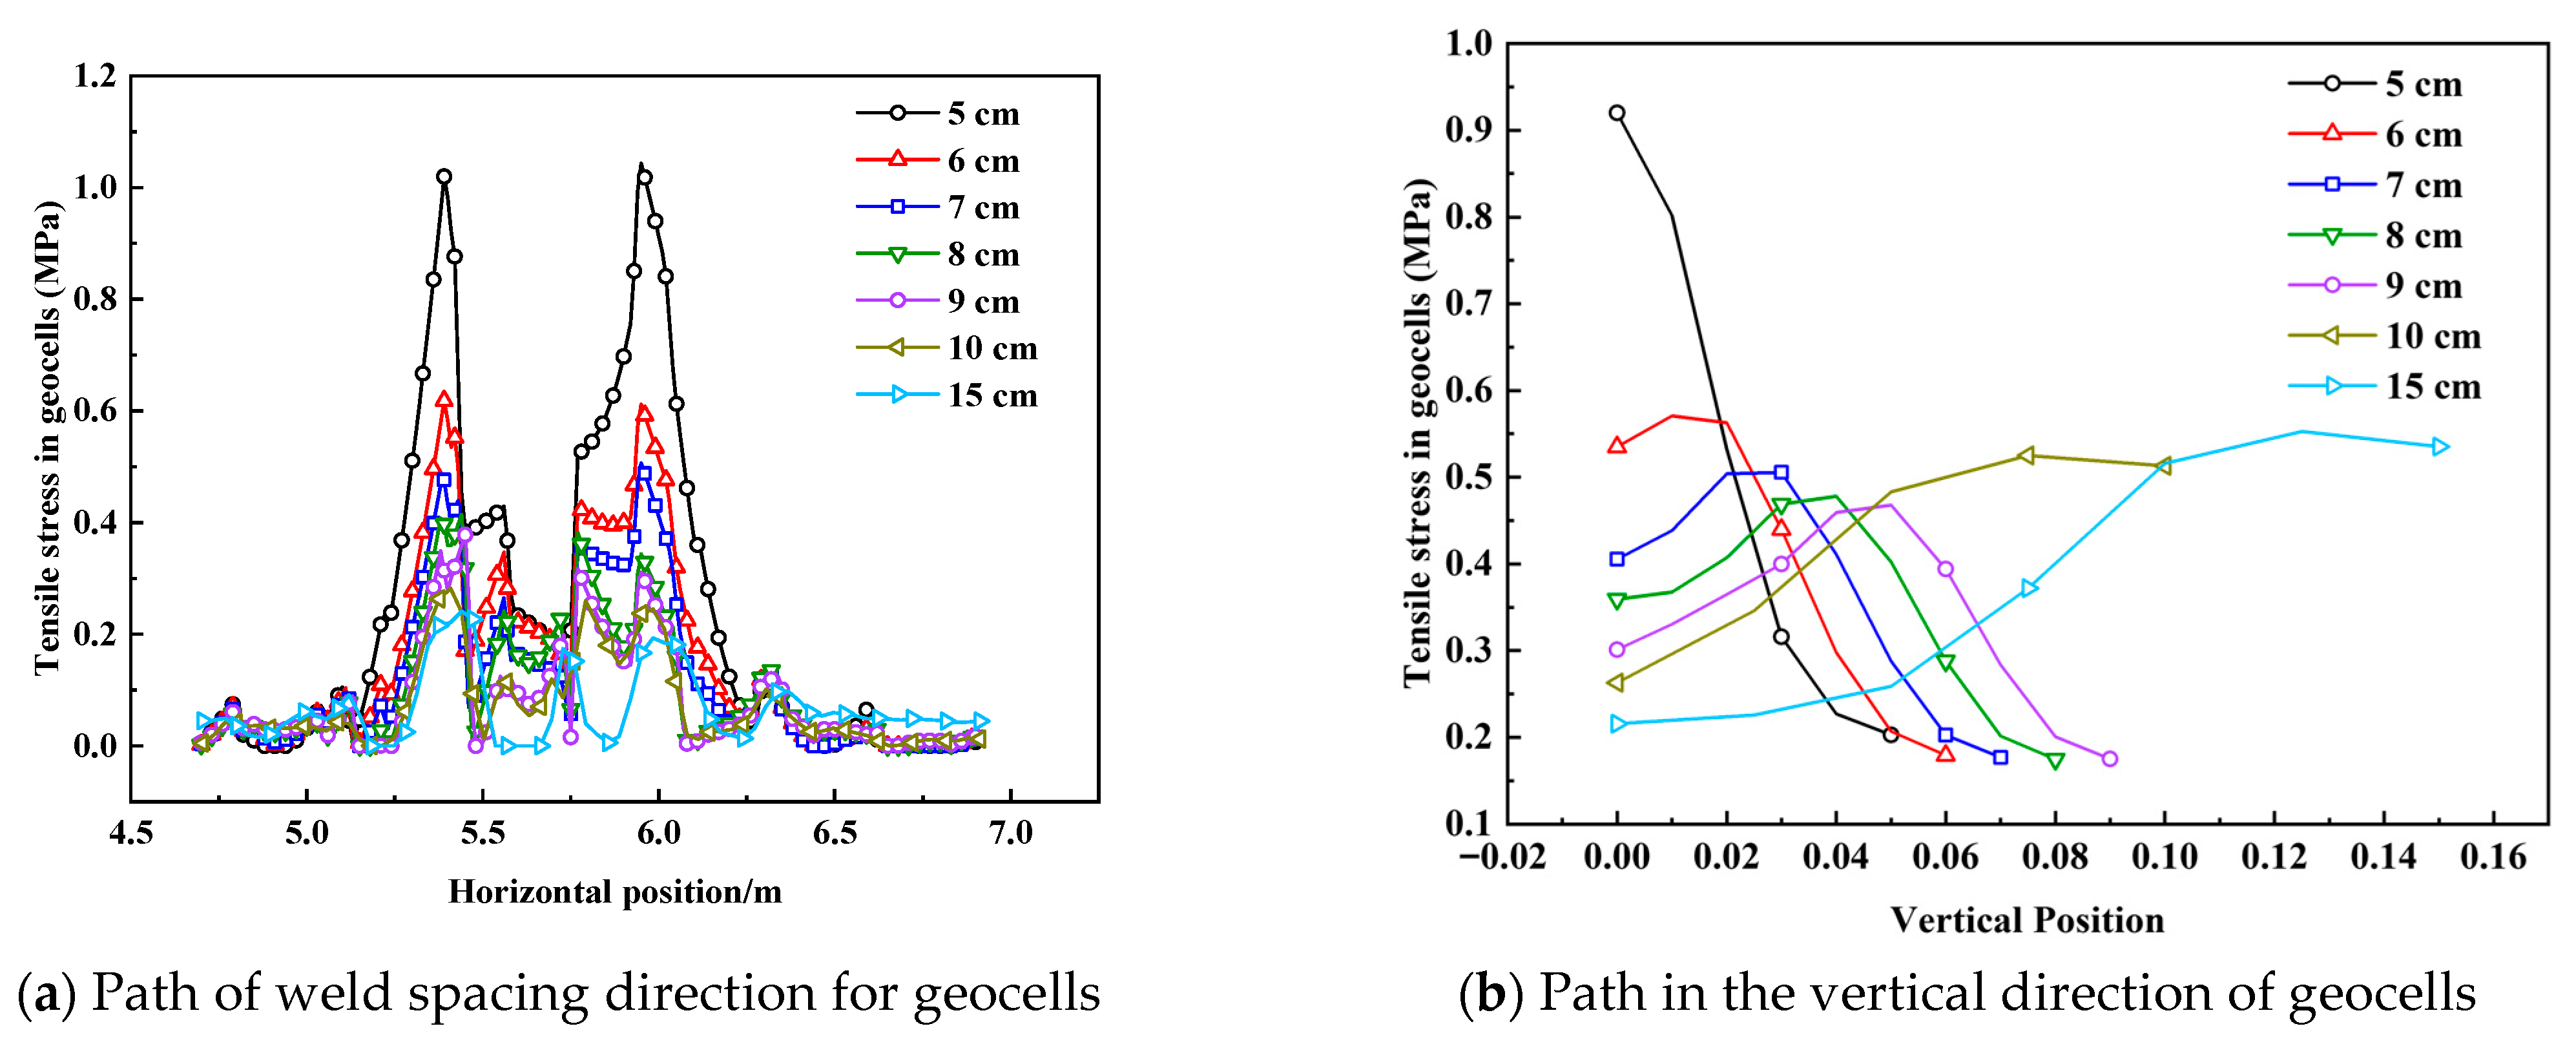
To further quantify the height threshold, the stress distribution along both the longitudinal (cell spacing) and vertical directions was extracted for all examined heights (H = 5, 6, 7, 8, 9, 10, and 15 cm), as shown in
Figure 22. Near the load center, geocell stress generally decreases with increasing height, indicating that taller geocells promote local reinforcement activation and stress diffusion. However, this trend does not hold consistently farther from the load center, and the reinforcement effect at H = 15 cm is slightly degraded. Vertical sectional profiles further reveal that, at H = 5 cm, the upper portion of the geocell exhibits the most significant stresses, while increasing H shifts the prominent stress region downward. This observation suggests that beyond a certain height range, the upper portion of the geocell is less effectively mobilized, diminishing its contribution to stress diffusion and leading to diminishing marginal returns or even local performance reversal.
Taken together, the evaluation of the four response indicators indicates that, for a given surface course thickness, an optimal range of geocell height exists. The reinforcement effect increases with height up to approximately one-third of the concrete surface thickness, beyond which marginal benefits diminish and may even deteriorate. These findings underscore the importance of optimizing geocell height relative to pavement layer thickness for efficient reinforcement design.
4.6. Analysis of Reinforced Performance Under Thermo-Mechanical Loads at Different Temperatures
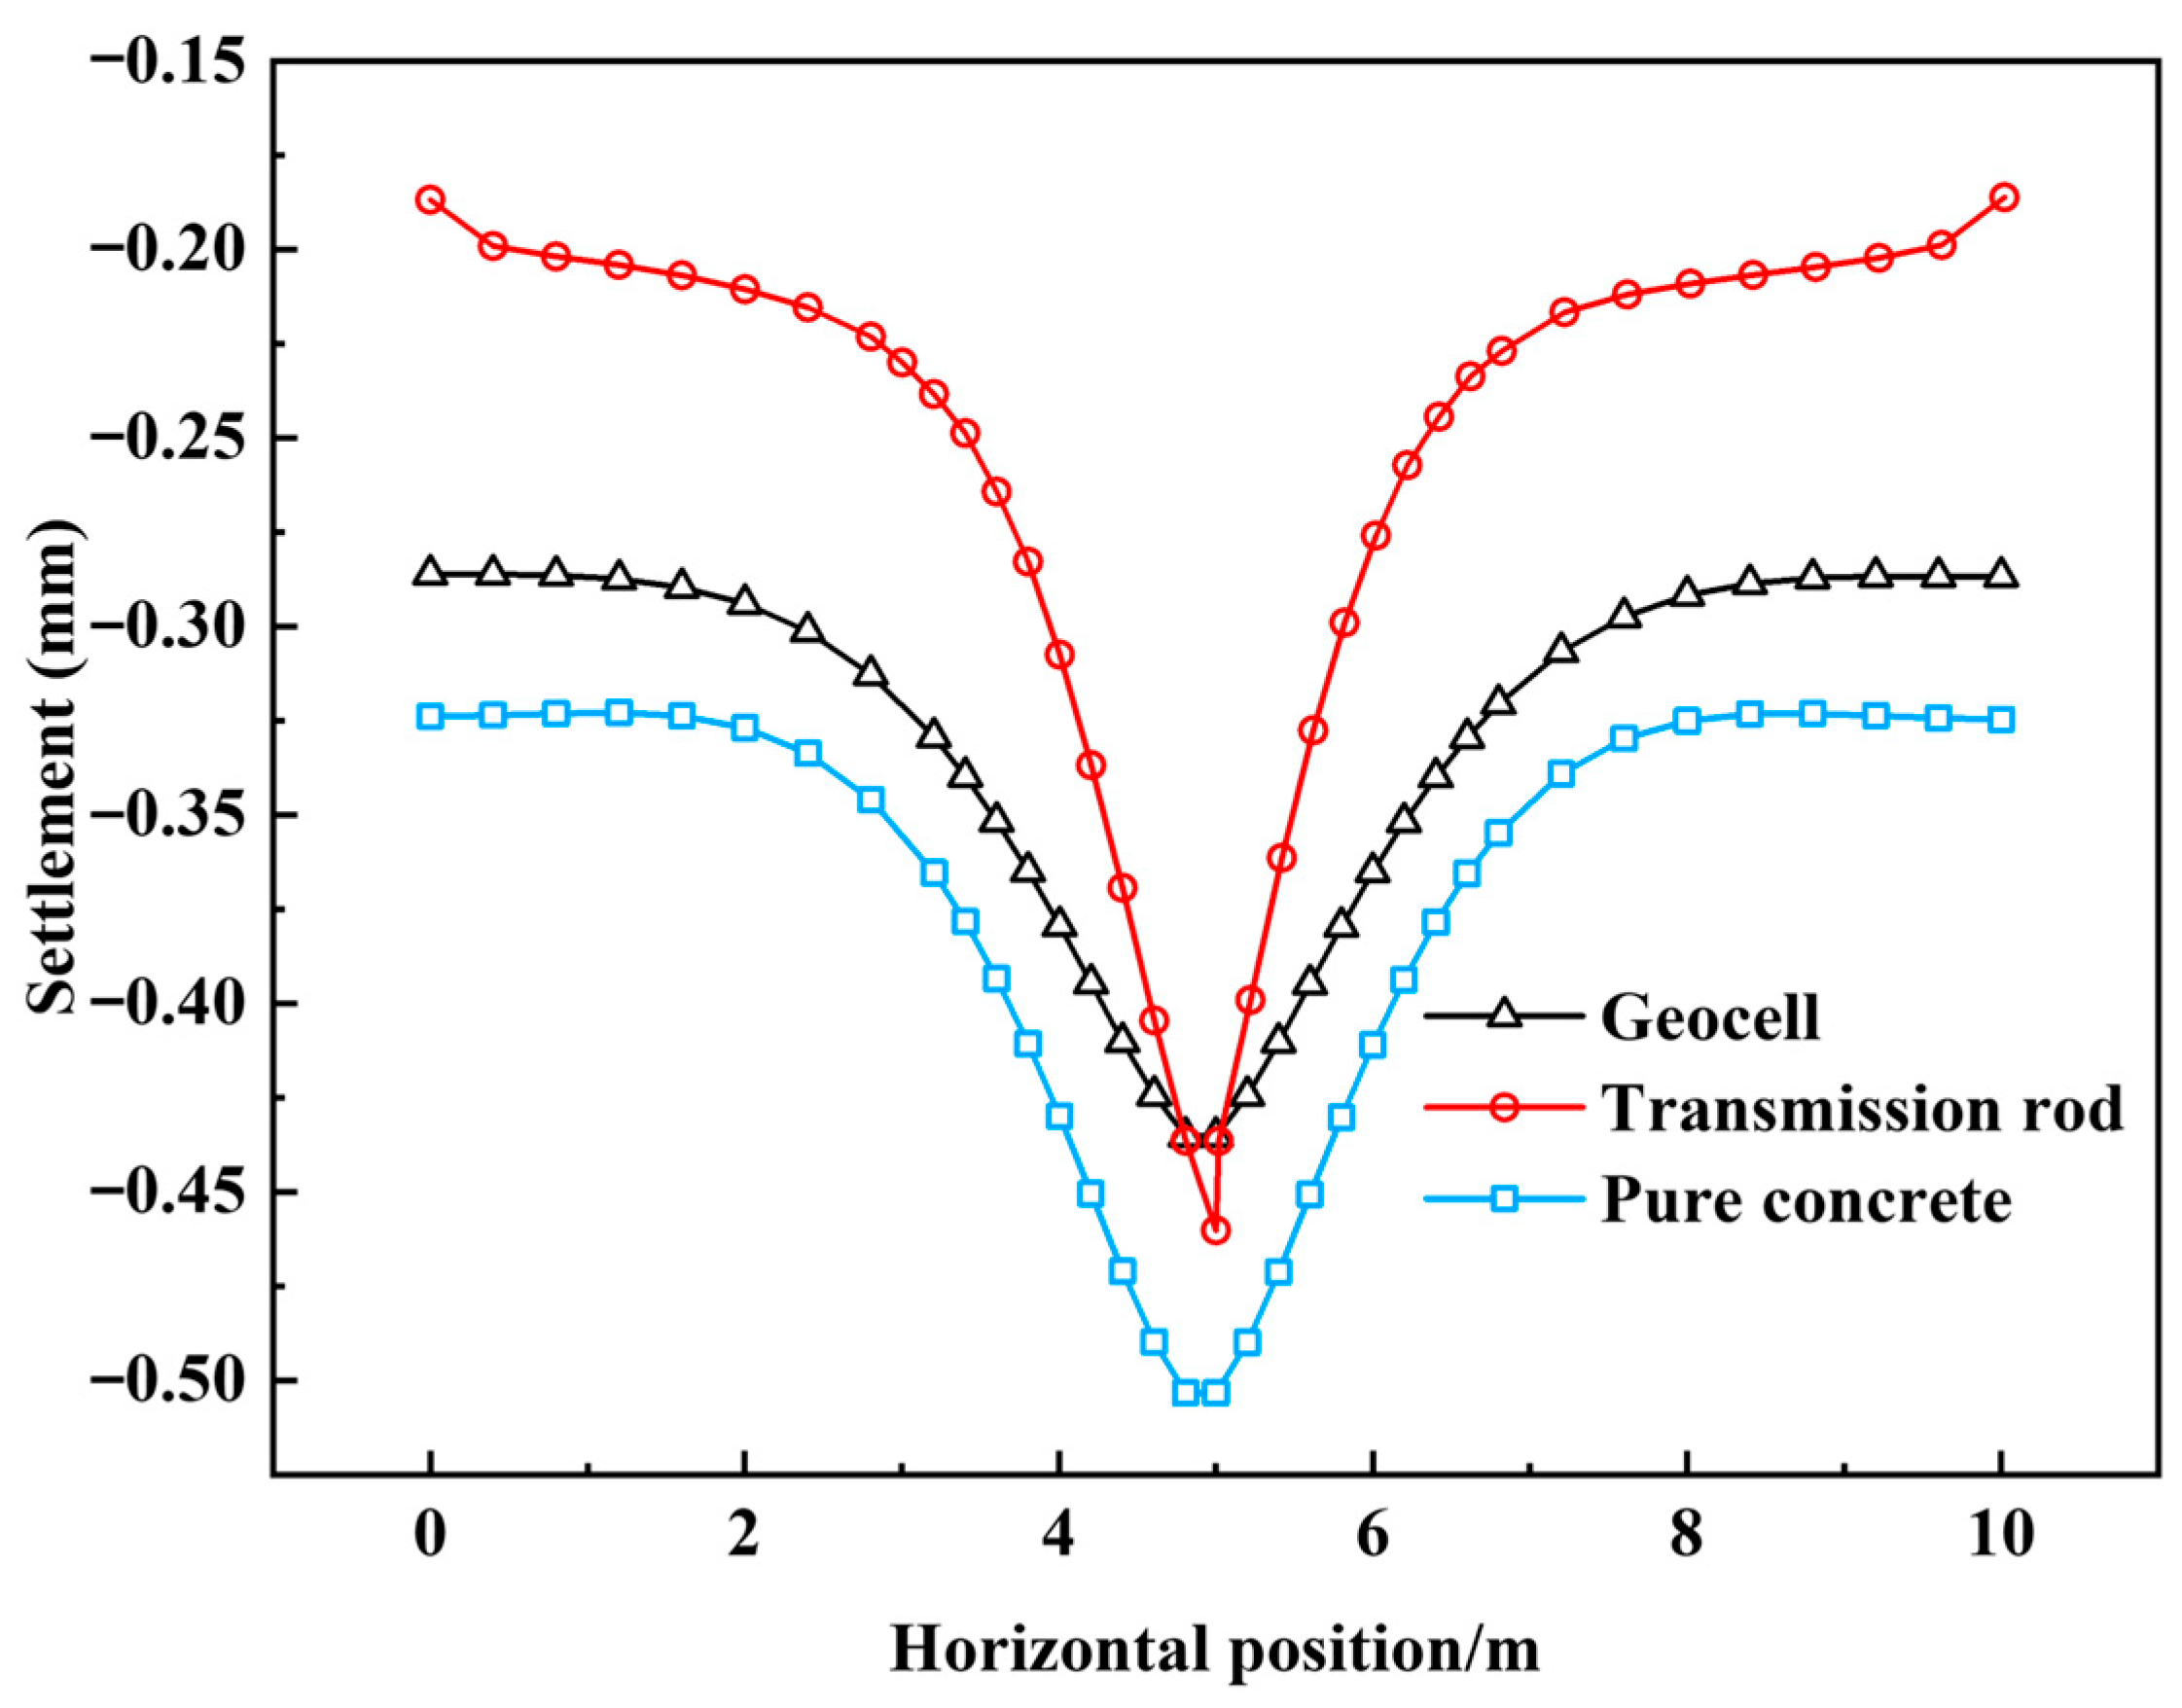
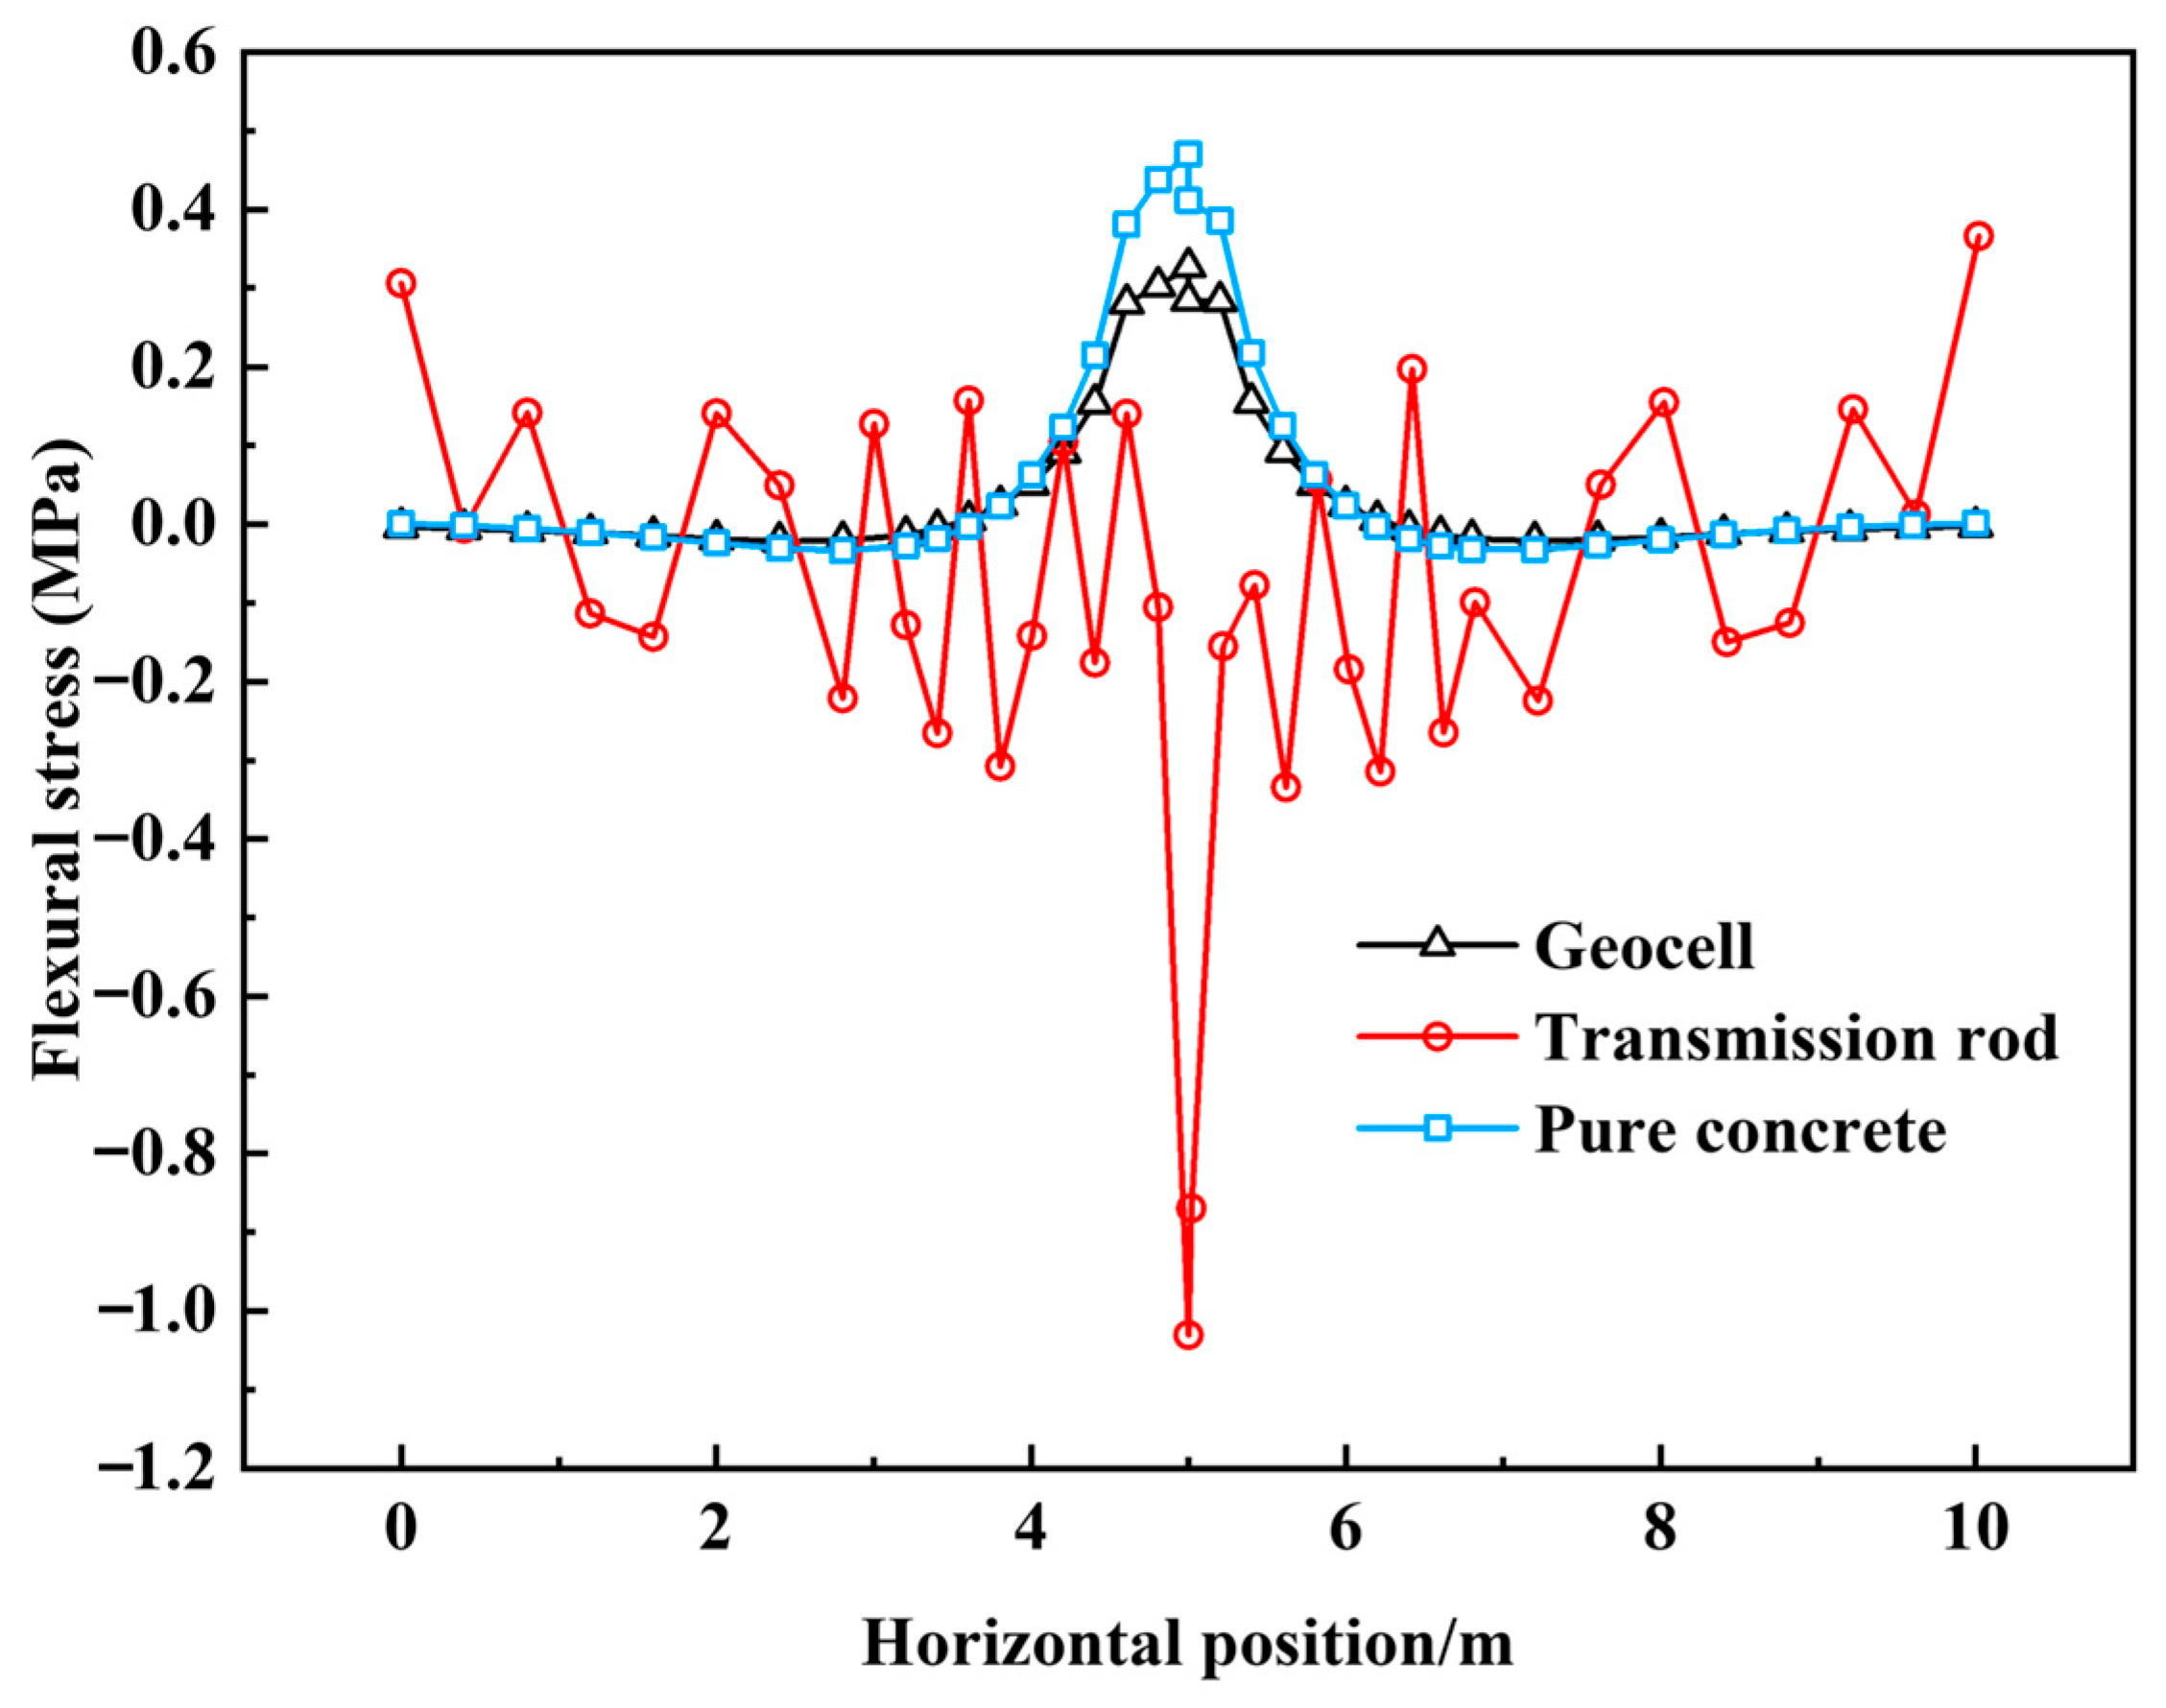
Under the high-temperature thermo-mechanical coupling condition (steady-state 60 °C temperature field combined with a 7 MPa static load), the settlement and stress distribution of differently reinforced pavements are illustrated in
Figure 23 and
Figure 24. As shown in
Figure 23, the maximum settlement consistently occurs near the loading point, indicating that deformation under thermo-mechanical coupling is still dominated by localized concentrated loading. Quantitative comparison reveals that the geocell-reinforced pavement exhibits the smallest central deflection, followed by the load-transfer-bar pavement, while the unreinforced concrete pavement shows the largest settlement. Relative to the unreinforced case, geocell reinforcement reduces peak settlement by approximately 17.4% and by about 7.6% compared to the load-transfer-bar scheme.
More importantly, the displacement gradient on both sides of the load center is markedly gentler for the geocell-reinforced section, indicating that geocell reinforcement not only mitigates peak settlement but also significantly reduces curvature concentration in the vicinity of the load. This improvement in local bending response is attributed to enhanced lateral load spreading resulting from the three-dimensional confinement provided by the geocell reinforcement, which increases the equivalent stiffness of the reinforced layer and broadens the effective load diffusion zone.
The stress distributions in
Figure 24 show pronounced local stress peaks near the load center across all reinforcement schemes, indicating that, under coupled conditions, stress response arises from the superposition of thermal warping stresses and load-induced stresses. Differences in reinforcement schemes are primarily reflected in the character of these stress peaks: the stress peaks in geocell-reinforced and unreinforced pavements exhibit relatively smooth spatial transitions, whereas the load-transfer-bar scheme produces more abrupt local fluctuations near the center. This suggests that, although load-transfer bars can improve shear transfer and continuity across joints, their relatively rigid local load path under thermo-mechanical coupling may promote stress concentration and sharper peak responses. In contrast, geocell reinforcement provides a more flexible confinement mechanism that yields a more uniform and continuous stress distribution, thereby more effectively suppressing localized bending stress concentrations.
In summary, the geocell reinforcement achieves superior stress homogenization by interacting laterally with the slab and base layers: it reduces peak tensile stresses associated with cracking while avoiding excessive stiffness that can induce stress spikes in rigid load-transfer bar designs. Under the combined high-temperature and static loading condition, the geocell-reinforced pavement also demonstrates greater overall stiffness and enhanced resistance to vertical deformation. These advantages not only outperform unreinforced concrete pavements but also exceed the performance of load-transfer-bar reinforced pavements in terms of local bending resistance, indicating that the geocell reinforcement effectively increases the equivalent modulus of the composite slab system and improves its ability to resist deformation under coupled thermal and mechanical loads.
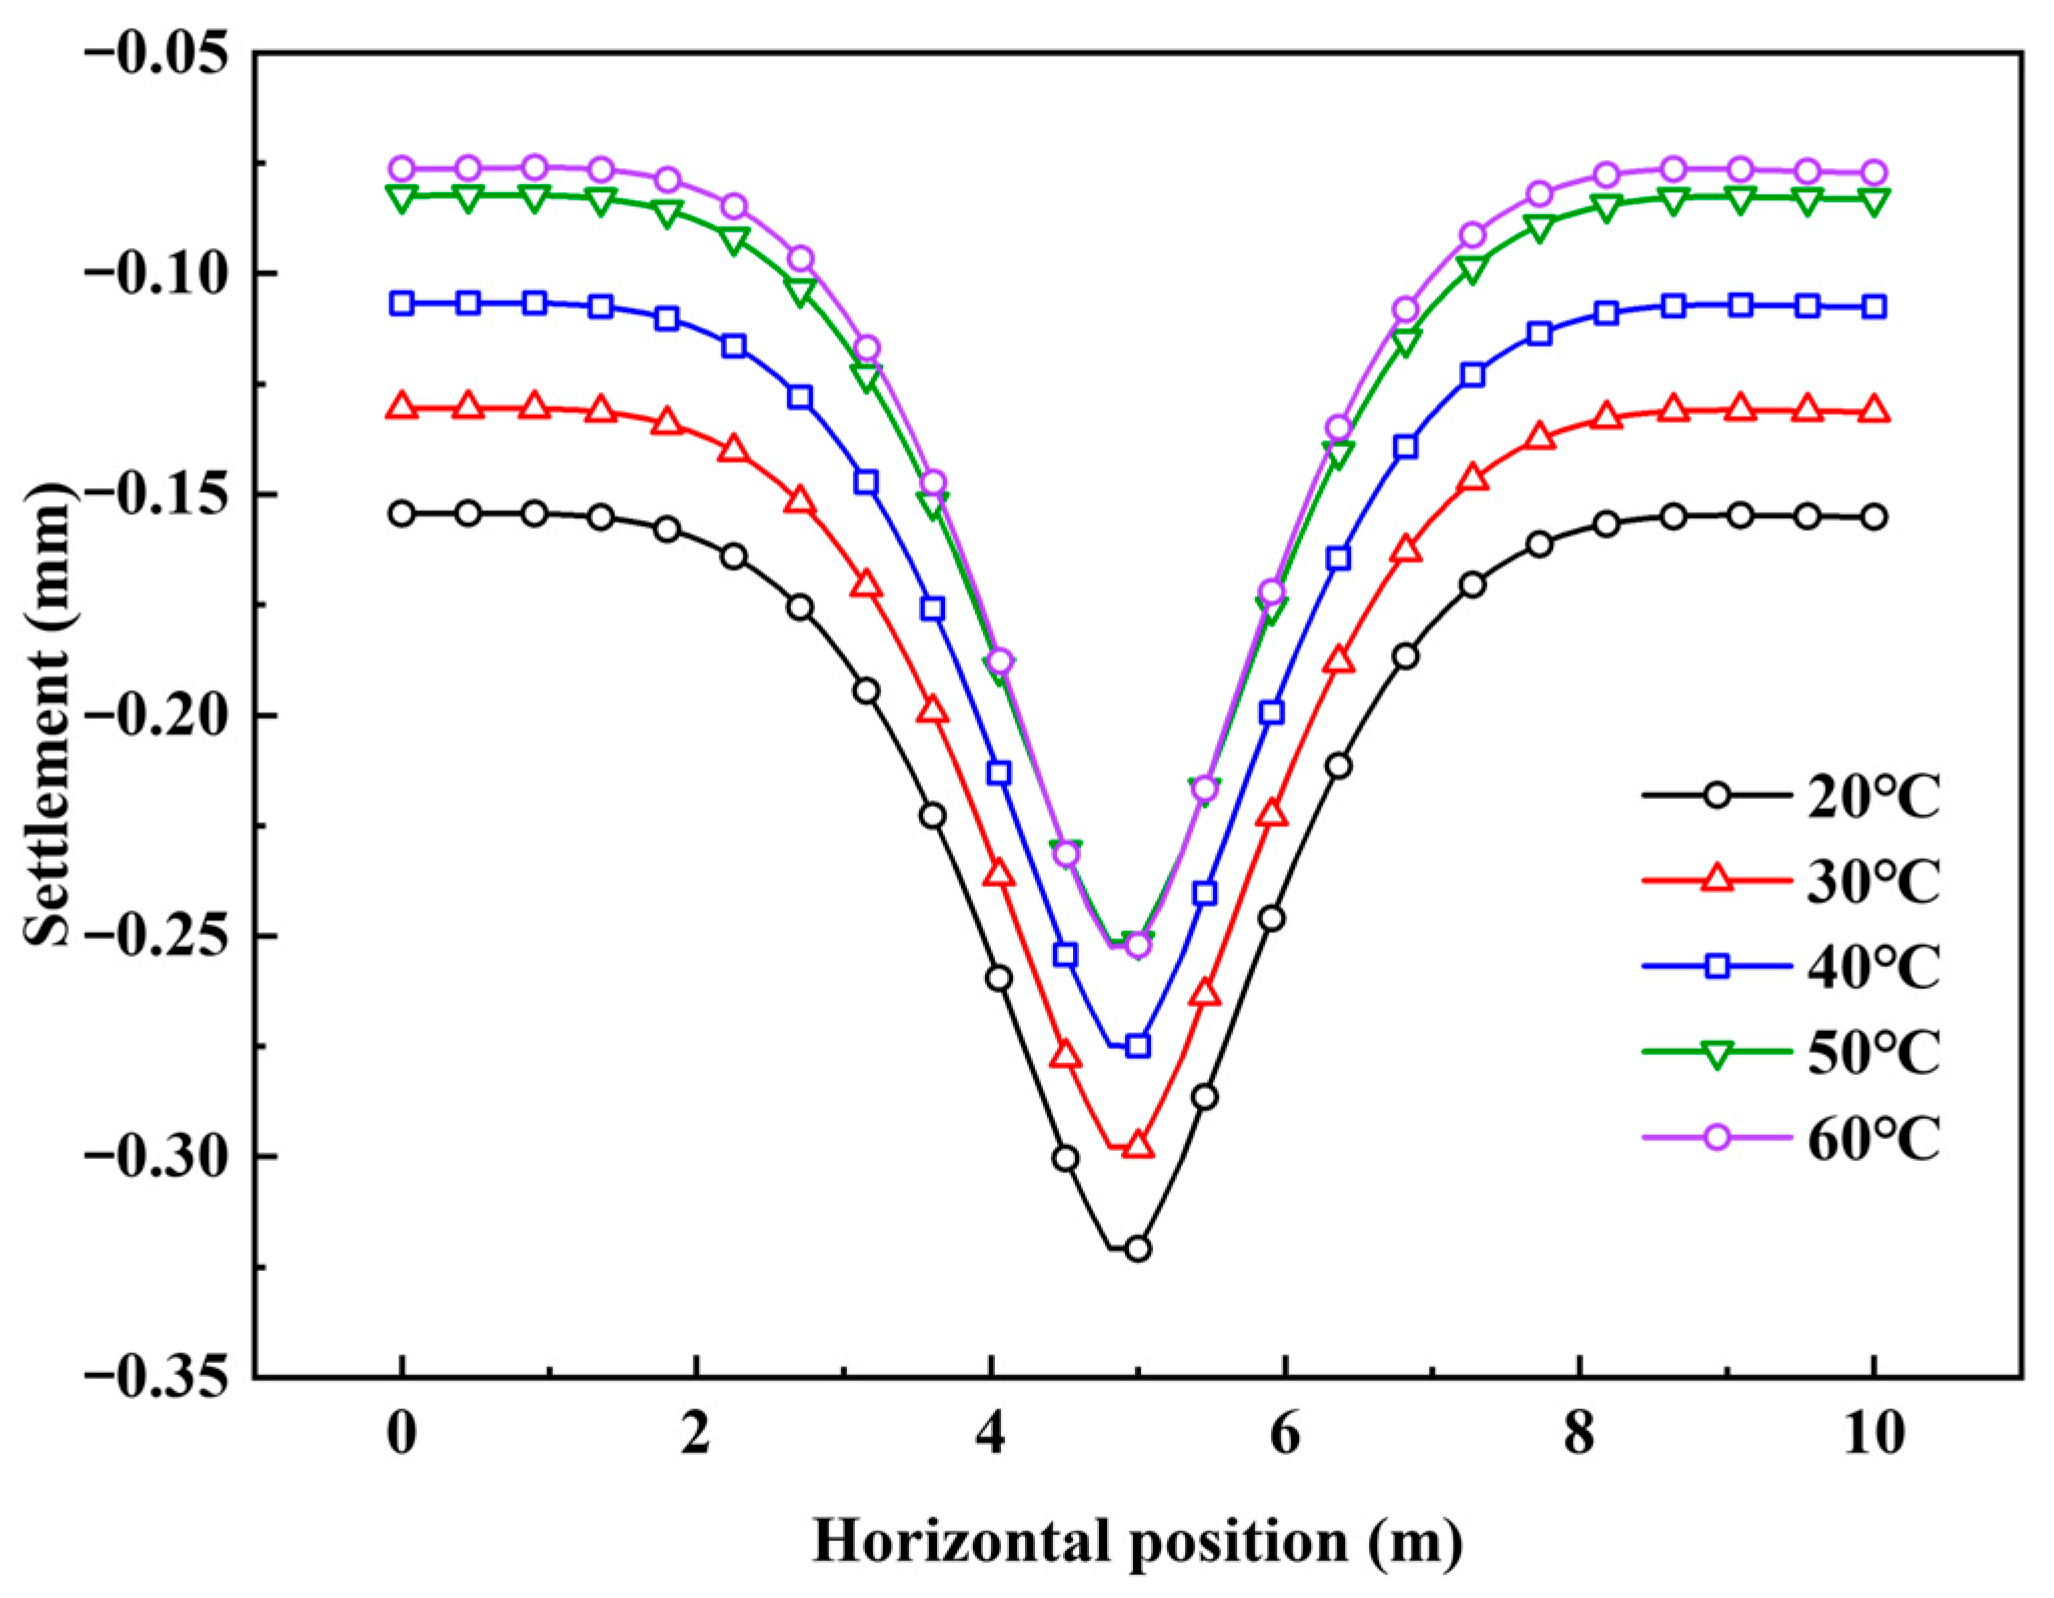
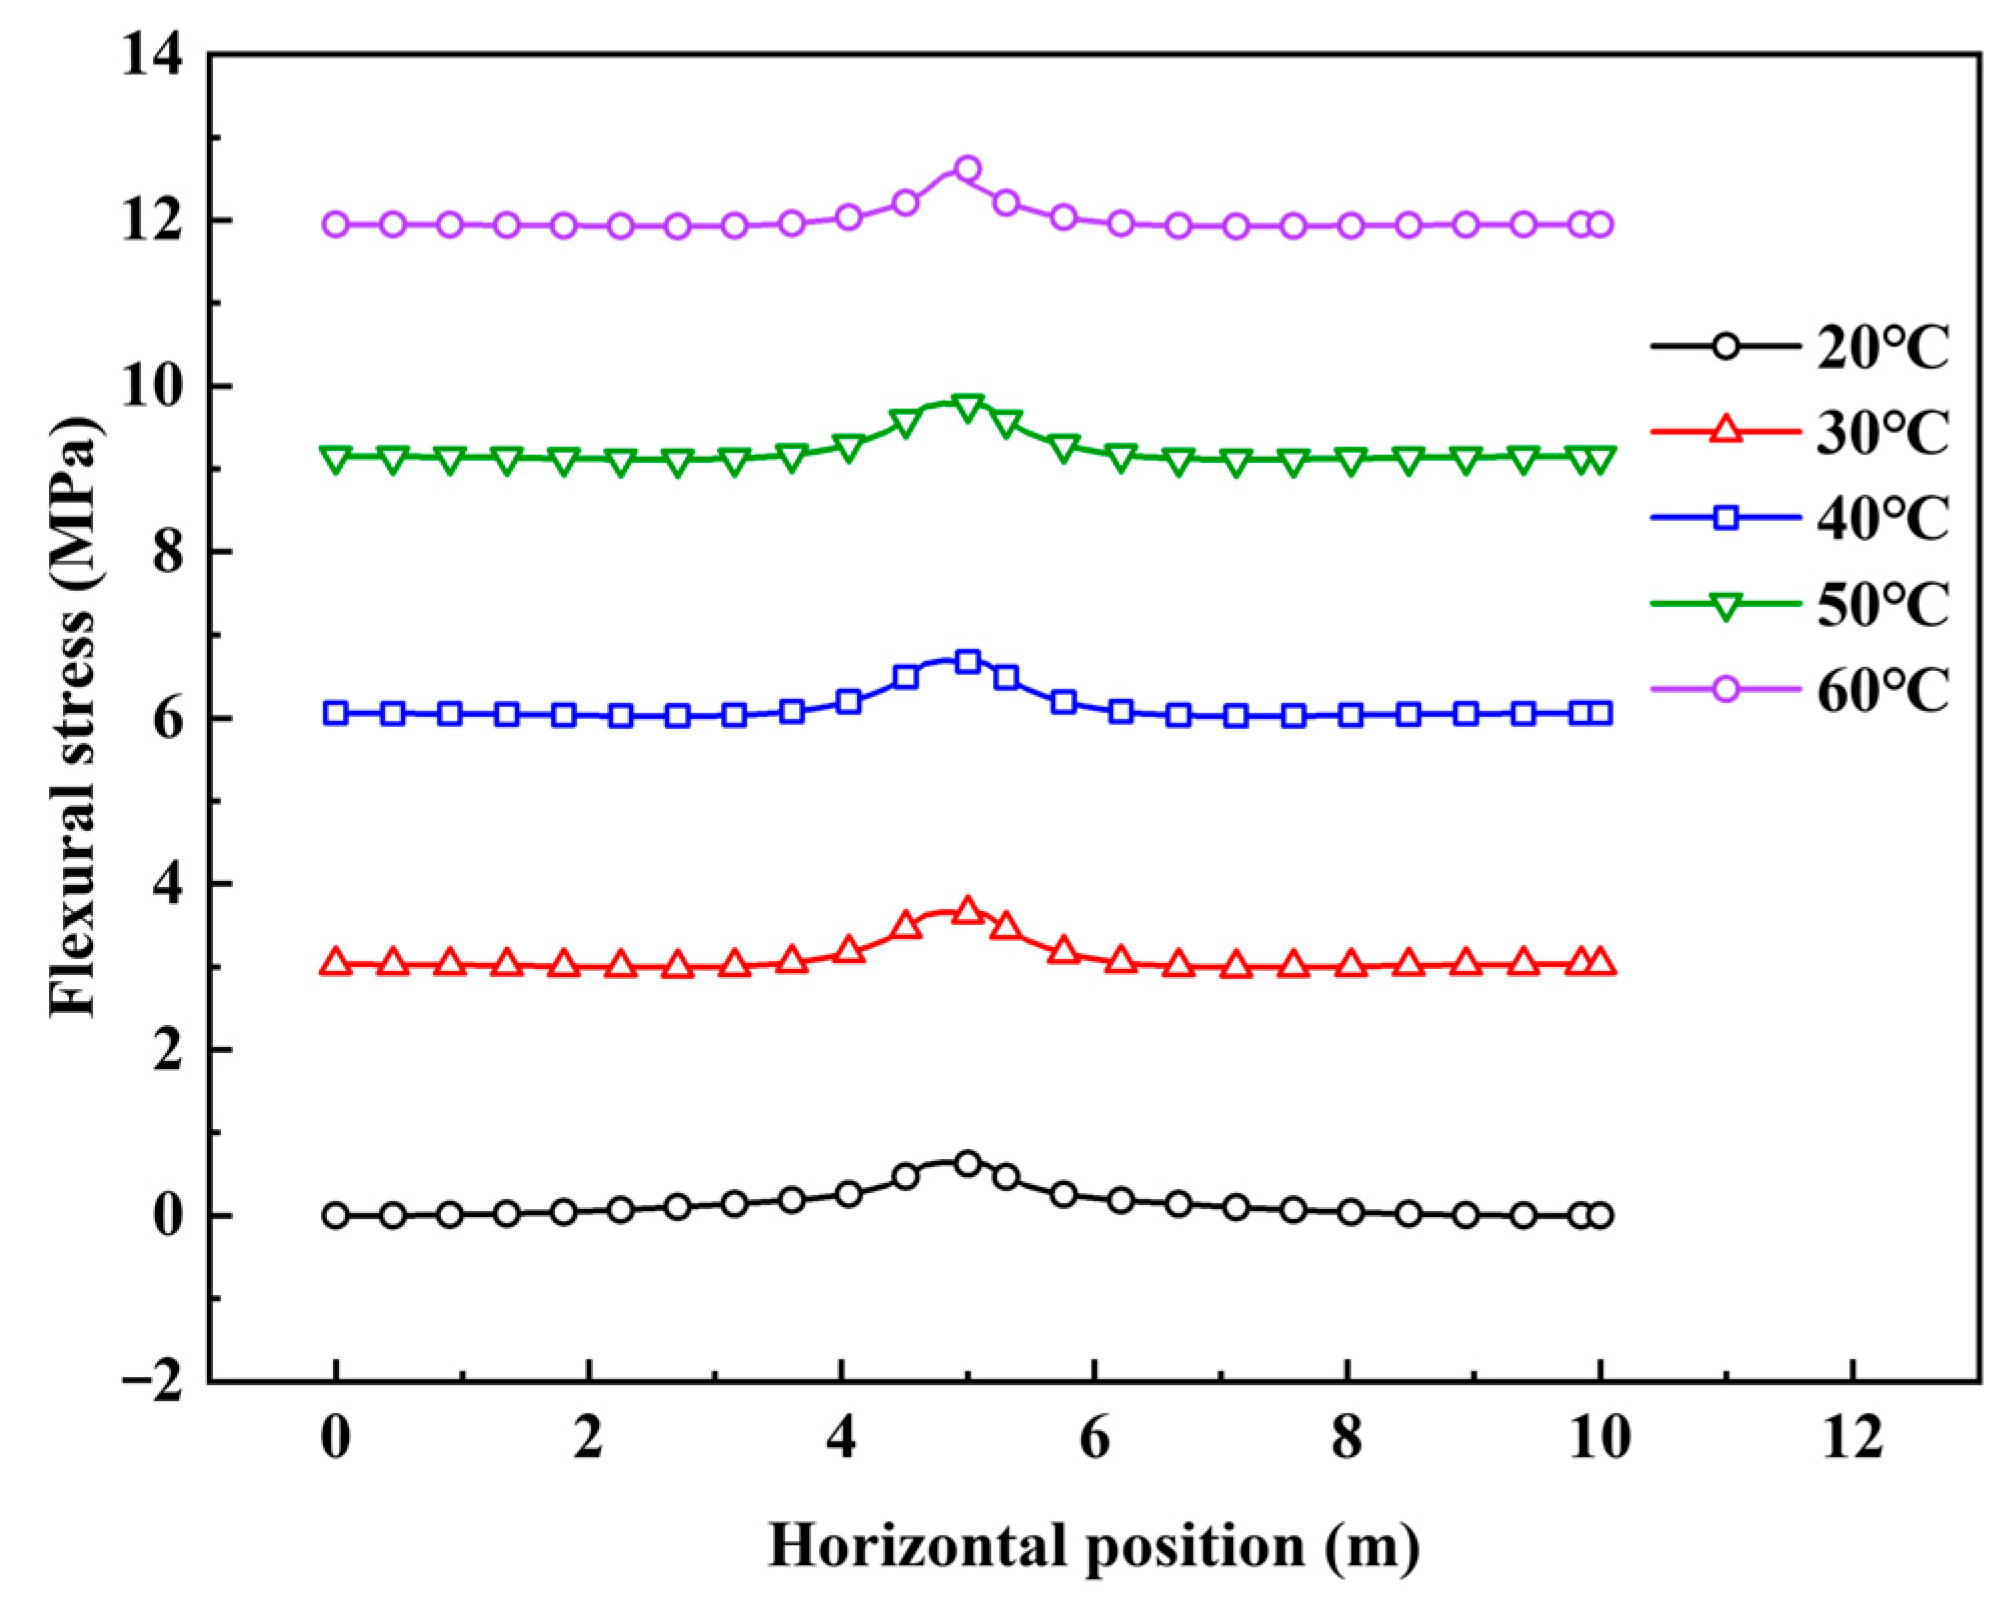
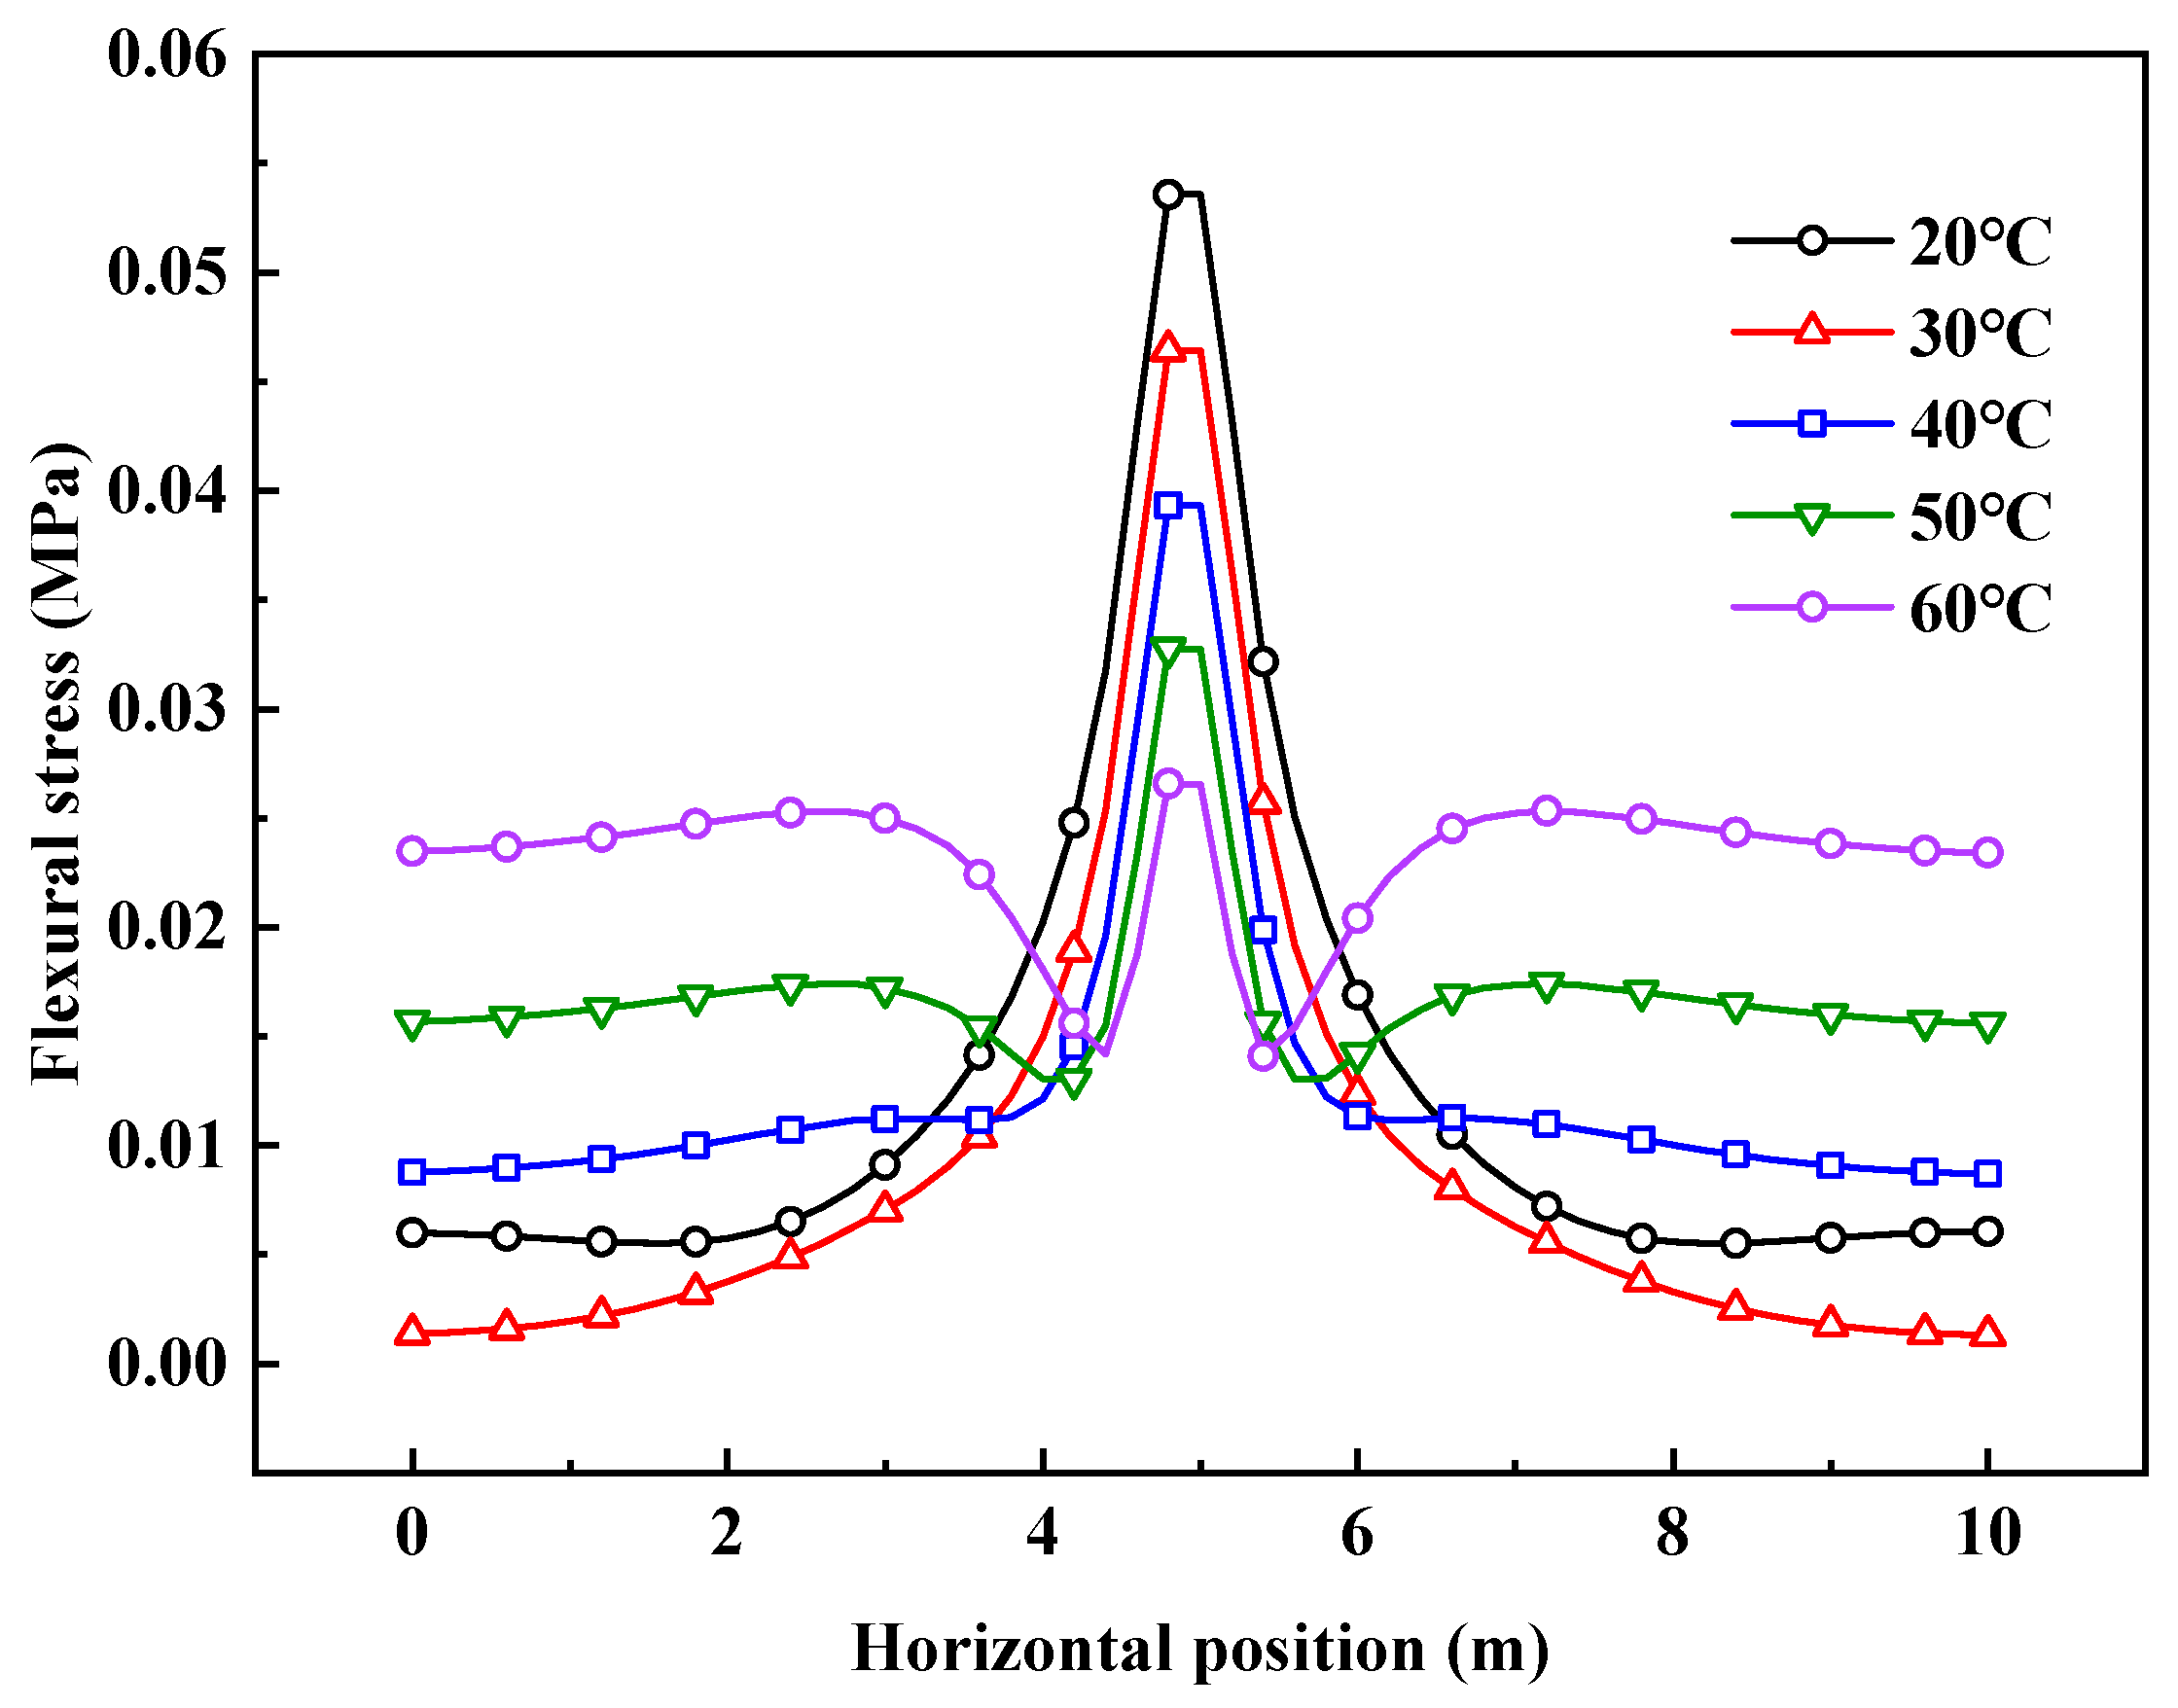
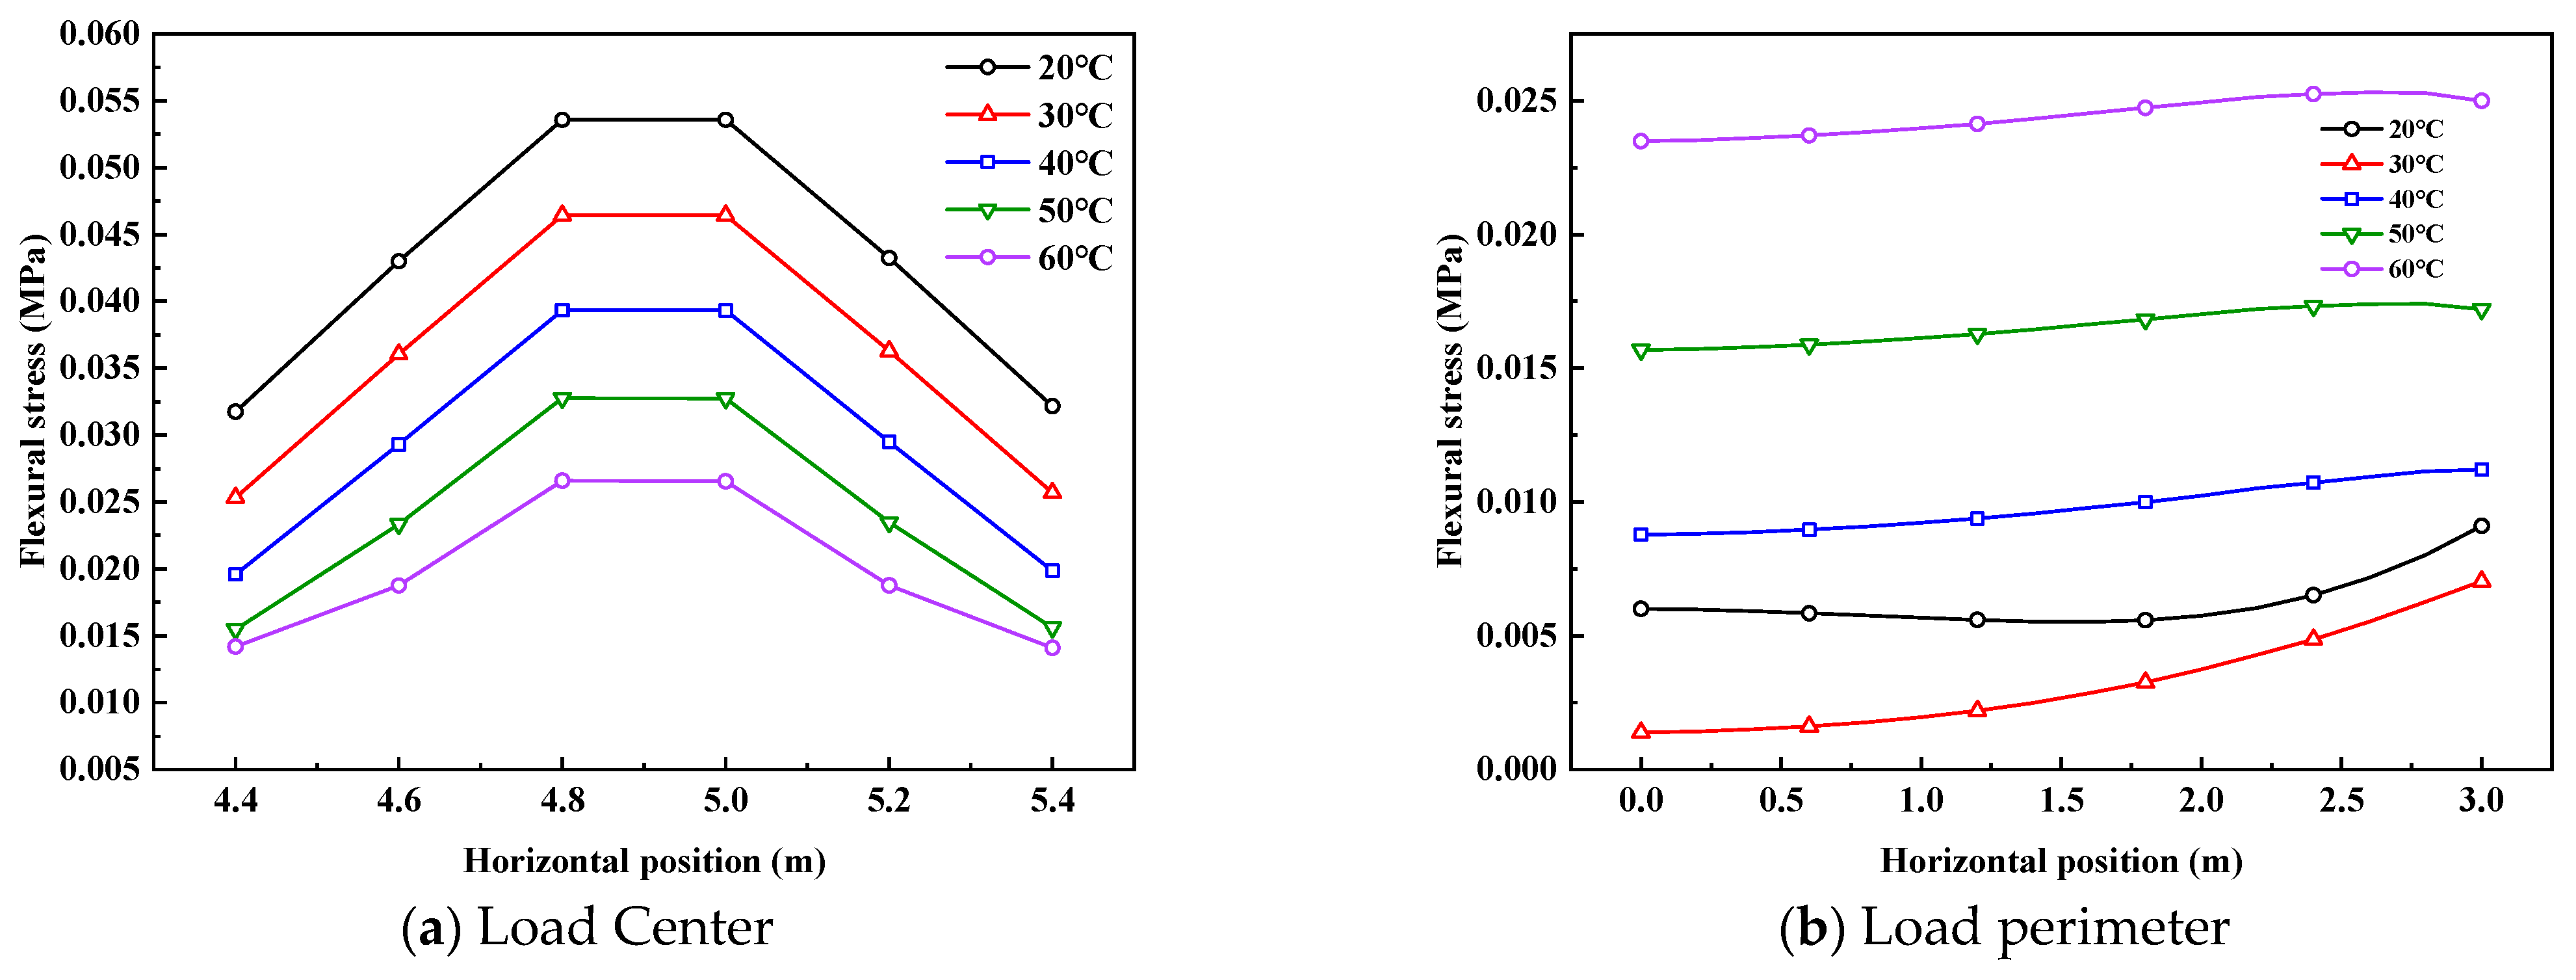
The settlement and stress responses of the geocell-reinforced concrete pavement under varying temperature and load conditions are shown in
Figure 25,
Figure 26,
Figure 27 and
Figure 28. Specifically,
Figure 27 and
Figure 28 illustrate the stress distribution at the bottom of the base course. It can be observed that the largest settlement consistently concentrates near the load center and gradually levels off toward the sides, indicating that deformation under coupled thermal and mechanical loading is still dominated by local load effects.
As temperature increases from 20 °C to 60 °C, the maximum central settlement decreases from approximately −0.33 mm to −0.24 mm, representing a reduction of about 27%, and the incremental change diminishes at higher temperatures (especially between 50 °C and 60 °C). This trend suggests that under elevated temperatures, geocell reinforcement more effectively suppresses thermal warping and local bending deflection. Concurrently, baseline displacements far from the load zone rise from about −0.19 mm to −0.11 mm, indicating a shift in structural response from localized settlement toward coordinated global deformation.
In contrast to settlement, the top surface stress increases markedly with temperature. The far-field stress level rises from near 0 MPa at 20 °C to approximately 12 MPa at 60 °C, with an additional localized peak stress of 0.5–1 MPa at the load center. This behavior indicates that temperature-induced constraint stresses constitute a major component of the internal stress state, while wheel load effects contribute as superimposed local peaks.
From
Figure 27 and
Figure 28, as temperature rises from 20 °C to 60 °C, the maximum stress at the base of the base course near the center decreases from approximately 0.055 MPa to 0.028 MPa (a reduction of about 49%), indicating that high temperatures significantly weaken stress concentration and promote more diffuse load distribution. At the same time, the far-field baseline stress level increases with temperature, reaching about 0.023–0.025 MPa at 60 °C, significantly higher than the 0.006–0.008 MPa range at 20 °C. This rise reflects an increased contribution of temperature-induced internal stresses at the base course level.
Overall, elevated temperatures cause the base stress distribution to exhibit a “lower peak, raised baseline” pattern, indicating that while local peak stress risk decreases, the general stress level across the domain increases. Consequently, the dominant force mechanism transitions from local stress concentration toward global temperature-driven internal stress accumulation under coupled thermo-mechanical loading.




 ,
,