Article

pH- and Temperature-Dependent Dissolution Kinetics of Commercial Lightly Burned Magnesia: Bridging Methodological Gaps for Cement Applications


by
Xiaowen Zhang
1 and
Juan Pablo Gevaudan
2,3,*
1
Fiber and Particle Engineering Research Unit, University of Oulu, 90570 Oulu, Finland
2
Department of Architectural Engineering, The Pennsylvania State University, University Park, PA 16802, USA
3
Department of Materials Science and Engineering, The Pennsylvania State University, University Park, PA 16802, USA
*
Author to whom correspondence should be addressed.
Sustainability 2026, 18(7), 3600; https://doi.org/10.3390/su18073600
Submission received: 26 February 2026 / Revised: 25 March 2026 / Accepted: 31 March 2026 / Published: 7 April 2026
(This article belongs to the Special Issue Advanced Concrete- and Cement-Based Composite Materials)

Abstract

Performance variability in MgO-based cements stems partly from poorly characterized dissolution kinetics of commercial lightly burned magnesia (LBM). Existing studies focus on high-purity materials under acidic conditions, but LBM also dissolves in alkaline conditions, where Mg(OH)2 precipitation prevents reliable sampling at high pH. We validated pH monitoring against ICP-AES for tracking initial LBM dissolution kinetics across pH 2.0–11.0 and temperatures 25–85 °C. Commercial LBM (32 m2/g, 7.5 wt% CaO) exhibited rates one to two orders of magnitude higher than synthetic magnesia (10−8 to 10−12 mol/cm2·s). X-ray diffraction, electron microscopy with energy-dispersive spectroscopy, and BET analysis revealed enhanced reactivity from poor crystallinity, multiphase composition, and high surface area with textural porosity. Temperature effects peaked at 75 °C before declining due to Mg(OH)2 passivation. The validated method provides practical guidance for MBC quality control and performance optimization. By providing a rapid, instrument-simple alternative to ICP-AES for reactivity assessment, it lowers the analytical barrier to systematic LBM quality control, supporting the transition of magnesia-based cements from laboratory materials to scalable low-carbon alternatives to Portland cement.

1. Introduction

Magnesia-based cements (MBCs) have emerged as promising low-carbon alternatives to Portland cement, owing to their lower calcination temperatures and the potential for direct CO2 sequestration through mineral carbonation [1,2]. However, industrial adoption remains constrained by significant performance variability, particularly in setting behavior, early-age strength development, and long-term durability. Understanding the fundamental dissolution mechanisms controlling this variability is essential for advancing MBC technology from laboratory demonstrations to reliable construction materials. This transition carries significant sustainability implications. Portland cement production accounts for approximately 8% of global anthropogenic CO2 emissions, driven largely by the high calcination temperature (approximately 1450 °C) and the stoichiometric release of CO2 from limestone decomposition [1,2]. Although MgO production from magnesite generates more process CO2 than Portland cement clinker (1.1 vs. 0.67 t CO2/t from decomposition alone), the ability of MBC products to sequester CO2 through carbonation during curing can reduce net emissions to 0.5–0.6 t/t, representing a 40–50% reduction relative to Portland cement [2,3]. However, realizing this potential on an industrial scale is hindered by the performance variability of commercial LBM. Without reliable and accessible methods for characterizing LBM reactivity, quality control relies on time-consuming hydration tests or costly ICP-based analysis, limiting scalability. Addressing this methodological gap is, therefore, a prerequisite for the broader deployment of MBC as a sustainable construction material.
Unlike Portland cement systems, where tricalcium silicate hydration dominates, MBC strength development depends critically on the initial dissolution of magnesia (MgO) to provide Mg2+ ions for subsequent reactions with supplementary components, forming binding phases such as magnesium silicate hydrate (M-S-H) or hydrotalcite-like phases [4,5,6].
The discrepancy becomes particularly relevant when considering that commercial MBCs utilize lightly burned magnesia (LBM), produced by calcining natural magnesite or brucite at relatively low temperatures (700–1000 °C) [3]. This production route yields materials with characteristics distinctly different from the high-purity MgO crystals or dead-burned magnesia commonly employed in fundamental dissolution studies. Commercial LBM is characterized by higher specific surface areas (typically 20–50 m2/g), variable crystallinity arising from incomplete thermal transformation, and significant levels of calcium, silicon, iron, and aluminum impurities inherited from natural feedstocks [7,8,9]. Previous studies have suggested that surface defects, lattice disorder, and impurity incorporation can significantly affect oxide dissolution rates [10,11,12], with dopants and calcium-bearing phases potentially creating preferential dissolution sites [13,14]. Recent work [15] has shown that LBM reactivity depends on synergistic effects between pore networks and surface defect concentrations, but dissolution behavior across the pH spectrum relevant to MBC formulation remains uncharacterized [16].
A critical methodological limitation further restricts our understanding of MgO dissolution under cement-relevant conditions. Most fundamental studies are conducted in acidic environments to maintain stoichiometric dissolution and avoid secondary phase precipitation. However, MBC systems operate across a buffered alkaline spectrum, typically ranging from the initial hydrolysis of MgO near pH 10 to the higher alkalinity of mature hydration environments. Under these alkaline conditions, the low solubility of Mg(OH)2 (Ksp = 5.61 × 10⁻¹²) [17] and its rapid precipitation kinetics establish a dynamic dissolution–precipitation equilibrium that precludes accurate sampling-based measurements [18,19]. Consequently, the field lacks a validated method for tracking MgO dissolution continuously across the full pH range relevant to cement hydration.
This study addresses these interconnected material and methodological gaps by investigating the dissolution behavior of a representative commercial LBM across a pH range of 2.0 to 11.0 and temperatures from 25 to 85 °C. These conditions encompass the entire spectrum from initial mixing to accelerated curing. Our primary objective is to validate pH monitoring as a practical and continuous method for determining dissolution rates; the kinetic dataset generated through this validation constitutes the first systematic characterization of commercial LBM dissolution behavior across the full cement-relevant pH range, particularly in alkaline regimes where precipitation makes direct ionic measurement impractical. We evaluate pH-derived rates against ICP-AES measurements where feasible. Simultaneously, we employ comprehensive material characterization, including X-ray diffraction, scanning and transmission electron microscopy, and surface area analysis, to identify the physicochemical properties that distinguish commercial LBM from synthetic reference materials and drive its dissolution kinetics. By establishing quantitative structure-kinetics relationships, this work provides practical guidance for MBC formulation design, quality control protocols, and optimization of the curing conditions to ensure predictable performance.

2. Materials and Methods

2.1. Materials

The lightly burned magnesia used in this study was a commercial product (MagOx XL, Premier Magnesia, LLC, Waynesville, NC, USA), representative of materials commonly employed in MBC formulations. This LBM is produced by calcination of natural magnesite at temperatures below 1000 °C, resulting in a reactive magnesia with characteristic impurities from the parent ore. For comparison, a high-purity synthetic magnesia (STM) was obtained from ThermoFisher Scientific Chemicals (Waltham, MA, USA, 99.99% purity). The chemical compositions and specific surface areas of both materials are presented in Table 1.
The substantial differences in impurity content and surface area between these materials provide an ideal system for investigating the effects of material properties on dissolution kinetics. The LBM contains significant levels of CaO (7.5 wt%) and SiO2 (3.18 wt%), typical of commercial reactive magnesia derived from natural magnesite, which generally exhibits BET surface areas of 20–50 m2/g and MgO purity of 85–95%. Note that while the manufacturer’s safety data sheet reports 93% MgO and 3% CaO, X-ray fluorescence revealed the complete composition; XRF analysis of a separate batch of the same product yielded 89.7 wt% of MgO and 5.38 wt% of CaO, confirming that compositional variability exists between batches, which highlights why a standardized reactivity test is needed. The LBM was used as received without further grinding, sieving, or surface conditioning. All dissolution experiments utilized deionized water (resistivity > 17 MΩ·cm) and ACS-grade reagents, including hydrochloric acid (HCl), nitric acid (HNO3), sulfuric acid (H2SO4), and sodium hydroxide (NaOH) for pH adjustment.

2.2. Material Characterization

Scanning electron microscopy was performed to examine the morphological differences between LBM and STM. Powder samples were mounted on aluminum stubs using conductive carbon tape and sputter-coated with gold (<5 nm thickness) to prevent charging. Images were acquired using a field emission SEM operated at accelerating voltages of 5–15 kV and a beam current of 50 pA.
X-ray diffraction patterns were collected to assess crystallinity and phase composition. Powders were front-loaded into silicon zero-background holders and analyzed using an Empyrean diffractometer (Malvern Panalytical, Malvern, UK) equipped with Cu Kα radiation (λ = 1.5406 Å) operated at 45 kV and 40 mA. Diffraction data were collected from 5° to 80° 2θ with a step size of 0.026° and a counting time of 150 s per step. The incident beam path included Bragg–Brentano HD optics with 0.04 radian Soller slits and a 1/4° fixed divergence slit. Phase identification was performed using Jade software (version 8.9, MDI) with the ICDD PDF-5 database. Peak broadening analysis was conducted on the (200) reflection of periclase to estimate crystallite size using the Scherrer equation after correction for instrumental broadening.
BET surface area measurements were performed using nitrogen adsorption at 77 K on a Micromeritics TriStar II Plus 3030 analyzer (Micromeritics, Norcross, GA, USA). Samples were degassed at 100 °C for 24 h under vacuum prior to analysis. Pore size distributions were calculated from the desorption branch using the Barrett–Joyner–Halenda method. The BET surface area was determined from an 8-point fit (p/p° = 0.075–0.251, correlation coefficient 0.9999), yielding 32.29 ± 0.14 m2/g for LBM.
We further investigated the nanoscale structure and chemical distribution of the precursors using scanning transmission electron microscopy (STEM). The analysis was performed on a Talos F200X microscope (ThermoFisher, Waltham, MA, USA) operated at 200 kV. High-angle annular dark-field (HAADF) images were acquired to observe mass-thickness contrast and to generate corresponding energy-dispersive X-ray spectroscopy (EDS) maps to visualize the spatial distribution of key elements.

2.3. Dissolution Experiments

Dissolution kinetics were characterized using an automated reactor system (EasyMax 102, Mettler Toledo, Schwerzenbach, Switzerland) capable of precise thermal regulation (±0.1 °C). For each experiment, 400 mL of solution was adjusted to an initial pH between 2.0 and 11.0 using appropriate acids or bases and equilibrated to the target temperature (25, 35, 45, 75, or 85 °C). Upon reaching thermal equilibrium, 100 mg of MgO powder was introduced to the solution, yielding a low solid-to-liquid ratio (0.25 g/L). This dosage was selected to minimize bulk pH drift while ensuring sufficient sensitivity for tracking ion release under the alkaline conditions typical of magnesia-based cements. All dissolution tests were conducted under quiescent (non-stirred) conditions to avoid experimental artifacts associated with mechanical stirring: the friable aggregate microstructure of commercial LBM (Figure 1c,d) makes it susceptible to particle breakage, aggregation, and wall adhesion under agitation, which inconsistently alters the effective reactive surface area. The observed first-order dependence of dissolution rate on proton activity in acidic conditions (Section 3.3) is consistent with surface-controlled rather than transport-controlled kinetics, supporting the validity of this approach. A standardized cylindrical vessel (80 mm internal diameter, 100 mm depth) with constant solution volume ensured a reproducible diffusion boundary layer. To ensure data fidelity, the pH electrode (InLab Expert, Mettler Toledo, Schwerzenbach, Switzerland) was fixed at the vessel centerline, 30 mm below the liquid surface, with measurements logged at 1–2 s intervals. The electrode underwent a three-point calibration (pH 4.01, 7.00, and 10.01) every 4 h to account for potential drift. Dissolution experiments were conducted in replicate to assess reproducibility. This experimental design requires only a standard pH electrode and data logger, lowering the analytical barrier to routine MBC quality control.
For comparison with LBM, selected experiments used high-purity synthetic magnesia (STM, see Section 2.1) under identical conditions to validate that the observed dissolution behavior reflects material-specific properties rather than methodological artifacts.

2.4. Dissolution Rate Determination

Two complementary methods were employed to determine dissolution rates. The primary approach utilized pH monitoring to calculate MgO consumption based on stoichiometric flux analysis.
In acidic conditions (pH < 8), the dissolution is primarily driven by proton consumption (MgO + 2H+ → Mg2+ + H2O). By measuring pH over time, the rate of proton consumption can be calculated in moles per unit volume (∆[H+] = 10−pH(t=0) − 10−pH(t=x), in mol/L). Utilizing the molar ratios from the hydration reaction and the solution volume (VR, 400 mL), the fraction of dissolved MgO (X = mdissolved, MgO/m0MgO) can be represented as
10 pH 0 10 pH = 2 m MgO 0 V R M MgO X
where MMgO is the molar mass (40.3 g/mol), and mMgO is the initial mass of MgO added to the reaction (mg, 100 mg). Assuming constant surface area (S) during the initial phase, the dissolution rate (r, in mol·cm−2·s−1) is derived from the linear slope of proton consumption:
10 pH 0 10 pH = 2 r S V R t
where VR is the solution volume (0.40 L), and S is the total surface area (cm2) derived from BET analysis.
Under alkaline conditions (pH > 8), MgO dissolution proceeds via the direct hydration reaction (MgO + H2O → Mg2+ + 2OH). In this regime, the rate was determined by tracking the production of hydroxide ions:
O H t O H 0 = 2 r S V R t
where [OH]t and [OH]0 represent the measured and initial hydroxide concentrations, respectively, and other terms are as defined previously.
Linear regression was performed on the kinetic data within the initial 5 s of the reaction. This interval represents the duration over which the pH-time relationship remained linear across all experimental conditions; linearity was verified for each experiment individually. Extending the measurement window would capture dissolution–precipitation equilibrium rather than initial surface-controlled dissolution, particularly at pH > 8, where Mg(OH)2 precipitation begins almost immediately. The InLab Expert electrode has a response time of less than 3 s, and with data logged at 1–2 s intervals, 3–5 data points were available within each regression window. The slopes from these regressions were used to calculate the specific dissolution rate r. For the multiphase LBM, this calculated rate represents the effective release of hydroxide ions from the bulk material, providing a practical index of reactivity for cement formulation. At near-neutral and alkaline pH (rates of 10−11 to 10−12 mol/cm2/s), less than 0.1% of the initial material dissolves within 5 s, ensuring that surface area changes are negligible. At acidic pH, where dissolution is faster, the verified linearity itself confirms approximately constant reactive surface area during the measurement interval.
To independently validate the stoichiometric pH-based calculations, the dissolution rate was also calculated directly from the magnesium ion concentration measured via ICP-AES:
r = M g 2 + · V R S · t
This method provides a direct quantification of mass transfer without assumptions regarding surface speciation or proton consumption stoichiometry.

2.5. Aqueous Sampling and ICP-AES Analysis

Selected experiments included direct determination of dissolved magnesium to validate the pH-based measurements. Aliquots were collected using both automated sampling (EasySampler, Mettler Toledo) and manual syringe sampling. The automated system withdrew 20 μL samples at 2.86 min intervals from a consistent depth of 2 cm below the solution surface. Manual sampling using 5 mL syringes provided additional time points at 1, 2, 3, 4, and 5 min to capture initial kinetics. All samples were immediately filtered through 0.45 μm PTFE syringe filters to remove suspended particles. Filtered samples were diluted 1:10 with 2% HNO3 (trace metal grade) to stabilize dissolved species and prevent precipitation. Magnesium concentrations were determined by inductively coupled plasma atomic emission spectroscopy (ICP-AES) within 24 h of collection, with most samples analyzed within 4–6 h. The instrument was calibrated using matrix-matched standards with detection limits of 0.01 mg/L and analytical precision better than 2% RSD.

2.6. Language Editing Tools

During the preparation of this manuscript, the authors used Grammarly, 2026, for the purposes of English language and grammar corrections. The authors have reviewed and edited the output and take full responsibility for the content of this publication.

3. Results and Discussion

3.1. Precursor Characteristics

As discussed in Section 2.1, Table 1 highlights distinct compositional and microstructural differences between the two precursors. Commercial LBM contains significant impurities (7.5 wt% CaO, 3.18 wt% SiO2) and possesses a specific surface area (SSA) of 32.3 m2/g, whereas STM is analytically pure with a lower SSA of 10.1 m2/g.
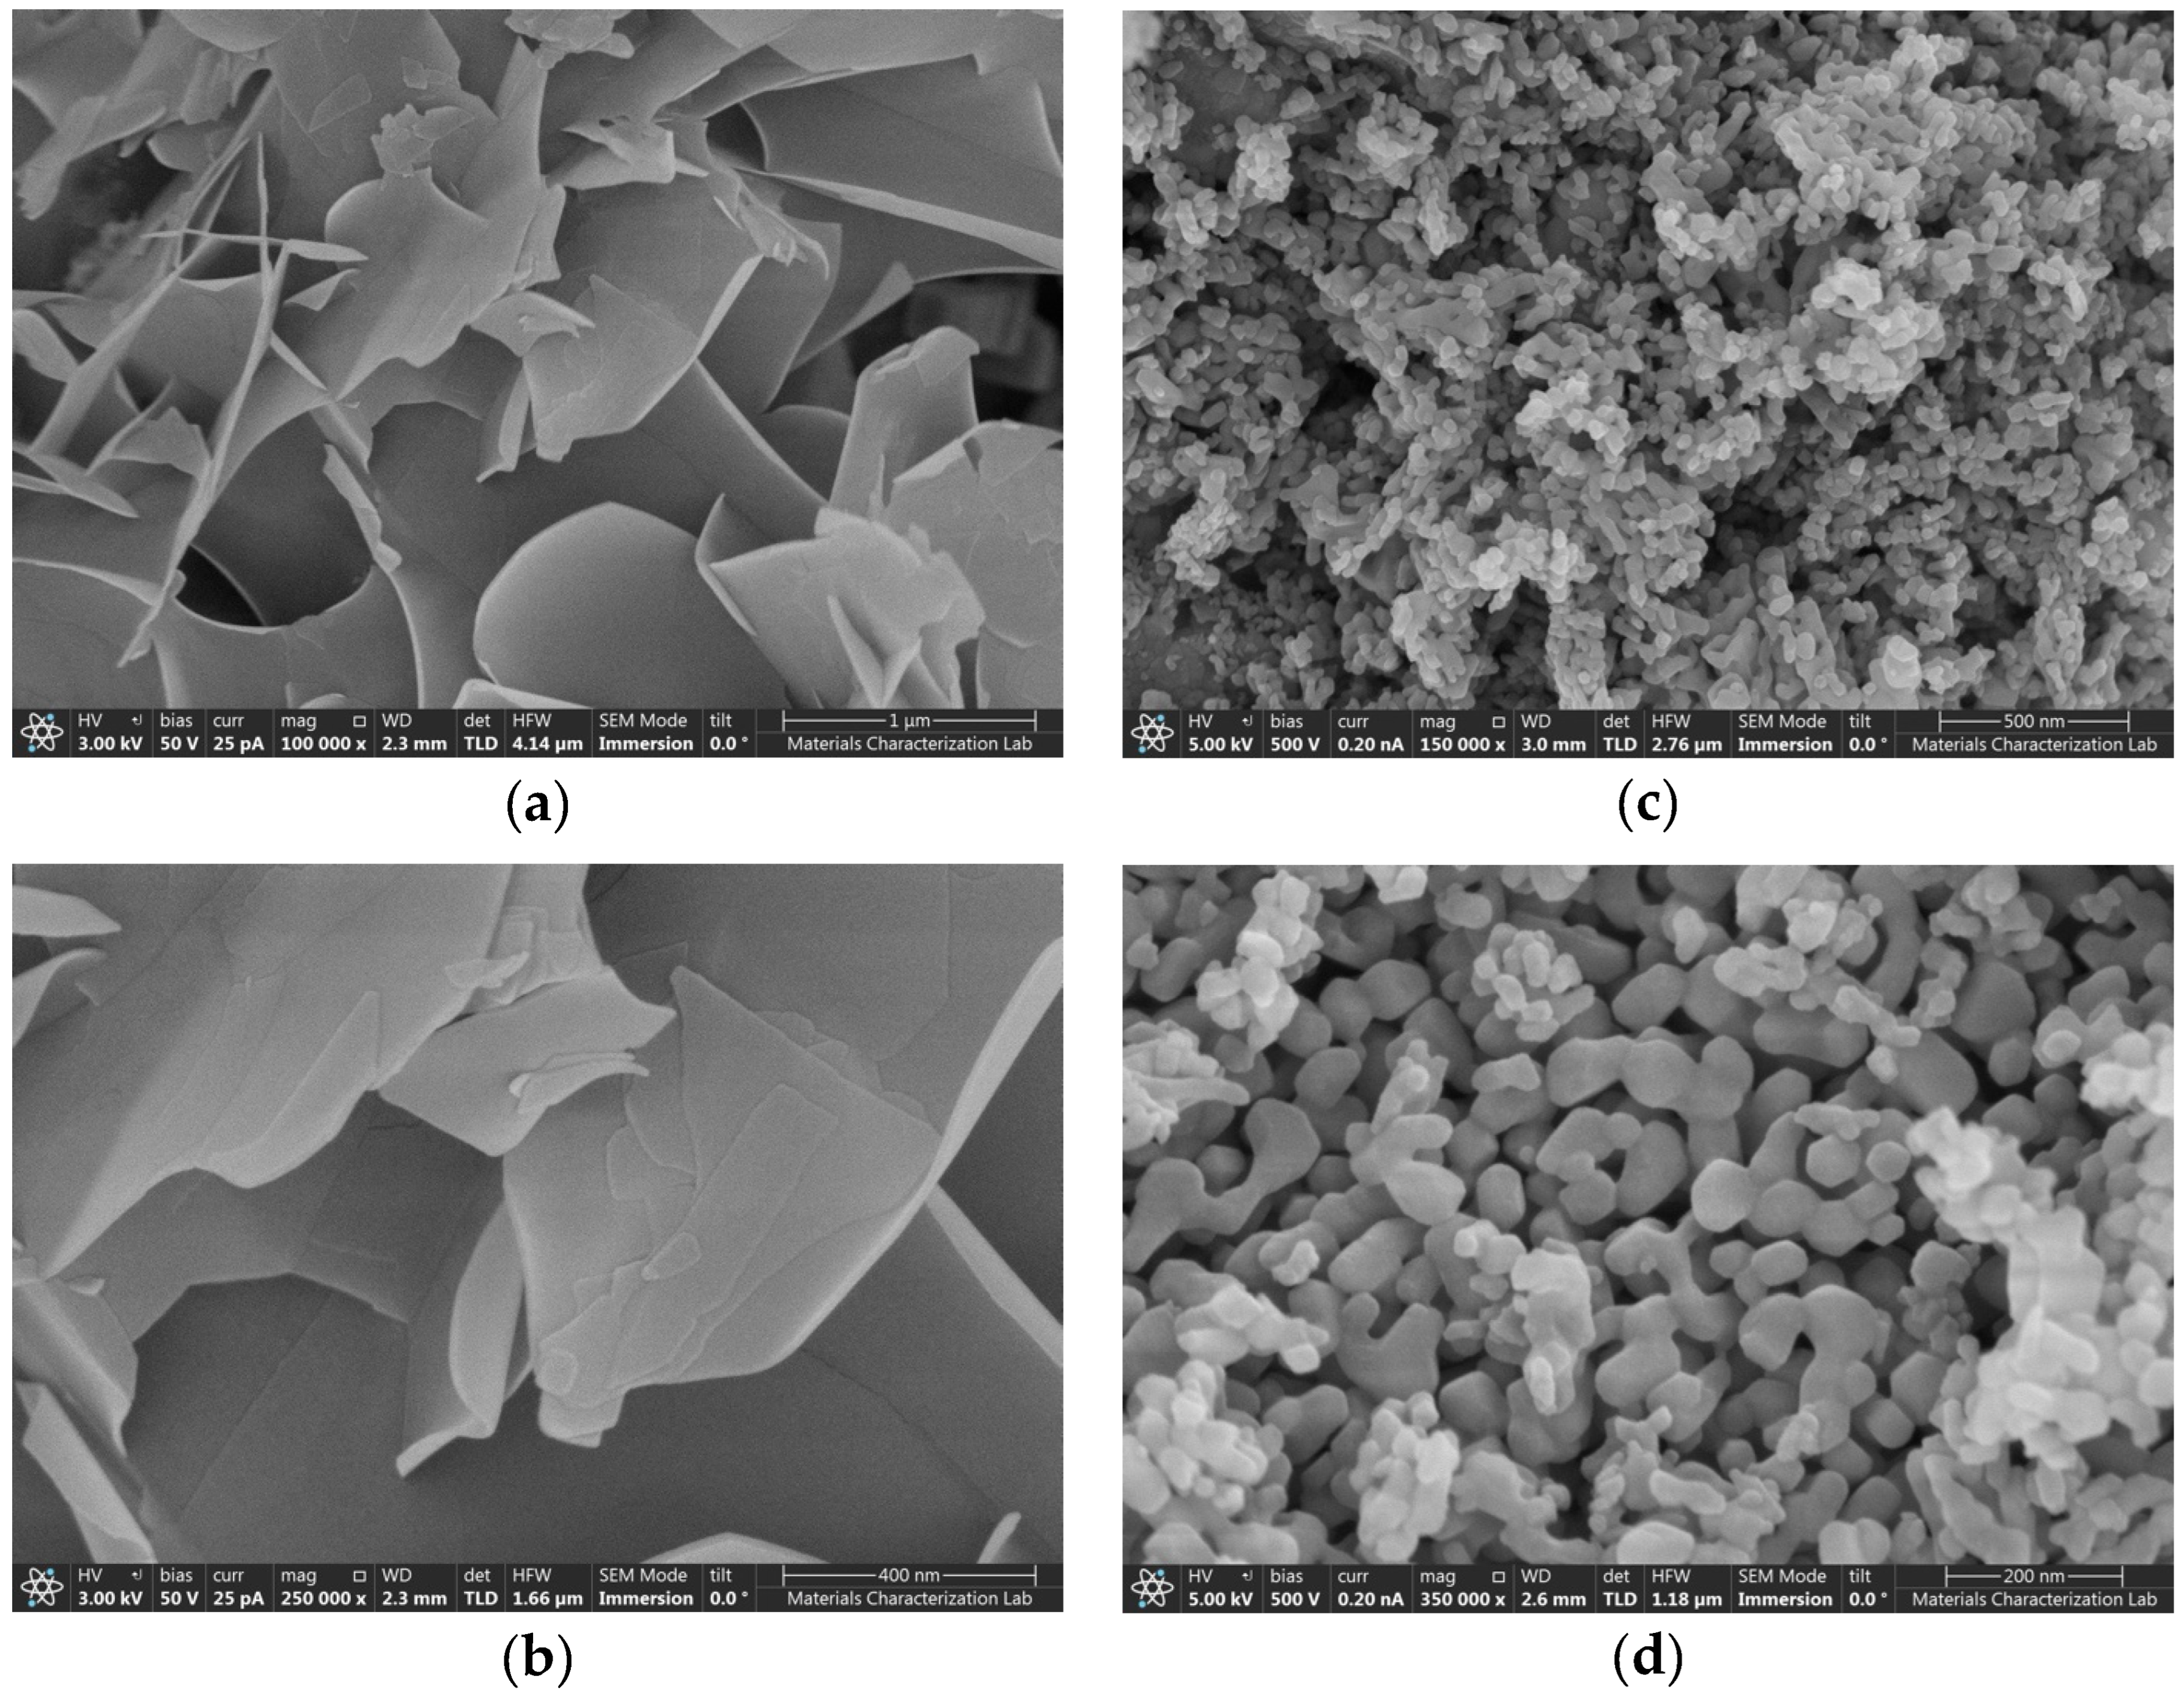
SEM imaging (Figure 1) links the threefold SSA disparity to particle texture. STM (Figure 1a,b) appears dense, with monolithic particles of smooth cleavage surfaces. In contrast, LBM (Figure 1c,d) consists of hierarchical aggregates of primary nanoparticles, creating a rough, open texture.
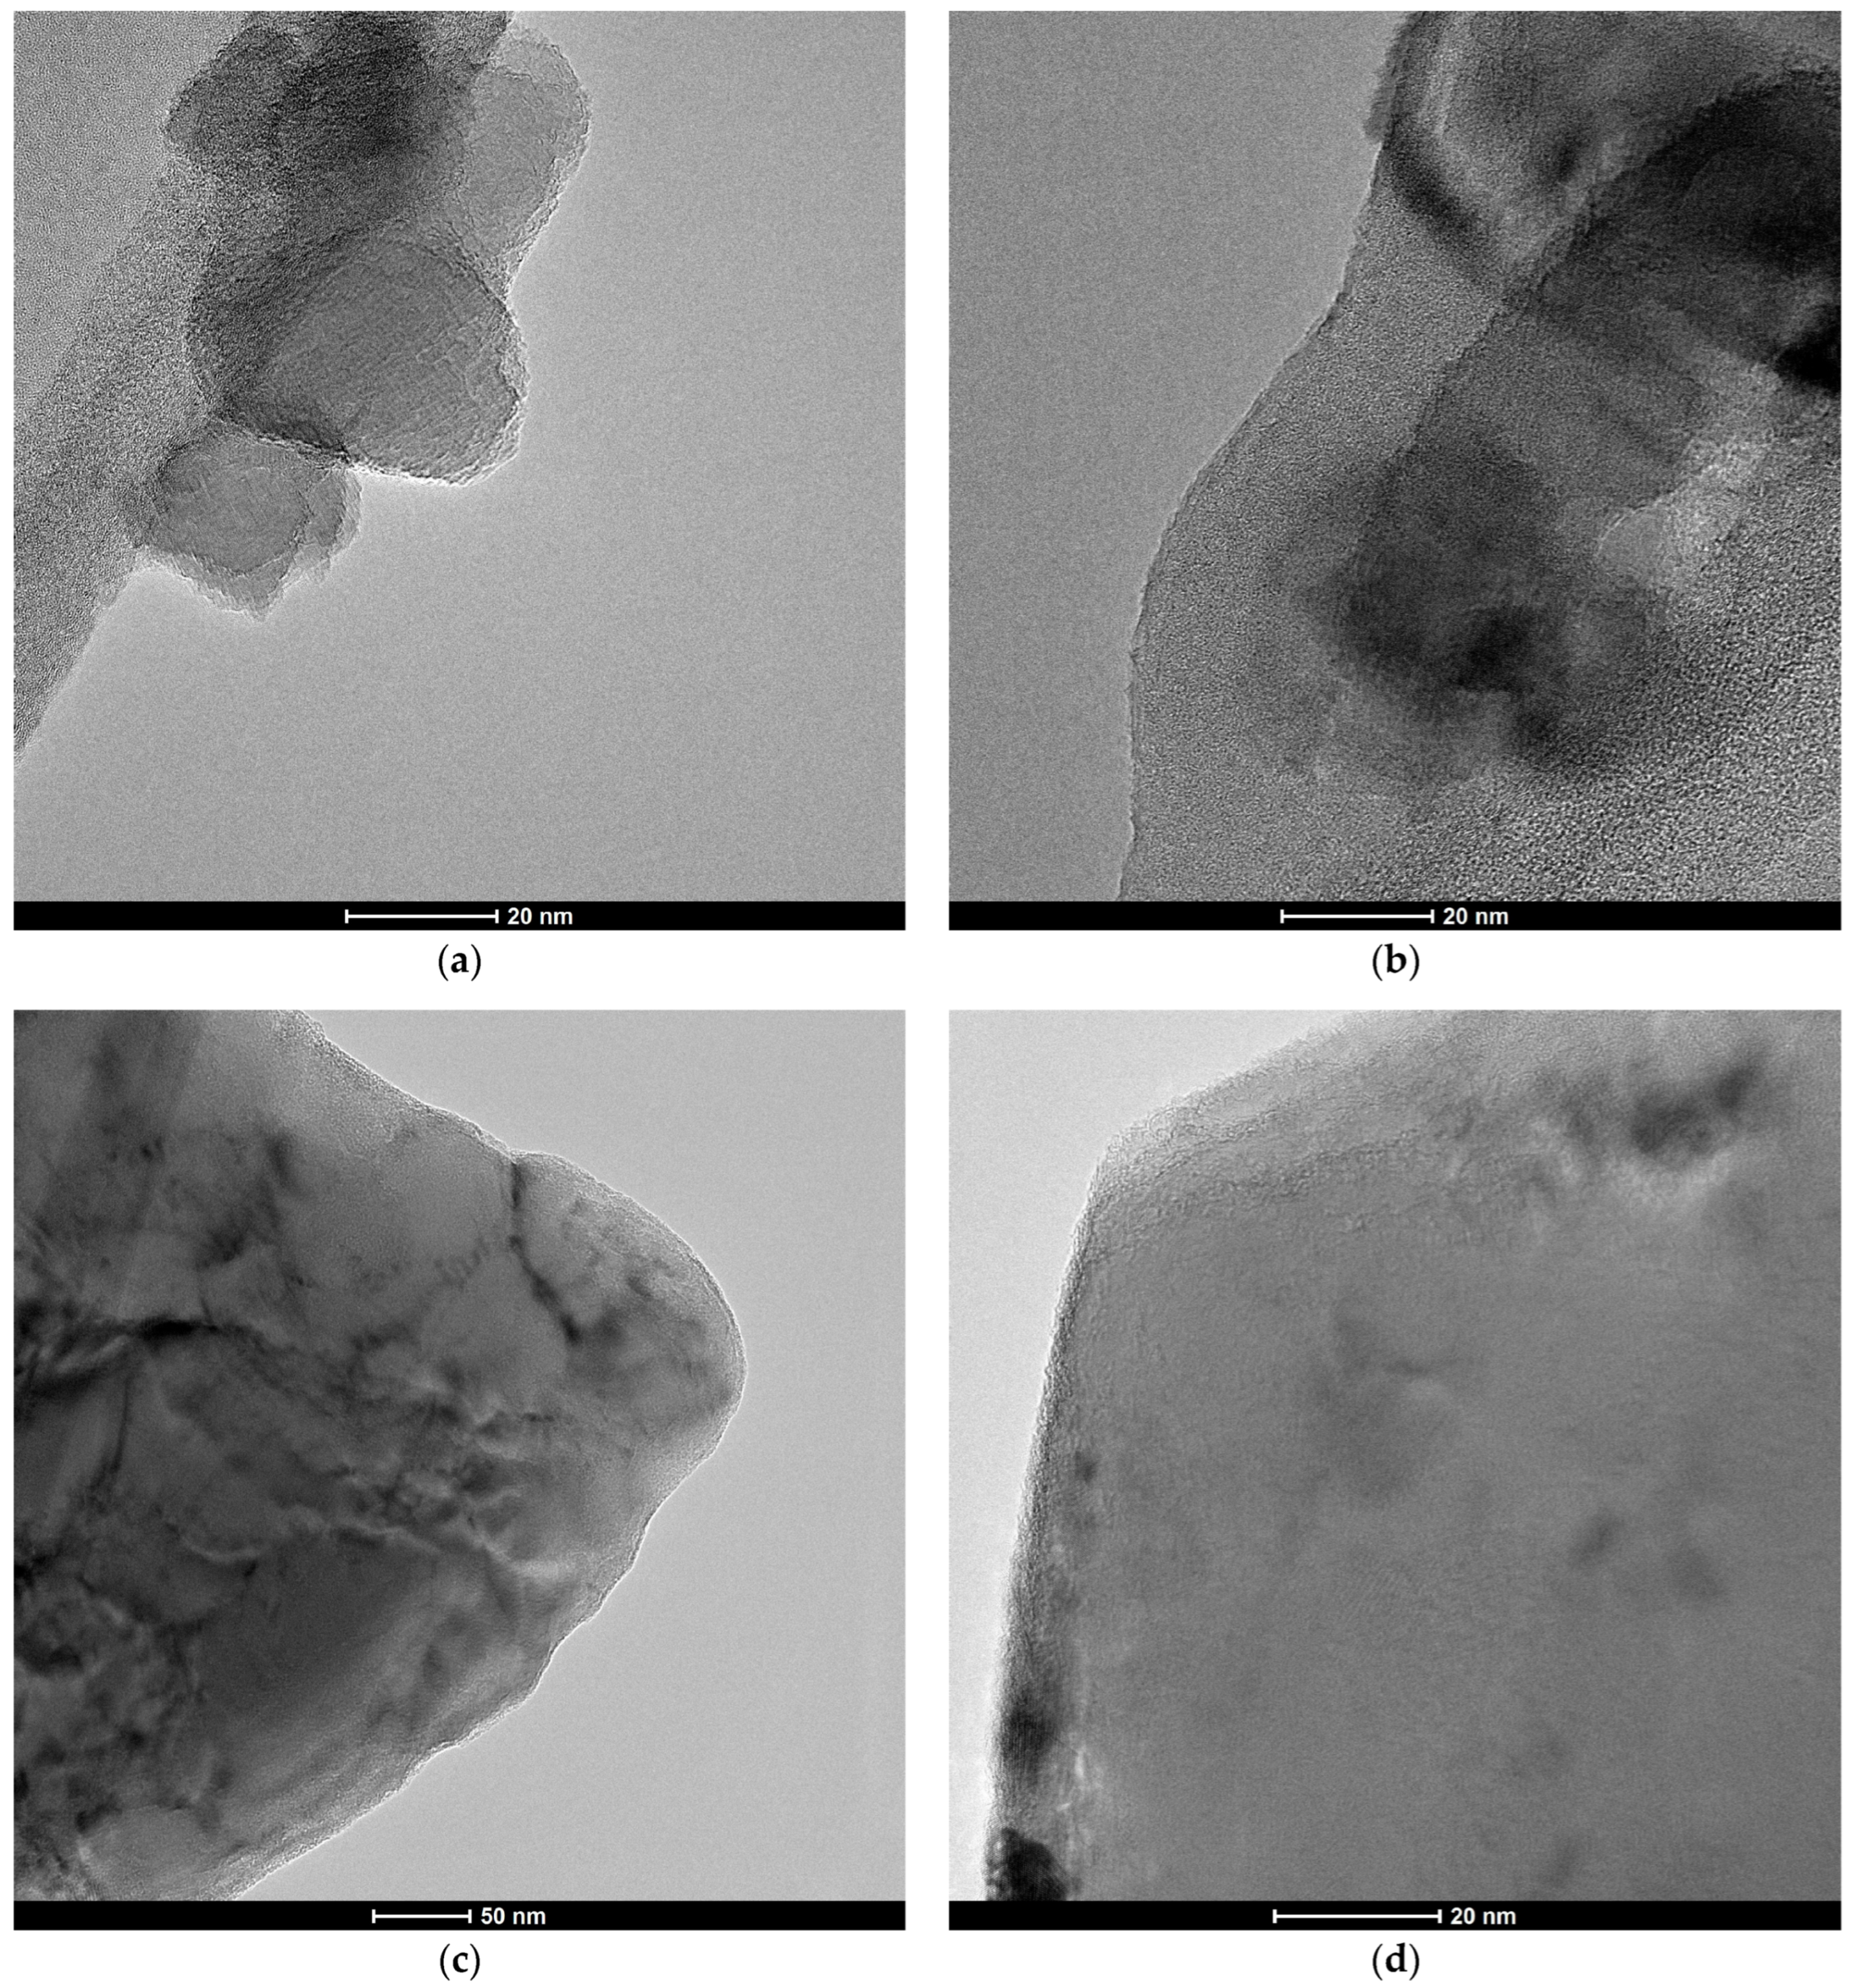
TEM analysis (Figure 2) supports this observation; STM displays sharp, faceted terminations (Figure 2c,d) indicative of high crystallinity, while LBM particles exhibit diffuse, irregular boundaries (Figure 2a,b). These features confirm that the elevated SSA of LBM arises from external roughness and particle aggregation rather than a well-defined internal pore network.
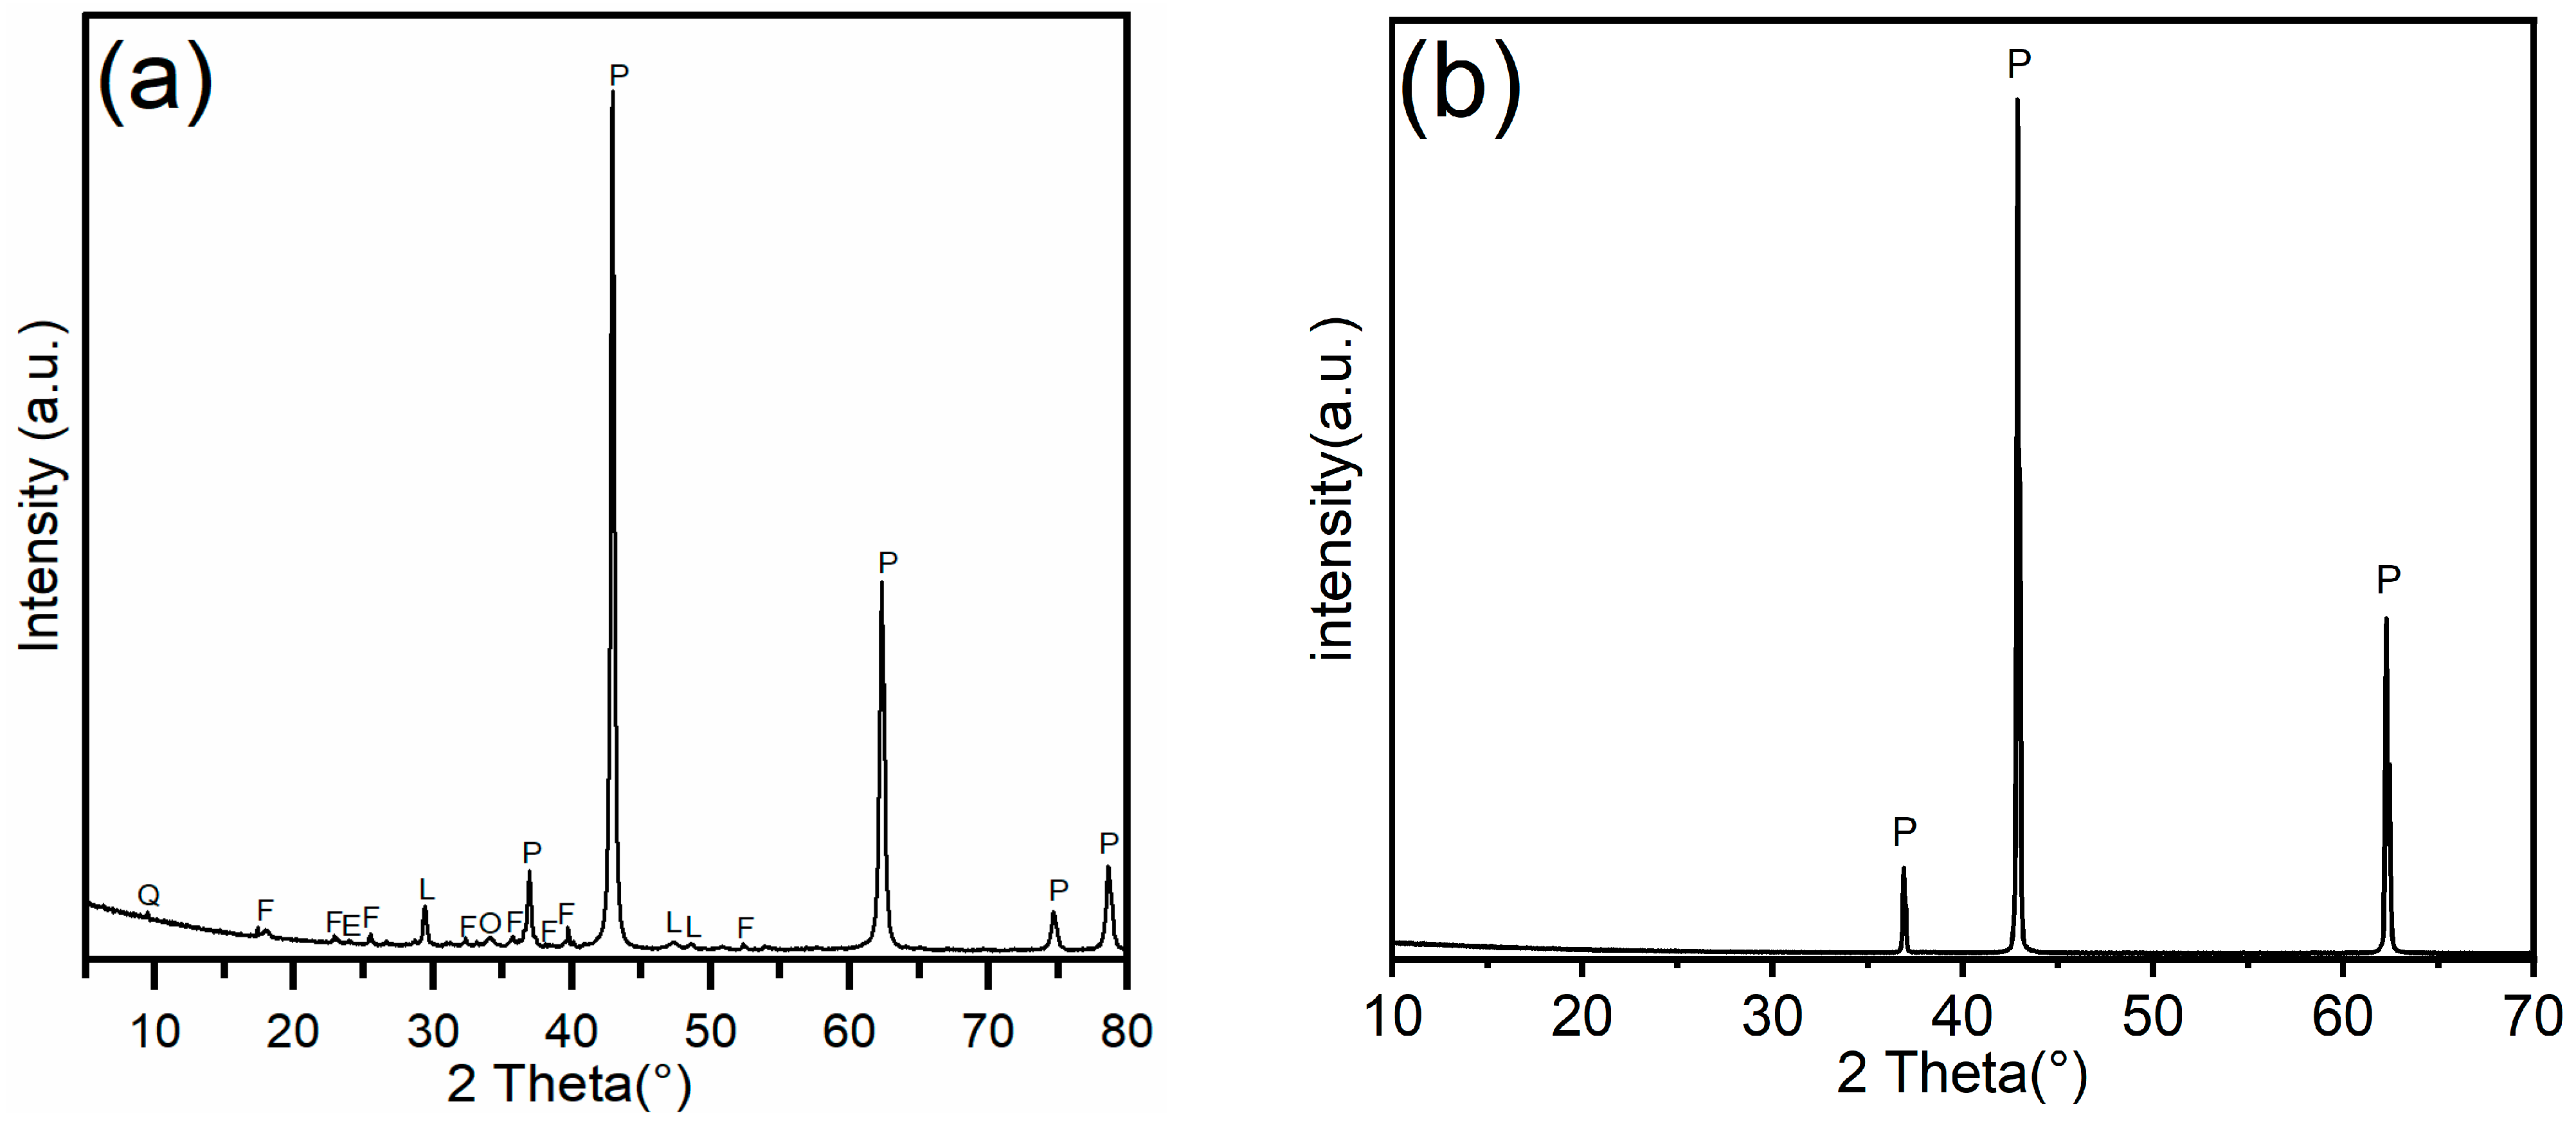
Notably, the dissolution kinetics (Section 3.2) demonstrate that LBM exhibits a significantly higher reaction rate than STM even after normalizing for specific surface area. This implies that the intrinsic reactivity per unit surface area of LBM is superior. XRD profiles (Figure 3) provide crystallographic evidence for this enhancement. Unlike the sharp, high-intensity periclase peaks of STM (Figure 3b), the LBM patterns (Figure 3a) show broadened reflections and a complex assemblage of minor phases, including quartz (Q), forsterite (F), and calcite (L). The observed peak broadening in the periclase phase is consistent with reduced crystallite size and lattice microstrain, pointing to a higher density of surface defects (e.g., steps and vacancies) that serve as thermodynamically active sites for dissolution. The periclase reflection intensity under identical measurement conditions reached approximately 27,000 counts for LBM versus 82,000 counts for STM, providing a semi-quantitative measure of the crystallinity difference.
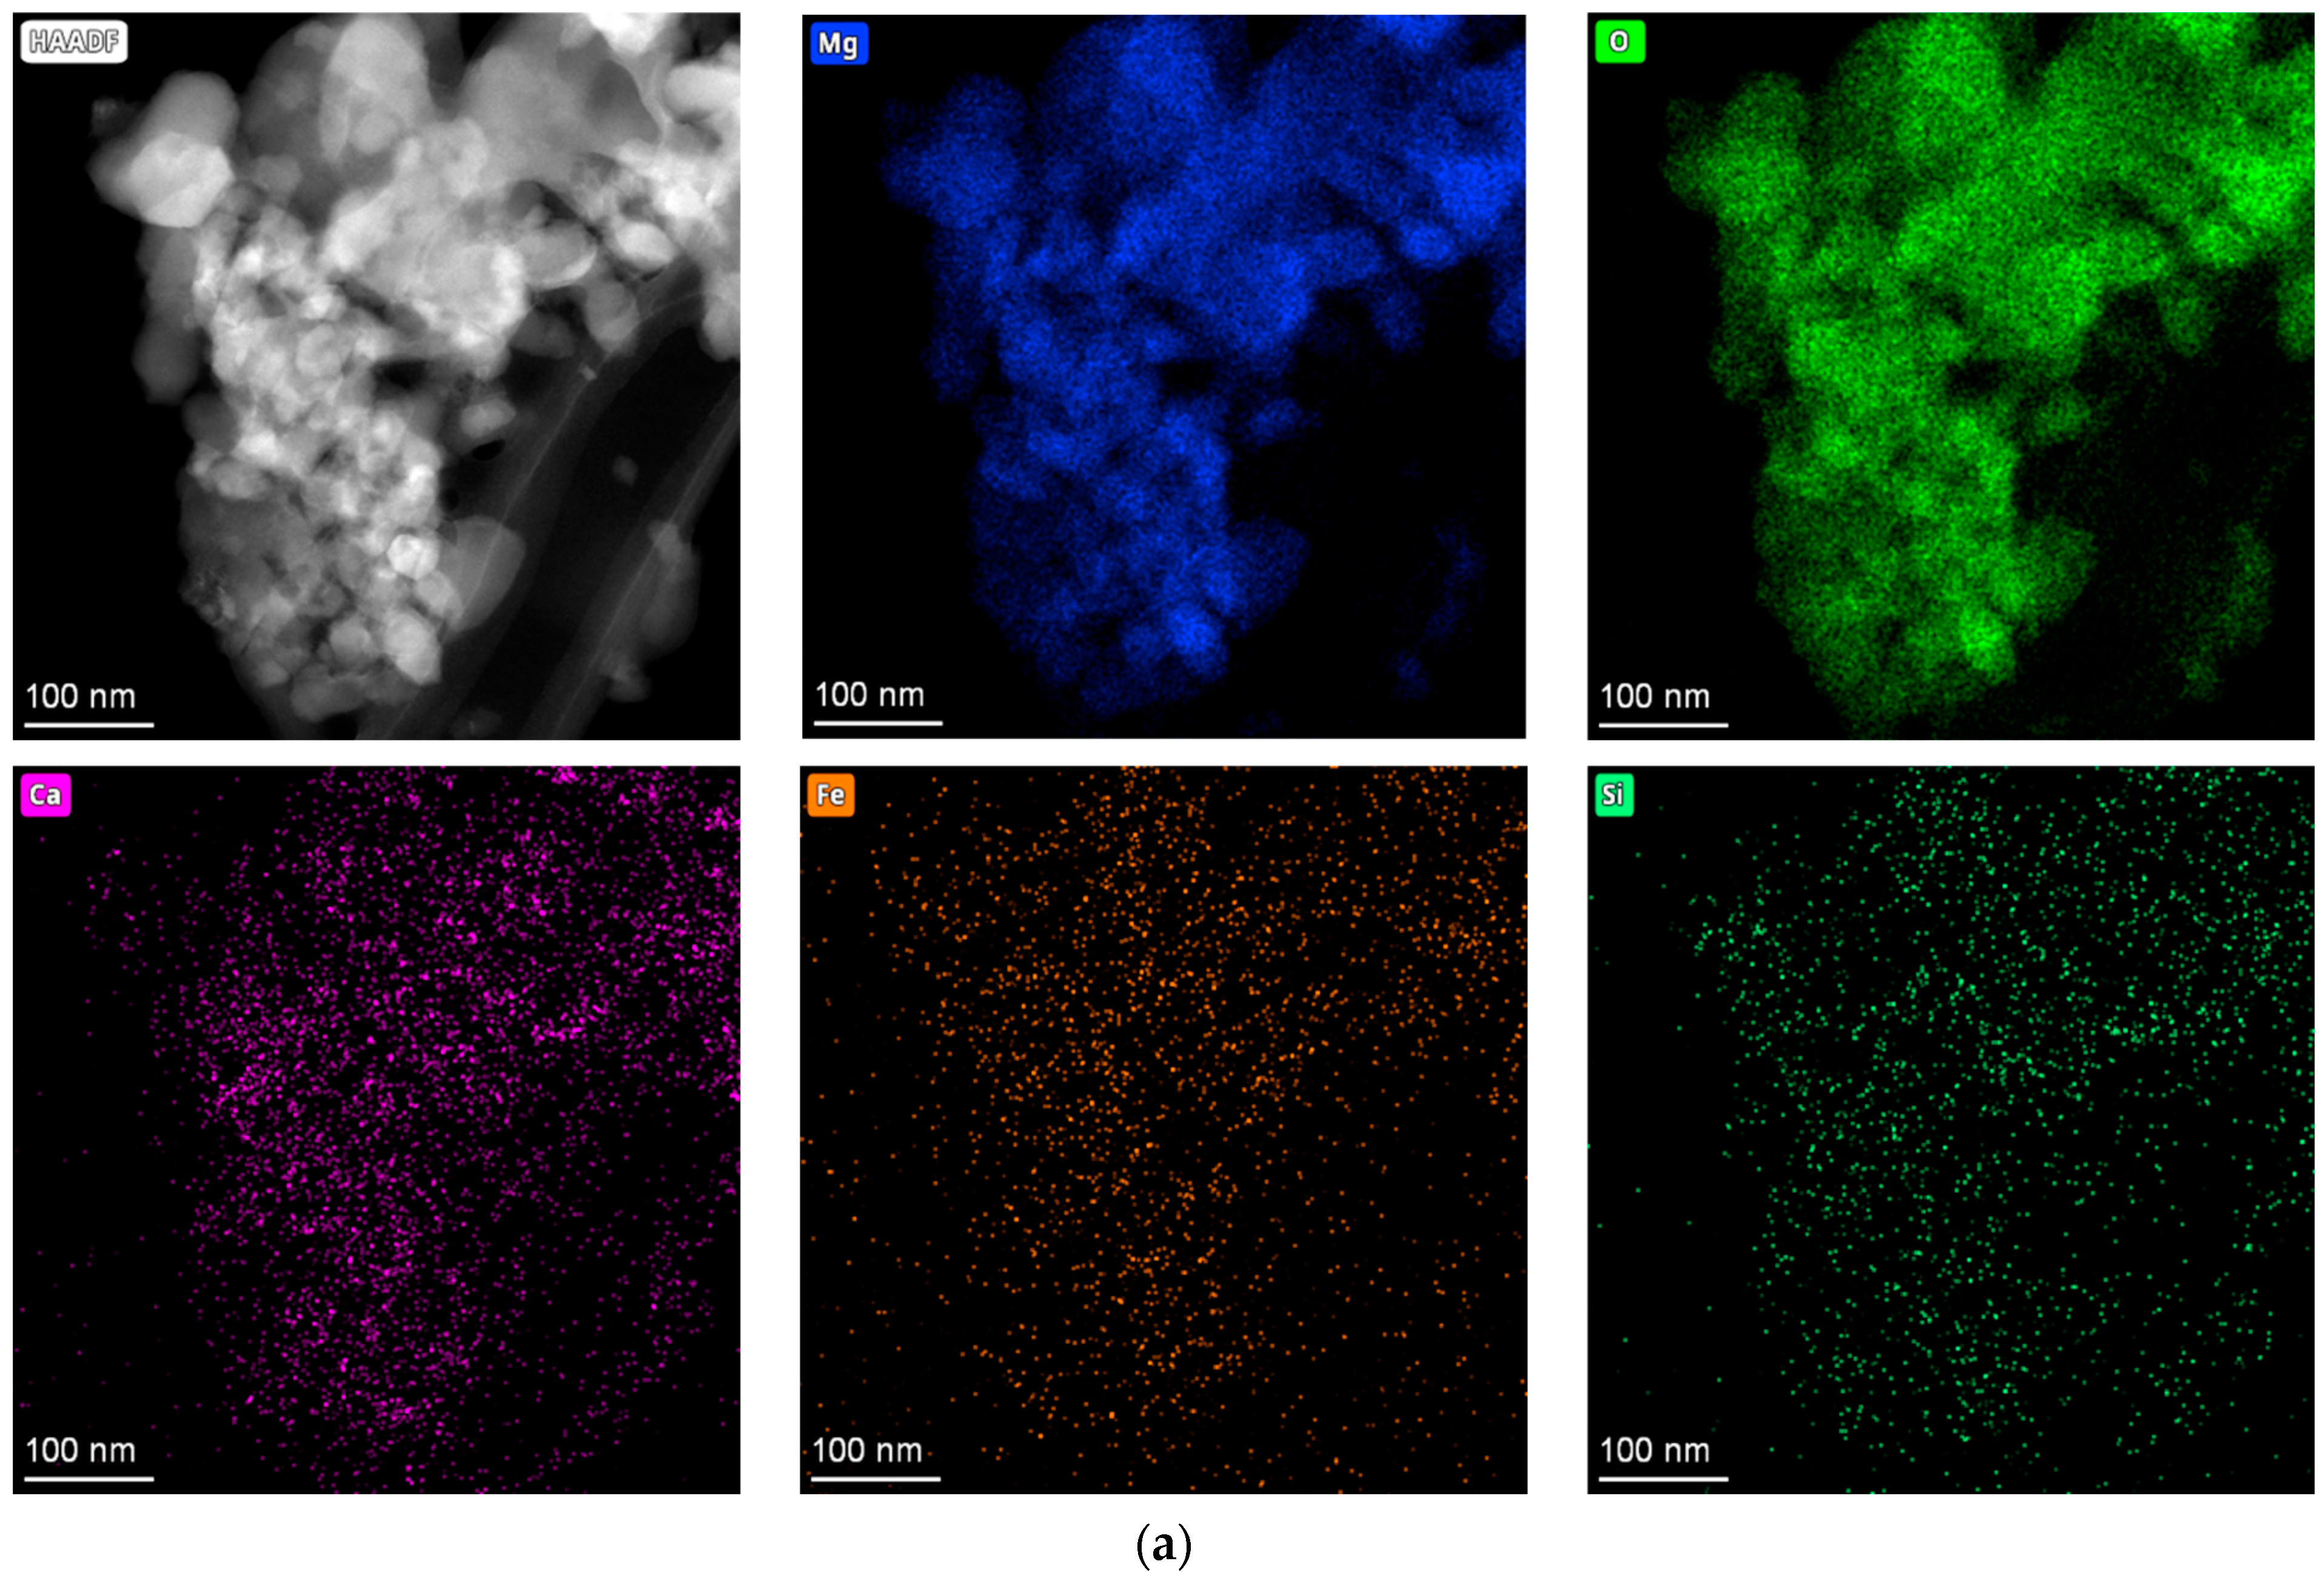
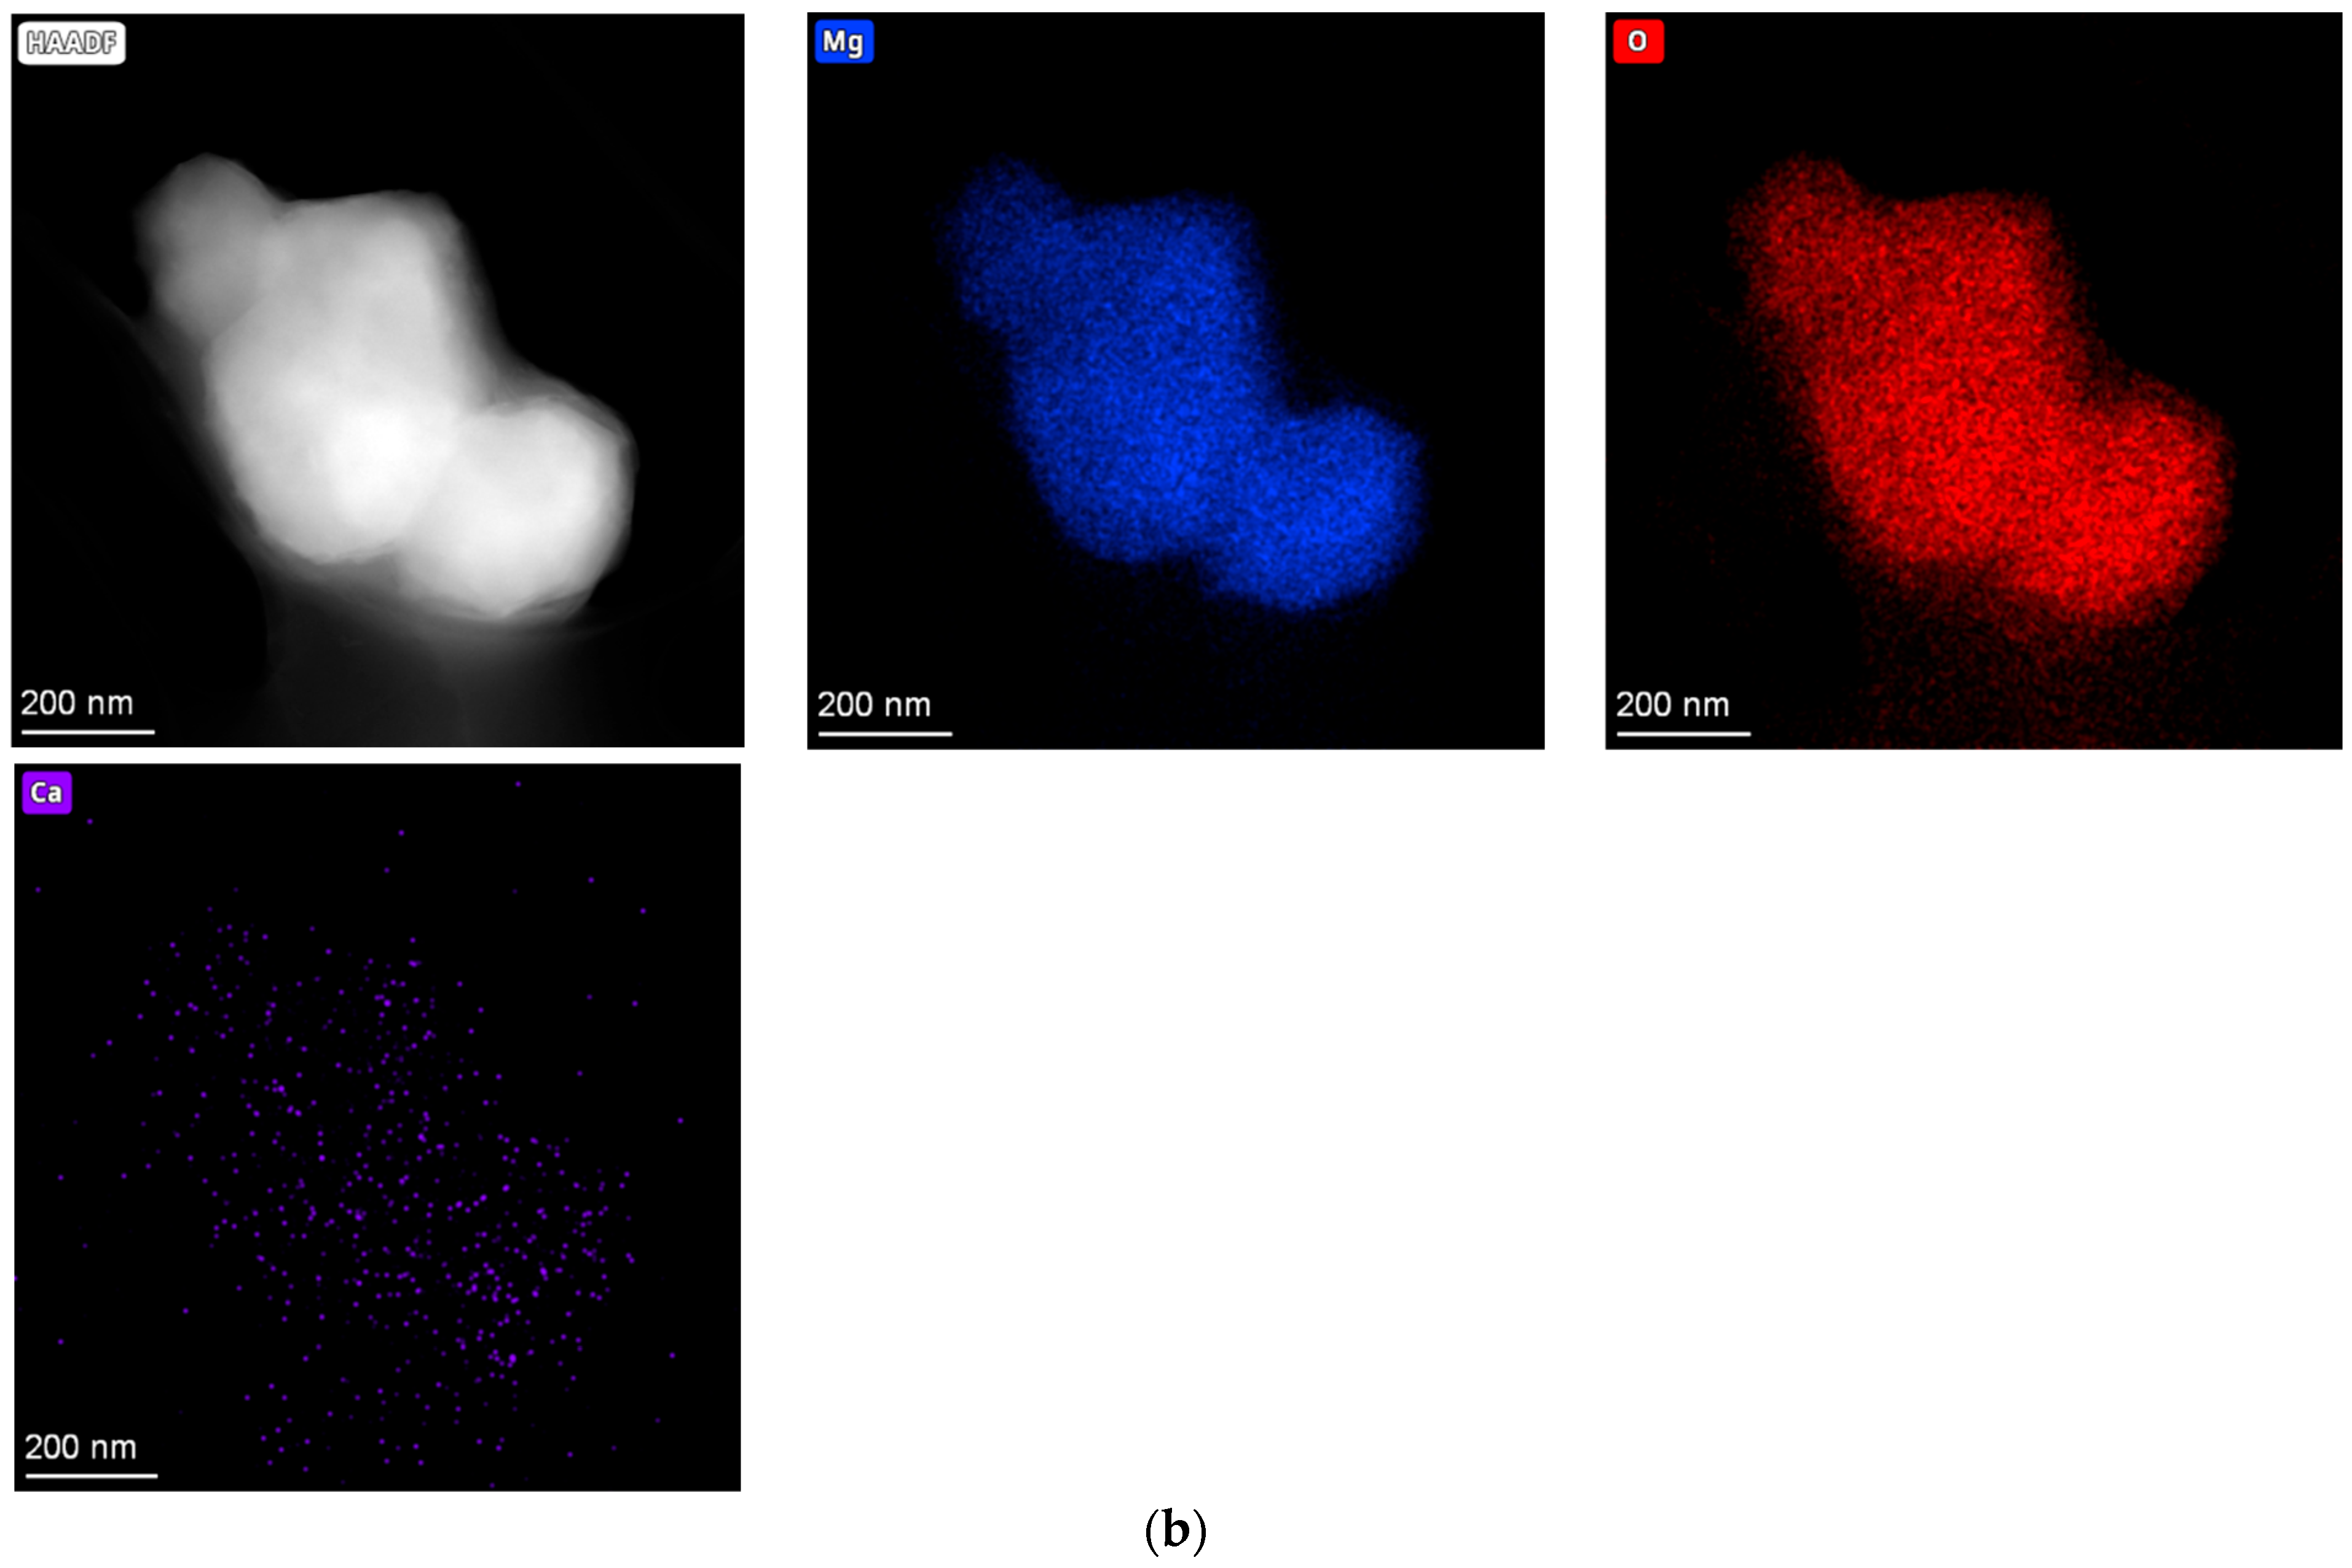
Complementary high-angle annular dark-field (HAADF) STEM and EDS mapping (Figure 4) reveal a clear chemical contrast. STM (Figure 4b) shows a uniform distribution of Mg and O. Conversely, LBM (Figure 4a) exhibits nanoscale segregation, where Ca and Si impurities appear as localized clusters rather than a uniform solid solution. These domains correspond to the minor phases (e.g., calcite and silicates) identified in XRD. The interfaces between these impurity phases and the MgO matrix likely create boundaries of mismatched solubility. Preferential leaching of these more soluble domains may generate local initiation points for dissolution, providing a secondary kinetic pathway absent in the chemically homogeneous STM. The BET surface area includes contributions from micropores and internal textural porosity that may not be fully accessible to aqueous solutions within the initial measurement window. Rates normalized to BET area, therefore, represent conservative estimates; the intrinsic rate per unit of actually reactive surface would be higher. BET normalization is the standard approach in prior MgO dissolution studies [20,21], ensuring direct comparability with the existing literature.

3.2. Comparative Dissolution Kinetics of LBM and STM

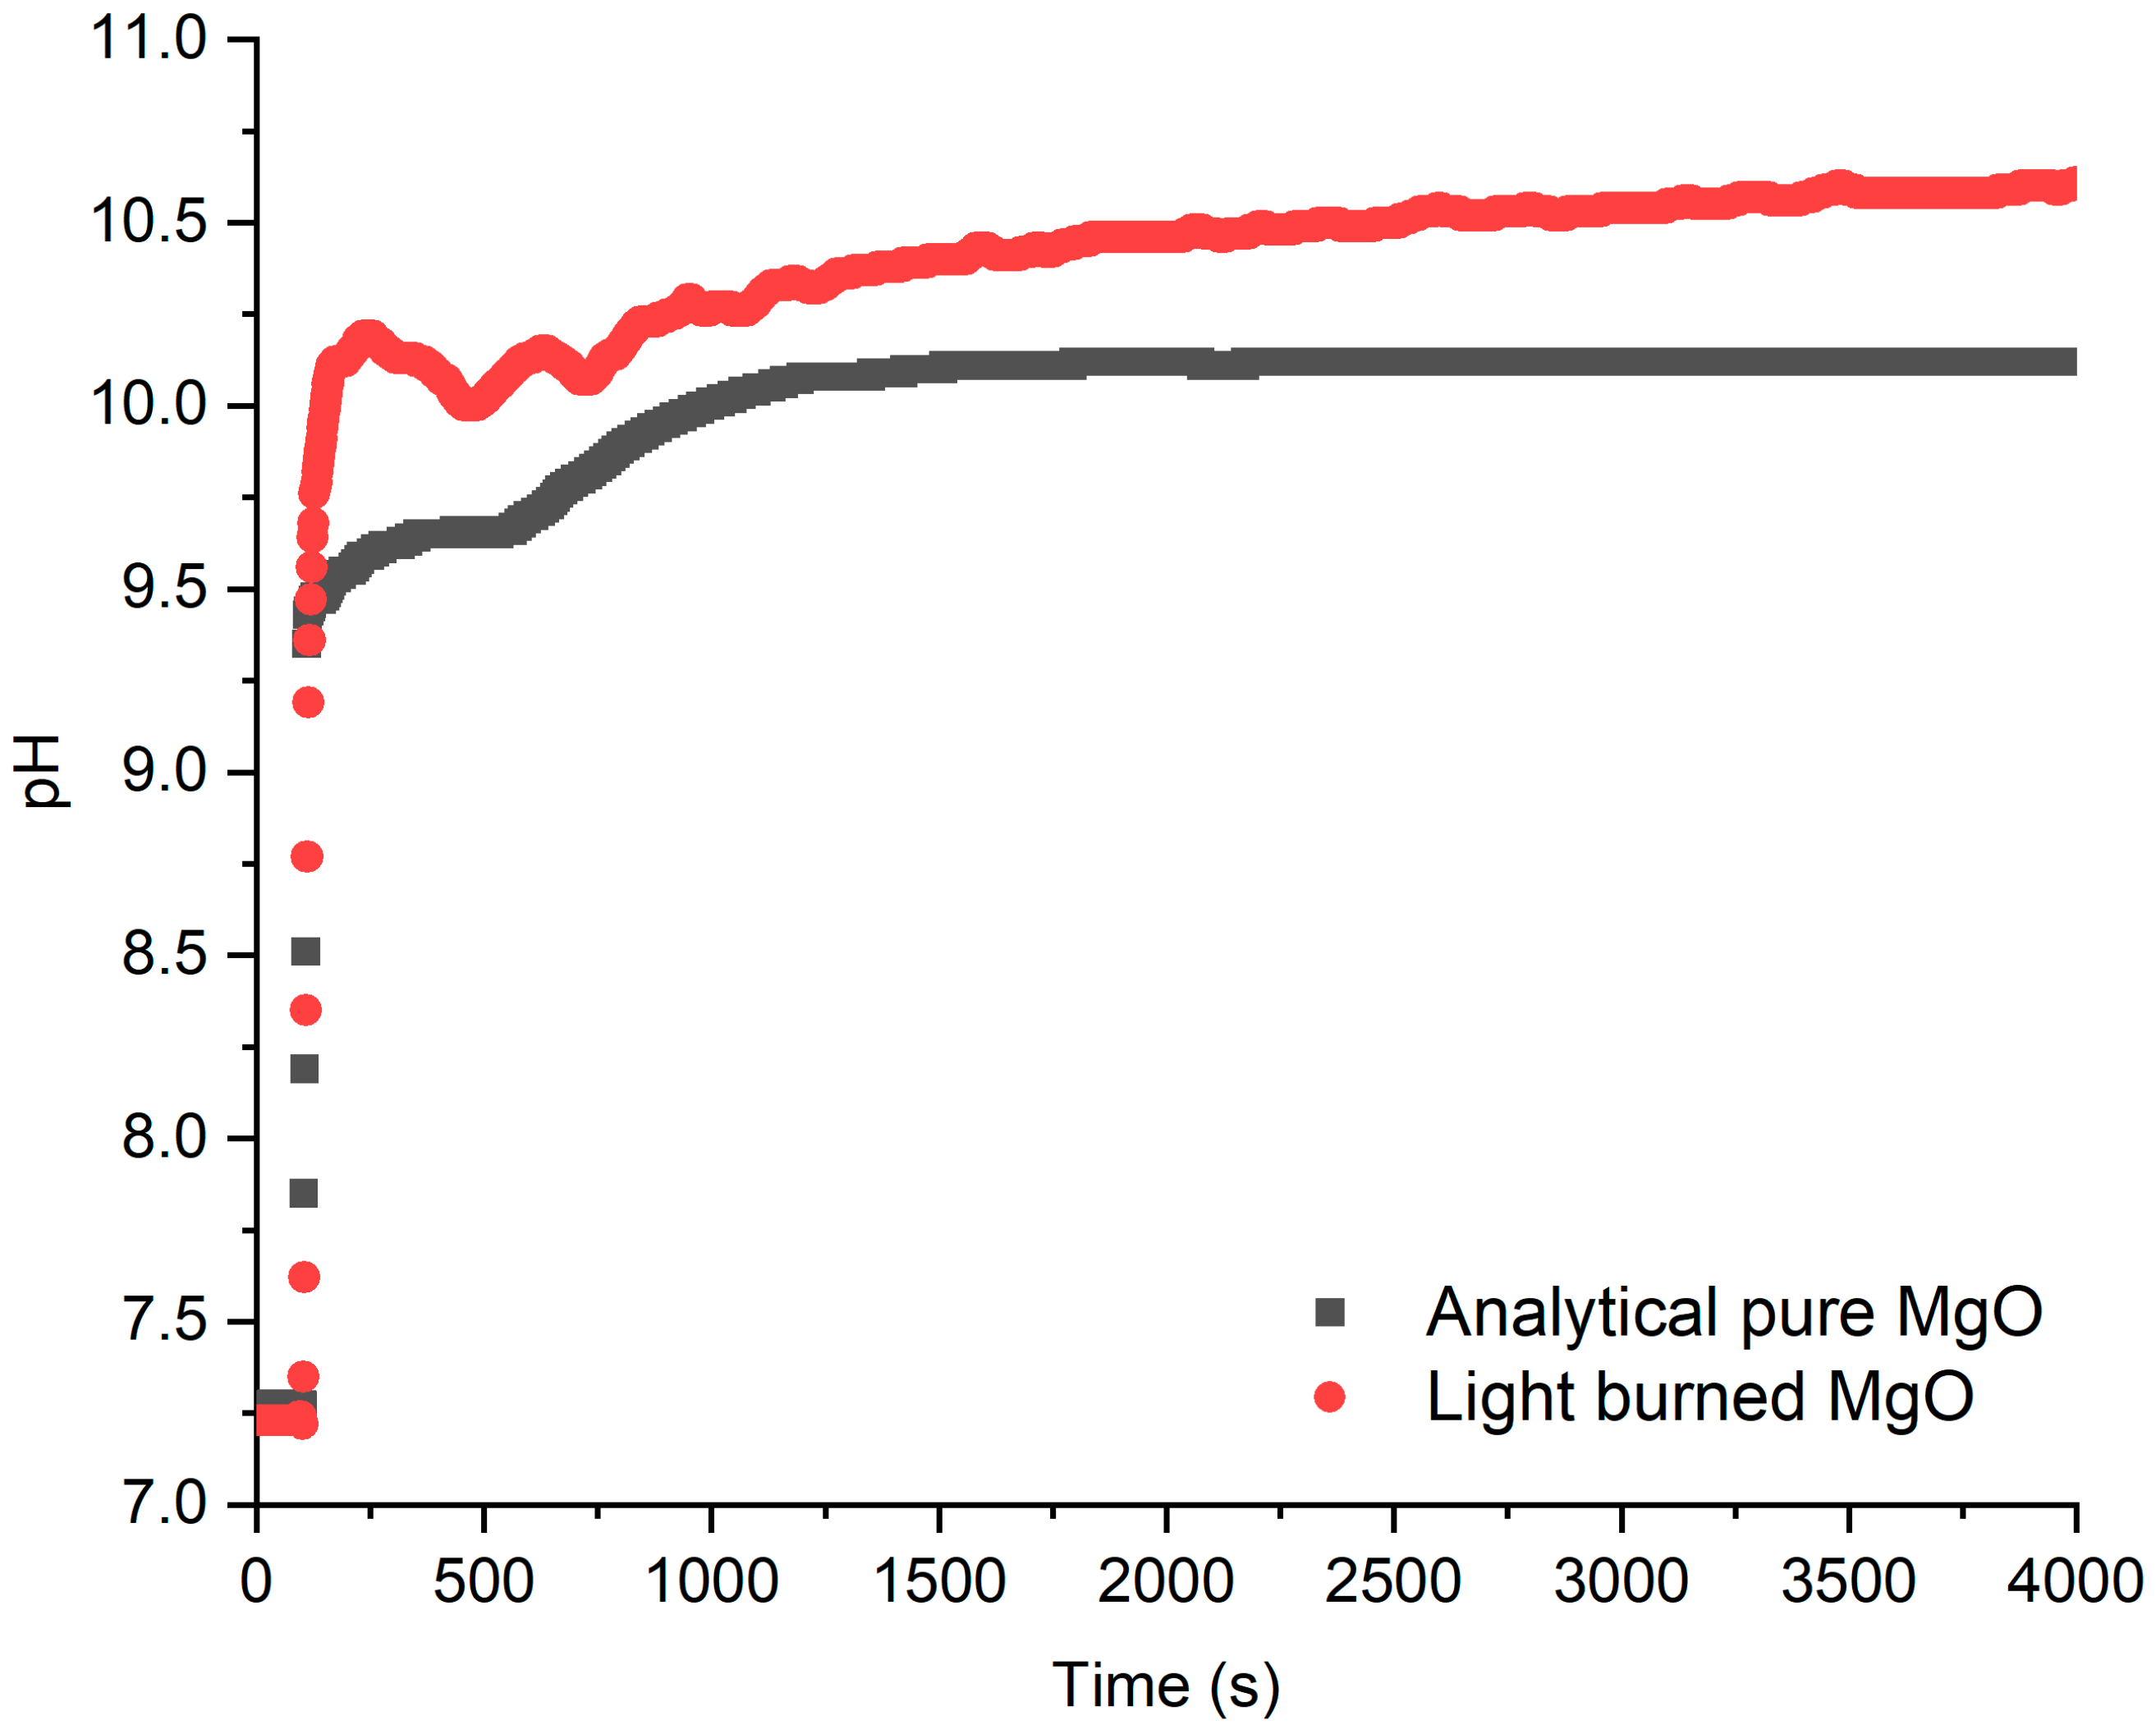
To quantify the impact of the physicochemical differences identified in Section 3.1, dissolution kinetics of LBM were benchmarked against high-purity synthetic magnesia (STM) at 25 °C and 35 °C under near-neutral conditions. As shown in Figure 5, both materials exhibit an instantaneous, near-vertical pH rise within the first seconds, confirming that rapid surface hydroxylation is intrinsic to both commercial and synthetic magnesia. STM follows a smooth progression toward an equilibrium, consistent with the dissolution of a homogeneous, single-phase solid. In contrast, LBM displays a distinct non-monotonic profile characterized by an initial overshoot and subsequent fluctuations between 200 and 500 s before recovering and ascending to a final equilibrium that exceeds the initial peak. This indicates a dynamic competition between rapid ion release from reactive impurities and transient surface precipitation events, resulting in higher equilibrium values (10.5–11.0 for LBM vs. 9.5–10.0 for STM).
Quantitative rates derived from initial linear pH slopes (first 5 s) are presented in Table 2. At 25 °C, STM rates range from 1.0 to 1.4 × 10⁻¹³ mol·cm−2·s−1, consistent with the literature values for crystalline, low-defect periclase [18]. In contrast, LBM rates under comparable conditions range from 3.3 × 10⁻⁹ to 7.7 × 10⁻⁸ mol·cm−2·s−1, representing enhancements of one to two orders of magnitude over STM rates, even after SSA normalization. This disparity persists at 35 °C, where STM rates remain largely unchanged while LBM maintains elevated dissolution flux.
The enhanced kinetics reflect the combined physicochemical characteristics identified in Section 3.1: smaller crystallite size and structural disorder providing higher reactive site density, textural porosity enabling water access to internal surfaces, and multiphase composition. With a molar ratio of MgO to CaO of approximately 16.3:1, portlandite contributes to the initial rapid pH rise upon contact with water, but the equilibrium pH values (10.5–11.0) align with Mg(OH)2 saturation rather than Ca(OH)2 saturation (pH ~12.4), indicating that the overall dissolution process is governed by the more abundant MgO phase. STEM-EDS mapping (Figure 4a) reveals that Ca-bearing phases form localized nanoscale domains whose preferential dissolution may create local alkaline microenvironments and physical voids exposing fresh MgO surfaces, acting as a secondary kinetic enhancement. The pH method thus captures the combined reactivity of LBM relevant to MBC applications, where both Mg2+ and Ca2+ participate in binding phase formation.
These findings have direct implications for MBC formulation. LBM’s superior rates at neutral pH ensure efficient Mg2+ supply during early hydration, supporting binding phase formation. However, enhanced kinetics also imply potential batch-to-batch variability from differences in calcination conditions or feedstock impurities, necessitating quality control protocols. The pH-monitoring method, validated against ICP-AES in Section 3.5, provides a practical tool for such characterization. This reference comparison demonstrates the method’s capability to quantify material-dependent reactivity differences, setting the stage for examining LBM’s pH-dependent dissolution behavior across the wider conditions relevant to MBC curing. The ability to quantify these reactivity differences using only pH monitoring, without requiring ICP instrumentation, is relevant to the scalability of MBC quality control in industrial settings where analytical resources may be limited, an important consideration for the sustainable scale-up of MBC technology.

3.3. pH-Dependent Dissolution Mechanisms of LBM

As discussed in Section 3.2, the measured dissolution rates represent the combined behavior of all phases present in LBM, but stoichiometric and equilibrium pH analysis confirm that MgO dissolution dominates the overall signal despite the 7.5 wt% CaO contribution. The measured kinetics, therefore, primarily reflect MgO dissolution across the pH range investigated. The solubility of MgO in aqueous solutions and its resultant dissolution rate are dependent on the pH of the environment. In acidic conditions, solubility is higher. The dissolution reaction in an acidic context can be represented by the following chemical equations:
Mg − OH+ + H+ → Mg2+ + H2O
MgO(s) + 2H+(aq) → Mg2+(aq) + H2O
These reactions describe how MgO interacts with protons (H+) in solution, yielding solvated magnesium ions and water molecules. The higher dissolution rate at lower pH reflects the elevated concentration of H+ ions [20,21]. At a pH below 5, the rate-determining step is proton attack, reliant on the concentration of H+ and pre-existing Mg2+ in the solution; around pH 5, the process transitions to being diffusion-limited due to proton availability [18].
Conversely, at elevated pH levels, MgO’s solubility decreases. It can undergo hydration, leading to the formation of magnesium hydroxide (Mg(OH)2), which has a low solubility product and tends to precipitate from solution:
MgO + H2O → Mg(OH)2
Under highly alkaline conditions, magnesium hydroxide may further interact with hydroxide ions:
Mg(OH)2 + 2OH → Mg(OH)42−
However, due to the low solubility product of Mg(OH)2 (Ksp = 5.61 × 10⁻¹²) [17], it typically precipitates rather than forming soluble complexes. This precipitation can create passivating surface layers that dramatically reduce dissolution rates at pH > 10. The rate-controlling step in alkaline conditions shifts to OH adsorption and subsequent Mg2+ and OH desorption, leading to complex kinetic behavior [18,22]. Furthermore, at pH levels exceeding 10, rapid dissolution of MgO nanocubes into Mg(OH)2 nanosheets has been observed, demonstrating the dynamic nature of the dissolution–precipitation equilibrium [23].
The existing literature reveals that MgO powder dissolution rates are significantly higher than those of single crystals or natural periclase [18,24,25]. This enhancement cannot be explained by surface area differences alone, as these are typically normalized in rate calculations. Instead, factors such as crystallinity, surface defects, and the presence of impurities appear to play crucial roles [10,11,12,13,14]. For commercial LBM materials, the combined effects of these factors remain unquantified, representing a critical knowledge gap for MBC development.
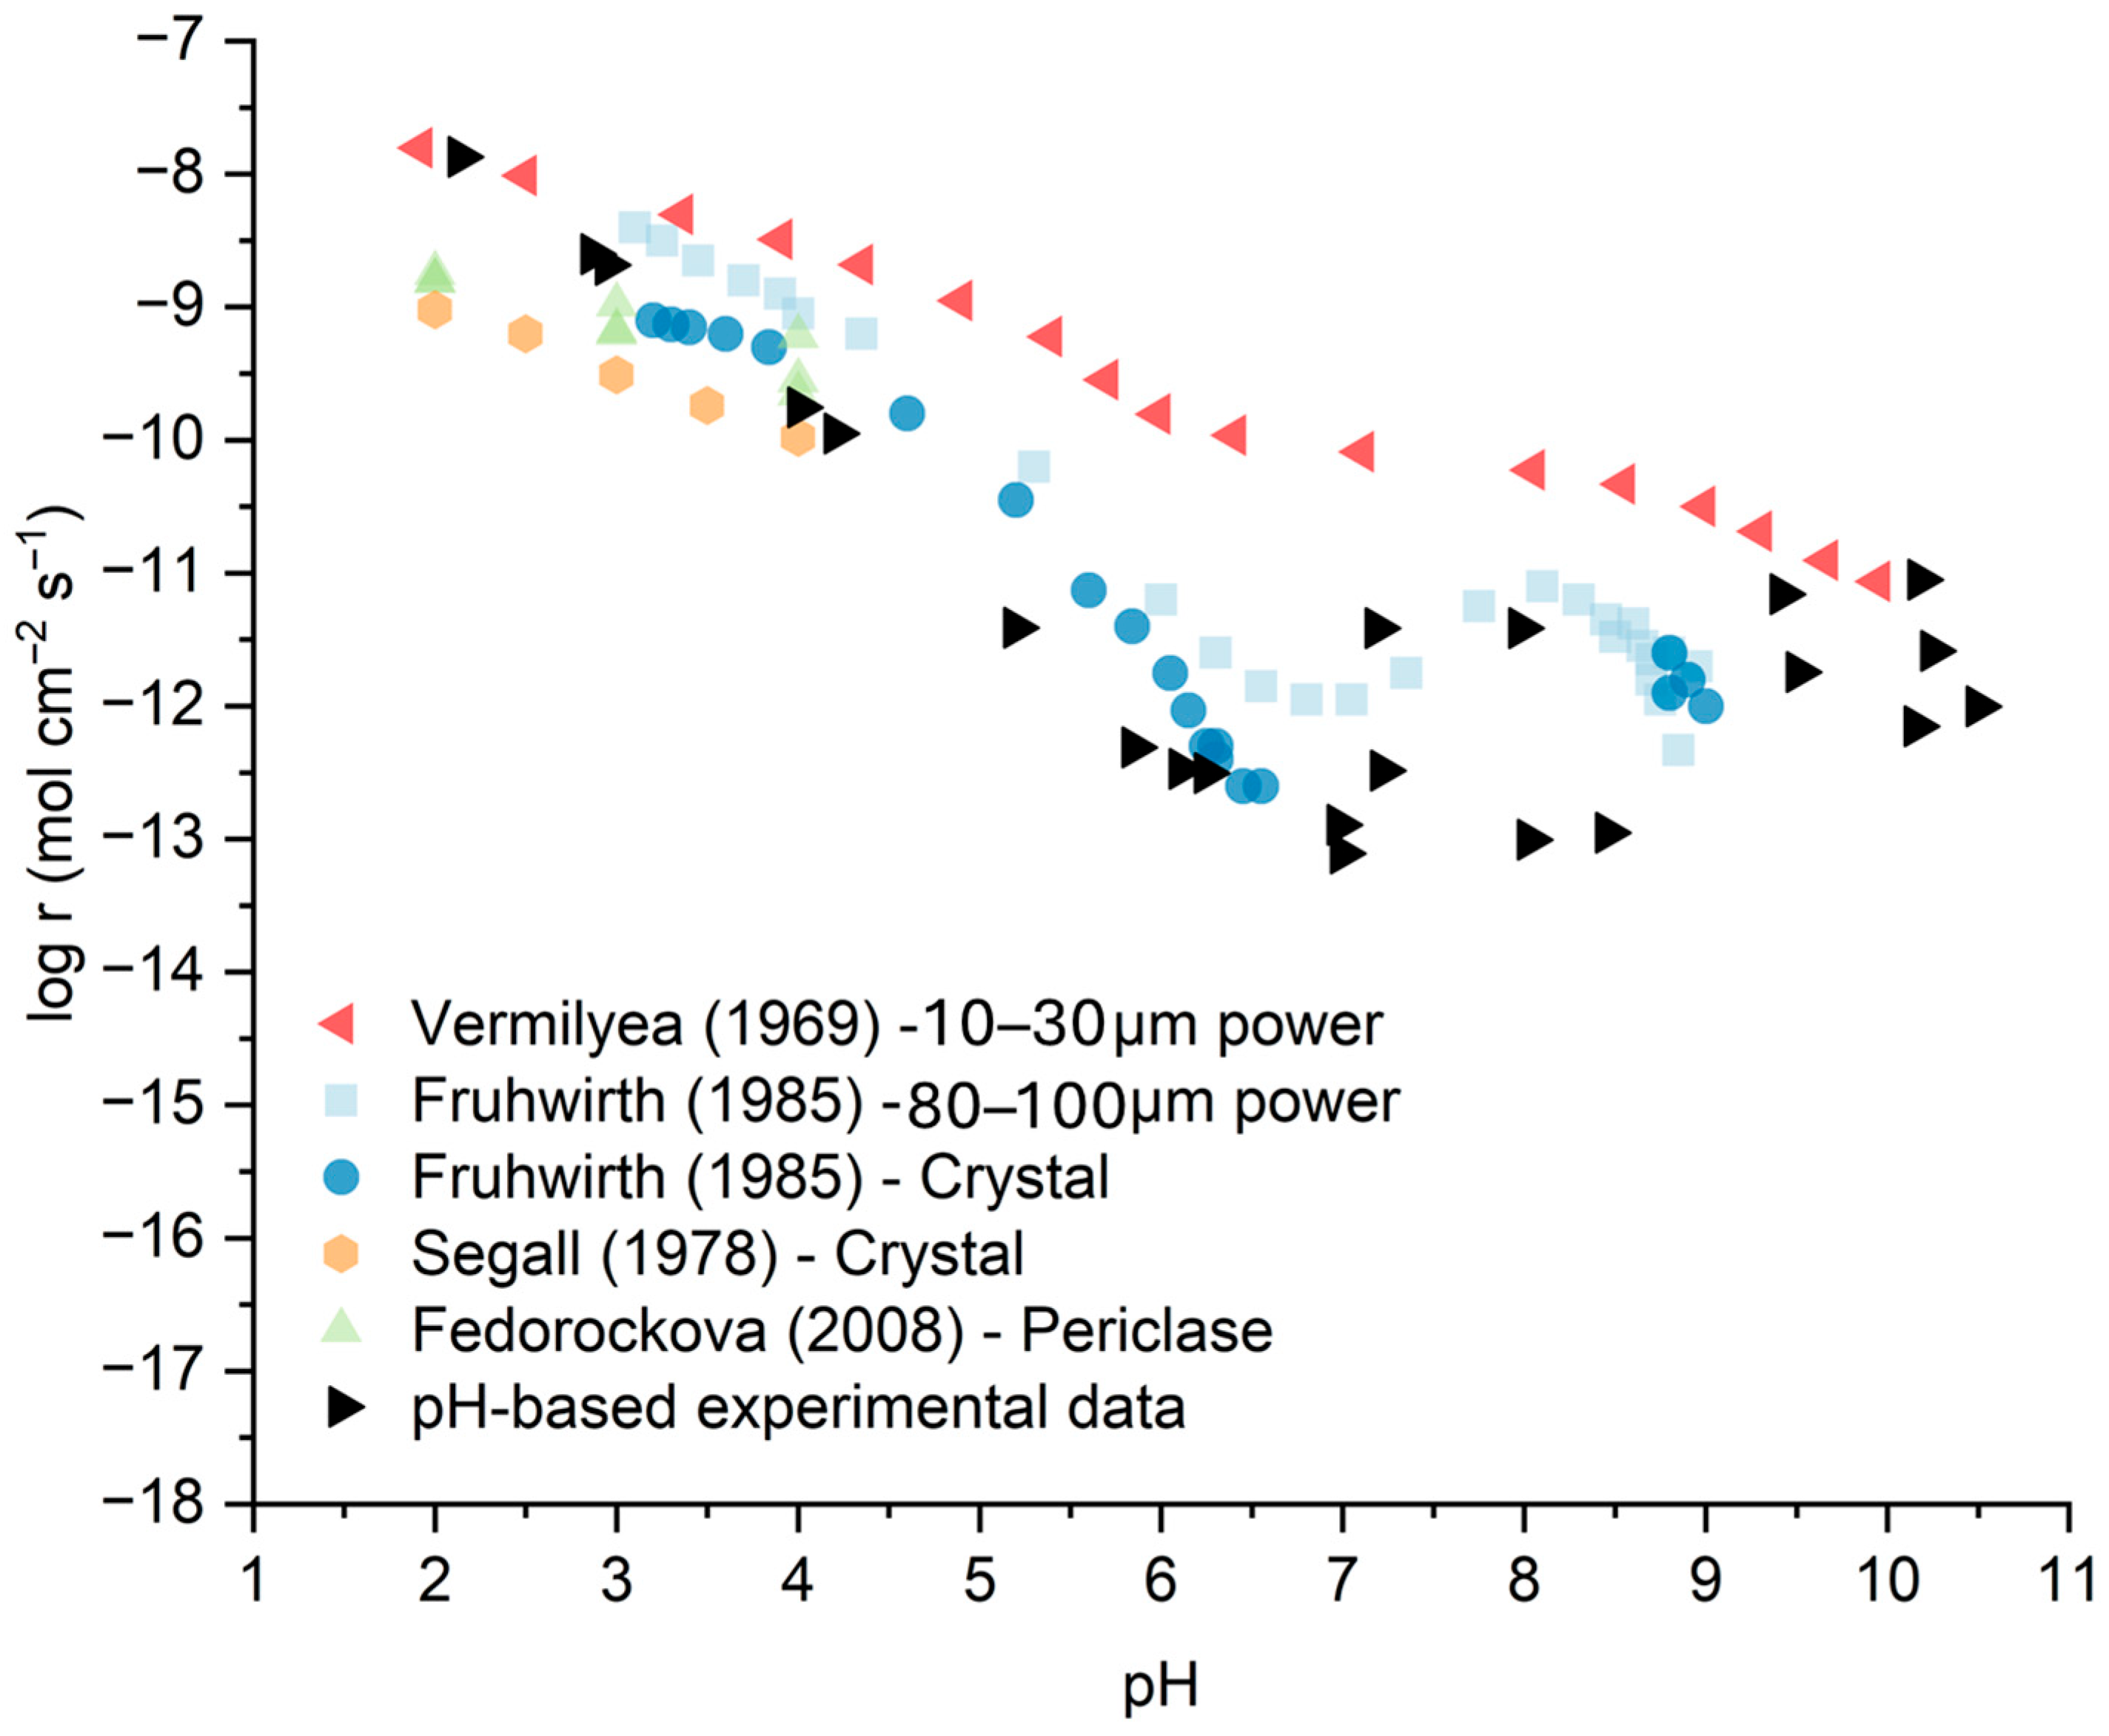
Extending the near-neutral reference contrast from Section 3.2, where LBM’s material properties drive superior kinetics, the full pH-dependent behavior of LBM at 25 °C spans acidic to alkaline conditions (2.0–11.0) relevant to MBC hydration, with rates determined via the validated pH-monitoring method (detailed in Section 2.4) and compared to the literature [7,8,9,10]. To ensure accuracy, the linearity of calculated proton or hydroxide consumption with respect to time was verified, confirming surface-controlled dissolution with constant reactive surface area (S) during the initial 5 s of reaction. Figure 6 illustrates both the literature context and our experimental data, compiling reported dissolution rates from various studies [7,8,9,10] alongside LBM results, demonstrating the four-order-of-magnitude variability that limits predictive understanding.
As shown in Figure 6, under acidic conditions (pH 2.0–6.0), the logarithm of the dissolution rate (log r) exhibits a roughly linear relationship with pH. The linear trend shows a four-order-of-magnitude decrease in dissolution rate, similar to reported values in the literature [18,21,24,25]. This confirms proton-promoted dissolution as the dominant mechanism, initiated by protonation of surface oxygen sites (>Mg-O + H+ → >Mg-OH), which weakens Mg-O bonds and facilitates Mg2+ release (Equations (5) and (6)). The observed slope of approximately −1 indicates first-order dependence on proton activity [8,9], with LBM’s enhanced rates stemming from its defect-rich structure.
The transition to near-neutral pH (6.0–9.0) marks a shift to pH-independent behavior, with rates fluctuating within one order of magnitude (−11.42 < log r < −12.49 mol/cm2·s, or ~10−11 to 10−12 mol/cm2·s). Notably, rates at pH 7.0–8.0 show elevation compared to adjacent pH values, a trend also observed in the literature powder data [18]. This enhancement may result from transitional dissolution mechanisms or contributions from the multiphase composition identified in Section 3.1, particularly the presence of Ca-containing phases and textural porosity that provide continued water access to reactive sites. These effects are advantageous for MBC applications during the transition from neutral mixing to alkaline hydration environments.
Under alkaline conditions (pH > 9.0), the measured dissolution behavior reflects the complex interplay between MgO dissolution and Mg(OH)2 precipitation (Equation (7)). The reported rates represent initial surface-controlled dissolution during the first 5 s before precipitation significantly affects the measured pH evolution. While pure MgO typically shows progressive passivation at high pH, the experimental data for LBM exhibit scatter spanning approximately one order of magnitude at pH 9–11. This variability likely arises from the combined dissolution of multiple phases in LBM (87.8 wt% MgO, 7.5 wt% CaO, plus silicates and carbonates identified in Section 3.1), along with the influence of textural porosity and defect-rich crystallinity on local dissolution–precipitation equilibria. The pH-monitoring method provides practical reactivity assessment of initial reactivity across the full pH range (2.0–11.0) relevant to MBC hydration, though rates at pH > 10 should be interpreted as composite material behavior rather than pure MgO kinetics.

3.4. Non-Monotonic Temperature Effects on LBM Dissolution Kinetics

This section examines the non-monotonic effects of temperature (25–85 °C) on the dissolution kinetics of lightly burned magnesia (LBM), revealing a rate maximum at 75 °C due to competing thermal activation and Mg(OH)2 passivation processes. These are insights that build on the pH-dependent mechanisms in Section 3.3 and offer practical guidance for optimizing magnesia-based cement (MBC) curing. While dissolution rates generally increase with temperature due to enhanced molecular kinetics [26,27,28], anomalous decreases occur at higher temperatures [29,30]. This anomalous behavior is attributed to enhanced Mg(OH)2 precipitation at elevated temperatures, which creates more effective passivating layers [31,32]. Understanding these temperature effects is crucial for cement systems where exothermic reactions can raise temperatures.
Building on the pH-dependent mechanisms in Section 3.3, where dissolution transitions from proton-promoted to passivation-limited regimes, temperature introduces non-monotonic effects on LBM kinetics across pH 2.0–9.5, spanning conditions from ambient MBC hydration (40–60 °C) to accelerated curing (up to 85 °C). Rates were determined via pH monitoring (Equations (1)–(3)), enabling continuous measurement of these thermal influences and providing practical guidance for optimizing MBC performance.
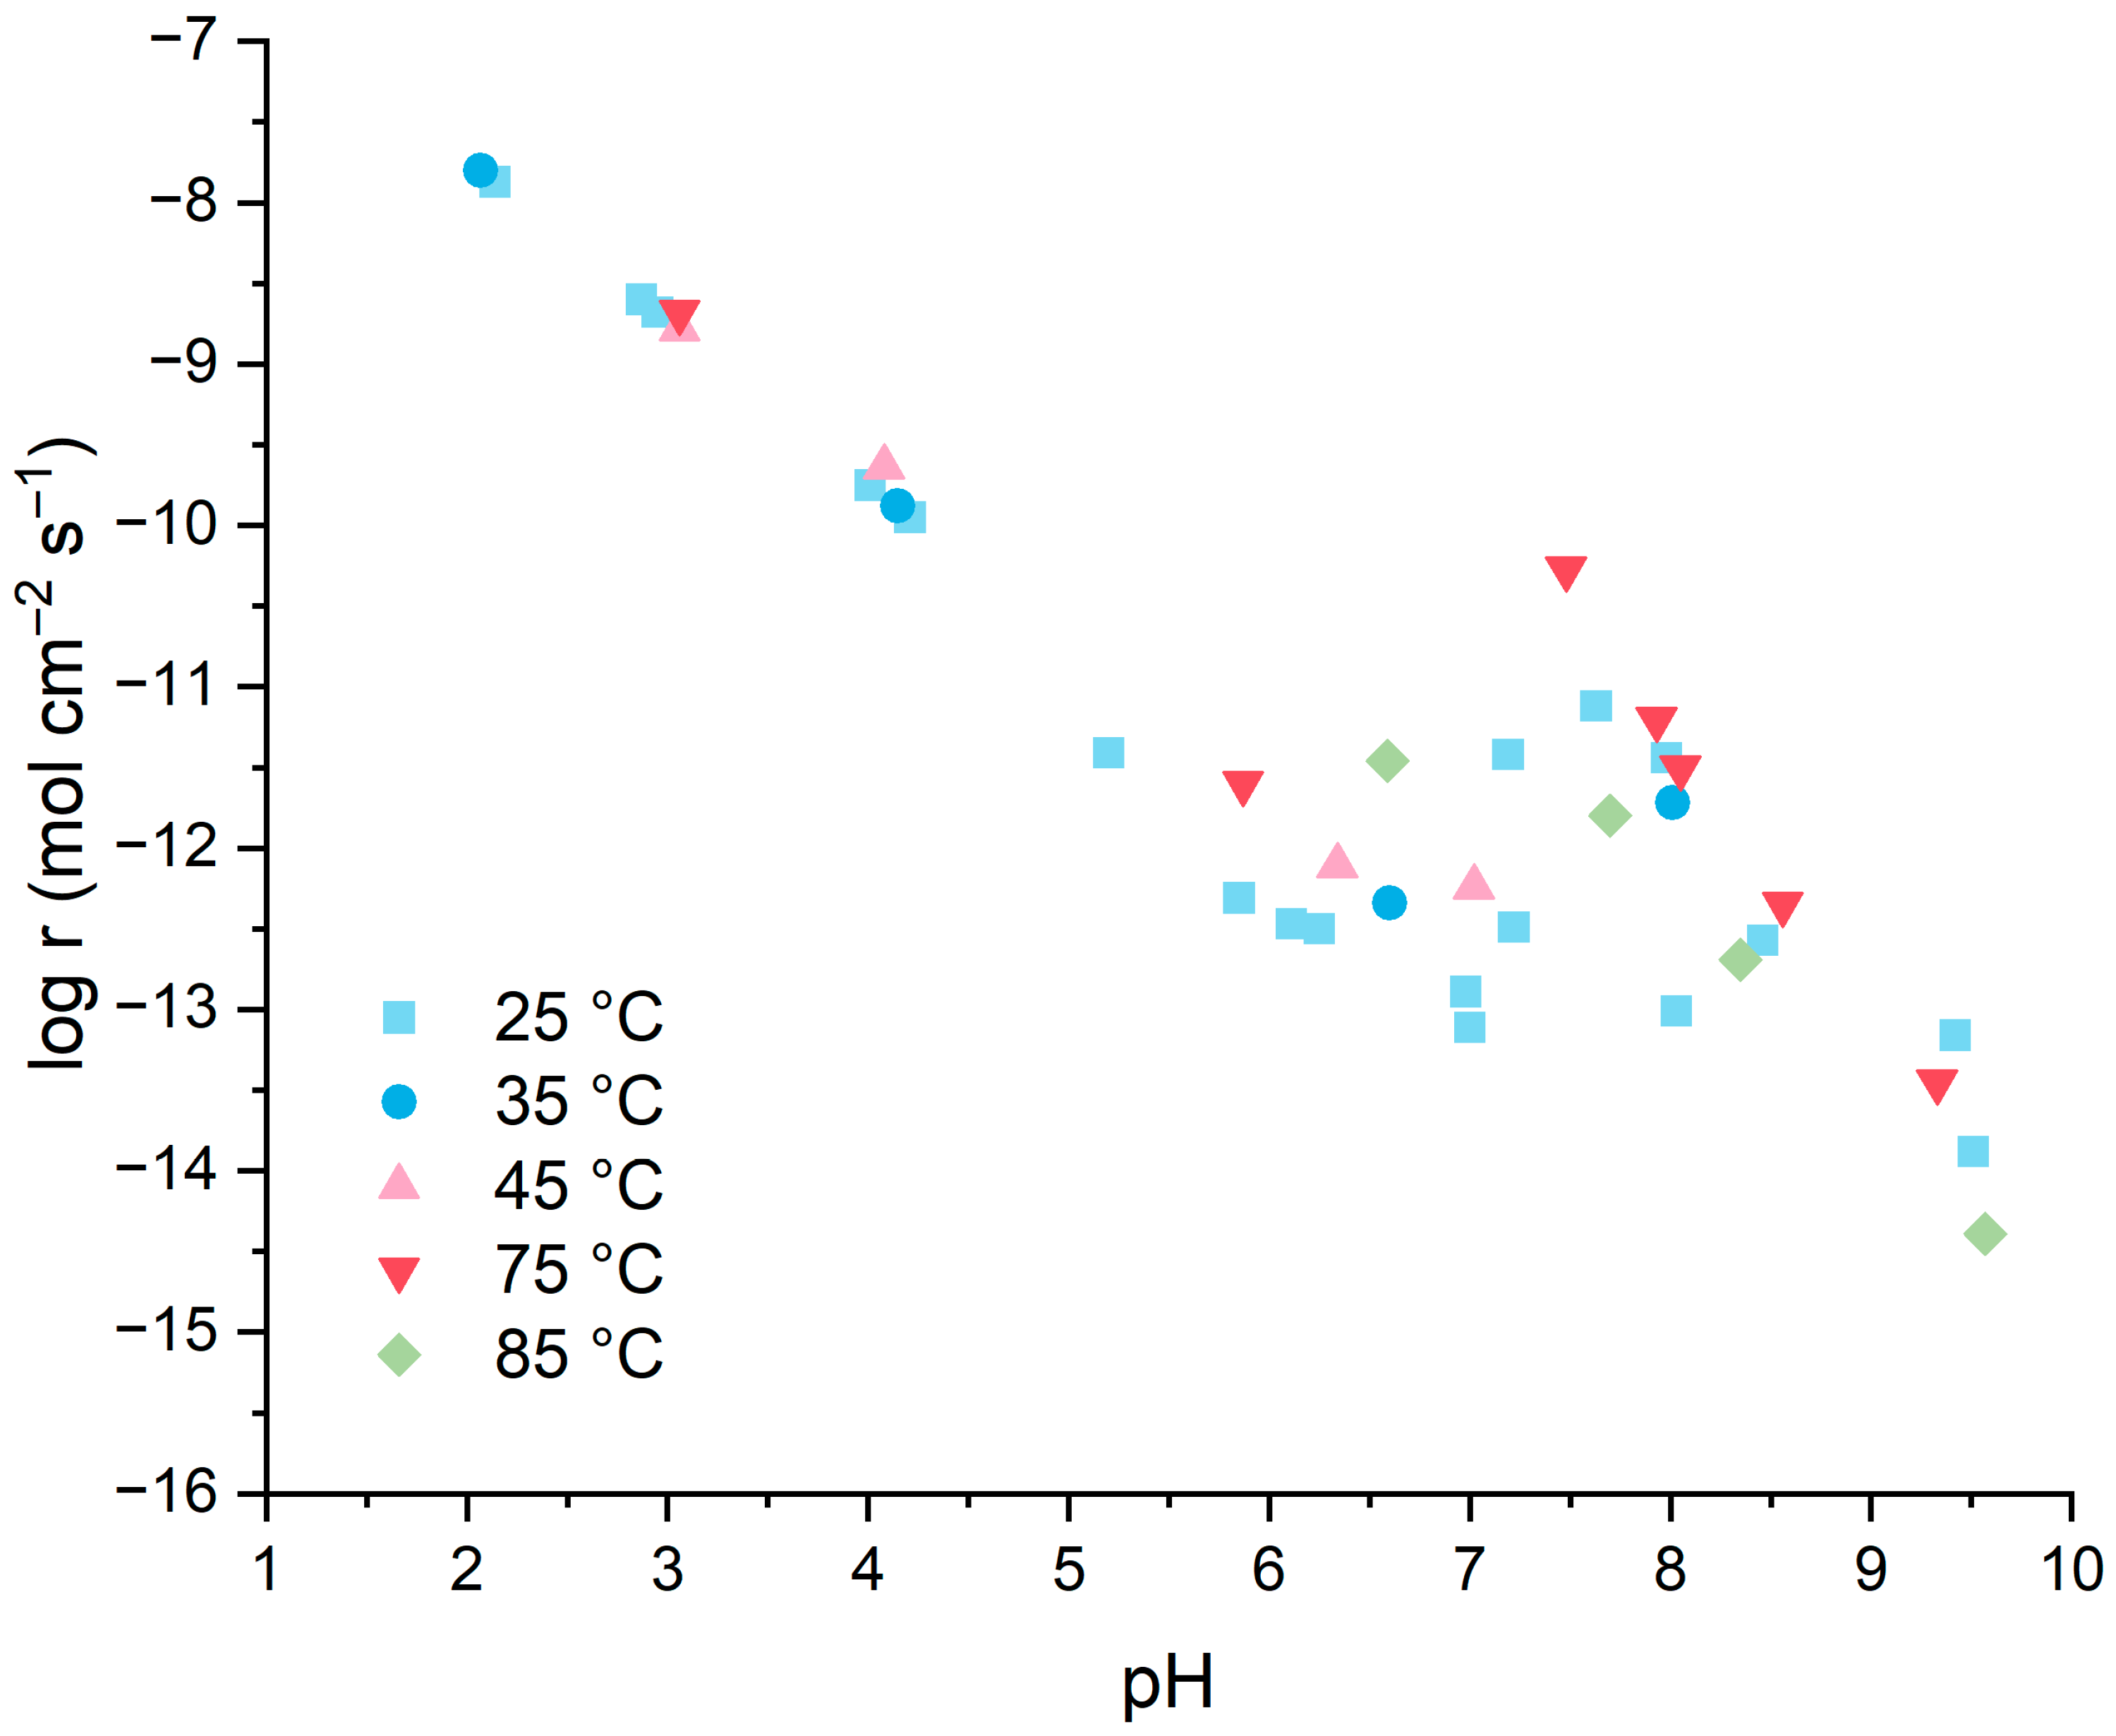
In the acidic regime (pH 2.0–4.0), dissolution rates are high (10−8 to 10−10 mol/cm2·s) and relatively independent of temperature, with clustered data showing limited systematic trends amid some scatter, as in Figure 7. This suggests that under high proton availability, the reaction is rapid, with thermal activation effects marginal compared to pH dominance. The near-neutral region (pH 5.0–8.0) shows more variable behavior, with rates at 75 °C higher than at 25 °C, reflecting transitional mechanisms such as impurity contributions as discussed in Section 3.2. Across the full range, rates at 85 °C are lower than at 75 °C, indicating a non-monotonic relationship with an apparent maximum at 75 °C. This anomaly deviates from standard Arrhenius behavior due to competing processes: below 75 °C, thermal activation enhances kinetics; above 75 °C, accelerated Mg(OH)2 precipitation (Equation (7)) forms effective passivating layers. Amaral et al. [32] reported that Mg(OH)2 layers formed at higher temperatures are denser and more crystalline, consistent with more effective passivation, and the thermodynamic solubility of Mg(OH)2 also decreases above approximately 50 °C, increasing the driving force for precipitation [30,32]. Equilibrium pH data support this: mean 9.80 ± 0.22 at 75 °C versus 9.35 ± 0.31 at 85 °C (Supplementary Table S4).
In alkaline conditions (pH > 8.0), temperature effects are minimal, with rates remaining relatively low across all temperatures, confirming that passivation dominates over thermal activation effects in this regime. The measured behavior aligns with the literature observations showing reduced dissolution at high pH due to Mg(OH)2 layer formation [9,32]. LBM’s textural porosity may provide some continued water access to reactive sites even as external surfaces passivate, though high temperatures exacerbate layer formation.
These findings have direct implications for MBC development. The rate maximum at 75 °C suggests optimal accelerated-curing conditions to maximize early Mg2+ release and strength development [33,34], while avoiding 85 °C, where enhanced passivation may reduce reactivity. For ambient conditions (25 °C), lower rates indicate the need for sufficient curing time or the use of activators. The pH-dependent rate data (Figure 6) provide quantitative input for predicting Mg2+ supply rates during different hydration stages, though linking dissolution kinetics directly to strength development remains an important objective for future work. The pH-monitoring method enables such optimization under the exothermic conditions typical of MBC hydration, and future post-dissolution surface characterization could further clarify passivation mechanisms.

3.5. Validation of the pH-Monitoring Method for Cement-Relevant Conditions

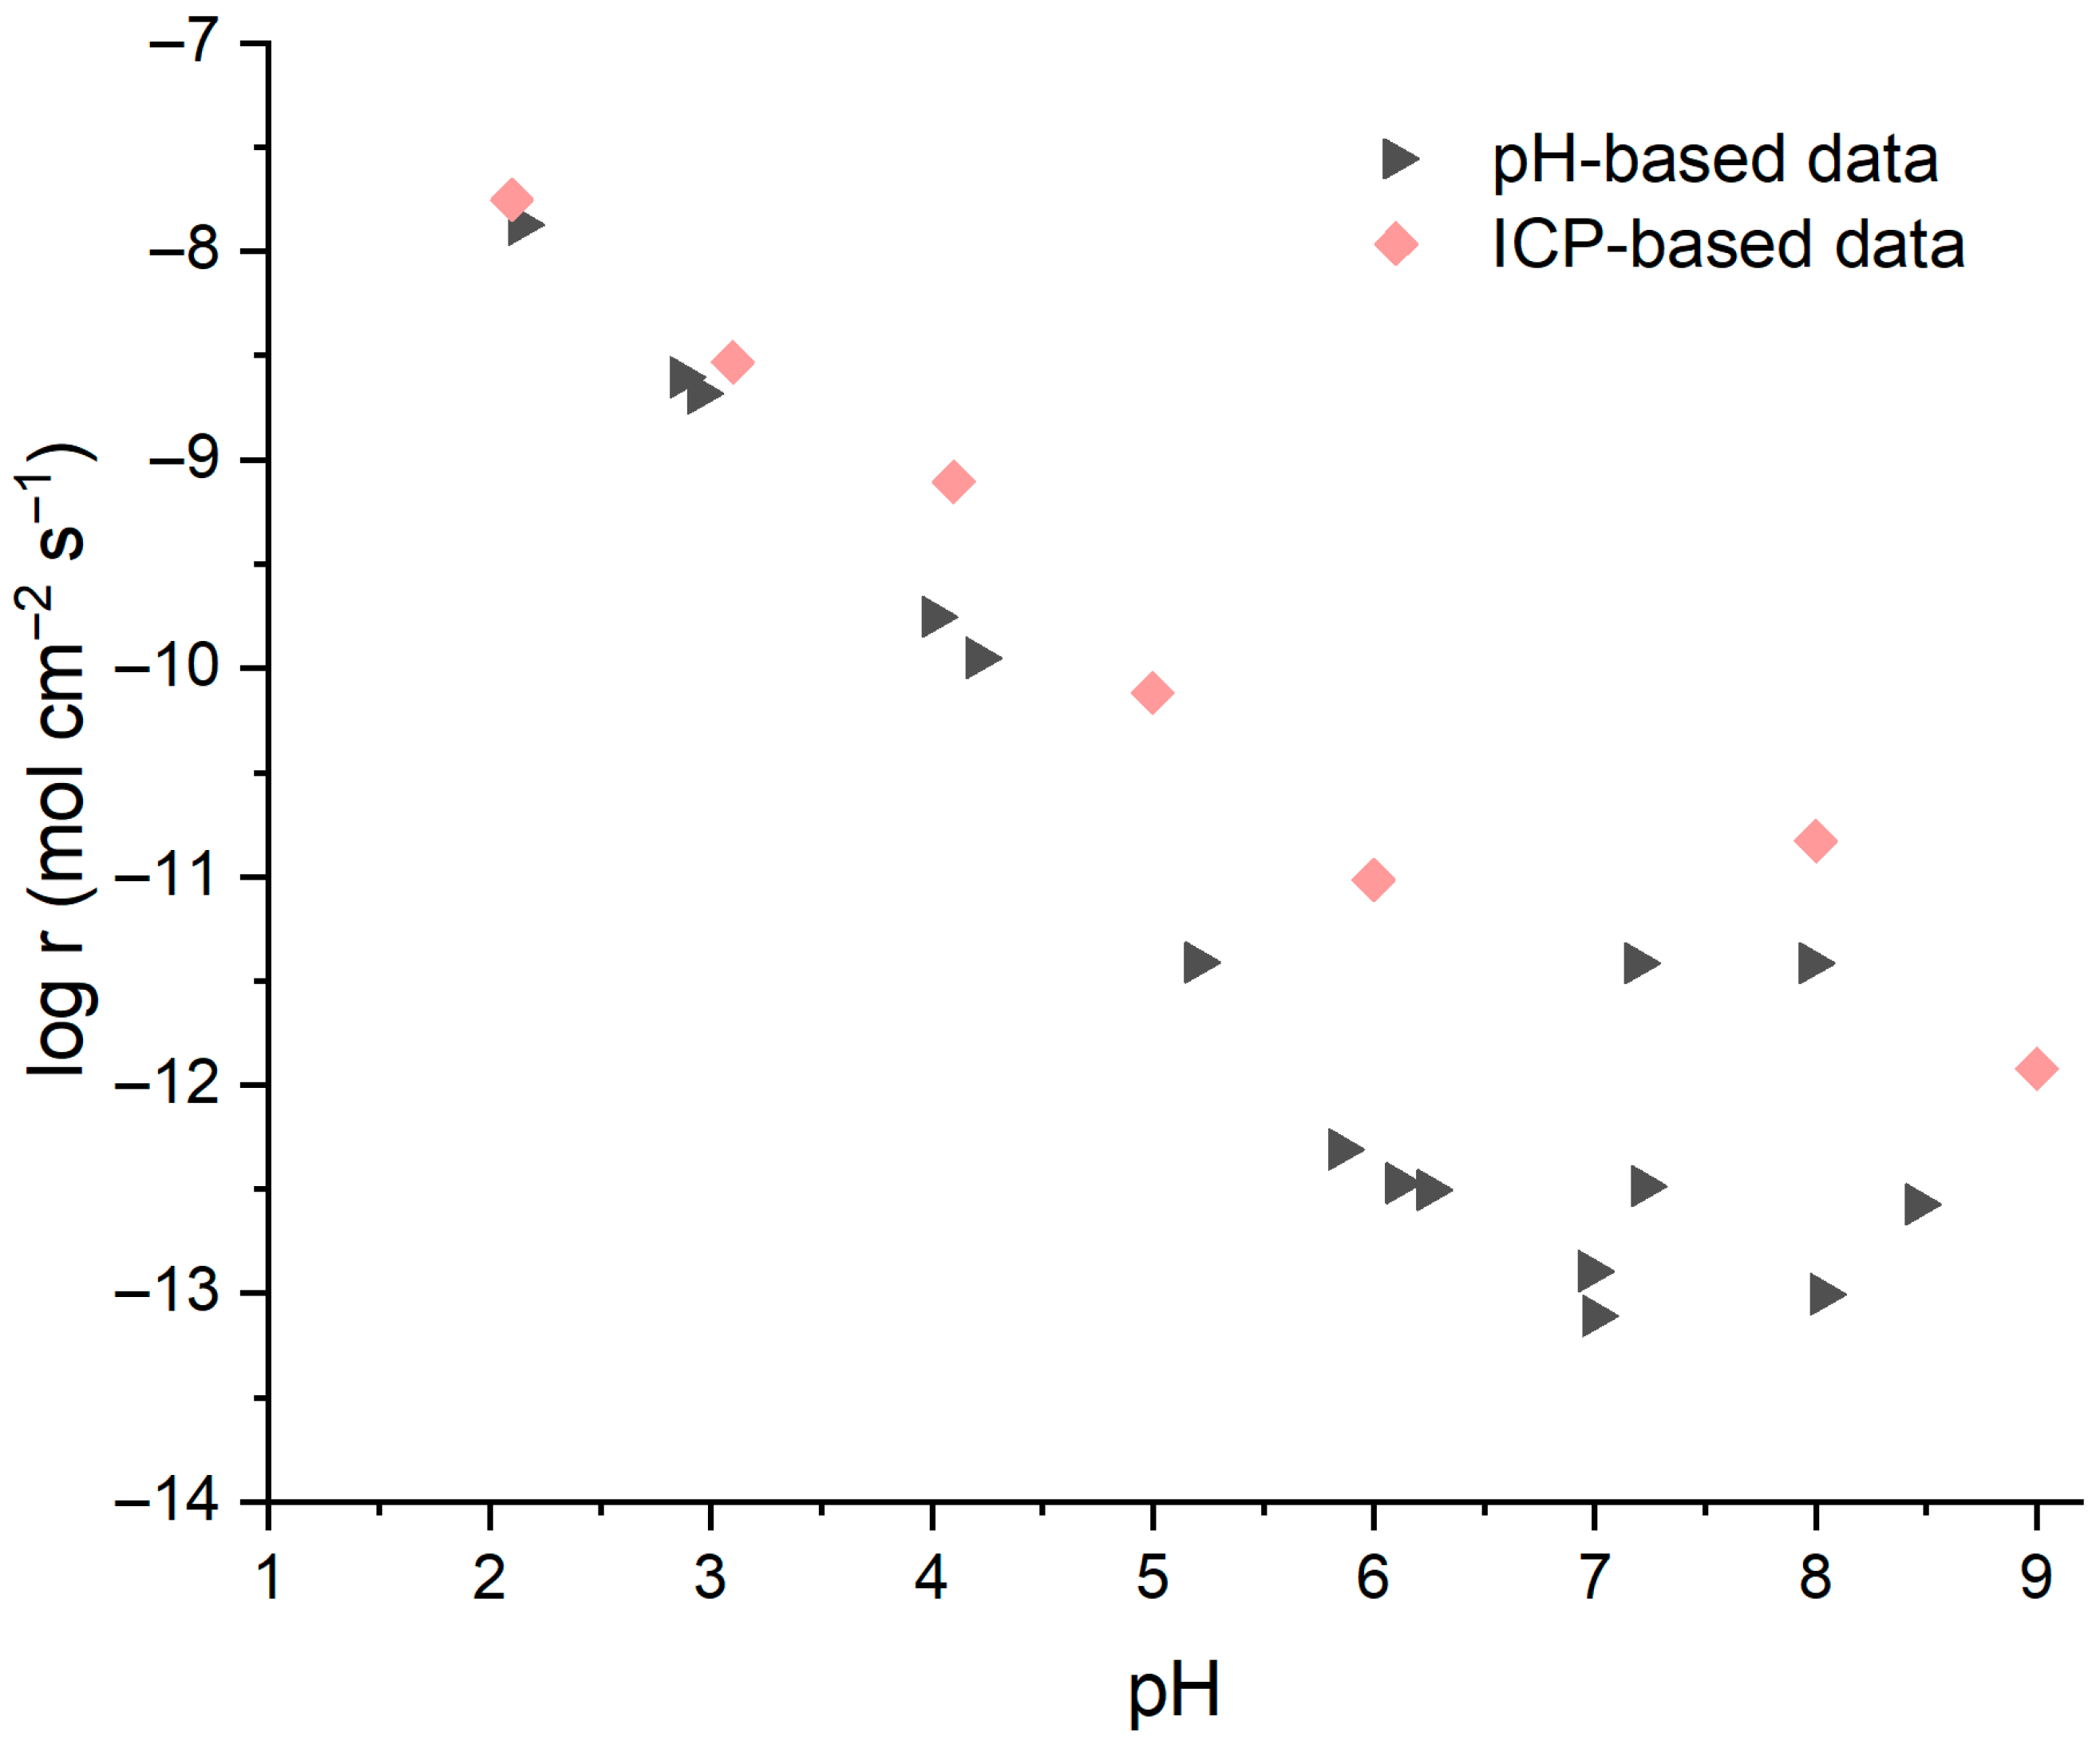
The temperature-dependent kinetics in Section 3.4, captured through continuous pH monitoring, underscore the need for reliable methods across diverse conditions—particularly alkaline regimes (pH > 8–10) where MBC hydration occurs, and traditional ion measurements falter due to rapid Mg(OH)2 precipitation. To validate this stoichiometric pH approach (Equations (1)–(3)) against direct Mg2+ quantification via ICP-AES (Equation (4)), selected experiments at 25 °C compared both techniques across pH 2.0–9.0, confirming their accuracy and practicality for cement-relevant studies.
As shown in Figure 8, the methods yield closely overlapping results in acidic conditions (pH 2.0–4.0), with dissolution rates (log r) agreeing within 0.5 log units. The stoichiometric relationship between pH change and Mg ion release (Equations (1)–(3)) holds where MgO dissolution is the dominant reaction affecting pH and secondary precipitation is negligible; both conditions are satisfied at pH < 5, validating pH monitoring as a reliable alternative to discrete ICP sampling in this regime.
At pH > 4, ICP-derived rates become systematically higher than pH-based calculations, with the offset reaching approximately 0.5–1.5 orders of magnitude by pH 6–8. This divergence arises from the onset of Mg(OH)2 precipitation: the pH method measures net hydroxide generation, while ICP quantifies total dissolved Mg2+, including ions that subsequently precipitate. Additionally, colloidal Mg(OH)2 particles smaller than 0.45 μm may pass through PTFE filters, contributing to higher apparent ICP concentrations at elevated pH. Above pH 8, the pH method therefore measures net reactivity (dissolution minus precipitation) rather than total dissolution. The dominant source of uncertainty in pH-derived rates is the linear regression slope over the initial measurement interval, rather than electrode accuracy (±0.01 pH units).
Practically, pH monitoring offers continuous tracking without sampling artifacts, with sufficient sensitivity at high pH for real-time MBC hydration studies (pH 8–11) [4,35]. Real MBC pore solutions contain dissolved silicate, aluminate, and carbonate species and have higher ionic strength (typically 0.1–1 M) than the dilute conditions used here, which may modify dissolution driving forces and precipitation behavior. The rates measured in this study therefore represent intrinsic material properties under standardized conditions and are best used for comparing materials rather than predicting in situ behavior. Future work combining pH monitoring with post-dissolution surface characterization (e.g., SEM/XRD analysis of precipitated phases) could further elucidate the dissolution–precipitation mechanisms governing high-pH behavior.

4. Conclusions

This study validated pH monitoring as a practical method for tracking commercial LBM dissolution kinetics across pH 2.0 to 11.0 and temperatures 25 to 85°C, conditions spanning the full range relevant to magnesia-based cement hydration. The method is reliable at pH below 5, where it agrees with ICP-AES within 0.5 log units; at higher pH, it captures net reactivity (dissolution minus Mg(OH)2 precipitation), which is the quantity that matters in practice for cement applications.
Commercial LBM exhibited dissolution rates one to two orders of magnitude higher than synthetic high-purity magnesia after BET surface area normalization, ranging from 10−8 mol/cm2/s at pH 2 to 10−12 mol/cm2/s at pH 11. This enhancement is attributable to reduced crystallite size, lattice disorder, multiphase composition (7.5 wt% CaO), and textural porosity, as evidenced by XRD, STEM-EDS, and BET analysis. Temperature effects are non-monotonic, with rates peaking at 75°C before declining at 85°C due to the formation of denser Mg(OH)2 passivation layers and decreasing Mg(OH)2 solubility. These results suggest 75°C as an optimal accelerated-curing temperature for maximizing early Mg2+ supply while cautioning against higher temperatures. The validated pH monitoring protocol can serve as a rapid quality control tool for incoming LBM batches by measuring the initial dissolution rate at a standardized condition (e.g., pH 7, 25 °C), enabling quantitative comparison of material reactivity without requiring ICP analysis or extended hydration testing. This low-cost, instrument-simple approach removes a practical barrier to industrial MBC quality control: a standard pH electrode costs orders of magnitude less than ICP-AES instrumentation and requires no specialist operation, making pH-based QC accessible to small-scale and developing-market producers where MBC adoption could have the greatest sustainability impact. By enabling routine characterization of LBM reactivity, the methodology supports the transition of MBCs from laboratory-demonstrated materials to industrially viable low-carbon alternatives to Portland cement.
This study focused on one commercial LBM source to establish the methodology; testing additional LBM materials with different compositions and calcination histories would strengthen the generalizability of the findings. Post-dissolution surface characterization and stirred comparison experiments represent natural extensions of this work. Future studies should also link dissolution kinetics to hydration degree and compressive strength development in blended MBC systems, building on the validated methodology presented here.

Supplementary Materials

The following supporting information can be downloaded at https://www.mdpi.com/article/10.3390/su18073600/s1, Table S1. Calculated dissolution rates based on the pH method for various initial pH values (2.14 < pHo < 11.33) at 25 °C and standard pressure. Table S2. Determined dissolution rates based on the aqueous composition method from ICP-AES data for various initial pH values (2.14 < pHo < 11.33) at 25 °C and standard pressure. Table S3. Influence of temperature on the MgO dissolution rates (35 °C to 85 °C) as calculated using the stoichiometric (pH) method. Table S4. Processed Equilibrium pH: For 75 °C, mean = 9.80 ± 0.22 (range 9.58–10.03); for 85 °C, mean = 9.35 ± 0.31 (range 9.04–9.66).

Author Contributions

Conceptualization, J.P.G.; methodology, J.P.G.; software, X.Z.; validation, X.Z. and J.P.G.; formal analysis, X.Z.; investigation, X.Z.; resources, J.P.G.; data curation, X.Z.; writing—original draft preparation, X.Z.; writing—review and editing, J.P.G.; visualization, X.Z.; supervision, J.P.G.; project administration, J.P.G.; funding acquisition, J.P.G. All authors have read and agreed to the published version of the manuscript.

Funding

This research was funded by Penn State and the Architectural Engineering Department, specifically the D/Carb Research Group.

Institutional Review Board Statement

Not applicable.

Informed Consent Statement

Not applicable.

Data Availability Statement

The authors declare that the data supporting the findings of this study are available within the paper and its Supplementary Information file. Should any raw data files be needed in another format, they are available from the corresponding author upon reasonable request.

Acknowledgments

This research was made possible by the Department of Architectural Engineering, the College of Engineering, and the D/Carb Group at the Pennsylvania State University. This research is dedicated to our late group member, Lovisa Arnesson-Cronhamre, who showed immense potential to be an excellent researcher. This work represents the views of the authors and not necessarily those of the sponsors. During the preparation of this manuscript, the authors used Grammarly, 2026, for the purposes of English language and grammar corrections. The authors have reviewed and edited the output and take full responsibility for the content of this publication.

Conflicts of Interest

The authors declare no conflicts of interest.

References

  1. Supriya, J.; Raut, A. Performance Parameter Analysis of Magnesia Based Cement Products—A Review. IOP Conf. Ser. Mater. Sci. Eng. 2021, 1197, 012078. [Google Scholar] [CrossRef] [Scilit]
  2. Walling, S.A.; Provis, J.L. Magnesia-Based Cements: A Journey of 150 Years, and Cements for the Future? Chem. Rev. 2016, 116, 4170–4204. [Google Scholar] [CrossRef] [Scilit]
  3. Ruan, S.; Unluer, C. Influence of Supplementary Cementitious Materials on the Performance and Environmental Impacts of Reactive Magnesia Cement Concrete. J. Cleaner Prod. 2017, 159, 62–73. [Google Scholar] [CrossRef] [Scilit]
  4. Zhang, T.; Cheeseman, C.R.; Vandeperre, L.J. Development of Low pH Cement Systems Forming Magnesium Silicate Hydrate (M-S-H). Cem. Concr. Res. 2011, 41, 439–442. [Google Scholar] [CrossRef] [Scilit]
  5. Gardeh, M.G.; Kistanov, A.A.; Nguyen, H.; Manzano, H.; Cao, W.; Kinnunen, P. Exploring Mechanisms of Hydration and Carbonation of MgO and Mg(OH)2 in Reactive Magnesium Oxide-Based Cements. J. Phys. Chem. C 2022, 126, 6196–6206. [Google Scholar] [CrossRef] [Scilit]
  6. Ma, S.; Akca, A.H.; Esposito, D.; Kawashima, S. Influence of Aqueous Carbonate Species on Hydration and Carbonation of Reactive MgO Cement. J. CO2 Util. 2020, 41, 101260. [Google Scholar] [CrossRef] [Scilit]
  7. Unluer, C.; Al-Tabbaa, A. The Role of Brucite, Ground Granulated Blastfurnace Slag, and Magnesium Silicates in the Carbonation and Performance of MgO Cements. Constr. Build. Mater. 2015, 94, 629–643. [Google Scholar] [CrossRef] [Scilit]
  8. Calcinations Regulation Effect on Activity and Hydration of MgO from Magnesite Tailings|Scientific.Net. Available online: https://www.scientific.net/AMM.405-408.2559 (accessed on 25 August 2024).
  9. Mo, L.; Deng, M.; Tang, M. Effects of Calcination Condition on Expansion Property of MgO-Type Expansive Agent Used in Cement-Based Materials. Cem. Concr. Res. 2010, 40, 437–446. [Google Scholar] [CrossRef] [Scilit]
  10. Hacquart, R.; Jupille, J. Morphology of MgO Smoke Crystallites upon Etching in Wet Environment. J. Cryst. Growth 2009, 311, 4598–4604. [Google Scholar] [CrossRef] [Scilit]
  11. Pacchioni, G. Quantum Chemistry of Oxide Surfaces: From CO Chemisorption to the Identification of the Structure and Nature of Point Defects on MgO. Surf. Rev. Lett. 2012, 7, 277–306. [Google Scholar] [CrossRef]
  12. Jordan, G.; Higgins, S.R.; Eggleston, C.M. Dissolution of the Periclase (001) Surface; a Scanning Force Microscope Study. Am. Mineral. 1999, 84, 144–151. [Google Scholar] [CrossRef] [Scilit]
  13. Nilius, N.; Freund, H.-J. Activating Nonreducible Oxides via Doping. Acc. Chem. Res. 2015, 48, 1532–1539. [Google Scholar] [CrossRef] [Scilit]
  14. Pettauer, M.; Baldermann, A.; Eder, S.; Dietzel, M. Hydration of MgO: Reaction Kinetics and pH Control on Brucite Crystal Morphology. Cryst. Growth Des. 2024, 24, 3085–3092. [Google Scholar] [CrossRef] [Scilit]
  15. Wang, J.; Zhou, H.; Song, Y.; Xie, C.; Unluer, C.; Ruan, S. Revisiting MgO Reactivity: The Critical Role of Mesopores and Surface Defects of Particles. Cem. Concr. Res. 2026, 201, 108118. [Google Scholar] [CrossRef] [Scilit]
  16. Bernard, E.; Nguyen, H.; Kawashima, S.; Lothenbach, B.; Manzano, H.; Provis, J.; Scott, A.; Unluer, C.; Winnefeld, F.; Kinnunen, P. MgO-Based Cements—Current Status and Opportunities. RILEM Tech. Lett. 2023, 8, 65–78. [Google Scholar] [CrossRef] [Scilit]
  17. Dong, C.; He, G.; Zheng, W.; Bian, T.; Li, M.; Zhang, D. Study on Antibacterial Mechanism of Mg(OH)2 Nanoparticles. Mater. Lett. 2014, 134, 286–289. [Google Scholar] [CrossRef] [Scilit]
  18. Fruhwirth, O.; Herzog, G.W.; Hollerer, I.; Rachetti, A. Dissolution and Hydration Kinetics of MgO. Surf. Technol. 1985, 24, 301–317. [Google Scholar] [CrossRef] [Scilit]
  19. Pokrovsky, O.S.; Schott, J. Experimental Study of Brucite Dissolution and Precipitation in Aqueous Solutions: Surface Speciation and Chemical Affinity Control. Geochim. Cosmochim. Acta 2004, 68, 31–45. [Google Scholar] [CrossRef] [Scilit]
  20. Raschman, P.; Fedoročková, A. Dissolution Kinetics of Periclase in Dilute Hydrochloric Acid. Chem. Eng. Sci. 2008, 63, 576–586. [Google Scholar] [CrossRef] [Scilit]
  21. Fedoročková, A.; Raschman, P. Effects of pH and Acid Anions on the Dissolution Kinetics of MgO. Chem. Eng. J. 2008, 143, 265–272. [Google Scholar] [CrossRef] [Scilit]
  22. Mejias, J.A.; Berry, A.J.; Refson, K.; Fraser, D.G. The Kinetics and Mechanism of MgO Dissolution. Chem. Phys. Lett. 1999, 314, 558–563. [Google Scholar] [CrossRef] [Scilit]
  23. Baumann, S.O.; Schneider, J.; Sternig, A.; Thomele, D.; Stankic, S.; Berger, T.; Grönbeck, H.; Diwald, O. Size Effects in MgO Cube Dissolution. Langmuir 2015, 31, 2770–2776. [Google Scholar] [CrossRef] [Scilit] [PubMed]
  24. Segall, R.L.; Smart, R.S.C.; Turner, P.S. Ionic Oxides: Distinction between Mechanisms and Surface Roughening Effects in the Dissolution of Magnesium Oxide. J. Chem. Soc. Faraday Trans. 1 Phys. Chem. Condens. Phases 1978, 74, 2907. [Google Scholar] [CrossRef] [Scilit]
  25. Vermilyea, D.A. The Dissolution of MgO and Mg(OH)2 in Aqueous Solutions. J. Electrochem. Soc. 1969, 116, 1179. [Google Scholar] [CrossRef] [Scilit]
  26. Rocha, S.D.; Mansur, M.B.; Ciminelli, V.S. Kinetics and Mechanistic Analysis of Caustic Magnesia Hydration. J. Chem. Technol. Biotechnol. 2004, 79, 816–821. [Google Scholar] [CrossRef] [Scilit]
  27. Casey, W.H.; Sposito, G. On the Temperature Dependence of Mineral Dissolution Rates. Geochim. Cosmochim. Acta 1992, 56, 3825–3830. [Google Scholar] [CrossRef] [Scilit]
  28. Cohen, N.; Westberg, K.R. Chemical Kinetic Data Sheets for High-Temperature Chemical Reactions. J. Phys. Chem. Ref. Data 1983, 12, 531–590. [Google Scholar] [CrossRef] [Scilit]
  29. Lambert, I.; Clever, H.L. Alkaline Earth Hydroxides in Water and Aqueous Solutions; Elsevier: Amsterdam, The Netherlands, 2013. [Google Scholar]
  30. Lambert, I.; Lefevre, A.; Montel, J.; CEA Centre d’Etudes Nucleaires de Saclay, 91-Gif-sur-Yvette (France). Solubility of Magnesium Hydroxide in Aqueous Solutions from 200 to 3000C. Influence of Chlorides. In Proceedings of the 8. International CODATA Conference, Jachranka, Poland, 4–7 October 1982. [Google Scholar]
  31. Tang, X.; Guo, L.; Chen, C.; Liu, Q.; Li, T.; Zhu, Y. The Analysis of Magnesium Oxide Hydration in Three-Phase Reaction System. J. Solid State Chem. 2014, 213, 32–37. [Google Scholar] [CrossRef] [Scilit]
  32. Amaral, L.F.; Oliveira, I.R.; Salomão, R.; Frollini, E.; Pandolfelli, V.C. Temperature and Common-Ion Effect on Magnesium Oxide (MgO) Hydration. Ceram. Int. 2010, 36, 1047–1054. [Google Scholar] [CrossRef] [Scilit]
  33. Zhang, T.; Zou, J.; Wang, B.; Wu, Z.; Jia, Y.; Cheeseman, C.R. Characterization of Magnesium Silicate Hydrate (MSH) Gel Formed by Reacting MgO and Silica Fume. Materials 2018, 11, 909. [Google Scholar] [CrossRef] [Scilit]
  34. Dung, N.T.; Unluer, C. Advances in the Hydration of Reactive MgO Cement Blends Incorporating Different Magnesium Carbonates. Constr. Build. Mater. 2021, 294, 123573. [Google Scholar] [CrossRef] [Scilit]
  35. Liu, Y.; Wang, B.; Fan, Y.; Yu, J.; Shi, T.; Zhou, Y.; Song, Y.; Xu, G.; Xiong, C.; Zhou, X. Effects of Reactive MgO on Durability and Microstructure of Cement-Based Materials: Considering Carbonation and pH Value. Constr. Build. Mater. 2024, 426, 136216. [Google Scholar] [CrossRef] [Scilit]
Figure 1. SEM images of analytically pure STM (a,b) and commercial LBM (c,d). (a) 100,000×, 3.00 kV, 25 pA, TLD detector; (b) 250,000×, 3.00 kV, 25 pA, TLD detector; (c) 150,000×, 5.00 kV, 0.20 nA, TLD detector; (d) 350,000×, 5.00 kV, 0.20 nA, TLD detector. All images were acquired in immersion mode at the Materials Characterization Laboratory, The Pennsylvania State University.
Sustainability 18 03600 g001
Figure 2. TEM morphology images of LBM (a,b) and STM (c,d), with scales of 20 nm and 50 nm.
Sustainability 18 03600 g002
Figure 3. XRD patterns of (a) lightly burned magnesia and (b) synthetic magnesia. The lightly burned magnesia contains quartz, Q (PDF# 010-090-3640); forsterite, F (PDF# 04-008-7944); hematite, E (PDF# 04-008-8479); calcite, L (PDF#98-000-0141); portlandite, O (PDF# 04-027-9358); and periclase, P (PDF# 00-004-0829). The synthetic magnesia contains periclase, P (PDF# 00-004-0829).
Sustainability 18 03600 g003
Figure 4. HAADF-STEM images and EDS maps for LBM (a) showing elemental distribution (blue Mg, green O, purple Ca, orange Fe, cyan Si) and for STM (b) showing uniform Mg (blue) and O (red).
Sustainability 18 03600 g004aSustainability 18 03600 g004b
Figure 5. Comparative dissolution behavior of analytically pure STM and commercial LBM in aqueous solutions at 25 °C. In general, all samples exhibited similar logarithmic pH rise over time.
Sustainability 18 03600 g005
Figure 6. Relationship between the logarithm of the dissolution rate (log r) and pH for LBM at 25 °C, comparing the current pH-based dissolution rate data with data from the previous literature: [18,21,24,25]. Rates are calculated from initial linear pH change during the first 5 s, representing surface-controlled dissolution before significant precipitation occurs at high pH. The form of MgO utilized is noted in the legend, which varied from natural periclase (MgO) to powderized forms (10–30 μm and 80–100 μm) and single crystals with polished or cleaved surfaces. Experimental data is available in the Supplementary Information document.
Sustainability 18 03600 g006
Figure 7. Effect of solution temperature (25–85 °C) on the dissolution rate (log r) of LBM across various pH regimes (2.0 < pH < 9.5). Data available in the Supplementary Information document.
Sustainability 18 03600 g007
Figure 8. Comparison between both methodologies, namely the stoichiometric (pH) method and the aqueous chemical composition method, to determine the dissolution rate of LBM across varying pH regimes at 25 °C. Data available in the Supplementary Information document.
Sustainability 18 03600 g008
Table 1. Chemical composition and BET-specific surface area of lightly burned and synthetic MgO.
Raw MaterialOxide Content (%)SSA (m2/g)
MgOSiO2Fe2O3Al2O3CaO
Lightly Burned MgO (LBM)87.83.180.910.347.5032.3
Synthetic MgO (STM)99.990.01NDNDND10.1
Table 2. Dissolution rates of LBM and analytically pure STM at 25 °C and 35 °C at near-neutral initial pH conditions (6.89 < pH < 8.01).
TemperatureTypepH0Slope: 2rS/VRr (mol·cm−2·s−1)log r (mol·cm−2·s−1)
25 °CSTM7.274.20 × 10−81.40 × 10⁻¹³−12.85
7.123.02 × 10−81.00 × 10⁻¹³−13.00
7.013.05 × 10−81.02 × 10⁻¹³−12.99
LBM7.191.15 × 10−63.84 × 10⁻¹²−11.42
7.229.80 × 10−83.26 × 10⁻¹³−12.49
7.632.30 × 10−67.67 × 10⁻¹²−11.12
7.981.10 × 10−63.67 × 10⁻¹²−11.44
35 °CSTM6.982.93 × 10−89.77 × 10⁻¹⁴−13.01
6.894.09 × 10−81.36 × 10⁻¹³−12.87
6.973.81 × 10−81.27 × 10⁻¹³−12.90
LBM8.013.24 × 10−72.00 × 10⁻¹²−11.72
7.151.50 × 10−69.29 × 10⁻¹²−11.03
Disclaimer/Publisher’s Note: The statements, opinions and data contained in all publications are solely those of the individual author(s) and contributor(s) and not of MDPI and/or the editor(s). MDPI and/or the editor(s) disclaim responsibility for any injury to people or property resulting from any ideas, methods, instructions or products referred to in the content.