Article

Experimental Evaluation of Commercial Molecular Sieves 13X, 4A, and JLPM3 for Sustainable Direct Air CO2 Capture from Humid Air via Temperature-Swing Adsorption: “Sieve the Atmosphere”

by
Luis Signorelli
1,2,*,
Pedro Esparza
1,*,
Pedro Martín-Zarza
1 and
María Emma Borges Chinea
3
1
Department of Chemistry, University of La Laguna, C/Padre Herrera, s/n, 38200 La Laguna, Spain
2
CanaryCarbon, S.L., Avda de Roma, 49, El Sauzal, 38360 Santa Cruz de Tenerife, Spain
3
Department of Chemical Engineering, University of La Laguna, 38200 La Laguna, Spain
*
Authors to whom correspondence should be addressed.
Sustainability 2026, 18(7), 3601; https://doi.org/10.3390/su18073601
Submission received: 26 January 2026 / Revised: 26 February 2026 / Accepted: 30 March 2026 / Published: 7 April 2026

Abstract

Direct air capture (DAC) of CO2 via temperature-swing adsorption (TSA) can support sustainable carbon dioxide removal, but only if sorbents regenerate with low energy demand and maintain performance under humid ambient air. In this paper, we evaluate three commercial molecular sieves (JLPM3, 13X, and 4A) in packed-bed tests using humid ambient air. We compared 40 g samples as received with 200 g samples conditioned for 12 days at 100 °C to emulate prolonged exposure to regeneration temperature (the cumulative effect of many heating/desorption cycles); all cycle-stabilized uptake values are reported from the conditioned materials. JLPM3 delivered the highest stabilized CO2 uptake (0.24 ± 0.01 mmol·g−1), consistent with a combined physisorption/chemisorption mechanism. Its higher total porosity (26.190%) and smaller mesopores (7.569 nm width) promoted rapid mass transfer and site accessibility, while slightly greater micropore area (710.285 m2·g−1) and volume (0.267 cm3·g−1) than 13X supported its marginally higher capacity. Evidence of partial structural degradation under mechanical and thermal stress indicates that minimizing strain during cycling will be important for scale-up and for reducing sorbent replacement. Conditioning at 100 °C activated additional chemisorption sites across all sieves but reduced physisorption capacity. Importantly, a ~100 °C desorption step fully regenerated physisorbed CO2 while purging moisture from zeolite pores, indicating that low-temperature TSA (compatible with low-grade or waste heat) can replace harsher 300 °C regeneration and lower energy demand. CO2–H2O competition experiments confirmed substantial site occupancy by water vapor, which limits capture under humid conditions and motivates water management strategies. Overall, maximizing DAC performance requires tailoring pore structure and operating conditions while preserving sorbent integrity; JLPM3 emerges as a promising candidate for more energy- and resource-efficient DAC.

1. Introduction

The ongoing rise in atmospheric carbon dioxide (CO2) concentrations is one of the most pressing challenges of our time, with levels exceeding 420 ppm as of 2024, an alarming increase from pre-industrial ~280 ppm [1,2]. This rapid accumulation, driven by fossil fuel combustion, deforestation, and industrial processes, has already led to profound climatic changes, including rising global temperatures, more extreme weather events, and widespread ecological disruption [3]. While deep emissions cuts via renewable energy, efficiency improvements, and ecosystem stewardship are essential, mitigation alone will not be enough. Even if emissions ceased immediately, excess atmospheric CO2 would continue to warm the climate for centuries, underscoring the need for carbon dioxide removal (CDR) alongside rapid decarbonization [4].
From a sustainability standpoint, DAC must deliver net-negative CO2 when energy, water, and material inputs are considered. In adsorption-based DAC, regeneration heat and moisture management strongly influence operating energy, lifecycle emissions, and cost. Likewise, sorbent lifetime and mechanical robustness affect resource demand and waste generation, making cyclic stability a key sustainability metric for scalable deployment.
Within the CDR portfolio, direct air capture (DAC) offers a scalable, location-flexible route to remove CO2 directly from ambient air and to address residual emissions from hard-to-abate sectors [5,6]. Although capturing CO2 at ~420 ppm is technically demanding, DAC can be paired with permanent geological storage (CCS) or with utilization pathways (CCU) to enable negative emissions while supporting a range of end-uses [7]. Achieving practical DAC at scale hinges on sorbent materials that couple high capacity and selectivity with stability and regenerability under realistic operating conditions, including humidity [8]. Zeolitic molecular sieves are leading physisorbents for temperature-swing adsorption (TSA) because their framework chemistry, pore structure, and surface properties can be tuned for CO2 capture [6,9].
Commercial zeolites remain key benchmark sorbents for adsorption-based CO2 capture because their framework topology and high cation density can provide strong CO2 affinity at low partial pressure, while pore architecture and binder-related textural porosity govern kinetics and working capacity. FAU-type materials such as 13X are among the most widely studied zeolites for CO2 separation and serve as common reference sorbents due to their large-pore access and high micropore volume [6,9]. In contrast, LTA-type zeolites such as 4A are highly hydrophilic and widely used as desiccants; under mixed CO2/H2O feeds their performance is often dominated by water uptake and transport constraints associated with narrow pore windows, which can strongly limit effective CO2 working capacity under humid conditions [6,10]. In addition to standard grades, industrial molecular sieves used for air pre-purification (e.g., JLPM3) are designed to remove CO2/H2O upstream of cryogenic air separation, but comparative datasets under humid ambient air and packed-bed TSA conditions remain less common, motivating direct benchmarking under realistic feeds.
However, real systems operate with humid ambient air and undergo many thermal cycles near typical regeneration temperatures, factors that can shift the balance between physisorption and chemisorption and adversely impact long-term sorbent performance. In particular, moisture in ambient air competitively occupies adsorption sites in hydrophilic zeolites, drastically curtailing CO2 uptake and increasing regeneration energy requirements [8]. Repeated heating and pressurization cycles can also induce structural and capacity degradation in zeolites over time [11]. Accordingly, this study focuses on three commercial zeolites purchased from Jalonzeolite (Yanshi, Luoyang, China) (13X, 4A, and JLPM3) to: (i) benchmark CO2 capture from humid ambient air in a packed-bed TSA process; (ii) quantify CO2–H2O competitive adsorption under varying conditions; (iii) determine the regeneration conditions needed to fully desorb physisorbed CO2 while purging accumulated moisture; (iv) assess how prolonged exposure at 100 °C, used to emulate the cumulative effect of many desorption/heating cycles, alters adsorption mechanisms and mechanical robustness; and (v) relate performance differences to textural attributes (porosity, mesopore size, and micropore volume).
To meet these objectives, we conducted two complementary experimental phases. In Phase 1, ambient air was fed through a packed bed containing 40 g of each sieve (no pre-treatment) at 2.94 L/min (3.09 NL/min) under ambient conditions. Breakthrough curves established CO2 uptake; desorption was quantified during regeneration up to 310–315 °C; and concurrent water capture was tracked to elucidate hygroscopic behavior. In Phase 2, the materials underwent 12 days of pre-conditioning at 100 °C prior to testing, after which one TSA cycle was performed with a 200 g bed using humid ambient air feed. This deliberate, long-duration conditioning was designed to simulate the multiple desorption heating cycles encountered in real DAC/TSA operation at typical regeneration temperatures. All cycle-stabilized uptake values reported refer to these 12-day/100 °C-conditioned samples.
By linking humidity effects, regeneration temperature, and prolonged thermal exposure to pore architecture and mechanical integrity, this work provides actionable guidance to improve the energy efficiency, durability, and overall sustainability of zeolite-based DAC and to translate laboratory metrics into durable, real-world operation.

2. Experimental Procedure

2.1. Experimental Setup and Procedure

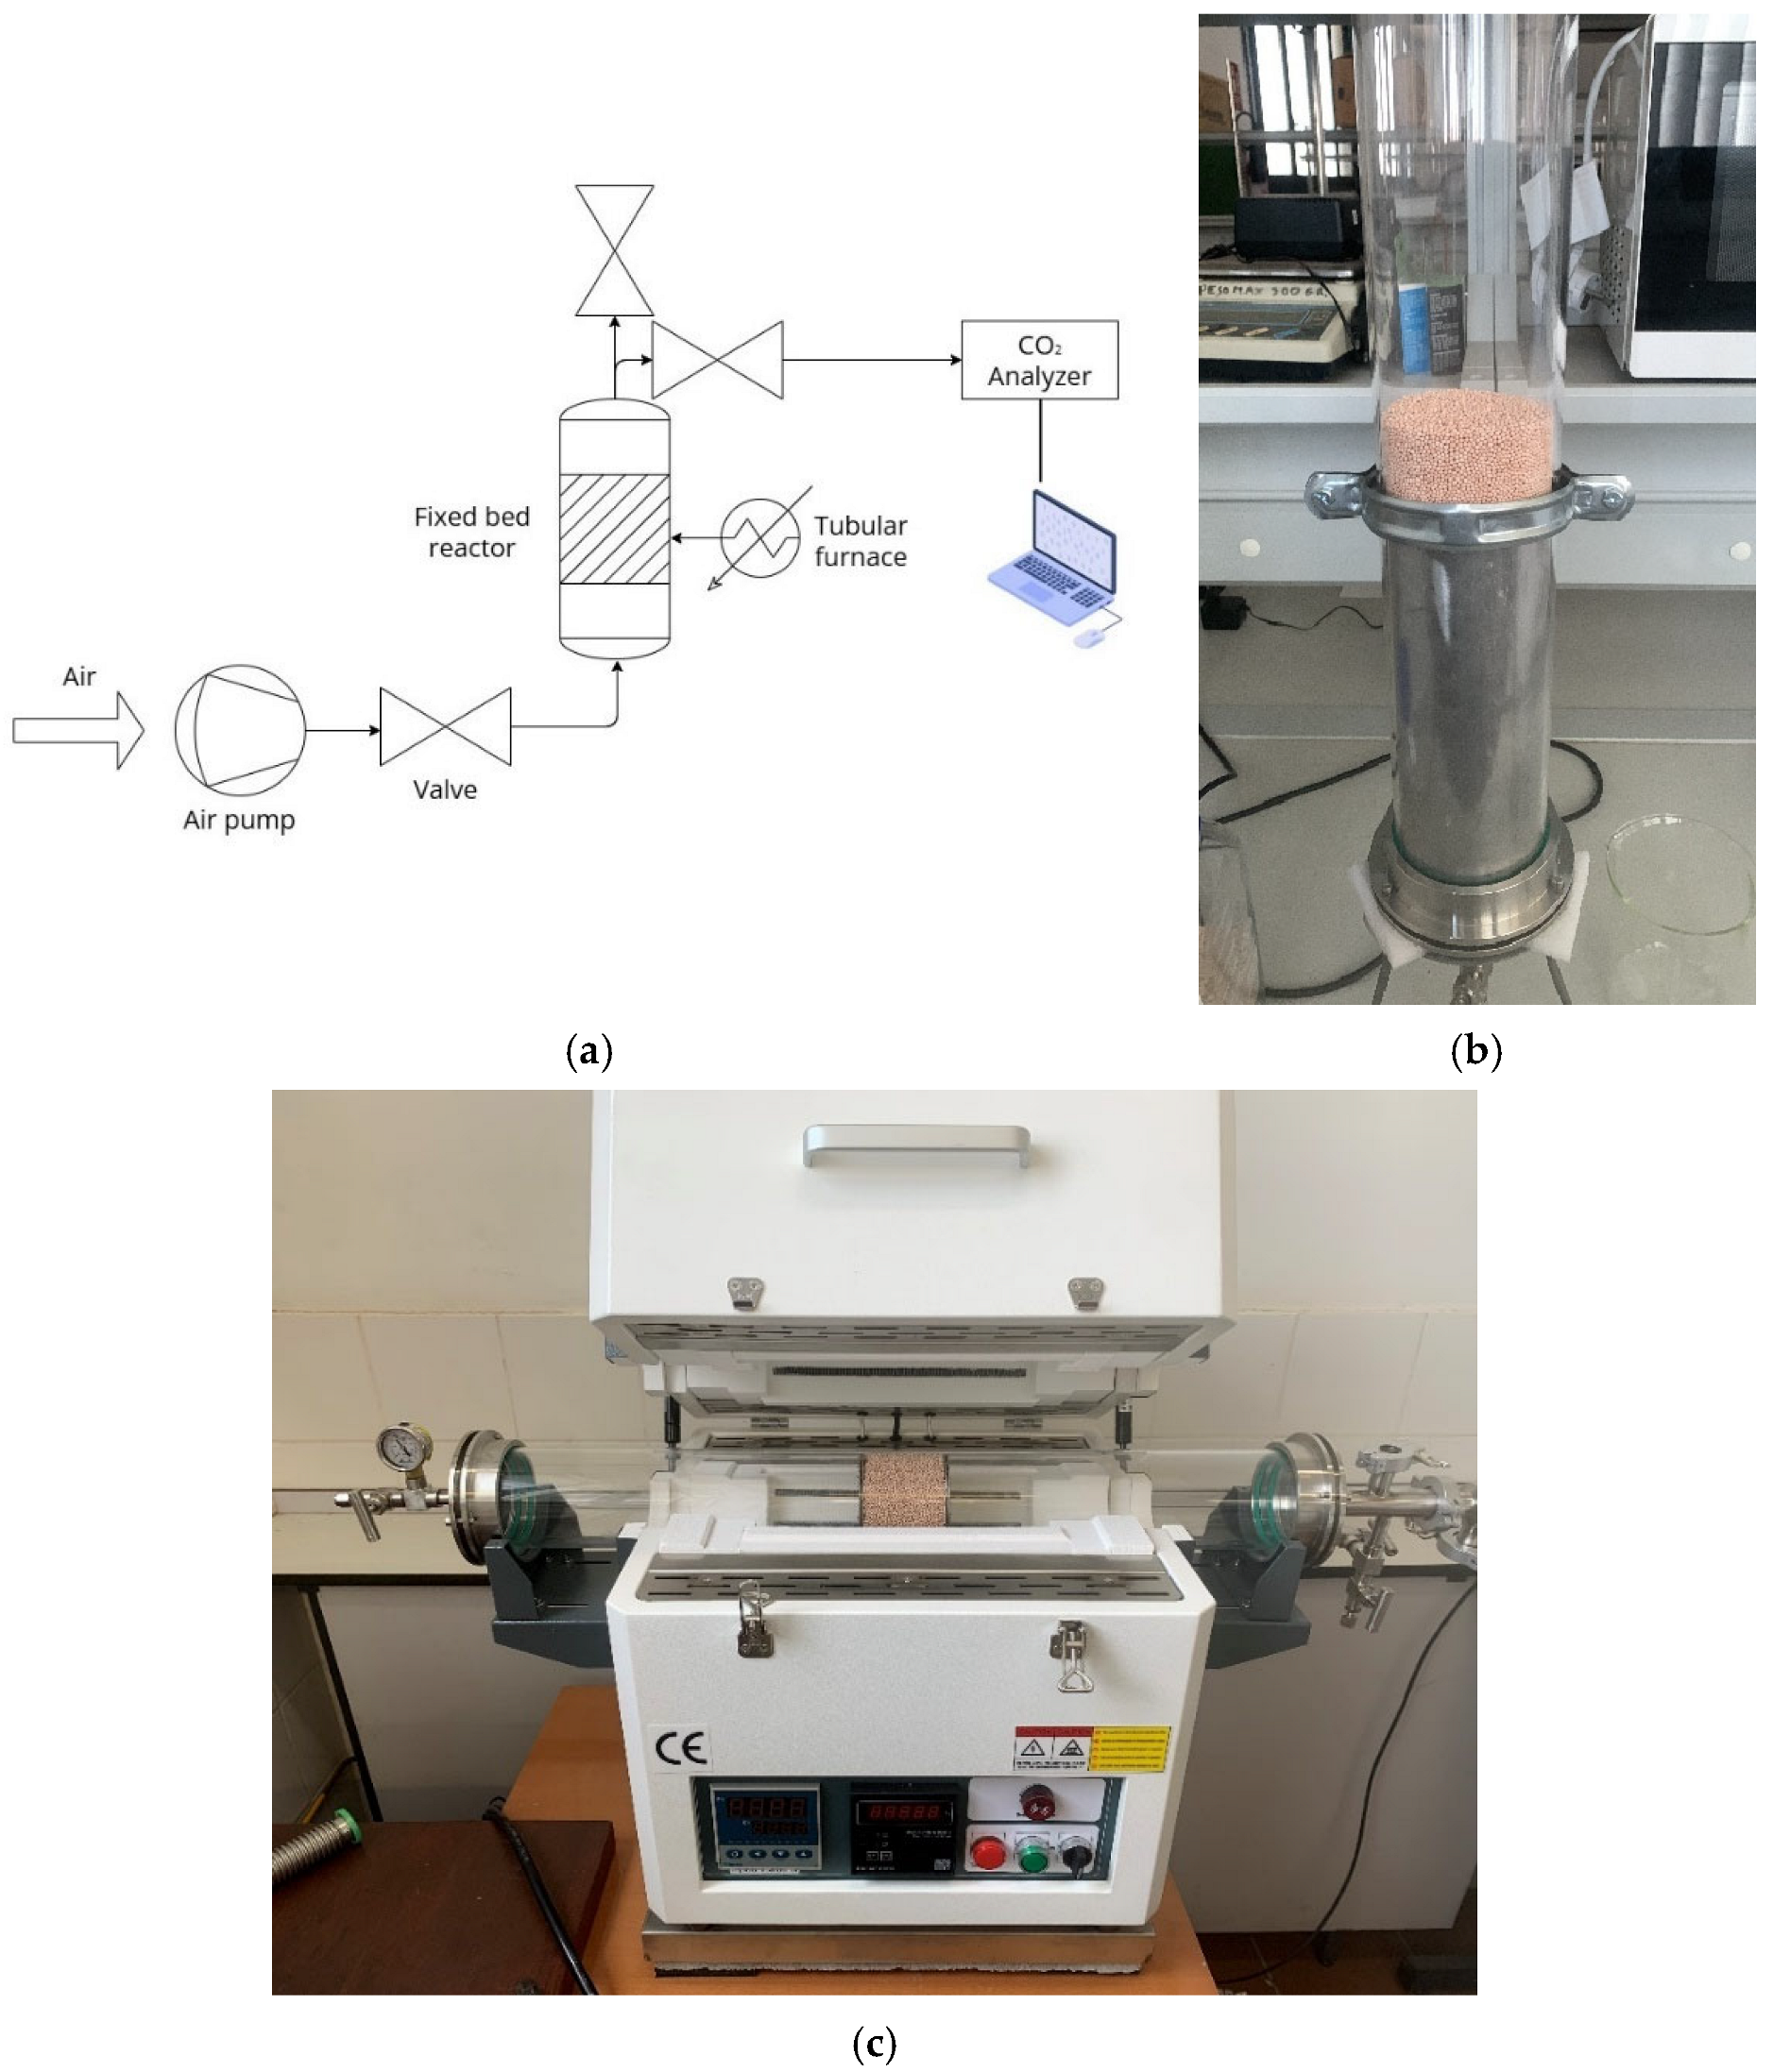
The experimental setup (Figure 1a) consists of a homemade fixed-bed reactor consisting of a quartz tube. The ends of the quartz tube are sealed using vacuum flanges; one flange is equipped with a single valve, while the other has two valves for gas flow control. The quartz tube is oriented vertically (Figure 1b), and a metallic filter is placed inside to support the molecular sieves (see Appendix A).
The quartz reactor tube had inner diameter D i = 90 mm (inner radius r i = 45 mm) and total length of 800 mm. The corresponding internal cross-sectional area was A = π r i 2 = 6.36 × 10⁻³ m2 (63.6 cm2). A perforated metallic support plate (1 mm holes) retained the pellets. The bed volume was computed as V b = A·L, the packed-bed bulk density as ρ b u l k = m/ V b , and the void fraction was estimated as ε = 1 − ρ b u l k / ρ p using the skeletal (particle) density ρ p obtained from mercury porosimetry (Table 6). Table 1 summarizes all geometric and packing parameters. The molecular sieves used in the experiments include 13X, 4A, and JLPM3, with particle sizes ranging from 1.6 to 2.5 mm. Humid ambient air is pumped into the reactor from the bottom using a micro-diaphragm air pump that operates continuously at a flow rate of 2.94 L/min (3.09 NL/min). Based on the tube cross-section and the actual inlet volumetric flow, the superficial gas velocity was calculated as u s = Q / A [12,13]. Bed-scale flow regime was characterized using the particle Reynolds number R e p = ρ u s d p / μ (air at ~25 °C, 1 atm), yielding R e p 0.8 –1.2 for d p = 1.6 –2.5 mm (laminar regime) [12,13]. The bed pressure drop was not measured directly; therefore, Δ P   was estimated using the Ergun equation with the measured bed height L , pellet size range, and the estimated void fraction ε (Table 1) [12,14]. Under the present conditions, the resulting Δ P is predicted to be very small (sub-Pa even for the 200 g beds) [12,14]. The air passes through the packed bed of molecular sieves, and a portion of the exiting air is directed to an online NDIR CO2 gas analyzer (Wuhan Enviro Solutions Technology Co., Ltd., Wuhan, China). The analyzer sampled the reactor effluent via a downstream tee (slipstream) connection; the gas was not dried prior to analysis, consistent with the use of humid ambient air feed. The instrument operates over 0–980 mg/m3 and 0–19,600 mg/m3, corresponding to maximum absolute errors of ±19.6 mg/m3 and ±392 mg/m3 (±2% of full scale in each range).
During desorption, the quartz tube was placed horizontally inside the tubular furnace (Model No.STG-100-12 tube furnace, Henan Sante Furnace Technology Co., Ltd., Luoyang, China) (Figure 1c) with the packed-bed region centered in the furnace hot zone. The temperature reported in the desorption plots corresponds to the furnace control thermocouple located at the center of the hot zone (i.e., the temperature signal available from the furnace controller). The furnace was programmed to ramp from ambient to 310–315 °C at an average heating rate of ~8 °C·min−1. Axial and radial temperature gradients within the packed bed were not directly measured using multiple thermocouples at the bed inlet/outlet/center; therefore, transient features should be interpreted as referenced to the furnace thermocouple temperature, and small offsets may occur during the ramp. Because the bed lengths are short (Table 1) and the bed is located within the hot zone, temperature non-uniformity across the bed is expected to be limited near steady-state conditions.

2.2. Data Analysis

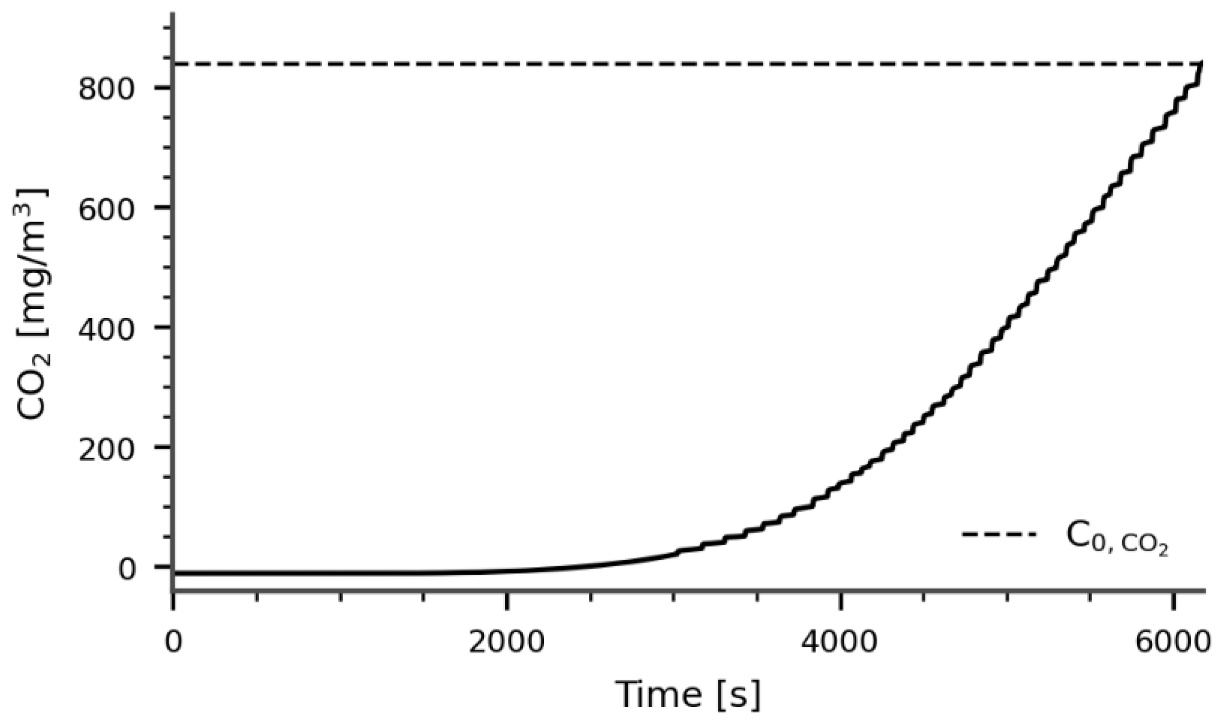
During the adsorption process, graphs like the one shown in Figure 2 were obtained. In these graphs, C 0 , CO 2 represents the inlet concentration of CO2. C 0 , CO 2 is determined by passing air through the reactor without the molecular sieves and averaging the measured concentrations. To calculate the total amount of CO2 adsorbed ( Q ads , CO 2 ), an overall mass balance over the fixed-bed was applied, and the uptake was obtained from the area above the breakthrough curve, i.e., the time integral of the difference between inlet and outlet concentrations [15,16]:
Q ads , CO 2 = F t = 0 t = t sat ( C 0 , CO 2 C CO 2 ) d t
The equation (Equation (1)) to calculate the total amount of CO2 adsorbed includes several key components. The volumetric flow rate of air, F , represents the amount of air passing through the reactor and is expressed in units such as liters per minute (L/min) or cubic meters per second (m3/s). In this study, F was set at 2.94 L/min (3.09 NL/min), equivalent to 0.000049 m3/s (0.0000515 Nm3/s). The inlet CO2 concentration, C 0 , CO 2 , reflects the amount of CO2 in the air entering the reactor, measured in milligrams per cubic meter (mg/m3); this was determined before each run using a bypass procedure (reactor without sorbent), and this provided the baseline for the CO2 available for adsorption. The outlet CO2 concentration, C CO 2 , corresponds to the CO2 content measured in the analyzer after passing through the packed bed of molecular sieves, indicating the CO2 that remains unadsorbed. The time at which the adsorption process reaches saturation, t sat , represents the point at which the adsorbent material can no longer effectively capture CO2, serving as the upper limit of integration.
The CO2 concentrations C 0 and C CO 2 used in Equation (1) correspond to the NDIR analyzer readings under humid (wet) conditions, because the feed was unconditioned ambient air and no drying stage was installed upstream of the analyzer. Accordingly, the uptake integration uses wet-basis concentrations consistently for both inlet and outlet.
For the graphs obtained during the desorption process, a similar integration was performed to calculate the total amount of CO2 desorbed ( Q des , CO 2 ). However, in this case, the integration was applied to the expression ( C CO 2 C 0 , CO 2 ) from t = 0 to the time when the desired temperature is reached. The outlet CO2 concentration ( C CO 2 ) was adjusted by subtracting the inlet CO2 concentration ( C 0 , CO 2 ) because during desorption, the CO2 released from the molecular sieves due to heating is mixed with the air being pumped through the system. This results in an additional C 0 , CO 2 being recorded by the analyzer, which must be accounted for to accurately quantify the CO2 desorbed.
The inlet water-vapor concentration ( C 0 , H 2 O ) was estimated from ambient temperature ( T ) and relative humidity ( R H ) using standard psychrometric relations. Because the adsorption tests used unconditioned ambient air and no inline humidity analyzer (or inlet hygrometer) was installed at the reactor inlet during the experimental campaign, hourly T and R H were obtained from the Meteostat platform for the nearest representative airport station, Tenerife/Los Rodeos [17]. Meteostat compiles and redistributes observational datasets from public meteorological sources (e.g., NOAA/WMO networks), enabling traceable post-processing of ambient test conditions.
Relative humidity is defined as R H = 100 p H 2 O / p s a t ( T ) , where p H 2 O is the partial pressure of water vapor and p s a t ( T ) is the saturation vapor pressure at temperature T [18]. Thus, p H 2 O = ( R H / 100 ) p s a t ( T ) . Assuming ideal-gas behaviour for water vapour, the inlet absolute humidity (mass concentration) is:
C 0 , H 2 O = Relative   Humidity   ( % ) × P sat ( T ) × M H 2 O 100 × R × T
where M H 2 O is the molar mass of water (18.015 g·mol−1), R is the universal gas constant (8.314 Pa·m3·mol−1·K−1), and T is in Kelvin. When p s a t ( T ) is expressed in Pa, Equation (2) yields C 0 , H 2 O in g·m−3 (multiply by 10 3 to obtain mg·m−3). The saturation vapor pressure p s a t ( T ) was calculated using the Buck correlation [19]. This estimated inlet humidity was used only to contextualize and compare inlet conditions between runs; no inlet–outlet H2O mass balance is claimed in the absence of a dedicated humidity analyzer.
Uncertainties reported in Table 2, Table 3, Table 4 and Table 5 correspond to combined measurement uncertainty (propagated from instrument specifications and data reduction) and are not standard deviations from independent replicate experiments. CO2 uptake uncertainty was obtained by propagation of the NDIR analyzer accuracy (±2% of full scale for the selected range) together with numerical integration discretization error. Because cycles 0–3 were performed sequentially on the same packed bed (no repacking), cycle-to-cycle variation reflects cyclic conditioning/degradation rather than replicate-to-replicate variability.
Baseline correction was not based on a fixed “laboratory baseline” across days. Instead, each run was treated under its own steady conditions and referenced to C 0 , defined as the inlet CO2 concentration measured immediately before that run using the bypass procedure (reactor without sorbent). During data processing, the concentration time series was screened for isolated spikes/outliers (e.g., occasional analyzer glitches or switching transients); points that deviated strongly from the local neighborhood were excluded so they did not bias the baseline estimate or the subsequent numerical integration.

2.3. Characterization Techniques

2.3.1. Nitrogen Adsorption

The samples were degassed at 200 °C for 16 h under vacuum to remove moisture and other physisorbed species, ensuring that subsequent N2 uptake reflects the accessible pore volume. Adsorption–desorption isotherms were then measured on a (Micromeritics Instrument Corporation, Norcross, GA, USA) with the MicroActive 5.02 software. Liquid nitrogen cooling maintained a bath temperature of 77.3 K, and high-purity N2 gas was used as the adsorptive. Data points were collected over a relative pressure range of p/p0 ≈ 0.001–0.987 with a fixed 20 s equilibration interval at each step.
The instrument software generated, for each sample: single-point BET surface area, multi-point BET surface area, t-plot micropore area and volume, BJH adsorption/desorption pore-size distribution, and Horváth–Kawazoe micropore width. These textural parameters were used to correlate structural properties with adsorption performance.

2.3.2. Mercury Porosimetry

Mercury intrusion–extrusion measurements were performed with a high-pressure porosimeter, Micromeritics AutoPore IV (Micromeritics Instrument Corporation, Norcross, GA, USA), controlled by the MicroActive software. Powder samples were loaded into a 3-bulb, 0.412-stem glass penetrometer (volume = 3.1276 mL). Intrusion was recorded from vacuum up to ~60,000 psia. Calculations assumed a mercury contact angle of 141°. The resulting mercury intrusion data provided macropore size distributions and bulk density measurements, supplementing the nitrogen physisorption data to provide a full picture of the pore architecture in each material.

2.3.3. X-Ray Diffraction (XRD)

Powder specimens (10 mm track length) were examined on a θ–2θ diffractometer operated in Bragg–Brentano geometry. Cu K-α radiation was used (λ = 1.54060 Å; generator setting 45 kV/40 mA). Key instrument parameters were: divergence slit = 0.1799°, incident-beam Soller slit = 0.040°, 10 mm beam mask, goniometer radius = 240 mm and specimen spinning “Yes”. Patterns were collected continuously from 5.013 to 79.97° 2θ with a step of 0.026° 2θ and 56.865 s counting time per step. Peak lists produced by the control software were matched against ICDD PDF-4+ entries, providing semi-quantitative phase abundances by the reference intensity ratio (RIR) routine included in the same package.

2.3.4. X-Ray Fluorescence (XRF)

Elemental concentrations were obtained from wavelength-dispersive XRF measurements. The instrument acquired two excitation ranges automatically: Range 3 at 20 kV and Range 2 at 40 kV (ranges shown in the report for every oxide). The three samples return analytical totals of 99.99–100.02 wt %, confirming measurement completeness within the stated precision.

3. CO2/H2O Adsorption–Desorption Performance

3.1. The 40 g Packed Bed of Molecular Sieves JLPM3, 13X, and 4A (No Pre-Treatment)

Four TSA cycles were carried out on separate days in a fixed-bed reactor packed with 40 g of JLPM3, 13X, and 4A molecular sieves. The first adsorption cycle (cycle 0) served as a pre-treatment to activate the zeolites. Adsorption was performed under ambient conditions, while desorption was induced by a temperature swing from ambient ( T a m b ) up to 310–315 °C. The packed beds were prepared in a tube of inner diameter D i = 90 mm (inner radius r i = 45 mm). For the 40 g tests, the resulting packed-bed heights were L = 0.80 cm (JLPM3), 0.80 cm (13X), and 0.70 cm (4A) (see Table 1 for full geometric and packing parameters).
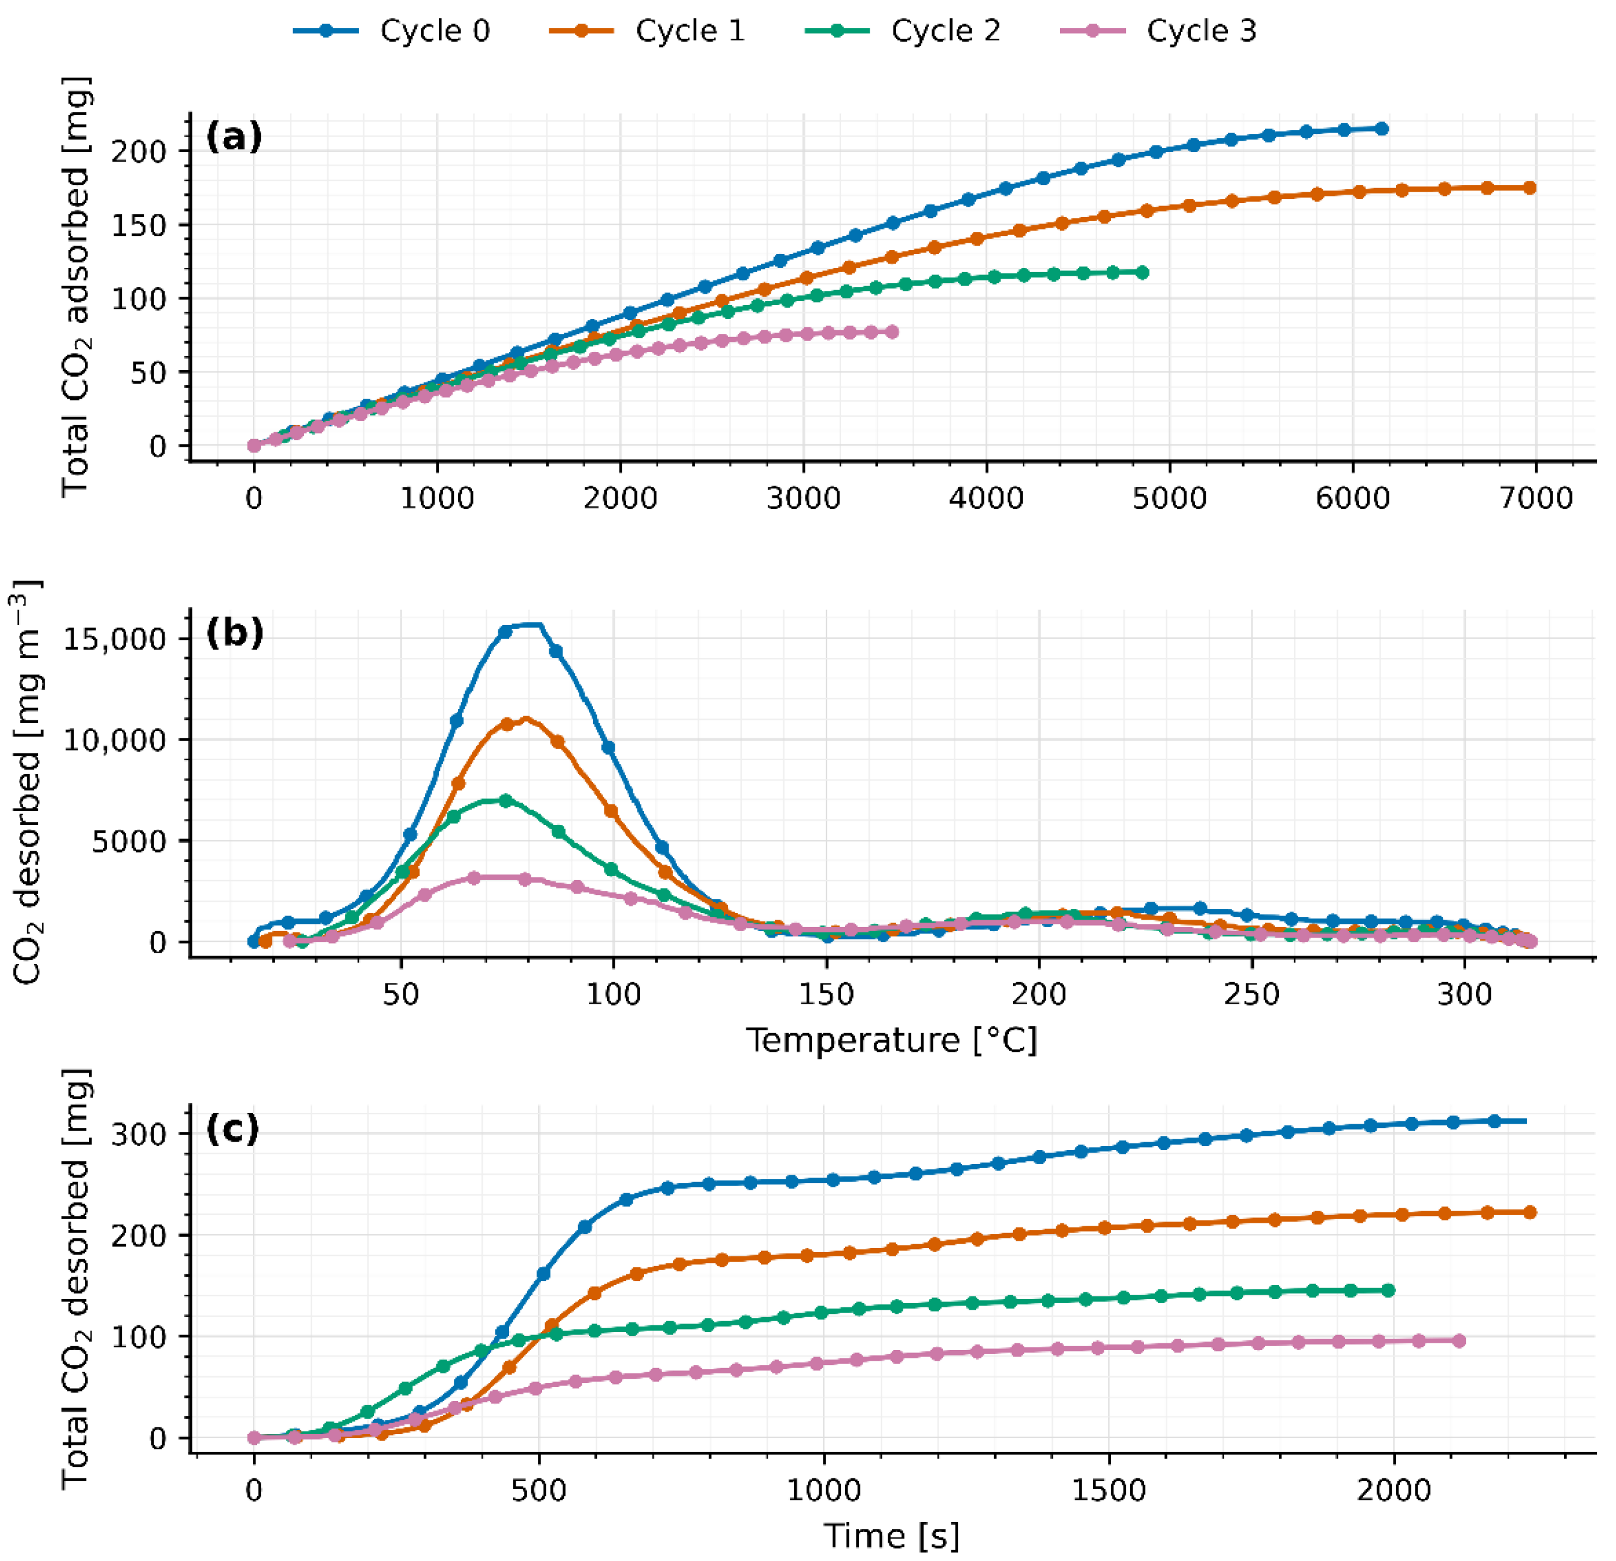
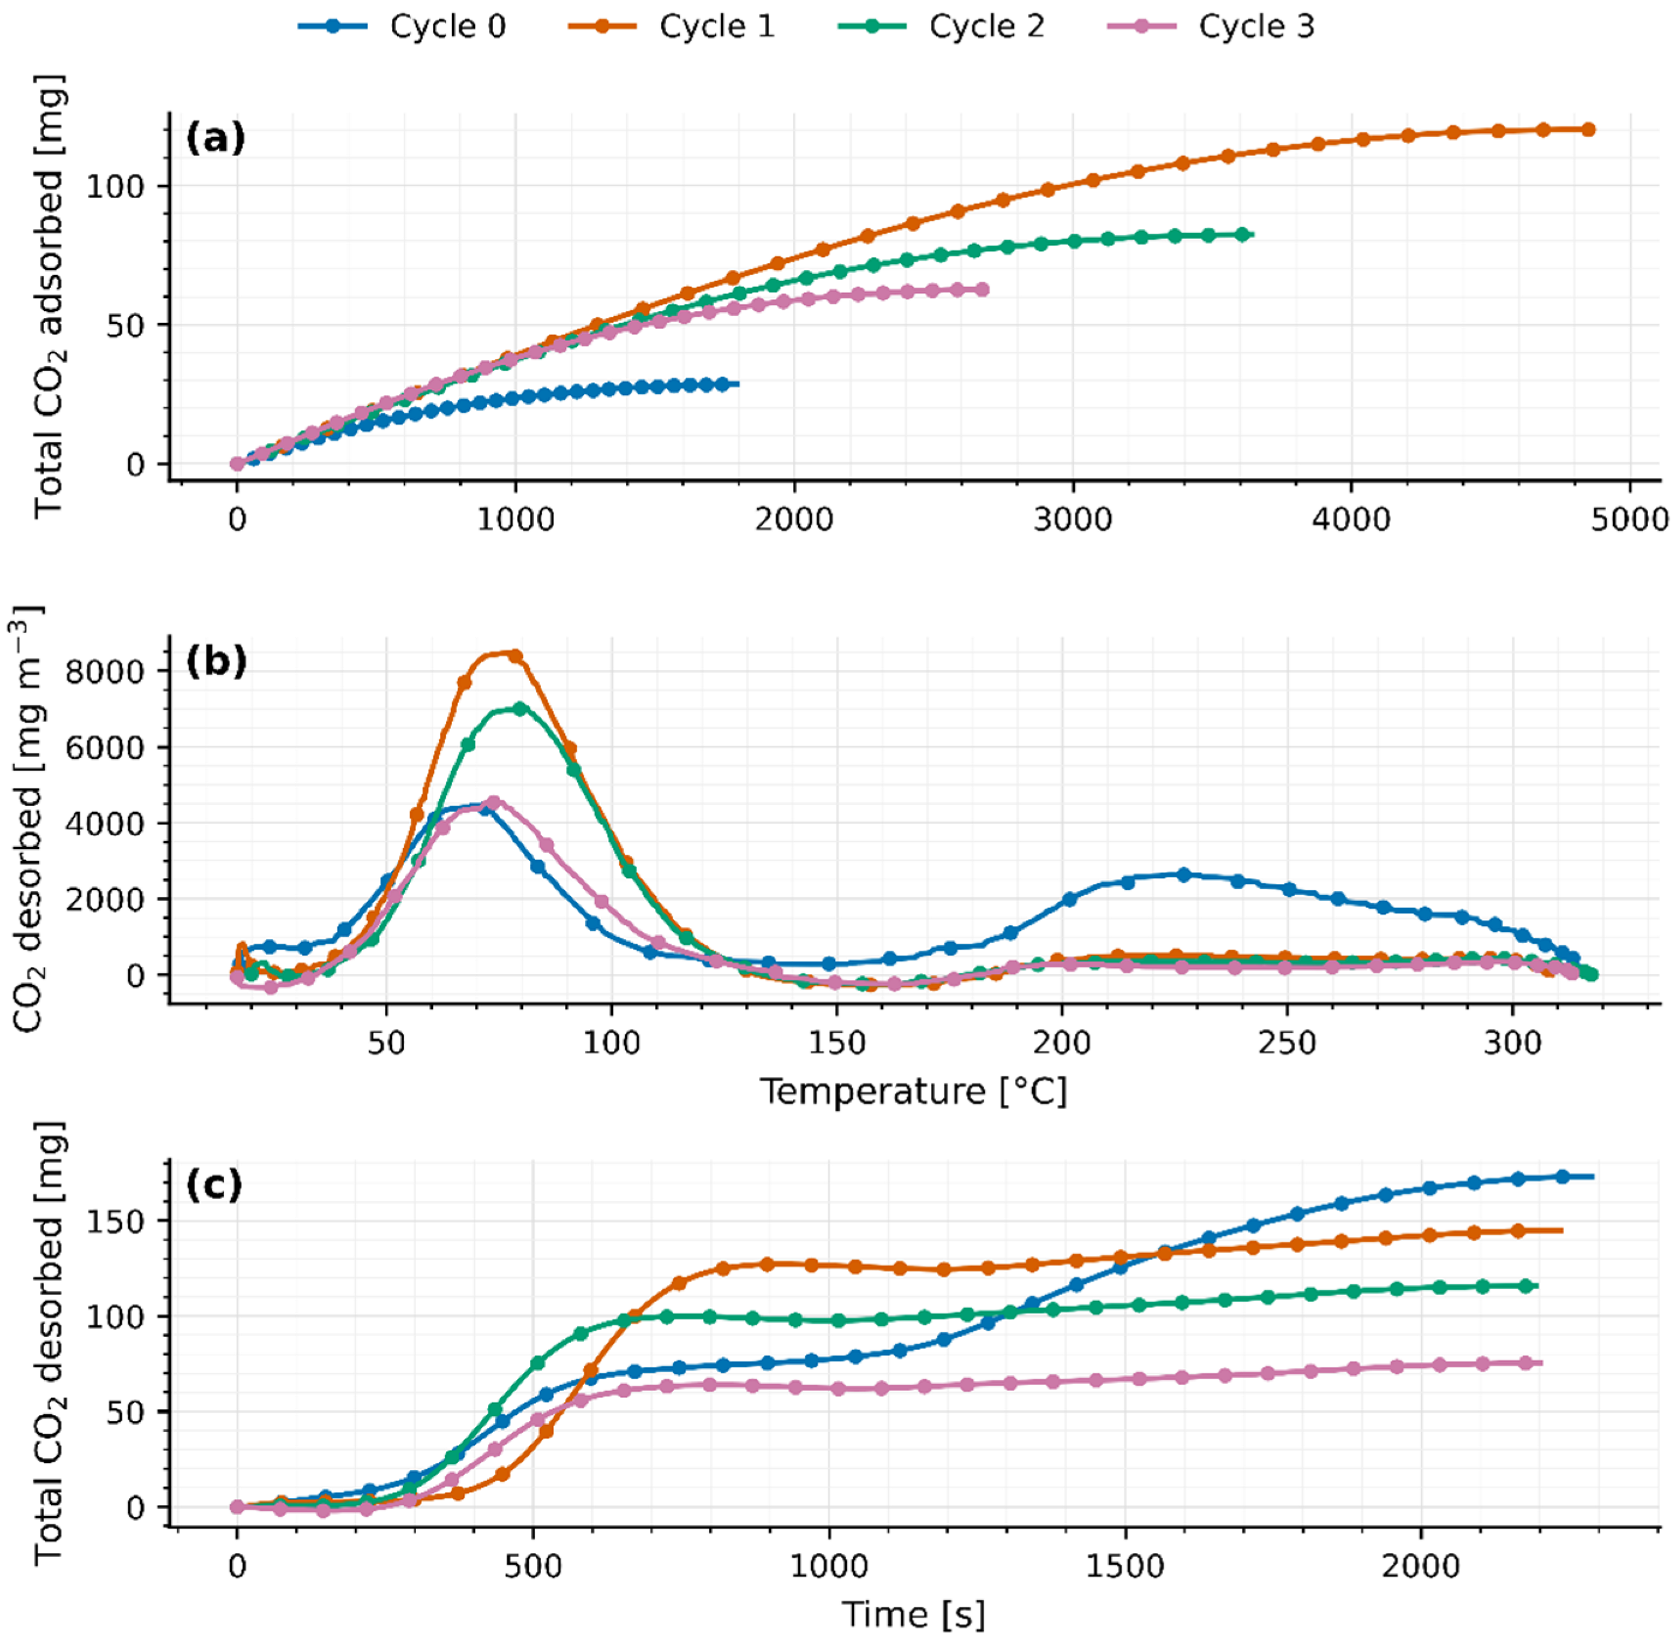
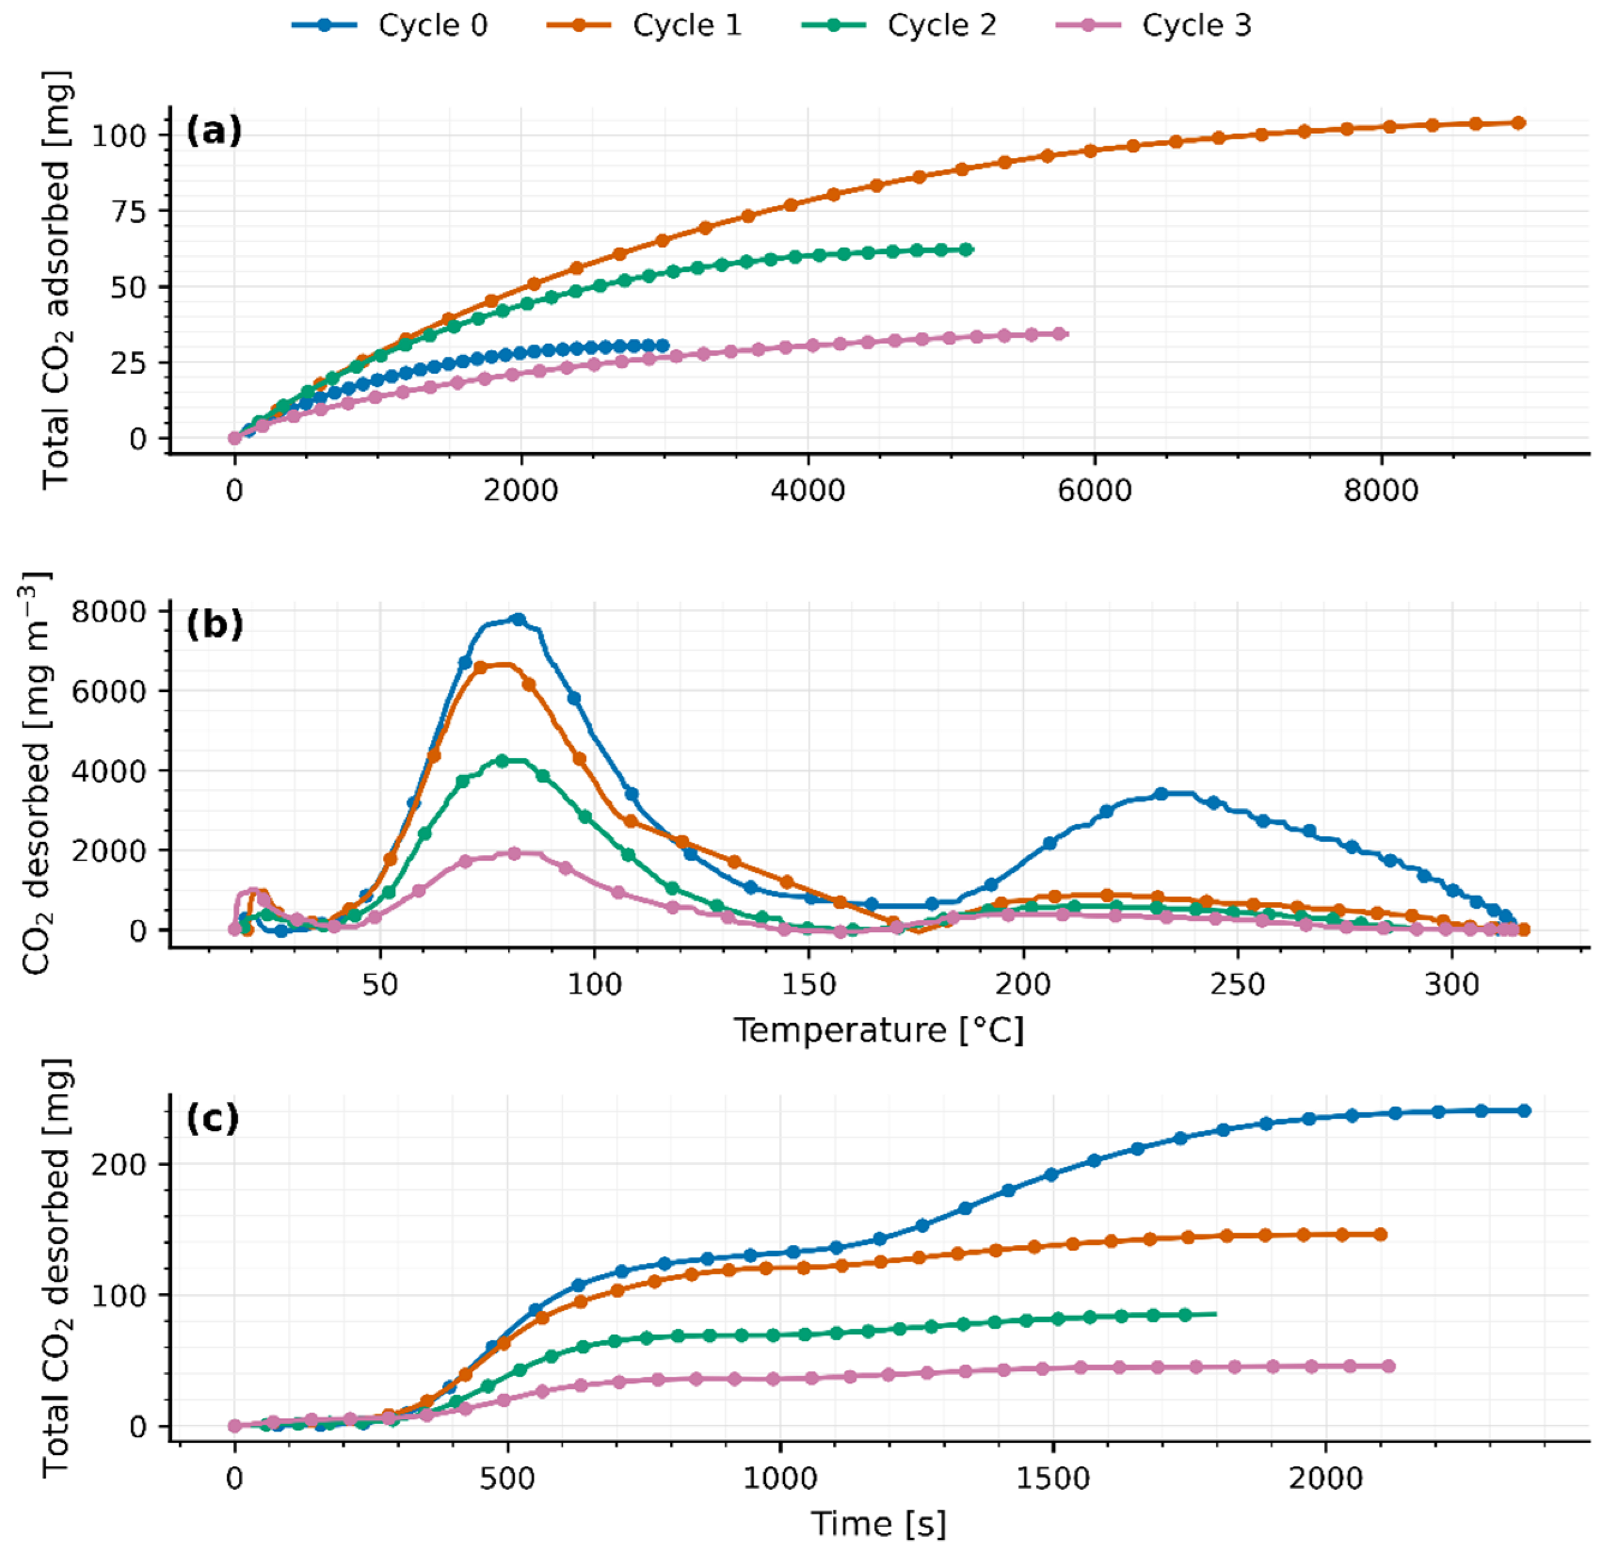
Four TSA cycles were performed on separate days with 40 g beds of JLPM3, 13X, and 4A using humid ambient air as feed (Section 2.1). Adsorption proceeded at ambient conditions; desorption used a temperature swing to 310–315 °C. The corresponding breakthrough and temperature-programmed desorption (TPD) profiles are shown in Figure 3, Figure 4 and Figure 5 and cycle-wise uptakes in Table 2, Table 3 and Table 4.
Typically, zeolites are considered physical adsorbents, but formation of chemisorbed species (like carbonates or bicarbonates) on zeolite cation sites is known under certain conditions [7]. For example, Amrit Kumar et al. (2015) observed that some physisorbents can bind CO2 strongly enough to require elevated temperatures for release, hinting at chemisorptive interactions in MOFs/zeolites during DAC [20]. In all three sieves, the CO2 TPD curves show a reproducible bi-modal shape: a low-temperature peak (≈75–82 °C) followed by a broader peak at ≈214–220 °C (Figure 3b, Figure 4b and Figure 5b). We attribute the first to readily reversible physisorption in micropores and the second to stronger binding (e.g., bicarbonate/carbonate-like species on cationic/defect sites) that requires higher temperature to desorb, consistent with reports on FAU/LTA zeolites that separate weakly vs. strongly bound CO2 in TPD features [6,7]. A fraction of stronger sites can also be introduced or amplified by composition/defects or metal modification (e.g., Fe@13X), which shifts part of the desorption to higher T [21].
As heat is applied from ambient up to 310–315 °C, a first peak appears between 75 °C and 82 °C (77.9 ± 1.2 °C for JLPM3; 75.3 ± 2.8 °C for 13X; 81.9 ± 0.6 °C for 4A), signaling the release of weakly adsorbed CO2 (physisorption or surface interactions). Following this peak, the CO2 concentration falls sharply (flush-out of residual gas) until roughly 156–168 °C. Then, a second, broader peak emerges at 214–220 °C (214.1 ± 7.3 °C for JLPM3; 216.6 ± 4.5 °C for 13X; 219.6 ± 5.1 °C for 4A), attributed to the desorption of more strongly bound CO2 (chemisorption or internal zeolite interactions). A small, marginal rise near 300 °C is observed in all cases, likely due to combustion of trace organics rather than continued desorption.
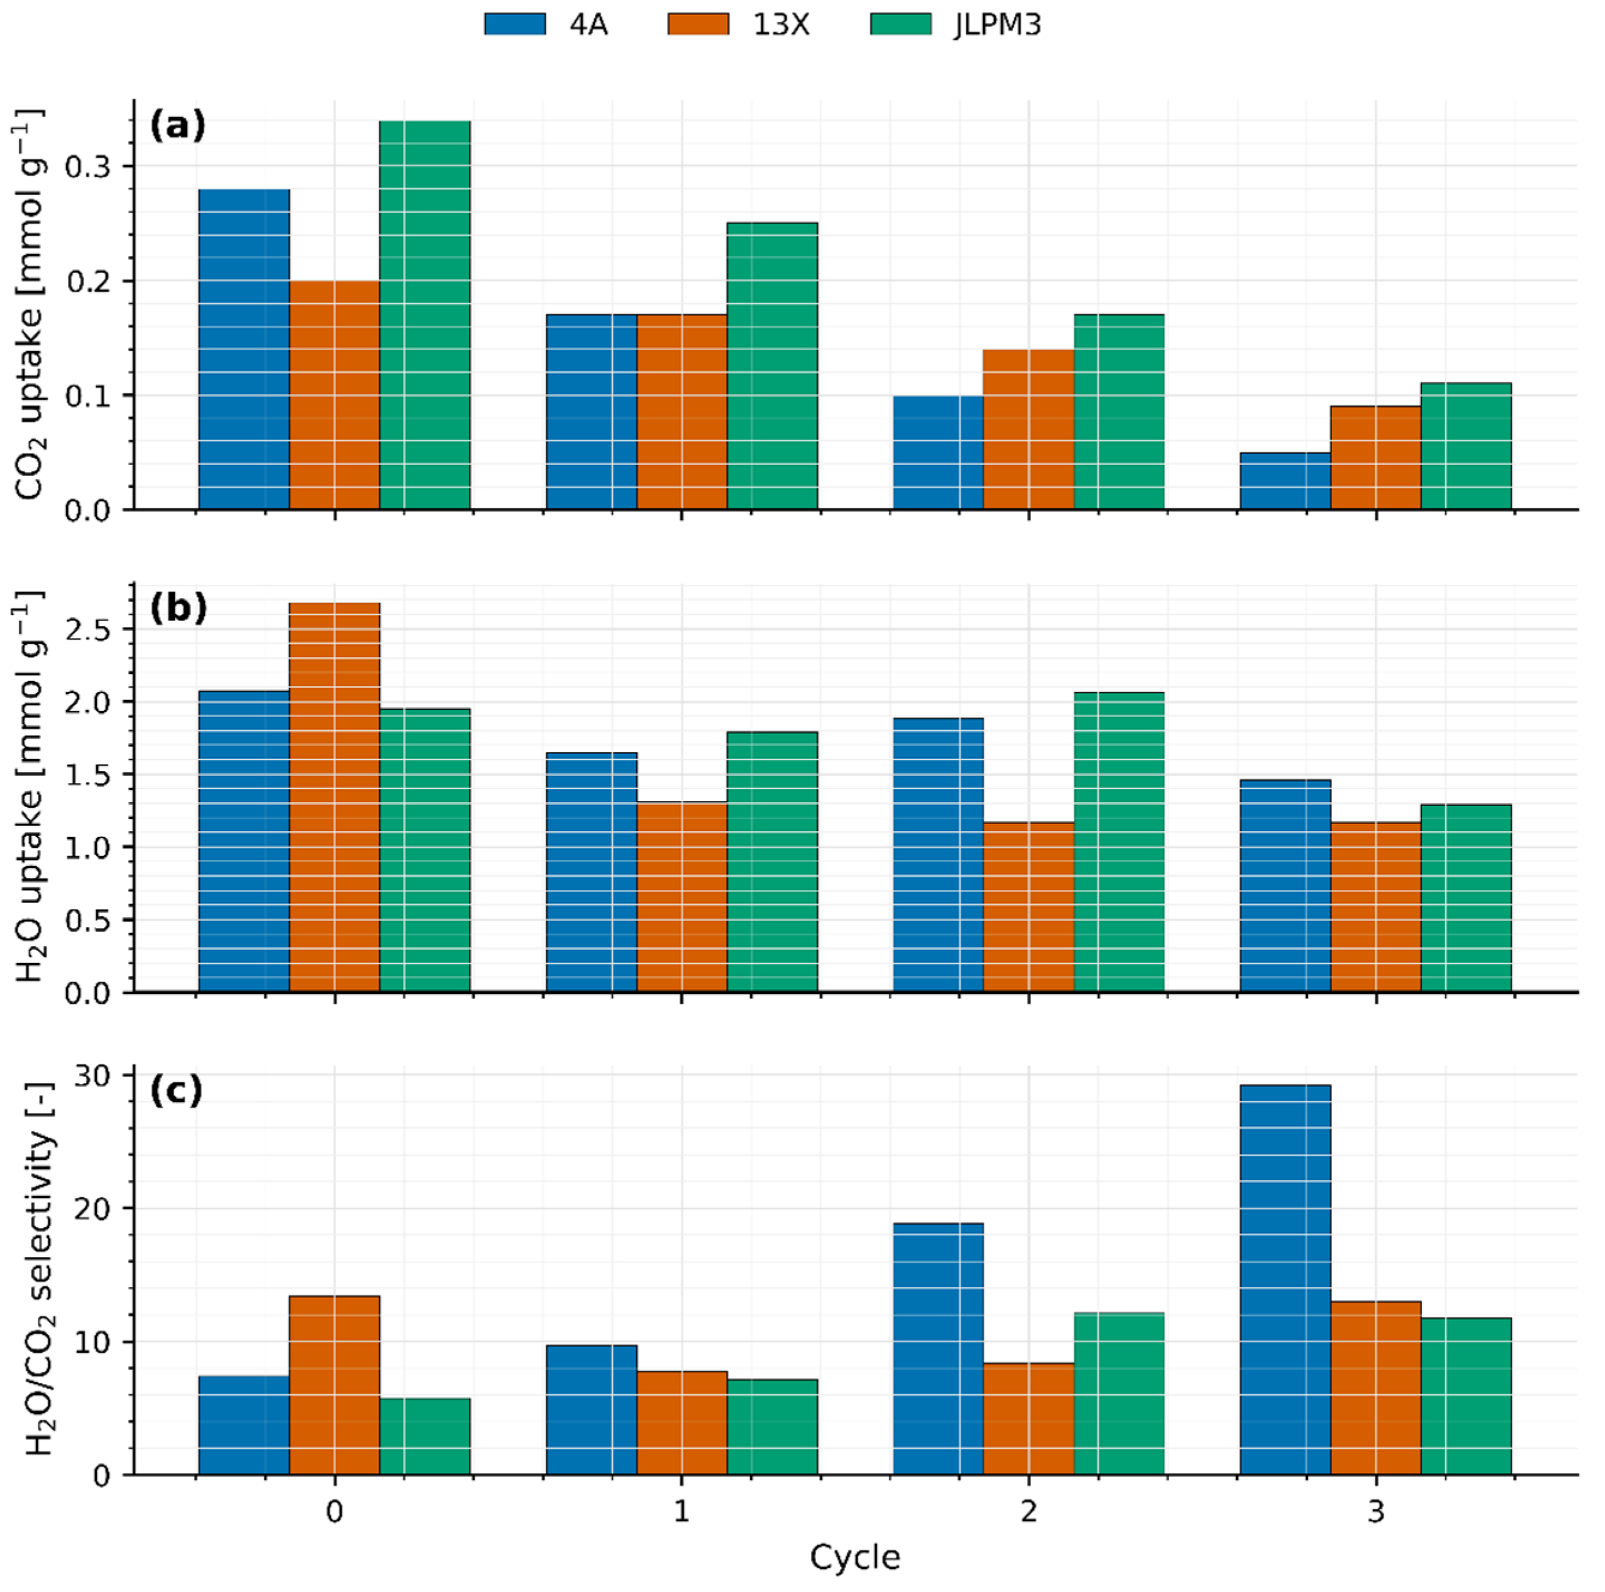
Integrating the breakthrough curves, the initial CO2 uptakes rank JLPM3 > 13X > 4A (Table 2, Table 3 and Table 4). JLPM3 shows the steepest front, indicative of faster kinetics, consistent with its higher porosity and smaller mesopores that shorten diffusion paths to CO2-selective micropores (Section 4). Recent studies confirm that appropriately engineered zeolites can capture CO2 at air-level concentrations with fast kinetics and modest heats of adsorption, particularly MOR-type frameworks under dry or controlled-humidity conditions [16]. These results align with our ranking (JLPM3 ≥ 13X ≫ 4A) and the observed sensitivity to moisture. All three materials, however, display substantial co-adsorption of H2O; the measured H2O/CO2 selectivity increases across cycles (Figure 3, Figure 4 and Figure 5), reflecting the strong hydrophilicity of low-Si/Al zeolites and site blocking by water under ambient humidity [6,22]. The particularly low CO2 capacity of 4A is consistent with its small LTA windows that limit CO2 access and its strong affinity for H2O [6,22]. Notably, while competitive adsorption by water is generally dominant in hydrophilic zeolites, specific K-MER sites have been shown to allow CO2 to displace pre-adsorbed H2O at 30 °C, highlighting framework/cation site effects under humid DAC conditions [23].
Quantitatively, the fraction of CO2 released via the first mechanism (“low temperature” peak) varies by sorbent and cycle. For JLPM3, it remains around 80% across cycles (with no statistically significant change), whereas 13X rises from 43% in cycle 0 (preloaded and burning off organics) to about 85% thereafter, and 4A from 55% up to ~80–82%. Weight measurements (Table 2, Table 3 and Table 4) confirm a large drop after the first cycle (40.01 g → 37.49 g for 13X; 40.01 g → 37.85 g for 4A), then only minor losses in subsequent cycles, corroborating removal of pre-existing CO2/organics and stabilization of the material. Across all sorbents, after pre-treatment (after cycle 0), adsorption/desorption capacities ( Q ads , CO 2 and Q des , CO 2 ) match within margin of error each cycle, aside from cycle 0, but this is because, during the desorption in cycle 0, there was still CO2 adsorbed in the zeolites and also part of the excess of CO2 comes from organic matter being burnt, demonstrating full reversibility once pre-treatment effects are accounted for.
Except for the first cycle, the integrated CO2 desorbed ( Q des , CO 2 ) matches the CO2 adsorbed ( Q ads , CO 2 ) within the combined experimental uncertainty of the flow, baseline subtraction, and analyzer calibration. The apparent Q des , CO 2 > Q ads , CO 2 observed in cycle 0 arises from (i) pre-loaded CO2 in the as-received zeolites (CO2 weakly bound and/or bicarbonate/carbonate species accumulated) that is released upon the first heat-up and (ii) oxidation of trace organics on the pellets/binder, evidenced by the small shoulder near ~300 °C, which contributes additional CO2 not associated with the immediately preceding adsorption step. After this conditioning cycle, baseline-corrected desorption profiles close the CO2 mass balance in every cycle, confirming reversible uptake once pre-treatment effects are removed.
Despite this reversibility, total CO2 uptake and release steadily decline with each TSA cycle (Figure 3a,c, Figure 4a,c and Figure 5a,c), indicative of thermal degradation at 310–315 °C. This is consistent with the thermally induced degradation of hydrophilic zeolites under repeated TSA exposure in humid feeds [11]. As high-quality CO2 sites/accessibility decline, the H2O/CO2 selectivity rises because polar H2O increasingly dominates competitive adsorption [6,22]. JLPM3 shows the greatest performance drop and physical fragmentation, producing dust, whereas 13X retains its structure best, and 4A lies in between. By cycle 3, JLPM3 and 13X converge to similar uptake levels, underscoring how JLPM3’s structural breakdown drives its loss. When comparing all three sorbents (Figure 6), JLPM3 initially delivers the highest CO2 uptake, followed by 13X and then 4A, but all three diminish over cycles. Water uptake likewise converges, and the H2O/CO2 selectivity ratio increases cycle-by-cycle: as the sorbents’ electromagnetic adsorption strength weakens (affecting non-polar CO2 more than polar H2O), given that they preferentially capture water. These trends highlight that, while the dual-peak desorption signature and reversible adsorption mechanisms persist, high-temperature cycling inexorably erodes sorbent capacity and selectivity, especially for JLPM3, suggesting a trade-off between initial performance and thermal durability.
The humidity penalty observed in this paper and in the literature [10,22,23,24] underscores the need for water management (e.g., layered beds or pre-drying) to enable moderate-temperature TSA (≈100–120 °C) with zeolites [22]. Framework topology and extra-framework cations critically tune DAC performance at 400 ppm, especially in LTA/4A where cation charge/size governs low ppm uptake and moisture sensitivity [10]. These comparisons support our mechanistic interpretation and guide process/material strategies to mitigate water competition and thermal stress in DAC cycles.

3.2. Comparison of Molecular Sieves JLPM3, 13X, and 4A (No Pre-Treatment)

Figure 6 consolidates the cycle-wise CO2 uptake, H2O uptake, and H2O/CO2 selectivity for the three sieves (see Table 2, Table 3 and Table 4 for values and uncertainties). Trends are discussed in terms of framework topology, extra-framework cations, and competitive adsorption with water, which dominate DAC performance at ~400 ppm CO2.
CO2 uptake (Figure 6a): In the first cycle, the ranking is JLPM3 > 13X > 4A. JLPM3’s advantage is consistent with its higher accessible porosity and shorter diffusion paths to CO2-selective micropores (Section 4), which sharpen the breakthrough front and improve bed utilization. 13X (FAU) provides large pore windows (~0.74 nm) and a high density of Na+ sites that polarize CO2 effectively, explaining its robust, though lower, uptake. By contrast, 4A (LTA) has ~0.40–0.42 nm apertures that restrict CO2 access and are readily occupied by H2O under ambient humidity, depressing its effective capacity [6,11,16]. These observations align with DAC-specific studies showing zeolites can capture air-level CO2 with fast kinetics under dry/controlled-humidity feeds (e.g., MOR- and FAU-type) and that framework/cation pairing strongly governs low ppm performance [6,24,25].
H2O uptake (Figure 6b): All three sieves co-adsorb substantial water, with 4A and 13X exhibiting the strongest moisture loading, consistent with their low Si/Al and hydrophilicity [6,22]. Preferential H2O occupation of cationic sites reduces the number of electrostatically favorable CO2 sites and lengthens mass-transfer paths, explaining earlier CO2 breakthrough and lower integrated uptake relative to dry conditions [6,22]. While water typically “wins” on hydrophilic zeolites, site-specific exceptions exist (e.g., K-MER), where CO2 can displace pre-adsorbed H2O at 30 °C; this underscores that cation identity and local ring geometry can flip CO2/H2O selectivity under certain conditions [23].
H2O/CO2 (Figure 6c) increases with cycle number for all sieves. Two effects compound: (i) progressive loss of high-quality CO2 sites and/or pore accessibility due to thermal/mechanical stress at 310–315 °C in humid feeds, well documented for 4A/13X-class materials [11], and (ii) H2O “hogging” of the remaining cationic sites as the CO2-affine population shrinks [6,22]. The net result is a rising water fraction in the working capacity even as both absolute uptakes decline.
The monotonic decrease in CO2 capacity across cycles, the visible fragmentation in JLPM3, and the relative robustness of 13X are consistent with the literature on the thermo-humid cyclic degradation of hydrophilic zeolites [11]. By the last cycle, JLPM3 and 13X converge to similar CO2 uptakes, implicating mechanical attrition and/or partial amorphization in JLPM3 as the cause of its steeper decline (see Section 4). 4A remains transport-limited and water-poisoned throughout, consistent with LTA access constraints and strong cation–H2O interactions [6,22,24]. The pronounced cation sensitivity of LTA-type zeolites at 400 ppm reported elsewhere further explains 4A’s low working capacity under humid air [10].
Mechanistic link to desorption profiles. The bi-modal CO2-TPD response discussed in Section 3.1, low T, readily reversible physisorption followed by a higher-T contribution from stronger binding on cationic/defect sites, rationalizes the selective loss of CO2 capacity under harsh cycling. Introducing or exposing a stronger-site fraction (e.g., via composition/defects or metal incorporation) shifts part of the desorption to higher temperature, as seen for Fe-modified FAU (Fe@13X) [21].
These results point to two levers for DAC with zeolites: (1) Water management, e.g., upstream drying or layered beds with a desiccant pre-layer [22]. (2) Framework/cation tuning, especially in LTA/FAU, controls the CO2/H2O balance at 400 ppm; cations with appropriate charge density and placement can improve low ppm CO2 uptake yet should avoid excessive water affinity [6,10,24]. These principles are consistent with the stronger initial performance of FAU-type materials in this paper and with recent demonstrations of low ppm CO2 capture on optimized zeolites [21,24].

3.3. Effect of Prolonged Thermal Conditioning (12 Days at 100 °C) on CO2 Uptake and Mechanism

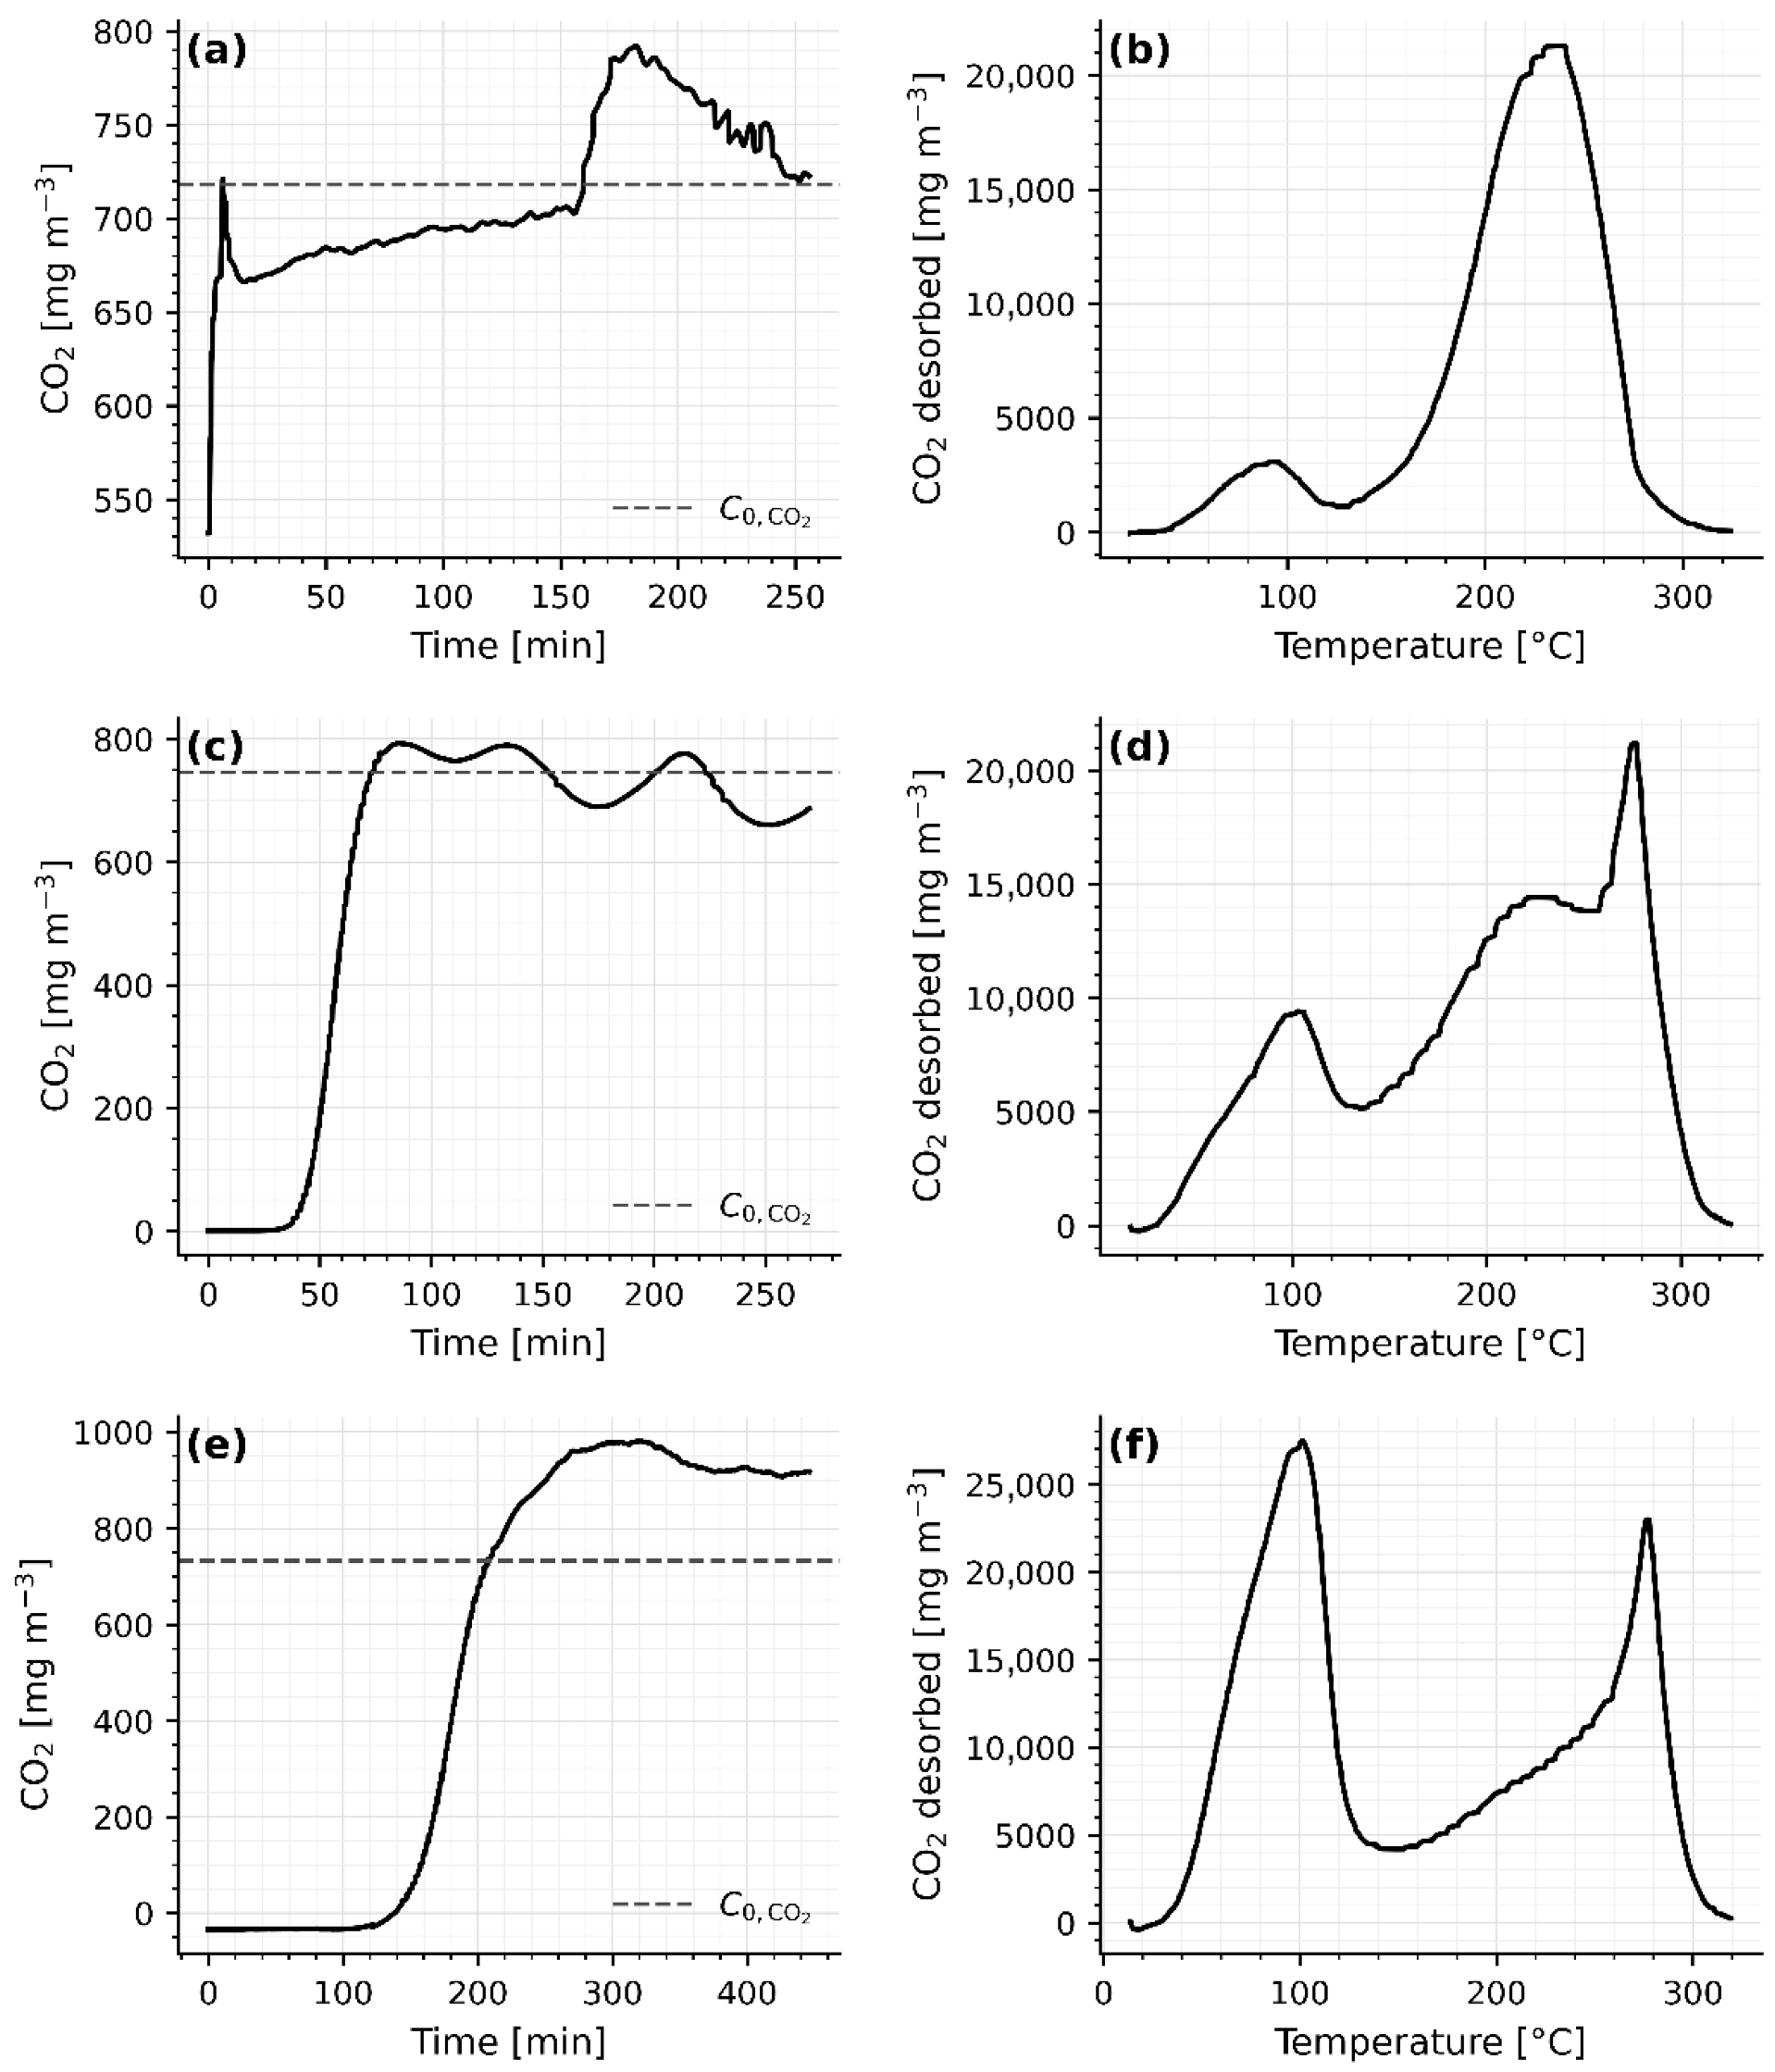
A 12-day conditioning at 100 °C was applied to 200 g beds of JLPM3, 13X, and 4A to emulate cumulative desorption exposure and obtain cycle-stabilized behavior. After this treatment, one TSA cycle was performed under humid ambient air. The results (Figure 7a–f; Table 5) show (i) similar total CO2 uptake for JLPM3 and 13X relative to their first cycles in Section 3.1, (ii) a redistribution of CO2 between weak and strong binding (a larger high T desorption contribution), and (iii) persistent H2O co-adsorption that continues to limit working capacity under humidity.
From Figure 7b,d,f, the desorption profiles of the three molecular sieves as a function of temperature exhibit a distinct pattern: an initial peak ( T 1 ), followed by a relative minimum ( T 2 ), and finally, another peak ( T 3 ). These temperature points, detailed in Table 5, correspond to different desorption mechanisms. At T 1 , the zeolites release all CO2 stored via physisorption. The intermediate point T 2 marks the onset of desorption for CO2 bound by stronger interactions, while T 3 indicates the complete release of all stored CO2.
In the pre-treated 200 g beds, the CO2-TPD traces display a low-temperature release centered near 95–105 °C (JLPM3, 103.1 °C; 13X, 103.7 °C; 4A, 92.3 °C), followed by an intermediate minimum (~137–153 °C) and a pronounced high-temperature tail/peak extending to ~235–275 °C (Table 5; Figure 7b,d,f). We attribute the first feature to readily reversible physisorption in micropores and the higher T release to stronger binding (bicarbonate/carbonate-like species on cationic/defect sites) that requires additional thermal input, consistent with established assignments for FAU/LTA zeolites and other physisorbents showing dual-mode CO2 retention [6,7,20]. The growth of the high T fraction after conditioning indicates that mild, extended heating can activate or expose stronger sites (e.g., by cation re-distribution or defect formation) [6,7], a trend aligned with observations that metal-modified FAU (e.g., Fe@13X) holds a portion of CO2 more strongly and desorbs at higher T [21].
The total CO2 and H2O uptakes in Table 5 were calculated using the post-desorption weights of the molecular sieves, representing the fully regenerated samples. Table 5 shows that the weight of the molecular sieves after desorption is significantly lower than before adsorption, confirming the presence of CO2 and H2O stored in the materials even after 12 days at 100 °C. Post-conditioning CO2 uptakes are 0.24 ± 0.01 mmol g−1 (JLPM3), 0.20 ± 0.01 mmol g−1 (13X), and 0.14 ± 0.01 mmol g−1 (4A) (Table 5), preserving the rank JLPM3 > 13X > 4A seen in the 40 g tests. This hierarchy matches expectations from framework access and micropore volume (FAU ≫ LTA) and the kinetic advantage of hierarchical/mesoporous architectures [6,24,25]. Nevertheless, H2O uptake remains substantial (2.51, 2.14, and 1.89 mmol g−1 for JLPM3, 13X, and 4A), keeping H2O/CO2 selectivity ≈ 10–14 (Table 5). This confirms that, under humid feeds, water preferentially occupies cationic sites, depressing CO2 working capacity unless moisture is managed [6,8,22]. While water usually predominates on hydrophilic, low-Si/Al zeolites, site-specific motifs (e.g., K-MER) can allow CO2 to displace pre-adsorbed H2O at 30 °C, underscoring the role of cation identity and ring geometry in tuning competition [23].
Figure 7a,c,e provide insights into the adsorption behavior after extended pre-conditioning. For JLPM3 (Figure 7a), the CO2 concentration surpasses the inlet concentration ( C 0 , CO 2 ) before stabilizing at a higher level. This phenomenon may result from the heat released during adsorption, which partially desorbs CO2, and from competition between H2O and CO2 for adsorption sites due to JLPM3’s strong electromagnetic interactions. For 13X (Figure 7c), the CO2 concentration initially exceeds C 0 , CO 2 before oscillating around this value, suggesting lower heat being emitted during adsorption and fast cooling of the sorbent, which yields a rapid equilibration. In contrast, the behavior of 4A (Figure 7e) reflects a significant loss of adsorption capacity following thermal pre-treatment, with a markedly anomalous adsorption curve compared to JLPM3, 13X, and the results from Section 3.1 for the 40 g packed bed of molecular sieve 4A.
Prolonged exposure at 100 °C under humid air likely dehydrates residual hydroxyls, drives limited cation migration, and stabilizes defect-adjacent sites, modestly increasing the population of stronger CO2-binding sites while slightly reducing purely physisorptive capacity [6,7,20]. This dual effect explains the larger high T desorption contribution in Figure 7, and the observation that JLPM3 and 13X have similar capacities relative to their unconditioned cycle 1 (Section 3.1), whereas 4A remains transport-limited by LTA apertures under humid air [6,10,22,24]. The trend is consistent with the literature where framework/cation tuning at DAC concentrations adjusts the balance between weak and strong binding, particularly for LTA/FAU families [6,10].

4. Textural Properties and Characterization

4.1. Nitrogen Adsorption

Table 6 summarizes BET areas and pore volumes derived from N2 sorption at 77 K. As measured, 4A shows negligible measured micropore area/volume, while JLPM3 and 13X exhibit large micropore areas (≈710 and ≈673 m2 g−1) and micropore volumes (≈0.267 and ≈0.253 cm3 g−1), respectively. The disparity primarily reflects aperture accessibility at 77 K: LTA (4A) eight-ring windows (~0.40–0.42 nm) impose diffusion limitations for N2 at 77 K; so, conventional N2 sorption “sees” little internal surface, whereas FAU (13X/JLPM3) 12-ring windows (~0.74 nm) are accessible, yielding the much larger measured microporous surface [6]. Consequently, measured N2 microporosity correlates with the higher DAC CO2 uptake observed for FAU vs. LTA in Section 3.1, Section 3.2 and Section 3.3. This trend is consistent with zeolite structure, property relationships discussed in [6], and with the hierarchical transport benefits reported for small-mesopore chabazite analogues [25].
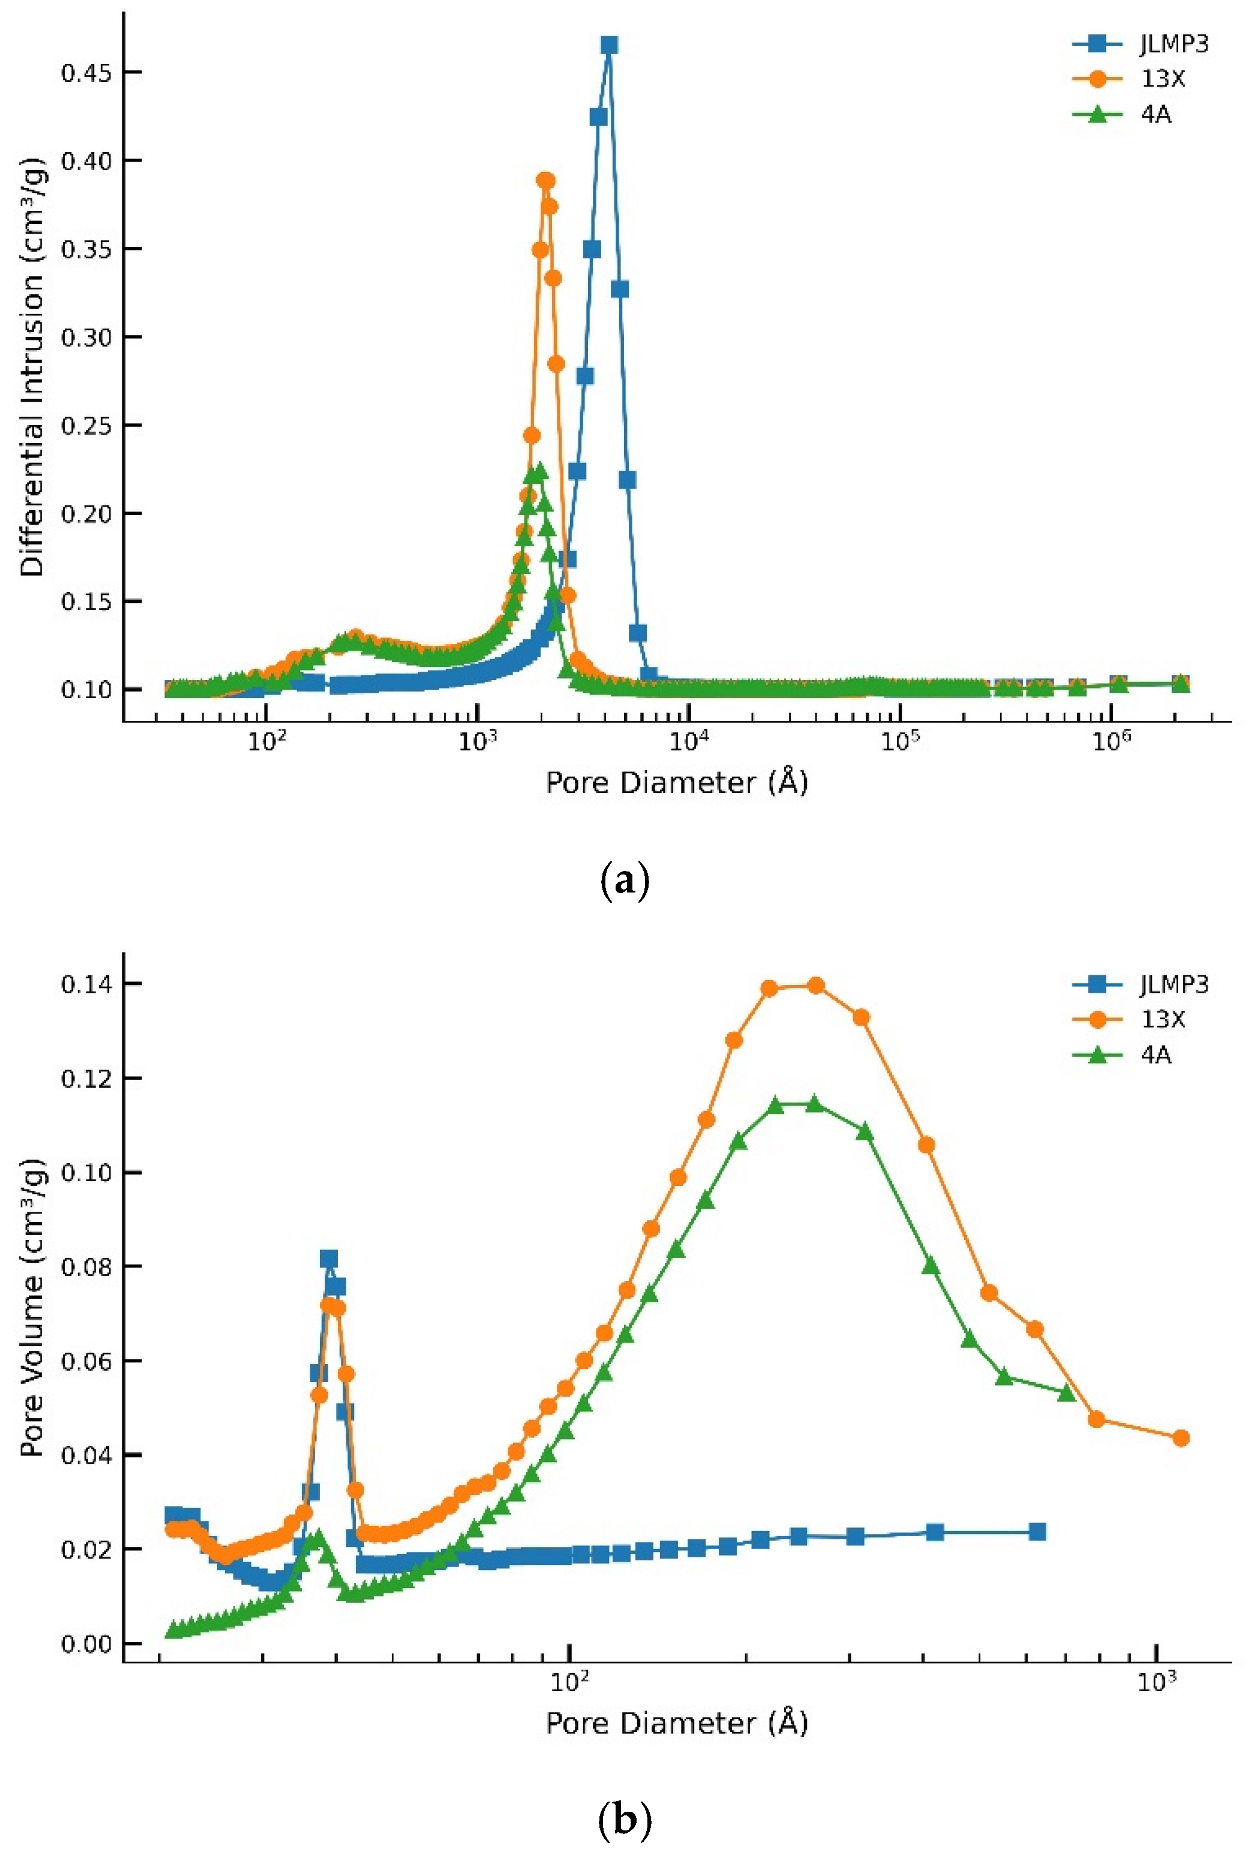
The HK micropore width for JLPM3 and 13X (~0.75 nm) indicates channels readily accessible to CO2, while the BJH mesopore peaks (JLPM3 ≈ 7.6 nm; 13X ≈ 13.3 nm) suggest shorter diffusion paths in JLPM3 than in 13X, which helps explain JLPM3’s sharper breakthrough fronts and slightly higher working capacities under humid air (Section 3.1 and Section 3.2) [6,24,25]. In contrast, 4A’s low measured microporosity at 77 K aligns with its low working capacity at ~400 ppm in humid feeds due to combined access limitations and water competition [6,10,22].
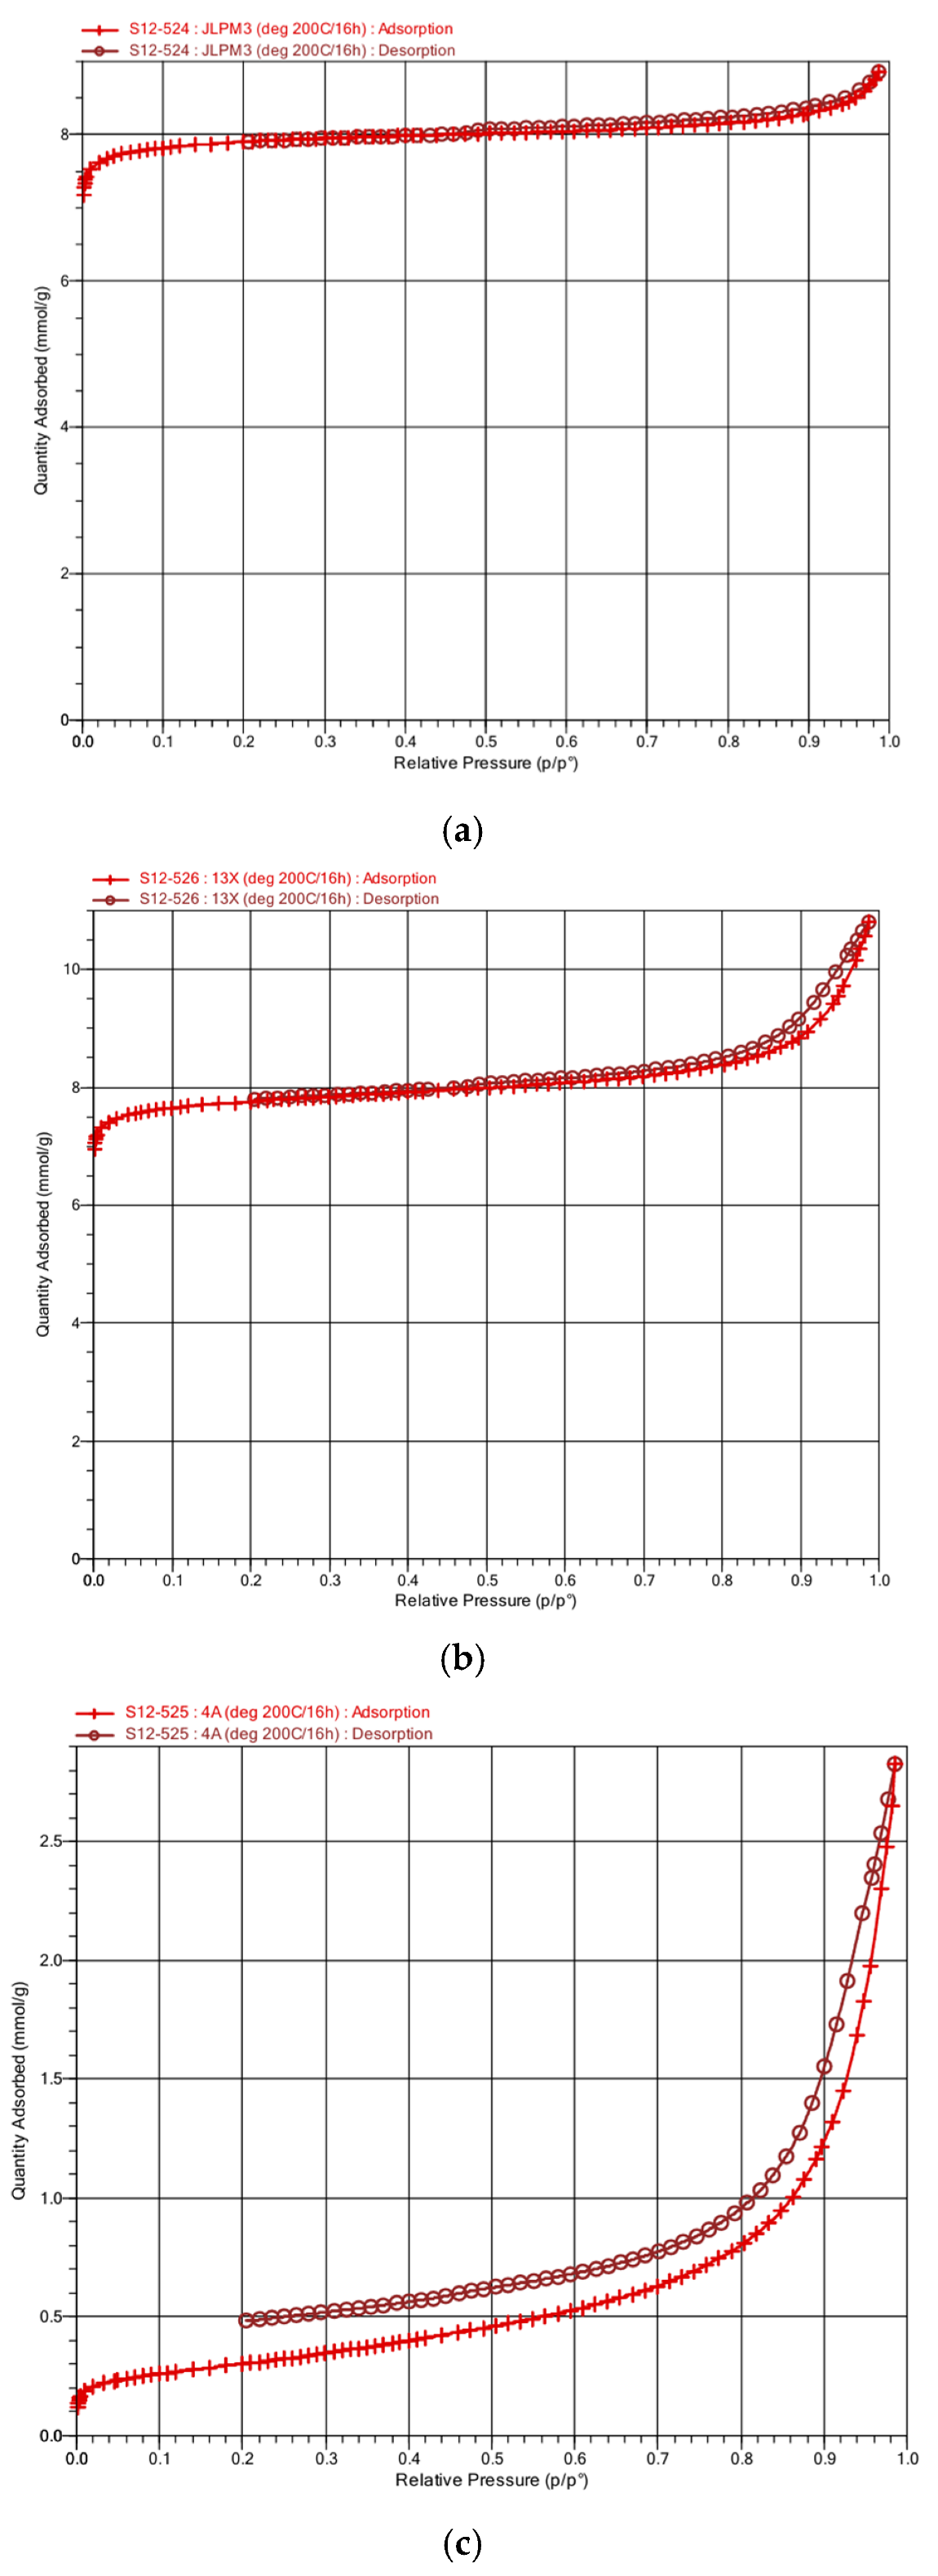
The N2 adsorption–desorption isotherms at 77.3 K (Figure 8) allow classification of the porous texture and the origin of the BET/BJH parameters following IUPAC recommendations [26]. (a) JLPM3 exhibits a very steep uptake at low relative pressure ( p / p 0 0.05 ) , which is characteristic of micropore filling and corresponds to an IUPAC Type I behavior typical of zeolitic adsorbents [26]. At intermediate pressures, the uptake increases only slightly, indicating limited additional adsorption on external surfaces. A small hysteresis loop at high p / p 0 (near p / p 0 0.8 ) suggests the presence of textural mesoporosity (e.g., intercrystalline voids or packing/binder-related mesopores), commonly described as H4-like for micro–mesoporous solids [26]. Consequently, BET surface area provides a consistent comparative metric [27], while BJH analysis should be interpreted as describing textural mesopores rather than intrinsic zeolite micropores [26,28]. (b) 13X also shows a sharp low-pressure uptake ( p / p 0 0.05 ) , again consistent with dominant microporosity (Type I) [26]. Compared with JLPM3, the higher adsorbed amount across the pressure range indicates a larger accessible pore volume and/or a greater contribution from external/textural porosity in the commercial form. The more evident high-pressure hysteresis towards p / p 0 1 indicates additional adsorption associated with textural mesopores/interparticle voids, compatible with an H4-like loop in a micro–mesoporous solid [26]. Accordingly, BET remains appropriate for surface-area comparison [27], and BJH-derived pore size distributions should be considered primarily within the mesopore range (2–50 nm) [26,28]. (c) 4A differs markedly, showing much smaller apparent uptake at very low p / p 0 and a strong increase only at high relative pressure, together with a pronounced hysteresis loop. This shape indicates that, in the measured sample form, adsorption is strongly influenced by textural porosity (interparticle/binder voids) that undergoes capillary condensation/evaporation at high p / p 0 , often associated with H3-like hysteresis for aggregates/slit-like interparticle voids [26]. In addition, for narrow-pore zeolites such as LTA/4A, N2 at 77 K can be kinetically restricted in accessing the smallest micropores, leading to an underestimation of micropore filling; IUPAC notes that alternative probe molecules/conditions (e.g., CO2 at higher temperature) may be required when diffusion limitations occur [26,29]. Therefore, BET/BJH results for 4A should be interpreted cautiously: BJH mainly reflects textural mesoporosity [26,28], while the intrinsic micropore volume may not be fully captured by N2 at 77 K under diffusion-limited conditions [26,29].

4.2. Mercury Porosimetry

Table 7 shows all three samples have similar bulk porosity (≈24–26 vol %), but distinct meso/macropore architectures. JLPM3 exhibits a narrower BJH mesopore distribution (~7–8 nm) than 13X and 4A (≈13–16 nm), which is consistent with shorter intraparticle paths to CO2-selective micropores. Numerous studies on hierarchical zeolites (e.g., SSZ-13 with 5–8 nm mesopores) report accelerated uptake kinetics relative to purely microporous analogues, because a mesopore network reduces diffusion lengths into the micropore network [25]. These textural features rationalize JLPM3’s faster kinetics and higher initial utilization vs. 13X/4A under humid ambient air, while also explaining why larger mesopores alone (13X, 4A) do not compensate for insufficient accessible micropore volume (notably in 4A) [6,25] (Figure 9).

4.3. X-Ray Diffraction (XRD)

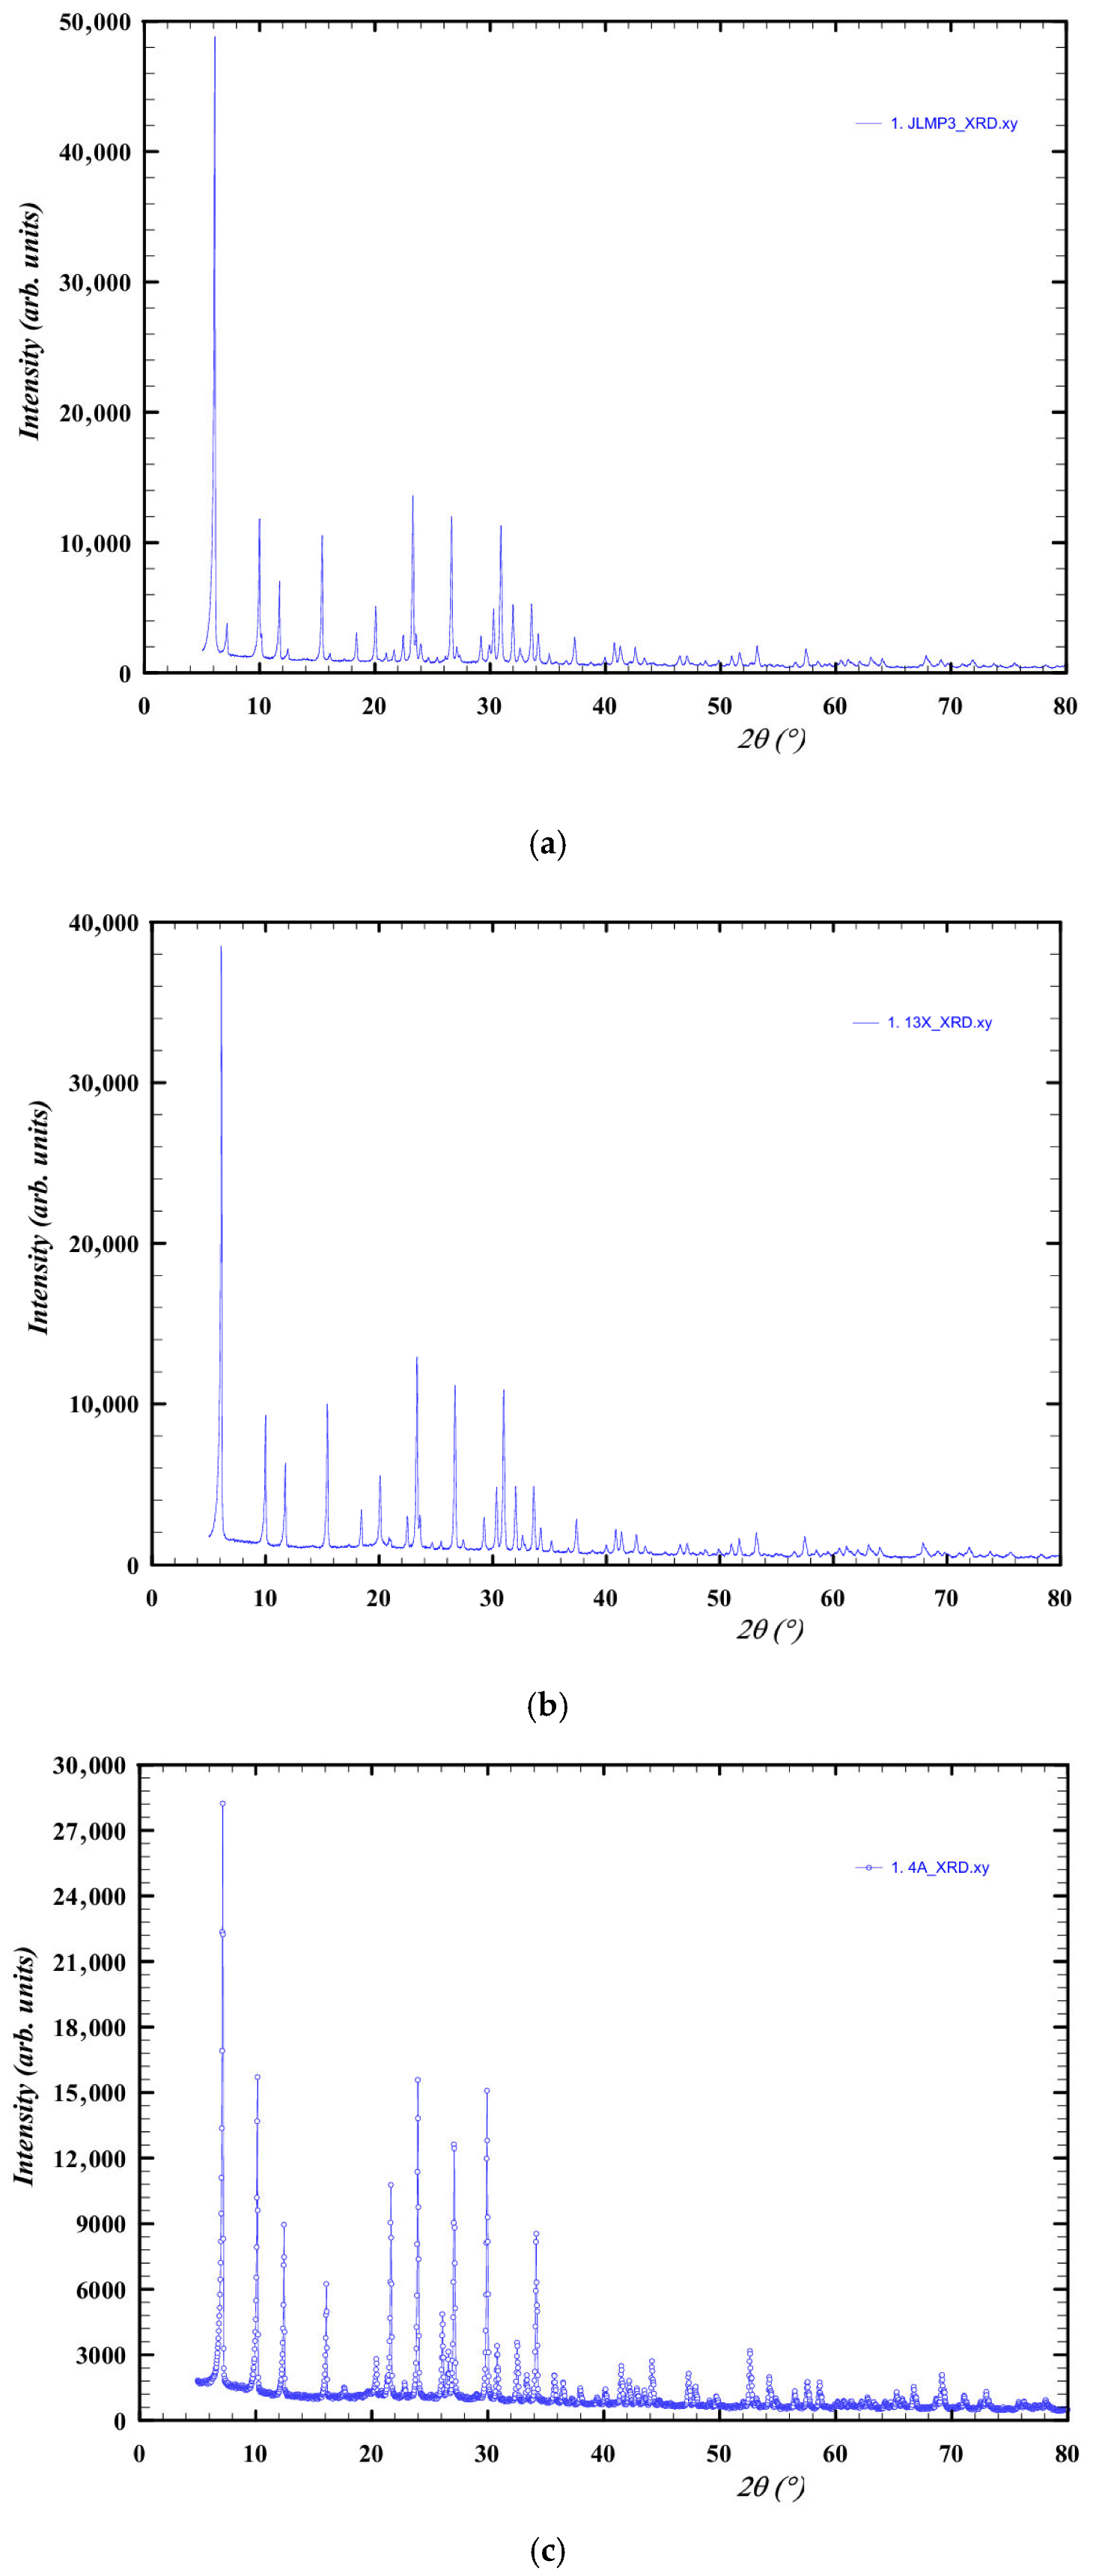
Figure 10 confirms the expected FAU topology for 13X and JLPM3 and LTA topology for 4A. Because reference intensity ratio (RIR) matches are semi-quantitative, the phase percentages should be interpreted cautiously; minor reflections may also include binder/amorphous components and carbonate/hydroxide species introduced during handling. The key point for DAC is structural: FAU frameworks (JLPM3, 13X) provide 12-ring access to large supercages, whereas LTA (4A) provides 8-ring access to α-cages, driving the accessibility differences discussed above [6]. The trace Fe indicated by XRF (Section 4.4) is consistent with small iron-bearing domains or extra-framework cations that can slightly modify local electrostatics, a factor known to influence low ppm CO2 binding on FAU-type materials [6].

4.4. X-Ray Fluorescence (XRF)

Table 8 shows all three are low-silica Na-zeolites (Si/Al ≈ 1.15–1.40), implying a high density of extra-framework cations that enhance adsorption of polarizable CO2 via electrostatic/quadrupolar interactions [6]. The Si/Al trend helps explain strong CO2 affinity in JLPM3 and 13X provided access is not rate-limiting, while 4A, despite similar Si/Al, remains transport-limited by its narrow windows under humid DAC conditions [6,10]. Minor levels of divalent/other cations (e.g., Mg2+) may adjust local fields or create defect-adjacent sites, but the dominant effects observed in this paper are framework access (FAU vs. LTA) and water competition [6,10,22] (Section 3.1, Section 3.2 and Section 3.3).

5. Conclusions

In conclusion, this comparative study has demonstrated distinct performance trade-offs among zeolite sorbents for direct air capture under humid TSA conditions. JLPM3 exhibited the highest cycle-stabilized CO2 uptake (~0.24 mmol·g−1) owing to a synergistic physisorption–chemisorption capacity and a more accessible pore architecture. However, JLPM3’s initial advantage was tempered by a pronounced capacity decline over repeated cycles due to mechanical and thermal strain, leading its uptake to converge toward that of the more robust 13X by the final cycles. Zeolite 13X achieved a slightly lower CO2 capacity (~0.20 mmol·g−1) but maintained superior structural integrity, showing minimal degradation across cycles. In contrast, 4A consistently displayed the smallest CO2 uptake (~0.14 mmol·g−1) because its narrow LTA-type pore windows and high intrinsic affinity for H2O severely limited CO2 access. All three sorbents showed substantial co-adsorption of water, which competed with CO2 for adsorption sites and exacerbated performance differences.
Mechanistically, the sorbents were found to capture CO2 via dual binding modes. We observed a readily reversible physisorbed component and a strongly bound chemisorbed component in all materials. The presence of a high-temperature desorption tail (extending up to ~250 °C in TPD profiles) confirms that a fraction of CO2 forms stronger bonds (likely carbonate or bicarbonate species on cationic or defect sites) requiring higher thermal input to desorb. Mild thermal preconditioning (100 °C for 12 days) accentuated this effect by activating additional strong binding sites (increasing the chemisorbed fraction) at the expense of some physisorptive capacity. Notably, a regeneration temperature of ~100 °C was sufficient to fully desorb the physisorbed CO2 and to purge accumulated water from the zeolites. Notably, the dominant low-temperature desorption feature (centered near ~75–105 °C) indicates that most of the reversible, physisorbed CO2 can be released at moderate temperatures and that co-adsorbed moisture can be substantially purged under these conditions. However, the persistence of a high-temperature tail/peak extending to ~235–275 °C shows that a non-negligible fraction of CO2 is more strongly bound and would require higher temperatures (or periodic high T regeneration) for complete removal. Humidity proved to be a critical factor: water vapor was shown to strongly compete for cationic adsorption sites, driving H2O/CO2 selectivity to ~10–14 in these low-Si/Al zeolites. Consequently, under humid ambient air, a significant portion of each sieve’s capacity was occupied by H2O, directly limiting the available sites for CO2 uptake unless moisture is rigorously managed.
From a practical standpoint, our findings underscore the importance of coupling water management strategies with gentle regeneration conditions to sustain DAC performance. Co-adsorbed water must be minimized, for example, by incorporating upstream dehumidification or layered bed configurations with a dedicated desiccant pre-layer—to prevent site blockage and preserve CO2 capacity. Implementing such water management measures enables effective CO2 capture at moderate desorption temperatures (~100–120 °C), instead of having to heat adsorbent beds to ~310 °C. Indeed, maintaining milder TSA conditions was sufficient in this work to restore the sieves’ working capacity on each cycle while avoiding the structural degradation observed at higher temperatures. This gentle regeneration not only reduces energy requirements but also helps preserve sorbent integrity over extended operation.
For future development, sorbent tuning and hybrid bed configurations emerge as promising pathways to enhance performance. Tailoring the zeolite framework and cation composition can modulate the balance between CO2 affinity and H2O selectivity. For instance, adjusting Si/Al ratios or exchanging extra-framework cations may reduce excessive water binding while maintaining strong CO2 adsorption at 400 ppm. Such compositional modifications, alongside creating hierarchical porosity, could produce materials that combine the high initial capacity of JLPM3 with the long-term stability of 13X. Equally important is improving the mechanical robustness of candidate sorbents: the partial attrition observed for JLPM3 indicates that strengthening particle morphology or binder formulation will be critical for durable cyclic use. Additionally, hybrid adsorption system designs (e.g., layered beds or sorbent blends) should be explored to leverage the complementary strengths of different materials—for example, using a moisture-tolerant layer to safeguard a CO2-selective layer. Overall, the insights gained in this study provide a foundation for optimizing zeolitic sorbents and process conditions. By managing water uptake and limiting thermal stress, and by tuning sorbent properties to favor dual-mode CO2 binding without incurring fragility, next-generation DAC systems can achieve more efficient and stable CO2 capture from humid air in practical applications.

Author Contributions

Conceptualization, L.S., P.E., P.M.-Z. and M.E.B.C.; Methodology, L.S. and P.E.; Software, L.S.; Validation, P.E., P.M.-Z. and M.E.B.C.; Formal analysis, L.S.; Investigation, L.S. and P.E.; Data curation, L.S.; Writing—original draft, L.S.; Supervision, P.E., P.M.-Z. and M.E.B.C. All authors have read and agreed to the published version of the manuscript.

Funding

This research received funding from Presupuestos Participativos ULL 2023.

Institutional Review Board Statement

Not applicable.

Informed Consent Statement

Not applicable.

Data Availability Statement

The data presented in this study are available on request from the corresponding author.

Conflicts of Interest

Author Luis Signorelli is the owner of the company CanaryCarbon, S.L. The remaining authors declare that the research was conducted in the absence of any commercial or financial relationships that could be construed as a potential conflict of interest.

Appendix A

Video of the Experimental Setup

A video showing the experimental setup can be accessed at the following link: https://youtu.be/qmERupRJINQ (accessed on 25 January 2026).

References

  1. Calvin, K.; Dasgupta, D.; Krinner, G.; Mukherji, A.; Thorne, P.W.; Trisos, C.; Romero, J.; Aldunce, P.; Barrett, K.; Blanco, G.; et al. IPCC, 2023: Climate Change 2023: Synthesis Report. Contribution of Working Groups I, II and III to the Sixth Assessment Report of the Intergovernmental Panel on Climate Change; Core Writing Team, Lee, H., Romero, J., Eds.; IPCC: Geneva, Switzerland, 2023. [Google Scholar]
  2. Keith, D.W.; Holmes, G.; St. Angelo, D.; Heidel, K. A Process for Capturing CO2 from the Atmosphere. Joule 2018, 2, 1573–1594. [Google Scholar] [CrossRef] [Scilit]
  3. Anderson, K.; Peters, G. The Trouble with Negative Emissions. Science 2016, 354, 182–183. [Google Scholar] [CrossRef] [Scilit]
  4. Wilcox, J.; Psarras, P.C.; Liguori, S. Assessment of Reasonable Opportunities for Direct Air Capture. Environ. Res. Lett. 2017, 12, 065001. [Google Scholar] [CrossRef] [Scilit]
  5. Sahu, T.; Ghuman, K.K.; O’Brien, P.G. A Review of Materials Used for Carbon Dioxide Capture. In Progress in Sustainable Development; Elsevier: Amsterdam, The Netherlands, 2023; pp. 205–232. [Google Scholar]
  6. Boer, D.G.; Langerak, J.; Pescarmona, P.P. Zeolites as Selective Adsorbents for CO2 Separation. ACS Appl. Energy Mater. 2023, 6, 2634–2656. [Google Scholar] [CrossRef] [Scilit]
  7. Grün, R.; Hashim, A.S.; Grau Turuelo, C.; Breitkopf, C. Insights into CO2 Diffusion on Zeolite 13X via Frequency Response Technique. Chem.–Methods 2024, 4, e202400006. [Google Scholar] [CrossRef] [Scilit]
  8. Song, M.; Rim, G.; Kong, F.; Priyadarshini, P.; Rosu, C.; Lively, R.P.; Jones, C.W. Cold-Temperature Capture of Carbon Dioxide with Water Coproduction from Air Using Commercial Zeolites. Ind. Eng. Chem. Res. 2022, 61, 13624–13634. [Google Scholar] [CrossRef] [Scilit]
  9. Fu, D.; Davis, M.E. Carbon Dioxide Capture with Zeotype Materials. Chem. Soc. Rev. 2022, 51, 9340–9370. [Google Scholar] [CrossRef] [Scilit]
  10. Tao, Z.; Tian, Y.; Ou, S.Y.; Gu, Q.; Shang, J. Direct Air Capture of CO2 by Metal Cation-exchanged LTA Zeolites: Effect of the Charge-to-size Ratio of Cations. AIChE J. 2023, 69. [Google Scholar] [CrossRef] [Scilit]
  11. Jacobs, J.H.; Deering, C.E.; Sui, R.; Lesage, K.L.; Marriott, R.A. Degradation of Desiccants in Temperature Swing Adsorption Processes: The Temperature Dependent Degradation of Zeolites 4A, 13X and Silica Gels. Chem. Eng. J. 2023, 451, 139049. [Google Scholar] [CrossRef] [Scilit]
  12. Richardson, J.F.; Harker, J.H.; Backhurst, J.R.; Coulson, J.M. Particle Technology and Separation Processes, 5th ed.; Butterworth-Heinemann: Oxford, UK, 2002. [Google Scholar]
  13. Erdim, E.; Akgiray, Ö.; Demir, İ. A Revisit of Pressure Drop-Flow Rate Correlations for Packed Beds of Spheres. Powder Technol. 2015, 283, 488–504. [Google Scholar] [CrossRef] [Scilit]
  14. Ergun, S. Fluid Flow Through Packed Columns. Chem. Eng. Prog. 1952, 48, 89–94. [Google Scholar]
  15. Ruthven, D.M. Principles of Adsorption and Adsorption Processes; John Wiley & Sons: Hoboken, NJ, USA, 1984. [Google Scholar]
  16. Yang, R.T. Gas Separation by Adsorption Processes; Butterworths: Washington, DC, USA, 1987. [Google Scholar]
  17. Meteostat. Available online: https://meteostat.net/en/ (accessed on 25 January 2026).
  18. Guide to Instruments and Methods of Observation (WMO-No. 8), 2021/2018 Edition. Available online: https://community.wmo.int/site/knowledge-hub/programmes-and-initiatives/instruments-and-methods-of-observation-programme-imop/guide-instruments-and-methods-of-observation-wmo-no-8 (accessed on 25 January 2026).
  19. Buck, A.L. New Equations for Computing Vapor Pressure and Enhancement Factor. J. Appl. Meteorol. 1981, 20, 1527–1532. [Google Scholar] [CrossRef]
  20. Kumar, A.; Madden, D.G.; Lusi, M.; Chen, K.; Daniels, E.A.; Curtin, T.; Perry, J.J.; Zaworotko, M.J. Direct Air Capture of CO2 by Physisorbent Materials. Angew. Chem. Int. Ed. 2015, 54, 14372–14377. [Google Scholar] [CrossRef] [Scilit]
  21. Xiang, X.; Guo, T.; Yin, Y.; Gao, Z.; Wang, Y.; Wang, R.; An, M.; Guo, Q.; Hu, X. High Adsorption Capacity Fe@13X Zeolite for Direct Air CO 2 Capture. Ind. Eng. Chem. Res. 2023, 62, 5420–5429. [Google Scholar] [CrossRef] [Scilit]
  22. Fu, D.; Davis, M.E. Toward the Feasible Direct Air Capture of Carbon Dioxide with Molecular Sieves by Water Management. Cell Rep. Phys. Sci. 2023, 4, 101389. [Google Scholar] [CrossRef] [Scilit]
  23. Lee, H.; Xie, D.; Zones, S.I.; Katz, A. CO2 Desorbs Water from K-MER Zeolite under Equilibrium Control. J. Am. Chem. Soc. 2024, 146, 68–72. [Google Scholar] [CrossRef] [Scilit]
  24. Fu, D.; Park, Y.; Davis, M.E. Confinement Effects Facilitate Low-Concentration Carbon Dioxide Capture with Zeolites. Proc. Natl. Acad. Sci. USA 2022, 119, e2211544119. [Google Scholar] [CrossRef] [Scilit]
  25. Hillen, L.; Degirmenci, V. Hierarchical Mesoporous SSZ-13 Chabazite Zeolites for Carbon Dioxide Capture. Catalysts 2021, 11, 1355. [Google Scholar] [CrossRef] [Scilit]
  26. Thommes, M.; Kaneko, K.; Neimark, A.V.; Olivier, J.P.; Rodriguez-Reinoso, F.; Rouquerol, J.; Sing, K.S.W. Physisorption of Gases, with Special Reference to the Evaluation of Surface Area and Pore Size Distribution (IUPAC Technical Report). Pure Appl. Chem. 2015, 87, 1051–1069. [Google Scholar] [CrossRef] [Scilit]
  27. Brunauer, S.; Emmett, P.H.; Teller, E. Adsorption of Gases in Multimolecular Layers. J. Am. Chem. Soc. 1938, 60, 309–319. [Google Scholar] [CrossRef] [Scilit]
  28. Barrett, E.P.; Joyner, L.G.; Halenda, P.P. The Determination of Pore Volume and Area Distributions in Porous Substances. I. Computations from Nitrogen Isotherms. J. Am. Chem. Soc. 1951, 73, 373–380. [Google Scholar] [CrossRef] [Scilit]
  29. Rouquerol, F.; Rouquerol, J.; Sing, K.S.W. Adsorption by Powders and Porous Solids: Principles, Methodology, and Applications; Academic Press: Cambridge, MA, USA, 1999. [Google Scholar]
Figure 1. (a) Schematic diagram of the experimental setup for CO2 analysis using a fixed bed reactor. (b) Experimental setup for adsorption. (c) Experimental setup for temperature swing desorption.
Sustainability 18 03601 g001
Figure 2. Experimental breakthrough curve for CO2 adsorption.
Sustainability 18 03601 g002
Figure 3. (a) Total CO2 adsorbed for each cycle as a function of time for 40 g packed bed of molecular sieve JLPM3. (b) CO2 desorption on each cycle as a function of temperature for 40 g packed bed of molecular sieve JLPM3. (c) Total CO2 desorbed for each cycle as a function of time for 40 g packed bed of molecular sieve JLPM3.
Sustainability 18 03601 g003
Figure 4. (a) Total CO2 adsorbed for each cycle as a function of time for 40 g packed bed of molecular sieve 13X. (b) CO2 desorption on each cycle as a function of temperature for 40 g packed bed of molecular sieve 13X. (c) Total CO2 desorbed for each cycle as a function of time for 40 g packed bed of molecular sieve 13X.
Sustainability 18 03601 g004
Figure 5. (a) Total CO2 adsorbed for each cycle as a function of time for 40 g packed bed of molecular sieve 4A. (b) CO2 desorption on each cycle as a function of temperature for 40 g packed bed of molecular sieve 4A. (c) Total CO2 desorbed for each cycle as a function of time for 40 g packed bed of molecular sieve 4A.
Sustainability 18 03601 g005
Figure 6. (a) CO2 uptake comparison for 40 g packed beds of molecular sieves JLPM3, 13X, and 4A for each cycle. (b) H2O uptake comparison for 40 g packed beds of molecular sieves JLPM3, 13X, and 4A for each cycle. (c) H2O/CO2 selectivity comparison for 40 g packed beds of molecular sieves JLPM3, 13X, and 4A for each cycle.
Sustainability 18 03601 g006
Figure 7. (a) Breakthrough curve for CO2 adsorption on 200 g of molecular sieve 4A with thermal pre-treatment. (b) CO2 desorption as a function of temperature of 200 g molecular sieve 4A with thermal pre-treatment. (c) Breakthrough curve for CO2 adsorption on 200 g of molecular sieve 13X with thermal pre-treatment. (d) CO2 desorption as a function of temperature on 200 g of molecular sieve 13X with thermal pre-treatment. (e) Breakthrough curve for CO2 adsorption on 200 g of molecular sieve JLPM3 with thermal pre-treatment. (f) CO2 desorption as a function of temperature on 200 g of molecular sieve JLPM3 with thermal pre-treatment.
Sustainability 18 03601 g007
Figure 8. N2 adsorption–desorption isotherms (77.3 K) of the studied molecular sieves: (a) JLPM3, (b) 13X, and (c) 4A, measured after degassing at 200 °C for 16 h.
Sustainability 18 03601 g008
Figure 9. (a) Mercury porosimetry and (b) N2 adsorption pore size distribution for molecular sieves JLPM3, 13X, and 4A.
Sustainability 18 03601 g009
Figure 10. (a) XRD spectra of molecular sieve JLPM3. (b) XRD spectra of molecular sieve 13X. (c) XRD spectra of molecular sieve 4A.
Sustainability 18 03601 g010
Table 1. Fixed-bed reactor and packed-bed geometry/packing parameters.
TestSorbent D i (mm)A (cm2)L (cm) ρ b u l k (g·cm−3) ε u s (cm·s−1) R e p * P (Pa) **
40 gJLPM39063.60.800.7860.5010.770.79–1.230.056–0.135
40 g13X9063.60.800.7860.4740.770.79–1.230.073–0.177
40 g4A9063.60.700.8980.4920.770.79–1.230.053–0.129
200 gJLMP39063.64.000.7860.5010.770.79–1.230.279–0.674
200 g13X9063.64.000.7860.4740.770.79–1.230.365–0.883
200 g4A9063.63.500.8980.4920.770.79–1.230.267–0.645
* R e p computed using air properties at ~25 °C and pellet diameter range d_p = 1.6–2.5 mm. ** ΔP estimated by the Ergun equation (not measured), using the ε values in this table.
Table 2. Adsorption and desorption results for CO2 and H2O over 4 cycles for 40 g packed bed of molecular sieves JLPM3.
Cycles0123
C 0 , CO 2 [mg/m3]840.85 ± 19.60750.81 ± 19.60744.99 ± 19.60736.61 ± 19.60
C 0 , H 2 O [mg/m3]11,662.405164.108014.298364.19
Weight before adsorption [g]40.0139.9139.1338.73
Weight after adsorption [g]44.5343.2443.3041.60
Q ads , CO 2 [mg]214.91 ± 12.47175.01 ± 14.08117.48 ± 9.7977.07 ± 7.08
Q des , CO 2 [mg]312.27 ± 46.54222.13 ± 43.15145.47 ± 38.7595.48 ± 37.80
Q des , H 2 O [mg]4308 ± 46.543888 ± 43.154425 ± 38.752775 ± 37.80
CO2 uptake [mmol/g]0.34 ± 0.050.25 ± 0.050.17 ± 0.040.11 ± 0.04
H2O uptake [mmol/g]1.95 ± 0.021.79 ± 0.022.06 ± 0.021.29 ± 0.02
H2O/CO2 Selectivity5.74 ± 0.857.16 ± 1.4312.12 ± 2.8511.73 ± 4.27
Table 3. Adsorption and desorption results for CO2 and H2O over 4 cycles for 40 g packed bed of molecular sieves 13X.
Cycles0123
C 0 , CO 2 [mg/m3]784.68 ± 19.60770.93 ± 19.60770.29 ± 19.60832.49 ± 19.60
C 0 , H 2 O [mg/m3]12,878.636540.089520.2714,366.6
Weight before adsorption [g]40.0137.4937.0736.88
Weight after adsorption [g]43.2539.9139.3839.36
Q ads , CO 2 [mg]28.54 ± 3.62120.10 ± 9.8282.35 ± 7.3562.64 ± 5.40
Q des , CO 2 [mg]173.07 ± 47.28144.87 ± 36.18115.68 ± 34.0675.45 ± 35.51
Q des , H 2 O [mg]5587 ± 47.282695 ± 36.182384 ± 34.062405 ± 35.51
CO2 uptake [mmol/g]0.20 ± 0.060.17 ± 0.040.14 ± 0.040.09 ± 0.04
H2O uptake [mmol/g]2.68 ± 0.021.31 ± 0.021.17 ± 0.021.17 ± 0.02
H2O/CO2 Selectivity13.40 ± 4.027.71 ± 1.828.36 ± 2.3913.00 ± 5.78
Table 4. Adsorption and desorption results for CO2 and H2O over 4 cycles for 40 g packed bed of molecular sieves 4A.
Cycles0123
C 0 , CO 2 [mg/m3]735.32 ± 19.60728.58 ± 19.60771.57 ± 19.60723.62 ± 19.60
C 0 , H 2 O [mg/m3]8991.645376.0711,925.412,158.3
Weight before adsorption [g]40.0137.8537.5137.52
Weight after adsorption [g]42.4841.1041.5340.60
Q ads , CO 2 [mg]30.46 ± 6.03104.06 ± 18.1762.24 ± 10.3834.42 ± 11.72
Q des , CO 2 [mg]240.57 ± 44.13146.02 ± 35.8685.02 ± 28.8045.46 ± 24.47
Q des , H 2 O [mg]4389 ± 44.133444 ± 35.863925 ± 28.803035 ± 24.47
CO2 uptake [mmol/g]0.28 ± 0.050.17 ± 0.040.10 ± 0.030.05 ± 0.03
H2O uptake [mmol/g]2.07 ± 0.021.65 ± 0.021.88 ± 0.011.46 ± 0.01
H2O/CO2 Selectivity7.39 ± 1.329.71 ± 2.2918.80 ± 5.6429.20 ± 17.52
Table 5. Adsorption and desorption results for CO2 and H2O over one TSA cycle with 12 days thermal pre-treatment at 100 °C for molecular sieves JPM3, 13X, and 4A.
Molecular SieveJLPM313X4A
Bed length ( l b ) [cm]4.04.03.5
C 0 , CO 2 [mg/m3]718.27 ± 19.60745.33 ± 19.60732.91 ± 19.60
C 0 , H 2 O [mg/m3]8726.443382.619072.79
Weight Before Adsorption [g]200.01200.01200.01
Weight After Adsorption [g]214.22207.39208.83
Weight After Desorption [g]187.14184.6188.44
Q ads , CO 2 [mg]408.40 ± 24.95128.95 ± 8.8922.57 ± 19.62
Q des , CO 2 [mg]1009.93 ± 45.35857.48 ± 43.45588.55 ± 37.76
Q des , H 2 O [mg]26,070 ± 43.3521,933 ± 43.4519,802 ± 37.76
CO2 uptake [mmol/g]0.24 ± 0.010.20 ± 0.010.14 ± 0.01
H2O uptake [mmol/g]2.51 ± 0.002.14 ± 0.001.89 ± 0.00
H2O/CO2 Selectivity10.46 ± 0.4410.70 ± 0.5313.50 ± 0.96
T 1 [°C]103.1103.792.3
T 2 [°C]152.6136.9126.6
T 3 [°C]275.3273.2236.6
Table 6. BET/BJH data for molecular sieves JLPM3, 13X, and 4A.
Molecular SieveBET Surface Area (m2 g−1)Micropore Area (m2 g−1)External Surface Area (m2 g−1)Total Pore Volume (cm3 g−1)Micropore Volume (cm3 g−1)Median Pore Width (nm)BJH Average Mesopore Width (nm)
JLPM3727.901710.28517.6160.301 (at p/p0 = 0.977)0.2670.7587.569 (des.)
13X710.088672.61837.4700.359 (at p/p0 = 0.975)0.2530.76513.353 (des.)
4A24.0872.80921.2780.086 (at p/p0 = 0.976)0.00141.56015.699 (des.)
Table 7. Mercury intrusion porosimetry data for molecular sieves JLPM3, 13X, and 4A.
Molecular SieveTotal Intrusion Volume at 59,862.34 Psia (mL g−1)Total Pore Area at 59,862.34 Psia (m2 g−1)Bulk Density at 1.02 Psia (g mL−1)Apparent (Skeletal) Density at 59,862.34 Psia (g mL−1)Porosity (%)
JLPM30.2254.8751.1621.57526.190
13X0.22916.3051.1141.49525.491
4A0.17614.7031.3491.76823.721
Table 8. Elemental composition of molecular sieve JLPM3, 13X, and 4A.
Composition (wt.%)JLPM313X4A
Na2O17.6916.6315.26
MgO0.142.682.43
SiO245.9948.3445.71
Al2O333.8229.3332.62
K2O0.210.240.35
Fe2O30.601.131.44
CaO0.970.831.15
Other *1.580.821.04
Si/Al **1.151.401.19
* “Other” includes P2O5, SO3, Cl, TiO2, MnO, SrO, ZrO2 and (where present) V2O5, ZnO, Rb2O; each individual component is ≤0.37 wt.%. ** Si/Al = Silicon/Aluminum.
Disclaimer/Publisher’s Note: The statements, opinions and data contained in all publications are solely those of the individual author(s) and contributor(s) and not of MDPI and/or the editor(s). MDPI and/or the editor(s) disclaim responsibility for any injury to people or property resulting from any ideas, methods, instructions or products referred to in the content.