Article

An Early Warning Method Based on Transformer–Attention–LSTM Hybrid Framework for Landslides in the Red Bed Sedimentary Layers in Western Sichuan, China: Implications for Sustainable Hazard Mitigation

1
Chengdu Center, China Geological Survey (Geosciences Innovation Center of Southwest China), Chengdu 610218, China
2
School of Mathematical Sciences, Chengdu University of Technology, Chengdu 610059, China
3
Geomathematics Key Laboratory of Sichuan Province, Chengdu University of Technology, Chengdu 610059, China
4
College of Management Science, Chengdu University of Technology, Chengdu 610059, China
*
Authors to whom correspondence should be addressed.
Sustainability 2026, 18(7), 3241; https://doi.org/10.3390/su18073241
Submission received: 24 December 2025 / Revised: 22 March 2026 / Accepted: 23 March 2026 / Published: 26 March 2026
(This article belongs to the Special Issue Disaster Prevention, Resilience and Sustainable Management)

Abstract

Global climate change and increasingly complex geological conditions have led to more frequent landslides in the red-bed sedimentary layers of western Sichuan, China, posing severe threats to human safety and hindering progress toward regional Sustainable Development Goals (SDGs), particularly those related to disaster risk reduction and ecological protection. To address this challenge and advance sustainable disaster management, this study proposes a lightweight hybrid model, termed Transformer–Attention–LSTM, which integrates the global attention mechanism of Transformers with the local time-series modeling capabilities of Long Short-Term Memory networks. Focusing on the Kuyaogou landslide, the model achieves an optimal balance between parameter scale, sequence length, and prediction accuracy. The mean Coefficient of Determination (R2) values for the test samples in the X, Y, and Z directions reached 0.948, representing enhancements of 9.9%, 4.2%, and 2.3%, respectively, compared to the suboptimal Attention–LSTM model. Concurrently, the Root Mean Square Error (RMSE) and Mean Absolute Error (MAE) were reduced to 9.23 mm and 7.17 mm, respectively. Based on these displacement predictions, the landslide evolution stage was determined by calculating the tangent angle, indicating that the Kuyaogou landslide will remain in a stable creep phase over the ensuing ten-day period with low overall risk of rapid movement, though localized instability requires continued monitoring. This research provides a ‘small, fast, and accurate’ paradigm for red-bed landslide displacement prediction, offering scientific support for disaster prevention and emergency decision-making. The framework demonstrates potential for broader application in monitoring other geological hazards, thereby contributing to the implementation of sustainable development strategies in geohazard-prone regions.

1. Introduction

Landslides represent a pervasive and profoundly destructive geological hazard, posing a considerable threat to human life, property and infrastructure in mountainous regions worldwide. In southwestern China, red-bed soft rock formations are particularly susceptible to softening and disintegration due to a combination of factors including rainfall, groundwater and weathering. This phenomenon can be attributed to the unique depositional environment and lithological composition of these formations [1,2,3]. This phenomenon is a primary cause of frequent landslides in the region. These landslides typically exhibit complex disaster mechanisms characterized by the interaction between ‘susceptible strata’ and ‘triggering factors’ [4,5]. In recent years, advancements in remote sensing technologies (e.g., Interferometric Synthetic Aperture Radar (InSAR)) and ground-based monitoring networks (Global Navigation Satellite System (GNSS) and crack meters) have yielded a substantial amount of high-precision data for the early detection and monitoring of red-bed landslides [6,7]. Nevertheless, the extraction of meaningful precursory features from large, multi-source and noisy monitoring datasets, and the construction of highly accurate displacement prediction models, remain critical challenges in the field of landslide risk mitigation.
As artificial intelligence has developed rapidly, landslide displacement prediction has shifted gradually from traditional physics-based models to data-driven machine learning and deep learning approaches. Early methods, including support vector machines (SVMs) and shallow neural networks, demonstrated potential for capturing non-linear mappings [8]. In light of the time-series characterization of landslide displacement, long short-term memory networks (LSTMs) and their variants (e.g., Bidirectional Long Short-Term Memory networks (BiLSTMs)) have emerged as the prevailing standard due to their capacity to address the vanishing gradient issue and enhance prediction accuracy [9,10,11]. In order to enhance predictive performance, signal decomposition techniques such as Complete Ensemble Empirical Mode Decomposition with Adaptive Noise (CEEMDAN) and Variational Mode Decomposition (VMD) have been incorporated into ‘decompose-reconstruct-predict’ frameworks [12,13]. In recent years, from 2023 to 2025, there has been an increased interest in advanced deep learning architectures that incorporate attention mechanisms and Transformer models. In comparison with conventional recurrent neural networks (RNNs), Transformers utilise self-attention to identify long- range dependencies within Sequences. Concurrently, graph attention networks (GATs) have been shown to enhance the extraction of spatial-topological features of landslides [14,15,16,17].
Notwithstanding these advances, two significant challenges persist in practical applications. Firstly, the physical completeness and interpretability of the input features are frequently inadequate. The majority of studies concentrate on black-box mappings between rainfall and displacement, while neglecting to consider the internal ‘process responses’ of the landslide, such as crack development and stress adjustment. Crack propagation has been shown to precede overall slope movement in such cases, thus serving as a direct indicator of internal damage accumulation [18,19]. Secondly, multi-source monitoring data frequently exhibit strong collinearity and feature redundancy. The integration of rainfall, crack measurements, multi-point displacement and hydrogeological parameters has been demonstrated to generate temporally and spatially correlated, high-dimensional features. The direct input of such data can result in overfitting and unstable model training. Despite the investigation of correlation-based feature selection, the utilization of regularization-based methods such as Ridge, Lasso and ElasticNet remains limited in the landslide domain [20,21,22]. These methods have been shown to effectively handle multicollinearity and automatically select physically meaningful subsets of features, which is essential for constructing lightweight, robust predictive models [23,24].
In the context of the dual challenges posed by global climate change and increasingly complex geological conditions, landslides in the red-bed sedimentary rock layers of Sichuan have become a frequent occurrence. This has necessitated the development of precise and efficient monitoring and early warning models. The present study focuses on the Kuyaogou landslide in Sichuan, proposing a lightweight hybrid architecture combining Transformer and LSTM (Long Short-Term Memory) mechanisms. This model integrates the global attention mechanism of the Transformer with the local time-series modelling capabilities of the LSTM. The key innovations of this model are as follows:
(1) This study proposes the first lightweight hybrid architecture that combines Transformer and LSTM for landslide displacement prediction. This approach enables collaborative modelling of global trends and local details through parallel information processing and cascaded attention mechanisms.
(2) A novel ‘rainfall-crack-historical displacement’ lag feature matrix is developed to explicitly model the multi-physical process coupling mechanism involving triggering factors, precursor information and evolutionary inertia.
(3) A three-tiered attention evolution path of ‘local time series—lag factor—key period’ is constructed to visually reveal the model’s learning mechanism, with a specific focus on critical stages of cumulative deformation and impending slip.
(4) The proposed multi-source time-series feature construction method and hybrid modelling framework exhibit strong transferability to other geological disaster monitoring scenarios.
(5) By integrating high-precision displacement prediction with the physical criterion of tangent angle, quantitative identification of landslide evolution stages and dynamic risk assessment are achieved, marking a technological leap from ‘data-driven prediction’ to ‘physical mechanism interpretation’.
The model achieves an optimal balance between parameter scale, sequence length, and prediction accuracy, offering a novel “small, fast, accurate” paradigm for predicting red-bed landslide displacement. It not only provides scientific support for disaster prevention, mitigation and emergency decision-making but also demonstrates broad applicability in the time series monitoring of geological disasters.

2. Materials and Methods

2.1. Study Area

2.1.1. Study Area Overview

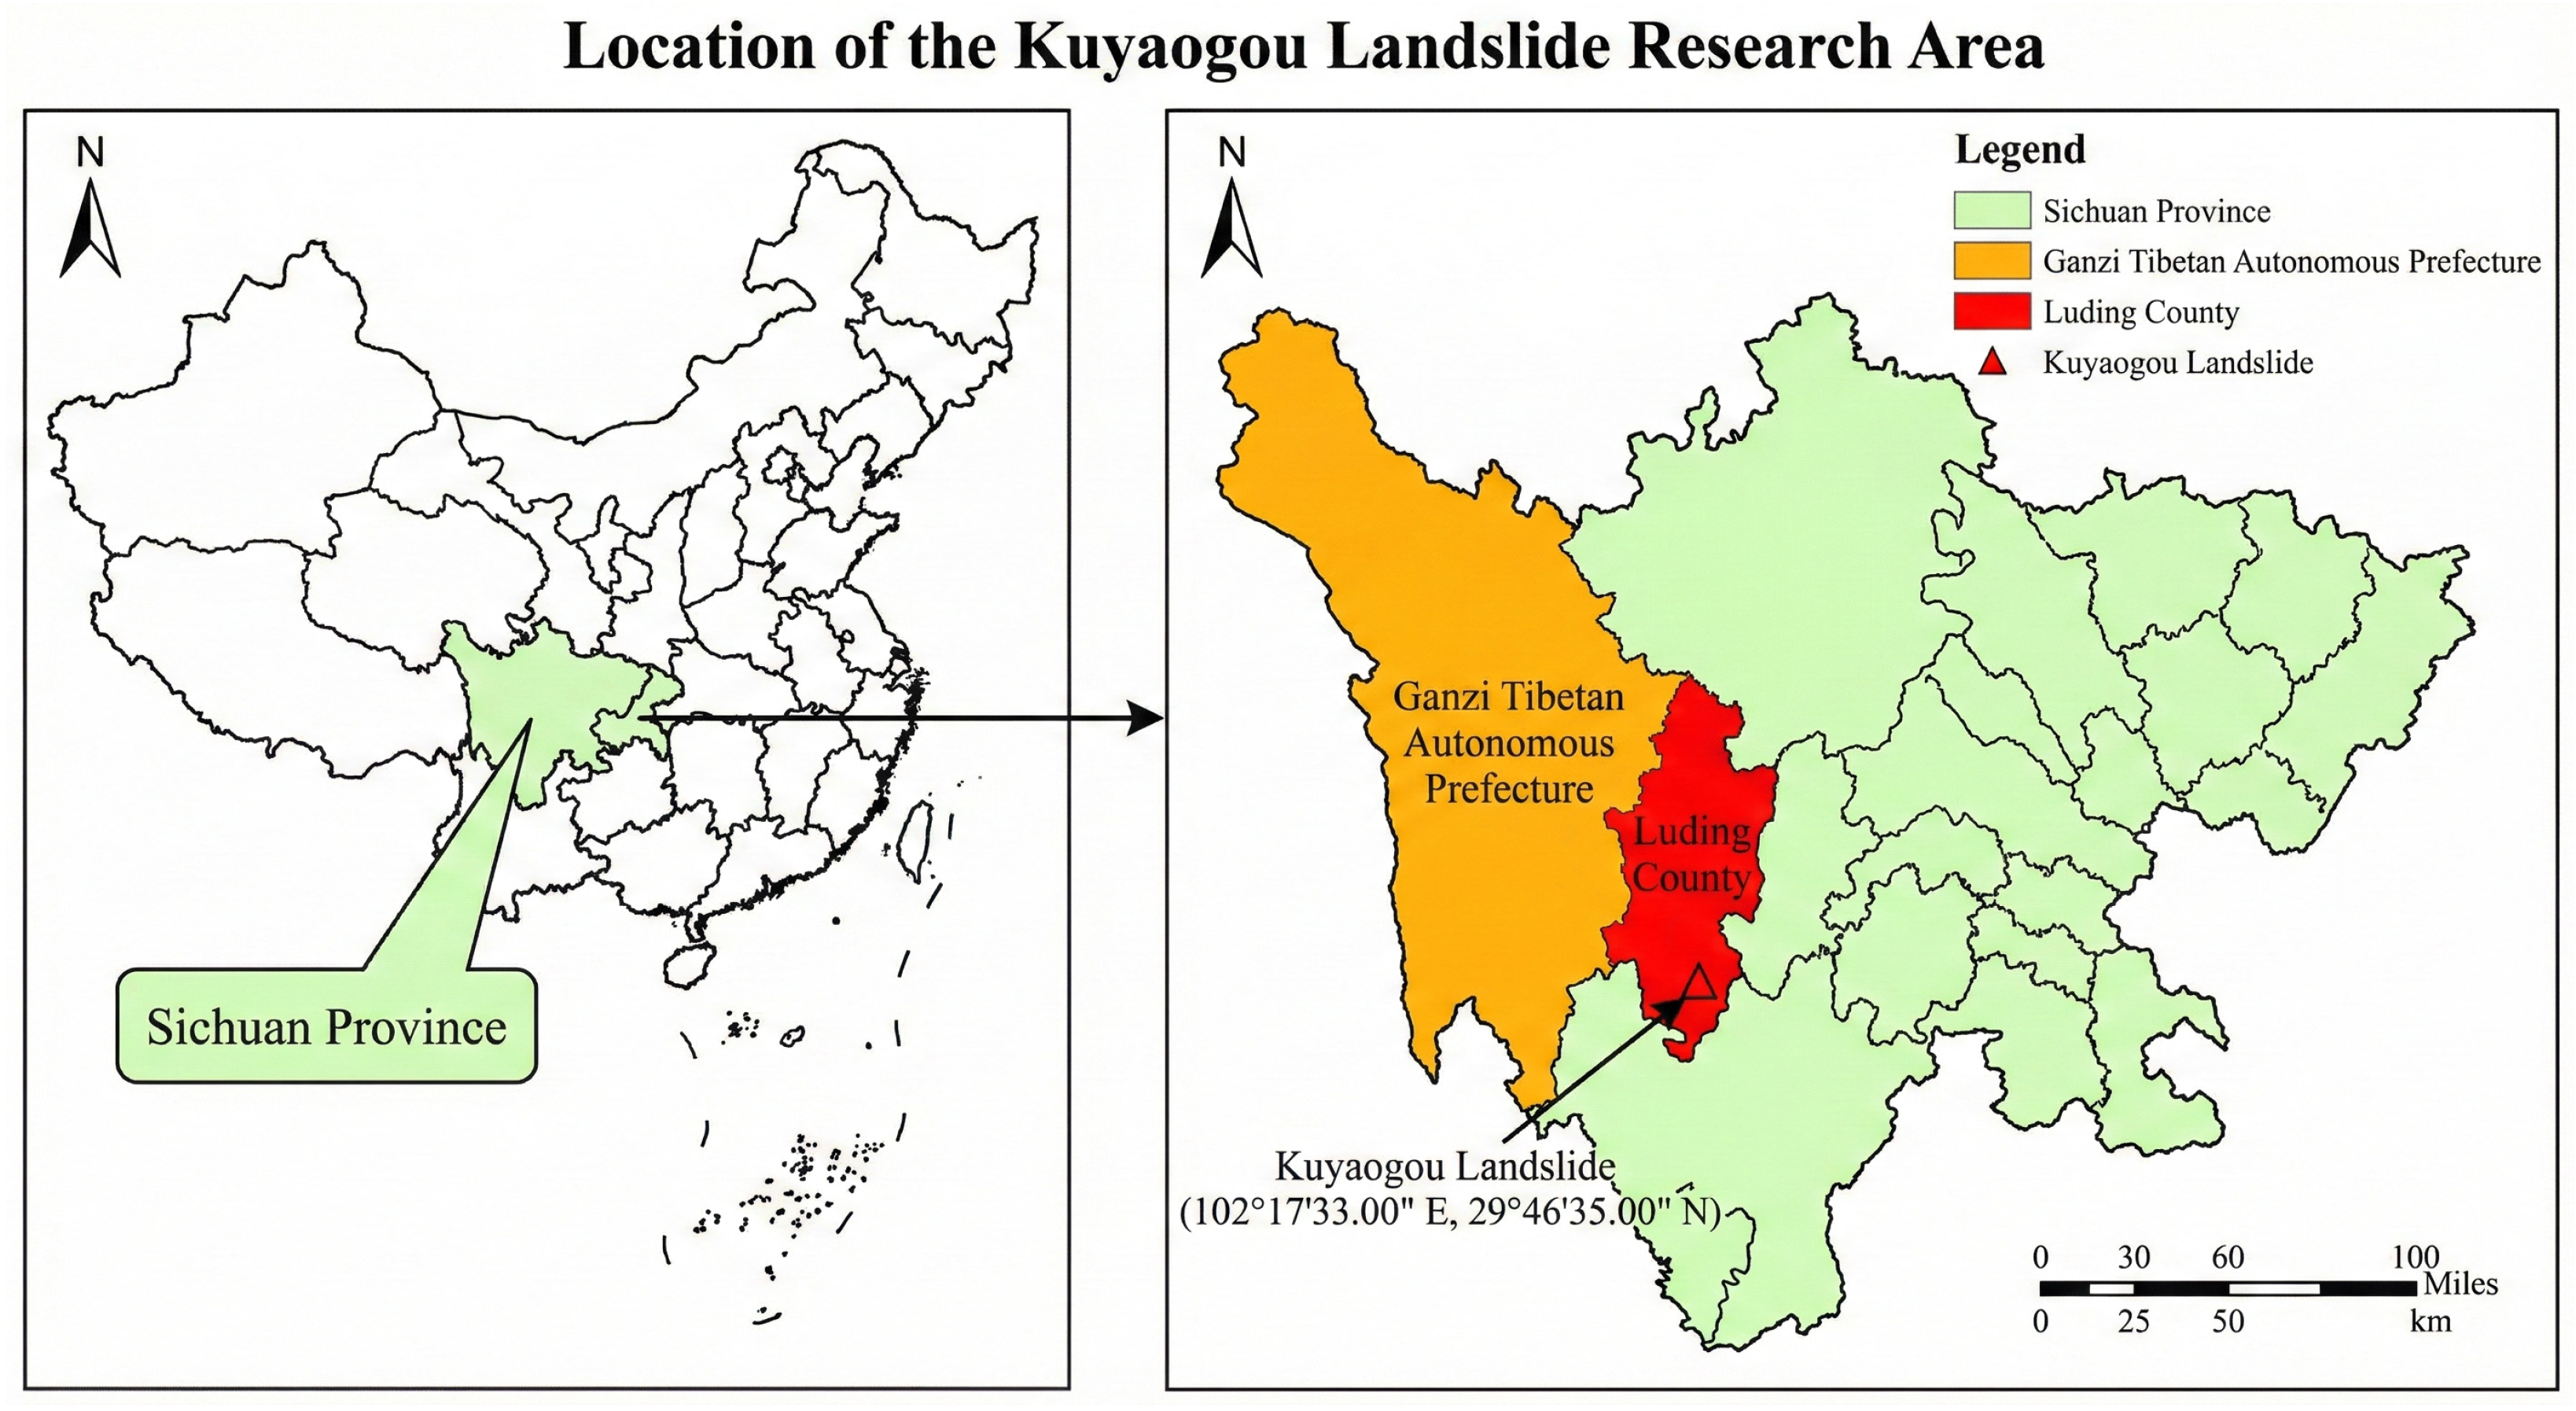
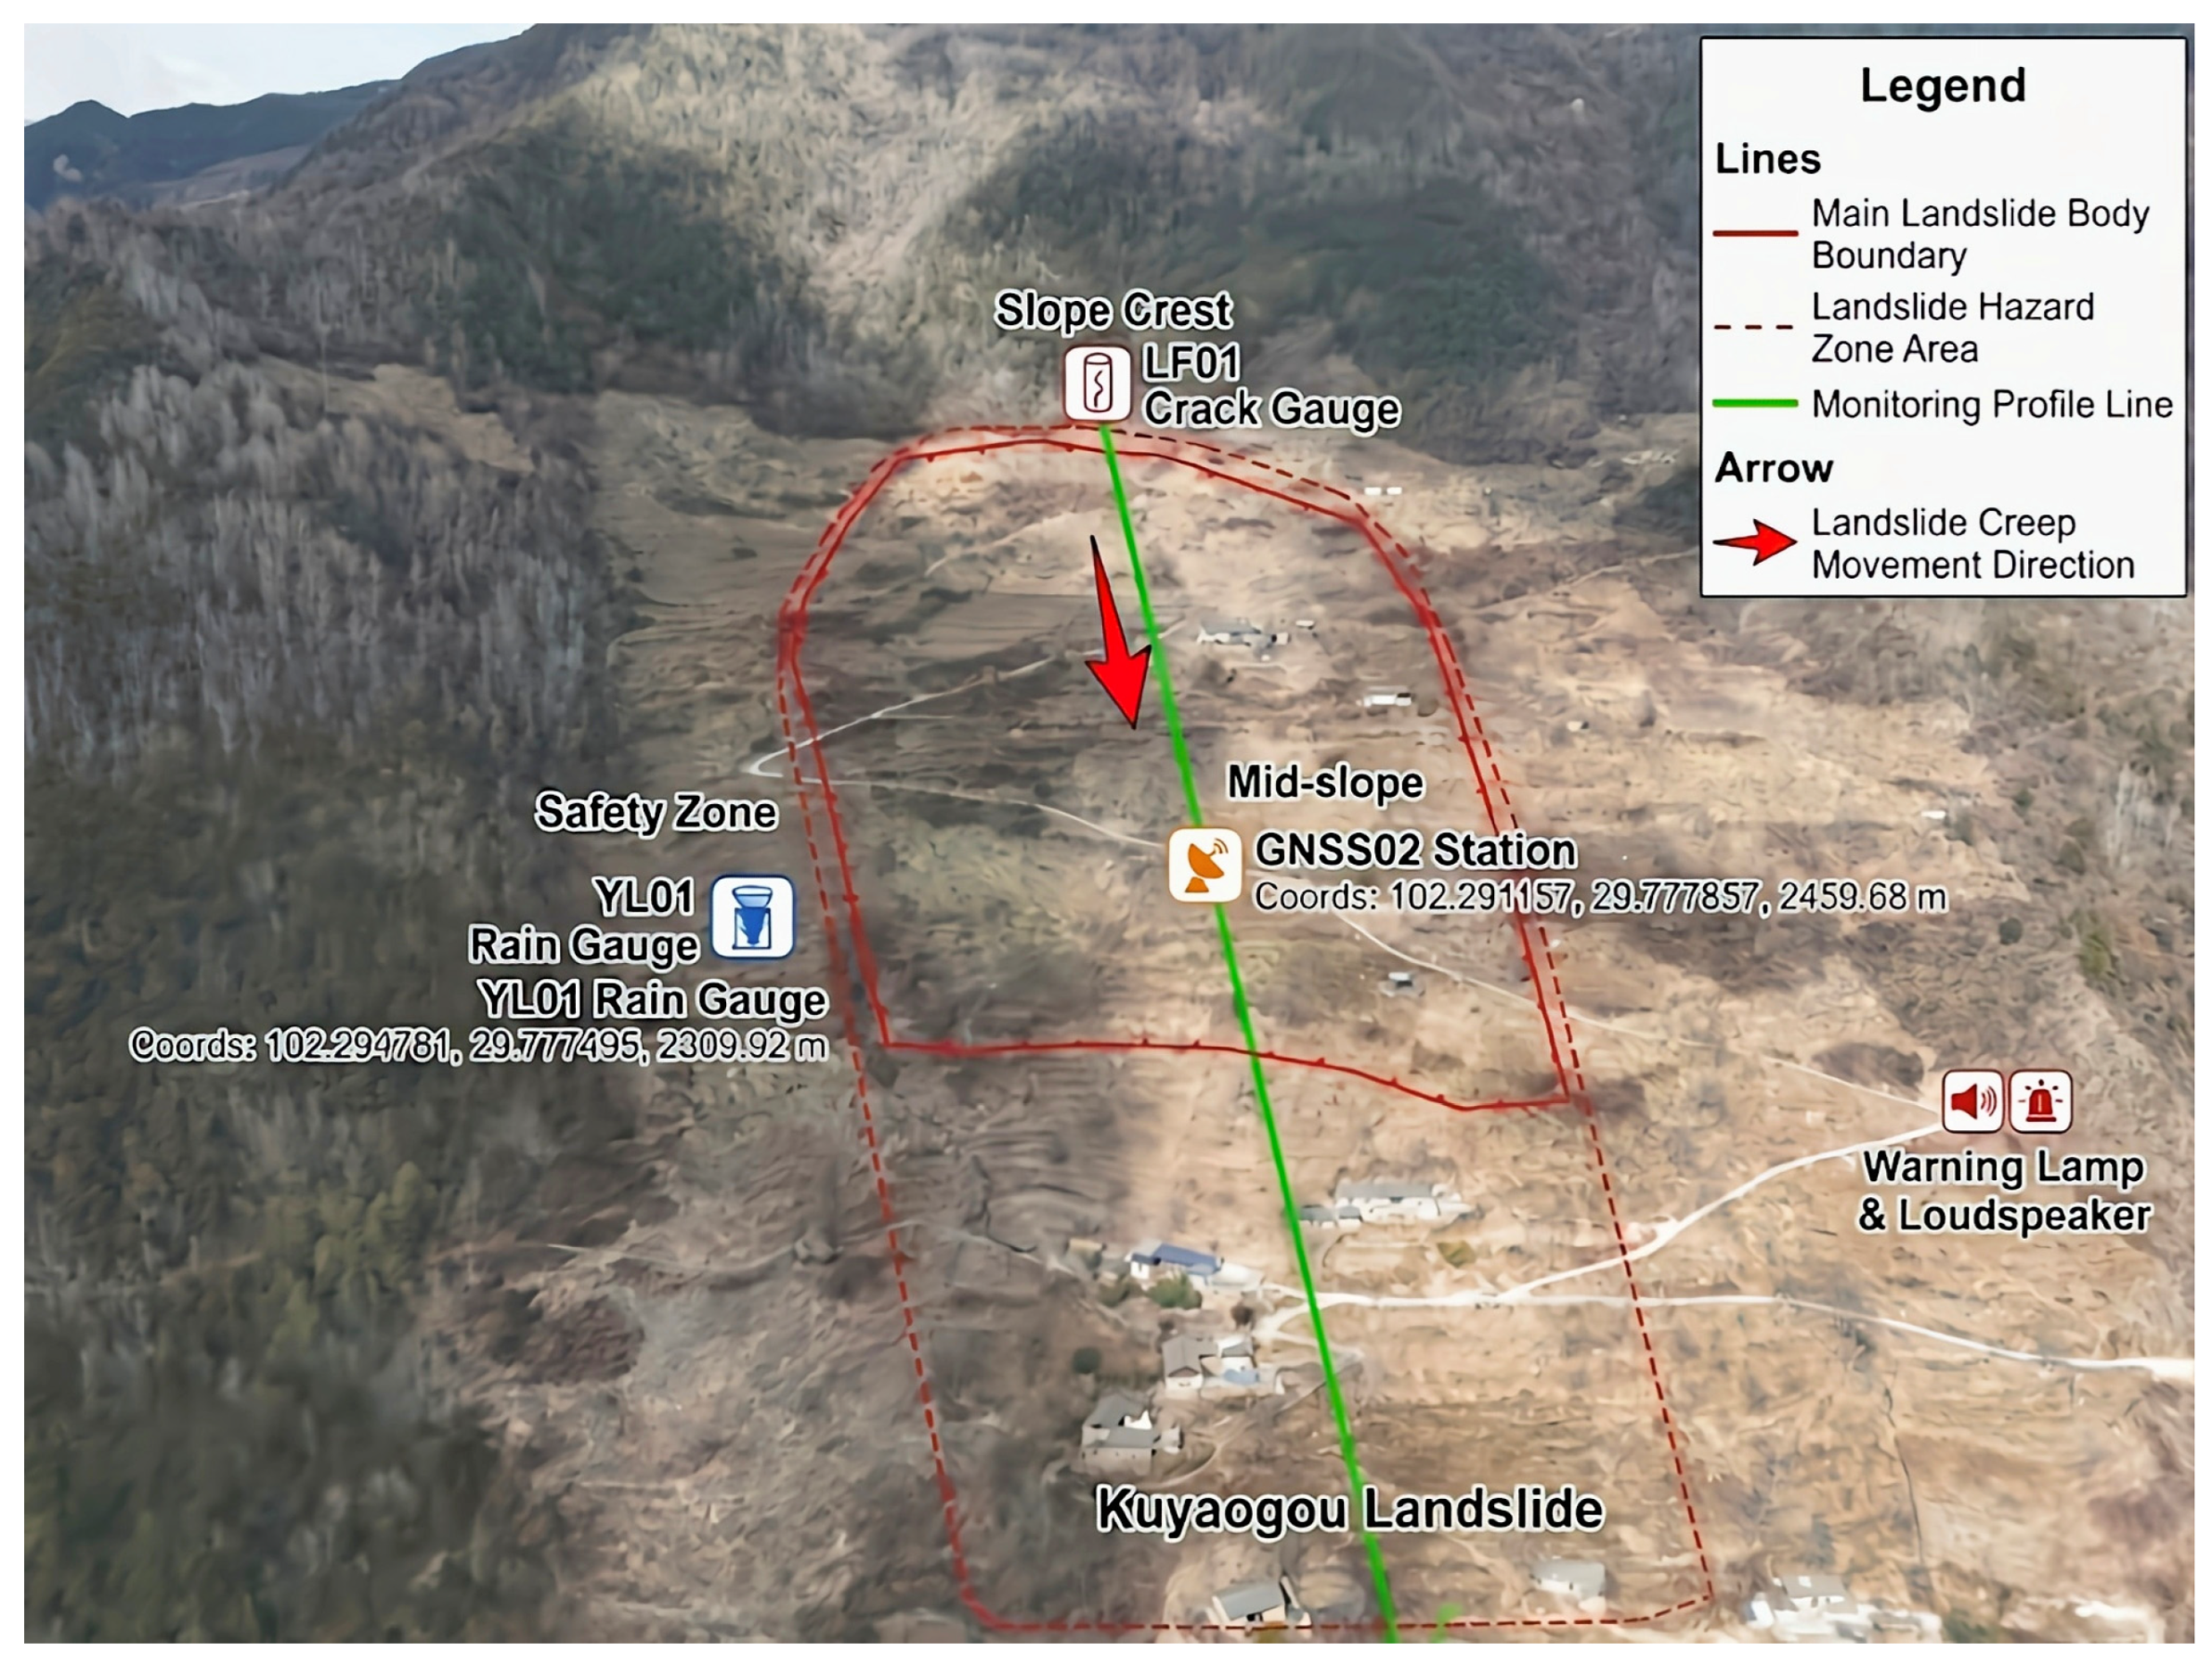
The Kuyaogou landslide, which is classified as a small-scale shallow soil landslide dominated by surface-layer creep deformation, is located in Xiamachang Village, Xinglong Town, Luding County, Sichuan Province (102°17′33.00″ E, 29°46′35.00″ N), at an elevation of approximately 2355 m, as shown in Figure 1.

2.1.2. Overview of Landslide Monitoring and Early Warning in Kuyaogou

The landslide body measures approximately 162 m in length and 134 m in width, with an estimated volume of around 88,000 m3. The predominant sliding direction is estimated to be approximately 156°, with slope gradients ranging from 30° to 65°. Field observations reveal ongoing creep deformation accompanied by surface cracks and localized collapses.
An integrated monitoring system has been deployed, comprising rainfall gauges, crack meters, GNSS displacement monitoring stations and audible–visual warning devices. These instruments were installed at the slope crest, upper slope, mid-slope, and in a stable reference area to provide continuous, multi-source monitoring data (see Figure 2 and Table 1).

2.2. Data Sources and Data Preprocessing

2.2.1. Data Sources

The data for this study were obtained from the monitoring records of the Kuyaogou landslide site, which were collected by the Sichuan Geological Survey Institute between 8 June 2024 and 30 November 2025. The total number of samples is 3229, among which approximately 70% (2260 samples) are used for training and 30% (969 samples) for testing. The monitoring system forms a complete physical chain of ‘Triggering Factor–Process Response–State Characterization’. (1) Triggering factor: Daily rainfall data from the YL01 rain gauge, which drives landslide movement by increasing pore water pressure and reducing soil shear strength; (2) Process response: Fracture width measurements from the LF01 crack meter serve as an internal precursor indicator reflecting initial tension and stress release within the slope. (3) State characterization: Three-dimensional displacement data (X/Y/Z) from GNSS02, representing the final kinematic outcome of the landslide.
The data for this study were obtained from the monitoring records of the Kuyaogou landslide site, which were collected by the Sichuan Geological Survey Institute between 8 June 2024 and 30 November 2025. The total number of samples is 3229, of which approximately 70% (2260 samples) are used for training and 30% (969 samples) for testing.
The monitoring system forms a complete physical chain of ‘Triggering Factor–Process Response–State Characterization’:
(1) Triggering factor: Daily rainfall data from the YL01 rain gauge, which drives landslide movement by increasing pore water pressure and reducing soil shear strength;
(2) Process response: Fracture width measurements from the LF01 crack meter serve as an internal precursor indicator, reflecting initial tension and stress release within the slope;
(3) State characterization: Three-dimensional displacement data (X/Y/Z) from GNSS02, representing the final kinematic outcome of the landslide.

2.2.2. Descriptive Statistical Analysis

(1)
Rainfall Characteristics
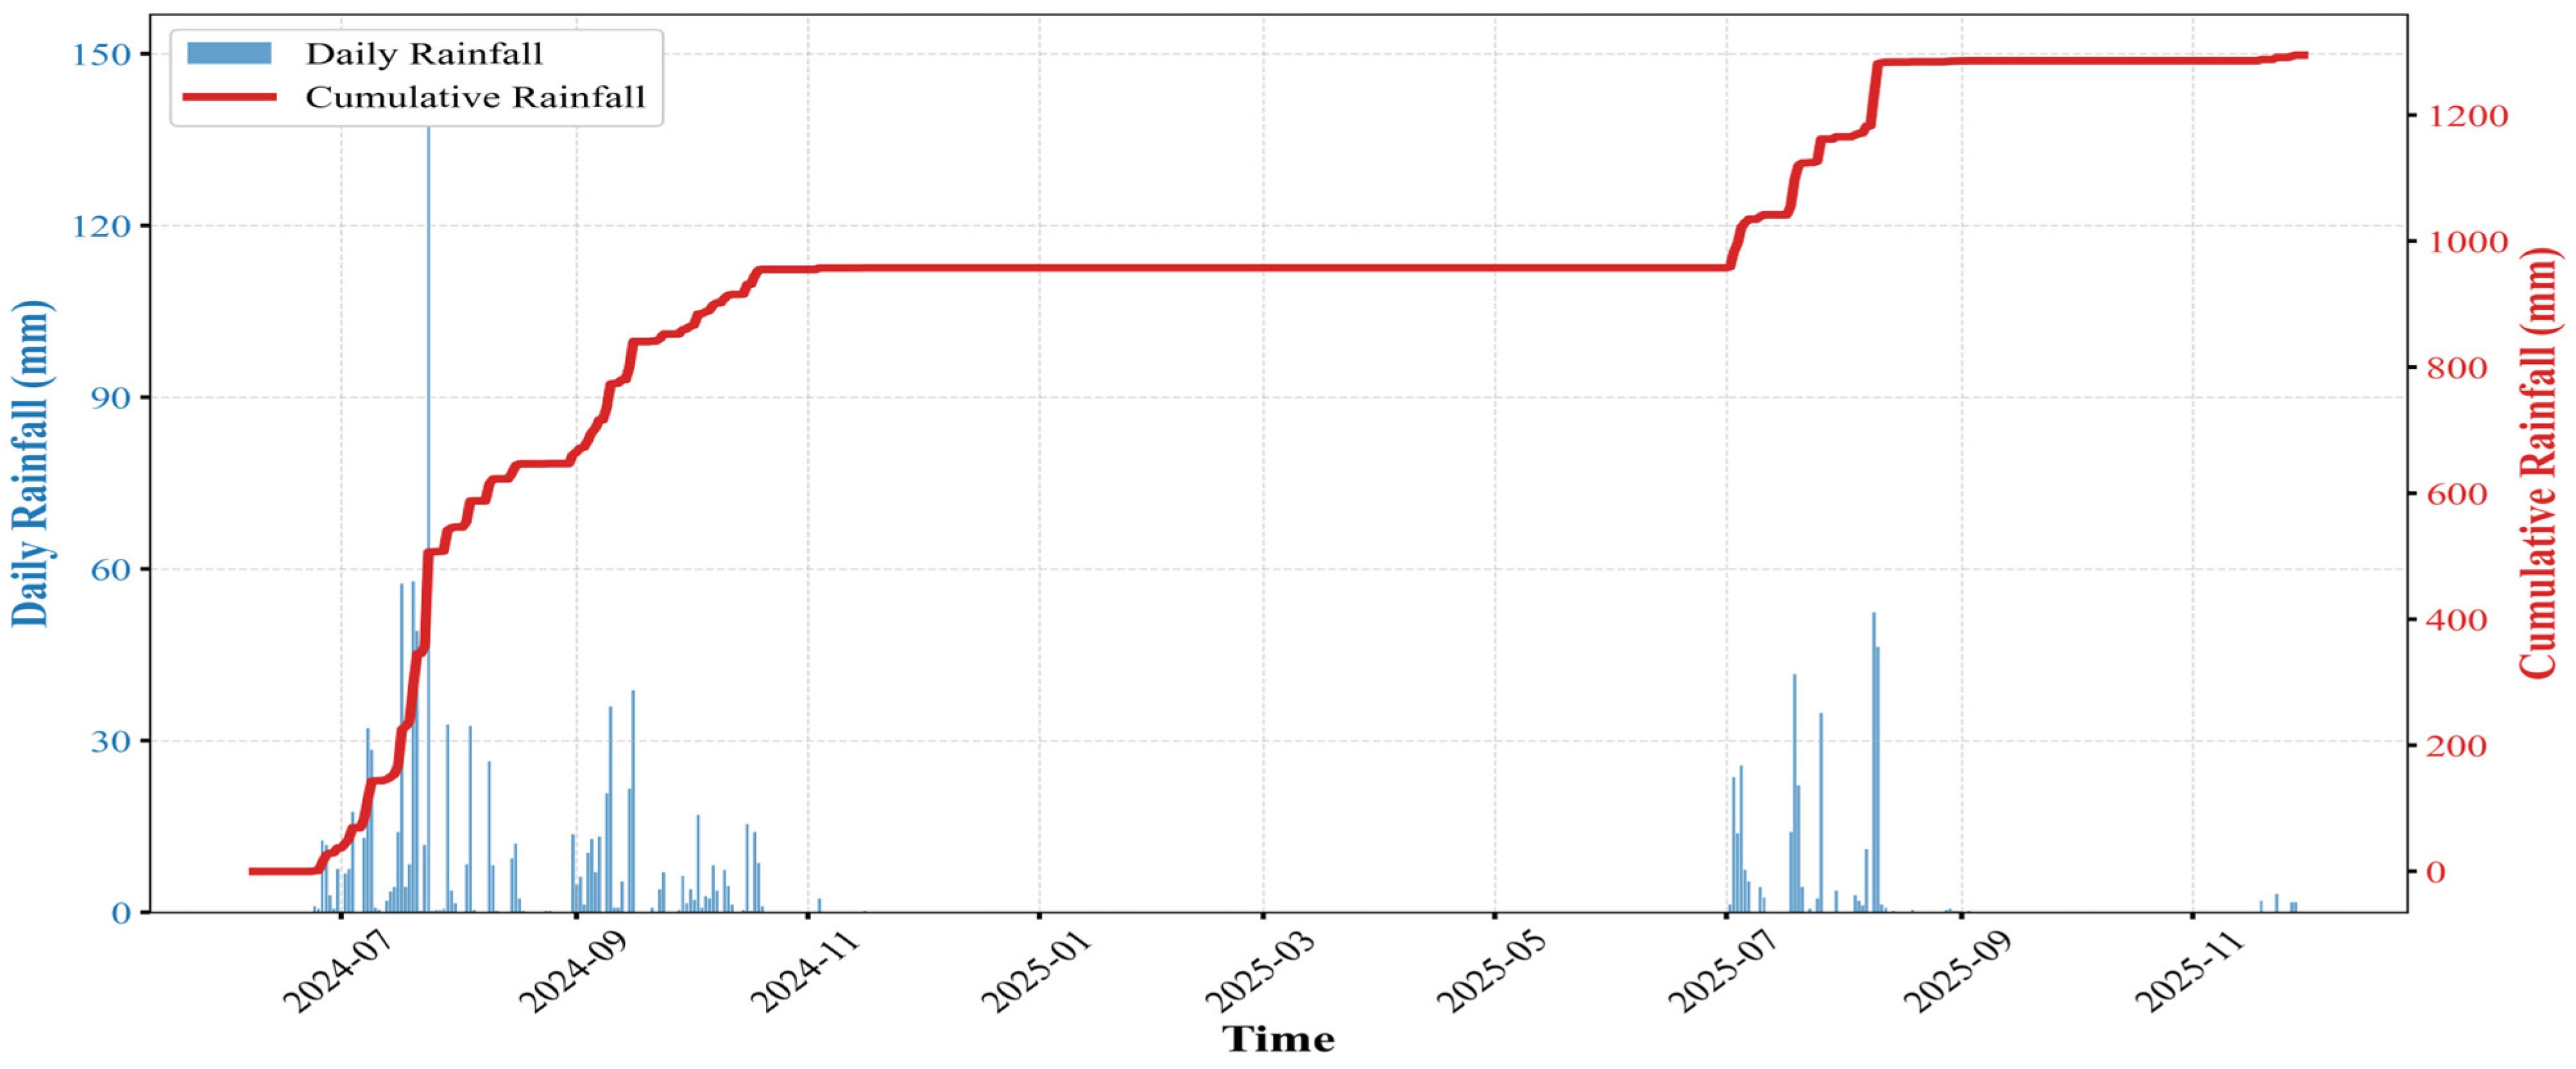
Figure 3 shows daily and cumulative rainfall at the Kuyaogou monitoring site. The rainfall series is highly intermittent, with most precipitation concentrated in a few brief, intense events. Consequently, the cumulative rainfall curve exhibits a distinct stepwise pattern, reflecting the uneven temporal distribution of rainfall.
(2)
Temporal Variation of Crack Width
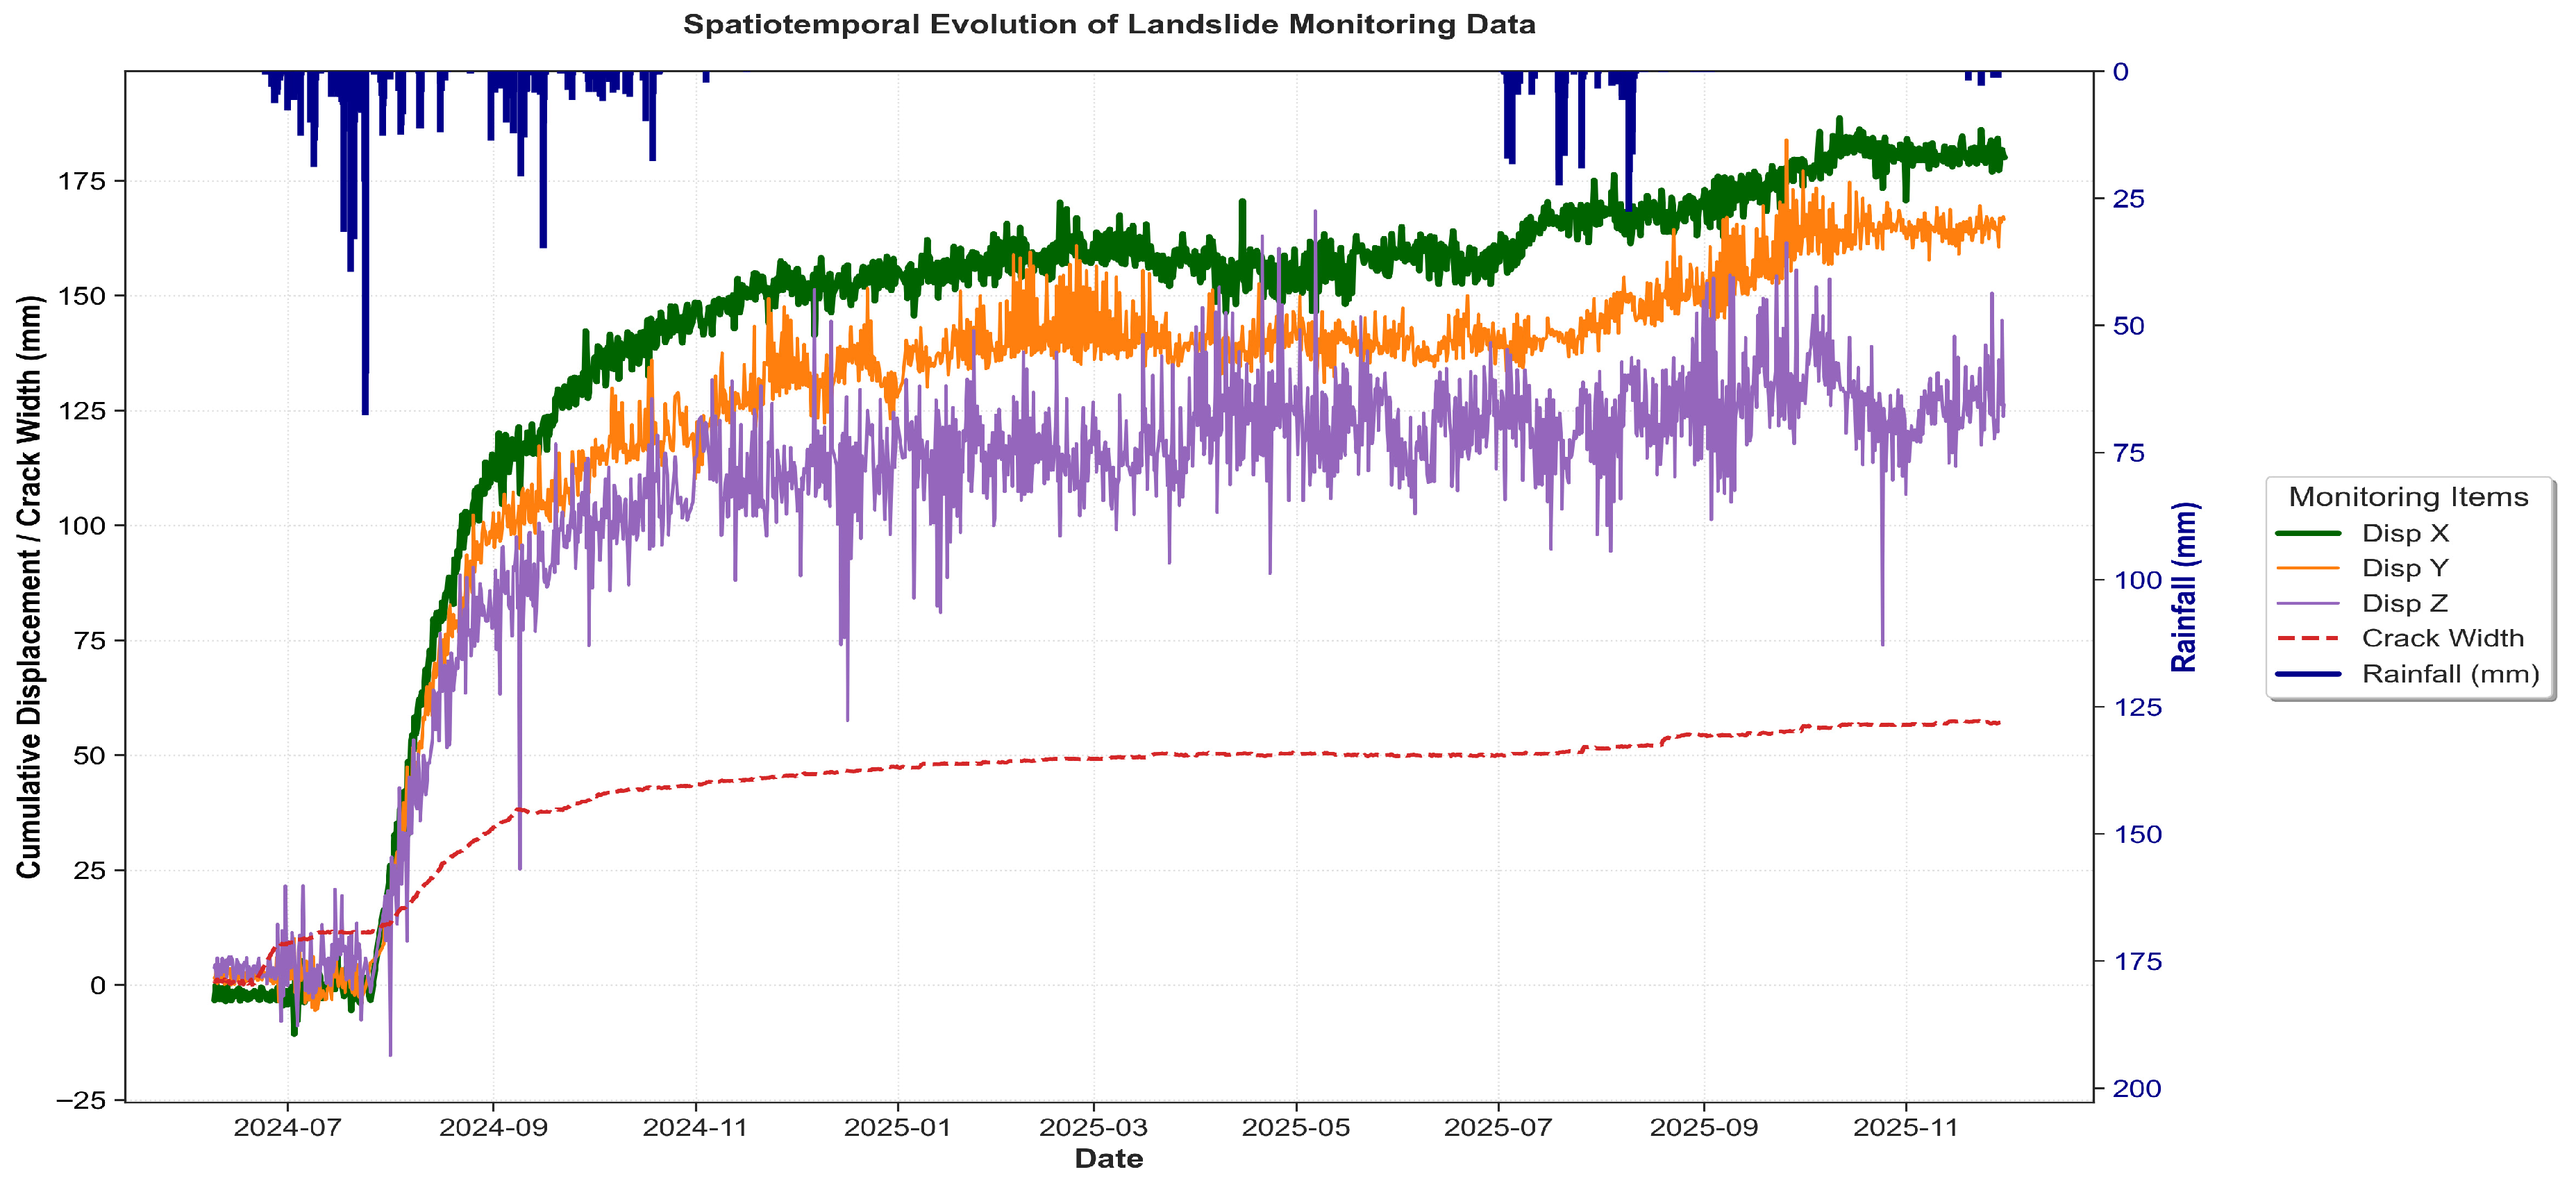
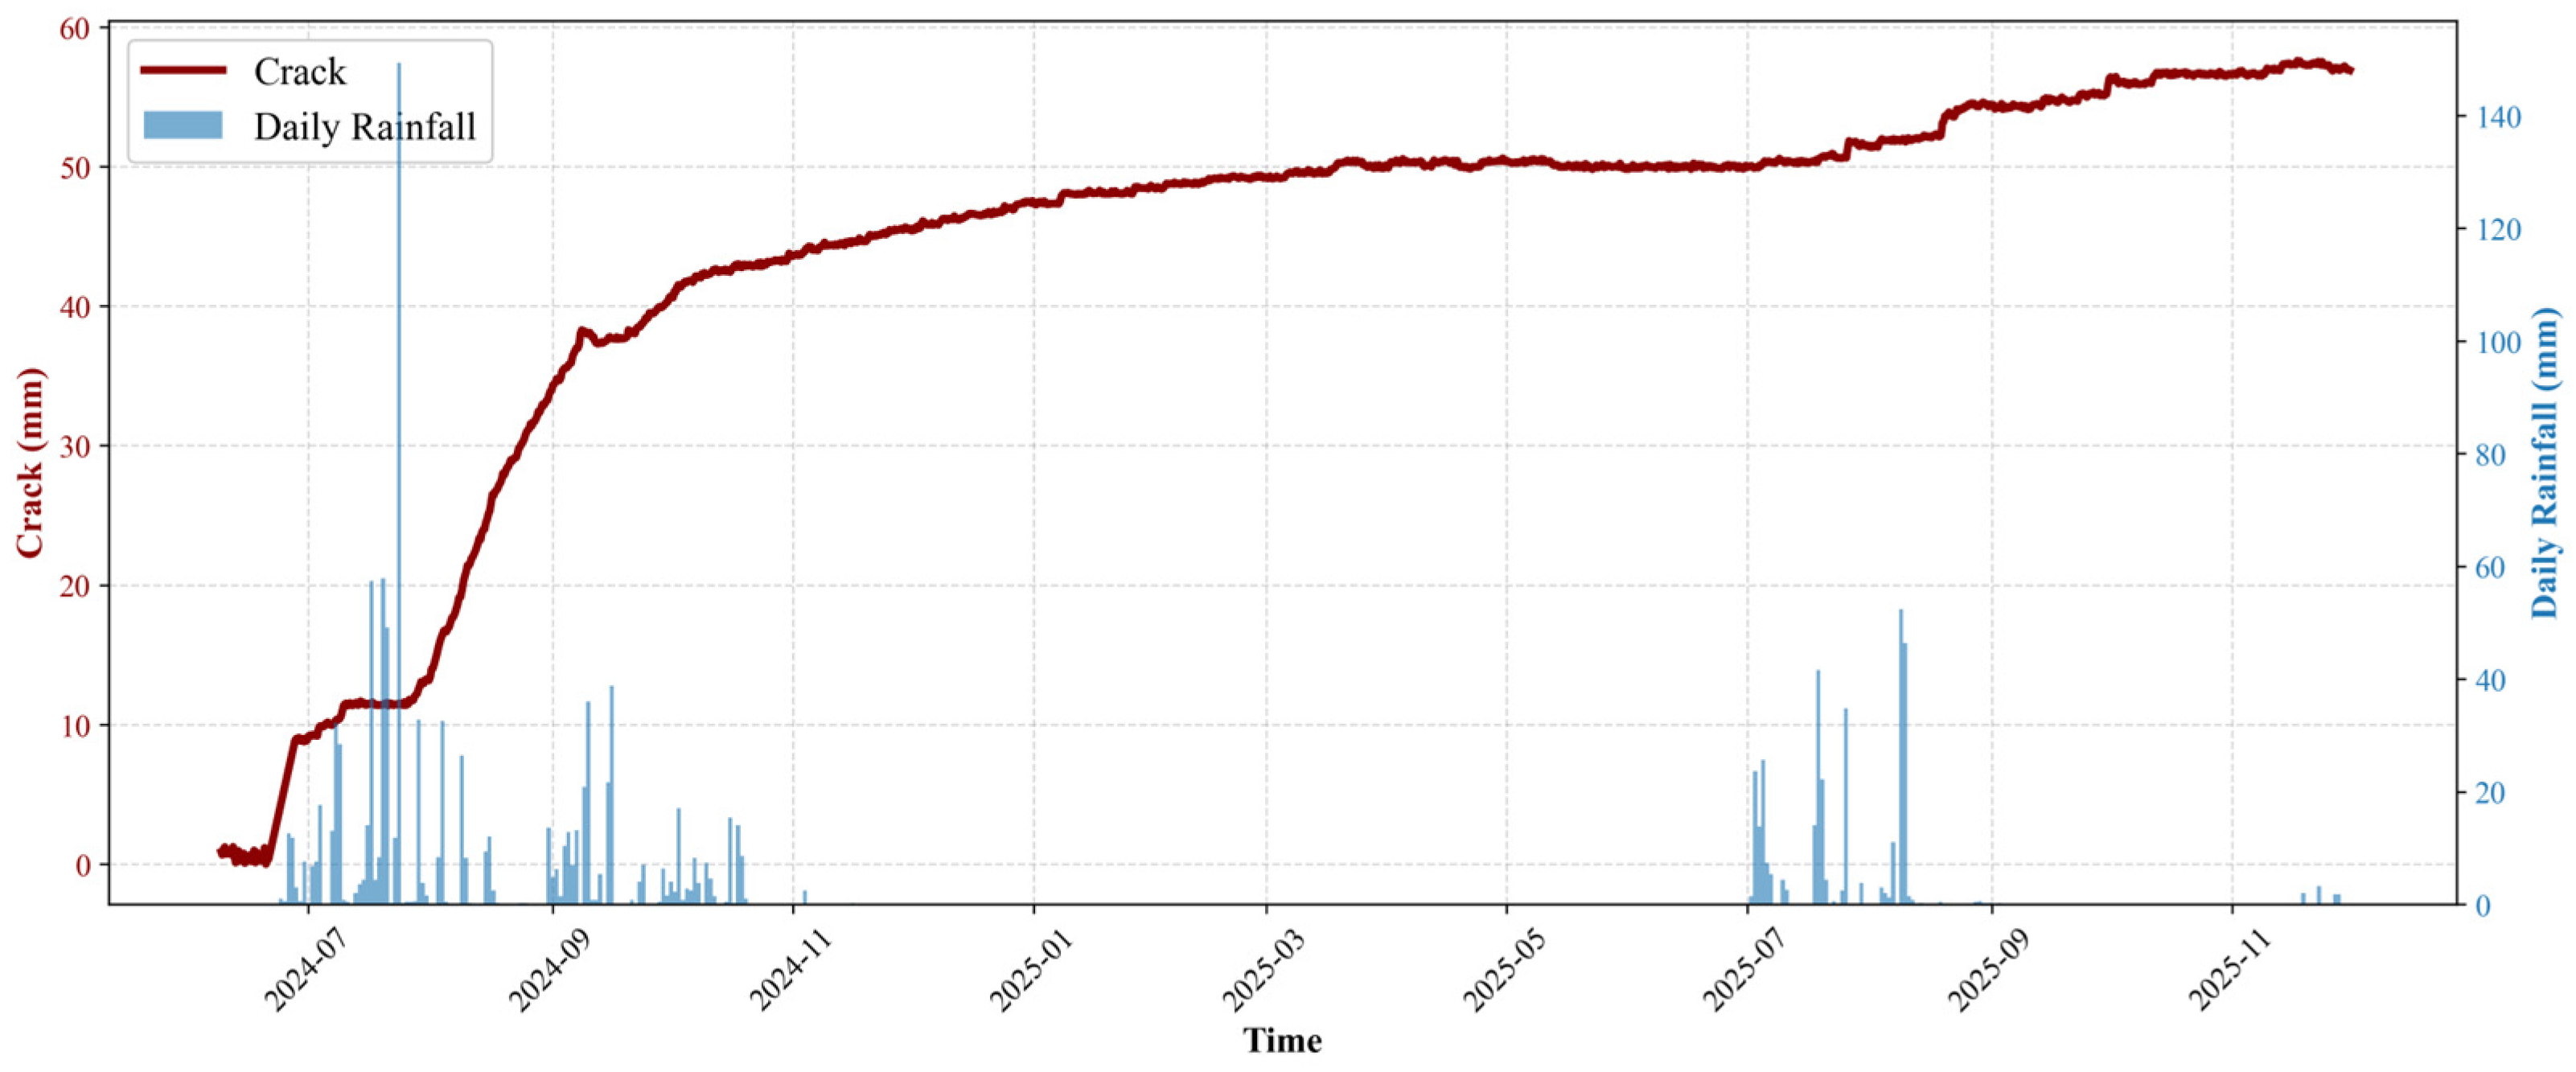
Figure 4 shows the time series of rainfall and crack width. Changes in crack width occur intermittently and exhibit step-like increases rather than continuous trends. Periods of crack expansion are temporally aligned with, or slightly lag behind, rainfall events, suggesting a strong temporal relationship between them.
(3)
Displacement Time Series Characteristics
Figure 5 shows a comparison of the time series for rainfall, crack width and GNSS displacement. Displacement exhibits a cumulative growth pattern with intermittent acceleration phases, while its temporal variation is smoother than that observed for rainfall and crack width. This highlights the progressive and inertial nature of landslide displacement.
(4)
Analysis of GNSS Data for Kuyaogou Landslide Monitoring
Horizontal displacement is defined as the lateral movement of the ground surface during geological hazards, which are typically associated with earthquakes, landslides, or fault activity. This phenomenon represents the lateral displacement of points on the ground surface, which can result in surface deformation. The total GNSS displacement is calculated as follows:
D i s p T o t a l S = ( D i s p X ) 2 + ( D i s p Y ) 2
Vertical displacement is defined as the vertical movement of the ground surface caused by geological hazards. This movement is typically uplift or subsidence. Examples include vertical fault displacement, earthquake-induced ground heaving or subsidence, and landslide vertical components.
Combined displacement is defined as the integrated manifestation of horizontal and vertical displacements. It is represented by the straight-line movement of an object or ground point from its initial to final position. This vector sum is calculated using the Pythagorean theorem:
D i s p T o t a l H = ( D i s p X ) 2 + ( D i s p Y ) 2 + ( D i s p Z ) 2
(5)
Statistical Distribution of Monitoring Variables
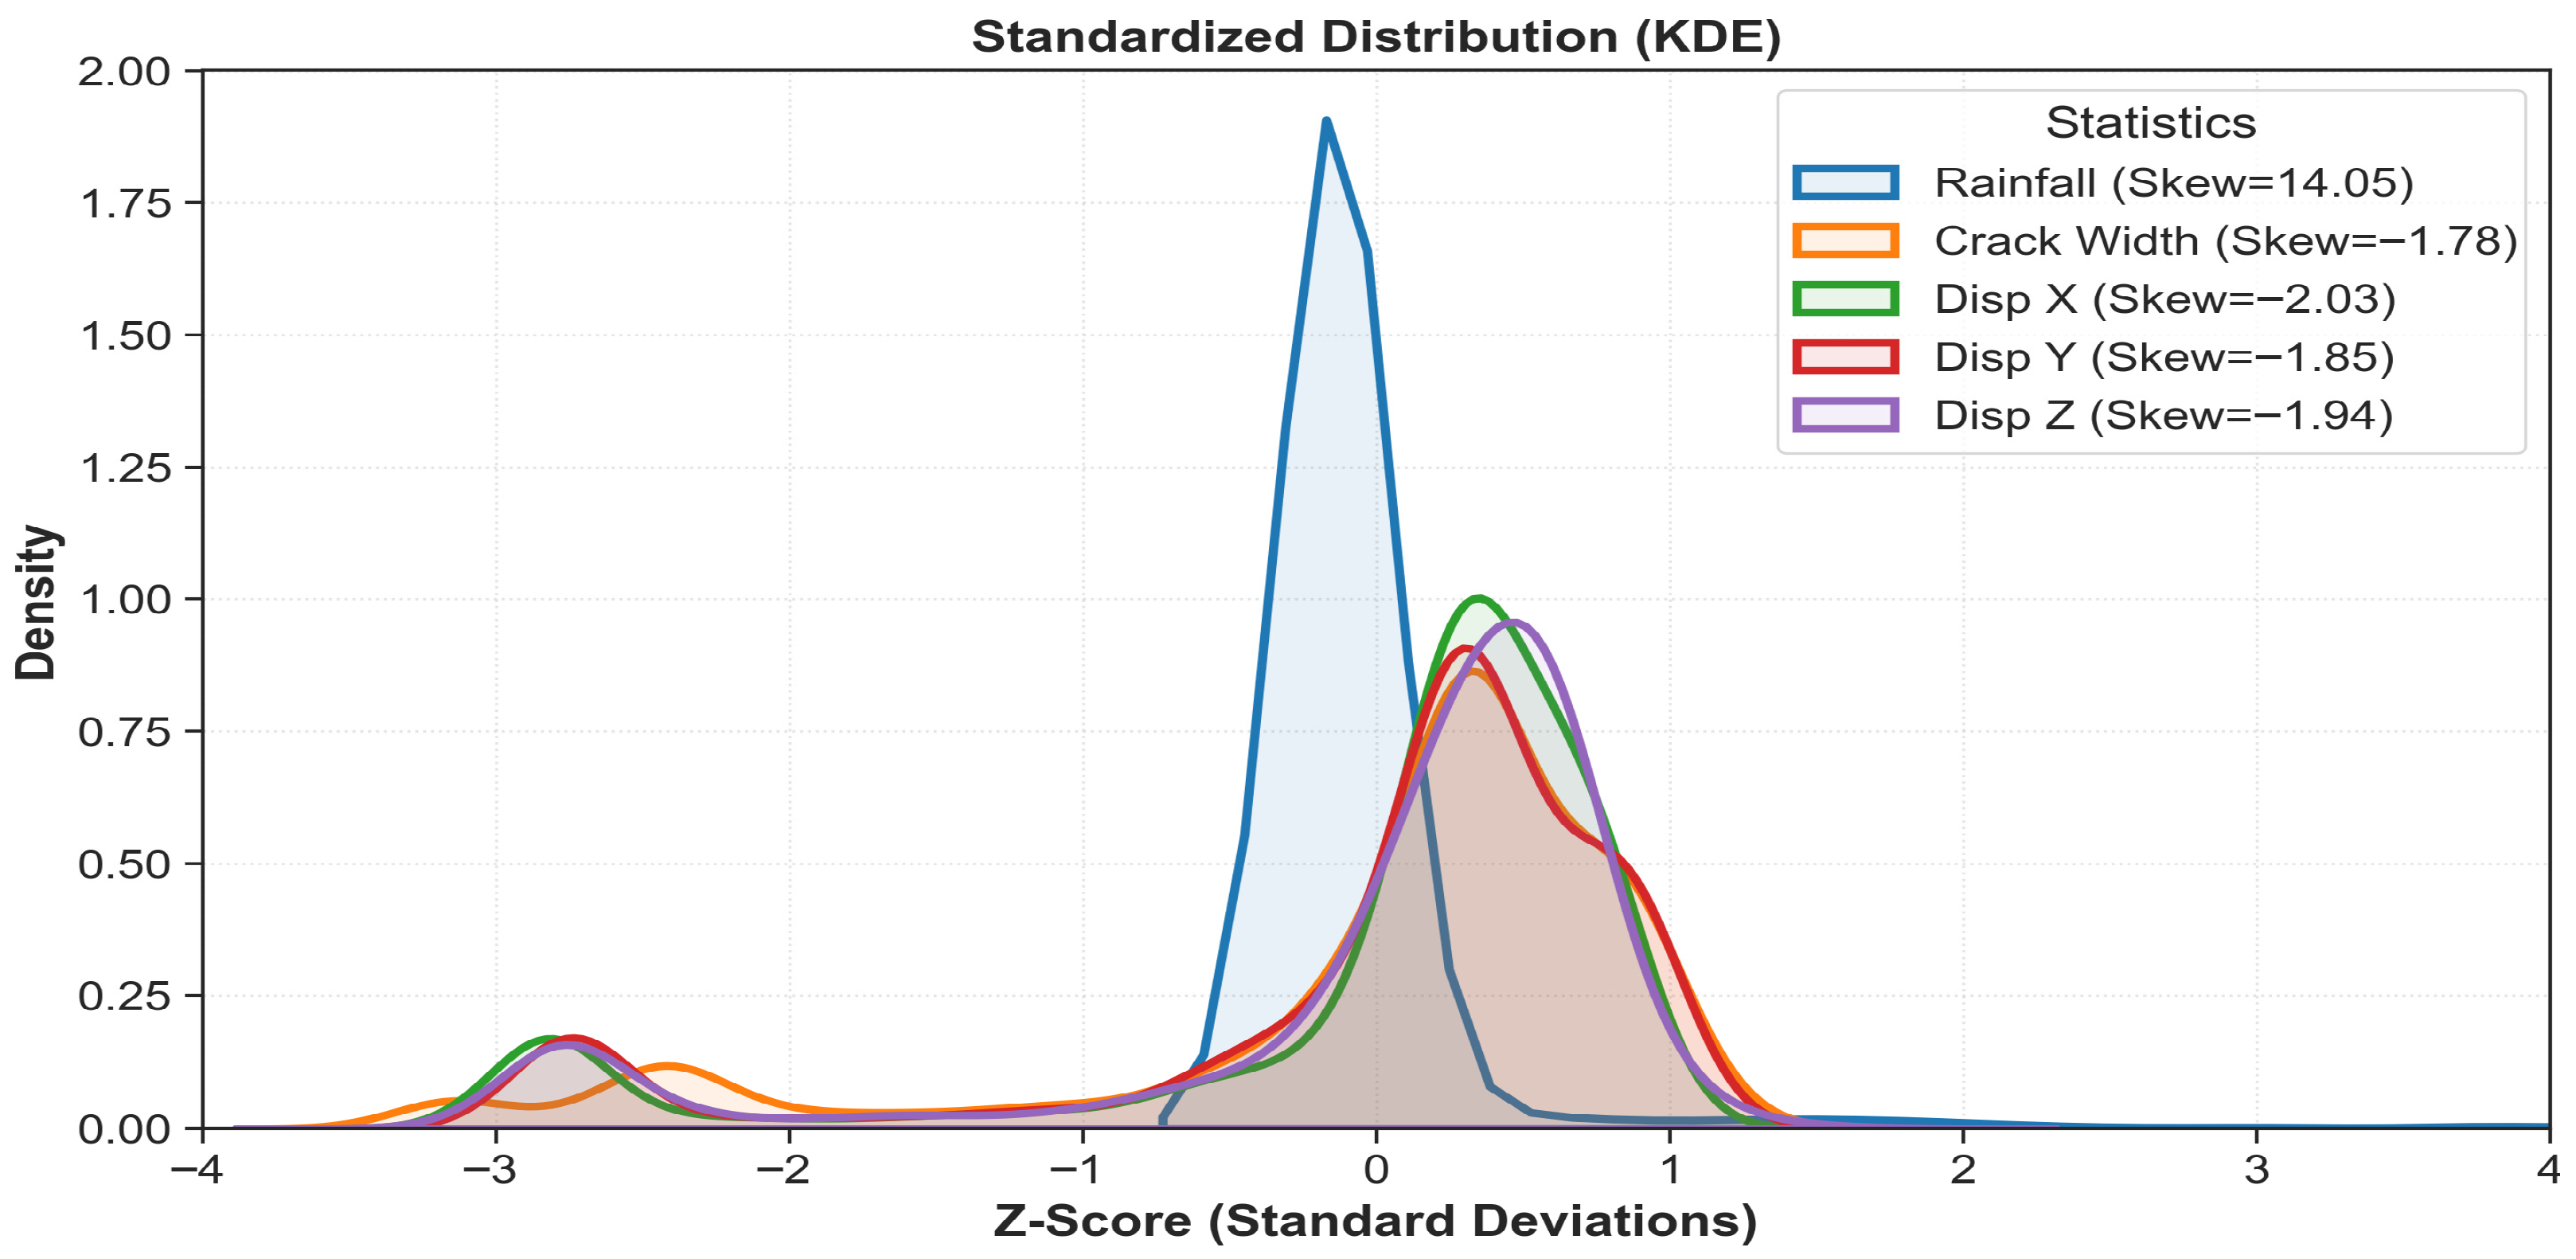
Figure 6 shows the statistical distributions of rainfall, crack width, and displacement. Rainfall exhibits strong positive skewness (14.05) due to extreme events, while crack width and displacement show right-skewed or multimodal distributions. These substantial differences in scale and distribution justify the normalization procedure applied prior to model training.

2.3. Data Preprocessing and Feature Engineering

2.3.1. Data Resampling

Rainfall data calculates cumulative precipitation within each four-hour window to reflect total infiltration during that period. Missing data segments are treated as zero values. Crack data uses the arithmetic mean of width measurements within the window to characterize the average deformation state. Missing values are filled via linear interpolation; displacement data records the instantaneous value at the end of each four-hour window to capture cumulative displacement in three dimensions (X, Y, and Z). It also calculates displacement change within the period to reflect deformation trends. These processing steps establish a unified time indexing system, laying the foundation for subsequent feature engineering.

2.3.2. Feature Engineering

This study uses the sliding window method to create a feature matrix that captures temporal dependencies during landslide evolution. The window parameters were set with the physical mechanisms of landslides in full consideration. A lag step of K = 6 was set, which corresponds to a time span of 24 h (i.e., 6 × 4 h). This ensures that the window length sufficiently covers the complete physical processes of rainfall infiltration, pore water pressure transmission, soil strength decay, and surface deformation. A sliding step size of one time step (4 h) was also set to ensure continuity between adjacent samples. For each time point t, the constructed feature vector incorporates lagged values from multi-source monitoring data collected over the preceding 24 h. The specific feature composition is detailed in Table 2.

2.3.3. Time-Delay Characteristic Matrix Based on “Rainfall-Crack-Historical Displacement”

This study frames the displacement prediction task as a regression problem based on multi-source monitoring sequences. The target displacement, D_(t+1), is predicted at the next time step. To comprehensively capture the various physical mechanisms of landslide evolution comprehensively, three types of temporal features are integrated: rainfall sequence R (reflecting the triggering effects of rainfall), crack sequence C (providing precursor deformation information), and historical displacement sequence D (representing system evolution inertia). A unified “rainfall-crack-historical displacement” time-delay feature matrix is constructed through time-delay analysis of these sequences and serves as input for the subsequent regression prediction model. This enables multi-mechanism collaborative modeling and prediction of landslide displacement dynamics.
The displacement prediction is defined as a non-linear regression problem that integrates the entire physical evolution chain:
D t + 1 = f ( R t k : t , C t k : t , D t k : t )
where D t + 1 is the predicted displacement; R represents the rainfall sequence (triggering factor); C represents the crack sequence (process response); and D represents the historical displacement (inertial state).

2.4. Methodology

2.4.1. Ridge Regression

Ridge regression is a regularized linear method that addresses multicollinearity by adding an L2 penalty term to the loss function. This shrinks coefficients towards zero without eliminating features, thereby reducing variance and improving generalization. The methodology was first proposed by Hoerl and Kennard in 1970, and it has been demonstrated to preserve all feature information while preventing overfitting. In the context of landslide displacement prediction, ridge regression has been shown to effectively handle high correlations among multi-source monitoring features (e.g., rainfall and cracks), delivering stable baseline performance and significantly lower prediction errors than ordinary least squares when strong linear correlations exist among variables [20].

2.4.2. Least Absolute Shrinkage and Selection Operator (Lasso)

Lasso regression, proposed by Tibshirani in 1996, is an L1-regularised linear method that introduces an absolute value penalty term to shrink some regression coefficients precisely to zero. This enables simultaneous regularization and automatic feature selection, producing sparse solutions that are particularly suitable for variable screening in high-dimensional data scenarios [21]. In the context of landslide displacement prediction, Lasso has been shown to automatically identify key predictors from numerous time-lagged features, thereby constructing minimalist, interpretable models. When the true model has a sparse structure, Lasso outperforms traditional regularization methods in both accuracy and interpretability.

2.4.3. ElasticNet Regression

ElasticNet regression, a methodology proposed by Zou and Hastie in 2005 [22], combines L1 and L2 regularization techniques to address the instability of Lasso in selecting variables when dealing with highly correlated features. The integration of the L1 penalty, which addresses sparsity and feature selection, and the L2 penalty, which addresses multicollinearity, preserves the strengths of both Lasso and Ridge regression. In the context of landslide displacement prediction, ElasticNet has been demonstrated to effectively capture complex spatiotemporal correlations among monitored features, automatically selecting key feature groups rather than individual variables. This approach yields more stable and physically interpretable predictive models, and outperforms Lasso or Ridge alone in scenarios where group effects or strong correlations among variables are present.

2.4.4. Long Short-Term Memory Networks (LSTM)

Long Short-Term Memory (LSTM) networks are a type of recurrent neural network (RNN) designed to address the issues of gradient vanishing and explosion that traditional RNNs encounter when processing long sequences. LSTM has been demonstrated to significantly enhance the learning capabilities for long sequence data by preserving the stability of the gradient flow during backpropagation [25]. This approach has found extensive application in various fields, including speech recognition, natural language processing, and time series forecasting.

2.4.5. The Transformer–Attention–LSTM Hybrid Architecture

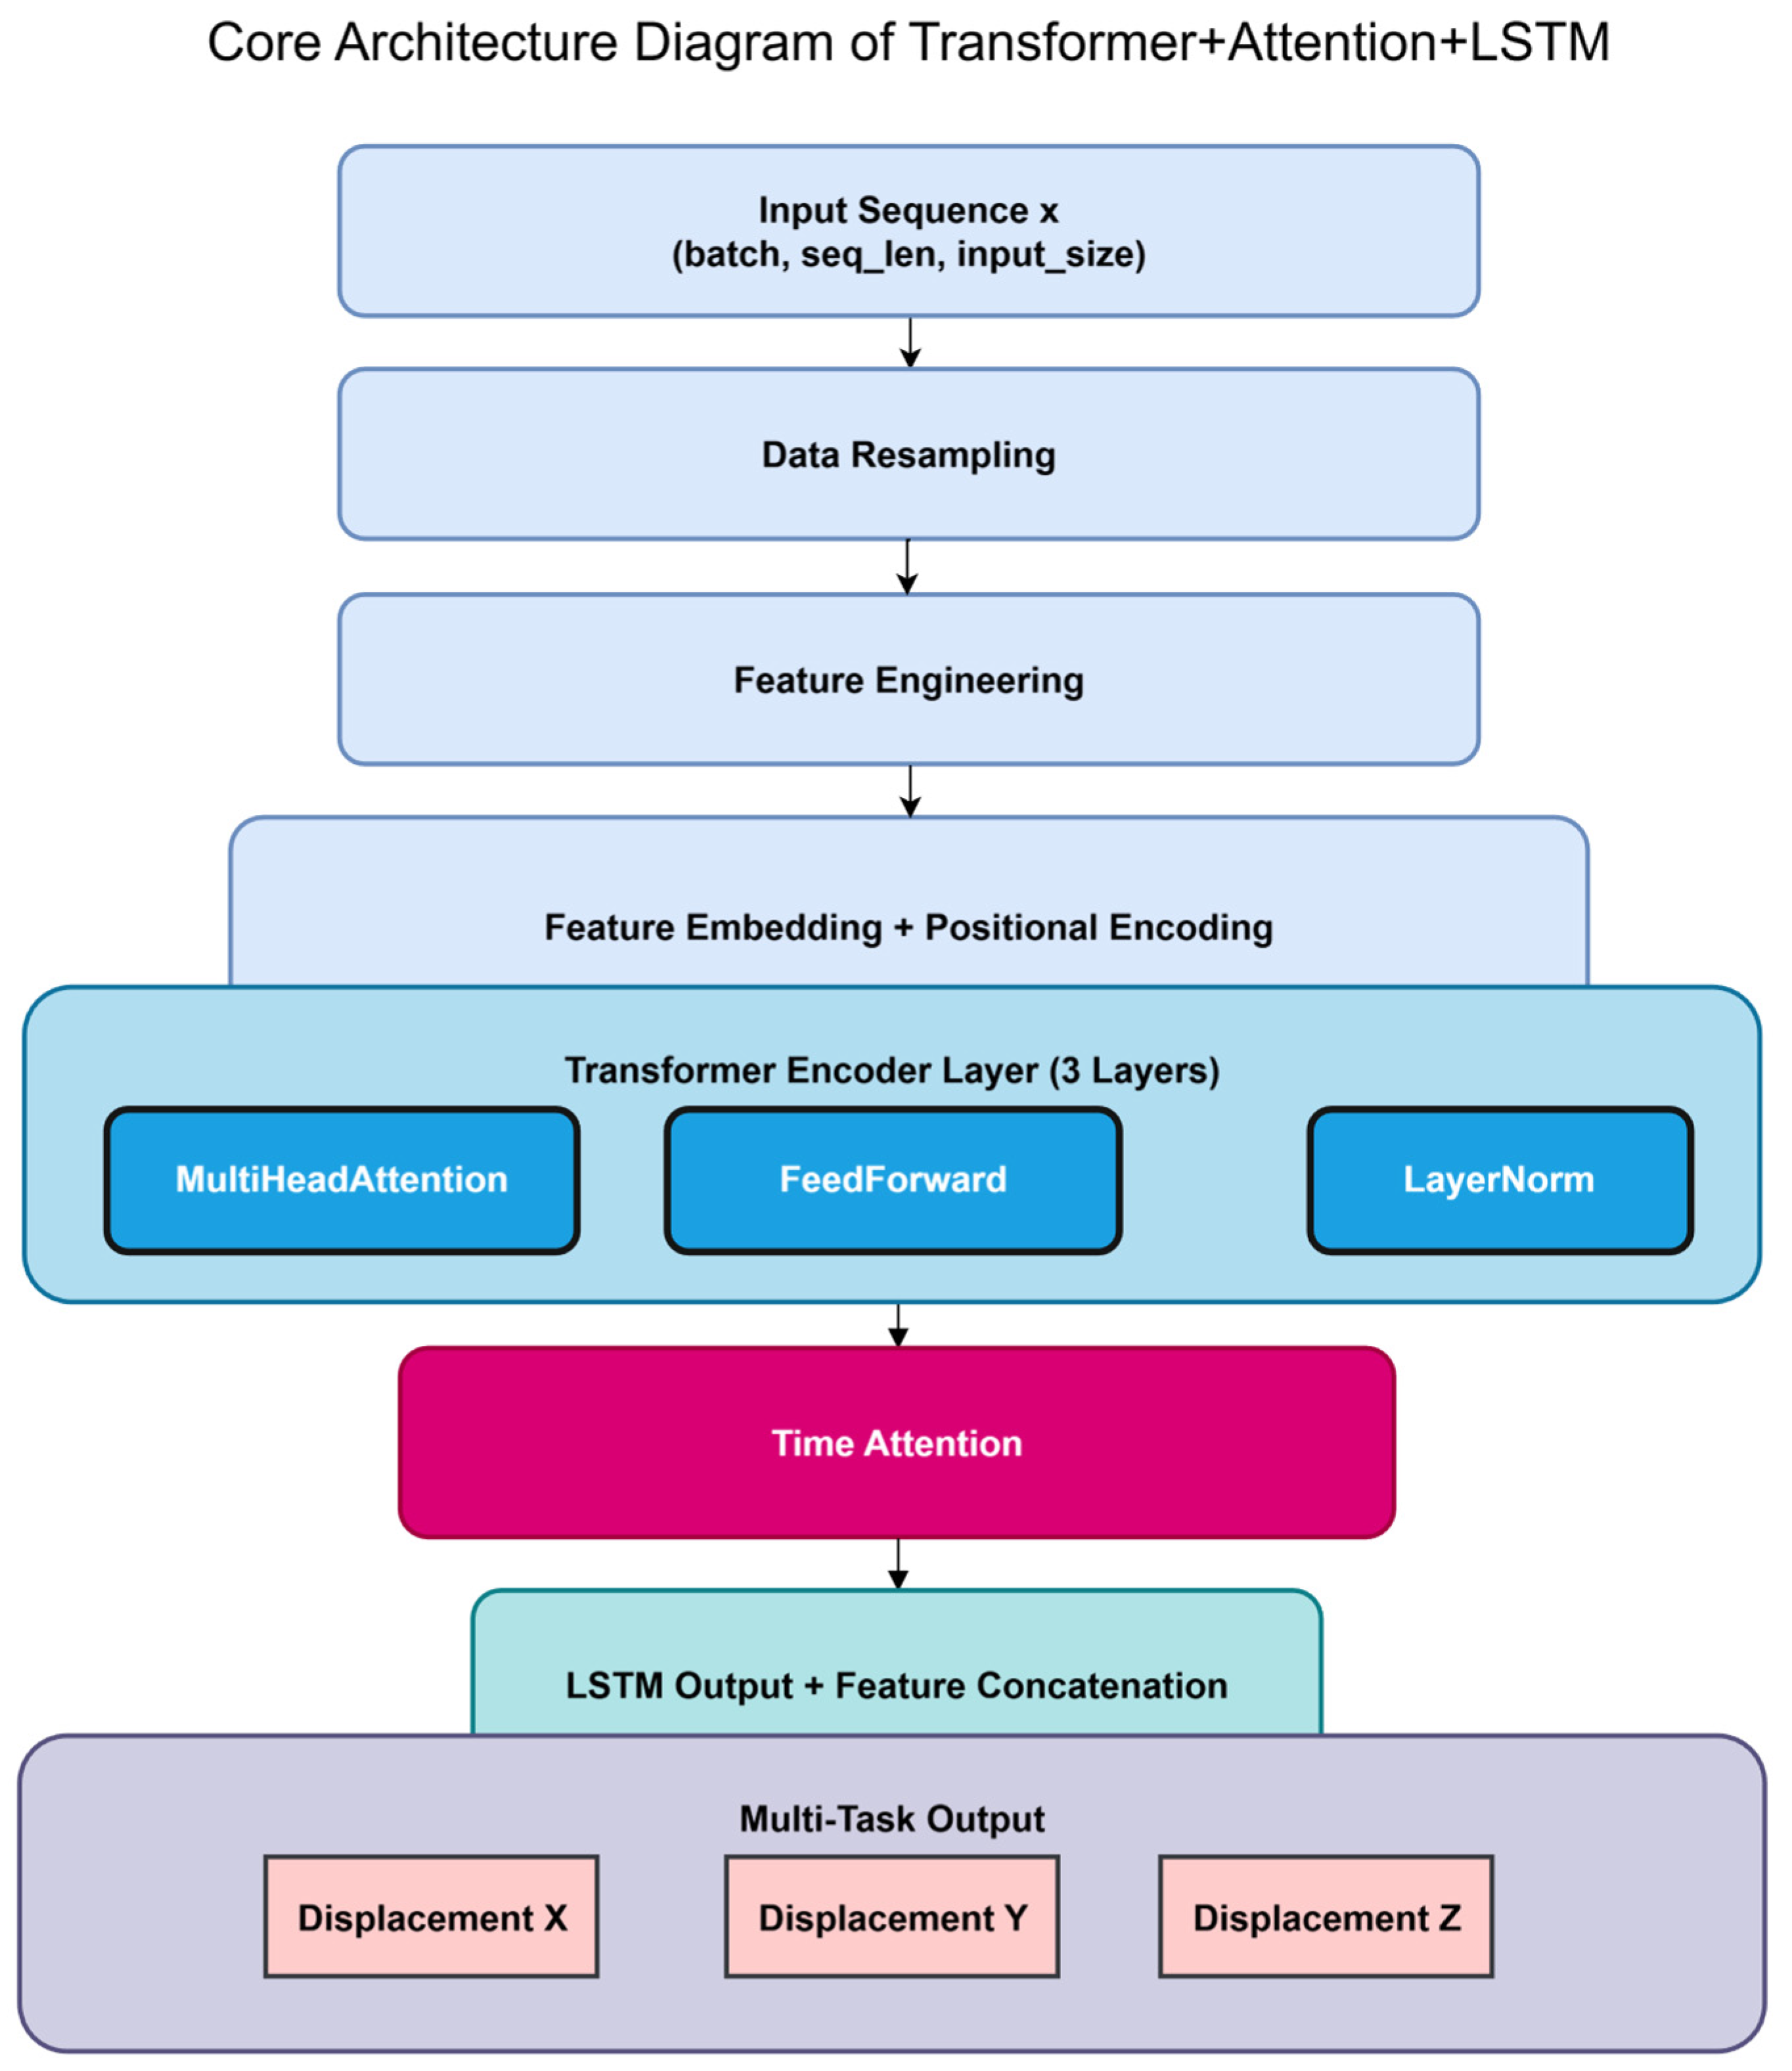
As shown in Figure 7, the Transformer–Attention–LSTM hybrid architecture integrates the multi-head global attention mechanism of transformers with the temporal modeling capabilities of LSTMs. The model borrows the self-attention design from Transformers to capture long-range global dependencies in sequences via parallel multi-head mechanisms. It also retains the recursive gating structure of LSTMs to improve learning of local temporal features. Research indicates that, in landslide displacement prediction, such hybrid models can model both remote meteorological effects and near-field geotechnical responses simultaneously, demonstrating superior overall performance compared to standalone LSTM or Transformer models. The multi-layer attention weight maps generated by the model provide insights into the factors influencing predictions of complex geological processes across spatiotemporal scales, enhancing their interpretability [14].

2.4.6. Definition and Theoretical Basis of Displacement Tangent Angle

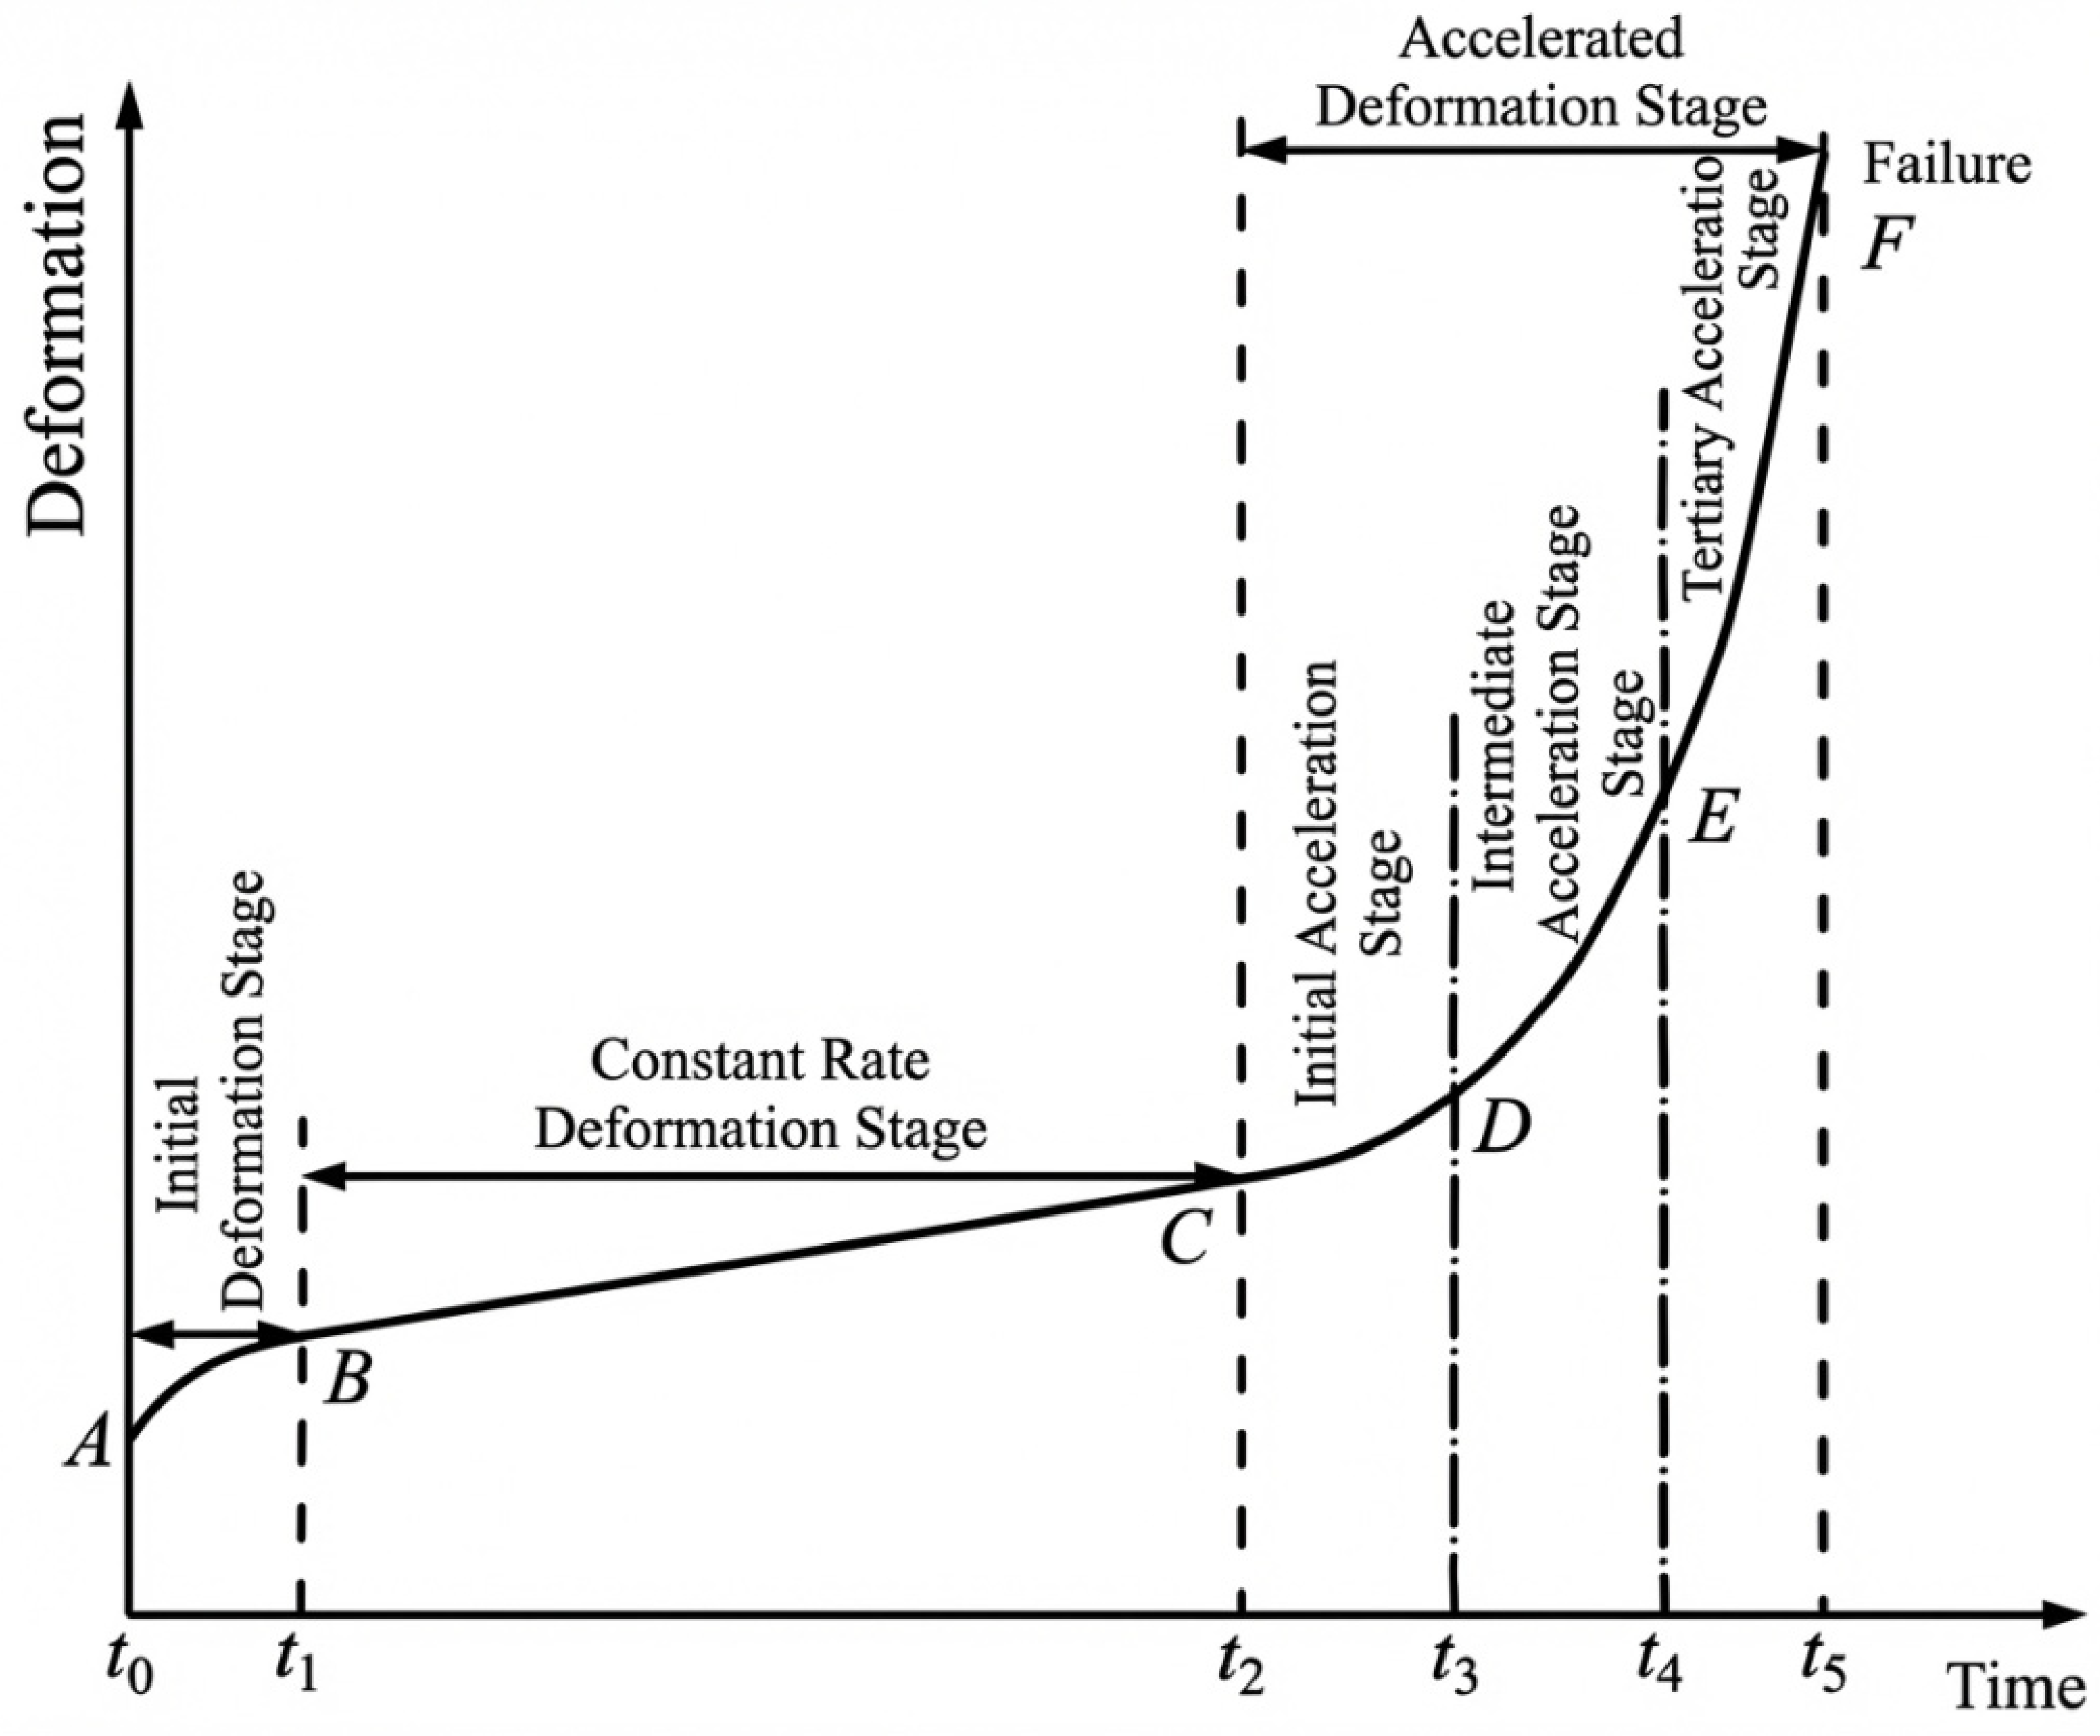
Extensive research indicates that the displacement-time evolution curve of landslides typically exhibits a distinct three-stage pattern, as illustrated in Figure 8. This pattern consists of an initial deformation stage, a constant-rate deformation stage, and an accelerated deformation stage. During the initial deformation stage, the landslide mass begins to undergo slight deformation with a low displacement rate, resulting in a relatively flat curve. In the constant-rate deformation stage, the deformation rate stabilises while the geotechnical structure continues to adjust. Upon entering the accelerated deformation stage, a marked increase in the displacement rate is observed, signifying that the landslide mass is on the verge of instability. This stage is of critical importance for the implementation of early warning and intervention measures.
The present study introduces the displacement tangent angle α as a discriminating indicator with the objective of quantitatively identifying the deformation stages of landslides. The displacement tangent angle is defined as the angle between the tangent line at a specific point on the cumulative displacement–time curve and the positive direction of the time axis. Its mathematical expression is as follows:
α = a r c t a n ( d s d t )
In this equation, S represents cumulative displacement, while t denotes time. This angle reflects both the displacement rate and acceleration information, thus serving as a key parameter for characterizing the dynamic evolution of landslides. Previous studies have demonstrated that the displacement tangent angle is closely related to the internal stress state and the stability of the landslide body, rendering it an important indicator for landslide early warning. In their study on rainfall-induced landslides, Wei et al. [26] established the tangent angle as a quantitative indicator for heavy rainfall warning levels. However, the existing 3–4 level warning models, developed primarily for single lithological settings, inadequately address the characteristics of western Sichuan red-bed landslides, which exhibit “multi-stage slow deformation susceptible to rainfall triggering”. As demonstrated by Zhen et al. [27] in the Three Gorges Reservoir area, water-induced softening in red-bed strata produces a distinct five-phase evolution: initial slow deformation, uniform adjustment, initial acceleration, uniform acceleration, and accelerated instability. Conventional classification standards do not account for the critical transition from initial to uniform acceleration. This study proposes a five-level warning model optimized for the Kuyaogou landslide, tailored to enable precise risk identification through refined acceleration-phase thresholds.
Consequently, this paper proposes an optimized five-level early warning model, integrating the actual deformation characteristics of the Kuyaogou landslide and building upon existing landslide early warning classification research. By refining the classification thresholds for the acceleration phase, precise identification and tiered management of landslide risks are enabled. The specific classification criteria are detailed in Table 3.
The selection of 45° as the tangent angle threshold is theoretically grounded in the physical significance of deformation stages within landslide creep theory. According to the refined tangent angle method proposed by Xu Qiang et al. [28], the slope displacement–time curve exhibits a three-stage evolutionary pattern: initial deformation, constant-rate deformation, and accelerated deformation. When α < 45 ° , displacement rates gradually decrease, indicating that the slope is in the initial deformation or deceleration adjustment phase. When α 45 ° , displacement rates remain constant, corresponding to the constant-rate creep stage, during which time internal stress conditions are relatively stable. When α > 45 ° , displacement rates begin to increase, signalling entry into the accelerated deformation stage. Therefore, 45° represents the critical transition point at which landslide deformation shifts from ‘deceleration/constant velocity’ to ‘acceleration’, marking the boundary between stable and potentially unstable states. Based on this theoretical framework, this study uses 45° as the threshold for blue (caution) and yellow (warning) alerts, achieving precise multi-stage classification of slow landslide deformation in red-bed areas of western Sichuan.

2.5. Evaluation Metrics

To evaluate the predictive performance of the Transformer–Attention–LSTM hybrid architecture, the following evaluation metrics were selected: the coefficient of determination ( R 2 ), mean absolute error (MAE), and root mean square error (RMSE). The formulas are as follows:
R 2 = 1 i = 1 n x ^ i x i 2 i = 1 n x ¯ x i 2
M A E = 1 n i = 1 n | x ^ i x i |
R M S E = 1 n i = 1 n x ^ i x i 2
where x i represents the true value, x ^ i denotes the predicted value, x ¯ signifies the mean of the true values, and n indicates the number of samples. Lower values of MAE, and RMSE, along with a R 2 closer to 1, indicate higher model prediction accuracy.

3. Experiments and Results

3.1. Experimental Environment

All models in this study were executed within the same experimental environment. The experiment was conducted on a 64-bit Windows 11 platform, with hardware equipped with an Intel Core i7-11800H@2.3GHz processor and a software environment comprising Python 3.10.7 and PyTorch 2.0.1. The parameter settings are presented in Table 4.

3.2. Results

This study proposes a Transformer–Attention–LSTM hybrid prediction model that combines the multi-head global attention mechanism of Transformers with the sequential modeling capabilities of LSTMs. This combination aims to improve the accuracy and interpretability of displacement prediction for complex geological processes, such as landslides. To systematically evaluate the model’s performance, a series of comparative experiments was designed to provide a comprehensive evaluation of the test samples across critical metrics, including R2, root mean square error (RMSE), and mean absolute error (MAE). The detailed experimental results are presented in Table 5.
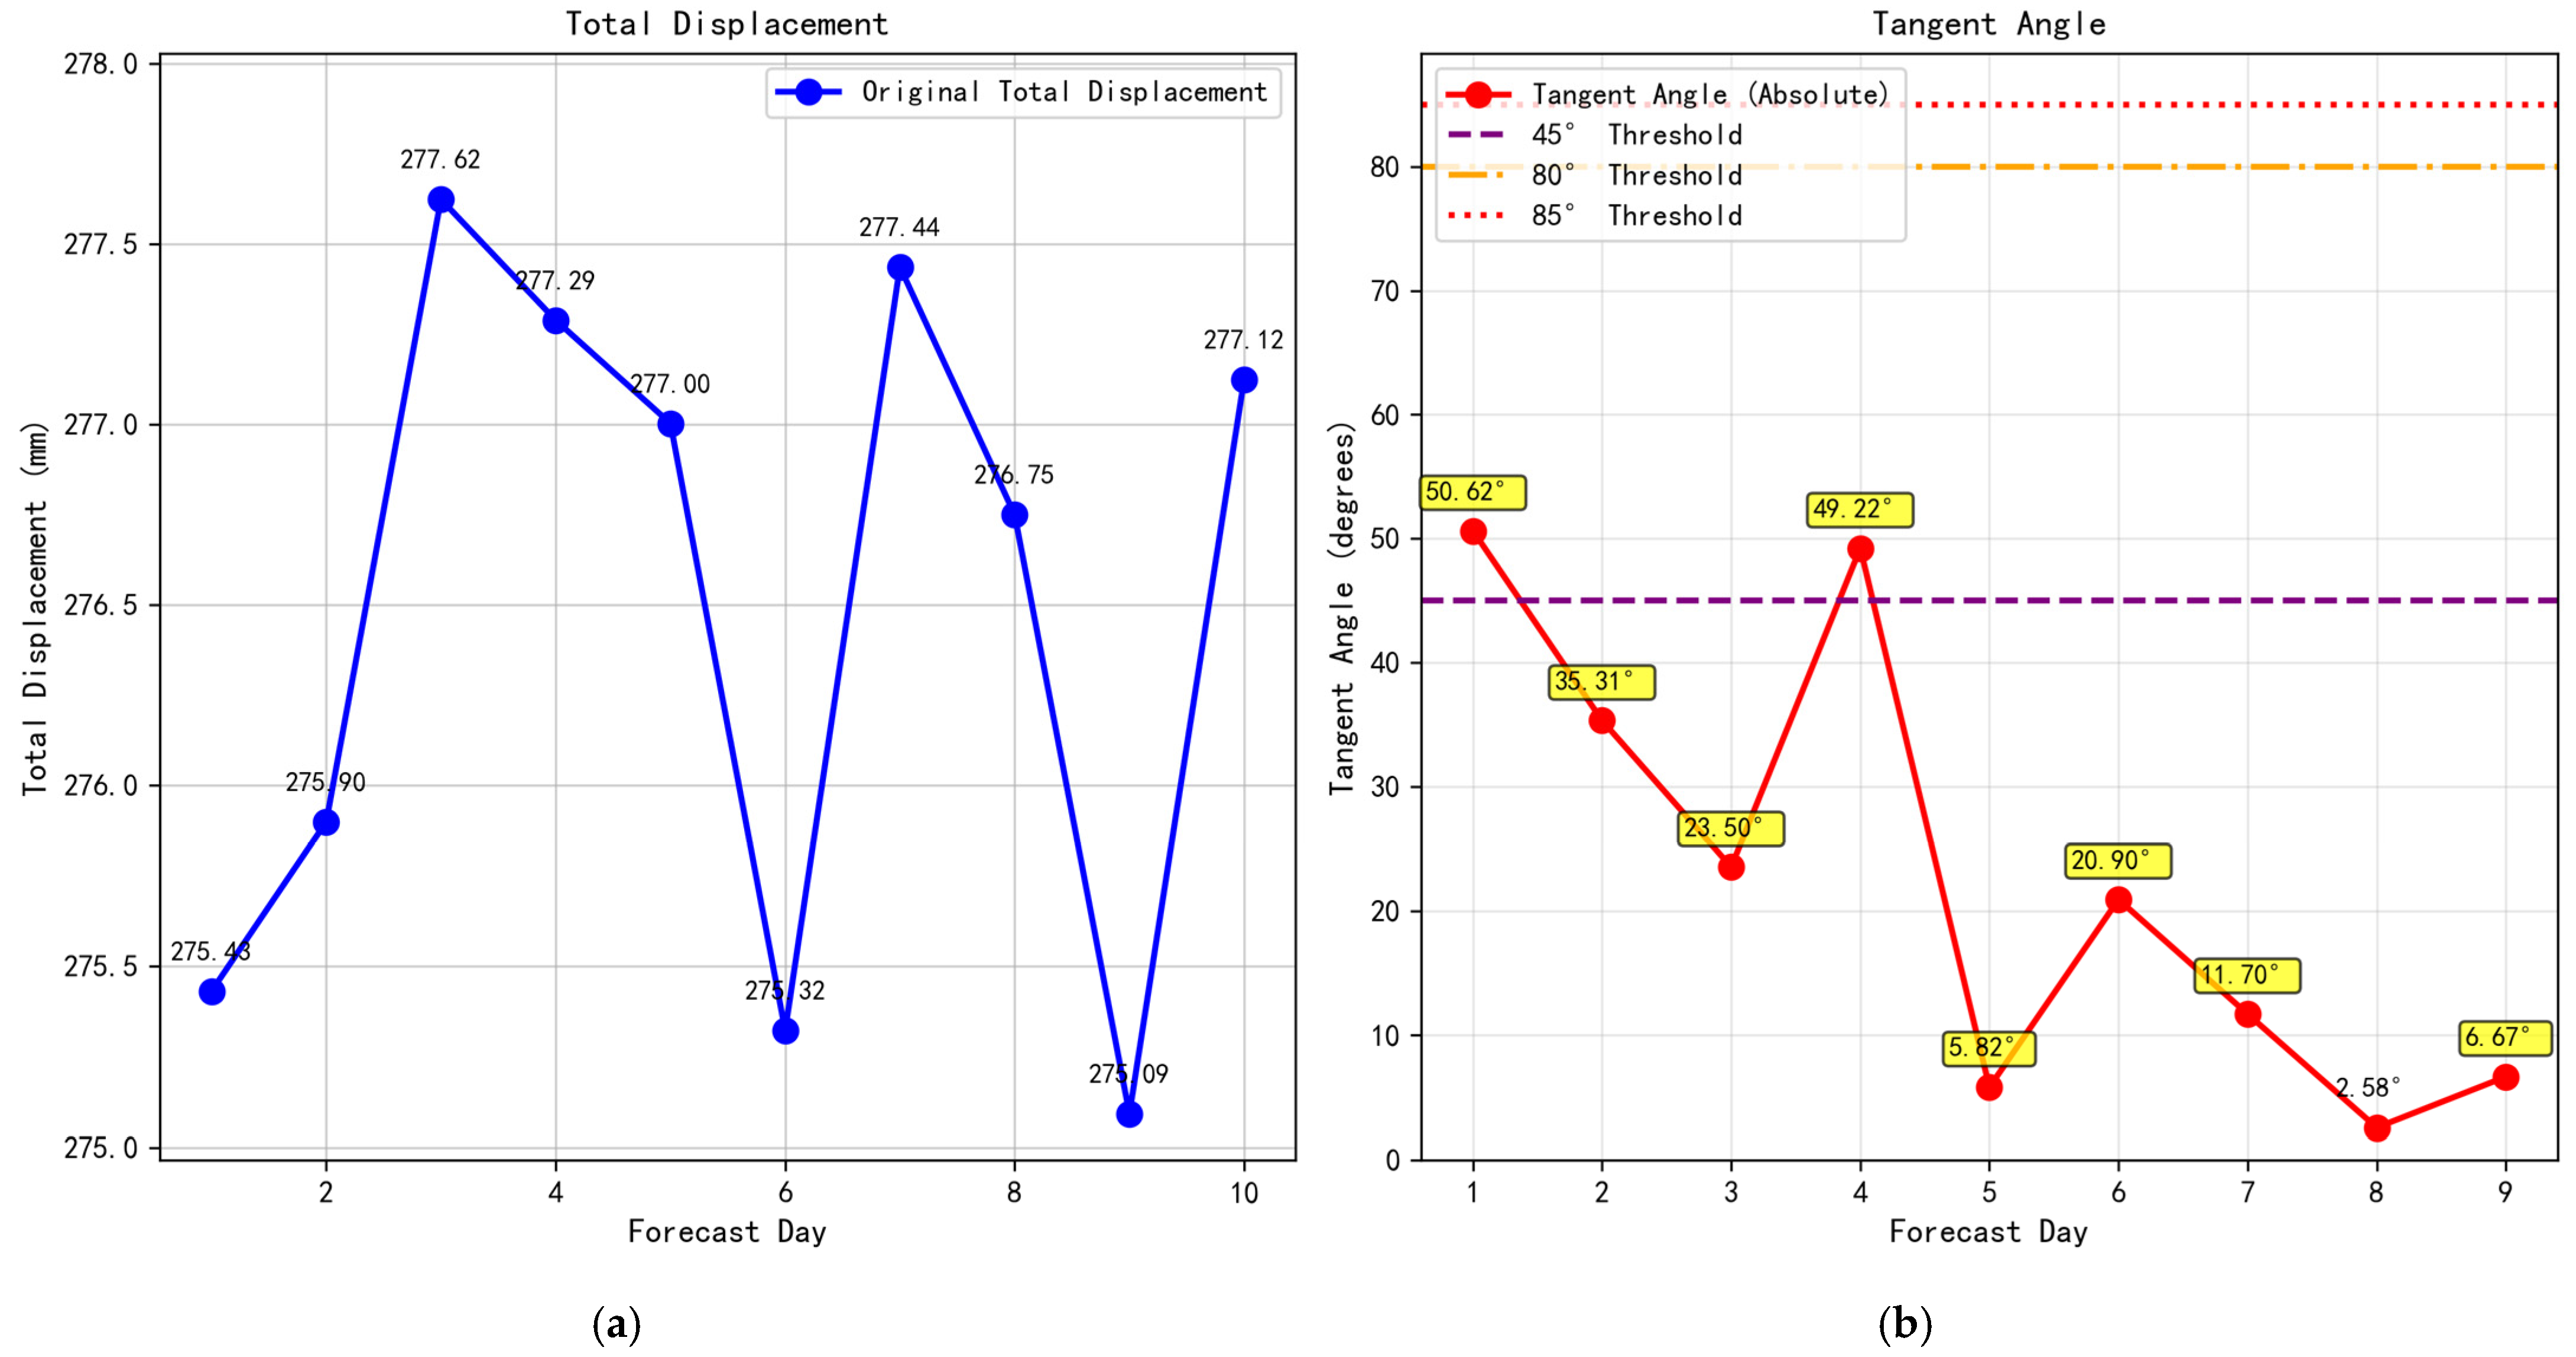
Based on this methodology, a predictive analysis of the displacement evolution trend for the Kuyaogou landslide over the next 10 days was conducted. The specific values of key indicators, including displacement magnitude and tangent angle, are detailed in Table 6. To further visualize the changes, Figure 9 presents the cumulative displacement–time curve and the corresponding tangent angle evolution characteristics.

4. Discussion

4.1. R2 Analysis of the Transformer–Attention–LSTM Architecture

The Transformer–Attention–LSTM hybrid architecture developed in this study demonstrates remarkable performance in displacement prediction for complex geological processes. As shown in Table 5, the model achieves an average R2 of 0.948 across the X, Y, and Z axes, with a root mean square error (RMSE) of 9.23 mm and a mean absolute error (MAE) of 7.17 mm. These results indicate that the model outperforms all competing models. Compared to the second-best-performing Attention–LSTM model (average R2 = 0.925, RMSE = 13.46 mm, MAE = 10.06 mm), the proposed model improves average R2 by 2.5% and reduces average RMSE by 31.4% and average MAE by 28.7%, representing a substantial advancement in prediction accuracy.
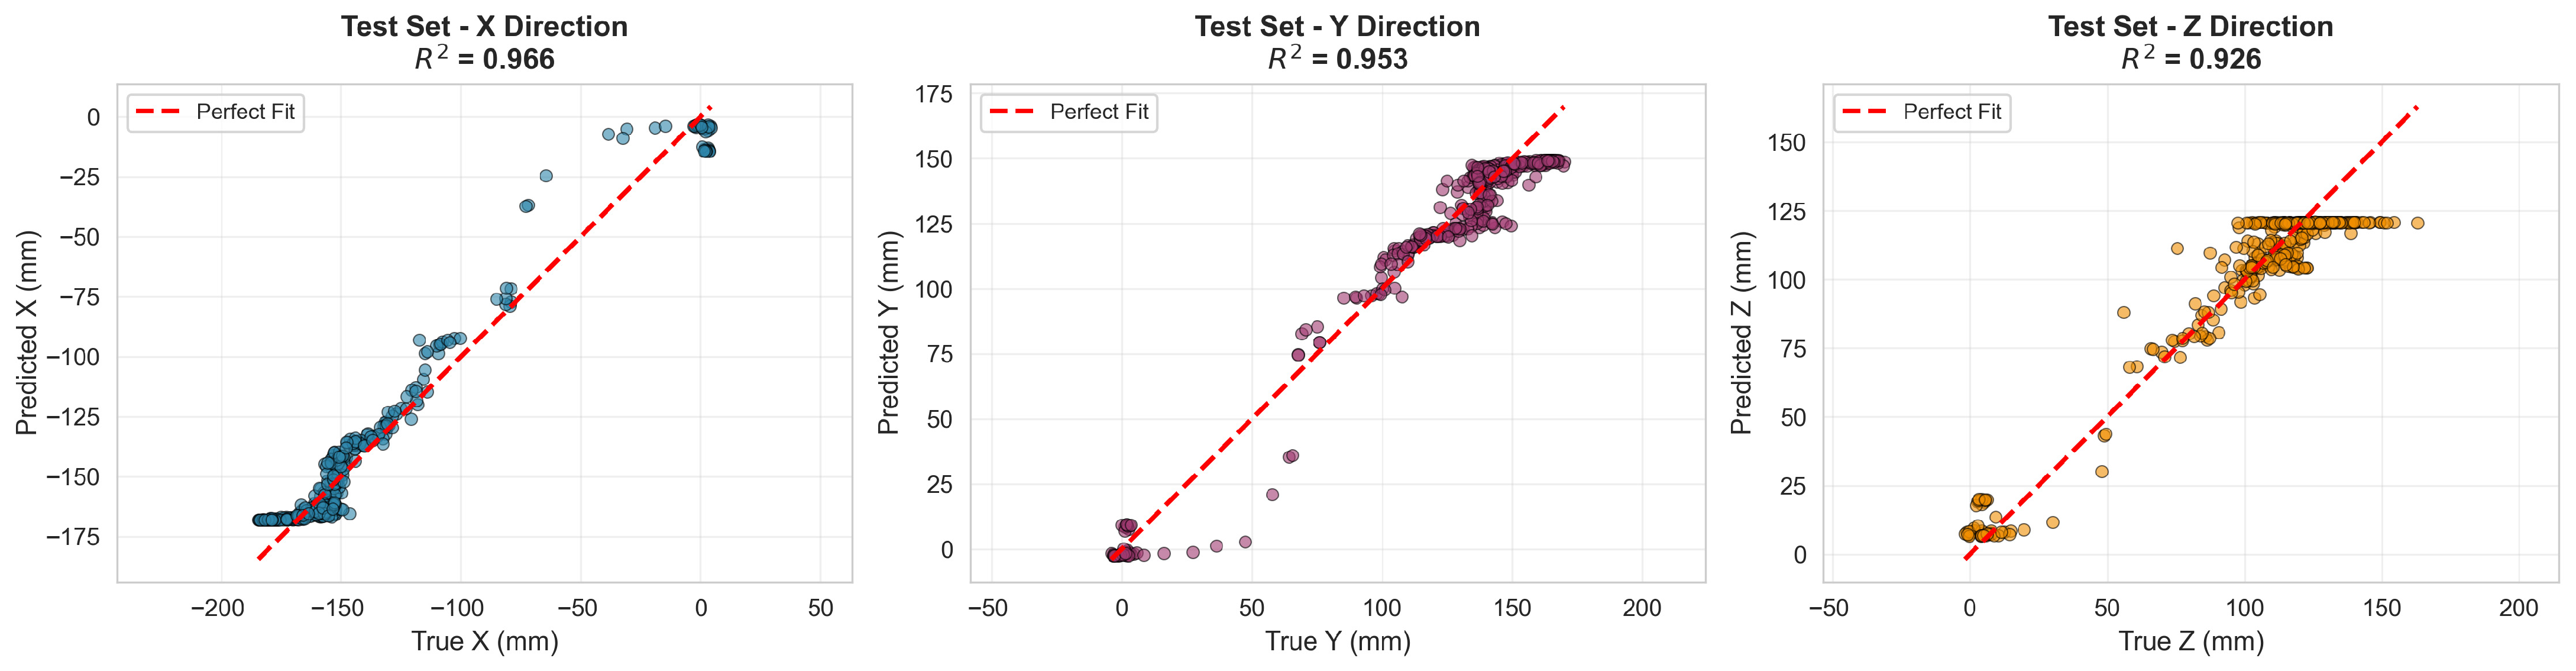
Regarding directional performance, the model exhibits consistent and superior performance across all three spatial dimensions, as illustrated in Figure 10. The R2 value reaches 0.966 in the X direction, indicating excellent prediction; 0.953 in the Y direction demonstrates robust fitting capability; and even in the most challenging Z direction, the R2 attains 0.926, considerably surpassing the prediction levels of conventional methods. This cross-directional consistency demonstrates the model’s strong generalization ability and robustness, enabling it to adapt to the complex variation patterns of landslide displacement across different spatial dimensions.

4.2. RMSE Analysis of the Transformer–Attention–LSTM Architecture

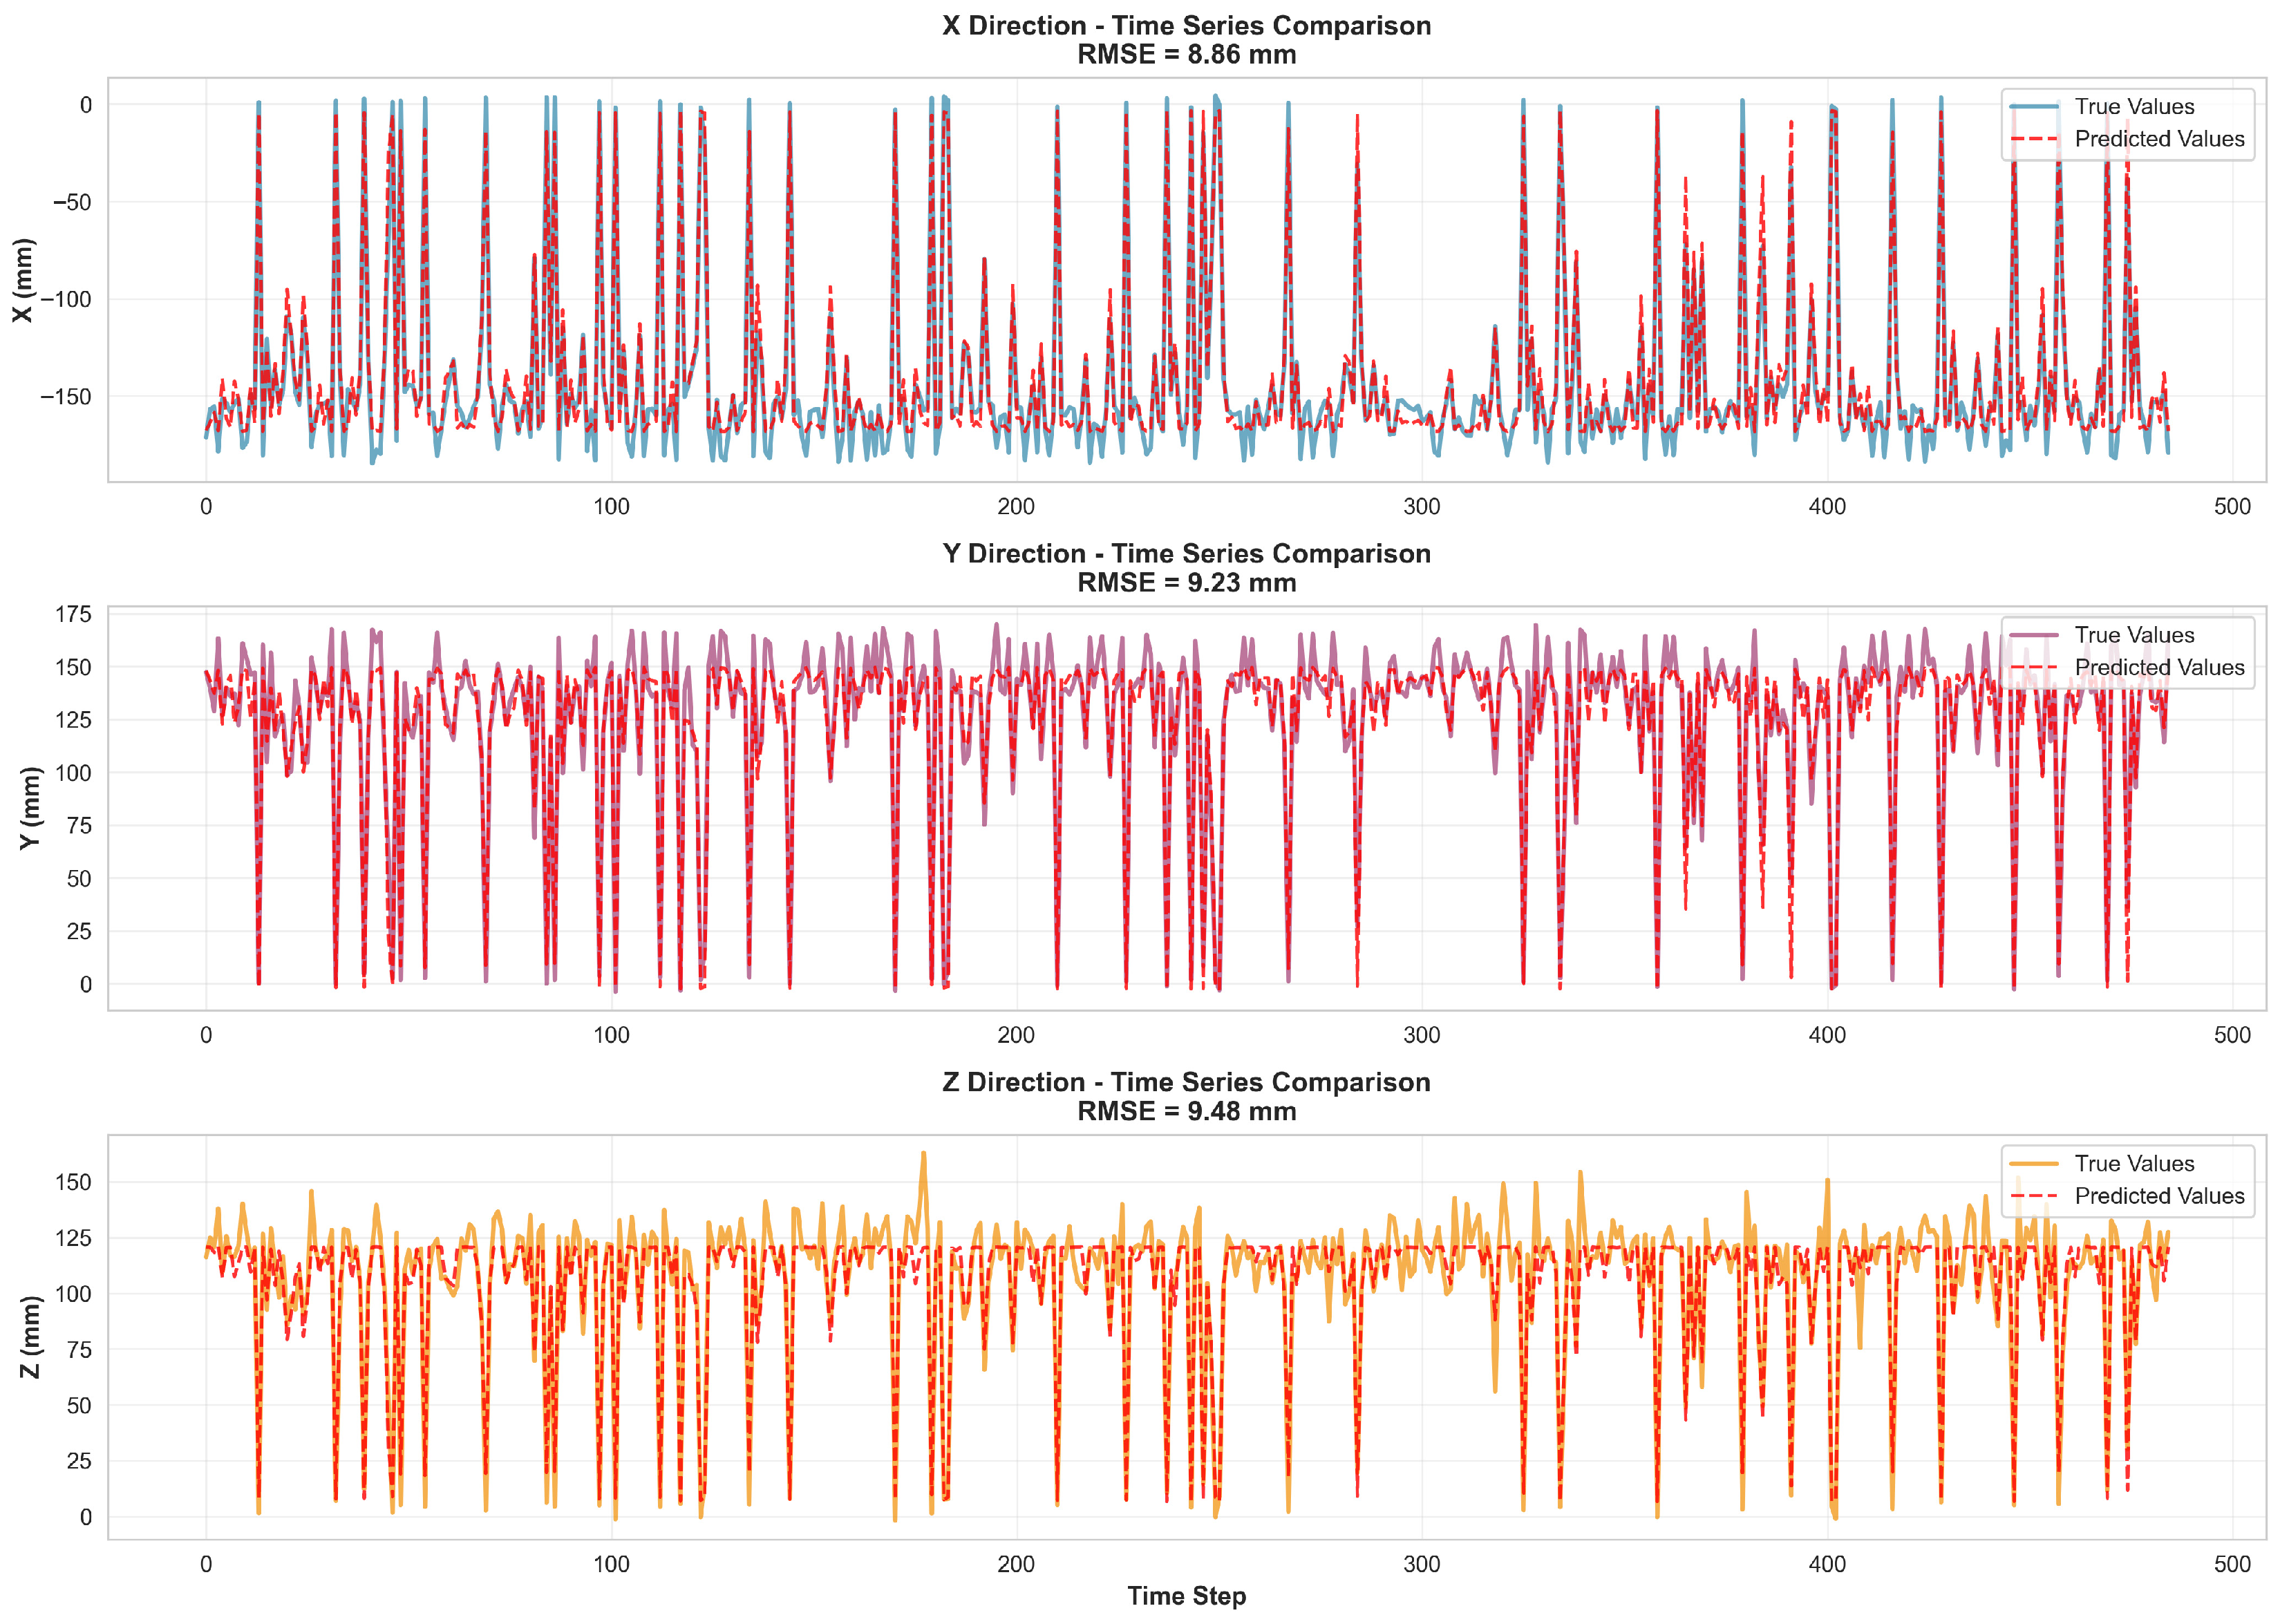
In terms of root mean square error (RMSE), the model demonstrates remarkable error control capabilities. The RMSE values are 8.864 mm in the X direction, 9.234 mm in the Y direction, and 9.480 mm in the Z direction, with an average RMSE of 9.23 mm across all three dimensions (Figure 11). This substantially outperforms competing models. Compared to the Attention–LSTM model (average RMSE = 13.46 mm), the proposed model reduces prediction errors by 31.4%, and achieves a 42.2% reduction over traditional LSTM models (average RMSE = 15.96 mm). This consistently low error performance reflects the model’s accuracy and stability. Lower RMSE values indicate smaller discrepancies between predicted and actual displacement, demonstrating that the model’s predictions are more reliable and consistent. This has substantial practical implications for early warning systems in geological disaster prevention.

4.3. Attention Weight Analysis of Transformer–Attention–LSTM Architecture

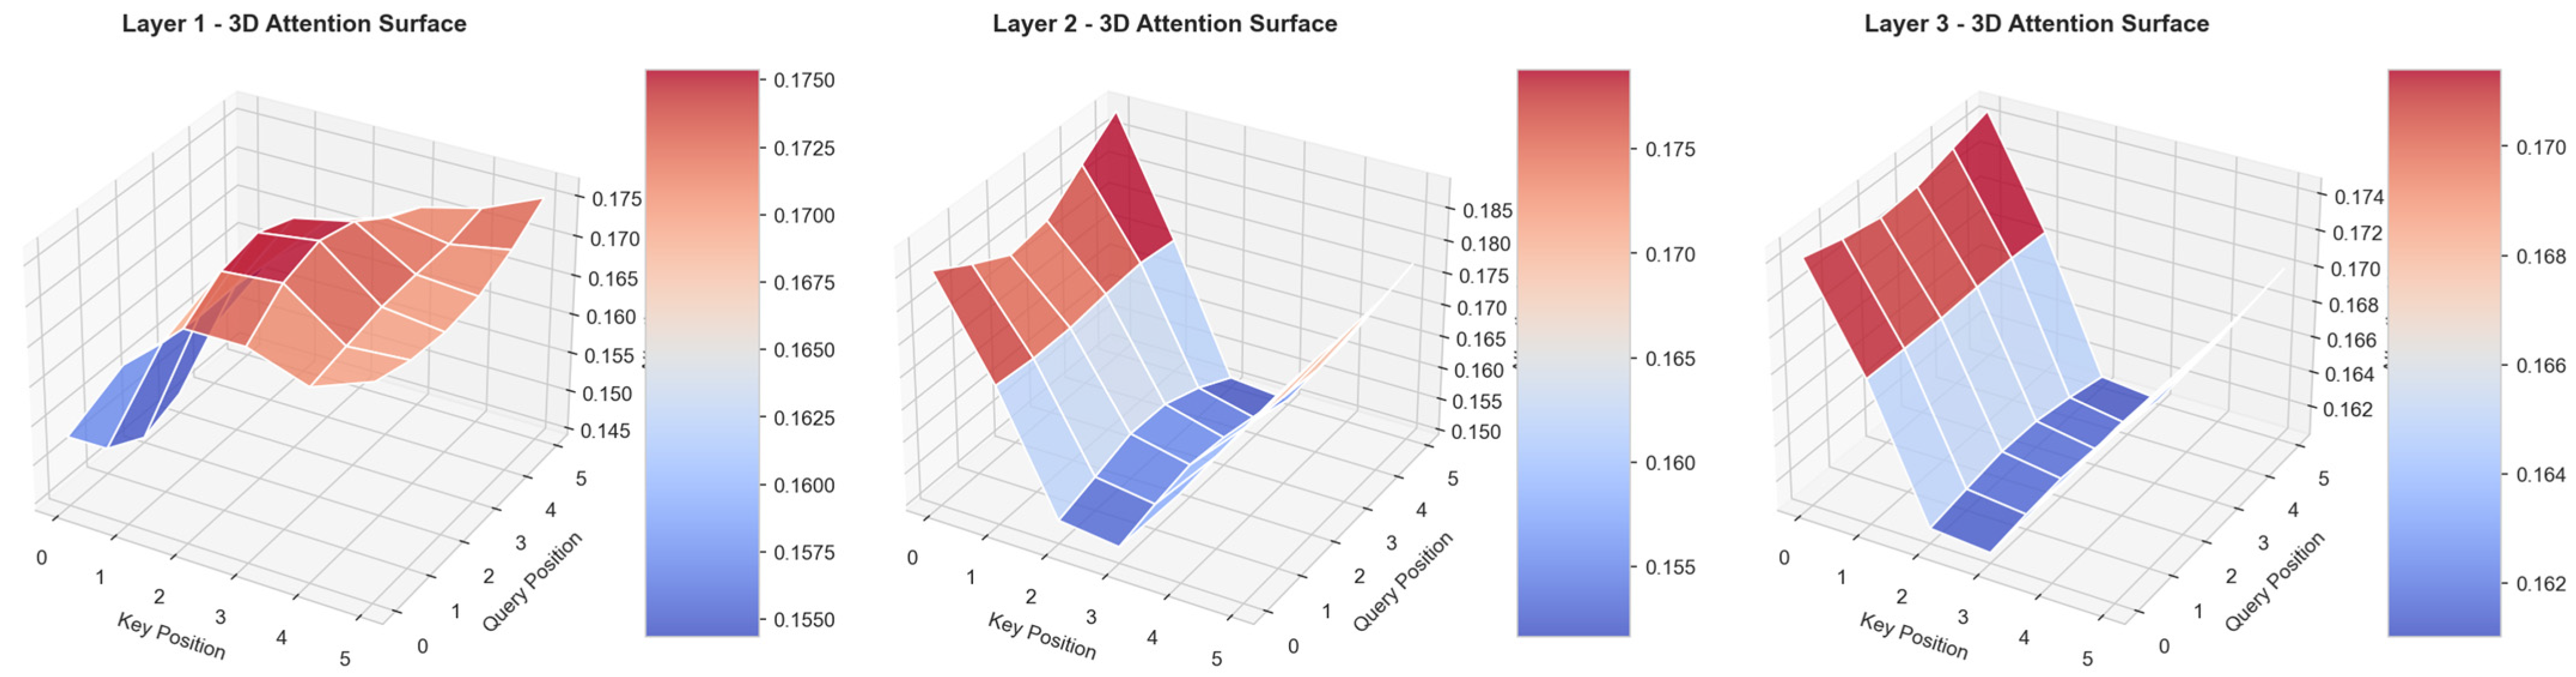
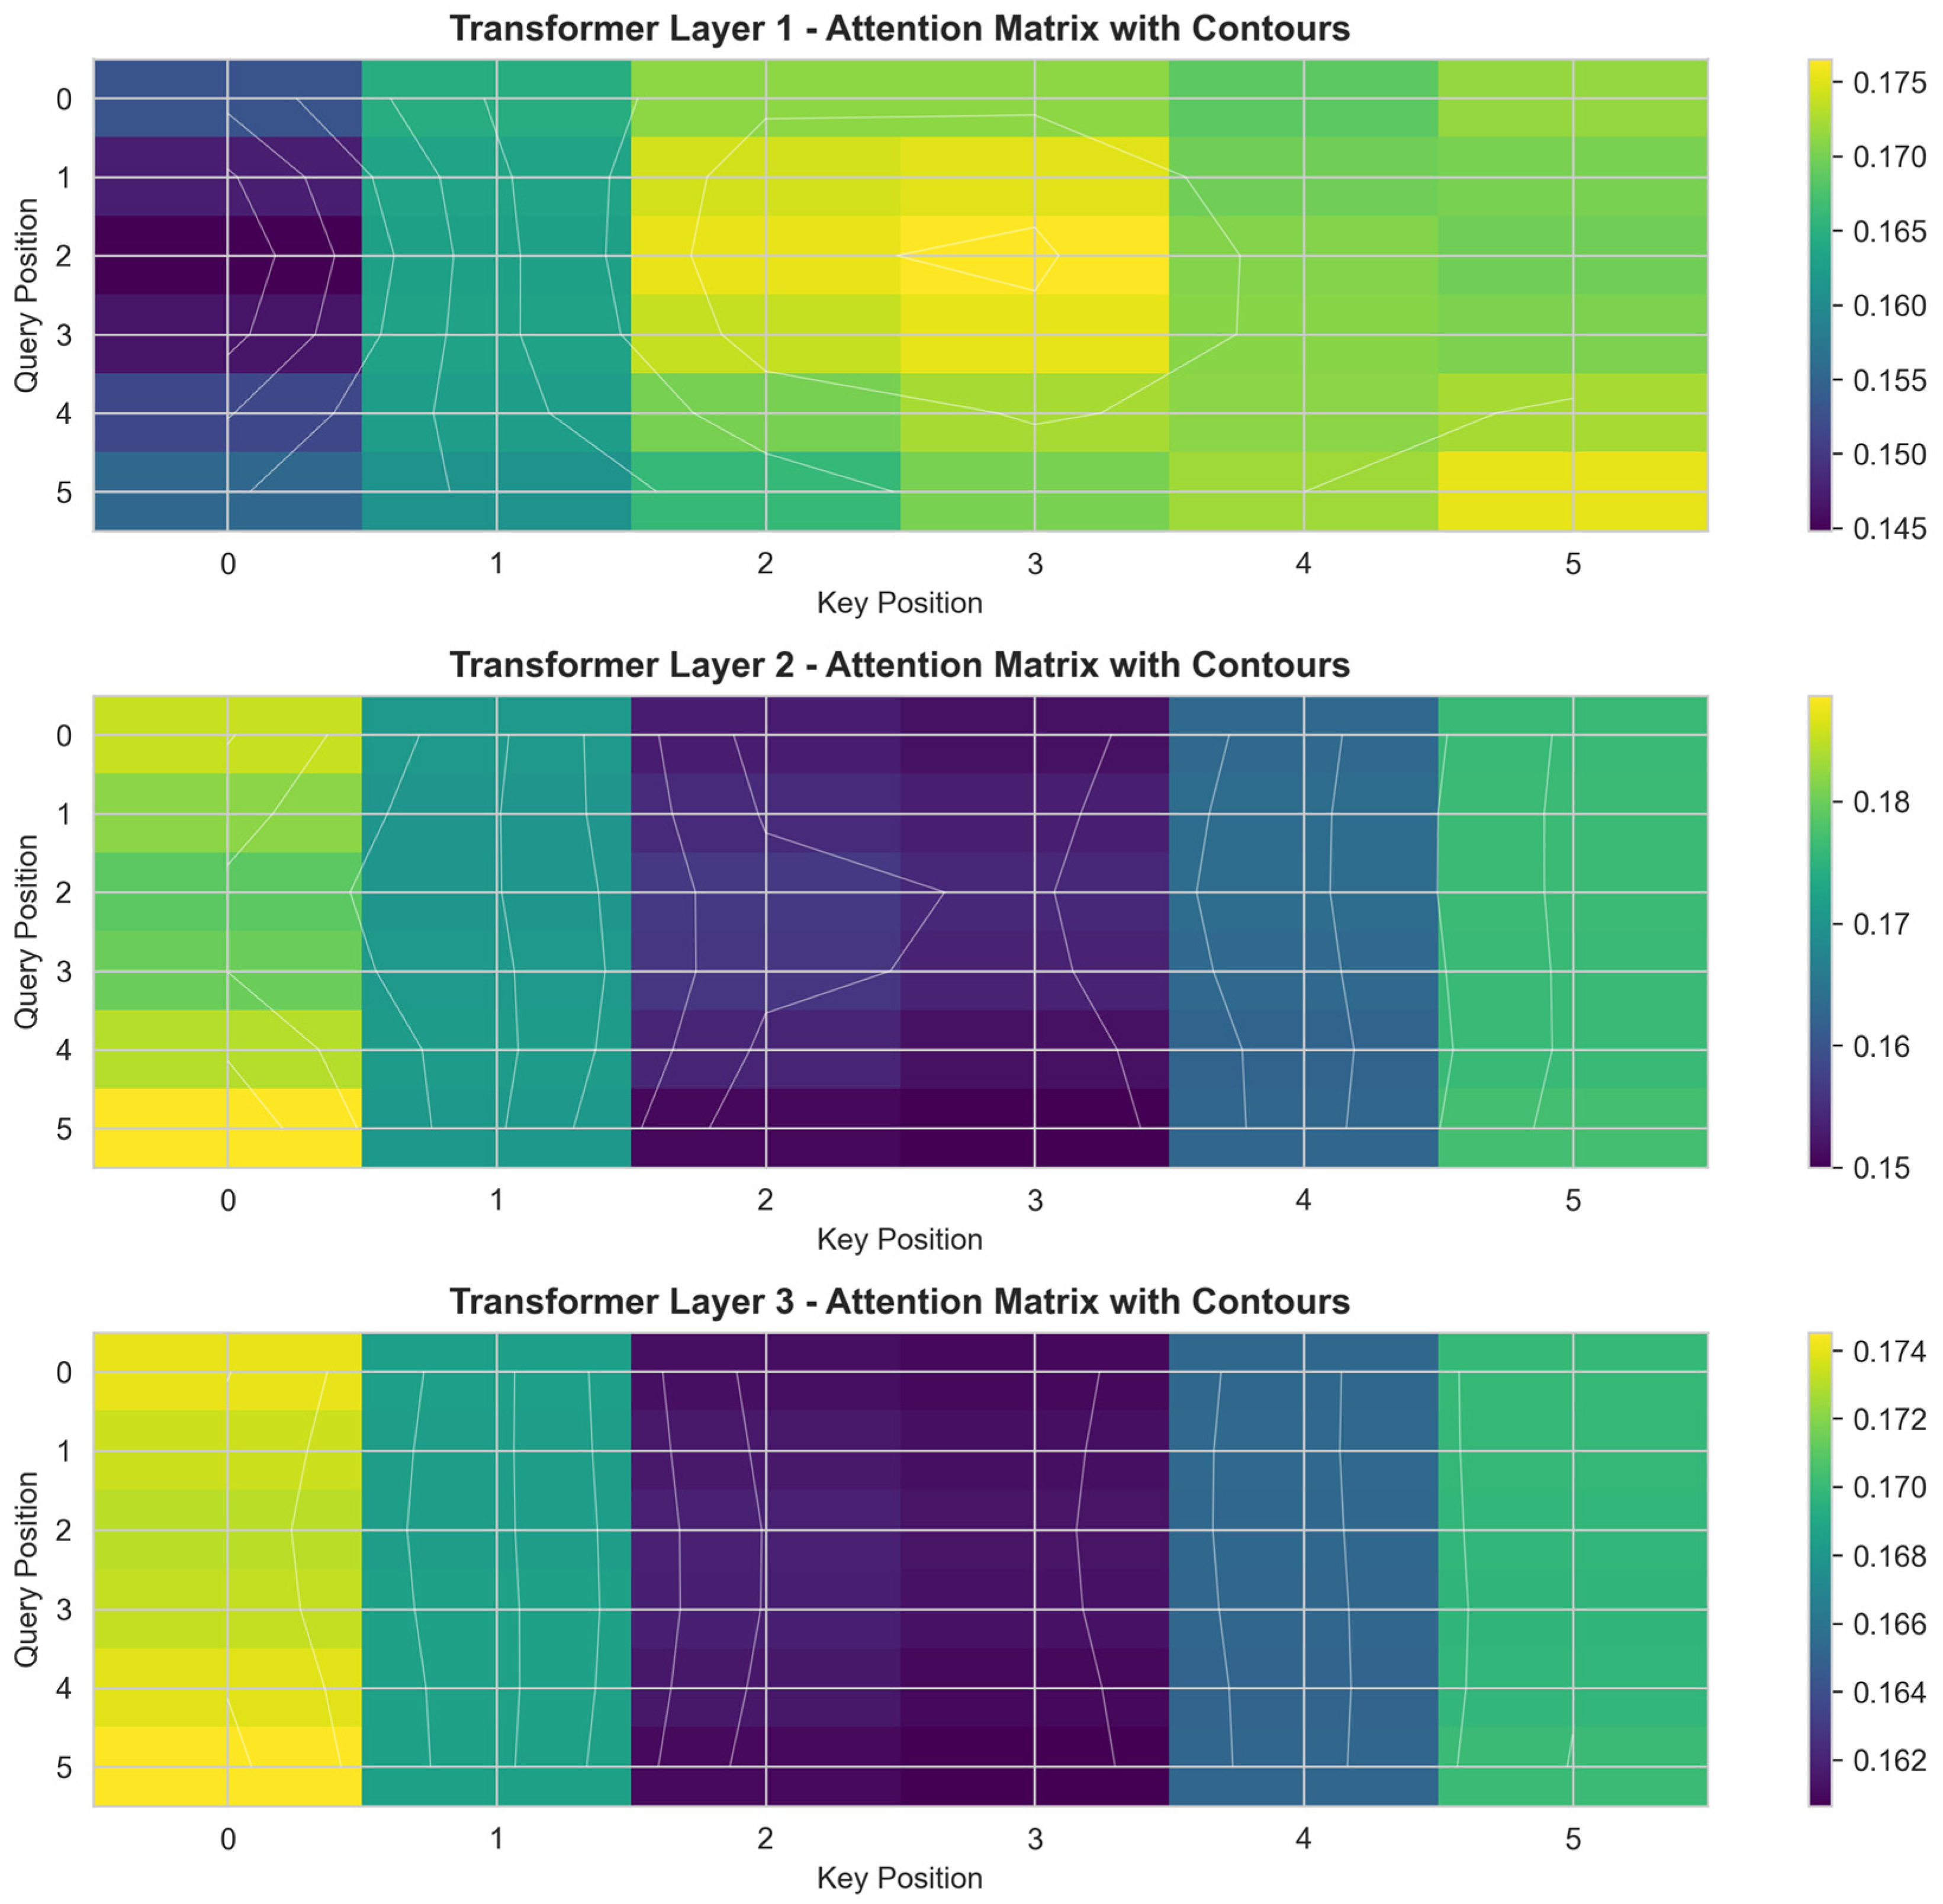
This model integrates the global attention mechanism of Transformers with the local temporal modeling capabilities of LSTMs. The former eliminates long-term memory decay through multi-head self-attention, while the latter refines short-term fluctuations via gating mechanisms, with an intermediate attention layer enabling cross-scale weight redistribution. The three-tiered evolution depicted in Figure 12 and Figure 13 presents a pragmatic “slippery spatiotemporal attention” paradigm. The base layer captures short-term micro-movements of displacement sequences through a broad diagonal peak-valley range of 0.145–0.18. The middle layer employs steep vertical stratification to enable Query 0–2 to specifically target Key 4–5, independently reinforcing the priority sliding plane of “pre-precipitation-lagged displacement”. The top layer compresses dynamic range to 0.162–0.174, flattening the curved surface into dual bands of “long-term accumulation-slippery mutation”, retaining only Key 0–1 and Key 5 as critical tokens to determine weight levels. This three-step progression—from “local temporal sensitivity” to “external factor specialization” and ultimately to “unified key periods”—enables the model to reduce global noise and extrapolate displacement trends using only minimal high-impact moments. Consequently, this reduces the computational load while enhancing sensitivity to sudden instability. With an average weight of 0.111, the displacement feature is significantly higher than other features and is the most attended indicator for the model, with a maximum attention of 0.169. The fracture feature (average 0.056) and precipitation feature (average 0.055) have similar weights, both much lower than that of the displacement feature. However, their maximum attention values are both close to 0.169, indicating that the model focuses on these two types of features at specific moments.

4.4. Creep State Evaluation and Risk Prediction of Kuyaogou Landslide

The Kuyaogou landslide is expected to continue creeping steadily over the 10-day forecast period, with a gradual increase in displacement. Despite the absence of sudden changes, the deformation pattern exhibits substantial complexity. Analysis of the displacement components reveals comparable values in the X and Y directions, indicating a pronounced horizontal sliding characteristic. Conversely, Z-direction displacement fluctuates significantly, with notable vertical adjustments observed on days 3, 7, and 10. This indicates localized tearing occurring concurrently with the slope’s horizontal movement.
Using the tangent angle as the primary diagnostic indicator, the deformation process can be characterized in three phases: ‘fluctuating adjustment—brief acceleration—restored stability’. During the initial phase (days 1–4), the tangent angle decreased from 50.6° to 23.5°, exhibiting decelerating adjustment characteristics. On the fifth day, a sudden change was observed, with the tangent angle abruptly rising to 49.2° and the displacement increment in the main slip direction (X) transitioning from negative to positive, indicating a transient acceleration disturbance. In the subsequent phase (days 6–10), the tangent angle decreased abruptly to 5.8° and remained at low levels (2.6–11.7°), well below the 30° acceleration warning threshold. The displacement derivative also fluctuated slightly within ±0.4 mm/d, indicating that the landslide body has re-entered a relatively stable phase of uniform creep. The current maximum tangent angle is 50.6°, which is well below the 80° threshold that is typically associated with imminent-slip warnings. Consequently, the probability of rapid overall movement occurring within the next 10 days is low.

4.5. Coupled Validation of Numerical Simulation and Tangent Angle Prediction with Stability Mechanism Analysis

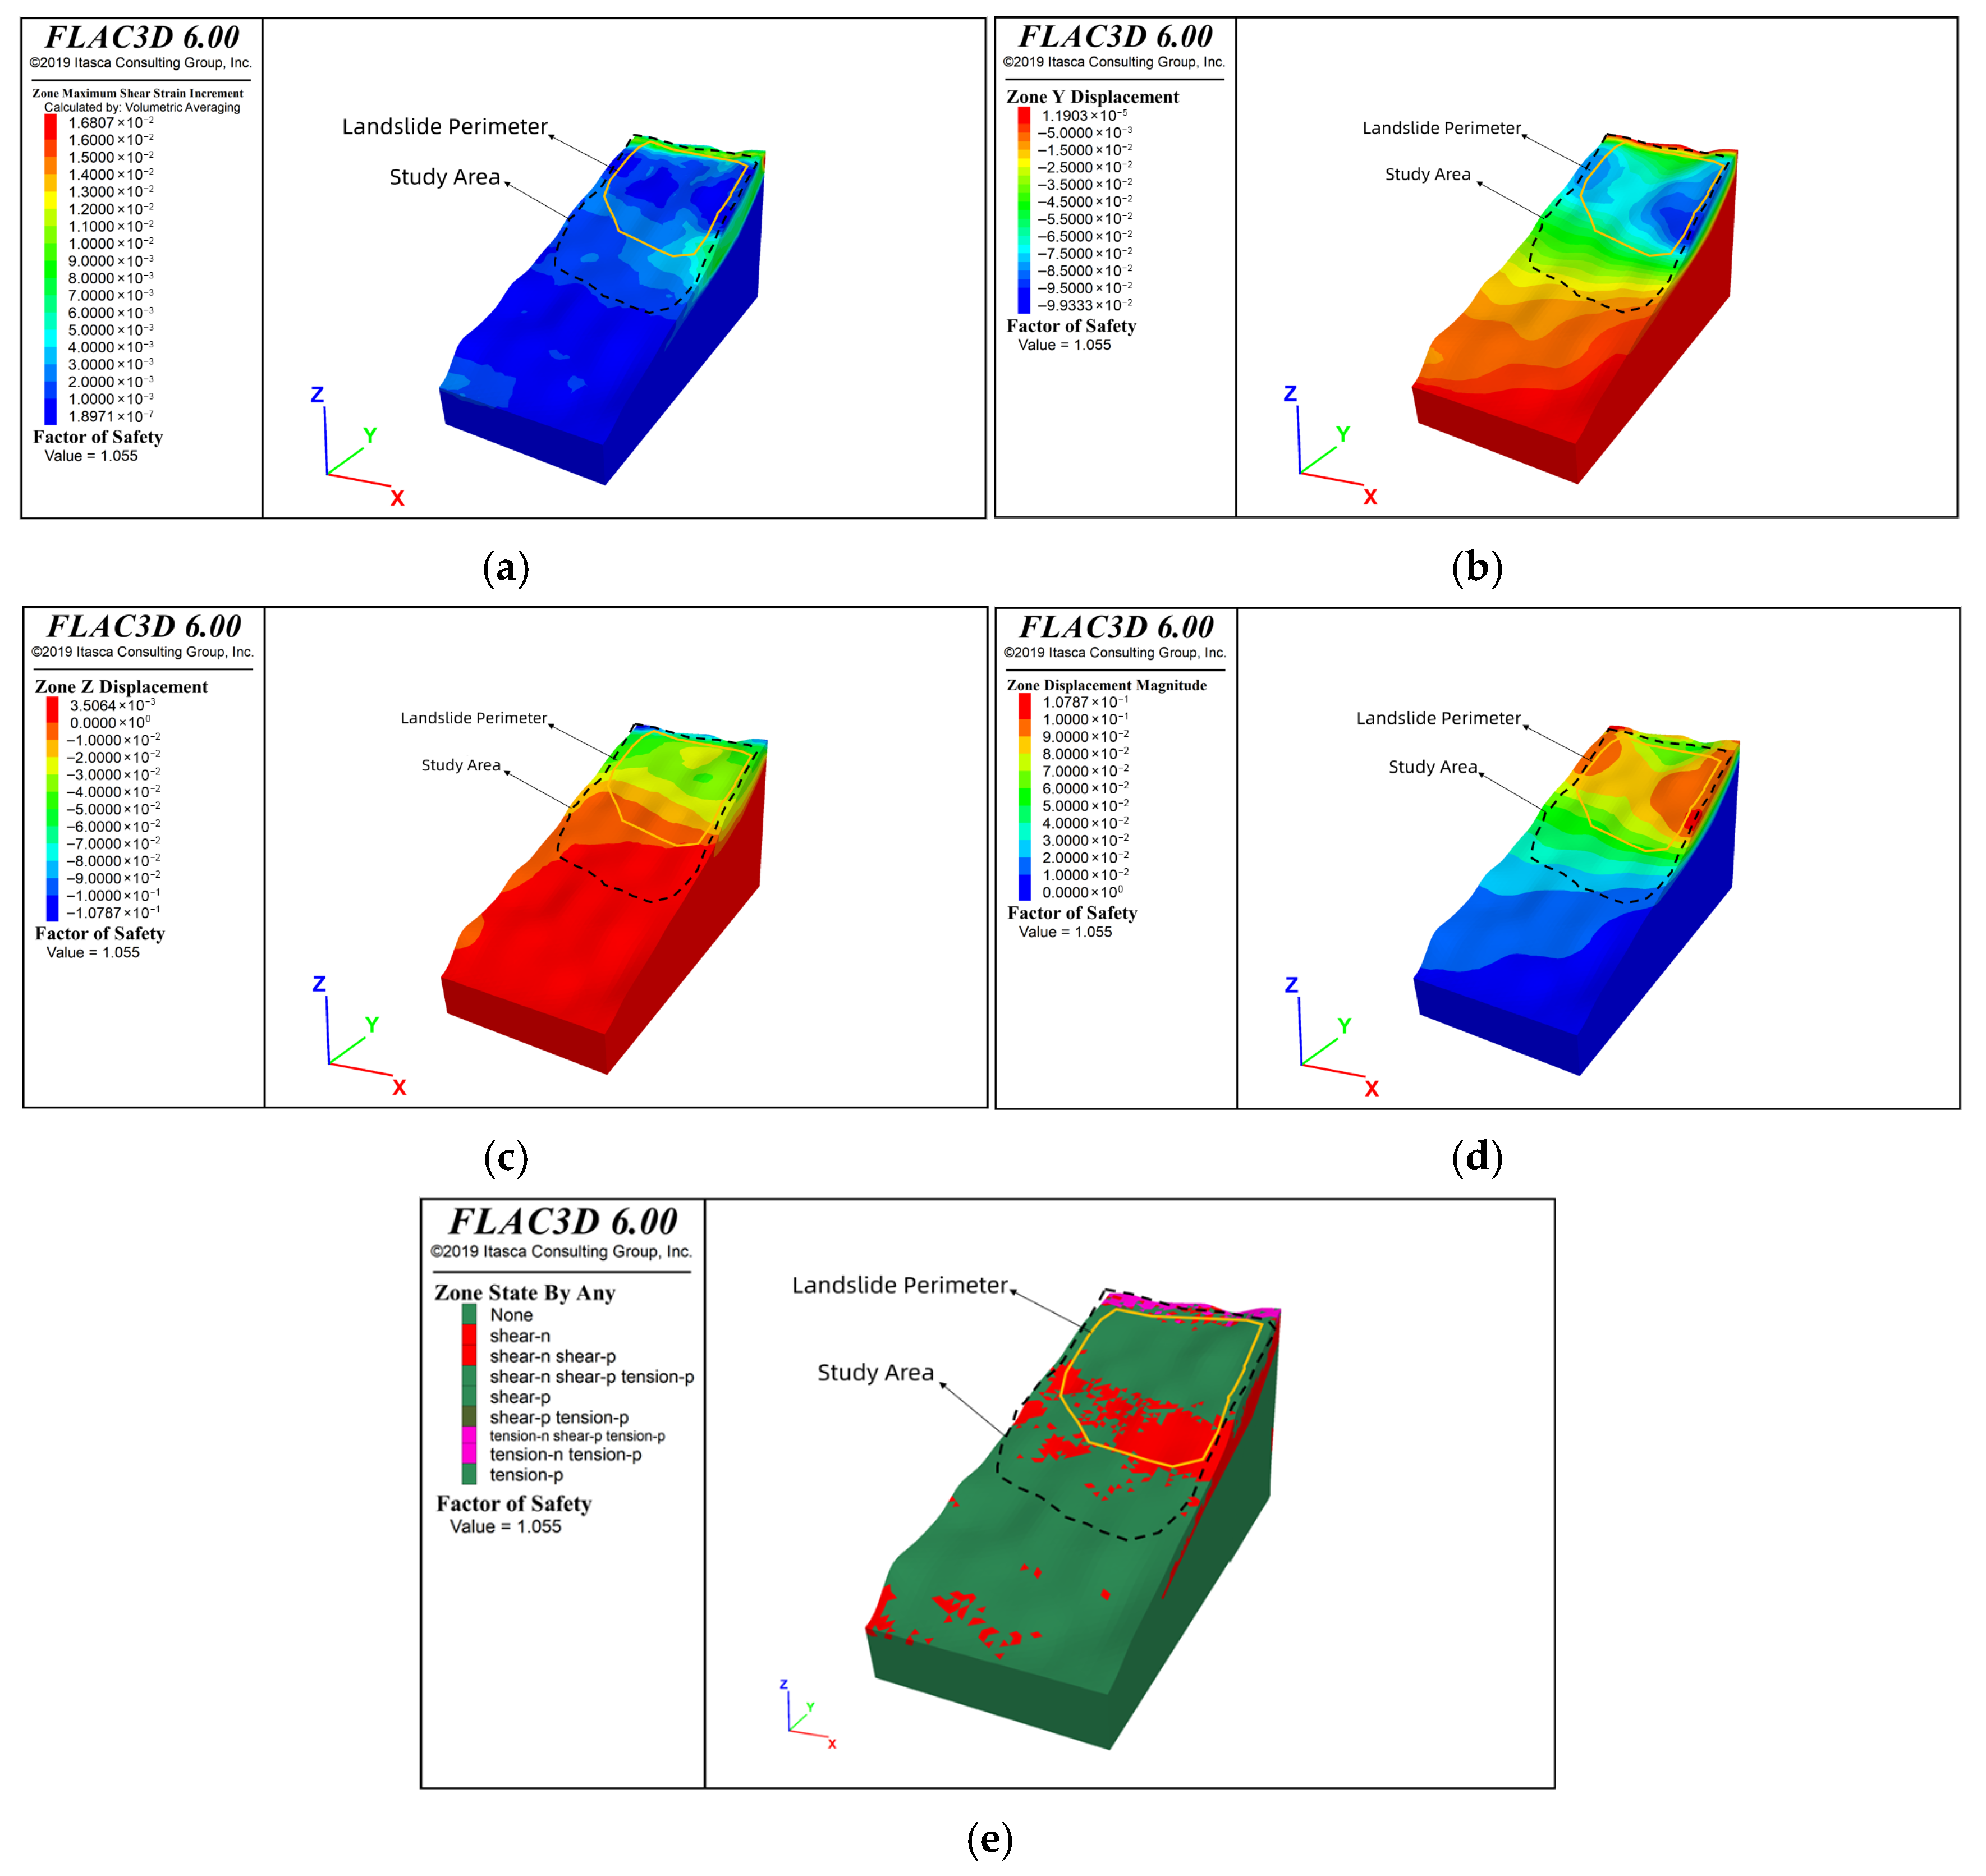
In conditions of heavy rainfall, the physical and mechanical properties of landslide rock and soil deteriorate due to increased self-weight and water-induced softening effects, resulting in reduced effective stress and a significant decline in sliding resistance. As demonstrated in Figure 14, the stability coefficient of the Kuyaogou landslide under heavy rain conditions is 1.055, indicating an overall state of basic stability. However, the shear stress concentration zone at the leading edge of the slide is most susceptible to shear failure, with the region exhibiting the greatest displacement changes and therefore likely to fail first. Numerical simulations demonstrate that strain is increasing steadily within the landslide. The slip surface is located at the interface of the gravelly silt clay layer. Following instability, the total displacement reaches 0.10 m, accompanied by a vertical drop of 0.11 m, indicating a propensity to evolve into a translational landslide. The plastic deformation zone shows that, although the slope remains stable overall, extensive localized shear failure occurs at the leading edge, accompanied by tensile cracks at the trailing edge, with the basal slip surface beginning to emerge.
The numerical simulation results corroborate displacement predictions based on the tangent angle. A sharp rise in tangent angle to 49.2° on day 5 and pronounced vertical displacement fluctuations in the Z-direction (days 3, 7, 10) indicate localized stress adjustments within the slope and potential shear failure risks. Further analysis of shear strain increments and displacement contour plots reveals that displacement responses are most pronounced within the shear stress concentration zone at the leading edge during heavy rainfall events. This coupled analysis demonstrates that the tangent angle, used as a macro-deformation indicator, effectively captures displacement responses triggered by internal stress evolution within the landslide. This provides a reliable physical basis for assessing landslide stability under heavy rainfall conditions.

4.6. Limitations

Although the lightweight Transformer–Attention–LSTM hybrid framework proposed in this study demonstrates promising performance in landslide displacement prediction, it still exhibits inherent limitations that must be objectively acknowledged. These limitations are closely related to data processing, methodology, technical approaches, and engineering applications, which provide critical insights for enhancing the framework’s robustness, generalizability, and practical engineering value. The specific limitations are as follows:

4.6.1. Data-Related Limitations

This study primarily relies on a single monitoring dataset for the Kuyaogou landslide (June 2024–November 2025). Although the dataset is relatively comprehensive, it presents two critical limitations. First, temporal data uncertainties (sensor noise, data gaps, unrecorded environmental disturbances) remain inevitable in geological monitoring practice. However, the current study fails to explicitly quantify prediction-related uncertainties (e.g., prediction intervals), which limits the reliability of risk communication based on point predictions. Second, spatial variability in geotechnical materials and differences in triggering factors are inadequately addressed. Significant variations in geological conditions, geomechanical properties, and rainfall thresholds across different red-bed regions result in pronounced spatial heterogeneity in landslide evolution characteristics and early warning criteria. Consequently, while the model demonstrates excellent performance for the Kuyaogou landslide, its direct transferability to other red-bed landslides without recalibration would be constrained, thereby limiting the spatial generalizability of research findings.

4.6.2. Methodological Limitations

The model exhibits three primary limitations: Firstly, the multi-source data fusion employs a simplistic feature concatenation strategy that fails to fully leverage the spatiotemporal heterogeneity of data, making it difficult to capture complex interactions among factors and thus limiting further improvements in prediction accuracy. Secondly, the model operates as a data-driven ‘black box’ with limited integration of physical mechanisms. The tangent angle used for evolutionary phase identification is merely a post-processing step lacking physical constraints, which reduces the model’s extrapolation capability and interpretability. Thirdly, the application of sensitivity analysis methods necessitates standardization. Implicit analysis relying on the Attention weights is not a substitute for formal sensitivity analysis methods, which require systematic quantification of the impact of input perturbations on outputs.

4.6.3. Technical and Comparative Limitations

From a technical implementation perspective, while the lightweight design of the model delivers computational efficiency advantages, it also imposes limitations on model capacity. This may impede the model’s capacity to adequately characterize the nonlinearity of landslide displacement and intricate evolutionary mechanisms, particularly when processing voluminous and heterogeneous datasets. Furthermore, comparative analyses with other scholarly methodologies require further refinement. Despite incorporating multiple comparative models (ridge regression, lasso regression, elastic net regression, LSTM, and Attention–LSTM), systematic comparisons with recently advanced landslide displacement prediction methods remain inadequate, which may affect the clarity of the study’s positioning within existing research frameworks.

4.6.4. Limitations in Geological and Engineering Applications

The current study focuses primarily on modelling the relationship between rainfall, cracks and displacement. However, insufficient consideration is given to the spatial distribution of geotechnical materials. Soil type, clay sensitivity and underground topographical features represent significant factors influencing landslide stability. However, these geological parameters have not yet been incorporated into the model as physical constraints or additional input features. This inherent limitation restricts the model’s capacity to adapt to complex geological environments.

4.7. Future Research

4.7.1. Enhancing Multi-Source Data Fusion and Uncertainty Quantification

We will delve into parallel hybrid architectures and cross-modal attention mechanisms for multi-source data fusion, introduce deep integration learning or Bayesian neural networks to quantify prediction uncertainty, and investigate advanced dynamic normalization techniques to balance the preservation of physical meaning and the speed of model convergence.

4.7.2. Constructing a Physically Informed Model Architecture

A physically informed neural network will be constructed by incorporating physical laws and geotechnical engineering criteria (such as the tangent angle) into the loss function. This enables end-to-end optimization for displacement prediction and evolution stage identification, thereby enhancing the model’s extrapolation capability and interpretability.

4.7.3. Standardization of Sensitivity Analysis and Model Comparison

Standardized sensitivity analysis methods from relevant literature will be employed to quantify the impact of input disturbances on output variance, with detailed elaboration on the parameters of the weight database. Concurrently, systematic comparisons with advanced methodologies will be expanded to clarify the positioning of this study in the existing research landscape.

4.7.4. Integration of Spatial Geological Information and Model Generalization

By integrating spatial geological information into the model framework and incorporating physical constraints related to the spatial distribution of geotechnical materials, the model’s adaptability to complex geological environments can be enhanced. To address the spatial variability of landslide conditions, the proposed framework will be validated across multiple landslide cases with diverse geological and geotechnical characteristics.

4.7.5. Model Optimization and Deployment for Engineering Applications

We will develop dynamic update and filtering mechanisms for the model to accommodate temporal updates of monitoring data, and deploy and test the model on edge computing devices to enable real-time on-site monitoring, thereby facilitating the translation of the model from theoretical research to engineering practice.

5. Conclusions

To address the real-time monitoring requirements for loess landslides, this study proposes a lightweight Transformer–Attention–LSTM hybrid architecture. Experiments demonstrate that this model achieves optimal accuracy in three-dimensional displacement prediction, with R2 values of 0.966, 0.953, and 0.926 for the X, Y, and Z directions, respectively, yielding an average R2 of 0.948. The proposed model shows a 3.9%, 2.8%, and 3.7% improvement over the second-best Attention–LSTM model. In addition, the root mean square error (RMSE) and mean absolute error (MAE) are reduced to 9.23 mm and 7.17 mm, respectively. Building on this, the study integrates displacement prediction results with the tangent angle physical criterion, enabling quantitative identification of landslide evolution stages. Tangent angle analysis indicates that the Kuyaogou landslide will continue to creep uniformly over the next 10 days, with a maximum tangent angle of only 50.6°, well below the 80° pre-slip warning threshold. Consequently, the probability of rapid overall movement in the short term is low. The proposed approach achieves a favorable balance between parameter scale, sequence length, prediction accuracy, and physical interpretability, establishing a new paradigm for early landslide identification in complex environments characterized by ‘lightweight, fast, accurate, and interpretable’ features. The methodology is scalable for online monitoring and early warning tasks for other geological hazard time series.


Author Contributions

Conceptualisation, H.G.; methodology, Y.C. and S.H.; software, S.H.; validation, H.G. and Y.L.; formal analysis, Y.L. and X.L.; investigation, C.Q.; resources, Y.L.; data curation, C.Q. and Y.L.; writing—original draft preparation, Y.C., S.H. and Y.L.; writing—review and editing, Y.C., S.H., Y.L., T.L. and X.L.; visualisation, X.L. and C.Q.; supervision, H.G., T.L. and C.Q.; project administration, H.G.,T.L. and X.L. All authors have read and agreed to the published version of the manuscript.

Funding

This paper was financed by China Geological Survey project (DD20230600306) and 2024 Natural Science Foundation of Sichuan Province (2024NSFSC0091) and State Key Laboratory of Oil and Gas Reservoir Geology and Exploitation Special Open Fund—Sichuan Province Geothermal Resources Development and Comprehensive Utilization Industry-Education Integration Demonstration Project (No. CDUT-PLC2025017CJRH), and the AI Research Foundation of Chengdu University of Technology (Grant No. 2025AI032).

Institutional Review Board Statement

Not applicable.

Informed Consent Statement

Not applicable.

Data Availability Statement

Data are contained within the paper.

Conflicts of Interest

The authors declare that the research was conducted in the absence of any commercial or financial relationships that could be construed as a potential conflict of interest.

Abbreviations

LSTMLong Short-Term Memory
Transformer–Attention–LSTMTransformer-Attention-Long Short-Term Memory
Attention–LSTMAttention-Long Short-Term Memory
BiLSTMBidirectional Long Short-Term Memory
GATGraph Attention Network
InSARInterferometric Synthetic Aperture Radar
GNSSGlobal Navigation Satellite System
SVMSupport Vector Machine
RNNRecurrent Neural Network
CEEMDANComplete Ensemble Empirical Mode Decomposition with Adaptive Noise
VMDVariational Mode Decomposition
RidgeRidge Regression
LassoLeast Absolute Shrinkage and Selection Operator
ElasticNetElasticNet Regression
AdamWAdam Weight Decay

References

  1. Tang, R.; Ren, S.; Fan, X.; Xu, Q. Formation mechanism of large-scale red bed gently inclined strata landslide: Taking Duanqu landslide in north Sichuan as an example. J. Chengdu Univ. Technol. (Sci. Technol. Ed.) 2024, 51, 649–662. [Google Scholar] [CrossRef]
  2. He, H.; Zheng, D.; Xu, G.; Dong, X.; Liu, W.; Zou, Y.; Wang, H. Research on the evolution mechanisms and prevention countermeasures behind a large-scale landslide in complicated-geological-structure red beds. Sci. Rep. 2025, 15, 40294. [Google Scholar] [CrossRef]
  3. Ye, C.; Liu, J.; Shi, Y.; Zhao, S.; Li, H.; Deng, J. The Mechanism of Mineral Dissolution on the Development of Red-Bed Landslides in the Wudongde Reservoir Region. Minerals 2024, 14, 115. [Google Scholar] [CrossRef]
  4. Yu, B.; Ma, E.; Cai, J.; Xu, Q.; Li, W.; Zheng, G. A prediction model for rock planar slides with large displacement triggered by heavy rainfall in the Red bed area, Southwest, China. Landslides 2021, 18, 773–783. [Google Scholar] [CrossRef]
  5. Ye, Z.; Liu, X.; Dong, Q.; Wang, E.; Sun, H. Hydro-Damage Properties of Red-Bed Mudstone Failures Induced by Nonlinear Seepage and Diffusion Effect. Water 2022, 14, 351. [Google Scholar] [CrossRef]
  6. Miao, Z.; Tang, P.; Zhang, Y. Recognition of Red-Bed Landslides over Eastern Sichuan through Remote Sensing and Field Investigations. Geofluids 2022, 2022, 9385352. [Google Scholar] [CrossRef]
  7. Zhao, X.; Dong, X.; Zhao, Z.; Yang, Z.; Yang, Y.; Wen, M.; Cao, Y. Insights into red-bed landslide movement from the perspective of geomorphic evolution: A case study in western Yunnan, China. Geomorphology 2026, 496, 110157. [Google Scholar] [CrossRef]
  8. Wang, L.; Chen, Y.; Huang, X.; Zhang, L.; Li, X.; Wang, S. Displacement prediction method of rainfall-induced landslide considering multiple influencing factors. Nat. Hazards 2023, 115, 1051–1069. [Google Scholar] [CrossRef]
  9. Yang, K.; Wang, Y.; Duan, G. Displacement Prediction Method for Rainfall-Induced Landslide Using Improved Completely Adaptive Noise Ensemble Empirical Mode Decomposition, Singular Spectrum Analysis, and Long Short-Term Memory on Time Series Data. Water 2024, 16, 2111. [Google Scholar] [CrossRef]
  10. Ren, S.; Ghazali, K.H. Ceemdan-Bilstm for Landslide Displacement Prediction: Exploring Rainfall Hysteresis and Effective Rainfall Cycles. In Proceedings of the 8th IEEE International Conference on Electrical, Control and Computer Engineering (InECCE 2025), Kuantan, Malaysia, 27–28 August 2025; pp. 374–379. [Google Scholar]
  11. Song, K.; Yang, H.; Liang, D.; Chen, L.; Jaboyedoff, M. Step-like displacement prediction and failure mechanism analysis of slow-moving reservoir landslide. J. Hydrol. 2024, 628, 130588. [Google Scholar] [CrossRef]
  12. Li, Y.; Hu, X.; Zhang, H.; Zheng, H.; Li, N. Displacement prediction and failure mechanism analysis of rainfall-induced colluvial landslides. J. Hydrol. 2025, 660, 133361. [Google Scholar] [CrossRef]
  13. Wang, N.; Zhang, J.; Xiang, Y.; Huang, S. A high-precision displacement prediction model for landslide geological hazards based on APSO-SVR-LSTM combination. Front. Earth Sci. 2025, 13, 1597570. [Google Scholar] [CrossRef]
  14. Wang, S.; Duan, X.; Zhan, H.; Zhang, J.; Chen, H.; Zhang, L.; Xu, G.; Song, J.; Lou, Q.; Li, Y.; et al. A Data-driven framework for temperature prediction and control of megawatt alkaline electrolyzers based on LSTM-Transformer hybrid model. Fuel 2026, 411, 138063. [Google Scholar] [CrossRef]
  15. Chen, H.; Li, Y.; Liu, Y. Research and analysis of the TCN-Multihead-Attention prediction model of landslide deformation in the Three Gorges Reservoir area, China. Front. Earth Sci. 2025, 13, 1587623. [Google Scholar] [CrossRef]
  16. Chen, F.; Yuan, X.; Zhou, K.; Ma, K.; Zhang, Y.; Zhang, J.; Wu, L. Interpretable deep learning prediction of landslide displacement based on graph attention networks and temporal attention mechanisms across selected sites. Discov. Appl. Sci. 2025, 8, 120. [Google Scholar] [CrossRef]
  17. Zhang, Y.; He, Y.; Gao, F.; Huo, T.; Zhang, Q.; Lu, J.; Zhang, L. A spatiotemporal displacement prediction method for InSAR-detected landslides using a graph neural network coupling spatial and temporal features. Geomat. Nat. Hazards Risk 2025, 16, 2596362. [Google Scholar] [CrossRef]
  18. Ding, Q.; Ma, G.; Guo, C.; Chi, F.; Cao, X.; Zhou, W. Spatiotemporal prediction of landslide displacement considering heterogeneous responses to rainfall and reservoir level fluctuations. Acta Geotech. 2025, 20, 6133–6155. [Google Scholar] [CrossRef]
  19. Dai, H.; Ali, K.; Xiong, Y.; Haseeb, M.; Miao, Z.; Wu, L. Optimized intermittent MT-InSAR methodology for landslide monitoring in low-coherence region with complex terrains: Gilgit-baltistan case study. Geomat. Nat. Hazards Risk 2025, 16, 2601806. [Google Scholar] [CrossRef]
  20. Zhao, K.; Hu, X.; Cai, J.; Yang, S.; Yu, Z.; Jiang, Y.; Chen, L. Unveiling hydrothermal dynamics: Ridge regression-driven prediction of water-rock interaction fractured aquifer in coal mine gobs during thermal energy storage. J. Energy Storage 2026, 147, 120121. [Google Scholar] [CrossRef]
  21. Shen, R.; Xu, X.; Li, Y.; Sun, Y.; Xu, Y.; Duan, Y.; Liu, X.; Feng, L. Enhancing spatiotemporal influenza prediction in China: A multi-output least absolute shrinkage and selection operator machine learning model integrating web-based search data. Intell. Med. 2025, 5, 310–317. [Google Scholar] [CrossRef]
  22. Elkhidir, E.; Patel, T.; Rotimi, J.O.B. Predictive Modelling for Residential Construction Demands Using ElasticNet Regression. Buildings 2025, 15, 1649. [Google Scholar] [CrossRef]
  23. Samanta, I.S.; Rout, P.K.; Swain, K.; Cherukuri, M.; Panda, S.; Bajaj, M.; Blazek, V.; Prokop, L.; Misak, S. A hybrid approach for power quality event identification in power systems: Elasticnet Regression decomposition and optimized probabilistic neural networks. Heliyon 2024, 10, e37975. [Google Scholar] [CrossRef] [PubMed]
  24. Liu, J.; Geng, T.; Jiang, W.; Fan, S.; Chen, J.; Jia, C.; Ji, S. A new application of Elasticnet regression based near-infrared spectroscopy model: Prediction and analysis of 2,3,5,4′-tetrahydroxy stilbene-2-O-β-D-glucoside and moisture in Polygonum multiflorum. Microchem. J. 2024, 199, 110095. [Google Scholar] [CrossRef]
  25. Rong, Z.; Cong, S.; Tang, L.; Chen, P.; Wang, Y.; Ma, M.; Arbanas, Z. Prediction of enhanced creep landslide displacement by analyzing multi-time-scale displacement impact factors using convolutional neural network (CNN). Landslides 2026, 23, 595–615. [Google Scholar] [CrossRef]
  26. Wei, H.; Ou, O.; Wang, W.; Ruan, J.; Zhong, B.; Lao, L.; Li, Z.; Du, X.; Leng, X. Study on rainfall early warning model for Xiangmi Lake slope based on unsaturated soil mechanics. Open Geosci. 2022, 14, 1434–1443. [Google Scholar] [CrossRef]
  27. Wu, Z.; Ye, R.; Yang, S.; Wen, T.; Huang, J.; Chen, Y. Study on Early Identification of Rainfall-Induced Accumulation Landslide Hazards in the Three Gorges Reservoir area. Remote Sens. 2024, 16, 1669. [Google Scholar] [CrossRef]
  28. Xu, Q.; Zeng, Y.; Qian, J.; Wang, C.; He, C. An improved tangent angle and the corresponding landslide warning criterion. Geol. Bull. China 2009, 28, 501–505. [Google Scholar] [CrossRef]
Figure 1. Topography and location of the Kuyaogou landslide and monitoring area.
Sustainability 18 03241 g001
Figure 2. Plan view of monitoring equipment layout.
Sustainability 18 03241 g002
Figure 3. Combined analysis of daily rainfall and cumulative rainfall at the Kuyaogou landslide monitoring site.
Sustainability 18 03241 g003
Figure 4. Spatiotemporal coupling between rainfall triggers and internal fracture responses.
Sustainability 18 03241 g004
Figure 5. Time series comparison of rainfall, crack width, and GNSS displacement.
Sustainability 18 03241 g005
Figure 6. Statistical distribution and skewness analysis of multi-source monitoring features.
Sustainability 18 03241 g006
Figure 7. Core Architecture Diagram of Transformer–Attention–LSTM.
Sustainability 18 03241 g007
Figure 8. Demonstration of the Three Stages of Landslide Deformation. (Point definitions are as follows: A, onset of initial deformation stage; B, transition to constant-rate deformation stage; C, start of accelerated deformation stage; D, intermediate acceleration transition; E, tertiary acceleration transition; and F, ultimate failure point).
Sustainability 18 03241 g008
Figure 9. Predicted Total Displacement and Its Tangent Angle Variation. (a) Resultant Displacement–time Graph; (b) Tangent Angle–Time Graph.
Sustainability 18 03241 g009
Figure 10. Comparison of R2 values for displacement prediction in X, Y and Z directions.
Sustainability 18 03241 g010
Figure 11. Comparison of RMSE values for displacement prediction in X, Y and Z directions.
Sustainability 18 03241 g011
Figure 12. Transformer Layer 1–3 Attention Matrix with Contours. (The white lines represent the grid and contour levels of the attention weights across different query and key positions).
Sustainability 18 03241 g012
Figure 13. Transformer 3D attention surface.
Sustainability 18 03241 g013
Figure 14. Analysis of landslide stress, plastic strain zones, and displacement under heavy rainfall. (a) Shear strain increment contour; (b) Horizontal displacement; (c) Vertical displacement; (d) Total displacement; (e) Plastic deformation zones.
Sustainability 18 03241 g014
Table 1. Monitoring Information.
Monitoring Point IDMonitoring Instrument TypeInstallation LocationMonitoring Point Coordinates
LongitudeLatitudeElevation (m)
LF01Crack GaugeCrack at the slope crest102.29257229.7759092518.13
GNSS02GNSS Displacement Monitoring StationMid-slope102.29115729.7778572459.68
YL01Rain GaugeLeft-side safety zone of slope102.29478129.7774952309.92
Table 2. Feature matrix construction based on sliding window method.
Feature TypeFeature NameMathematical NotationLag StepsPhysical InterpretationTarget/Label
Rainfall (cumulative)R_t−1Rt−11 (4 h ago)Cumulative rainfall in previous 4-h interval-
R_t−2Rt−22 (8 h ago)Cumulative rainfall 8 h ago-
R_t−3Rt−33 (12 h ago)Cumulative rainfall 12 h ago-
R_t−4Rt−44 (16 h ago)Cumulative rainfall 16 h ago-
R_t−5Rt−55 (20 h ago)Cumulative rainfall 20 h ago-
R_t−6Rt−66 (24 h ago)Cumulative rainfall 24 h ago-
Crack width (average)C_t−1Ct−11 (4 h ago)Average crack width in previous 4-h interval-
C_t−2Ct−22 (8 h ago)Average crack width 8 h ago-
C_t−3Ct−33 (12 h ago)Average crack width 12 h ago-
C_t−4Ct−44 (16 h ago)Average crack width 16 h ago-
C_t−5Ct−55 (20 h ago)Average crack width 20 h ago-
C_t−6Ct−66 (24 h ago)Average crack width 24 h ago-
Displacement X (lag)D_X_t−1 D t 1 X 1 (4 h ago)X-direction displacement 4 h ago-
D_X_t−2 D t 2 X 2 (8 h ago)X-direction displacement 8 h ago-
D_X_t−3 D t 3 X 3 (12 h ago)X-direction displacement 12 h ago-
D_X_t−4 D t 4 X 4 (16 h ago)X-direction displacement 16 h ago-
D_X_t−5 D t 5 X 5 (20 h ago)X-direction displacement 20 h ago-
D_X_t−6 D t 6 X 6 (24 h ago)X-direction displacement 24 h ago-
Displacement Y (lag)D_Y_t−1 D t 1 Y 1 (4 h ago)Y-direction displacement 4 h ago-
D_Y_t−2 D t 2 Y 2 (8 h ago)Y-direction displacement 8 h ago-
D_Y_t−3 D t 3 Y 3 (12 h ago)Y-direction displacement 12 h ago-
D_Y_t−4 D t 4 Y 4 (16 h ago)Y-direction displacement 16 h ago-
D_Y_t−5 D t 5 Y 5 (20 h ago)Y-direction displacement 20 h ago-
D_Y_t−6 D t 6 Y 6 (24 h ago)Y-direction displacement 24 h ago-
Displacement Z (lag)D_Z_t−1 D t 1 Z 1 (4 h ago)Z-direction displacement 4 h ago-
D_Z_t−2 D t 2 Z 2 (8 h ago)Z-direction displacement 8 h ago-
D_Z_t−3 D t 3 Z 3 (12 h ago)Z-direction displacement 12 h ago-
D_Z_t−4 D t 4 Z 4 (16 h ago)Z-direction displacement 16 h ago-
D_Z_t−5 D t 5 Z 5 (20 h ago)Z-direction displacement 20 h ago-
D_Z_t−6 D t 6 Z 6 (24 h ago)Z-direction displacement 24 h ago-
Current displacement XD_X_target D t X 0 (current)Current X-direction displacement
Current displacement YD_Y_target D t Y 0 (current)Current Y-direction displacement
Current displacement ZD_Z_target D t Z 0 (current)Current Z-direction displacement
Total Features 33 (30 input + 3 target)
Note: ‘√’ indicates the output target feature.
Table 3. Landslide Deformation Stages and Early Warning Grading Based on Displacement Tangent Angle.
Deformation StageInitial DeformationConstant-Speed DeformationInitial AccelerationUniformly AcceleratedAccelerated Failure
Early warning levelNoneCautionWarningAlertAlert
Alert FormNoneBlueYellowOrangeRed
Tangent angleα < 45°α ≈ 45°45° < α < 80°80° < α < 85°α > 85°
Table 4. Experimental training parameter settings.
Training ParametersPreferencesTraining ParametersPreferences
Input Dimension30OptimizerAdam Weight Decay (AdamW)
Hidden Dimension (d_model)28Learning Rate0.0003
Number of Layers3Weight Decay 1 × 1 0 4
Number of Attention Heads4SchedulerCosine Annealing WarmRestarts (T_0 = 15, T_mult = 2)
Feed-Forward Dimension128Dropout Rate0.5
Sequence Length6Epochs150
Batch Size32
Table 5. Performance Comparison of Different Models in Displacement Prediction on the Test Samples.
ModelDisplacementR2Average R2RMSEMAE
Ridge RegressionX0.9180.8491.5661.157
Y0.885 2.2851.646
Z0.744 4.4223.362
Lasso RegressionX0.7450.6512.7622.439
Y0.6404.0383.287
Z0.5675.7464.199
ElasticNet RegressionX0.8660.7052.0051.523
Y0.6783.8192.956
Z0.5725.7134.128
LSTMX0.9150.90614.9448.828
Y0.913 13.6438.339
Z0.891 12.2378.310
Attention–LSTMX0.9300.92514.35810.831
Y0.927 13.0369.539
Z0.893 12.9859.798
Transformer–Attention–LSTMX0.9660.9488.8647.172
Y0.9539.2347.054
Z0.9269.4807.169
Table 6. Predicted Combined Displacement Results for the Next 10 Days.
Forecast DayX Displacement (mm)Y Displacement (mm)Z Displacement (mm)Daily Change X (mm)Daily Change Y (mm)Daily Change Z (mm)Total Displacement (mm)Total Displacement Filtering (mm)Displacement Derivative (ds/dt) (mm/Day)Tangent Angle (Degrees)
day 1−181.133165.950124.5520.0000.0000.000275.430275.232
day 2−181.058165.861125.8090.075−0.0891.257275.898276.4501.21850.618
day 3−181.353165.789129.228−0.295−0.0723.420277.624277.1590.70835.315
day 4−181.423165.959128.189−0.0700.170−1.040277.289277.5940.43523.504
day 5−181.254166.750126.7760.1690.791−1.413277.003276.434−1.15949.219
day 6−180.464166.123125.0510.789−0.627−1.725275.322276.332−0.1025.822
day 7−180.647165.963129.591−0.183−0.1604.539277.436276.7140.38220.905
day 8−180.961166.153127.424−0.3140.189−2.167276.750276.507−0.20711.703
day 9−180.831165.928124.2710.129−0.225−3.153275.092276.5520.0452.585
day 10−181.853165.882127.323−1.021−0.0473.051277.125276.435−0.1176.667
Disclaimer/Publisher’s Note: The statements, opinions and data contained in all publications are solely those of the individual author(s) and contributor(s) and not of MDPI and/or the editor(s). MDPI and/or the editor(s) disclaim responsibility for any injury to people or property resulting from any ideas, methods, instructions or products referred to in the content.