Article

Spatiotemporal-Imbalance-Aware Risk Prediction Framework for Lightning-Caused Distribution Grid Failures

State Key Laboratory of Disaster Prevention & Reduction for Power Grid, Changsha University of Science and Technology, Changsha 410205, China
*
Author to whom correspondence should be addressed.
Sustainability 2025, 17(16), 7228; https://doi.org/10.3390/su17167228
Submission received: 16 May 2025 / Revised: 27 July 2025 / Accepted: 4 August 2025 / Published: 10 August 2025
(This article belongs to the Special Issue Disaster Prevention, Resilience and Sustainable Management)

Abstract

Lightning strikes pose a significant threat to the reliability of power distribution networks, with cascading effects on energy sustainability and community resilience. This paper proposes a lightning disaster risk prediction model for distribution networks, designing a lightning strike hazard matrix to classify historical fault records and incorporating future multi-source heterogeneous data to predict lightning-induced fault hazard levels and enhance the sustainability of grid operations. To address spatiotemporal imbalances in data distribution, we first propose diagnostic threshold settings for low-frequency elements alongside a method for calculating hazard diagnostic criteria. This approach systematically integrates high-hazard, low-frequency factors into risk analyses. Second, we introduce an adaptive weight optimization algorithm that dynamically adjusts risk factor weights by quantifying their contributions to overall system risk. This method overcomes the limitations of traditional frequency-weighted approaches, ensuring more robust hazard assessment. Experimental results demonstrate that, compared to baseline models, the proposed model achieves average improvements of 21%/8.3% in AUROC, 30.2%/47.4% in SE, and 20.5%/8.1% in CI, empirically validating its superiority in risk prediction and engineering applicability.

1. Introduction

Lightning has consistently been a major natural threat to energy sustainability, with lightning disasters accounting for over 30% of power outages in the United States and more than 50% in Europe [1]. In China, 10 kV distribution networks span extensively, totaling 5.37 million kilometers [2]. In thunderstorm-prone regions, the overall lower insulation level of distribution networks leads to frequent lightning-induced tripping faults, jeopardizing power system security [3,4,5]. Therefore, research on lightning risk assessment for distribution networks is crucial for ensuring energy sustainability. Multidimensional spatiotemporal data analytics is opening new frontiers in risk governance for critical infrastructure and the sustainable development of energy systems [6].
Current studies exhibit a notable systemic imbalance: On one hand, transmission systems have achieved high reliability through comprehensive lightning protection measures [7,8] and mature risk assessment models [9,10,11]. On the other hand, distribution networks face inherent structural challenges, such as high grid density and inadequate protection, coupled with the low-frequency but high-hazard nature of lightning strikes, rendering traditional risk assessment methods inadequate. With rising demand for power supply reliability, developing accurate lightning risk assessment methods tailored to distribution networks has become a critical challenge in power system safety.
Existing lightning risk assessment approaches fall into two categories:
(1)
Analytical methods based on electrical characteristics or probabilistic statistics. For example, Zhang et al. [12] developed an electrical geometry model to simultaneously compute fault rates on photovoltaic systems and tripping rates on distribution lines, while Alessio et al. [13,14,15] proposed a probabilistic statistical framework to quantify risks associated with lightning protection equipment failures.
(2)
Data-driven methods, including machine learning algorithms such as Bayesian networks [16] and semi-supervised learning [17]. Among these, scenario analysis [1], which integrates lightning warning data, effectively handles prediction uncertainty.
Despite progress, current methods suffer from three key limitations:
  • Data sparsity: The sparse nature of lightning strike data in distribution networks leads to the neglect of low-frequency, high-hazard events, resulting in underestimation of extreme risks.
  • Poor generalization: Due to the long-tail distribution of lightning faults, traditional machine learning models exhibit unstable performance in predicting rare high-hazard events.
  • Low interpretability: Black-box models lack transparency, hindering their utility in operational decision-making.
Association Rule Mining (ARM) has advantages in rule interpretability in power systems and other fields [18,19,20,21,22,23], using relevant mining algorithms to explore patterns in multi-source datasets [24,25]. The effectiveness of lightning damage risk assessment in distribution networks depends on critical evaluation of each feature factor’s importance and organic integration of multi-source data, which facilitates objective analysis and weighting of characteristic factors. ARM is an important branch in data mining dedicated to extracting information from datasets and identifying strongly correlated itemsets [26]. Ref. [27] applied ARM to explore intrinsic connections between risk factors in solutions. Ref. [28] used ARM to establish a safety assessment model that enhances distribution network transmission corridor safety through precise evaluation of influencing factors. Ref. [29] employed MARM for feature selection to improve carbon price model accuracy. Refs. [30,31] addressed the issues of excessive candidate sets and complex mining processes in traditional pattern mining by using more efficient data structures to process incremental data, achieving significant improvements in runtime and memory usage. Although Ref. [32] also considered the impacts of different feature importance, its algorithm improvements mainly affected execution speed and memory usage—compared to speed and storage capacity, the scheme’s accurate estimation is a more critical issue. These ARM methods still suffer from insufficient low-frequency feature extraction and lack of dynamic weight mechanisms, limiting their application in distribution network lightning damage risk assessment.
To address these challenges, this paper redesigns the diagnostic threshold for conditional importance and conditional importance criteria within the ARM framework to incorporate low-frequency, high-hazard elements. Additionally, an adaptive weight adjustment method is developed based on risk contribution. We propose a Conditional Screening and Weight-Adaptive Association Rule Mining (CSWA-ARM) model, which leverages historical multi-source heterogeneous data to predict lightning strike hazard levels and enable early risk warning.

2. Model Frame

This study proposes a Conditional Screening and Weight-Adaptive Association Rule Mining (CSWA-ARM) model to address the spatiotemporal imbalance in distribution network lightning strike data and the identification of low-frequency, high-hazard elements. The model architecture is illustrated in Figure 1.
The model consists of four key components:
Data Input Module: Receives lightning-induced tripping records provided by the State Grid Corporation.
Preprocessing Module: Performs feature selection, discretization, and data cleaning, while establishing a lightning strike hazard-level classification.
Conditional Screening Module: Identifies low-frequency, high-hazard elements using diagnostic threshold criteria.
Weight-Adaptive Adjustment Module: Dynamically adjusts weights based on the actual impact of risk components on system reliability.
By integrating these mechanisms, the proposed model effectively mitigates data bias issues inherent in traditional methods, enhancing both prediction accuracy and operational applicability.

3. Data Entry and Preprocessing

This study focuses on the distribution network systems in China’s southern complex mountainous climate zone, where lightning activity is frequent and lightning-induced faults exhibit complex patterns. By integrating 1247 lightning trip records from the distribution network information management system, meteorological characteristic data provided by weather authorities, and geographic data of overhead transmission line towers from the Geospatial Data Cloud, a comprehensive analytical dataset was established. Statistically weak features (e.g., tower IDs and line identifiers) were removed based on quantitative analysis.
Given the high dimensionality of the original data features, a four-step feature selection process was implemented to ensure the selected features possessed annual sustainability, system compatibility, statistical significance, and measurement feasibility. This approach enhanced the model’s capability to handle complex datasets.
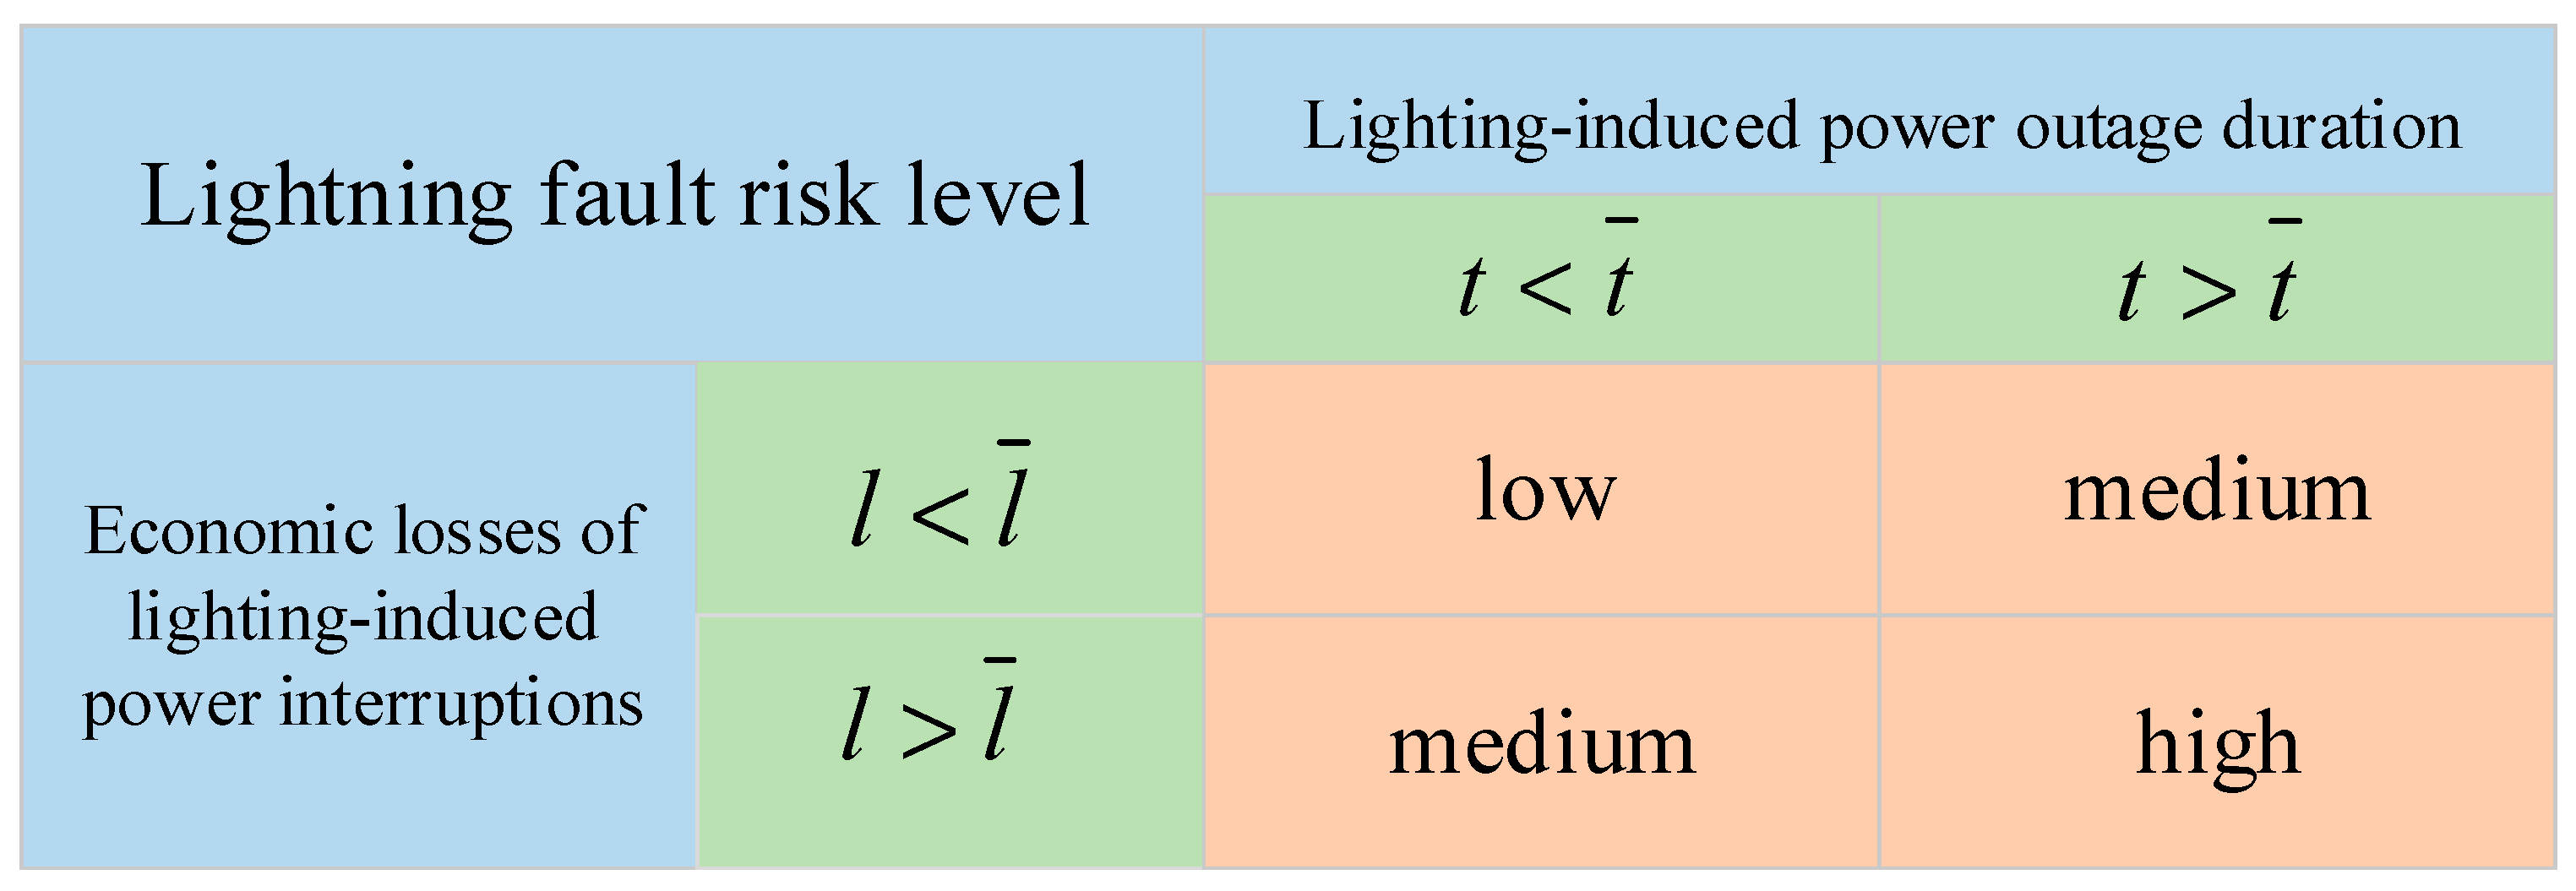
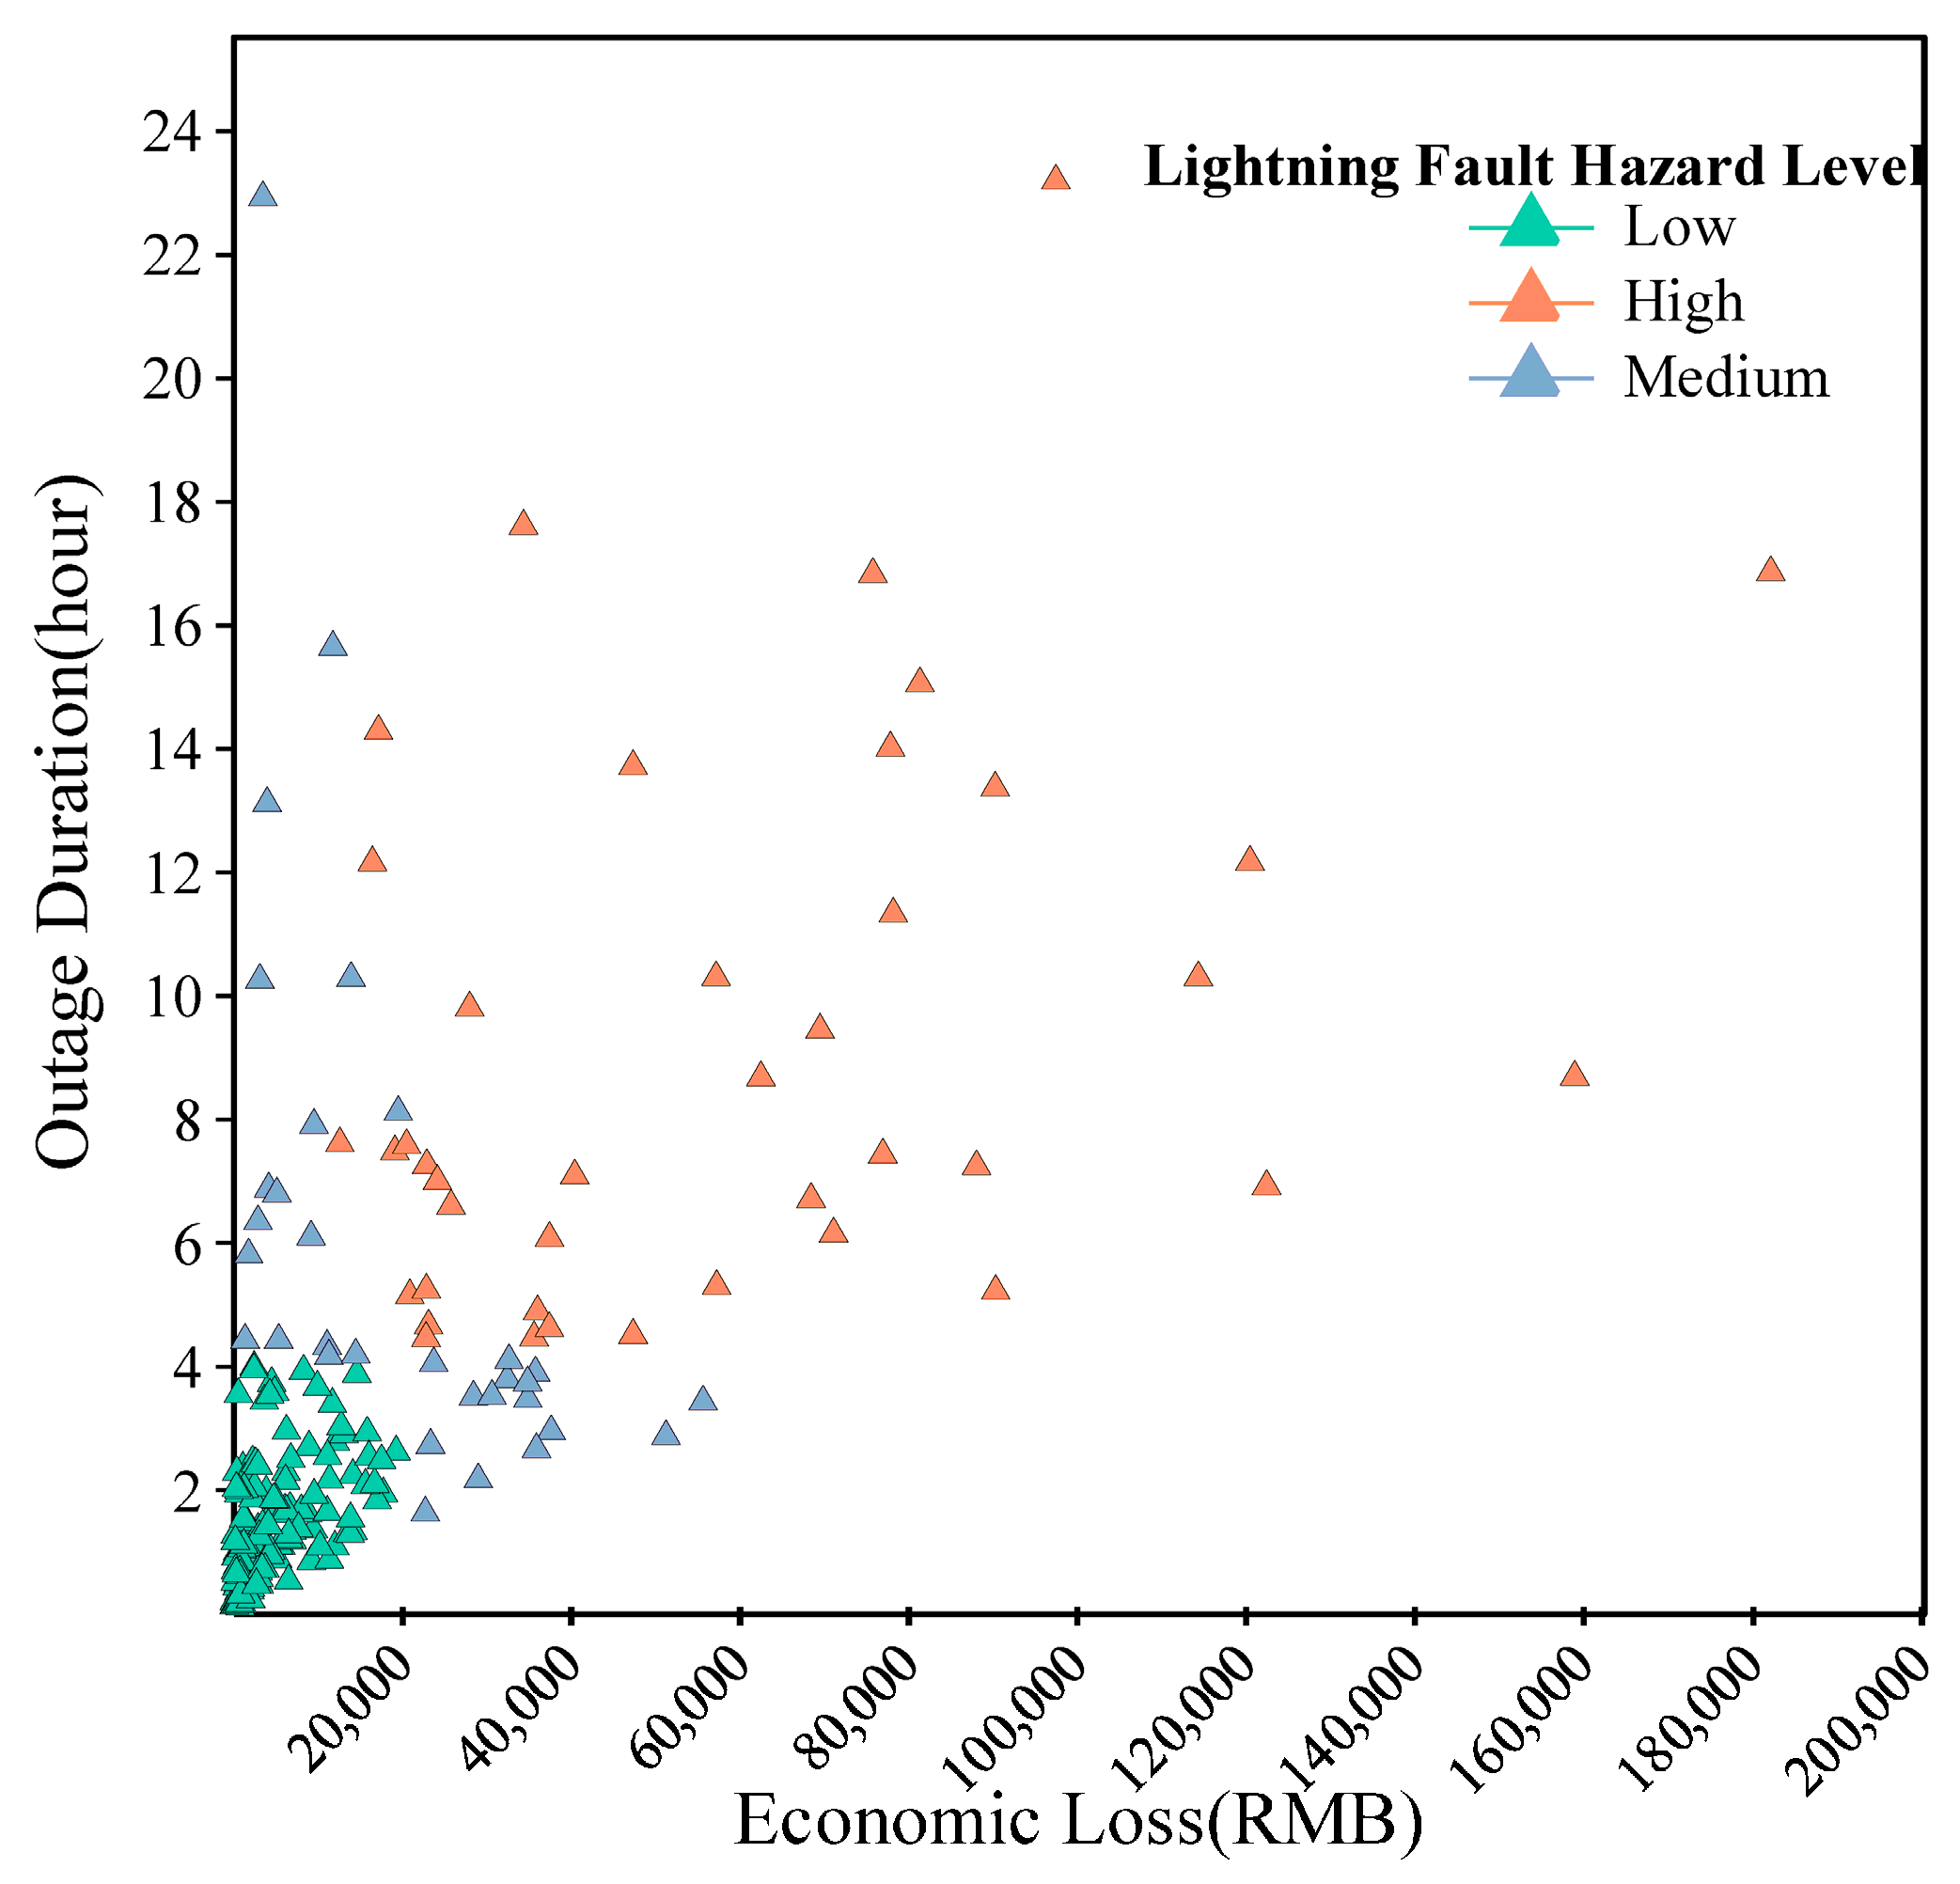
The target attribute of this study is the lightning-induced fault hazard level. Drawing upon the risk matrix methodology [33], we developed a two-dimensional evaluation model based on power outage duration and economic losses. We employed a grid-based sensitivity analysis approach to determine the optimal risk matrix thresholds. Based on the statistical distribution characteristics of our dataset, we established the threshold search space as follows: The power outage duration threshold was searched within a range of 0–20 h with a grid interval of 100 steps, while the economic loss threshold was investigated across CNY 0–180,000 using an identical 100-step grid resolution. For each recorded lightning-fault event, the risk level was classified according to the criteria specified in Figure 2. (1) low risk—both outage duration and economic loss below their respective thresholds; (2) medium risk—either parameter below its threshold; (3) high risk—both parameters exceeding threshold values. The predictive performance under different threshold combinations was quantitatively evaluated using the Area Under the Receiver Operating Characteristic (AUROC) curve metric. The comprehensive results of this grid sensitivity analysis for threshold selection are visually presented in the accompanying Figure 3. The optimally determined thresholds were finally established at 4.04 h for outage duration and RMB 20,000 for economic loss, achieving an AUROC of 0.9402 (94.02%). The distribution of risk classifications across all lightning fault records under these threshold values is presented in Figure 4.
By inputting feature selection and lightning-induced fault hazard level, this study identified a total of 14 characteristic attributes, as shown in the left column of Table 1. In Table 1, reasonable discretization is applied to the continuous variables; air temperature is categorized into five classes with an interval of 6 °C, while the average values for pressure and wind speed are taken for the day.

4. Criteria Optimization Model for Association Rule Discovery

4.1. Preliminary

Association Rule Mining (ARM) is a data analysis method for discovering latent co-occurrence patterns from large-scale datasets. In this study, each lightning-induced tripping record is treated as a transaction, described by an itemset composed of multiple attribute features. A typical association rule takes the form X → Y, indicating that the occurrence of itemset X tends to be accompanied by itemset Y. To assess the effectiveness of the rules, this article uses two indicators, support and added value, for quantitative analysis. Here, support refers to the frequency of itemsets occurring in all transactions, which is used to filter frequent itemsets. This can be expressed as:
s u p I 1 = f r e q ( I 1 ) T
Added Value (AV) quantifies the enhancement degree of itemset X on the occurrence probability of itemset Y, which effectively identifies strong association rules with practical significance. The metric is mathematically expressed as:
c o n f X Y = f r e q X Y f r e q X
A V X Y = c o n f X Y s u p ( Y ) = f r e q X Y f r e q X f r e q ( Y ) T
The Association Rule Mining process comprises two distinct phases. Initially, frequent itemsets are identified through screening against a predefined minimum support threshold (minsup). Subsequently, statistically significant association rules are extracted based on a minimum added value threshold (min|AV|).

4.2. Database

To effectively analyze the spatiotemporal characteristics of lightning-induced faults in distribution networks, this study establishes a standardized data structure framework. Given the cyclical and periodic nature of annual time units, the input data were partitioned and analyzed on a yearly basis. This annual segmentation enables independent mining and analysis for each year’s dataset, thereby facilitating validation of the predictive model’s effectiveness. Formally, we define T i T = T 1 , T 2 T n , where each T i contains the complete set of fault records for its corresponding calendar year.
This study employs a structured data representation approach where I = i 1 , i 2 i k i m denotes the set of record identifiers. Each lightning-induced fault record i k  I is characterized by an N-dimensional feature vector, with the attribute set U = u 1 , u 2 u j u n corresponding to the parameters listed in Table 1. For each attribute u j , discrete values are represented as v k j u j = { v 1 j ,   v 2 j v k j v m j } . The target variable Y = { y l ,   y m , y h } defines three hazard levels (low, medium, high). The constructed annual fault database Tn is formally represented as an m × (n + 2) dimensional matrix (Equation (4)), where the two additional columns store record identifiers and hazard levels, respectively.
T i = u 1 v 11           u j v 1 j          u n v 1 n     Y y 1      I i 1 v k 1 v m k         v k j v m j         v k n v m n    y k y m     i k i m
Each column in T i represents a feature, and each row represents a lightning-induced fault record. Among them, I is the record identification vector, u 1 u k u n are the input features, and Y is the target feature.

4.3. Development of Diagnostic Thresholds for Low-Frequency Element Analysis

When using traditional Association Rule Mining (ARM) methods for lightning strike fault hazard prediction, the unbalanced distribution of lightning strike faults across different seasons is not considered. Lightning strikes, as a seasonal phenomenon, are primarily concentrated in summer and are relatively rare in winter. However, existing lightning strike fault diagnosis ARM algorithms apply the same diagnostic threshold standards throughout the entire year. This means that the system uses the same threshold to evaluate the importance scores of lightning strike faults, regardless of whether it is summer or winter. Outside of summer, due to the lower frequency of faults, their importance scores may fall below the set threshold, leading to these seasonal lightning strike faults being easily overlooked. Lightning strike faults during rare periods often inflict more severe damage on power systems. For instance, in winter, heightened demand for heating and other factors can cause a sharp surge in power load. If a lightning strike occurs under such conditions, the system may already be operating near or beyond its capacity limit, significantly reducing its ability to withstand additional stress. This can trigger equipment overloading or cascading failures, ultimately leading to substantial economic losses. Furthermore, if weather conditions worsen after a lightning-induced trip, the difficulty of on-site repairs and restoration increases, prolonging the system recovery time—i.e., extending the duration of power outages.
Therefore, low-frequency elements can, in certain cases, cause severe damage to the power distribution system, necessitating their consideration in the analysis. To address this, this paper proposes a method for setting diagnostic threshold standards for low-frequency elements. This method can adaptively set more reasonable thresholds based on the distribution of lightning strike faults across different periods in the annual input database. To mitigate the data bias caused by the temporal imbalance in lightning strike fault distribution, this paper selects quarters as the baseline time units. Lightning strike faults occurring within the same quarter are assigned the same diagnostic threshold value for low-frequency elements. Let Q = Q 1 , Q 2 Q k Q m be the set of quarters in which the m lightning strike fault records are distributed. Here, Q k represents the quarter in which the k -th lightning strike fault record occurred, and Q Z s Z 1 , Z 2 , Z 3 , Z 4 denotes any one of the four seasons. Consequently, the annual data T i can be expanded as follows:
T i = u 1 v 11           u j v 1 j          u n v 1 n     Y y 1      I i 1 v k 1 v m k         v k j v m j         v k n v m n    y k y m     i k i m    Q Q 1 Q k Q m
Based on the two significance measures—support and added value—the diagnostic threshold standards for low-frequency elements are sequentially designed. This approach enables the setting of more reasonable thresholds tailored to the distribution of faults across different seasons. The mathematical representation of the corresponding threshold-setting method is as follows:
m i n s u p Z s   = m i n s u p 0 · f r e q ( i k T i k , n + 2 ; T i k , n + 3 = Q ( Z s ) ) f r e q ( i k T i k , n + 2 ; T i k , n + 3 = Q ( Z s m a x ) )
m i n | A V Z s , Z Y | = m i n | A V 0 | · f r e q ( i k T i k , n + 2 ; T i k , n + 3 = Q Z s ; T i k , n + 1 = Y Z Y ) f r e q ( i k T i k , n + 2 ; T i k , n + 3 = Q Z s m a x ; T i k , n + 1 = Y Z Y )
Here, k = 2 ,   3 m + 1 represents a row in the annual database T i , and f r e q ( ) denotes the cardinality of records in T i where the co-occurring elements satisfy the given conditions. m i n s u p 0 and m i n | A V Z s , Z Y | are the minimum support and minimum added value diagnostic threshold standards for low-frequency elements from the previous year, respectively. Additionally, an initial threshold must be preset for the first year. Q Z s indicates the season in which the lightning strike fault record occurred, while Q Z s m a x represents the season with the highest frequency of fault occurrences. Y Z Y denotes one of the three hazard severity levels of lightning strike faults.

4.4. Calculation of Diagnostic Criteria for Hazard

In the previous section, we designed diagnostic threshold criteria for low-frequency elements, enabling the mining of certain low-frequency variables. However, the problem now lies in how to identify and extract high-hazard factors from these low-frequency variables. To address this issue, we separately analyze high-frequency and low-frequency variables and derive the following extended association rules:
X h f + X l f = Y
In the equation, X h f and X l f represent the high-frequency variable set and the filtered low-frequency variable set in the database, respectively.
Currently, conventional ARM models’ hazard diagnostic criteria tend to inadvertently filter out high-hazard factors within low-frequency variables. This occurs because they employ a fixed hazard assessment methodology—identical to that used for common variables—regardless of varying environmental features. To address this limitation, this study proposes a more flexible hazard diagnostic calculation method. This approach dynamically computes distinct hazard scores based on the distribution patterns of low-frequency variables across different environmental contexts, thereby establishing an adaptive high-risk, low-frequency variable mining framework tailored to diverse environmental characteristics. Thus, for an association rule X h f + X l f = Y , when a low-frequency variable appears under a specific environmental feature u j , its hazard diagnostic calculation can be expressed as:
s u p u j = f r e q ( i k T i k , n + 2 ; X h f T i k , N h ; T i k , j X l f ) f r e q ( i k T i k , n + 2 ; T i k , j X l f )
| A V u j , Z Y | = | f r e q i k T i k , n + 2 ; X h f T i k , N h ; T i k , j X l f ; T i k , n + 1 = Y Z Y f r e q i k T i k , n + 2 ; T i k , j X l f f r e q ( i k T i k , n + 2 ; T i k , n + 1 = Y Z Y ) n |
In the equation, k = 2,3 , m   represents a row in the annual lightning strike trip-out database T i , and   N h denotes the numerical interval from 1 to n .

4.5. Implementation Process of CS-ARM Prediction Model

Based on the above discussion and analysis, the implementation process of the CS-ARM prediction model is illustrated in Figure 5. In the training dataset, we execute the following four steps:
Low-Frequency Element Mining:
In the input database’s training dataset, for each environmental feature   u j , we employ the diagnostic threshold design method for low-frequency elements (Formulas (6) and (7)) to mine low-frequency elements. The remaining elements are classified as high-frequency elements.
Fault Record Classification R h f
Fault records that do not contain any elements of the given environmental feature are classified as   R h f .
LFHH Element Mining R l f
Fault records containing any rare elements of the environmental feature are classified as R l f . Low-frequency, high-hazard (LFHH) elements are then mined from these records. These elements are represented in the form of high-frequency variable sets and frequent association rules.
Iterative Process:
The above three steps are repeated sequentially for each environmental feature in the training dataset.

5. Association Rule Mining with Adaptive Weight Adjustment

Currently, many relative weight calculation methods for input data rely primarily on data proportions or occurrence frequencies to determine element weights. However, proportional frequency does not always equate to system-level importance. Therefore, there is a need to develop a more appropriate and accurate relative weight calculation method.
In this section, building upon the risk factors mined by the CS-ARM model, we propose an adaptive weight adjustment model. This model quantifies the impact of individual components on the overall failure risk level of the power distribution system, directly measuring both the direction and the magnitude of their influence on system-wide risk.

5.1. Construction of the Adaptive Weight Adjustment Model

The risk contribution degree considers the contribution of individual risks relative to the overall risk portfolio. To more accurately assess the risk of each component, we simultaneously account for changes in both system stability and risk levels. Therefore, this paper adopts two established models—Degree of Risk Increase (DRI) and Degree of Risk Reduction (DRR)—to quantify component risk [32].
DRI (Degree of Risk Increase) measures the extent to which the overall system risk rises when an individual component generates a certain level of risk. DRR (Degree of Risk Reduction) quantifies the degree to which the overall system risk declines when an individual component remains stable. The mathematical expressions for DRI and DRR are as follows:
P D R I = I i / I 0    ,     P D R R = I i / I 0
Here, I i + represents the increase in overall system risk when component i generates risk, while I i denotes the decrease in overall system risk when component i is completely stable. I 0 indicates the baseline system-wide risk level under the given conditions.
Based on the above context, we define the environmental element v j , w as a risk component, where the component risk is the co-occurrence probability of v j , w during a lightning strike fault. The system-level fault risk is defined as the integrated likelihood of fault occurrences across the entire system. Consequently, DRI is redefined as the degree of system-wide risk increase when the environmental element v j , w is present, with its mathematical expression given by:
P D R I v j , w | i k = ( 1 η ( 1 w , p ( i k ) ) ) / ( 1 η ( p i k )
In the equation, η ( 1 w , p ( i k ) is the probability of system stability when component v j , w fails under fault i k , 1 η 1 w , p i k represents the risk of lightning strike fault i k occurring in the system when component v j , w is present, η ( p i k is the baseline stability probability under faults, and 1 η ( p i k denotes the inherent risk of lightning strike fault i k occurring in the system independently.
Similarly, DRR is redefined as the degree of system-wide risk reduction when environmental element v j , w is present, with its mathematical expression given by:
P D R R v j , w | i k = ( 1 η ( p i k ) / ( 1 η ( 0 w , p ( i k ) ) )
In the equation, 1 η ( p i k ) is the risk of lightning fault i k occurring in the system, η ( 0 w , p ( i k ) ) is the probability of system stability when fault i k does not exist in component v j , w , and 1 η 0 w , p i k is the risk of lightning fault i k occurring in the system when component v j , w is absent.
To separately analyze the high-frequency variable set and low-frequency variable set, this section uses the lightning strike trip-out database T i from Formula (3) as the data solution space. A low-frequency variable submatrix T i , j l is constructed, consisting of all lightning fault records in T i where feature u j contains at least one low-frequency element.
Furthermore, feature u j is partitioned into a high-frequency element subset u j h and a low-frequency element subset u j l .
For each individual element v j , w u j , this section defines its risk index S j , w l , which comprises two components and is expressed as:
S v j , w = S j , w h + S j , w l
In the equation, S j , w h represents the risk contribution from high-frequency elements, and S j , w l denotes the risk contribution from low-frequency elements. The term S j , w h can be expressed as:
S j , w h = 0 ,    k = 1 i k T i T i k , j = v j , w m      v j , w u j l   v j , w u j h
In the formula, k = 1,2 m represents a record in T i , j = 1,2 n represents an environmental feature u j , and m is the cardinality of lightning strike faults.
The overall risk of the system is determined by the relative positions and structural composition of its internal components. For a series system, the failure of any single component will lead to the failure of the entire system. Thus, the overall system risk can be expressed as:
O s = 1 k = 1 n   ( 1 I k )
In the formula, O s represents the overall system risk, and I k denotes the component risk.
For a given fault record, this type of system failure occurs only when all the corresponding elements of the required environmental features are present. If any of these environmental feature elements does not fully match the historical lightning strike fault data, the failure may not occur. Therefore, for a series-structured system, assuming that the environmental features are independent of each other, the overall system risk can be determined by the comprehensive likelihood of system failure when the corresponding elements of each environmental feature are present. The mathematical expression is:
1 η p i k = 1 j = 1 n η 1 w , p i k = 1 j = 1 n k = 1 i k T i , j l i k T i k , n + 2 ; T i k , j = v j , w ; T i k , j u j l i k T i k , n + 2 ; T i k , j u j
Therefore, we can combine DRI and DDR to assess the risk of low-frequency elements. Thus, S j , w l can be expressed as:
S j , w l = α 1 · R D R I + α 2 · R D D R   0      v j , w u j l      v j , w u j h
In the formula, α 1 and α 2 are the influence weights of R D R I and R D D R , respectively, which can be determined based on actual requirements.
R D R I and R D D R represent the fault risks derived from DRI and DDR, respectively. Their mathematical expressions are as follows:
R D R I = 1 l = 1 t k = 1 i k T i , j l i k T i k , n + 2 ; T i k , j = v j , w ; T i k , j u j l i k T i k , n + 2 ; T i k , j u j 1 j = 1 n k = 1 i k T i , j l i k T i k , n + 2 ; T i k , j = v j , w ; T i k , j u j l i k T i k , n + 2 ; T i k , j u j
R D D R = 1 l = 1 t k = 1 i k T i , j l i k T i k , n + 2 ; T i k , j = v j , w ; T i k , j u j l i k T i k , n + 2 ; T i k , j u j 1 j = 1 n k = 1 i k T i , j l i k T i k , n + 2 ; T i k , j v j , w ; T i k , j u j l i k T i k , n + 2 ; T i k , j u j
In the formula, t denotes the cardinality of all elements, k = 1,2 m represents the fault records in the annual input database T i , and j = 1,2 n corresponds to the environmental feature u j .

5.2. Implementation Process of WA-ARM

The adaptive weight adjustment model method is as follows, and is illustrated in Algorithm 1 and Figure 6.
Algorithm 1 Adaptive Weight Adjustment Input
1:Initialize W , S h , S l ,
2:for each environmental feature u j in environmental features U do:
3:   ( u j h , u j l ) F r e q u e n c y   P a r t i t i o n ( T i , u j )
4:  for each element v j w in u j h do:
5:   S h [ v j w ] C o u n t ( T i [ : , j ] = = v j w ) / m
6:  end for
7:  for each element v j w in u j l do:
8:   R D R I C a l c u l a t e   D R I ( v j w , T i )
9:   R D D R C a l c u l a t e   D D R ( v j w , T i )
10:   S l v j w α 1 R D R I + α 1 R D R I
11:  end for
12:   W [ j ] S u m ( S h ) + S u m ( S l )
13:end for
14: W N o r m a l i z e ( W )
15:return W
  • For a given environmental element   u j , k : Use Equation (15) to calculate the high-frequency element’s risk influence S j , w h   on it. Use Equations (18)–(20) to calculate the low-frequency element’s risk influence   S j , w l   on it.
  • Use Equation (14) to compute the comprehensive risk score S v j , w   of the individual element   u j , k .
  • Repeat Steps 1–2 to determine the risk score S v j , w   for each element.
  • Calculate the predicted failure risk level for each fault record and normalize it (0 → 1: impossible to occur → certain to occur).

6. Results and Discussion

6.1. The Correlation Between Feature Factors and Lightning Strike Faults

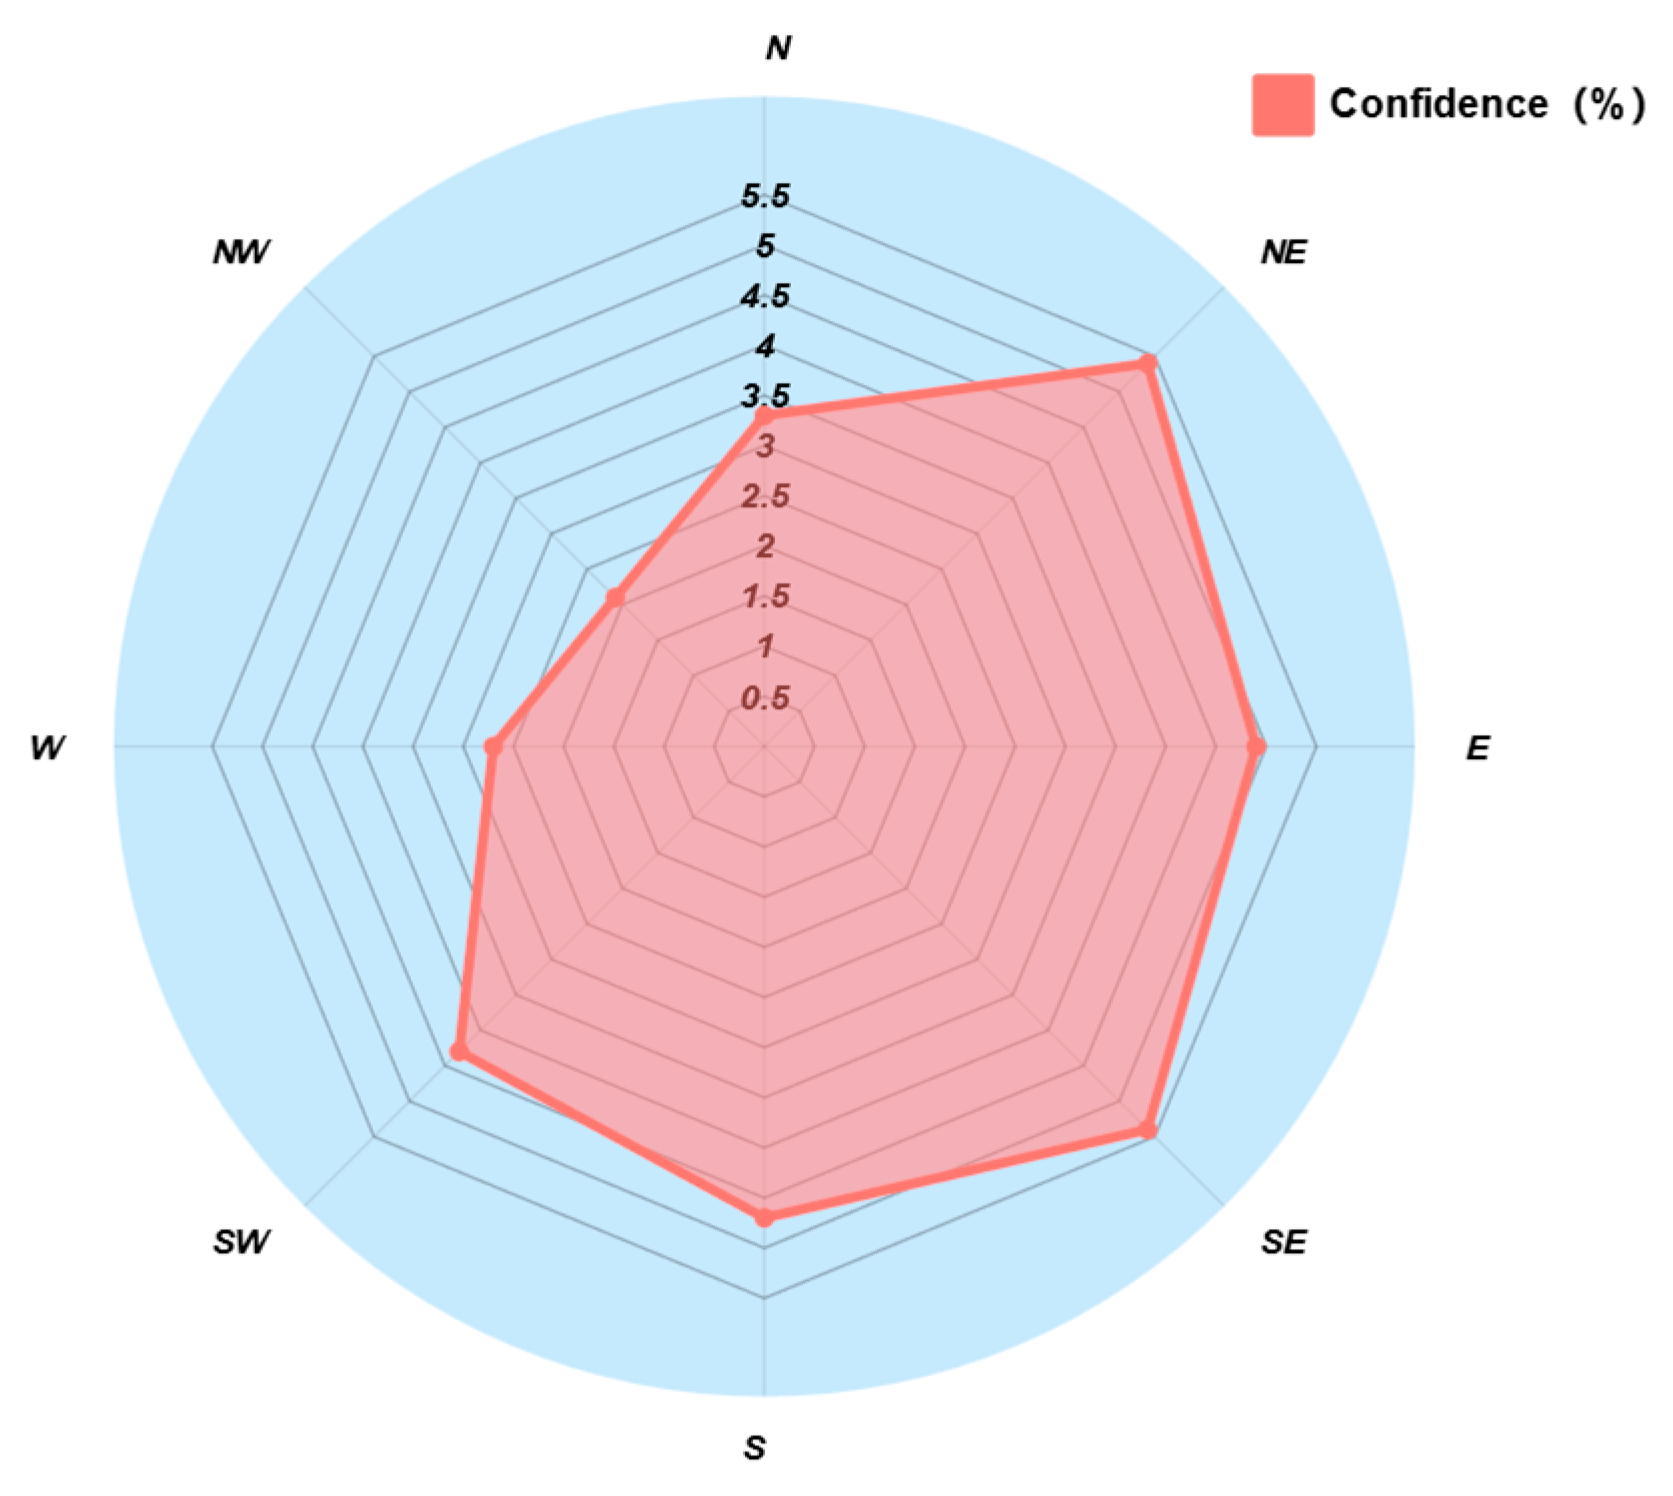
Taking the lightning trip records of an actual power grid in southern China as the research sample, the study focuses on analyzing the correlation between micro-topography environmental characteristic factors and line intrinsic characteristic factors with recorded lightning fault events based on Equation (2). As shown in Figure 7, the aspect of slope exhibits the strongest correlation with lightning faults. Southeasterly slopes demonstrate the highest association with lightning faults, primarily because lightning disasters are frequent in East China during summer. Influenced by the summer monsoon, southeasterly slopes serve as windward slopes, facilitating the uplift of moisture and leading to frequent frontal thunderstorms.
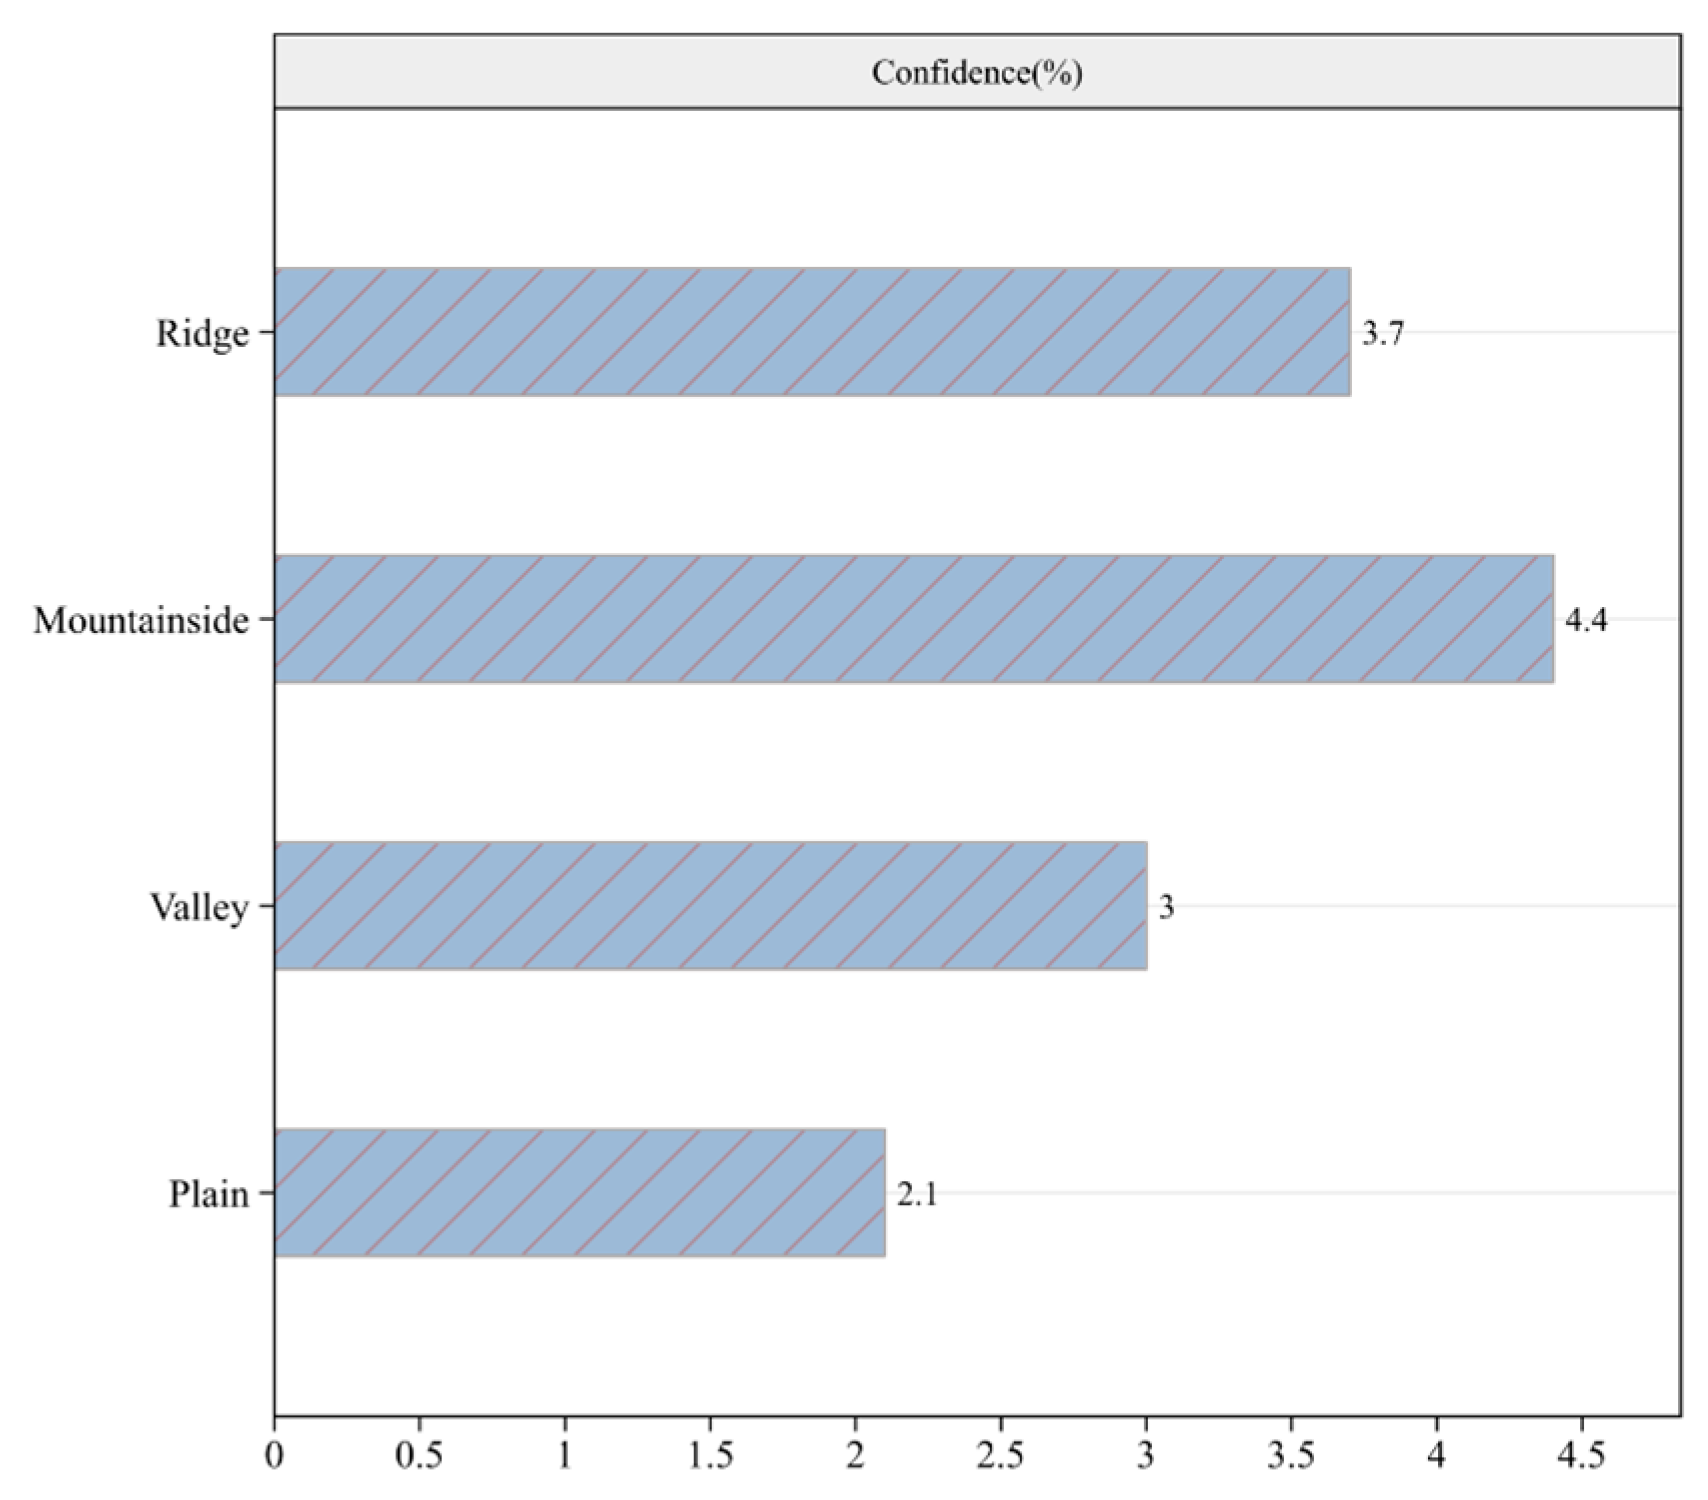
As shown in Figure 8, the slope position exhibits a correlation with lightning faults. Hillsides and ridges are more prone to lightning strikes compared to valleys and plains. The primary reason may be that ridges lose the shielding effect of terrain on power lines, increasing the probability of shielding failures (flashovers due to direct strikes). Meanwhile, hillsides often have steeper slopes, which facilitate the uplift of moisture and the formation of frontal thunderstorms, posing a greater lightning risk to transmission lines.
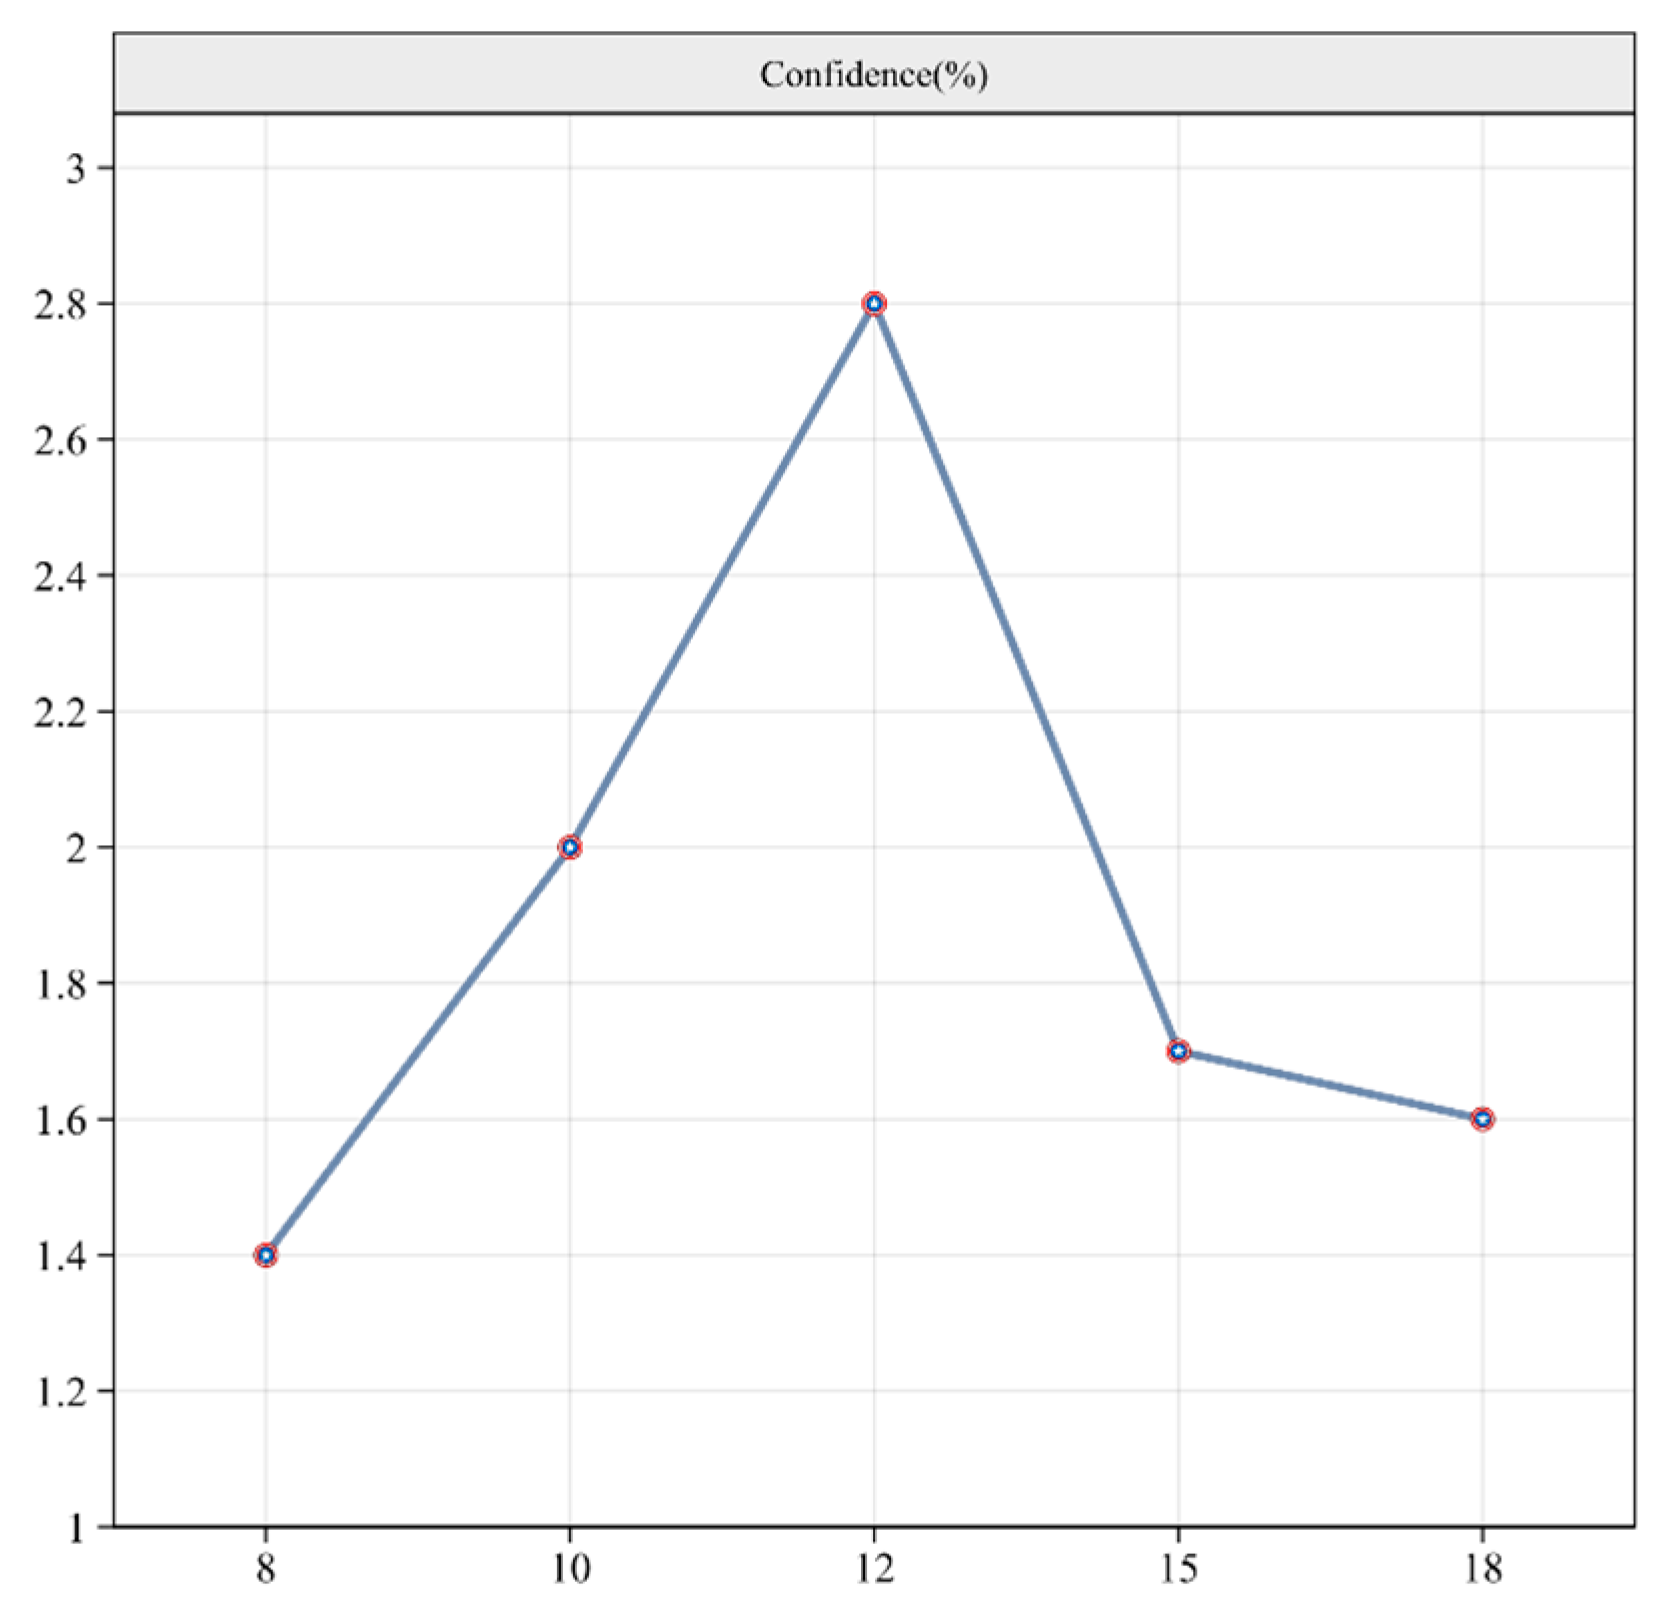
Figure 9 illustrates the correlation between tower height and lightning-induced faults on transmission lines. The association between lightning hazards and tower heights of 8 m to 12 m initially increases with height before subsequently declining. A possible explanation is that within the 8–12 m range, taller towers intensify electric field distortion effects, increasing the likelihood of lightning attraction and making upward leaders more probable. Additionally, 8–12 m towers predominantly support 10 kV overhead lines, whereas taller towers mainly carry 35 kV lines. Due to their higher voltage level, 35 kV lines are equipped with more robust insulation measures, thereby reducing the frequency of lightning-related tripping events.
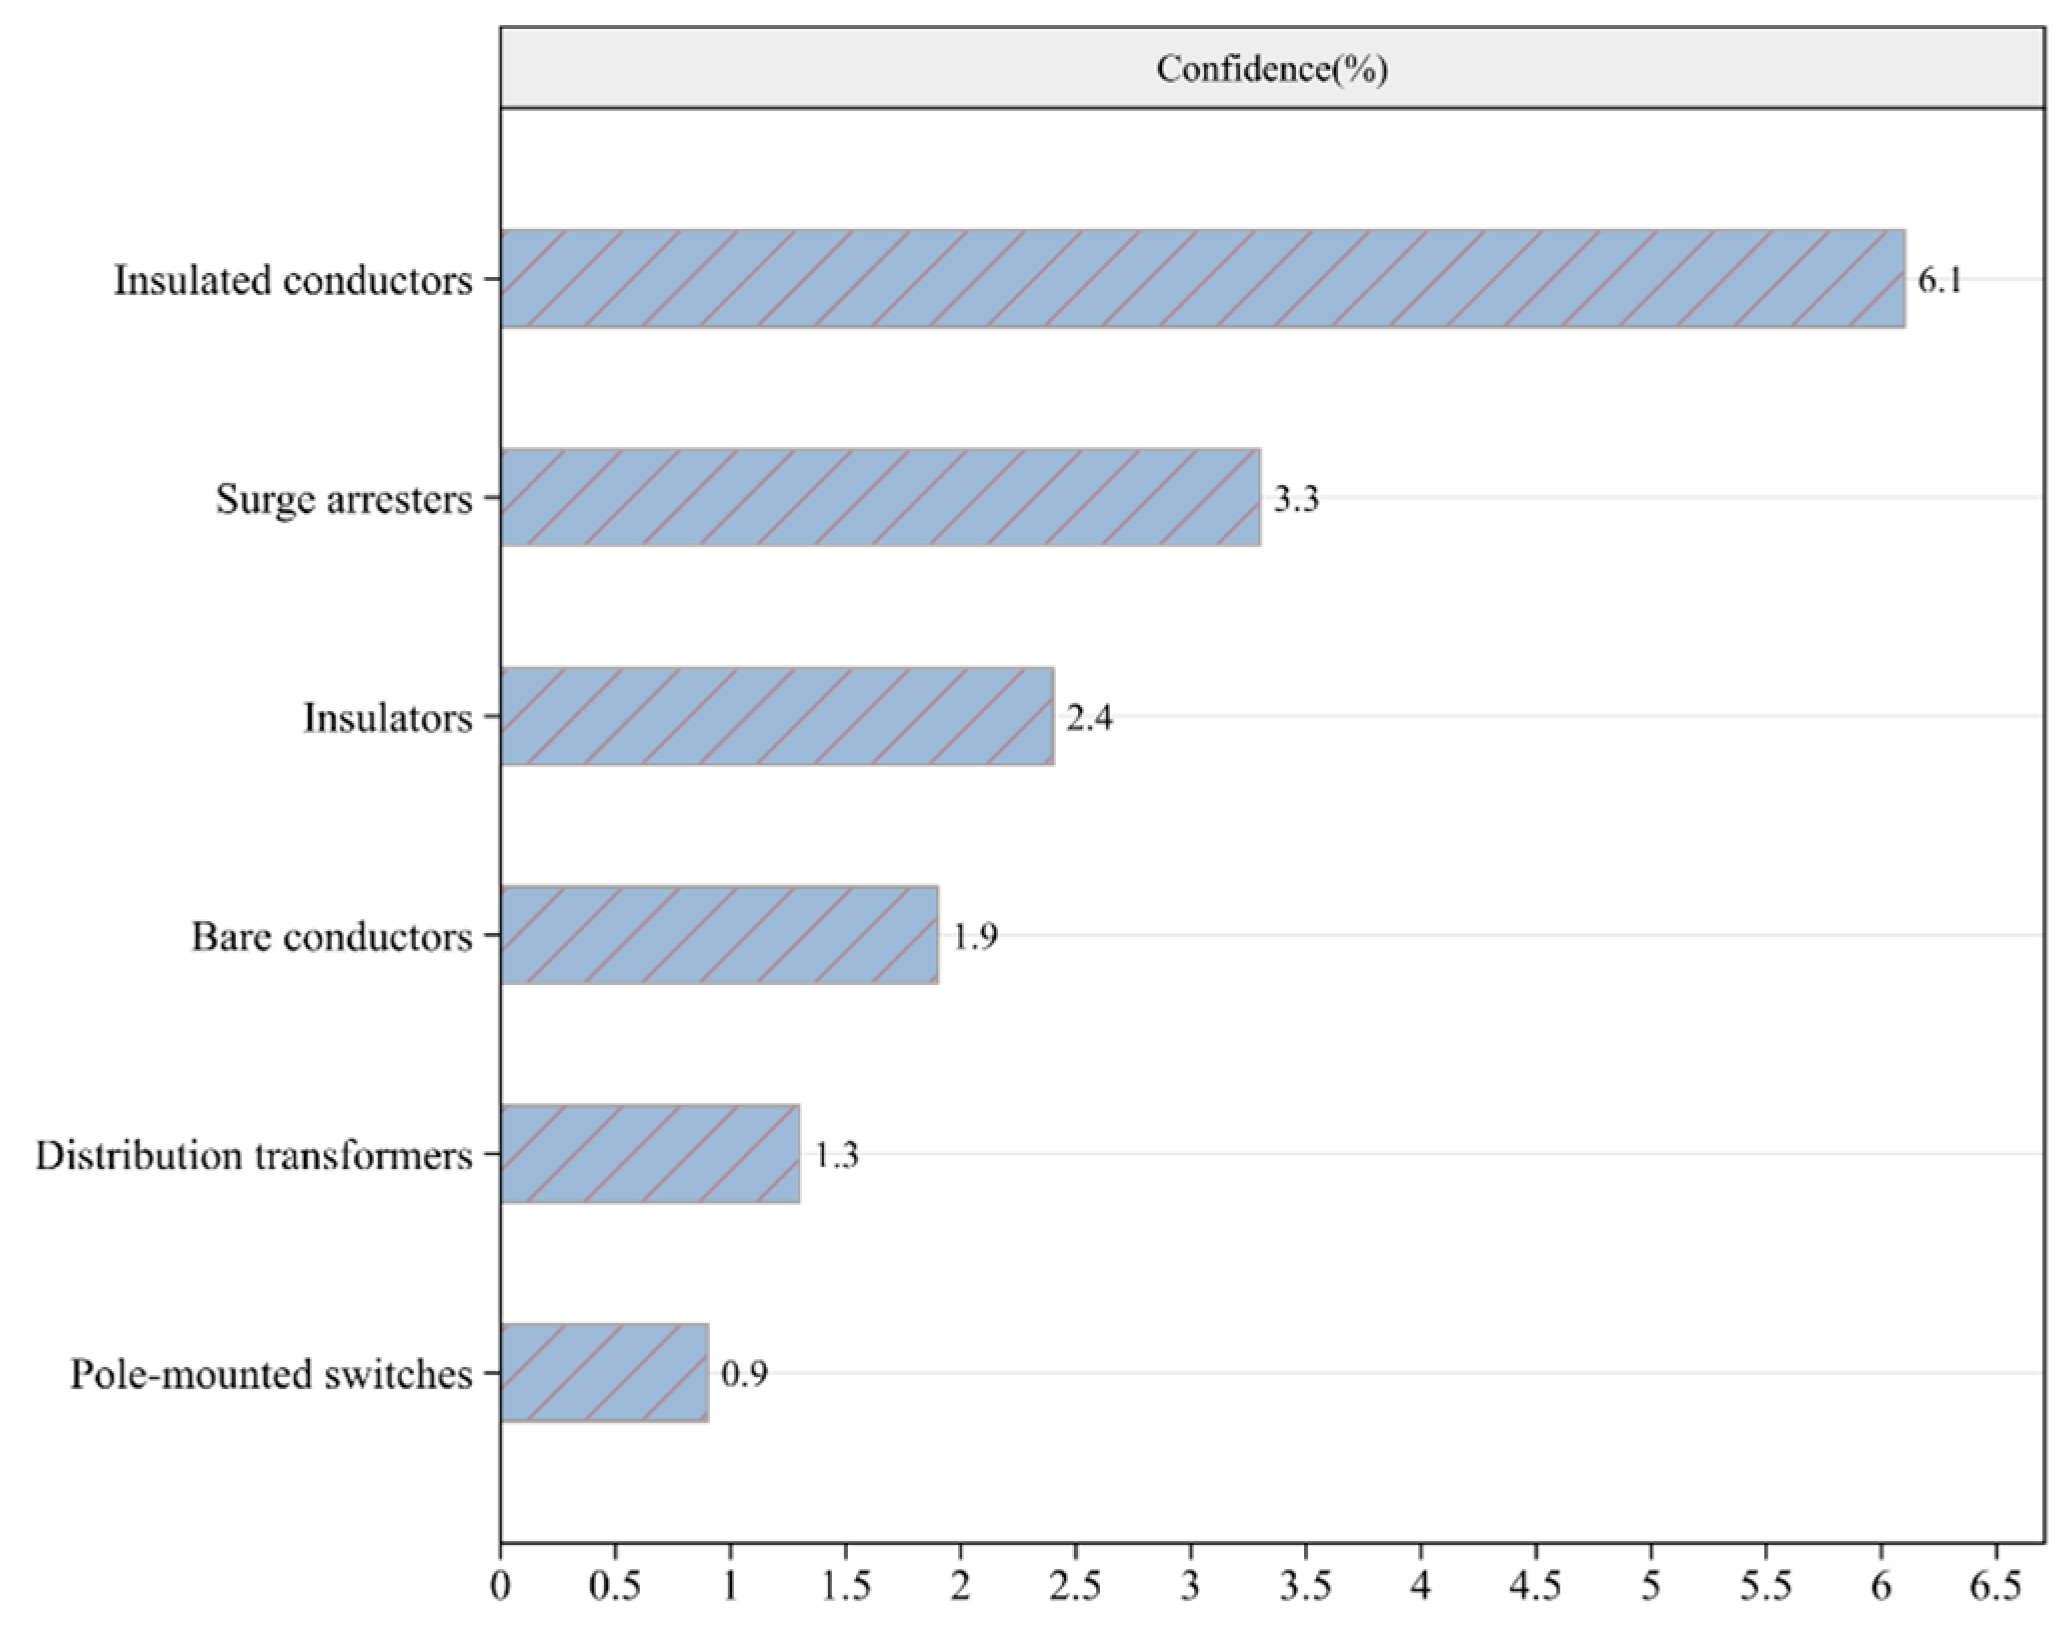
Figure 10 demonstrates the correlation between fault equipment and lightning-induced faults, with insulated conductors and surge arresters showing the strongest association. This is primarily because they serve as the first line of insulation defense, directly enduring lightning-induced overvoltage surges, which makes them more susceptible to damage. The nonlinear relationship shows peak risk at tower heights of 8–12 m, consistent with the “insulation configuration offsetting tower height risk” mechanism reported in the literature [34].
Compared to bare conductors, insulated conductors may experience power frequency, following the current at insulation weak points after puncture and leading to lightning-induced conductor breakage. In contrast, bare conductors, lacking insulation barriers, allow the arc root to travel farther along the line, causing the arc to self-extinguish before severe damage occurs.

6.2. Evaluation of Prediction Performance

The confusion matrix [33] can distinguish whether the model’s predictions are correct and is therefore commonly used for model performance evaluation. Based on the confusion matrix, two evaluation metrics are derived: the true positive rate (TPR) and the false positive rate (FPR), whose expressions are as follows.
T P R = T P T P + F N , F P R = T N T P + F N
The Receiver Operating Characteristic (ROC) curve [35] precisely describes the variation trend of TPR and FPR values. To intuitively assess the predictive performance of the ROC curve, this study adopts the Area Under the ROC (AUC) as the evaluation metric. Figure 11 illustrates the ROC interpretation graph. The top-left corner represents the perfect prediction point—the closer the curve is to this point, the better the predictive performance. The diagonal line indicates random prediction, suggesting the model lacks reliability. To account for uncertainty in ROC calculations, the standard error (SE) and confidence interval (CI) are also incorporated.

6.3. Lightning Failure Risk Hazard Test

This study conducted a ten-fold cross-validation test on the collected data. In each of the 10 tests, 9 folds were used as the training dataset, while the remaining fold was used for testing. The average predictive performance across all 10 tests was taken as the final predictive performance.
This paper selects three models for comparative evaluation: ARM, the combination of Conditional Screening and Unoptimized Weight Calculation (CS-ARM), and the combination of Conditional Screening and Weight-Adaptive Adjustment (CSWA-ARM).
Based on the input feature attributes studied in this paper (Table 1), a diagnostic threshold design method for low-frequency elements was applied to isolate the low-frequency elements, as shown in Table 2.
This study conducted grouped testing on the three classified levels of lightning strike fault severity. For each test group, the studied severity level was set as the positive sample, while the other two severity levels were treated as negative samples. For example, when testing the “low” severity group, fault records labeled as “low” were designated as positive samples, whereas records labeled as “medium” and “high” were assigned as negative samples.
We systematically evaluated parameter impacts using grid search across the α1–α2 space (bounds: [0.1, 1], grid density: 60 × 60), visualizing the AUROC surface through parametric sensitivity heatmaps. Concurrently, we optimized these weights via the Simulated Annealing (SA) algorithm to calibrate the CSWA-ARM model’s adaptive weighting module, maximizing the validation set AUROC for lightning fault risk classification. The SA configuration included parameter bounds [0.01, 1], an initial temperature of 100, a cooling coefficient of 0.95, a minimum temperature of 0.01, and 300 maximum iterations. The results present both the sensitivity heatmap and the SA convergence trajectory in the figure below.
To determine the relative weights α1 and α2 in the CSWA-ARM model, we employed a dual-optimization strategy combining grid search and simulated annealing. We systematically evaluated parameter impacts using grid search across the α1–α2 space (bounds: [0.1, 1], grid density: 60 × 60), visualizing the AUROC surface through parametric sensitivity heatmaps. Concurrently, we optimized these weights via the Simulated Annealing (SA) algorithm to calibrate the CSWA-ARM model’s adaptive weighting module, maximizing the validation set AUROC for lightning fault risk classification. The SA configuration included parameter bounds [0.01, 1], an initial temperature of 100, a cooling coefficient of 0.95, a minimum temperature of 0.01, and 300 maximum iterations. The results present both the sensitivity heatmap and the SA convergence trajectory in Figure 12 and Figure 13.
Global optimization results from the grid search identified the optimal parameters at α1 ≈ 0.96 and α2 ≈ 0.87, achieving peak AUROC = 0.941. Convergence analysis confirmed that the simulated annealing search reached a stable AUROC plateau within 108 iterations, with marginal improvements (<0.001) beyond this point. Robustness was validated through ten randomized restarts, all converging to the same solution neighborhood [0.96 ± 0.02, 0.87 ± 0.03], demonstrating consistent parameter sensitivity characteristics.
This study introduces SMOTE-ARM as a novel comparative baseline for extreme class imbalance scenarios. The implementation involves keeping all 1173 low-risk samples unchanged while selectively oversampling minority classes. For the high-risk category, each original sample generates 3.45 synthetic instances, increasing the count to 187. Similarly, each medium-risk sample produces 4.84 synthetic instances, also reaching 187. This adjustment balances both minority classes at 12.1% representation within the training set, effectively mitigating class skew. Synthesis employs Euclidean distance metrics with k = 3 nearest neighbors, while strict anti-leakage protocols ensure expansion occurs exclusively within each fold prior to cross-validation. The augmented training set is thoroughly shuffled before model retraining, upon which SMOTE-ARM is re-implemented.
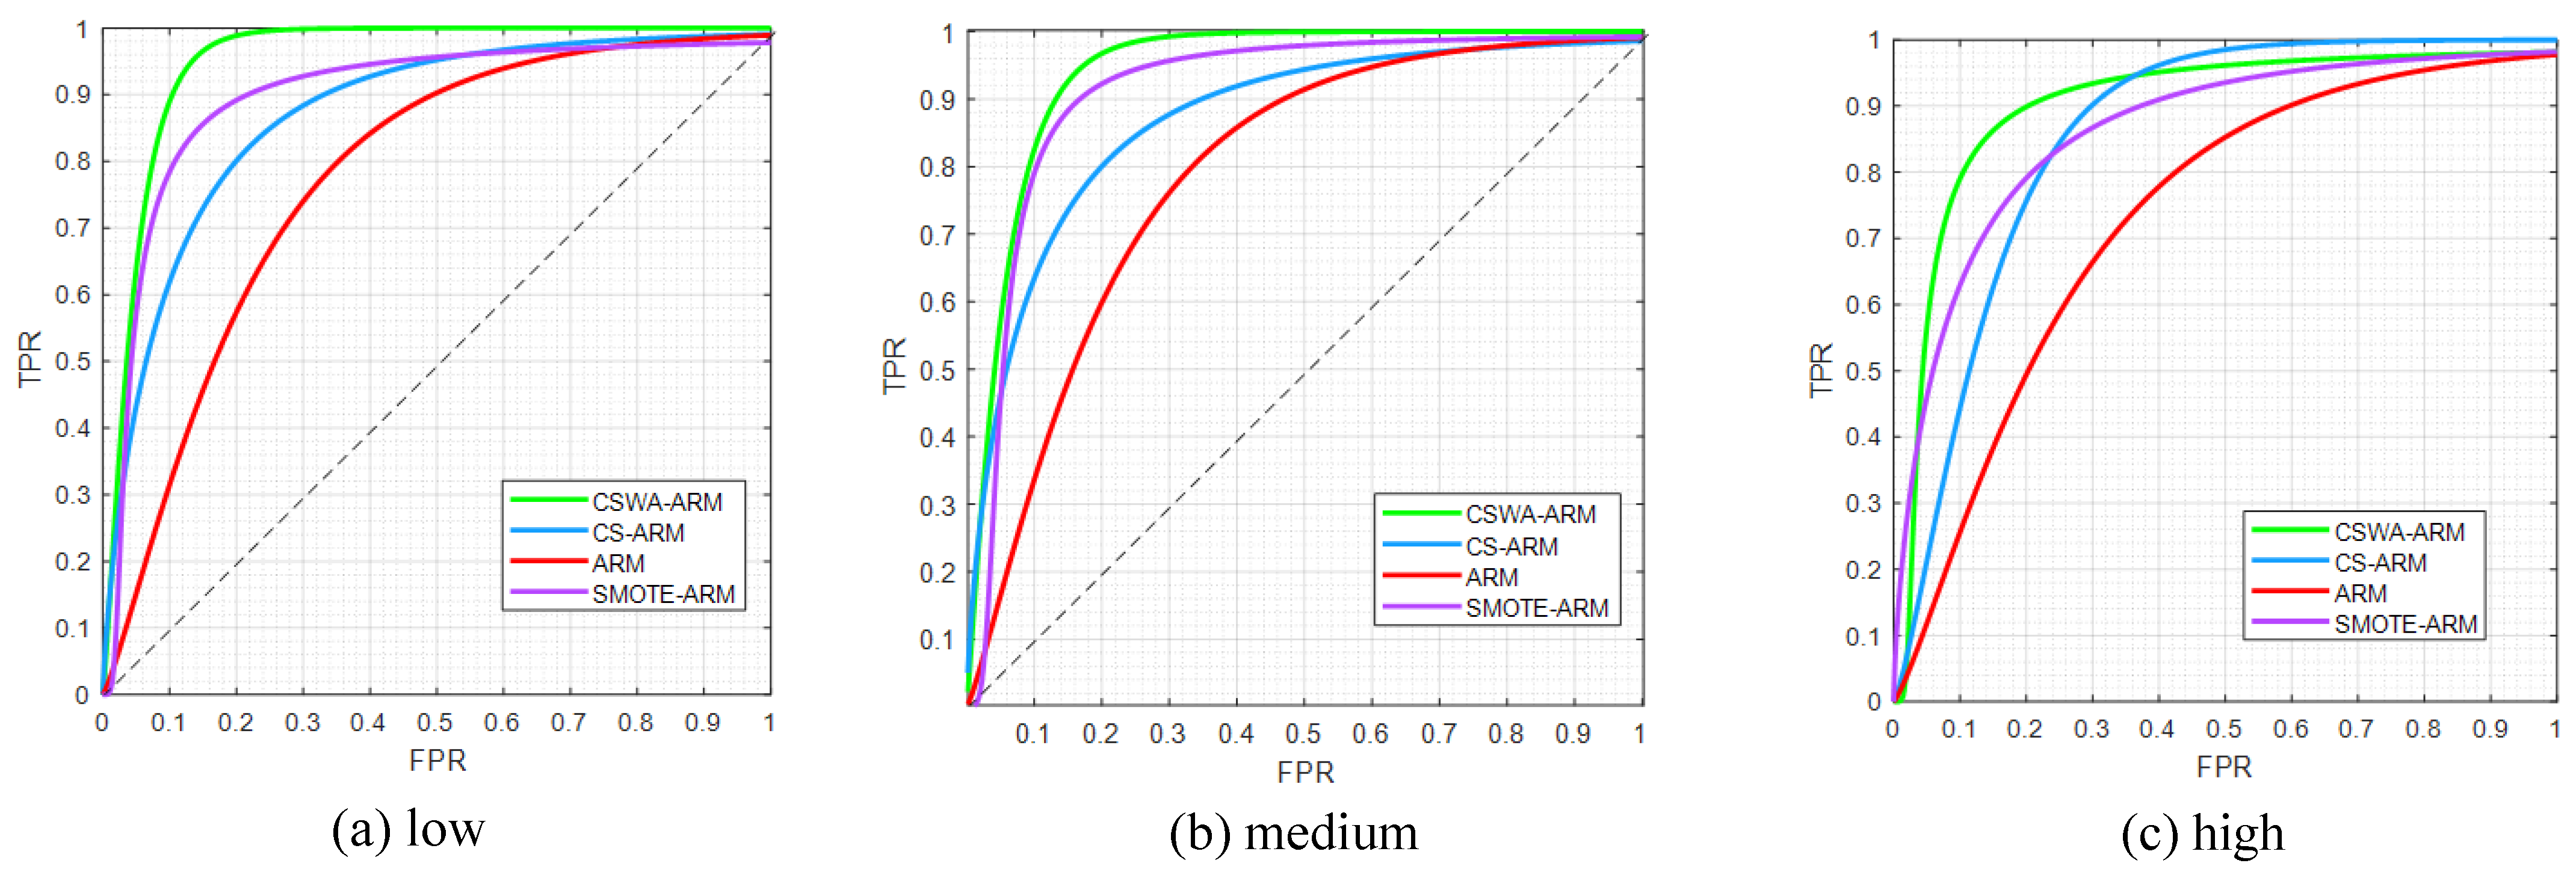
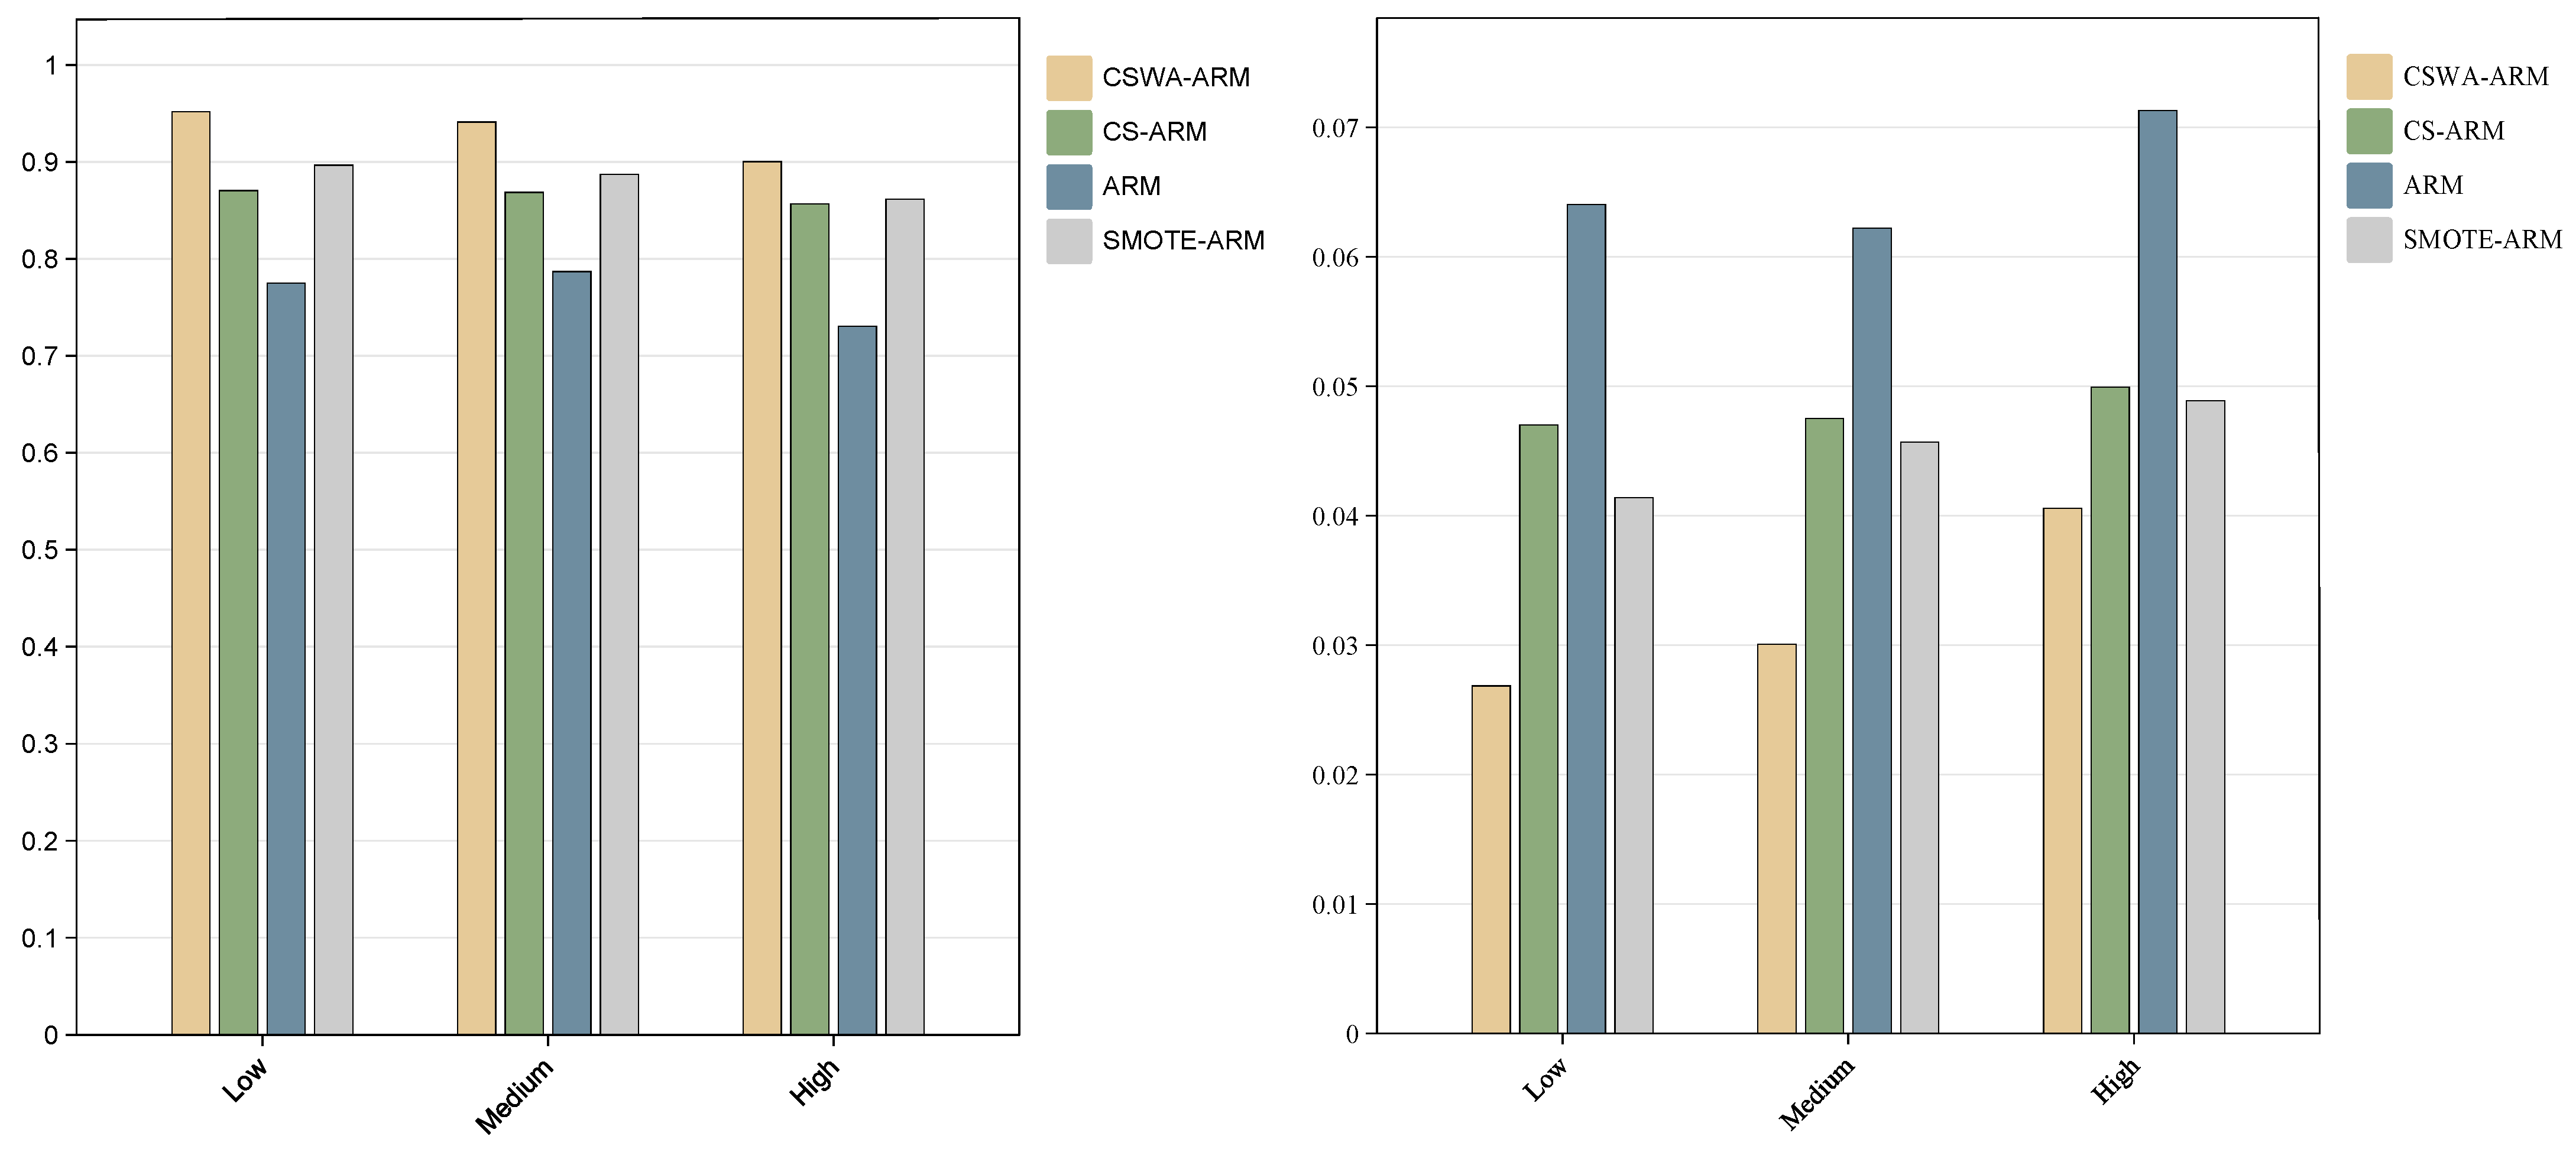
The comparative Receiver Operating Characteristic (ROC) curves of the evaluation results based on the SMOTE-ARM, ARM, CS-ARM, and CSWA-ARM models are shown in Figure 14. The detailed performance comparisons of the three models are presented in Figure 15 and Table 3.
From the comparison of ROC curves in Figure 14, it can be observed that both the CS-ARM and the CSWA-ARM evaluation models demonstrate superior predictive performance compared to the conventional ARM model. This is primarily because the diagnostic calculation method of the traditional ARM model is relatively rigid and may overlook rare environmental factors. Furthermore, the CSWA-ARM model outperforms the CS-ARM model in evaluation performance. By incorporating weight optimization, the CSWA-ARM model can more flexibly calculate element risk weights while accounting for rare factors, thereby improving accuracy.
Specifically, the data in the updated table demonstrate that, relative to ARM and CS-ARM, CSWA-ARM yields an average AUROC lift of 23.9% and 9.1%, respectively, while narrowing standard errors by 52.9% and 38.9% and widening confidence intervals by 19.8% and 8.5%. When benchmarked against the imbalance-aware SMOTE-ARM baseline, CSWA-ARM still delivers an average AUROC advantage of 4.4%, reduces SE by 12.1%, and extends CI coverage by 6.7%, further confirming the robust superiority of the proposed model.
Notably, according to the performance statistics in Figure 11, all three evaluation models exhibit higher accuracy in predicting “low” severity levels compared to “high” severity levels. The main reason is that when the lightning strike fault severity is low, the resulting consequences are relatively mild, allowing for better preservation of fault records and thus providing more sufficient sample data. In contrast, high-severity lightning faults often lead to catastrophic damage, severely impairing the power distribution network’s data acquisition equipment and resulting in missing or incomplete records, which ultimately affects evaluation accuracy.

7. Conclusions

This study proposes a Conditional Screening and Weight-Adaptive Association Rule Mining model. By inputting historical multi-source heterogeneous data into the model, it can predict lightning strike hazard levels and achieve risk prediction effects. The main contributions are as follows:
  • Inspired by risk matrix theory, we designed a lightning strike hazard-level matrix. This matrix demonstrates strong specificity in evaluating lightning strike risk, comprehensively considers economic loss factors, and simplifies the assessment process. These advantages enable it to better meet risk assessment requirements in specific application scenarios.
  • We proposed a diagnostic threshold-setting method for low-frequency elements and a calculation approach for hazard diagnostic criteria. This method incorporates previously neglected low-frequency elements into the analysis and identifies low-frequency, high-hazard factors. It addresses data imbalance issues from both temporal and spatial dimensions.
  • An adaptive weight adjustment model was developed. By assigning different relative weights, this model determines the varying impacts of environmental factors on overall system reliability, thereby further improving prediction accuracy.
  • Research Limitations
    (1)
    Data Dependency: The model requires all 14 feature fields listed in Table 1; due to dataset limitations, comprehensive model testing under extreme weather conditions could not be conducted.
    (2)
    Implementation Constraints: Actual system integration and field deployment tests have not been conducted due to current research limitations, primarily because real-time deployment requires multi-source data integration with SCADA and lightning monitoring systems, and hardware architecture adaptation for different grid companies’ needs.
These engineering challenges will be our main future research focus.

Author Contributions

Conceptualization, methodology, software, writing, S.T.; data curation, X.Y.; supervision, J.H. (Jie Huang); investigation, J.H. (Junyao Hu); validation, J.Z.; reviewing, S.L. All authors have read and agreed to the published version of the manuscript.

Funding

This research was funded by the National Natural Science Foundation of China, grant number 52177015.

Institutional Review Board Statement

Not applicable.

Informed Consent Statement

Not applicable.

Data Availability Statement

The data that support the findings of this study are available from [State Grid Yueyang Power Supply Company] but restrictions apply to the availability of these data, which were used under license for the current study and are not publicly available. Data are, however, available from the authors upon reasonable request and with permission from [State Grid Yueyang Power Supply Company].

Acknowledgments

We are very grateful to our colleagues on the team who supported the implementation of this project. We are also sincerely thankful to the editors and reviewers.

Conflicts of Interest

The authors declare no conflicts of interest.

References

  1. Xu, Y.; Tong, C.; Xiang, M.; Wang, T.; Xu, J.; Zheng, J. Lightning risk estimation and preventive control method for power distribution networks referring to the indeterminacy of wind power and photovoltaic. Electr. Power Syst. Res. 2023, 214 Pt A, 108896. [Google Scholar] [CrossRef]
  2. Chinese National Energy Administration (NEA) and China Electricity Council (CEC). National Electric Reliability Annual Report. 2020. Available online: https://prpq.nea.gov.cn/uploads/file1/20250331/67ea4fb889529.pdf (accessed on 3 August 2025).
  3. Tang, Y.; He, K.; Shu, H.; Wang, K.; Lou, W.; Qin, Z.; Han, Y.; Dai, Y. Reliability and Safety Assessment of Distribution Networks in Mountainous Plateau Areas Subject to Low-amplitude Lightning. Reliab. Eng. Syst. Saf. 2025, 264, 111305. [Google Scholar] [CrossRef]
  4. Yang, J.; An, Y.; Hu, Y.; Yao, S.; Pang, Z.; Qi, Y.; Sha, X.; Wang, Q.; Qu, L. Analysis of influencing factors of lightning strike damage of optical fiber composite overhead ground wire in distribution network. Electr. Power Syst. Res. 2025, 241, 111346. [Google Scholar] [CrossRef]
  5. Snodgrass, J.; Xie, L. Overvoltage analysis and protection of lightning arresters in distribution systems with distributed generation. Int. J. Electr. Power Energy Syst. 2020, 123, 106209. [Google Scholar] [CrossRef]
  6. Huang, J.; Lu, H.; Du, M. Coordinated development of digital economy and ecological resilience in China: Spatial—Temporal evolution and convergence. Environ. Dev. Sustain. 2025, 1–29. [Google Scholar] [CrossRef]
  7. Zhou, L.; Huang, L.; Wei, R.; Wang, D. A Novel Lightning Overvoltage Protection Scheme Using Magnetic Rings for Transmission Line Systems. IEEE Trans. Ind. Electron. 2023, 70, 12872–12882. [Google Scholar] [CrossRef]
  8. Xie, P.; Fang, Z. Lightning Performance of Unshielded 220 kV Transmission Lines Equipped With Metal Oxide Arresters. IEEE Trans. Electromagn. Compat. 2022, 64, 795–804. [Google Scholar] [CrossRef]
  9. Kuang, F.; Li, X.; Zhong, X.; Xu, Z.; Zhou, L. Classification of lightning strike risk for distribution line tower terrain in mountainous area. J. Electr. Power Sci. Technol. 2021, 36, 66–72. [Google Scholar]
  10. Zhang, H.; Deng, Y.; Wang, Y.; He, X.; Lan, L.; Wen, X. Joint diagnosis and validation of lightning risk for transmission lines by using multisource data. Electr. Power Syst. Res. 2024, 236, 110878. [Google Scholar] [CrossRef]
  11. Liu, H.; Han, Y.; Chen, C.; Chen, Y.; Cheng, Z.; Li, L. Research on lightning trip rate calculation and differentiated lightning protection of distribution line. Insul. Surge Arresters 2020, 296, 7–12. [Google Scholar]
  12. Zhang, M.; Liu, J.; Liu, Y.; Xia, L.; Chai, C.; Li, P. Lightning risk assessment of active distribution network with distributed photovoltaic system. Energy Rep. 2024, 12, 3711–3717. [Google Scholar] [CrossRef]
  13. Misuri, A.; Antonioni, G.; Cozzani, V. Quantitative risk assessment of domino effect in Natech scenarios triggered by lightning. J. Loss Prev. Process Ind. 2020, 64, 104095. [Google Scholar] [CrossRef]
  14. Piparo, G.B.L.; Maccioni, M.; Kisielewicz, T.; Mazzetti, C. Probability of Damage of Apparatus Powered by an HV/LV Transformer due to Lightning to a Structure Protected by a Lightning Protection System. In Proceedings of the 2023 International Symposium on Lightning Protection (XVII SIPDA), Suzhou, China, 9–13 October 2023; pp. 1–6. [Google Scholar]
  15. Souto, L.; Taylor, P.C.; Wilkinson, J. Probabilistic impact assessment of lightning strikes on power systems incorporating lightning protection design and asset condition. Int. J. Electr. Power Energy Syst. 2023, 148, 108974. [Google Scholar] [CrossRef]
  16. Wang, J.; Gao, S.; Yu, L.; Zhang, D.; Xie, C.; Chen, K.; Kou, L. Data-driven lightning-related failure risk prediction of overhead contact lines based on Bayesian network with spatiotemporal fragility model. Reliab. Eng. Syst. Saf. 2023, 231, 109016. [Google Scholar] [CrossRef]
  17. Zhou, Q.; Ye, J.; Yang, G.; Huang, R.; Zhao, Y.; Gu, Y.; Bian, X. Lightning risk assessment of offshore wind farms by semi-supervised learning. Eng. Appl. Artif. Intell. 2023, 126 Pt C, 107050. [Google Scholar] [CrossRef]
  18. Fister, I., Jr.; Fister, I.; Fister, D.; Podgorelec, V.; Salcedo-Sanz, S. A comprehensive review of visualization methods for association rule mining: Taxonomy, challenges, open problems and future ideas. Expert Syst. Appl. 2023, 233, 120901. [Google Scholar] [CrossRef]
  19. Veerappa, M.; Anneken, M.; Burkart, N.; Huber, M.F. Chapter 9—Explaining CNN classifier using association rule mining methods on time-series. In Explainable Deep Learning AI; Benois-Pineau, J., Bourqui, R., Petkovic, D., Quénot, G., Eds.; Academic Press: San Diego, CA, USA, 2023; pp. 173–189. [Google Scholar]
  20. Wu, W.; Wang, S.; Liu, B.; Shao, Y.; Xie, W. A novel software defect prediction approach via weighted classification based on association rule mining. Eng. Appl. Artif. Intelligence. 2024, 129, 107622. [Google Scholar] [CrossRef]
  21. Jia, P.; Zhang, J.; Zhao, B.; Li, H.; Liu, X. Privacy-preserving association rule mining via multi-key fully homomorphic encryption. J. King Saud Univ. Comput. Inf. Sci. 2023, 35, 641–650. [Google Scholar] [CrossRef]
  22. Nadakinamani, R.G.; Reyana, A.; Gupta, Y.; Kautish, S.; Ghorashi, S.; Jamjoom, M.M.; Mohamed, A.W. High-performance association rule mining: Mortality prediction model for cardiovascular patients with COVID-19 patterns. Alex. Eng. J. 2023, 71, 347–354. [Google Scholar] [CrossRef]
  23. Tandan, M.; Acharya, Y.; Pokharel, S.; Timilsina, M. Discovering symptom patterns of COVID-19 patients using association rule mining. Comput. Biol. Med. 2021, 131, 104249. [Google Scholar] [CrossRef]
  24. Ibrahim, N.A.; Alwi, S.R.W.; Manan, Z.A.; Mustaffa, A.A.; Kidam, K. Risk matrix approach of extreme temperature and precipitation for renewable energy systems in Malaysia. Energy 2022, 254 Pt C, 124471. [Google Scholar] [CrossRef]
  25. Pang, K.; Li, S.; Lu, Y.; Kang, N.; Zou, L.; Lu, M. Association rule mining with fuzzy linguistic information based on attribute partial ordered structure. Soft Comput. 2023, 27, 17447–17472. [Google Scholar] [CrossRef]
  26. Liu, W.; Wang, X.; Ye, P.; Jiang, L.; Feng, R. Safety accident analysis of power transmission and substation projects based on association rule mining. Environ. Sci. Pollut. Res. 2023, 1–12. [Google Scholar] [CrossRef]
  27. Huang, J.; Chen, C.; Sun, C.; Cao, Y.; An, Y. An integrated risk assessment model for the multi-perspective vulnerability of distribution networks under multi-source heterogeneous data distributions. Int. J. Electr. Power Energy Syst. 2023, 153, 109397. [Google Scholar] [CrossRef]
  28. Jiang, W.; Ma, S.; Zhang, Z.; Xu, Y. Study on Key Causal Factors and Pathways of Fire and Explosion Accidents in Hazardous Chemical Storage Tank Area. J. Loss Prev. Process Ind. 2025, 97, 105704. [Google Scholar] [CrossRef]
  29. Tu, X.; Fu, L.; Wang, Q. Carbon price prediction based on multidimensional association rules and optimized multi-factor LSTM model. Energy 2025, 329, 136768. [Google Scholar] [CrossRef]
  30. Nam, H.; Yun, U.; Yoon, E.; Lin, J.C.-W. Efficient approach for incremental weighted erasable pattern mining with list structure. Expert Syst. Appl. 2020, 143, 113087. [Google Scholar] [CrossRef]
  31. Lee, G.; Yun, U.; Ryu, K.H. Mining frequent weighted itemsets without storing transaction ids and generating candidates. Int. J. Uncertain. Fuzziness Knowl.-Based Syst. 2017, 25, 111–144. [Google Scholar] [CrossRef]
  32. Lee, G.; Yun, U.; Ryang, H.; Kim, D. Erasable itemset mining over incremental databases with weight conditions. Eng. Appl. Artif. Intell. 2016, 52, 213–234. [Google Scholar] [CrossRef]
  33. Rönkä, S.; Konttinen, H.; Kriikku, P.; Hakkarainen, P.; Häkkinen, M.; Karjalainen, K. Exploring the risk matrix of drug overdose deaths of young people: Drug use patterns, individual characteristics, circumstances, and environment. Drug Alcohol Depend. 2025, 274, 112757. [Google Scholar] [CrossRef] [PubMed]
  34. Xie, C.; Bai, J.; Wang, H.; Luan, L.; Zhu, W.; Wang, J.; Liu, Z. Lightning risk assessment method for overhead transmission lines based on multi-dimensional association information fusion. J. Electr. Eng. 2018, 38, 6233–6244. [Google Scholar]
  35. Phillips, G.; Teixeira, H.; Kelly, M.G.; Herrero, F.S.; Várbíró, G.; Solheim, A.L.; Kolada, A.; Free, G.; Poikane, S. Setting nutrient boundaries to protect aquatic communities: The importance of comparing observed and predicted classifications using measures derived from a confusion matrix. Sci. Total Environ. 2024, 912, 168872. [Google Scholar] [CrossRef] [PubMed]
Figure 1. Model frame.
Sustainability 17 07228 g001
Figure 2. Lightning-induced fault hazard-level matrix.
Sustainability 17 07228 g002
Figure 3. Threshold selection.
Sustainability 17 07228 g003
Figure 4. The distribution of hazard levels across all lightning fault records.
Sustainability 17 07228 g004
Figure 5. Implementation process of the CS-ARM prediction model.
Sustainability 17 07228 g005
Figure 6. Process of implementing the CSWA-ARM prediction model.
Sustainability 17 07228 g006
Figure 7. Slope direction correlation.
Sustainability 17 07228 g007
Figure 8. Slope position correlation.
Sustainability 17 07228 g008
Figure 9. Height of the tower correlation.
Sustainability 17 07228 g009
Figure 10. Faulty equipment correlation.
Sustainability 17 07228 g010
Figure 11. Illustration of ROC.
Sustainability 17 07228 g011
Figure 12. Parametric sensitivity heatmap. (* denotes the global optimal solution obtained through grid search).
Sustainability 17 07228 g012
Figure 13. Convergence curve.
Sustainability 17 07228 g013
Figure 14. Graphic comparison of ROC for lightning failure hazard-level test.
Sustainability 17 07228 g014
Figure 15. Statistical comparison of performance in the general case.
Sustainability 17 07228 g015
Table 1. Summary of feature and feature factors.
Attribute CharacterElement
Voltage10 kV, 35 kV
Transmission tower height (m)8, 10, 12, 15, 18
Circuit numberSingle circuit, double circuit
Faulty equipmentInsulators, distribution transformers, bare conductors, pole-mounted switches
Month1–12
Day1–30
Moment (h)1–24
Slope positionRidge, mountainside, valley, plain
WeatherSunny, overcast, cloudy, rainy, sleet, stormy
Temperature (°C)≤6, 7–12, 13–18, 18–24, ≥24
Air pressure (hPa)Average
Wind speed (m/s)Average
AspectE, N, S, W, NE, NW, SE, SW
Lightning failure hazard levelLow, medium, high
Table 2. Rare elements by support and confidence.
Attribute CharacterElement
Voltage35 kV
Transmission tower height (m)10, 15
Circuit numbertriple circuit
Faulty equipmentDistribution transformers
Month1, 2, 9, 10, 11, 12
Day1–30
Moment (h)1–24
Slope positionValley, plain
WeatherSunny, overcast, sleet, stormy
Temperature (°C)≤6, 7–12, 13–18
Air pressure (hPa)Average
Wind speed (m/s)Average
AspectN, W, NW, SW
Table 3. Numerical comparison of the performances.
CSWA-ARMAUCSECI
Low0.936400.031370.87492–0.95789
Medium0.918620.036090.84789–0.98935
High0.879560.045180.79100–0.96811
CS-ARMAUCSECI
Low0.858470.049550.76–0.0.92558
Medium0.837640.053550.73267–0.94260
High0.809950.058460.69538–0.92453
ARMAUCSECI
Low0.757030.066650.62641–0.88765
Medium0.705980.073220.56248–0.84948
High0.696320.074330.5504–0.84191
SMOTE-ARMAUCSECI
Low0.896620.041390.81550–0.97774
Medium0.887010.04570.80143–0.96733
High0.861680.04890.76583–0.95763
Disclaimer/Publisher’s Note: The statements, opinions and data contained in all publications are solely those of the individual author(s) and contributor(s) and not of MDPI and/or the editor(s). MDPI and/or the editor(s) disclaim responsibility for any injury to people or property resulting from any ideas, methods, instructions or products referred to in the content.