Review

Smart Technologies for Water Resources Management (WRM) in Semi-Arid Latin America: A Narrative Review and Adoption Agenda

by
Eduardo Alonso Sánchez Ruiz
1,
Lázaro V. Cremades
1,* and
Stephanie Villanueva Benites
2
1
Project and Construction Engineering Department, Universitat Politecnica de Catalunya (UPC), 08028 Barcelona, Spain
2
Industrial and ICT Engineering Manresa Department, Universitat Politecnica de Catalunya (UPC), 08242 Manresa, Spain
*
Author to whom correspondence should be addressed.
Sustainability 2026, 18(6), 3153; https://doi.org/10.3390/su18063153
Submission received: 11 February 2026 / Revised: 20 March 2026 / Accepted: 21 March 2026 / Published: 23 March 2026
(This article belongs to the Special Issue Smart Technologies Toward Sustainable Eco-Friendly Industry)

Abstract

Semi-arid territories in Latin America face chronic water stress; limited observability and fragmented institutions constrain effective water resources management (WRM). This narrative review synthesizes peer-reviewed evidence (2020–2026) on smart technologies that strengthen basin- and utility-level WRM, using Peru (Piura-like coastal semi-arid contexts) as an anchor and Latin America as a comparative lens. We used a structured, traceable database-based workflow and synthesized studies reporting measurable outcomes across five application categories: drought/flood early warning, hydrometeorological forecasting, water quality surveillance, non-revenue water (NRW)/leakage, and allocation and compliance. Findings were organized into an application-oriented taxonomy spanning remote sensing (RS) and GIS, Internet of Things (IoT)/telemetry, analytics/AI-enabled decision support, and hybrid approaches. Evidence most consistently reports operational gains (coverage, timeliness, predictive performance), while governance outcomes are less frequently measured and appear contingent on interoperability, digital capacity, and sustainable operations and maintenance (O&M) conditions. We conclude with a territorial adoption agenda specifying minimum enabling conditions and a phased pathway from pilots to scalable, eco-efficient smart WRM in Peru and comparable semi-arid settings across Latin America.

1. Introduction

Water stress in semi-arid regions is a global management challenge, as rising climate variability, demand pressures, and uneven monitoring capacity increasingly affect water availability and service reliability across arid and semi-arid settings. In Latin America, these pressures are compounded by hydrological variability, rapid urban growth, and uneven infrastructure, which increase exposure to droughts and service intermittency [1]. In these contexts, “water scarcity” is not only a physical constraint but also a management challenge shaped by limited observability, operational inefficiencies, and governance fragmentation [2,3,4,5]. These pressures highlight cross-sector interdependencies and reinforce the need for integrated WRM approaches that remain feasible under constrained institutional capacity [6].
Peru—particularly Piura-like coastal semi-arid settings—illustrates how limited observability of basin dynamics and distribution networks can constrain timely decision-making and effective enforcement [7]. These constraints are amplified by overlapping mandates and unequal technical capacity across actors, which weakens coordination and implementation. Evidence from water-scarce cities further shows that resilience is not achieved solely through additional supply; it depends on service reliability, risk management, and the institutional ability to coordinate, prioritize, and learn from interventions [5,8,9]. These pressures are intensified by climate-driven extremes and persistent data gaps, thereby reducing the capacity to anticipate drought/flood impacts, verify compliance, and target investments efficiently [10,11].
In parallel, digitalization is accelerating in sustainability research, positioning smart technologies as enablers of transparent, efficient, and adaptive resource management. Evidence links this transformation to improved sensing, analytics, automation, and decision support, contingent on interoperability, data governance, and sustainable operations and maintenance (O&M) [12,13,14,15]. In WRM, this translates into near real-time situational awareness and performance-based management across basin and utility levels [15,16,17,18].
This digitalization shift is reflected in the smart WRM literature, which can be organized into three application-oriented technology families. First, remote sensing and GIS extend hydrometeorological and hydrogeological assessment where ground networks are sparse, enabling drought-related indicators, basin diagnostics, and spatial screening for planning [19,20]. This line of work increasingly combines geospatial workflows with AI to improve interpretation and actionable insights, particularly under data scarcity and non-stationarity [21]. Second, IoT and telemetry strengthen operational control and environmental surveillance through sensor networks, smart metering, and SCADA-linked instrumentation for anomaly detection, water quality surveillance, and faster response [22,23]. Third, analytics and AI-enabled decision support systems enhance forecasting, anomaly detection, and risk management; evidence from water quality modeling shows sustained growth in ML applications alongside ongoing challenges in interpretability, generalizability, and data quality [24,25].
Despite this progress, the evidence base remains uneven in two ways that matter for Peru and comparable semi-arid territories. On the one hand, measurable operational outcomes are more consistently documented—such as improvements in early warning timeliness, forecasting accuracy, water quality surveillance, and NRW/leakage detection—especially where IoT is integrated with automation and asset management practices [26]. On the other hand, governance-related effects—particularly allocation and compliance, and less consistently transparency, participation, and accountability—are less consistently measured and often remain implicit, even though the enabling conditions—data interoperability, institutional coordination, and sustainable O&M financing—are repeatedly identified as decisive [27,28]. In resource-constrained settings, “pilot fatigue” is a practical risk: projects demonstrate technical feasibility but fail to scale because data pipelines, responsibilities, and budgets are not institutionalized [29,30,31].
Accordingly, a focused synthesis is needed on smart technologies that strengthen water resources management in Peru and comparable Latin American semi-arid contexts.
Unlike broader smart-water reviews, this review focuses on basin- and utility-level WRM in semi-arid settings, using Peru as an anchor case within a Latin American comparative lens. It synthesizes peer-reviewed evidence from 2020 to 2026 on measurable operational and governance outcomes and the barriers that shape movement from pilot projects to policy-relevant adoption pathways [32].
The objective is to identify which smart technology applications have demonstrated measurable operational and governance improvements for WRM in semi-arid settings and which enabling conditions support scale-up.
This review addresses three guiding questions: (i) What measurable operational and governance outcomes are reported for smart technology applications in basin- and utility-level WRM in semi-arid Latin American contexts (2020–2026)? (ii) Which application-oriented technology families and application areas dominate the evidence base (remote sensing/GIS, IoT/telemetry, analytics/AI-enabled DSS)? (iii) What barriers and enabling conditions shape implementation quality, integration, and scale-up from pilots to policy-relevant adoption—particularly regarding interoperability, institutional coordination, digital capacity, and sustainable O&M financing?

2. Materials and Methods

This section describes the scope and review design, eligibility criteria, information sources, search strategy and execution, record management (export, deduplication, and screening), and the data extraction and coding approach used to support narrative synthesis.

2.1. Scope and Review Design

This narrative review synthesizes peer-reviewed evidence published between 2020 and 2026 on smart technologies that support basin- and utility-level water resources management (WRM) in semi-arid contexts. This time window was selected to capture the most recent and policy-relevant phase of smart WRM research. It prioritizes contemporary evidence on measurable outcomes, implementation barriers, and scale-up conditions rather than earlier stages of digital-water development. Peru (Piura-like coastal settings) is used as an anchor case, with Latin America as the main comparative lens. To avoid missing transferable evidence, we also retained a limited set of globally relevant studies when they explicitly addressed semi-arid WRM applications and reported measurable outcomes.
The scope covers smart technology applications for WRM at basin and utility levels in semi-arid contexts. We prioritize studies reporting measurable operational outcomes and, when available, governance-related effects. Here, smart technologies for WRM are defined as digital and data-enabled solutions supporting five application categories plus an other label used for coding and synthesis: early warning, forecasting, water quality, NRW leakage, allocation and compliance, and other. For consistency, the master dataset used standardized labels.
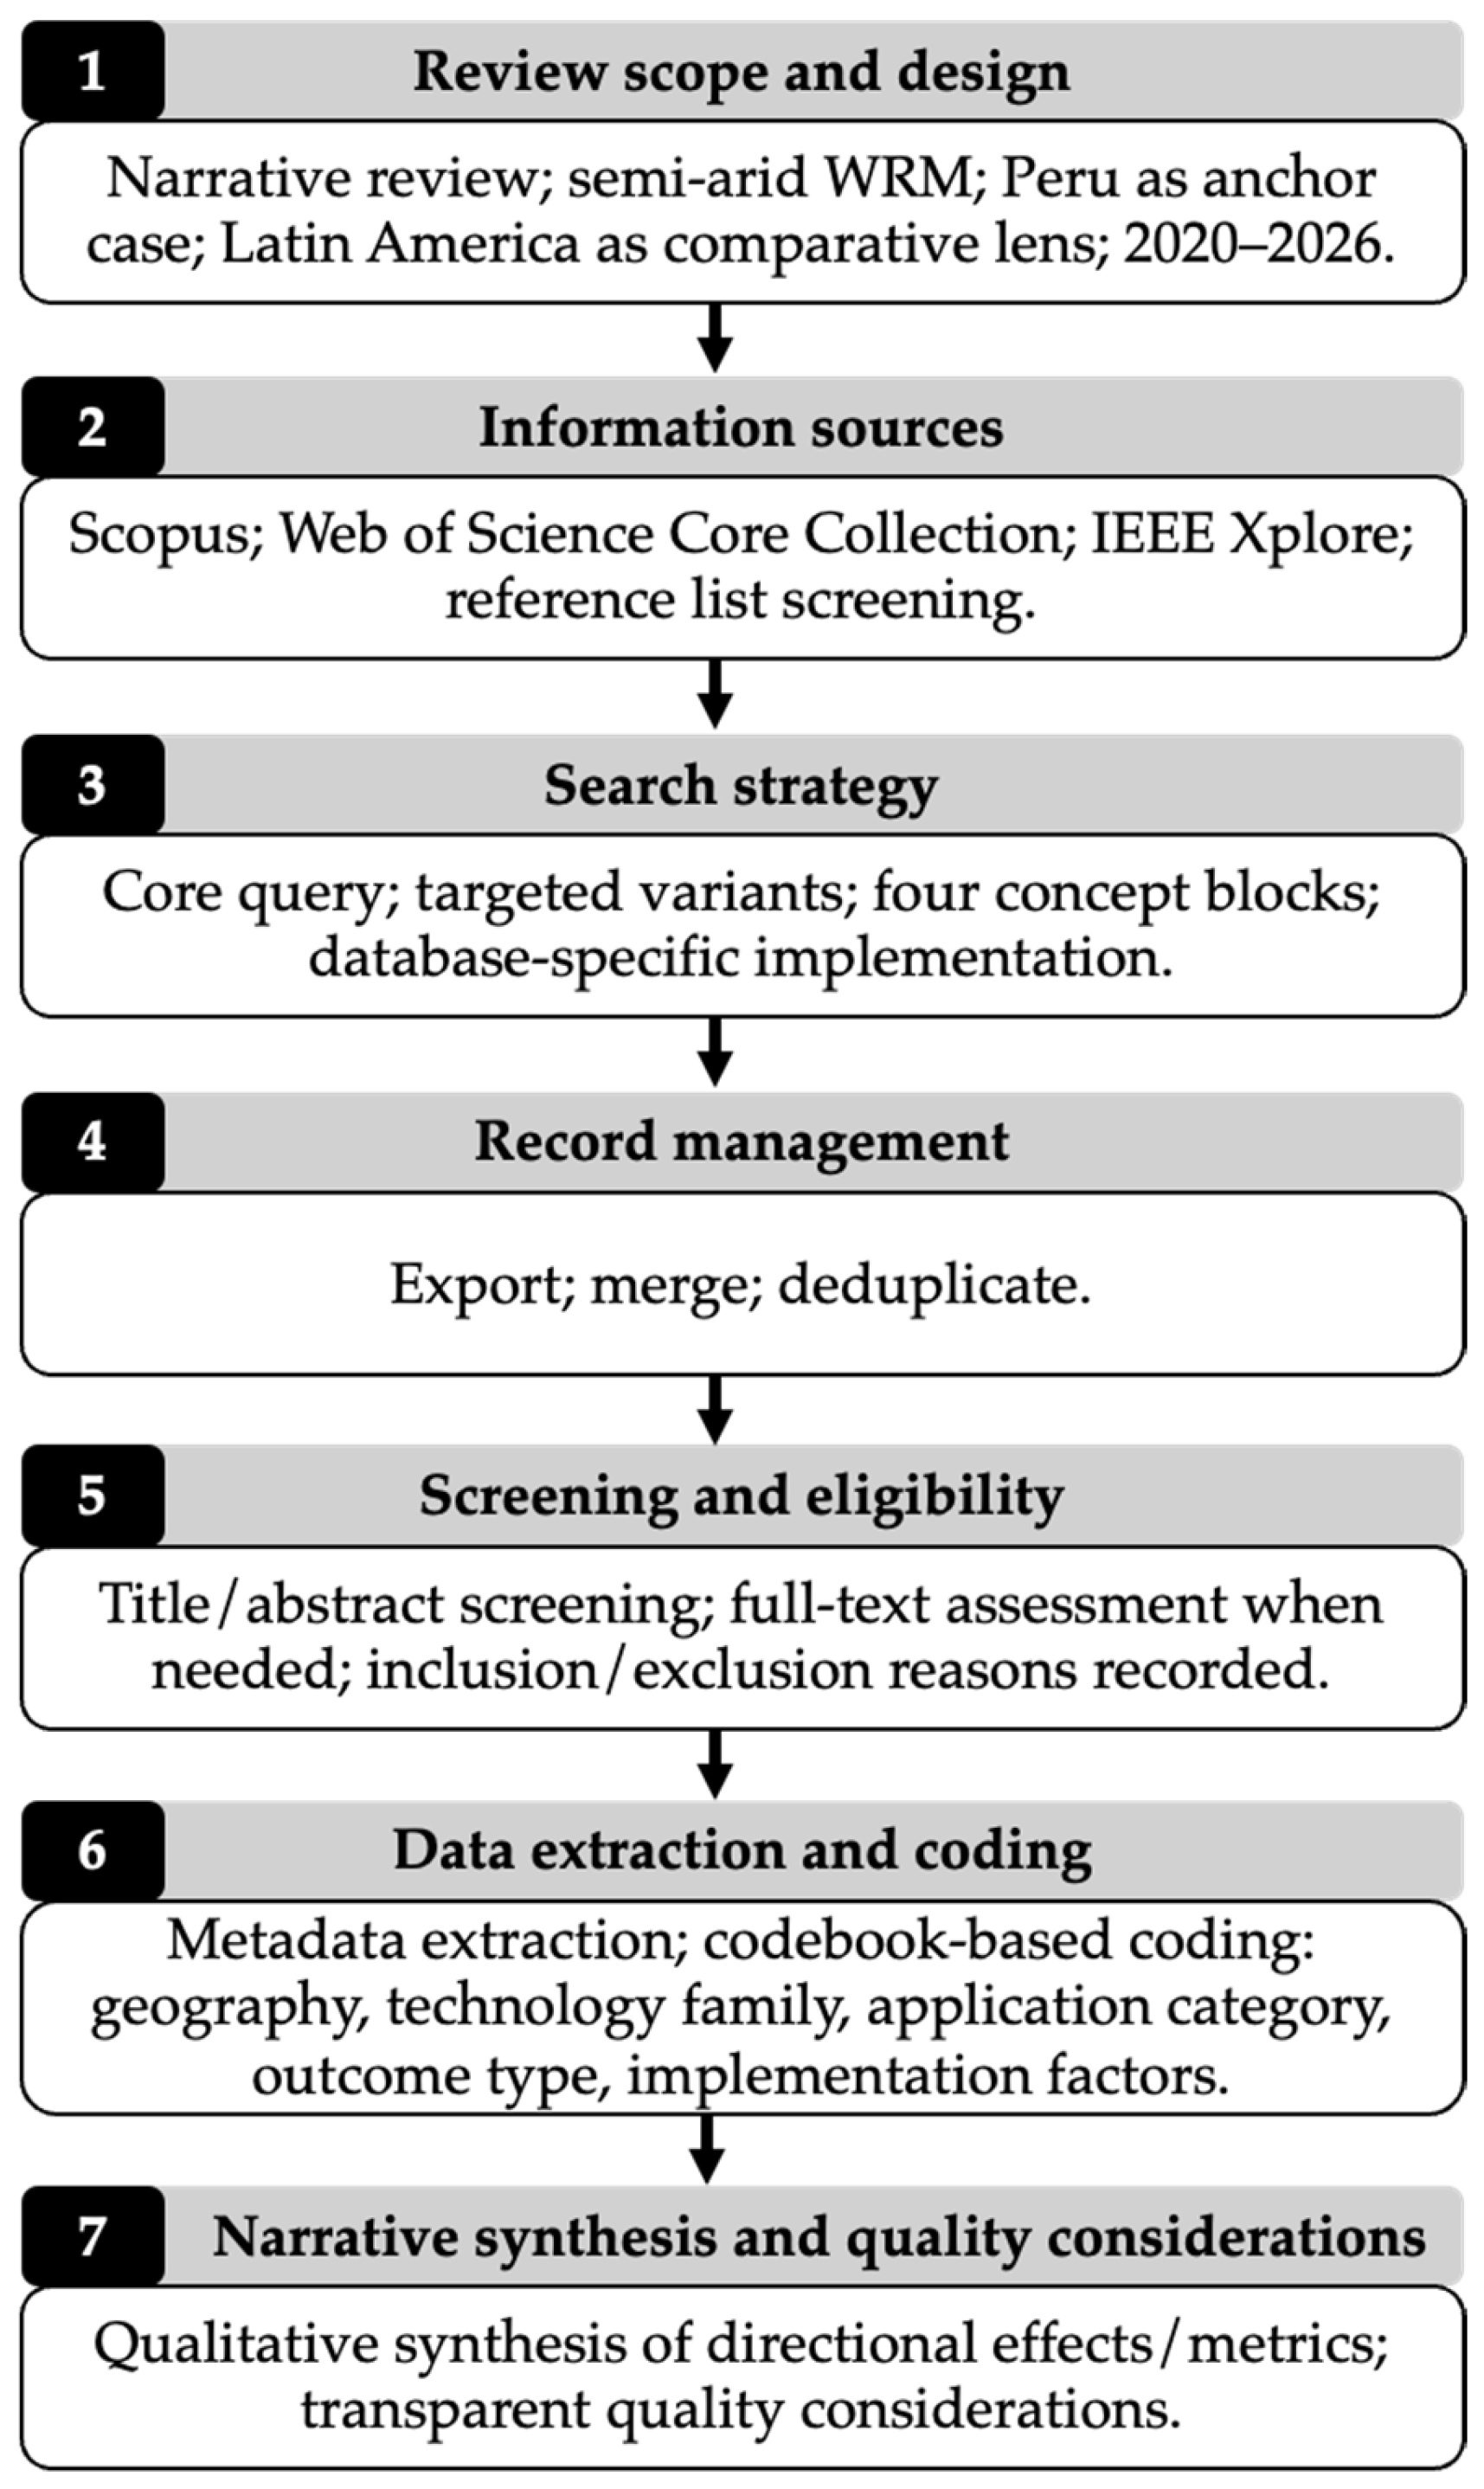
Evidence is grouped into three technological families: (1) remote sensing and GIS, (2) IoT/telemetry (including SCADA/AMI), and (3) analytics/AI and decision support systems (DSS). This review is narrative in its synthesis logic and interpretive purpose, as it aims to organize heterogeneous evidence into an application-oriented framework and draw context-sensitive implications for semi-arid WRM. Study identification and selection followed a structured process informed by PRISMA guidance and aligned with the SALSA logic for systematized reviews (Search, Appraisal, Analysis, and Synthesis), adapted to the review objectives and the semi-arid WRM context [33]. This structured component was used to improve transparency, consistency, and traceability in evidence selection and organization, rather than to frame the study as a full systematic review. The overall methodological sequence is summarized in Figure 1.

2.2. Eligibility Criteria

Eligibility criteria were defined a priori to ensure relevance to WRM, support consistent screening, and improve transparency and traceability across selection decisions. Exclusions were documented using standardized reasons in the master dataset to maintain consistency across title/abstract and full-text screening.

2.2.1. Inclusion Criteria

  • Time window: 2020–2026.
  • Document type: peer-reviewed journal articles (original research and reviews) and conference-derived publications were eligible only when methods and results were reported with sufficient clarity to support evidence extraction and coding; conference-derived records were not retained on document type alone.
  • WRM scope: basin- and utility-level WRM in semi-arid contexts (or clearly transferable settings).
  • Technology scope: remote sensing (RS) and GIS; IoT/telemetry (including SCADA/AMI); analytics/AI; decision support systems (DSSs).
  • Evidence requirement: reports at least one measurable outcome aligned with the coded application areas (early warning, forecasting, water quality, NRW leakage, or allocation and compliance).
  • Geographic scope: Peru as an anchor case and Latin America as the primary comparative region; studies from other regions were included only when they examined semi-arid or water-stressed contexts, addressed comparable basin- or utility-level WRM functions, and reported measurable outcomes or implementation conditions relevant to contextual transfer.

2.2.2. Exclusion Criteria

  • Primarily focused on agronomic productivity or irrigation yield without a clear basin/utility WRM contribution (agriculture or irrigation focus).
  • Did not report evaluable or measurable outcomes (no measurable outcome).
  • Not related to smart technologies as defined in Section 2.1 (not smart technology).
  • Outside the review boundaries (outside geographic scope, outside the time window, outside WRM scope).
  • Non-peer-reviewed literature (used only for background framing).
  • Insufficient information for screening or full-text assessment.

2.3. Information Sources

Searches were conducted in Scopus and the Web of Science Core Collection as the primary bibliographic databases. IEEE Xplore was used as a complementary source to capture engineering-oriented evidence on IoT/telemetry (including SCADA/AMI) and applied analytics relevant to WRM. To reduce omission risk, we screened reference lists of key included studies and examined papers citing them. Searches were executed between late January and early February 2026.

2.4. Search Strategy and Execution

Search strings were built around four concept blocks. The first defined the WRM context and management scale; the second captured the technology domain; the third targeted application and performance terms aligned with the coded outcome areas; and the fourth delimited the geographic lens, using Peru as an anchor and Latin America as the primary comparative region. The queries were then iteratively refined to balance recall and precision [33].
A core query was executed in each database and complemented by two targeted variants to capture recurring evidence clusters using different terminology: (a) IoT/telemetry for utility networks (NRW/leakage and distribution network management, including SCADA/AMI and related sensing/telemetry terms), and (b) RS/GIS and analytics for hydrometeorological risk (drought/flood; early warning/forecasting). AI/DSS-related studies were captured through the core query and later organized under the analytics/AI + DSS coding family.
Queries were implemented using database-specific fields (Scopus: TITLE-ABS-KEY; Web of Science (WoS): Topic [TS]; IEEE Xplore: metadata/abstract fields as available) and limited to 2020–2026. Records were exported and deduplicated prior to screening. Screening was conducted in two steps: combined title/abstract screening, followed by full-text assessment only when eligibility could not be confirmed from bibliographic information. The database search, deduplication, and primary screening workflow were conducted by the first author using the predefined eligibility criteria and screening protocol. Co-authors contributed through methodological oversight and review of the inclusion logic at key stages of the process. When bibliographic information or study scope raised borderline inclusion questions, these cases were discussed among the authors and resolved by consensus before final retention.
Across databases, 371 records were exported (Scopus n = 186; WoS n = 137; IEEE n = 48), resulting in 207 unique records after deduplication. Screening decisions were recorded by stage (title/abstract screening and full-text assessment). Exclusions were documented using 6 standardized reasons (agriculture irrigation focus, no measurable outcome, not smart technology, outside geographical scope, outside time window, outside WRM scope).

2.5. Data Extraction, Coding, and Synthesis

For each included study, we extracted bibliographic metadata (title, year, source, document type, DOI, abstract, and keywords). Bibliographic metadata were exported from each database using the available structured fields, standardized across sources in a master spreadsheet, and verified during deduplication and screening before coding. The included studies were then coded across the following dimensions:
  • Geographic scope: Peru, Latin America, globally relevant evidence transferable to semi-arid WRM, or other.
  • Technology family: (1) remote sensing and GIS, (2) IoT/telemetry (including SCADA/AMI), (3) analytics/AI and decision support systems (DSS), hybrid, or Other.
  • Application category: early warning, forecasting, water quality, NRW/leakage, allocation and compliance, or Other.
  • Outcome type: operational, governance, both, or not reported.
  • Implementation factors: barriers and enablers related to data availability/labeling, interoperability, energy/connectivity, O&M/financing, skills/capacity, and institutional arrangements.
We applied a predefined codebook with standardized labels to support consistent coding across records. A concise coding summary defining the application categories and outcome types used in the review is provided in Supplementary Materials. Primary coding was conducted by the first author. Co-authors contributed through review of category logic, interpretation of borderline classifications, and critical revision of the coded structure at manuscript-development stages. When a study could plausibly fit more than one category, final coding decisions were discussed among the authors and resolved by consensus to preserve internal consistency. This structured, table-based organization of the evidence base is consistent with systematized review practices [33]. Findings were synthesized qualitatively. We report directional effects and representative metrics, acknowledging heterogeneity in study designs and outcome measures.

2.6. Quality Considerations

Given the narrative design and heterogeneity in study types and outcome measures, we assessed robustness through transparent criteria rather than a single standardized critical appraisal checklist, consistent with guidance for narrative reviews that emphasize search transparency and the presentation of relevant evidence [34]. Specifically, we considered: (i) clarity of data sources and study setting, that is, whether the empirical context, data origin, and application setting were clearly identifiable; (ii) methodological reporting, including the description of data, models, and validation approach; and (iii) outcome reporting, including defined metrics, baselines, and evaluable performance evidence. During synthesis, greater weight was given to studies with explicit evaluation protocols and measurable outcomes, while descriptive or purely conceptual contributions were used only for contextual framing.

3. Results

This section reports the screened evidence base and synthesizes findings from the included studies. Results are presented first as a descriptive profile of the corpus and then as an application-oriented synthesis aligned with the proposed taxonomy and outcome categories.

3.1. Evidence Base and Descriptive Profile of Included Studies

The screened database was processed through a two-step selection procedure. First, records were assessed at the title/abstract stage; second, a subset underwent targeted full-text assessment when scope, outcomes, or technology descriptions were not sufficiently clear from the abstract. The distribution of inclusion and exclusion decisions across both stages is summarized in Table 1.
The included evidence concentrates toward the later years of the review window, suggesting a recent acceleration of smart technology applications for WRM in semi-arid contexts. The annual distribution of included studies across 2020–2026 is summarized in Table 2.
Most included items are journal articles, with conference-derived publications representing a smaller share of the evidence base and reviews accounting for a minor share. For presentation consistency, records indexed by the source databases as “conference paper” or “proceedings paper” were merged into a single conference-derived category for presentation in Table 3. Records with incomplete exported document-type metadata were manually verified during screening and reassigned where possible using the available bibliographic information and source fields.
Regarding information sources, Scopus and Web of Science contributed most of the included literature and showed substantial overlap. IEEE Xplore provided complementary technical coverage, including a subset of studies not captured by the other databases. The distribution of included studies by database overlap is summarized in Table 4.
In geographic terms, the included evidence is anchored in Peru and Latin America, with a smaller subset of studies considered transferable to semi-arid WRM contexts beyond the region. A residual group falls outside these categories. The distribution by geographic scope is summarized in Table 5.

3.2. Evidence Map Across Technology Families

Included studies were classified by application category—early warning, forecasting, water quality, NRW/leakage, and allocation and compliance—and then grouped by technology family (RS/GIS, IoT/Telemetry, Analytics/AI + DSS, and Hybrid). To preserve transparency and avoid forcing borderline cases into fixed categories, we used two residual codes. Other application captures enabling or ancillary functions, such as observability, planning support, and integration work, that do not fit consistently within the five application categories. Other tech families identify the few studies that fall outside the three core families and the hybrid stream. Table 6 summarizes the resulting evidence map by technology family and application category. Other application items are discussed within each family/stream, while the remaining edge cases are addressed in Section 3.4.
To complement the application-oriented evidence map (Table 6), studies were also coded by the type of reported impact: operational, governance, both, or not reported. This outcome-type lens helps distinguish performance-oriented evidence from studies reporting institutional or compliance-related effects, without re-classifying papers by application or technology. The distribution of outcome types across technology families is summarized in Table 7. Overall, operational reporting dominates, while governance-only outcomes are comparatively scarce.

3.3. Results by Technology Family

Across the three technology families (RS/GIS, IoT/Telemetry, and Analytics/AI + DSS) and the hybrid stream, evidence is organized and tabulated using five application outcomes to keep comparisons consistent across geographies. In addition, each family/stream includes a subset of studies coded as Other, which provide enabling capability (e.g., integration, observability, or planning support) but do not map consistently to the five outcome categories; these are discussed in-text and are not tabulated. Finally, a very small number of studies fall outside the three core families and the hybrid stream (coded as Other technology family in Table 6); these edge cases are addressed narratively in the cross-cutting synthesis (Section 3.4).

3.3.1. Remote Sensing and GIS (RS/GIS)

Early warning.
RS/GIS-enabled early warning focuses on basin-scale situational awareness for drought and flood risk. The evidence emphasizes spatially explicit hazard and exposure mapping, anomaly detection, and rapid post-event assessment using satellite-derived indicators and geospatial overlays. Reported contributions are primarily operational, improving timeliness and spatial coverage for monitoring and alerts, while governance effects are typically indirect (e.g., better targeting of preparedness actions rather than documented changes in enforcement or allocation rules) [35,36,37,38,39,40,41,42,43,44,45].
Forecasting.
Within RS/GIS, forecasting-oriented studies commonly use remotely sensed variables and indices as predictors or boundary conditions for hydrometeorological models, or as proxies in data-scarce basins. Contributions concentrate on improving forecast skill or extending lead time by integrating satellite-based precipitation, vegetation, evapotranspiration, soil moisture, or surface-water signals with in-situ records where available. Operational value is most visible where RS products reduce dependence on dense gauge networks; however, performance is sensitive to local calibration and the availability of reliable ground truth [46,47,48,49,50].
Water quality.
RS/GIS applications for water quality emphasize surveillance and screening rather than regulatory control. Studies typically use satellite proxies (e.g., turbidity-related reflectance patterns) and geospatial classification to flag potential quality issues, identify hotspots, and prioritize field sampling. The evidence most consistently supports improved monitoring reach and frequency in data-limited settings, but fewer papers quantify downstream corrective actions or compliance outcomes [51,52,53,54,55].
NRW/leakage.
NRW/leakage is largely absent from the RS/GIS family in the screened corpus, reflecting the separation between basin-scale geospatial monitoring and distribution-network instrumentation. Leakage control is therefore discussed under the IoT/Telemetry and Analytics/AI + DSS families.
Allocation and compliance.
A small subset of RS/GIS studies links geospatial information to allocation-relevant decisions through spatial prioritization, zoning, or risk-informed planning tools. However, measurable compliance or enforcement outcomes are rarely reported, and Peru-specific allocation and compliance evidence within RS/GIS was not observed in the screened corpus. This pattern suggests that geospatial transparency and diagnostic capacity alone are insufficient without interoperable data systems and institutional mechanisms that convert RS/GIS insights into enforceable allocation and compliance actions [56].
Other.
In the RS/GIS family, “Other” captures enabling contributions that improve WRM observability, inputs, or integration but do not align consistently with the five main application categories. Typical examples include hydrologic intelligence for diagnosis and planning, water-balance components and basin states, precipitation-bias correction, snow and cryosphere indicators, and surface-water or storage monitoring relevant to operational use [57,58,59,60,61,62,63,64,65]. Collectively, these studies improve what is observed and when it is observed, but they less often report decision rules, institutional uptake, or compliance effects. In semi-arid Latin America, this residual evidence remains policy-relevant because it supports drought diagnosis, climate-stress assessment, source-area prioritization, and basin planning.
Summary.
Overall, RS/GIS provides the most consistent evidence for basin-scale observability and risk intelligence, especially for early warning and forecasting, and it also supports targeted water quality screening. Across studies, reported gains are mainly operational, including improved coverage, timeliness, and monitoring continuity, while durable governance effects are less frequently documented. Recurrent constraints include data and validation needs, limited gauge networks, and the institutional capacity required to translate geospatial products into routine decision workflows. A smaller subset of RS/GIS studies was coded as “Other” because it supports WRM functions without fitting consistently into the five main application categories. Table 8 synthesizes the RS/GIS evidence cited in this section by application outcome and geographic scope (Peru, Latin America, and transferable/global studies).

3.3.2. IoT/Telemetry

Early warning.
IoT/Telemetry-enabled early warning relies on in situ sensing and near real-time data transmission to detect hazardous conditions and trigger alerts. Evidence in this family emphasizes timeliness and continuity of monitoring (e.g., hydromet or network conditions) as the main operational gain, while governance impacts are typically indirect and depend on the existence of response protocols and inter-agency coordination [66].
Forecasting.
Within IoT/Telemetry, forecasting applications use high-frequency operational data (e.g., flows, levels, pressures, consumption) to improve short-term prediction and operational planning. Reported value concentrates on better demand and system-state estimation under variability and intermittency, although performance depends on sensor reliability, data quality, and integration with existing operational workflows [67].
Water quality.
IoT/Telemetry applications for water quality rely on online sensing and near real-time transmission to support earlier anomaly detection and faster operational response than periodic sampling. In the screened corpus, evidence is limited and primarily operational, emphasizing increased visibility and quicker incident identification, while long-term performance is conditioned by sensor upkeep (calibration and replacement) and reliable connectivity and power [68].
NRW/leakage.
NRW/leakage is the most distinctive application area for IoT/Telemetry in the screened corpus. Studies report improved leakage detection and monitoring, pressure and flow visibility, and metering-enabled insights that support loss reduction and service reliability. Reported implementation constraints repeatedly include intermittent supply, sensor upkeep, communications and energy costs, and integration with legacy systems [69,70,74].
Allocation and compliance.
Direct evidence linking IoT/Telemetry to allocation enforcement or compliance outcomes was not observed in the screened corpus. Where relevant, IoT/Telemetry is best understood as an enabling layer—improving measurement, traceability, and operational transparency—whose contribution to compliance depends on institutional rules, enforcement capacity, and interoperable data governance.
Other
In the IoT/Telemetry family, “Other” captures enabling contributions that improve WRM observability, inputs, or operational integration without reporting outcome-level evidence aligned with the five main application categories. Typical examples include instrumentation and sensor–gateway architectures, as well as near real-time data capture in challenging environments. These studies usually improve data availability, continuity, or operational readiness, but they less often report outcome metrics such as alert skill, forecast accuracy, NRW reduction, or compliance improvement [71].
Summary.
Overall, IoT/Telemetry evidence is predominantly operational and centered on near real-time visibility and control at the network or utility level. Reported value most often relates to improved monitoring continuity and faster detection or response cycles. Recurrent barriers are practical and persistent, including O&M demands, energy and connectivity constraints, interoperability with legacy platforms, and the institutional capacity needed to translate telemetry into routine decision and response protocols. A small subset is coded as Other because it supports instrumentation or integration functions without outcome-level reporting. Table 9 summarizes the IoT/Telemetry evidence cited in this section by application outcome and geographic scope.

3.3.3. Analytics/AI + DSS

Early warning.
Analytics/AI-enabled early warning typically uses machine learning, statistical learning, or hybrid modeling to detect emerging hazards and to support trigger-based alerts. Evidence in this family emphasizes improved detection capability and more informative risk signals from multi-source data (e.g., hydroclimate, remote sensing, and operational records). Compared to RS/GIS-only approaches, Analytics/AI often shifts the contribution from “observability” to “actionable inference,” although model reliability depends on data quality, representativeness, and validation [72,73,75].
Forecasting.
Forecasting is a core application area for Analytics/AI + DSS. Studies commonly report improved predictive performance for hydrometeorological variables (e.g., precipitation, streamflow, soil moisture, evapotranspiration, or reservoir-relevant dynamics), particularly when models integrate heterogeneous predictors and capture non-linear behavior. Reported constraints frequently include limited labeled data, transferability across basins, and the need for clear validation and uncertainty reporting to support operational use [76,77].
Water quality.
Analytics/AI applications for water quality focus on classification, anomaly detection, and predictive assessment using sensor data, remotely sensed proxies, and contextual variables. The evidence highlights faster identification of contamination risks or quality excursions and improved targeting of sampling and interventions. However, sustained operational impact depends on reliable data pipelines and on institutional capacity to act on analytics outputs [78,79].
NRW/leakage.
Within Analytics/AI + DSS, NRW/leakage is typically addressed through anomaly detection, ensemble learning, and decision-support approaches aimed at identifying non-visible leaks and prioritizing intervention. Studies leverage distribution-network operational data to generate actionable signals (e.g., suspected leak events or network condition indices). Key limitations include data completeness and quality, intermittent supply confounding signals, and the integration of analytics outputs into utility workflows and asset management systems [80,81].
Allocation and compliance.
Direct evidence linking Analytics/AI + DSS to allocation enforcement or compliance outcomes was not observed in the screened corpus. Where relevant, Analytics/AI + DSS is best understood as an enabling layer—improving measurement, traceability, and operational transparency—whose contribution to compliance depends on institutional rules, data interoperability, and enforcement capacity.
Other.
In the Analytics/AI + DSS family, Other captures enabling contributions that improve WRM observability, inputs, or integration without reporting outcome-level evaluation aligned with the five main application categories. Typical examples include planning-oriented decision support under uncertainty, methods that strengthen hydro-environmental observability, and tools that improve the temporal resolution or detection capacity of hydrologic products [82,83,84]. These contributions can later support early warning, forecasting, or planning workflows, but they usually do not report attributable performance gains or governance effects.
Summary.
Overall, Analytics/AI + DSS concentrates evidence on predictive and decision-support value, with reported contributions spanning operational optimization and planning under uncertainty. Recurrent barriers are largely implementation-critical: data availability and labeling, model validation and transparency, interoperability with legacy systems, and the organizational capacity required to embed analytics into routine decision processes and accountability mechanisms. A limited subset is coded as “Other” because it supports analytical methods or planning tools without outcome-level reporting. Table 10 summarizes the Analytics/AI + DSS evidence cited in this section by application outcome and geographic scope.

3.3.4. Hybrid (RS/GIS + IoT/Telemetry + Analytics/AI)

Early warning.
Hybrid early-warning studies combine RS/GIS hazard observability with in situ telemetry and analytics to move from detection to actionable alerting. In this configuration, satellite and geospatial layers provide spatial coverage, IoT improves timeliness and local signal fidelity, and analytics/DSS support trigger thresholds, alert logic, and operational response. Reported gains are mainly operational, especially improved situational awareness and faster alert cycles, while governance effects are rarely measured [99,100,101,102,103].
Forecasting.
Forecasting is a strong use case for hybrid systems because multi-source fusion can reduce input uncertainty and improve model robustness. Studies typically integrate satellite-derived hydroclimate variables with ground observations and operational telemetry (e.g., reservoir/river levels, utility records), using statistical or ML-based models and/or hybrid (physics + data) approaches. Reported value centers on improved short-term planning and risk anticipation, but performance is sensitive to data alignment (spatial/temporal harmonization), missing data, and the stability of relationships under non-stationary conditions [104,105,106,107].
Water quality.
Hybrid water quality applications combine in situ sensing (continuous measurements) with geospatial context and analytics for anomaly detection, source inference, and targeted response. The operational contribution is usually faster detection and better prioritization (where to sample/act), especially when remote sensing provides contextual proxies (e.g., land use, upstream dynamics, turbidity-related signals) and telemetry provides high-frequency local confirmation. Sustained impact depends on reliable QA/QC routines, maintenance, and institutional readiness to act on alerts [108].
NRW/leakage.
Conceptually, hybrid NRW/leakage solutions would combine telemetry (pressure/flow/AMI), geospatial asset context, and analytics to improve detection, localization, and intervention planning. In the screened evidence, however, NRW/leakage is typically reported as single-family work—mainly IoT/telemetry implementations or analytics-based detection—rather than as end-to-end hybrid systems evaluated jointly. Reported value therefore concentrates on operational efficiency (identifying non-visible losses and improving fieldwork targeting), while longer-term accountability outcomes are less consistently documented. Accordingly, no distinct hybrid NRW/leakage evidence is tabulated in this section.
Allocation and compliance.
Where hybrid systems speak to allocation and compliance, the contribution is primarily enabling data fusion and traceability can strengthen transparency and reduce ambiguity about “who used what, when, and where,” thereby supporting rule implementation. In the screened evidence, however, measurable compliance outcomes remain uncommon and depend less on model sophistication than on institutional design—interoperability across agencies, enforceable rules, and response capacity to act on detected non-compliance. Accordingly, no distinct hybrid allocation/compliance evidence is tabulated in this section.
Other.
In hybrid studies, Other captures enabling contributions that improve WRM observability, inputs, or integration without reporting outcome-level evaluation aligned with the five application categories. Typical examples include integration architectures and data-fusion pipelines, interoperability layers, and platform implementations such as dashboards or multi-source monitoring hubs. These studies strengthen continuity and operational usability of information, which is foundational for moving beyond pilots. However, they often lack explicit outcome metrics, so they cannot be mapped consistently as outcome evidence [109,110,111,112].
Summary.
Overall, hybrid systems consolidate multi-source monitoring and analytics into integrated WRM workflows, with evidence concentrated on risk anticipation and continuous surveillance. Persistent challenges include data harmonization across sources, sustained O&M of sensing and communications, interoperability with legacy systems, and the organizational capacity needed to translate integrated intelligence into routine decision and response protocols. A small subset is coded as Other because it covers integration or interoperability architectures without outcome-level metrics. Table 11 summarizes the hybrid evidence cited in this section by application outcome and geographic scope.
Across the four technology families, the evidence base is strongest for operational applications, although each family shows a distinct concentration pattern. RS/GIS is most prominent in early warning and basin-scale observability; IoT/Telemetry is more closely linked to near-real-time monitoring and NRW/leakage; Analytics/AI + DSS concentrates on forecasting and decision-support uses; and hybrid systems are most visible in multi-source early warning and forecasting applications. Across families, reported gains are predominantly operational, while governance-related outcome evidence remains limited and less consistently documented.

3.4. Cross-Cutting Synthesis

Building on the evidence map (Table 6 and Table 7) and the family-level synthesis (Table 8, Table 9, Table 10 and Table 11), this section distills the main cross-cutting signals in the reviewed corpus. It focuses on shared strengths of the evidence base and recurring gaps that shape interpretation and scale-up.

3.4.1. What Evidence Consistently Reports

Across technology families, studies predominantly report operational improvements—especially enhanced observability, timeliness, and short-horizon decision support—while governance-related outcomes remain comparatively scarce (Table 7).
By technology family, RS/GIS most consistently strengthens basin-scale risk intelligence; IoT/telemetry concentrates on near real-time monitoring and control at the network/utility level; Analytics/AI + DSS contributes predictive models and decision support; and hybrid studies integrate multi-source pipelines but remain limited in number and are less consistently evaluated with outcome-level metrics (Table 8, Table 9, Table 10 and Table 11). Overall, the evidence base suggests a mature operational value proposition, with uneven evidence on institutional impacts.

3.4.2. Why Governance Evidence Is Thin and What “Other” Tells Us

Governance impacts are seldom quantified: while smart technologies can improve traceability and transparency, reviewed studies rarely report allocation/compliance or enforcement effects (Table 6 and Table 7). This likely reflects both evaluation practice (short pilots, limited counterfactual designs) and the fact that governance outcomes depend on institutional rules, coordination, and response capacity beyond the technology layer.
In this context, studies coded as “Other” application play a clear enabling role. They provide hydrologic intelligence, integration work, or planning support that does not map consistently to the five outcome categories [57,58,59,60,61,62,63,64,65,71,82,84,109,112]. The small set coded as “Other” tech family is best treated as edge-case evidence rather than a distinct stream (Table 6). Taken together, the synthesis indicates that moving from pilots to routine smart-WRM practice will require tackling recurring constraints in data readiness, interoperability, energy/connectivity, O&M financing, and institutional capacity.
In summary, the corpus most consistently demonstrates operational value, while governance impacts remain under-evaluated; “Other” contributions often act as enabling prerequisites for scale-up but are rarely assessed using comparable outcome-level metrics. These patterns motivate a territorial adoption agenda that specifies minimum enabling conditions and a pathway from pilots to policy.

4. Discussion

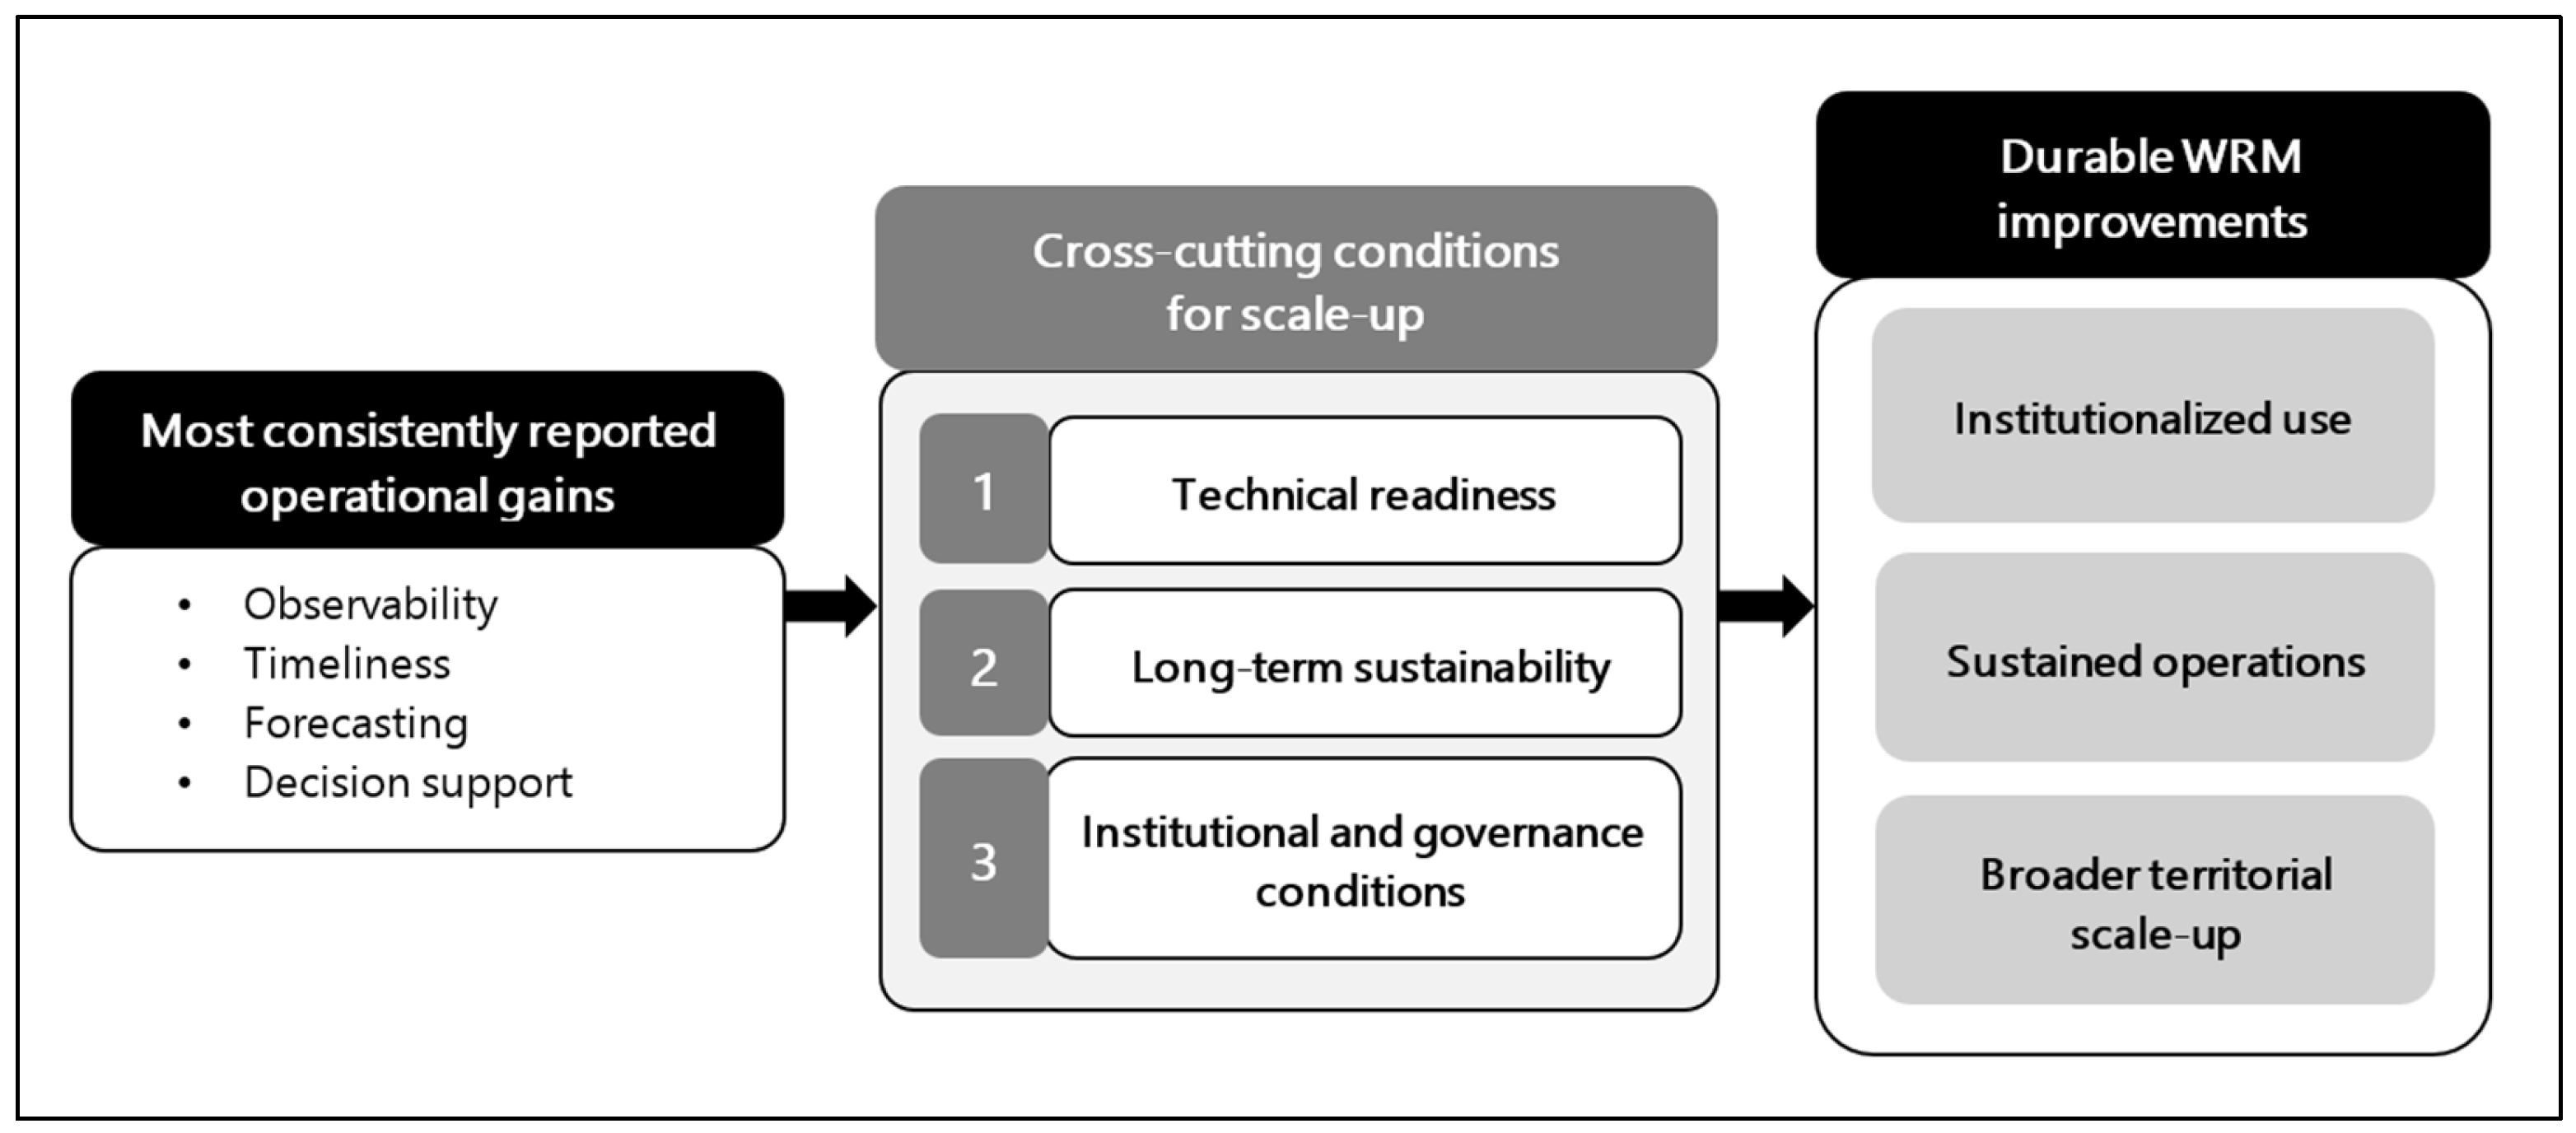
According to the reviewed evidence, smart technologies consistently improve operational functions in semi-arid WRM, especially observability, timeliness, forecasting, and decision support. However, scale-up and sustained impact depend on conditions beyond the tools themselves. Across the corpus, the evidence is stronger for performance improvements than for governance outcomes. This section therefore focuses on the main constraints and enabling conditions shaping implementation: technical readiness (data quality, interoperability, and connectivity), long-term sustainability (O&M capacity and lifecycle costs), and institutional and governance conditions (roles, coordination, accountability, and response protocols). Together, these factors help explain why many solutions remain at pilot stage and why scale-up depends on broader territorial readiness.
This pattern is consistent with evidence beyond Peru and Latin America. Across contexts, the clearest reported effects remain operational, while governance-related effects are less frequently measured and more dependent on institutional conditions. Sustained impact, in turn, depends on data quality, interoperability, reliable connectivity, and long-term institutional and O&M capacity [49,50,75,103]. Figure 2 summarizes how operational gains translate into durable WRM improvements only when cross-cutting scale-up conditions are in place.

4.1. Technical Readiness Constraints: Data, Interoperability, and Connectivity

A recurrent limitation across the reviewed evidence is that technical performance is often demonstrated under data and system conditions that are difficult to replicate in semi-arid territories. In practice, scale-up depends on whether WRM pipelines can be fed with reliable data, integrated with existing operational platforms, and sustained under connectivity and energy constraints.
Data readiness and validation are a first binding constraint. In many studies, performance gains depend on calibration, ground observations, and transparent validation. This is especially true for satellite or gridded products in sparsely gauged basins [37,48,87,105]. Without stable data quality assurance and control (QA/QC) and repeatable validation, uncertainty increases. Outputs then become harder to trust and harder to operationalize in routine decision-making.
Interoperability with legacy systems is a second constraint. Even when sensing or analytics are technically sound, value is limited if outputs cannot be integrated into existing telemetry, GIS, and operational dashboards. In the reviewed corpus, utility-oriented implementations repeatedly highlight the need to connect field devices, communications layers, and monitoring/control interfaces. Otherwise, insights remain “parallel” products rather than embedded decision inputs [67,69,70,74,81].
Connectivity and energy reliability form a third constraint, especially in dispersed and remote monitoring settings. IoT deployments repeatedly report intermittent communications, limited coverage, and infrastructure fragility. These factors threaten data continuity and system uptime. As a result, early warning and operational control weaken precisely when reliability is most needed [66,68]. The broader smart-water IoT literature reports the same pattern, particularly in low-resource or hard-to-reach settings [17,28].
Overall, technical readiness is less about deploying devices or models than about establishing a dependable socio-technical pipeline. That pipeline must connect data generation, validation, system integration, and delivery of actionable information. Without it, promising performance indicators are unlikely to translate into sustained WRM improvements at scale [37,81].

4.2. Long-Term Sustainability Constraints: O&M Capacity and Lifecycle Costs

A second set of constraints concerns whether smart WRM solutions can be operated and financed reliably over time, beyond initial deployment and integration. Evidence on smart water management and digitalization barriers repeatedly shows that technical feasibility is not enough. Long-term value depends on sustained O&M capacity and recurrent financing that covers the full lifecycle of hardware, software, and data services [12,24,28].
O&M capacity and service arrangements are a first bottleneck. Field deployments require routine calibration, replacement cycles, and continuous configuration of dashboards, alerts, and data services. Low-cost architecture can reduce entry barriers, but they still require stable maintenance routines and clearly assigned responsibilities. Without these, performance drift and data degradation accumulate over time [22,101]. This point is also emphasized in smart-water IoT reviews, where upkeep requirements and operational continuity are recurrent determinants of real-world feasibility, especially in low-resource settings [28].
Lifecycle costs and recurrent financing are a second bottleneck. Many pilots prioritize upfront procurement, while recurrent cost drivers—connectivity, hosting, licenses, cybersecurity updates, spare parts, and periodic upgrades—are underestimated or not institutionalized in annual budgets [14,28]. Funding models also matter. Decision support creates value only if the service remains available across seasons and extremes, consistent with climate-service evidence for reservoir management, where sustained delivery underpins adoption [77]. Similarly, cost-effective AMI can reduce entry barriers, but it still requires ongoing service and replacement over the system lifetime [69].
Overall, operational and financial sustainability often determines whether a smart WRM solution remains a demonstrator or becomes institutionalized infrastructure. When O&M capacity and lifecycle funding are not designed upfront, and matched with realistic service levels, solutions tend to remain fragile pilots rather than durable operational systems [14,28].

4.3. Institutional and Governance Constraints—And Enabling Conditions for Scale-Up

A third set of constraints is institutional and governance-related. Smart WRM tools generate sustained value only when information is translated into coordinated decisions, field actions, and compliance across multiple actors. Evidence on IWRM performance and adaptive governance suggests that governance outcomes are often less visible than operational gains. This is because implementation depends on mandates, coordination capacity, and accountability mechanisms, not only on technical performance [8,11].
Roles, coordination, and accountability are recurrent bottlenecks. Basin- and utility-level responsibilities are often distributed across agencies and levels of government. This can fragment decision rights and blur ownership of data and actions. When it is unclear who validates information, who triggers response, and who is accountable for outcomes, decision-support outputs remain advisory rather than actionable. As a result, gains in monitoring, early warning, and forecasting do not consistently translate into timely response and enforcement [7,11,15].
Protocols and institutionalization of workflows are equally critical. Smart tools can improve visibility and timeliness, but sustained impact requires standard operating procedures, thresholds, and escalation pathways that define what happens when indicators change. Without agreed response protocols and routine operational use, systems remain intermittent add-ons rather than institutional infrastructure [14,18].
Policy pathways and enabling conditions therefore matter for scale-up. Work on governance innovation in smart water management emphasizes the need for explicit rules for data access and sharing, standard operating procedures, and coordination protocols [15]. These elements help connect technical signals to operational decisions. In water-scarcity contexts, complementary measures also matter, including institutional arrangements that support non-conventional resources and demand management. These conditions shape whether technology-enabled insights can translate into sustained allocation and compliance improvements [10].
Overall, the transition from pilots to durable WRM infrastructure is primarily an institutional design challenge. Technical capability matters, but scale-up ultimately depends on governance arrangements that assign responsibilities, connect information to action, and sustain coordinated implementation over time [8,15].

5. Territorial Adoption Agenda for Smart WRM in Semi-Arid Latin America

This section presents a territorial adoption agenda that operationalizes the evidence synthesized in Section 3 and Section 4. It frames scale-up as an implementation and institutional-design challenge and proposes readiness conditions, a phased roadmap, and outcome-linked minimum packages to move from pilots to sustained practice in Peru and comparable semi-arid contexts.

5.1. Purpose and Scope

The scope is territorial and spans both basin- and utility-level WRM. Peru (Piura-like coastal semi-arid contexts) is used as the anchor case, while Latin America provides a comparative lens for transferability. It is intended for basin authorities, water utilities, and regulators. Other contributions are treated as enabling layers that strengthen observability, inputs, and integration, rather than outcome evidence.

5.2. Readiness Conditions and Enabling Requirements

Scaling smart WRM in semi-arid settings requires more than technology availability. It depends on minimum readiness across data, infrastructure, institutions, and lifecycle management [113]. These minimum readiness conditions synthesize recurrent barriers and enabling factors identified across the reviewed evidence, including data adequacy and validation, monitoring-network design, cost-effective infrastructure deployment, and institutional capacity for sustained implementation [49,69,83,114].
  • Data and baselines. Define a baseline for the targeted outcome and agree on core indicators. Apply QA/QC, metadata, and versioning to ensure traceability over time.
  • Connectivity and energy. Match sensing and telemetry to local constraints (intermittent links and power). Use buffering, redundancy, and field-hardened configurations to avoid data gaps.
  • Interoperability and integration. Set minimum interoperability requirements early (shared identifiers, standards and APIs). Avoid isolated pilots by designing RS/GIS, IoT, and analytics as one workflow.
  • Capacity and routines. Assign roles for operations, data management, and analytics, and train them. Convert outputs into action through simple SOPs (alerts, maintenance, escalation).
  • O&M and financing. Require a lifecycle plan before scaling (calibration, replacements, spare parts, vendor support). Secure OPEX for sustained operation, not only CAPEX for deployment.
  • Governance and accountability. Establish data-sharing rules and decision authority across basin agencies and utilities. Clarify ownership, validation, and accountability to reduce institutional overlap.

5.3. Phased Roadmap from Pilots to Scale

We synthesize a simple three-phase roadmap to keep the adoption agenda actionable and concise. The sequence reflects recurrent implementation patterns in the reviewed evidence: first, establishing reliable observability, validated baselines, and initial decision triggers; second, integrating output into operating routines, interoperability rules, and assigned responsibilities; and third, replicating what works through sustained O&M, coverage expansion, and performance monitoring [65,74,83,114]. Table 12 summarizes this sequence.

5.4. Outcome-Linked Minimal Implementation Packages

The following packages translate the agenda into outcome-specific starting points. Each outlines a minimum viable configuration that can expand as capacity and O&M readiness improve.
Early warning. Link hazard detection (RS/GIS and/or sensors) to clear thresholds, rapid dissemination, and a response protocol, prioritizing lead time and coverage. Examples include a low-cost IoT network for mudslide monitoring in Peru and RS/GIS-based flood analyses in Brazil that support early detection and local adaptation [44,66].
Forecasting. Implement a validated forecasting workflow tied to specific operational decisions, and track skill over seasons before adding complexity. Examples include satellite-supported river-flow forecasting in Peru and forecasting studies in data-scarce settings that validate climate and hydrological inputs before broader operational use [50,104].
Water quality. Deploy targeted monitoring with QA/QC and alert thresholds at high-risk points, prioritizing reliability and time-to-detection. Examples include combined field and satellite monitoring of bacterial risk in reservoirs and ANN-based prediction of water quality in Peruvian basins [68,78,108].
NRW/leakage. Start with basic sectorization (DMAs), pressure/flow monitoring, and a repair routine, scaling only after sustained NRW reductions. Examples include machine-learning and expert-system approaches for leak detection in Peru, as well as LoRaWAN-based monitoring and control in distribution networks [74,80,81].
Allocation and compliance. Combine RS/GIS baselines with shared identifiers and enforceable reporting and audit routines, supported by data-sharing agreements. Illustrative cases include RS/GIS-supported groundwater management at local scale and continental aquifer-vulnerability assessments that inform monitoring, reporting, and prioritization [52,56,115].
Packages should be prioritized by local risk and feasibility and expanded only after the phase KPIs in Table 12 are met.

6. Conclusions, Future Directions and Limitations

This review shows that smart technologies can strengthen water resources management in semi-arid Latin America, primarily through improved observability, timeliness, and decision support. Across the reviewed literature, the most consistent evidence concerns operational applications, especially early warning, forecasting, water quality surveillance, and NRW/leakage management. By contrast, evidence on governance-related effects—such as allocation and compliance improvement, institutional coordination, and long-term sustainability—remains more limited, uneven, and less consistently measured.
For Peru and similar semi-arid Latin American settings, the evidence supports a cautious but actionable interpretation. Smart WRM approaches appear promising, but their transfer and scaling should not be assumed to be direct or automatic. Their practical replicability depends on enabling conditions such as interoperable data systems, institutional coordination, financing and O&M capacity, digital skills, and sustained operating conditions. In this sense, the territorial adoption agenda proposed in this paper should be understood as a conditional implementation pathway rather than as a universally transferable template.
Future directions. Future work should prioritize scalable evidence, not additional pilots. Key directions include standardized outcome KPIs, interoperability-ready architectures that integrate RS/GIS, telemetry, and analytics, and reporting of O&M and total cost of ownership, together with measurable allocation/compliance and equity impacts.
Limitations. Findings are constrained by heterogeneous metrics and study designs, which preclude quantitative pooling. Although Scopus, Web of Science, and IEEE Xplore were used, some regional publications may remain underrepresented. Finally, many studies emphasize technical outputs over consistently measured operational and governance outcomes, and the coding scheme may simplify complex hybrid implementations.


Supplementary Materials

The following supporting information can be downloaded at: https://www.mdpi.com/article/10.3390/su18063153/s1, The Supplementary Material File includes a concise coding summary defining the application categories and outcome types used in the review, and the UNIFY master spreadsheet (screening and coding dataset), reporting bibliographic metadata, source database, de-duplication and screening decisions (with exclusion reasons), and the variables used for synthesis (technology family and application category). This Supplementary Material includes additional references [88,116,117,118,119,120,121,122,123,124,125,126,127,128,129,130,131,132,133,134,135,136].

Author Contributions

Conceptualization, E.A.S.R. and L.V.C.; Methodology, E.A.S.R. and S.V.B.; Formal analysis, E.A.S.R.; Data curation, E.A.S.R. and S.V.B.; Writing—original draft preparation, E.A.S.R.; Writing—review and editing, S.V.B.; Formatting and reference management, S.V.B.; Supervision, L.V.C.; Visualization, E.A.S.R. and S.V.B. All authors have read and agreed to the published version of the manuscript.

Funding

This research received no external funding.

Institutional Review Board Statement

Not applicable.

Informed Consent Statement

Not applicable.

Data Availability Statement

This study is a narrative review. The extracted dataset supporting the screening and synthesis (UNIFY master spreadsheet) is provided as Supplementary Materials. The reviewed articles are available through their respective publishers and databases.

Acknowledgments

The research was carried out within the framework of the PhD Program in Sustainability at the Universitat Politècnica de Catalunya (UPC). Generative AI tools were used for limited language editing. The authors reviewed and edited the output and take full responsibility for the content.

Conflicts of Interest

The authors declare no conflicts of interest.

References

  1. Morante-Carballo, F.; Montalván-Burbano, N.; Quiñonez-Barzola, X.; Jaya-Montalvo, M.; Carrión-Mero, P. What Do We Know about Water Scarcity in Semi-Arid Zones? A Global Analysis and Research Trends. Water 2022, 14, 2685. [Google Scholar] [CrossRef]
  2. Tzanakakis, V.A.; Paranychianakis, N.V.; Angelakis, A.N. Water Supply and Water Scarcity. Water 2020, 12, 2347. [Google Scholar] [CrossRef]
  3. Pacheco-Treviño, S.; Guadalupe, M.; Manzano-Camarillo, F. Review of Water Scarcity Assessments: Highlights of Mexico’s Water Situation. Wiley Interdiscip. Rev. Water 2024, 11, e1721. [Google Scholar] [CrossRef]
  4. Devincentis, A.J.; Guillon, H.; Díaz Gómez, R.; Patterson, N.K.; Van Den Brandeler, F.; Koehl, A.; Ortiz-Partida, J.P.; Garza-Díaz, L.E.; Gamez-Rodríguez, J.; Goharian, E.; et al. Bright and Blind Spots of Water Research in Latin America and the Caribbean. Hydrol. Earth Syst. Sci. 2021, 25, 4631–4650. [Google Scholar] [CrossRef]
  5. Díaz-Caravantes, R.E.; Zuniga-Teran, A.; Martín, F.; Bernabeu, M.; Stoker, P.; Scott, C. Urban Water Security: A Comparative Study of Cities in the Arid Americas. Environ. Urban. 2020, 32, 275–294. [Google Scholar] [CrossRef]
  6. Mahlknecht, J.; On Gonz Alez-Bravo, R.; Loge, F.J. Water-Energy-Food Security: A Nexus Perspective of the Current Situation in Latin America and the Caribbean. Energy 2020, 194, 116824. [Google Scholar] [CrossRef]
  7. Cifuentes-Herrera, L.F.; Romero-Duque, L.P.; Núñez, O.E.A.; Trilleras, J.M. Integrated Water Resource Management under Ecosystem Services Approach-The Chimulala Micro-Watershed, Peru. Environ. Manag. 2025, 75, 945–960. [Google Scholar] [CrossRef]
  8. Pineda-Morales, S.J.; Ortega-Argueta, A.; Ruiz-de-Oña-Plaza, C.; García-García, A.; Camacho-Valdéz, V.; Cortez-Lara, A.A. A Review of Domestic Water Management and Adaptive Governance in Urban Latin America. Discov. Sustain. 2025, 6, 754. [Google Scholar] [CrossRef]
  9. ElZein, Z.; Abdou, A.; Säumel, I. Lessons Learned from Water-Scarce Cities: Proposed Policies toward an Integrated Urban Water Management in Egypt. Front. Water 2022, 4, 981261. [Google Scholar] [CrossRef]
  10. Ricart, S.; Villar-Navascués, R.A.; Hernández-Hernández, M.; Rico-Amorós, A.M.; Olcina-Cantos, J.; Moltó-Mantero, E. Extending Natural Limits to Address Water Scarcity? The Role of Non-Conventional Water Fluxes in Climate Change Adaptation Capacity: A Review. Sustainability 2021, 13, 2473. [Google Scholar] [CrossRef]
  11. Al-Saidi, M. Pathways to Water Sustainability? A Global Study Assessing the Benefits of Integrated Water Resources Management. J. Environ. Manage. 2023, 343, 118179. [Google Scholar] [CrossRef]
  12. Mondejar, M.E.; Avtar, R.; Diaz, H.L.B.; Dubey, R.K.; Esteban, J.; Gómez-Morales, A.; Hallam, B.; Mbungu, N.T.; Okolo, C.C.; Prasad, K.A.; et al. Digitalization to Achieve Sustainable Development Goals: Steps towards a Smart Green Planet. Sci. Total Environ. 2021, 794, 148539. [Google Scholar] [CrossRef] [PubMed]
  13. Bibri, S.E.; Krogstie, J.; Kaboli, A.; Alahi, A. Smarter Eco-Cities and Their Leading-Edge Artificial Intelligence of Things Solutions for Environmental Sustainability: A Comprehensive Systematic Review. Environ. Sci. Ecotechnol. 2024, 19, 100330. [Google Scholar] [CrossRef] [PubMed]
  14. Liu, Q.; Yang, L.; Yang, M. Digitalisation for Water Sustainability: Barriers to Implementing Circular Economy in Smart Water Management. Sustainability 2021, 13, 11868. [Google Scholar] [CrossRef]
  15. Dai, Y.; Huang, Z.; Khan, N.; Labbo, M.S. Smart Water Management: Governance Innovation, Technological Integration, and Policy Pathways Toward Economic and Ecological Sustainability. Water 2025, 17, 1932. [Google Scholar] [CrossRef]
  16. Ramos, H.M.; Kuriqi, A.; Besharat, M.; Creaco, E.; Tasca, E.; Coronado-Hernández, O.E.; Pienika, R.; Iglesias-Rey, P. Smart Water Grids and Digital Twin for the Management of System Efficiency in Water Distribution Networks. Water 2023, 15, 1129. [Google Scholar] [CrossRef]
  17. Okoli, N.J.; Kabaso, B. Building a Smart Water City: IoT Smart Water Technologies, Applications, and Future Directions. Water 2024, 16, 557. [Google Scholar] [CrossRef]
  18. Mezni, H.; Driss, M.; Boulila, W.; Atitallah, S.; Ben; Sellami, M.; Alharbi, N. SmartWater: A Service-Oriented and Sensor Cloud-Based Framework for Smart Monitoring of Water Environments. Remote Sens. 2022, 14, 922. [Google Scholar] [CrossRef]
  19. Mashala, M.J.; Dube, T.; Mudereri, B.T.; Ayisi, K.K.; Ramudzuli, M.R. A Systematic Review on Advancements in Remote Sensing for Assessing and Monitoring Land Use and Land Cover Changes Impacts on Surface Water Resources in Semi-Arid Tropical Environments. Remote Sens. 2023, 15, 3926. [Google Scholar] [CrossRef]
  20. Castillo, J.L.U.; Cruz, D.A.M.; Leal, J.A.R.; Vargas, J.T.; Tapia, S.A.R.; Celestino, A.E.M. Delineation of Groundwater Potential Zones (GWPZs) in a Semi-Arid Basin through Remote Sensing, GIS, and AHP Approaches. Water 2022, 14, 2138. [Google Scholar] [CrossRef]
  21. Bibri, S.E.; Huang, J.; Jagatheesaperumal, S.K.; Krogstie, J. The Synergistic Interplay of Artificial Intelligence and Digital Twin in Environmentally Planning Sustainable Smart Cities: A Comprehensive Systematic Review. Environ. Sci. Ecotechnol. 2024, 20, 100433. [Google Scholar] [CrossRef]
  22. Pasika, S.; Gandla, S.T. Smart Water Quality Monitoring System with Cost-Effective Using IoT. Heliyon 2020, 6, e04096. [Google Scholar] [CrossRef] [PubMed]
  23. Palermo, S.A.; Maiolo, M.; Brusco, A.C.; Turco, M.; Pirouz, B.; Greco, E.; Spezzano, G.; Piro, P. Smart Technologies for Water Resource Management: An Overview. Sensors 2022, 22, 6225. [Google Scholar] [CrossRef] [PubMed]
  24. Krishnan, S.R.; Nallakaruppan, M.K.; Chengoden, R.; Koppu, S.; Iyapparaja, M.; Sadhasivam, J.; Sethuraman, S. Smart Water Resource Management Using Artificial Intelligence—A Review. Sustainability 2022, 14, 3384. [Google Scholar] [CrossRef]
  25. Alprol, A.E.; Mansour, A.T.; Ibrahim, M.E.E.D.; Ashour, M. Artificial Intelligence Technologies Revolutionizing Wastewater Treatment: Current Trends and Future Prospective. Water 2024, 16, 314. [Google Scholar] [CrossRef]
  26. Guo, Y.; Chen, C.; Luo, X.; Martek, I. Critical Drivers and Barriers of Digital Twin Adoption in Water Infrastructure: An Environmental, Social, Governance, and Financial Perspective. Sustain. Dev. 2025, 33, 1623–1648. [Google Scholar] [CrossRef]
  27. Tiyasha; Tung, T.M.; Yaseen, Z.M. A Survey on River Water Quality Modelling Using Artificial Intelligence Models: 2000–2020. J. Hydrol. 2020, 585, 124670. [Google Scholar] [CrossRef]
  28. Alshami, A.; Ali, E.; Elsayed, M.; Eltoukhy, A.E.E.; Zayed, T. IoT Innovations in Sustainable Water and Wastewater Management and Water Quality Monitoring: A Comprehensive Review of Advancements, Implications, and Future Directions. IEEE Access 2024, 12, 58427–58453. [Google Scholar] [CrossRef]
  29. Kulkarni, T.; Singh, A. Community-Centric Digital Twins for Equitable Water Infrastructure Governance in Low-Resource Settings. Int. J. Sci. Res. Eng. Manag. 2025, 9, 1–9. [Google Scholar] [CrossRef]
  30. Santos, E.; Carvalho, M.; Martins, S. Sustainable Water Management: Understanding the Socioeconomic and Cultural Dimensions. Sustainability 2023, 15, 13074. [Google Scholar] [CrossRef]
  31. Maldonado Benitez, V.M.; Morales Matamoros, O.; Moreno Escobar, J.J. Towards Resilient Cities: Systematic Review of the Literature on the Use of AI to Optimize Water Harvesting and Mitigate Scarcity. Water 2025, 17, 1978. [Google Scholar] [CrossRef]
  32. Soares Ascenção, É.; Melo Marinangelo, F.; Meschini Almeida, C.F.; Kagan, N.; Dias, E.M. Applications of Smart Water Management Systems: A Literature Review. Water 2023, 15, 3492. [Google Scholar] [CrossRef]
  33. Codina, L. Cómo Hacer Revisiones Bibliográficas Tradicionales o Sistemáticas Utilizando Bases de Datos Académicas. Rev. Orl 2020, 11, 139–153. [Google Scholar] [CrossRef]
  34. Baethge, C.; Goldbeck-Wood, S.; Mertens, S. SANRA—A Scale for the Quality Assessment of Narrative Review Articles. Res. Integr. Peer Rev. 2019, 4, 5. [Google Scholar] [CrossRef] [PubMed]
  35. Flores, W.; Acuña, D.; Montes, V.; García, J. Probabilities of occurrence of atmospheric electric discharges for the mantaro river basin-peru, using goes satellite infrared and water vapor bands. Ecol. Apl. 2021, 20, 53–63. [Google Scholar] [CrossRef]
  36. Alvan Romero, N.A.; Cigna, F.; Tapete, D. ERS-1/2 and Sentinel-1 Sar Data Mining for Flood Hazard and Risk Assessment in Lima, Peru. Appl. Sci. 2020, 10, 6598. [Google Scholar] [CrossRef]
  37. Llauca, H.; Lavado-casimiro, W.; León, K.; Jimenez, J.; Traverso, K.; Rau, P. Assessing near Real-time Satellite Precipitation Products for Flood Simulations at Sub-daily Scales in a Sparsely Gauged Watershed in Peruvian Andes. Remote Sens. 2021, 13, 826. [Google Scholar] [CrossRef]
  38. Rivera, C.A.; Valqui-Reina, S.V.; García-Naranjo, L.F.; Ocaña-Zúñiga, C.L.; Auquiñivín-Silva, E.A.; Chapa-Gonza, S.R.; Cieza-Tarrillo, D.; Vergara, C.G.; Vergara, A.J. Geospatial Landslide Risk Mapping Using AHP and GIS: A Case Study of the Utcubamba River Basin, Peru. Appl. Sci. 2025, 15, 9423. [Google Scholar] [CrossRef]
  39. Arana-Ruedas, D.P.R.; Pino-Vargas, E.; del Águila, S.; Ramosfernandez, L. Assessment and mapping of flood susceptibility using geospatial techniques and machine learning in the peruvian tropical andes. In Proceedings of the 41st IAHR World Congress, Singapore, 22–27 June 2025; International Association for Hydro-Environment Engineering and Research: Madrid, Spain; Universidad Nacional Agraria La Molina: Lima, Peru, 2025; pp. 2117–2125. [Google Scholar]
  40. Ferreira, G.J.; de Oliveira, N.M.; Santos, C.A.G.; da Silva, R.M. Spatiotemporal Variability of Vegetation Due to Drought Dynamics (2012–2017): A Case Study of the Upper Paraiba River Basin, Brazil. Nat. Hazards 2020, 102, 939–964. [Google Scholar] [CrossRef]
  41. Zheng, W.; Ge, W.; Shi, S.; Chen, H.; Wang, F.; Askari, K.; Song, C.; Shi, P.; Chu, J. Increasing Vulnerability of Vegetation to Meteorological and Groundwater Drought: A Case Study in Argentina. J. Hydrol. Reg. Stud. 2024, 55, 101931. [Google Scholar] [CrossRef]
  42. Cello, P.A.; Kröhling, D.M.; Ernesto, E.; Marizza, M.; Zalazar, M.C.; García-Martínez, R.; Nalesso, M.; Artigas, J.; Córdoba, J.R. Modeling of Non-Floodplain Wetlands in an Upstream Basin of the Pampa Plain, Argentina, during Current Hydro-Climatic Extreme Conditions: Geomorphological Thresholds Controlling Hydrodynamics. Glob. Planet. Change 2025, 248, 104768. [Google Scholar] [CrossRef]
  43. Freitas, A.A.D.; Carvalho, V.S.B.; Reboita, M.S. Extreme Precipitation Events During the Wet Season of the South America Monsoon: A Historical Analysis over Three Major Brazilian Watersheds. Climate 2024, 12, 188. [Google Scholar] [CrossRef]
  44. Donoso, V.G.; Böhrkircher, L.; dos Santos Junior, E.R.; Leuchner, M. Uncovering the 2024 Rio Grande Do Sul Floods: Land Use Change, Extreme Rainfall, and the Urgent Need for Local Adaptation in South Brazil. Nat. Hazards 2026, 122, 66. [Google Scholar] [CrossRef]
  45. Wei, W.; Wang, J.; Ma, L.; Wang, X.; Xie, B.; Zhou, J.; Zhang, H. Global Drought-Wetness Conditions Monitoring Based on Multi-Source Remote Sensing Data. Land 2024, 13, 95. [Google Scholar] [CrossRef]
  46. Calizaya, E.; Aráoz, J.; Sardón, S.; Calizaya, F.; Laqui, W. Modeling Surface Runoff under Climate Change Scenarios: An Integrated SCS-CN and GIS Techniques in a High Andean Basin of Puno, Peru. Int. J. Geoinform. 2025, 21, 1–17. [Google Scholar] [CrossRef]
  47. Baltazar, L.A.; Viola, M.R.; Rogério de Mello, C.; Junqueira, R.; da Silva Amorim, J. Hydrological Modeling in a Region with Sparsely Observed Data in the Eastern Central Andes of Peru, Amazon. J. S. Am. Earth Sci. 2023, 121, 104151. [Google Scholar] [CrossRef]
  48. dos Reis, A.A.; Weerts, A.; Ramos, M.H.; Wetterhall, F.; dos Santos, W. Fernandes Hydrological Data and Modeling to Combine and Validate Precipitation Datasets Relevant to Hydrological Applications. J. Hydrol. Reg. Stud. 2022, 44, 101200. [Google Scholar] [CrossRef]
  49. Tan, M.L.; Gassman, P.W.; Liang, J.; Haywood, J.M. A Review of Alternative Climate Products for SWAT Modelling: Sources, Assessment and Future Directions. Sci. Total Environ. 2021, 795, 148915. [Google Scholar] [CrossRef]
  50. Brocca, L.; Massari, C.; Pellarin, T.; Filippucci, P.; Ciabatta, L.; Camici, S.; Kerr, Y.H.; Fernández-Prieto, D. River Flow Prediction in Data Scarce Regions: Soil Moisture Integrated Satellite Rainfall Products Outperform Rain Gauge Observations in West Africa. Sci. Rep. 2020, 10, 12517. [Google Scholar] [CrossRef]
  51. Cardenas Morales, B.K.; Forrest, J.; Castro Aponte, W.V.; Sanchez Cornejo, H.E.; La Torre, B.; Jhoncon Kooyip, J.; Byrne, P.; Nguyen, T.T.; Barnes, C.H.W.; De Los Santos Valladares, L. Geochemical, Hydrochemical and Remote Sensing Study of an Andean Calcareous Wetland in Huanta, Peru. J. Hydrol. Reg. Stud. 2025, 62, 102767. [Google Scholar] [CrossRef]
  52. Reina-García, J.; Toro-Vélez, A.F.; Peña-Varón, M.R.; Olaya-Ochoa, J.; Figueroa-Casas, A. Methodological Design for the Macro-Location of a Micropollutants Monitoring Network in Tropical Rivers: A Case Study in Cauca River. Environ. Monit. Assess. 2020, 192, 205. [Google Scholar] [CrossRef] [PubMed]
  53. Dogliotti, A.I.; Gossn, J.I.; Gonzalez, C.; Yema, L.; Sanchez, M.L.; O’Farrell, I. Evaluation of multi- and hyper-spectral chl-a algorithms in the río de la plata turbid waters during a cyanobacteria bloom. In Proceedings of the 2021 IEEE International Geoscience and Remote Sensing Symposium IGARSS, Brussels, Belgium, 11–16 July 2021; pp. 7442–7445. [Google Scholar] [CrossRef]
  54. Jang, M.T.G.; Alcântara, E.; Rodrigues, T.; Park, E.; Ogashawara, I.; Marengo, J.A. Increased Chlorophyll-a Concentration in Barra Bonita Reservoir during Extreme Drought Periods. Sci. Total Environ. 2022, 843, 157106. [Google Scholar] [CrossRef] [PubMed]
  55. Spyrakos, E.; Hunter, P.; Simis, S.; Neil, C.; Riddick, C.; Wang, S.; Varley, A.; Blake, M.; Groom, S.; Torres Palenzuela, J.; et al. Moving towards global satellite based products for monitoring of inland and coastal waters. regional examples from Europe and South America. In Proceedings of the 2020 IEEE Latin American GRSS & ISPRS Remote Sensing Conference (LAGIRS), Santiago, Chile, 22–26 March 2020; pp. 101–106. [Google Scholar] [CrossRef]
  56. Rama, F.; Busico, G.; Arumi, J.L.; Kazakis, N.; Colombani, N.; Marfella, L.; Hirata, R.; Kruse, E.E.; Sweeney, P.; Mastrocicco, M. Assessment of Intrinsic Aquifer Vulnerability at Continental Scale through a Critical Application of the Drastic Framework: The Case of South America. Sci. Total Environ. 2022, 823, 153748. [Google Scholar] [CrossRef] [PubMed]
  57. Comini de Andrade, B.; Laipelt, L.; Fleischmann, A.; Huntington, J.; Morton, C.; Melton, F.; Erickson, T.; Roberti, D.R.; de Arruda Souza, V.; Biudes, M.; et al. GeeSEBAL-MODIS: Continental-Scale Evapotranspiration Based on the Surface Energy Balance for South America. ISPRS J. Photogramm. Remote Sens. 2024, 207, 141–163. [Google Scholar] [CrossRef]
  58. Filippucci, P.; Brocca, L.; Massari, C.; Saltalippi, C.; Wagner, W.; Tarpanelli, A. Toward a Self-Calibrated and Independent SM2RAIN Rainfall. J. Hydrol. 2021, 603, 126837. [Google Scholar] [CrossRef]
  59. Yan, S.; Liu, J.; Gu, X.; Kong, D. Global Runoff Signatures Changes and Their Response to Atmospheric Environment, GRACE Water Storage, and Dams. Remote Sens. 2021, 13, 4084. [Google Scholar] [CrossRef]
  60. Besnier, J.; Getirana, A.; Kato-Beaudoing, H.K.; Lakshmi, V. Characterizing the 2019–2021 Drought in La Plata River Basin with GLDAS and SMAP. J. Hydrol. Reg. Stud. 2024, 52, 101679. [Google Scholar] [CrossRef]
  61. Gonzales, E.; Alvarez, V.; Gonzales, K. Two Decades of Groundwater Variability in Peru Using Satellite Gravimetry Data. Appl. Sci. 2025, 15, 8071. [Google Scholar] [CrossRef]
  62. Crespo, S.A.; Fernandoy, F.; Cara, L.; Klarian, S.; Lavergne, C. First Snow, Glacier and Groundwater Contribution Quantification in the Upper Mendoza River Basin Using Stable Water Isotopes. Isot. Environ. Health Stud. 2020, 56, 566–585. [Google Scholar] [CrossRef]
  63. Laqui, W.; Zubieta, R.; Laqui-Vilca, Y.; Calizaya, E.; Laqui-Vilca, C.; Laqui, W.; Zubieta, R.; Laqui-Vilca, Y.; Calizaya, E.; Laqui-Vilca, C.; et al. Temporal Dynamics of Glacier Retreat and Its Relationship with Local Climate in Cordillera Apolobamba, Peru. Model. Earth Syst. Environ. 2024, 10, 1647–1656. [Google Scholar] [CrossRef]
  64. Ellis, J.S.S.; Zaffaroni, P.; García, C.M.; Lozada, J.M.D.; Oberg, K.; Jobbagy, E.; López Weibel, C.; Walker, E.; Szupiany, R.; Venturini, V.; et al. Evaluación Preliminar De Productos De Swot Para Determinar La Elevación De La Superficie De Agua De Lagos Y Lagunas De La Provincia De Córdoba Argentina. In Proceedings of the 2024 IEEE Biennial Congress of Argentina (ARGENCON), San Nicolás de los Arroyos, Argentina, 18–20 September 2024. [Google Scholar] [CrossRef]
  65. Biswas, N.K.; Hossain, F.; Bonnema, M.; Lee, H.; Chishtie, F. Towards a Global Reservoir Assessment Tool for Predicting Hydrologic Impacts and Operating Patterns of Existing and Planned Reservoirs. Environ. Model. Softw. 2021, 140, 105043. [Google Scholar] [CrossRef]
  66. Covenas, F.E.M.; Palomares, R.; Milla, M.A.; Verastegui, J.; Cornejo, J. Design and Development of a Low-Cost Wireless Network Using IoT Technologies for a Mudslides Monitoring System. In Proceedings of the 2021 IEEE URUCON, Montevideo, Uruguay, 24–26 November 2021; pp. 172–176. [Google Scholar] [CrossRef]
  67. Carrera-Villacrés, D.; Loaiza, V. Implementation of an Automated System Using IoT Flowmeters at a Pilot Level to Demonstrate Its Applicability in a Remote Population of the Border from Ecuador, South America. In Recent Advances in Environmental Science from the Euro-Mediterranean and Surrounding Regions, 3rd ed.; Advances in Science, Technology & Innovation; Springer: Cham, Switzerland, 2024; pp. 101–104. [Google Scholar] [CrossRef]
  68. Salgado, J.; Pizarro, C.; Wong, L.; Castillo, J. IoT Watercare: Water Quality Control System in Unofficial Settlements of Peru Based in an IoT Architecture. In Proceedings of the 2022 31st Conference of Open Innovations Association (FRUCT), Helsinki, Finland, 27–29 April 2022; pp. 277–288. [Google Scholar] [CrossRef]
  69. Pilotto Figueiredo, M.; de Souza Oliveira, L. AquOculus: A Cost-Effective Advanced Metering Infrastructure for Urban Water Distribution Systems. IEEE Lat. Am. Trans. 2026, 24, 174–186. [Google Scholar] [CrossRef]
  70. Cabrera, G.H.C.; Chipana, G.J.F.; Chambilla, T.R.B.; Cahua, A.D.M.; De La Cruz, S.E.C.; Ponce, G.R.V. IoT-Smart Water Monitoring Module for Home Connection for Pattern Identification Based on ESP32-Grafana. In Proceedings of the 2025 IEEE Colombian Caribbean Conference (C3), Santa Marta, Colombia, 17–20 September 2025; pp. 1–6. [Google Scholar] [CrossRef]
  71. Zapata-Paulini, J.; Lescano, L. Technological Advances in High Mountains: Development of an Augmented Reality and IoT Application for Snow Cover Monitoring on Huascaran, Peru. Environ. Adv. 2024, 17, 100586. [Google Scholar] [CrossRef]
  72. Zevallos, J.; Chávarri-Velarde, E.; Gutierrez, R.R.; Lavado-Casimiro, W. Bayesian Calibration of a 2D Hydraulic Model Using a Convolutional Neural Network Emulator. Environ. Model. Softw. 2025, 193, 106621. [Google Scholar] [CrossRef]
  73. Campo-Carrera, J.M.; Cedeño-Villarroel, M.A.; Boada-Herrera, M.; Udias, A. Decision Support System for the Hydrological Management of the Guayas River. Tecnol. Cienc. Agua 2025, 16, 237–294. [Google Scholar] [CrossRef]
  74. Yauri, R.; Gonzales, M.; Gamero, V.; Yauri, R.; Gonzales, M.; Gamero, V. Remote Monitoring and Control System of a Water Distribution Network Using LoRaWAN Technology. WSEAS Trans. Syst. Control 2023, 18, 73–82. [Google Scholar] [CrossRef]
  75. Kumar, S.; Tian, D. Causal Discovery Analysis Reveals Global Sources of Predictability for Regional Flash Droughts. Water Resour. Res. 2024, 60, e2024WR038391. [Google Scholar] [CrossRef]
  76. Aguirre-Escalante, C.; Quispe-Janampa, D.; Ruiz-Rengifo, L.; Dueñas-Tuesta, M.; Díaz-Quintana, E.; Reategui-Inga, M. Flow Series Generation from Water Depth Data Using Statistical and Machine Learning Models: The Tocache Station Case. Math. Model. Eng. Probl. 2025, 12, 1159–1168. [Google Scholar] [CrossRef]
  77. Essenfelder, A.H.; Larosa, F.; Mazzoli, P.; Bagli, S.; Broccoli, D.; Luzzi, V.; Mysiak, J.; Mercogliano, P.; Dalla Valle, F. Smart Climate Hydropower Tool: A Machine-Learning Seasonal Forecasting Climate Service to Support Cost–Benefit Analysis of Reservoir Management. Atmosphere 2020, 11, 1305. [Google Scholar] [CrossRef]
  78. Rustam, F.; Ishaq, A.; Kokab, S.T.; de la Torre Diez, I.; Mazón, J.L.V.; Rodríguez, C.L.; Ashraf, I. An Artificial Neural Network Model for Water Quality and Water Consumption Prediction. Water 2022, 14, 3359. [Google Scholar] [CrossRef]
  79. Li, W.; Yuan, Q.; Wang, X.; Wang, W.; Wu, X.; Zhang, Y.; Zhao, X.; Luo, Y.; Wu, F. Integrated Global Assessment of Escherichia Coli Emissions from Wastewater Treatment Plants. Eco-Environ. Health 2026, 5, 100209. [Google Scholar] [CrossRef]
  80. Espino, H.; Valencia, G.; León, C. Expert System to Control Non-Visible Water Leaks in Distribution Networks. In Emerging Research in Intelligent Systems; Lecture Notes in Networks and Systems; Springer: Cham, Switzerland, 2025; Volume 1347, pp. 502–517. [Google Scholar] [CrossRef]
  81. Rivera, M.; Lucero, P.; Castillo-Sequera, J.L.; Wong, L. Model for Anomaly Detection in Reducing Water Losses in the Distribution Network of Peru Using Machine Learning Algorithms. In Proceedings of the 2025 7th International Conference on Software Engineering and Computer Science (CSECS), Taicang, China, 21–23 March 2025. [Google Scholar] [CrossRef]
  82. Wang, J.; Zhang, Y.; Song, P.; Tian, J. Estimating Sub-Daily Resolution Soil Moisture Using Fengyun Satellite Data and Machine Learning. J. Hydrol. 2024, 632, 130814. [Google Scholar] [CrossRef]
  83. Araújo, B.M.; Gold, D.F.; Lau, L.B.; Reed, P.M.; Alves, C.M.A. Exploring Equity Challenges within Deeply Uncertain Water Supply Investment Pathways in the Federal District of Brazil. J. Water Resour. Plan. Manag. 2024, 150, 04024030. [Google Scholar] [CrossRef]
  84. Lin, C.-H.; Lin, J.-T.; Chiu, P.-Y.; Chen, S.-P.; Lin, C.C.H. Quantum-Driven Multihead Inland Waterbody Detection with Transformer-Encoded CYGNSS Delay-Doppler Map Data. IEEE Trans. Geosci. Remote Sens. 2025, 63, 1–21. [Google Scholar] [CrossRef]
  85. Moncada, W.; Willems, B.; Moncada, W.; Willems, B. Tendencia Anual Del Caudal de Salida, En Referencia al Caudal Ecológico En La Microcuenca Apacheta/Ayacucho/Perú, Del 2000 al 2018. Ecol. Apl. 2020, 19, 93–102. [Google Scholar] [CrossRef]
  86. Pino-Vargas, E.; Taya-Acosta, E.; Ingol-Blanco, E.; Torres-Rúa, A. Deep Machine Learning for Forecasting Daily Potential Evapotranspiration in Arid Regions, Case: Atacama Desert Header. Agriculture 2022, 12, 1971. [Google Scholar] [CrossRef]
  87. Portuguez-maurtua, M.; Arumi, J.L.; Lagos, O.; Stehr, A.; Arquiñigo, N.M. Filling Gaps in Daily Precipitation Series Using Regression and Machine Learning in Inter-Andean Watersheds. Water 2022, 14, 1799. [Google Scholar] [CrossRef]
  88. Benra, F.; De Frutos, A.; Gaglio, M.; Álvarez-Garretón, C.; Felipe-Lucia, M.; Bonn, A. Mapping Water Ecosystem Services: Evaluating InVEST Model Predictions in Data Scarce Regions. Environ. Model. Softw. 2021, 138, 104982. [Google Scholar] [CrossRef]
  89. Fleischmann, A.S.; Brêda, J.P.F.; Passaia, O.A.; Wongchuig, S.C.; Fan, F.M.; Paiva, R.C.D.; Marques, G.F.; Collischonn, W. Regional Scale Hydrodynamic Modeling of the River-Floodplain-Reservoir Continuum. J. Hydrol. 2021, 596, 126114. [Google Scholar] [CrossRef]
  90. Almagro, A.; Meira Neto, A.A.; Vergopolan, N.; Roy, T.; Troch, P.A.; Oliveira, P.T.S. The Drivers of Hydrologic Behavior in Brazil: Insights from a Catchment Classification. Water Resour. Res. 2024, 60, e2024WR037212. [Google Scholar] [CrossRef]
  91. Vincent, F.; Maertens, M.; Bechtold, M.; Jobbágy, E.; Reichle, R.H.; Vanacker, V.; Vrugt, J.A.; Wigneron, J.-P.; De Lannoy, G.J.M. L-Band Microwave-Based Satellite Data and Model Simulations over the Dry Chaco to Estimate Soil Moisture, Temperature, Vegetation and Soil Salinity. IEEE J. Sel. Top. Appl. Earth Obs. Remote Sens. 2022, 15, 6598–6614. [Google Scholar] [CrossRef]
  92. Briones- Zuñiga, J.; Soria Quijaite, J. Stacking Ensemble Model with Heterogeneous Algorithms for the Prediction of the Water Quality Index of the Rimac Basin. In Proceedings of the 23rd LACCEI International Multi-Conference for Engineering, Education and Technology (LACCEI): “Engineering, Artificial Intelligence, and Sustainable Technologies in Service of Society”, Virtual, 19–26 May 2025. [Google Scholar] [CrossRef]
  93. Vega-Huerta, H.; Pajuelo-Leon, J.; De-la-Cruz-VdV, P.; Calderón, D.; Maquen-Niño, G.L.E.; Rios-Castillo, M.E.; Camara-Figueroa, A.; Gil-Calvo, R.; Guerra-Grados, L.; Benito-Pacheco, O. K-Nearest Neighbors Model to Optimize Data Classification According to the Water Quality Index of the Upper Basin of the City of Huarmey. Appl. Sci. 2025, 15, 202. [Google Scholar] [CrossRef]
  94. Delgado, A.; Achata, J.A.G.; Valdivia, J.A.B.; Montes, J.C.J.S.; Carbajal, C. Grey Clustering Method for Water Quality Assessment to Determine the Impact of Mining Company, Peru. Int. J. Adv. Comput. Sci. Appl. 2021, 12, 557–564. [Google Scholar] [CrossRef]
  95. Cruz Grimaldo, C.; Ramos Fernández, L.; Arapa Quispe, J. Proposal to Improve Water Quality from the Calibration of the Streeter-Phelps Model for DO and BOD in the Lurin River, Peru. In Proceedings of the 39th IAHR World Congress; International Association for Hydro-Environment Engineering and Research (IAHR): Madrid, Spain, 2022; pp. 1500–1509. [Google Scholar] [CrossRef]
  96. Mousa, B.G.; Samat, A.; Shu, H. Evaluating the Performance of Satellite-Derived Soil Moisture Products across South America Using Minimal Ground-Truth Assumptions in Spatiotemporal Statistical Analysis. Remote Sens. 2025, 17, 753. [Google Scholar] [CrossRef]
  97. Chafloque, R.; Rodriguez, C.; Pomachagua, Y.; Hilario, M. Predictive Neural Networks Model for Detection of Water Quality for Human Consumption. In Proceedings of the 2021 IEEE 13th International Conference on Computational Intelligence and Communication Networks, CICN, Lima, Peru, 22–23 September 2021; pp. 172–176. [Google Scholar] [CrossRef]
  98. Dawood, T.; Elwakil, E.; Novoa, H.M.; Delgado, J.F.G. Ensemble Intelligent Systems for Predicting Water Network Condition Index. Sustain. Cities Soc. 2021, 73, 103104. [Google Scholar] [CrossRef]
  99. Ayala Bizarro, I.; Castillo Navarro, L.; Zúñiga Mendoza, J. Hydrological-Hydraulic Modeling with Climate Change Impact and Influence of the Curve Number (CN) in the Ichu River Basin, Huancavelica-Peru. In Proceedings of the 23rd LACCEI International Multi-Conference for Engineering, Education, and Technology: “Engineering, Artificial Intelligence, and Sustainable Technologies in Service of Society”, Mexico City, Mexico, 16–18 July 2025. [Google Scholar] [CrossRef]
  100. Badillo-Rivera, E.; Santiago, R.; Poma, I.; Chavez, T.; Arroyo-Paz, A.; Aucahuasi-Almidon, A.; Hinostroza, E.; Segura, E.; Eyzaguirre, L.; León, H.; et al. Flood Susceptibility Mapping in El Niño Phenomenom Integrating Multitemporal Radar Analysis, GIS and Machine Learning Techniques, Piura River Basin, Peru. Front. Environ. Sci. 2025, 13, 1672107. [Google Scholar] [CrossRef]
  101. Aubriot, L.; Zabaleta, B.; Bordet, F.; Sienra, D.; Risso, J.; Achkar, M.; Somma, A. Assessing the Origin of a Massive Cyanobacterial Bloom in the Río de La Plata (2019): Towards an Early Warning System. Water Res. 2020, 181, 115944. [Google Scholar] [CrossRef]
  102. Liu, Y.; Yue, Q.; Wang, Q.; Yu, J.; Zheng, Y.; Yao, X.; Xu, S. A Framework for Actual Evapotranspiration Assessment and Projection Based on Meteorological, Vegetation and Hydrological Remote Sensing Products. Remote Sens. 2021, 13, 3643. [Google Scholar] [CrossRef]
  103. Massari, C.; Brocca, L.; Pellarin, T.; Abramowitz, G.; Filippucci, P.; Ciabatta, L.; Maggioni, V.; Kerr, Y.; Fernandez Prieto, D. A Daily 25 Km Short-Latency Rainfall Product for Data-Scarce Regions Based on the Integration of the Global Precipitation Measurement Mission Rainfall and Multiple-Satellite Soil Moisture Products. Hydrol. Earth Syst. Sci. 2020, 24, 2687–2710. [Google Scholar] [CrossRef]
  104. Velasquez, R.M.A.; Ezcurra, T.T.P.; Aldon, L.F.V. Satellite and Statistical System for Advanced River Flow Prediction. In Proceedings of the 2022 IEEE 29th International Conference on Electronics, Electrical Engineering and Computing (INTERCON), Lima, Peru, 11–13 August 2022. [Google Scholar] [CrossRef]
  105. Fernandez-Palomino, C.A.; Hattermann, F.F.; Krysanova, V.; Lobanova, A.; Vega-Jácome, F.; Lavado, W.; Santini, W.; Aybar, C.; Bronstert, A.; Fernandez-Palomino, C.A.; et al. A Novel High-Resolution Gridded Precipitation Dataset for Peruvian and Ecuadorian Watersheds: Development and Hydrological Evaluation. J. Hydrometeorol. 2022, 23, 309–336. [Google Scholar] [CrossRef]
  106. Llauca, H.; Arestegui, M.; Lavado-Casimiro, W. Constraining Flood Forecasting Uncertainties through Streamflow Data Assimilation in the Tropical Andes of Peru: Case of the Vilcanota River Basin. Water 2023, 15, 3944. [Google Scholar] [CrossRef]
  107. Cambrin, D.R.; Poeta, E.; Pastor, E.; Corley, I.; Cerquitelli, T.; Baralis, E.; Garza, P. HydroChronos: Forecasting Decades of Surface Water Change. In Proceedings of the 33rd ACM SIGSPATIAL International Conference on Advances in Geographic Information Systems, ACM SIGSPATIAL, Minneapolis, MN, USA, 3–6 November 2025; Volume 1, pp. 265–276. [Google Scholar] [CrossRef]
  108. Gangi, D.; Frau, D.; Drozd, A.A.; Bordet, F.; Andrade, S.; Bazzalo, M.; de Tezanos Pinto, P. Integrating Field and Satellite Monitoring for Assessing Environmental Risk Associated with Bacteria in Recreational Waters of a Large Reservoir. Sci. Total Environ. 2022, 818, 151714. [Google Scholar] [CrossRef] [PubMed]
  109. Ross, A.C.; Mendoza, M.M.; Drenkhan, F.; Montoya, N.; Baiker, J.R.; Mackay, J.D.; Hannah, D.M.; Buytaert, W. Seasonal water storage and release dynamics of bofedal wetlands in the Central Andes. Hydrol. Process. 2023, 37, e14940. [Google Scholar] [CrossRef]
  110. Melati, M.D.; Athayde, G.B.; Fan, F.M.; Garcia, L.H.; de Vasconcelos Muller Athayde, C. Monitoring Groundwater Storage in a Fractured Volcanic Aquifer System. Environ. Monit. Assess. 2023, 195, 385. [Google Scholar] [CrossRef]
  111. Visitación, K.; Estrada, Y.; Cordova, M.; Pires, A.C.; Paule Bonnet, M.; Sollier, V.; Sfaksi, N.; Peña-Luque, S.; Rau, P.; Bourrel, L.; et al. Monitoring with Remote Sensing and Low-Cost Sensors: Surface Water Variability and Ecohydrological Dynamics of Yuracmayo Reservoir. In Proceedings of the IGARSS 2025—2025 IEEE International Geoscience and Remote Sensing Symposium, Brisbane, Australia, 3–8 August 2025; pp. 4513–4516. [Google Scholar] [CrossRef]
  112. Perez-Torres, W.I.; Uman-Flores, D.A.; Quispe-Quispe, A.B.; Palomino-Quispe, F.; Bezerra, E.; Leher, Q.; Paixão, T.; Alvarez, A.B. Exploratory Analysis Using Deep Learning for Water-Body Segmentation of Peru’s High-Mountain Remote Sensing Images. Sensors 2024, 24, 5177. [Google Scholar] [CrossRef]
  113. Oberascher, M.; Rauch, W.; Sitzenfrei, R. Towards a Smart Water City: A Comprehensive Review of Applications, Data Requirements, and Communication Technologies for Integrated Management. Sustain. Cities Soc. 2022, 76, 103442. [Google Scholar] [CrossRef]
  114. Suri, A.; Azad, S. Optimal Placement of Rain Gauge Networks in Complex Terrains for Monitoring Extreme Rainfall Events: A Review. Theor. Appl. Climatol. 2024, 155, 2511–2521. [Google Scholar] [CrossRef]
  115. Barilari, A.; Lima, M.L.; Massone, H.E. Spatial Dependencies during Multi-Criteria Analysis for Groundwater Resource Management at a Local Scale. Groundw. Sustain. Dev. 2021, 14, 100621. [Google Scholar] [CrossRef]
  116. Calizaya, E.; Cuentas, O.; Pozo, M.; Calizaya, F.; Vilcanqui, H.; Cuentas, M.; Marca, O.; Caira, C. Spatial Distribution of Deficit and Surplus of Water and Its Interplay with Landscape Relief Units in the High-Andean Huancané River Basin, Puno, Peru. Model. Earth Syst. Environ. 2025, 11. [Google Scholar] [CrossRef]
  117. Romero-Hernández, C.M.; Avila-Diaz, A.; Quesada, B.; Medeiros, F.; Cerón, W.L.; Guzman-Escalante, J.; Ocampo-Marulanda, C.; Rodrigues Torres, R.; Zuluaga, C.F. Bias-Corrected High-Resolution Precipitation Datasets Assessment over a Tropical Mountainous Region in Colombia: A Case of Study in Upper Cauca River Basin. J. S. Am. Earth Sci. 2024, 140, 104898. [Google Scholar] [CrossRef]
  118. Beltramone, G.; Frery, A.C.; Scavuzzo, M.C.; Bonansea, M.; Ferral, A. Detecting Seasonal Snow Transitions in SAR Time Series with Horizontal Visibility Graphs. Remote Sens. Appl. 2025, 40, 101772. [Google Scholar] [CrossRef]
  119. Jaafar, H.H.; Sujud, L.H. High-Resolution Satellite Imagery Reveals a Recent Accelerating Rate of Increase in Land Evapotranspiration. Remote Sens. Environ. 2024, 315, 114489. [Google Scholar] [CrossRef]
  120. Qiu, K.; You, W.; Jiang, Z.; Tang, M. Tracking the Water Storage and Runoff Variations in the Paraná Basin via GNSS Measurements. Sci. Total Environ. 2024, 912, 168831. [Google Scholar] [CrossRef] [PubMed]
  121. Cardenas, D.C.; Altamirano, F.S.; Yataco Bernaola, M. Using Neural Networks in River Level Prediction—Case Study of the River La Leche-Peru. In Proceedings of the 2021 IEEE International Conference on Machine Learning and Applied Network Technologies, ICMLANT 2021, Soyapango, El Salvador, 16–17 December 2021. [Google Scholar] [CrossRef]
  122. Quintana-Ortiz, J.M.; Santillan, R.D.M.; Pasapera-Gonzalez, J.J. Estimation of Flooded Areas during the El Niño Costero 2017 Event Using Multisensor Satellite Data. Case Study: Lower Piura Watershed (Peru). In Proceedings of the 2021 IEEE International Conference on Aerospace and Signal Processing, INCAS 2021, Lima, Peru, 28–30 November 2021. [Google Scholar] [CrossRef]
  123. Llanos, A.A.H.; Meza, J.R.Y.; Cordova, D.V.S.; Martinez, J.C.C.; Huatangari, L.Q.; Sanchez, D.L.Q.; Segura, R.R.; Gutierrez, A.L.L. An Artificial Neural Network Model for Water Quality Prediction in the Amoju Hydrographic Subbasin, Cajamarca-Peru. Int. J. Adv. Comput. Sci. Appl. 2024, 15, 1021–1032. [Google Scholar] [CrossRef]
  124. Instituto Mexicano de Tecnología del Agua; Lujano, E.; Lujano, R.; Huamani, J.C.; Lujano, A. Tecnología y Ciencias Del Agua. Tecnol. Y Cienc. Del Agua 2023, 14, 169–203. [Google Scholar] [CrossRef]
  125. Fleischmann, A.S.; Al Bitar, A.; Oliveira, A.M.; Siqueira, V.A.; Colossi, B.R.; de Paiva, R.C.D.; Kerr, Y.; Ruhoff, A.; Fan, F.M.; Pontes, P.R.M.; et al. Synergistic Calibration of a Hydrological Model Using Discharge and Remotely Sensed Soil Moisture in the Paraná River Basin. Remote Sens. 2021, 13. [Google Scholar] [CrossRef]
  126. Nardini, A.G.C.; Gonzalez, C.; Contreras, A.; Velásquez, G.; Vargas-Baecheler, J.; Piégay, H.; Espinoza, J.; Yépez, S. Linking the Evolution of the Andalién River Morphology (Central–Southern Chile) to Anthropogenic Interventions by Using a New QGIS Tool. Sustainability 2024, 16. [Google Scholar] [CrossRef]
  127. Arana-Ruedas, D.P.R.; Pino-Vargas, E.; del Águila-Ríos, S.; Huayna, G. Mapping Flood-Prone Areas Using GIS and Morphometric Analysis in the Mantaro Watershed, Peru: Approach to Susceptibility Assessment and Management. Sustainability 2025, 17. [Google Scholar] [CrossRef]
  128. Núñez, J.; Cortés, C.B.; Yáñez, M.A. Explainable Artificial Intelligence in Hydrology: Interpreting Black-Box Snowmelt-Driven Streamflow Predictions in an Arid Andean Basin of North-Central Chile. Water 2023, 15. [Google Scholar] [CrossRef]
  129. Rau, P.; Callan, N.; Abad, W.; Visitacion, K. Stormwater Runoff Assessment under Climate Change Scenarios Using Remote Sensing Products. A Case Study in Piura, Peru. 2022. Available online: https://www.iahr.org/library/infor?pid=21619 (accessed on 1 February 2026).
  130. Rangecroft, S.; Clason, C.; Dextre, R.M.; Richter, I.; Kelly, C.; Turin, C.; Grados-Bueno, C.V.; Fuentealba, B.; Hernandez, M.C.; Julca, S.M.; et al. GC Insights: Lessons from Participatory Water Quality Research in the Upper Santa River Basin, Peru. Geosci. Commun. 2024, 7, 145–150. [Google Scholar] [CrossRef]
  131. Pfeffer, J.; Cazenave, A.; Blazquez, A.; Decharme, B.; Munier, S.; Barnoud, A. Assessment of Pluri-Annual and Decadal Changes in Terrestrial Water Storage Predicted by Global Hydrological Models in Comparison with the GRACE Satellite Gravity Mission. Hydrol. Earth Syst. Sci. 2023, 27, 3743–3768. [Google Scholar] [CrossRef]
  132. Veizaga Medina, A.R. Comparative Meteorological Data in the Mauri and Coroico River Basins, in Relation to Satellite Data. J. Selva Andin. Res. Soc. 2025, 16, 28–39. [Google Scholar] [CrossRef]
  133. Fleischmann, A.S.; Papa, F.; Fassoni-Andrade, A.; Melack, J.M.; Wongchuig, S.; Paiva, R.C.D.; Hamilton, S.K.; Fluet-Chouinard, E.; Barbedo, R.; Aires, F.; et al. How Much Inundation Occurs in the Amazon River Basin? Remote Sens. Environ. 2022, 278, 113099. [Google Scholar] [CrossRef]
  134. Justiniano, E.F.; Kawakubo, F.S.; dos Santos Junior, E.R.; de Melo, B.M.; Menezes, G.P.; Fantin, M.; Pedrassoli, J.C.; Martines, M.R.; Morato, R.G. A New Spectral Index for Mapping Water Surfaces in Urban Contexts. IEEE J. Sel. Top. Appl. Earth Obs. Remote Sens. 2025, 18, 11358–11369. [Google Scholar] [CrossRef]
  135. Feng, Z.; Zhang, F.; Ma, X.; Jim, C.Y.; Wu, D.; Liu, D.; Oke, S.A.; Wang, W.; Wei, L.; Nie, S.; et al. Refining Water Body Extraction by Remote Sensing with Deep Learning Models: Exploring Different Band Combinations. IEEE J. Sel. Top. Appl. Earth Obs. Remote Sens. 2025, 18, 18005–18018. [Google Scholar] [CrossRef]
  136. Izagirre, E.; Casassa, G.; Dussaillant, I.; Miles, E.S.; Wilson, R.; Rada, C.; Faria, S.H.; Antiguedad, I. Evolution of Glacial Lakes and Southernmost GLOFs in the Cordillera Darwin and Cloue Icefields (Tierra Del Fuego) between 1945–2024. Front. Earth Sci. 2025, 13, 1641167. [Google Scholar] [CrossRef]
Figure 1. Structured review workflow. The figure summarizes the methodological sequence used in this narrative review: scope definition, source selection, search execution, record management, screening and eligibility assessment, data extraction and coding, and narrative synthesis with quality considerations.
Sustainability 18 03153 g001
Figure 2. From operational gains to durable WRM improvements: cross-cutting conditions for scale-up in semi-arid WRM.
Sustainability 18 03153 g002
Table 1. Inclusion and exclusion decisions by screening stage. Included and excluded records by screening stage *.
Screening StageIncluded (n)Excluded (n)Total (n)
Title/abstract screening7897175
Targeted full text assessment25732
Overall103104207
* Records included/excluded at each screening stage; totals reflect the deduplicated master se. Screening workflow aligned with Codina [33].
Table 2. Annual distribution of included studies (2020–2026) *.
Year2020202120222023202420252026Total
Included studies (n)101913822283103
* Included studies per year across the review window; values indicate publication counts.
Table 3. Document type distribution of included studies (2020–2026) *.
Document TypeArticleConference-DerivedReviewTotal
Included studies (n)81202103
* Distribution of included studies by document type.
Table 4. Database overlap of included studies. Included studies by database overlap *.
Source CategoryScopus OnlyWos OnlyIEEE Xplore OnlyScopus + WoSScopus + WoS + IEEE XploreTotal
Included studies (n)28119485103
* Contribution of each database and overlap among sources; “only” indicates unique contributions per database.
Table 5. Geographic scope of included studies. Included studies by geographic scope *.
Geographic ScopePeru (Case-Based)Latin America (Regional or Multi-Country)Transferable (Global Relevance)OtherTotal
Included studies (n)4140202103
* Distribution of included studies by geographic lens: Peru anchor, Latin America comparative, and transferable evidence.
Table 6. Evidence map of included studies by technology family and application outcome *.
Technology FamilyEarly WarningForecastingWater QualityNRW/LeakageAllocation and ComplianceOther ApplicationTotal
RS_GIS1255022347
IoT_Telemetry1113017
Analytics_AI_DSS412930432
Hybrid54100515
Other tech family0010012
Total2222176234103
* Cross-tabulation linking technology families to application outcomes.
Table 7. Outcome type distribution by technology family (operational vs. governance) *.
Technology FamilyOperationalBothGovernanceNot ReportedTotal
RS_GIS3772147
IoT_Telemetry70007
Analytics_AI_DSS2741032
Hybrid1140015
Other tech family00202
Total821551103
* Impact-reporting lens across families (operational vs. governance); counts indicate how outcomes were reported.
Table 8. RS/GIS evidence cited in this section by application outcome and geographic scope *.
Application OutcomeMain RS/GIS FindingsPeruLatin AmericaTransferable/Cross-Context
Early warningBasin-scale drought/flood risk intelligence improves monitoring coverage and alert timeliness.[35,36,37,38,39][40,41,42,43][44,45]
ForecastingRS-derived variables strengthen hydromet forecasting in data-scarce basins, contingent on local calibration/validation.[66,67][68][69,70]
Water qualitySatellite proxies support screening and hotspot targeting for field sampling; downstream compliance impacts are seldom quantified.[70][71,72,73][73]
NRW/leakageNot observed within the RS/GIS family; leakage control is addressed via network instrumentation and operational analytics.
Allocation and complianceRS/GIS informs allocation-oriented planning (e.g., zoning/prioritization), while enforceable compliance outcomes are rarely reported.[73]
* Studies coded as “Other” are discussed in-text and are not tabulated, as they do not map consistently to the five outcome categories.
Table 9. IoT/Telemetry evidence and main findings by application outcome and geographic scope *.
Application OutcomeMain IoT/Telemetry FindingsPeruLatin AmericaTransferable/Cross-Context
Early warningNear real-time in situ sensing supports faster hazard detection and alert triggering when response protocols exist.[66]
ForecastingHigh-frequency operational data improve short-term system-state estimation for operational planning.[67]
Water qualityOnline sensing enables earlier anomaly detection and quicker response, but sustained performance depends on O&M and reliable connectivity.[68]
NRW/leakageTelemetry and metering improve leakage monitoring and loss-reduction actions, constrained by O&M, connectivity, and legacy-system integration.[74][69,70]
Allocation and complianceNot observed in the screened corpus as a direct IoT/telemetry outcome category.
* Studies coded as “Other” are discussed in-text and are not tabulated, as they do not map consistently to the five outcome categories.
Table 10. Analytics/AI + DSS evidence and main findings by application outcome and geographic scope *.
Application OutcomeMain Analytics/AI and DSS FindingsPeruLatin AmericaTransferable/Cross-Context
Early warningAnalytics/AI enhance early warning by extracting actionable risk signals from multi-source data, contingent on robust validation.[72][73][75]
ForecastingData-driven and hybrid models improve forecasting for key hydromet variables, but transferability and transparent validation remain limiting factors.[76,85,86,87][77,88,89,90,91]
Water qualityModels support classification and prediction for faster risk identification; sustained impact depends on reliable pipelines and operational uptake.[78,92,93,94,95][96][79,97]
NRW/leakageAnomaly detection and decision-support tools help identify non-visible leaks and prioritize interventions, constrained by data completeness and workflow integration.[80,81,98]
Allocation and complianceNot observed in the screened corpus as a direct Analytics/AI + DSS outcome category.
* Studies coded as ‘Other’ are discussed in-text and are not tabulated, as they do not map consistently to the five outcome categories.
Table 11. Hybrid evidence and main findings by application outcome and geographic scope *.
Application OutcomeMain Hybrid FindingsPeruLatin AmericaTransferable/Cross-Context
Early warningIntegrates RS/GIS hazard observability with telemetry and analytics/DSS to enable actionable alerting; gains are mainly operational (faster alerts).[99,100][101,102][103]
ForecastingMulti-source fusion improves short-term forecasts; performance depends on harmonization and validation.[104,106][107]
Water qualityIn situ sensing combined with RS context and analytics supports anomaly detection and targeted response.[108]
NRW/leakageNo distinct hybrid evidence identified in the screened studies.
Allocation and complianceNo distinct hybrid evidence identified in the screened studies.
* Studies coded as “Other” are discussed in-text and are not tabulated, as they do not map consistently to the five outcome categories.
Table 12. Territorial adoption roadmap for smart WRM in semi-arid settings *.
Phase (Time)Minimum DeliverablesKey Performance Indicators
(KPIs; Readiness/Impact)
1. Baseline and quick wins
(0–12 months)
  • Outcome baselines and target KPIs;
  • Stable data flows (RS/GIS and/or telemetry);
  • First operational dashboards/alerts with decision triggers
  • Data completeness/uptime;
  • Baseline measured for the target outcome (lead time/skill, coverage, NRW)
2. Integration and institutionalization
(12–24 months)
  • Interoperability rules (identifiers, standards and APIs);
  • SOPs and assigned roles;
  • O&M plan with secured OPEX
  • SOP adherence/response time;
  • Sustained monitoring continuity and O&M execution rate
3. Scaling and optimization
(24+ months)
  • Replication templates (architecture + SOPs);
  • Expansion to new zones/sub-basins;
  • Performance monitoring and improvement loop
  • Coverage expansion with sustained KPI trends;
  • Unit cost improvement (per asset or per km)
* Three-phase adoption roadmap with minimum deliverables and suggested key performance indicators (KPIs) to operationalize scale-up.
Disclaimer/Publisher’s Note: The statements, opinions and data contained in all publications are solely those of the individual author(s) and contributor(s) and not of MDPI and/or the editor(s). MDPI and/or the editor(s) disclaim responsibility for any injury to people or property resulting from any ideas, methods, instructions or products referred to in the content.