1. Introduction
Agricultural carbon markets are expanding rapidly to address climate change while improving rural livelihoods, with voluntary carbon markets projected to grow fifteen-fold by 2030 [
1]. Central to this expansion is the engagement of smallholder farmers, who manage over 80% of the world’s farms and could sequester substantial carbon through agroforestry and improved land management [
2]. However, a troubling pattern persists: carbon programs often struggle to reach the poorest farmers, raising fundamental questions about whether market-based climate solutions can deliver equitable outcomes [
3,
4]. The conventional explanation points to resource constraints: low-income farmers lack the financial capital, land tenure security, and market access required for participation [
5,
6]. This resource-based logic has shaped how programs are designed, typically targeting farmers with demonstrated capacity to invest in tree planting and maintenance over multi-year time horizons.
However, this resource-based framework faces a critical limitation: it treats participation as primarily an individual-level phenomenon, overlooking how collective institutions may mediate access to markets. While extensive research has documented who participates in carbon markets, consistently finding that wealthier, better-educated farmers with secure tenure achieve higher enrollment, we lack a systematic understanding of how resource-poor farmers achieve access when they do participate successfully. This represents a fundamental gap: if some low-resource farmers overcome barriers that exclude others, understanding their pathways could inform more inclusive program design.
Kenya’s International Small Group and Tree Planting Program (TIST) (
https://program.tist.org/, accessed on 11 January 2026) dramatically challenges this conventional wisdom. Among 8894 smallholder farmers in Kenya’s mature carbon market, overall participation reaches 90.4%. More remarkably, when we disaggregate by income, we observe a
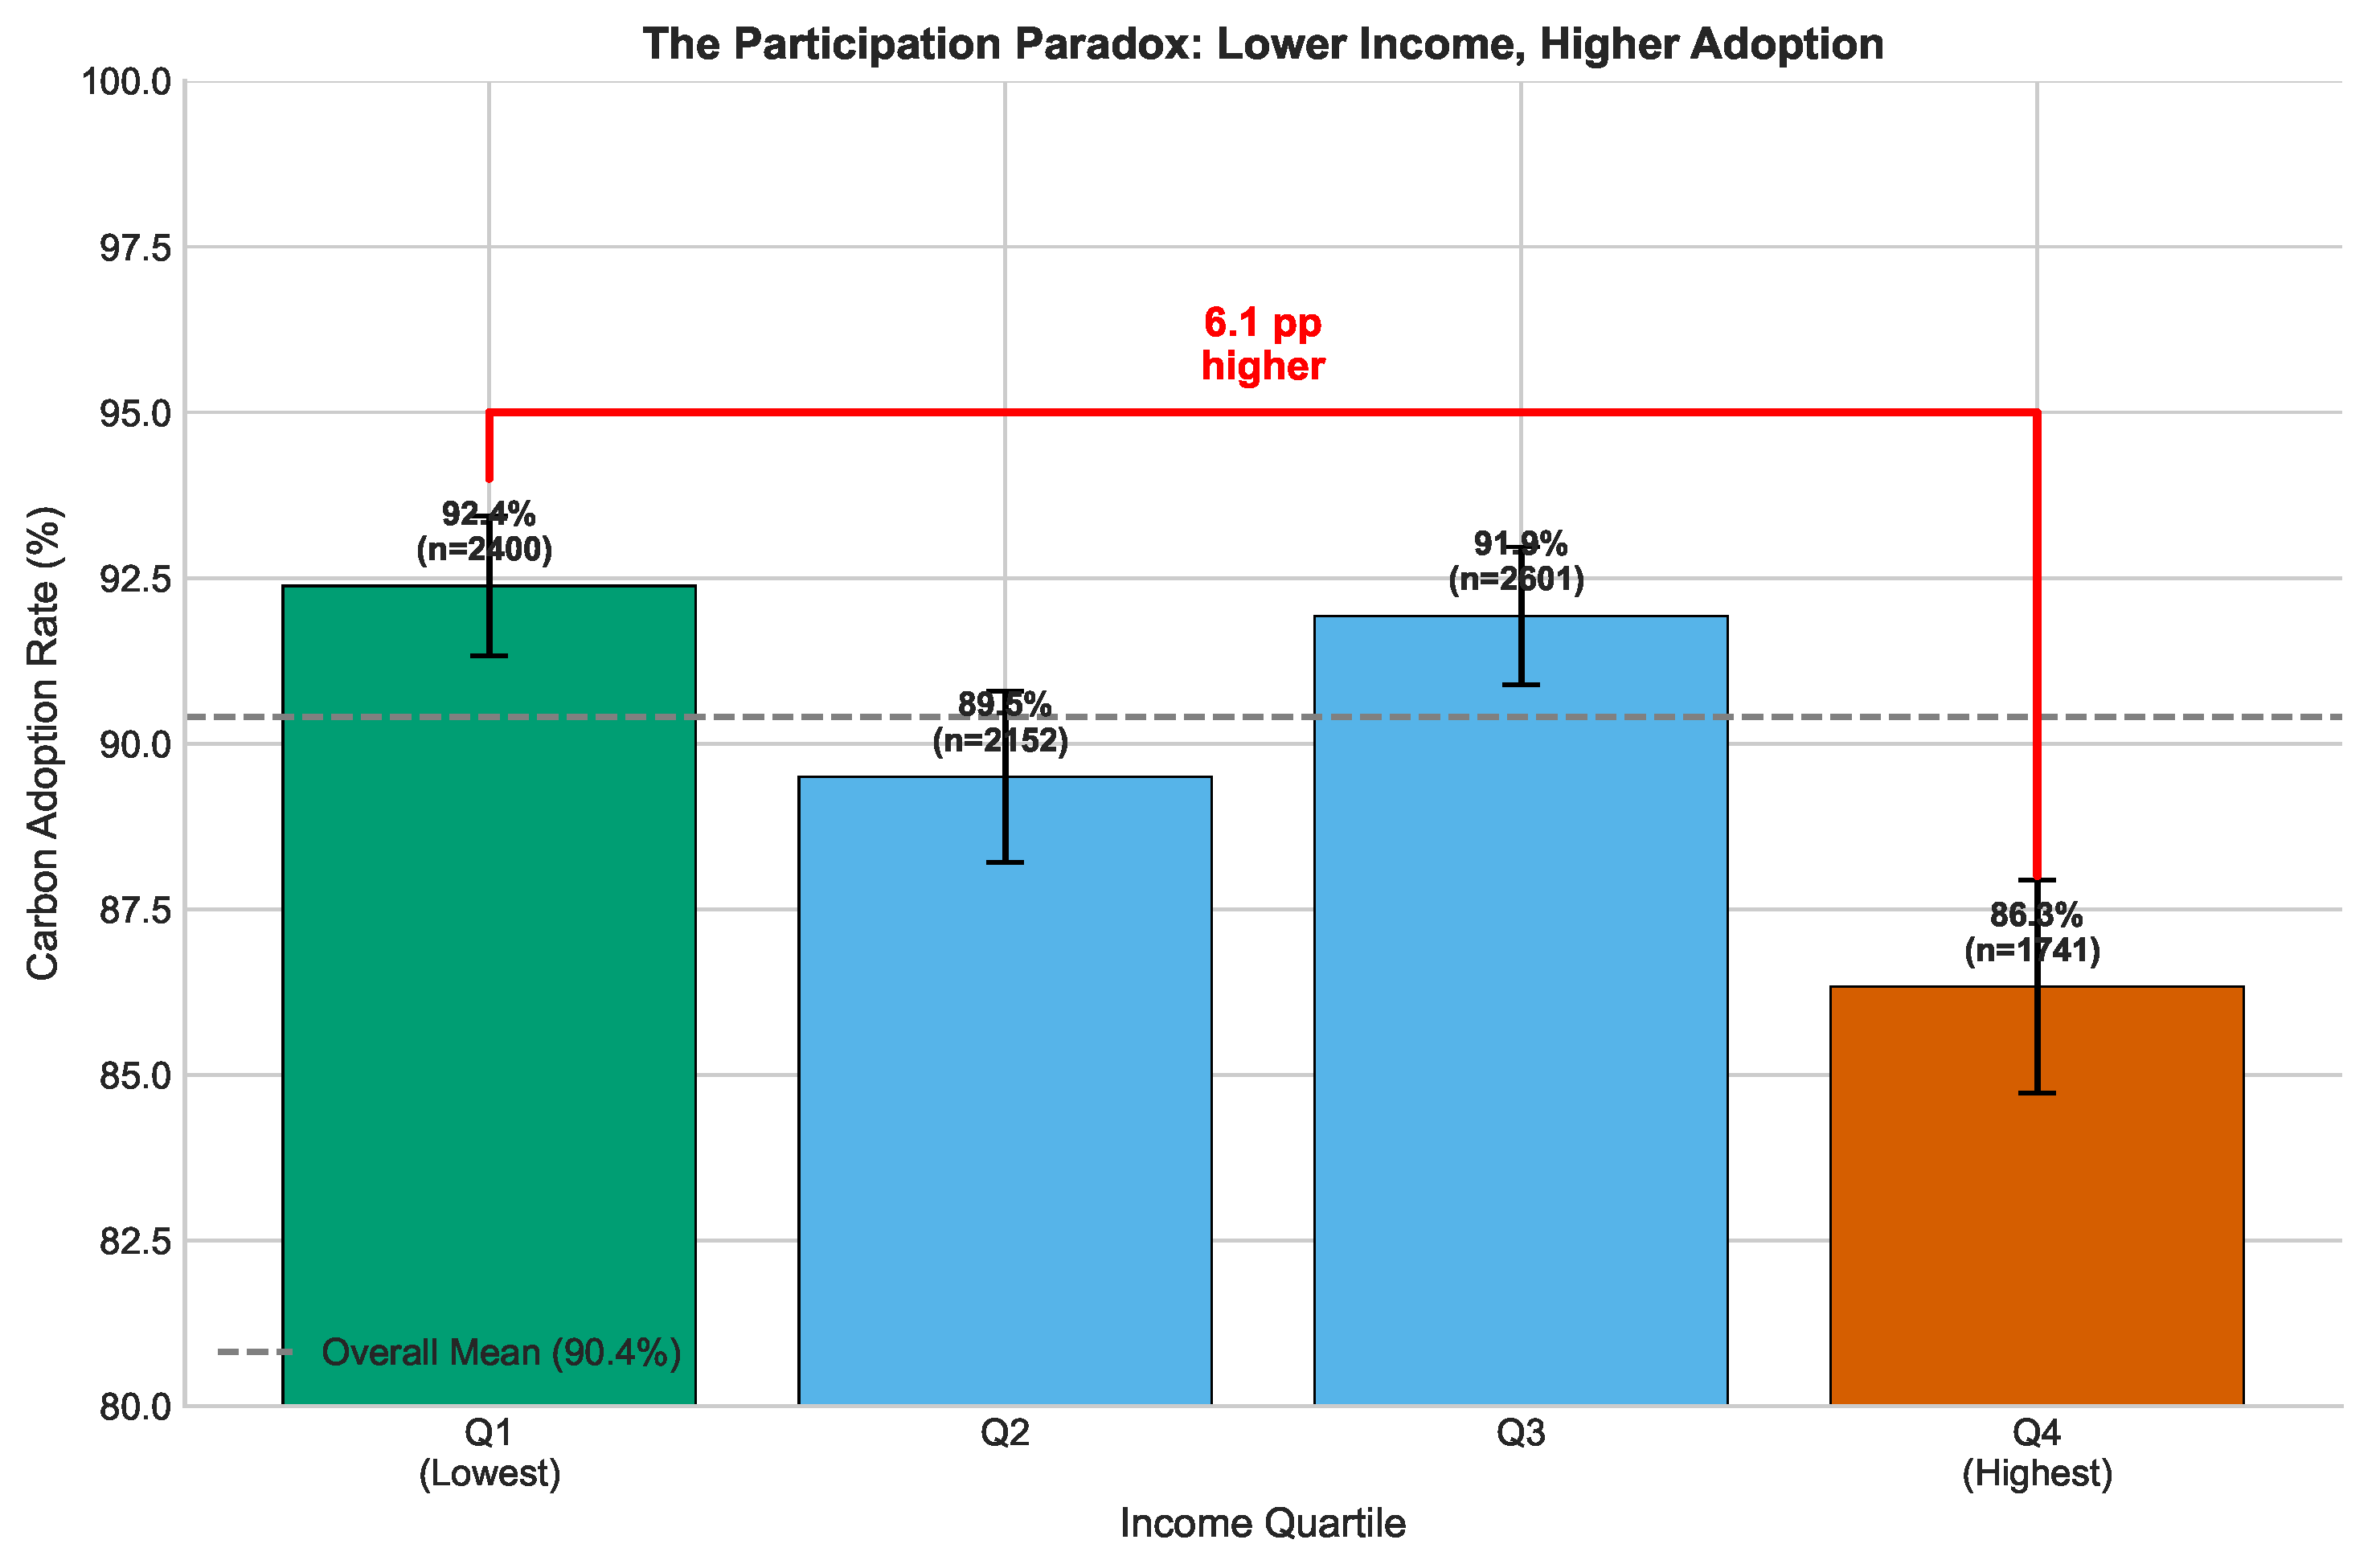
participation paradox: the lowest-income farmers achieve the highest adoption rates. Farmers in the poorest income quartile show 92.4% participation compared to 86.3% for the wealthiest quartile, a 6.1 percentage point advantage for those with the fewest financial resources. This pattern inverts the expected relationship between resources and market access, demanding explanation.
This study complements our prior work examining payment complementarity across TIST operations in Kenya, Tanzania, Uganda, and India [
7]. While that analysis tested whether combining cash and community benefits produces super-additive effects on land-use intensity among enrolled farmers, the present study addresses a logically prior and distinct question using a broader sample that includes non-enrolled farmers: how do resource-poor farmers achieve market access in the first place?
Research Questions and Study Design. This study addresses two research questions. The primary question is,
How do resource-poor smallholder farmers achieve high carbon market participation rates in a mature program context? The secondary question is,
Do organizationally-enabled participation pathways produce comparable or superior environmental outcomes relative to resource-driven pathways? To address these questions, we adopt a mixed confirmatory–exploratory design. The
exploratory component uses data-driven pathway identification via GMM clustering to uncover participant heterogeneity. The
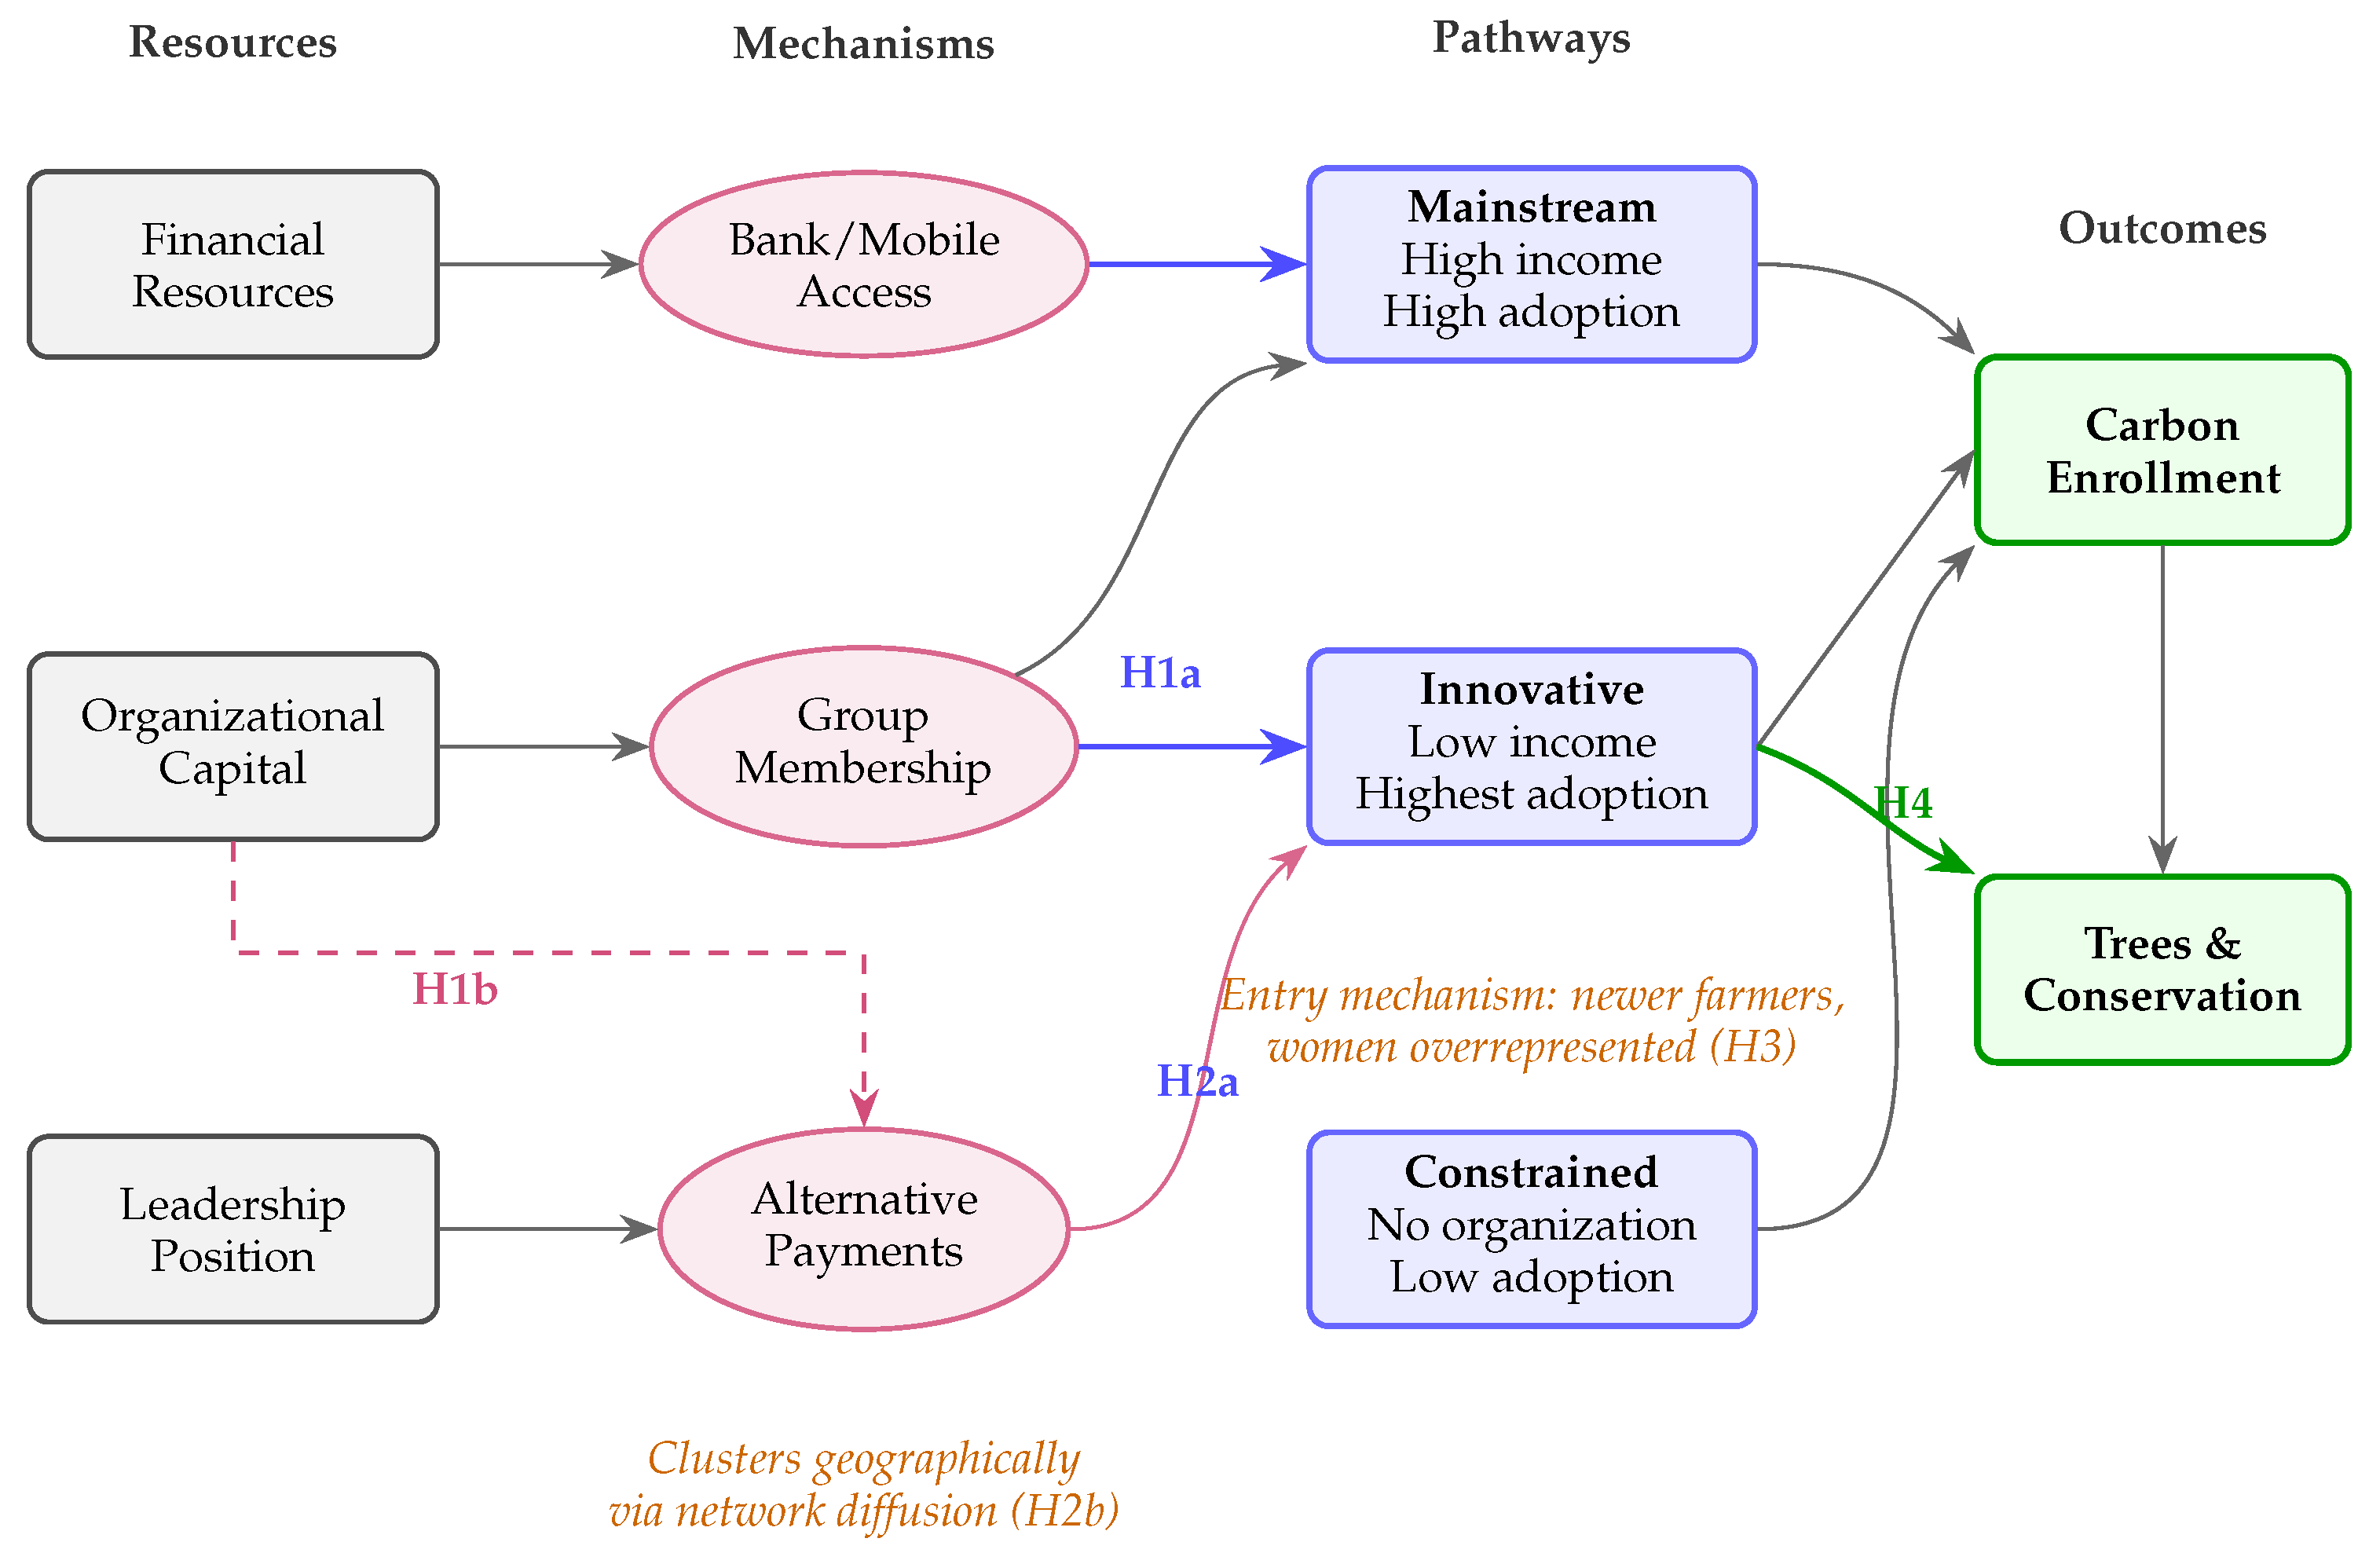
confirmatory component tests six pre-specified hypotheses (H1a, H1b, H2a, H2b, H3, H4) derived from collective action theory about how organizational capital and payment flexibility enable participation. We clearly label confirmatory hypothesis tests throughout
Section 6 and restrict causal language accordingly, given the cross-sectional observational design. By focusing on Kenya and employing model-based clustering to identify participation pathways, we uncover mechanisms, organizational capital and payment flexibility to explain why the poorest farmers achieve the highest adoption rates.
Using GMM clustering on eight socioeconomic variables, we identify three distinct pathways to carbon market participation. The Mainstream pathway (60.2% of farmers) is characterized by higher income ($3.15/day) and conventional resource-based participation (91.4% adoption). The Innovative pathway (32.4%) combines the lowest income ($1.57/day) with the highest adoption (93.8%). The Constrained pathway (7.5%) represents genuine exclusion, with only 67.0% adoption. The Innovative pathway, where the poorest farmers outperform their wealthier counterparts, is the empirical heart of the paradox.
We propose that two complementary mechanisms explain this pattern, drawing on Ostrom’s theory of collective action [
8]. First,
organizational capital, the capacity to access resources and coordinate action through group membership and leadership positions, is associated with high adoption rates. Organizational membership is present in all Mainstream and Innovative pathway farmers and absent in all Constrained pathway farmers. Readers should note an important disclosure: organizational membership and leadership are included as features in the GMM clustering procedure; consequently, their “separation” of pathways is partly definitional. To mitigate circularity concerns, we validate the typology using out-of-feature outcomes (tree counts, conservation farming) and present sensitivity analyses that exclude these definitional variables in
Section 5. This pattern suggests organizational capital may serve as a prerequisite for high participation, regardless of income level. Second,
payment flexibility through alternative benefit arrangements (training, seedlings, community infrastructure) is associated with participation without requiring formal financial infrastructure. Alternative payment recipients show 100% carbon enrollment, an association that should be interpreted descriptively given the cross-sectional design. Leadership positions serve as bridges to these alternative arrangements: holding a leadership role more than doubles the odds of accessing alternative payments (OR = 2.13,
).
These mechanisms characterize a pathway that functions as an entry mechanism, actively recruiting new participants. Among farmers with less than six months of program tenure, 49.3% participate through the Innovative pathway compared to 41.8% through Mainstream. Alternative payment arrangements cluster geographically, with Laikipia West district showing 75.8% uptake compared to 5.7% nationally, suggesting that successful organizational models diffuse spatially. The Innovative pathway is also associated with superior environmental outcomes: controlling for income and farm size, Innovative pathway farmers maintain 20% more trees (IRR = 1.20, ) and show 93% higher odds of conservation farming adoption (OR = 1.93, ). Women are overrepresented in this pathway (40.7% vs. 34.0% in Mainstream).
This study makes four contributions to the literature. First, we provide the first large-scale empirical documentation of an income-adoption inversion in agricultural carbon markets, challenging resource-based participation frameworks. Second, we introduce organizational capital as a distinct analytical construct, separate from social capital or human capital, that captures the institutional infrastructure, enabling collective action and market access. Third, methodologically, we develop a pathway-based approach using model-based clustering that reveals participant heterogeneity invisible to conventional regression analysis. Fourth, we derive three actionable design principles grounded in empirical evidence: invest in organizational infrastructure, enable payment flexibility from program inception, and shift from individual screening to institutional capacity building.
The findings carry direct implications for carbon market design and climate finance. As voluntary carbon markets scale toward
$50 billion by 2030, debates intensify about whether market mechanisms can deliver a “just transition” that includes vulnerable populations [
9]. Our evidence suggests that inclusion and effectiveness need not be in tension. Kenya’s carbon market achieves both near-universal participation and strong environmental outcomes, not by targeting high-resource farmers, but by building organizational pathways that enable resource-poor farmers to participate and excel. For standards bodies and program designers, these findings suggest a reorientation: from screening farmers based on individual resource endowments toward investing in organizational infrastructure that enables alternative participation pathways.
The remainder of this paper proceeds as follows.
Section 2 reviews the relevant literature and positions our theoretical contributions.
Section 3 develops our theoretical framework with six testable hypotheses.
Section 4 describes the TIST program context, data sources, and variable construction.
Section 5 presents our analytical strategy, including pathway identification via GMMs.
Section 6 presents results organized around our hypotheses, documenting pathway characteristics, mechanism tests, and outcome comparisons.
Section 7 interprets findings and considers boundary conditions.
Section 8 concludes with implications for carbon program design.
2. Literature Review
This section situates our study within three interconnected bodies of literature, identifying gaps that our research addresses. We begin with research on carbon markets and smallholder participation, documenting the prevailing resource-based explanation for participation barriers and its limitations. We then turn to collective action theory, drawing particularly on Ostrom’s institutional analysis to develop the concept of organizational capital as an alternative pathway to market participation. Next, we examine payment mechanism design, considering how payment flexibility enables institutional innovation. We conclude by articulating our specific contributions to each literature stream.
2.1. Carbon Markets and Smallholder Participation
Agricultural carbon markets have emerged as a prominent strategy for climate mitigation, with voluntary carbon markets projected to reach
$50 billion by 2030 and nature-based solutions commanding increasing attention from corporate buyers and policymakers [
1]. Smallholder farmers represent both a challenge and an opportunity: they manage the majority of agricultural land in developing countries and could contribute substantially to carbon sequestration through agroforestry, improved soil management, and reduced deforestation. Nevertheless, engaging millions of dispersed, resource-constrained farmers in formal carbon markets poses fundamental operational challenges.
The dominant framework for understanding smallholder participation emphasizes resource constraints at the individual level. According to this view, farmers require adequate financial capital to invest in tree establishment during the three-to-five year period before carbon payments materialize, secure land tenure to justify long-term investments, access to financial infrastructure for receiving payments, and sufficient education to navigate program requirements [
5,
6]. Transaction costs compound these barriers, with measurement, reporting, and verification (MRV) consuming substantial carbon revenues. This resource-based logic has led programs to adopt targeting strategies that prioritize farmers with demonstrated capacity [
10].
Empirical evidence has largely supported the resource-based framework, documenting systematic patterns of exclusion. Studies across diverse contexts find that carbon program participants tend to have larger landholdings, higher incomes, greater education, and more secure tenure than non-participants [
11]. Meta-analyses and case studies have found that the poor are rarely the main beneficiaries of payments for ecosystem services programs [
12,
13], fueling concerns about whether market-based approaches can contribute to equitable development.
However, the resource-based framework faces important limitations. First, it treats participation as primarily an individual-level phenomenon, overlooking how collective institutions mediate access to markets and resources. Second, it assumes that formal financial infrastructure is necessary for benefit delivery, ignoring alternative mechanisms. Third, it emphasizes barriers to entry while providing limited insight into pathways to inclusion. Fourth, it cannot explain the empirical anomalies we observe, i.e., contexts where low-resource farmers achieve high participation rates. These limitations motivate our theoretical reframing: rather than asking only who participates, we ask how different farmers achieve participation.
2.2. Collective Action Theory and Organizational Capital
Ostrom’s theory of collective action provides a powerful alternative lens for understanding smallholder participation in carbon markets [
8]. Ostrom demonstrated that communities can successfully manage common-pool resources when they develop appropriate institutional arrangements, defined rules, monitoring mechanisms, and sanctioning systems that align individual incentives with collective outcomes. Carbon sequestration exhibits common-pool characteristics: the atmosphere is a shared resource, individual sequestration efforts benefit all, and monitoring and enforcement require collective solutions [
14].
We extend this framework by introducing the concept of
organizational capital as a distinct asset that enables market participation. Drawing on the social capital literature [
15], we define organizational capital as the capacity to access resources, information, and coordination through membership in formal organizations and the networks they create. Organizational capital is analytically distinct from related concepts, differing in the following ways: from human capital (education, skills) by emphasizing institutional membership rather than individual attributes; from financial capital (income, savings) by focusing on non-monetary resources; from natural capital (land, resources) by centering on social infrastructure; from physical capital (equipment, infrastructure) by emphasizing organizational rather than material assets; and from social capital (networks, trust) by requiring formal membership in constituted organizations rather than diffuse relationships. It represents the institutional infrastructure through which collective action becomes possible.
Organizational capital facilitates carbon market participation through several mechanisms. First, farmer organizations reduce transaction costs by aggregating smallholders into units large enough to justify program engagement. Second, organizations provide information channels through which farmers learn about program requirements and management practices [
16,
17]. Third, organizations enable peer monitoring that reduces moral hazard. Fourth, organizations create platforms for collective bargaining that enable negotiation over payment arrangements. Fifth, organizations may provide risk pooling, reducing individual farmers’ exposure to establishment period uncertainties. Sixth, organizations can enforce commitments, solving time-consistency problems that would prevent individual participation.
Leadership plays a particularly important role in translating organizational membership into concrete benefits. Leaders serve as information brokers, connecting communities to external opportunities [
18]; norm entrepreneurs, legitimating new practices [
19]; and boundary spanners, negotiating between local institutions and formal programs [
20]. In carbon markets, leaders may be uniquely positioned to access alternative payment arrangements and channel resources to members who lack individual capacity.
Operationalizing Organizational Capital: Measurement and Limitations. In this study, organizational capital is operationalized through two observable proxies: (1)
formal membership status, a binary indicator for belonging to any registered agricultural cooperative, savings group, women’s group, or community association, and (2)
leadership position, a binary indicator for serving as chairperson, secretary, treasurer, or committee member in any such organization. These indicators are recorded in the TIST program administrative database, reducing reliance on self-reported data. However, several limitations warrant acknowledgment. First, membership and leadership are coarse proxies that do not distinguish the quality, intensity, or longevity of organizational involvement. Second, membership may reflect self-selection by more motivated or socially connected farmers, confounding the interpretation of organizational effects. Third, regional and historical variation in organizational infrastructure means that these proxies capture local institutional history as well as individual attributes. Fourth, the inclusion of these variables as GMM clustering features creates a potential circularity: pathway separation on membership is partly definitional rather than purely empirical. We address this through sensitivity analyses that exclude membership from the feature space and through out-of-feature outcome validation (
Section 5 and
Section 6).
2.3. Payment Mechanism Design and Institutional Innovation
The literature on payment mechanism design has evolved from early assumptions that cash transfers represent the optimal delivery channel. While cash offers flexibility and respects participant autonomy, it requires financial infrastructure that may be unavailable in remote rural areas [
21]. Alternative mechanisms, including in-kind transfers, training programs, and community investments, may be more appropriate when markets function poorly or financial infrastructure is lacking [
22,
23].
Carbon programs have experimented with diverse payment mechanisms beyond direct cash transfers. TIST and similar programs offer participants choices among cash payments, agricultural inputs, training and extension services, and collective benefits such as community infrastructure. This payment flexibility serves multiple functions: it accommodates heterogeneous preferences, circumvents financial infrastructure constraints, and enables collective investments that individual payments could not achieve.
We conceptualize payment flexibility as institutional innovation that expands the set of farmers who can meaningfully participate. For farmers lacking bank accounts or mobile money access, cash payments are effectively inaccessible. Alternative mechanisms, particularly training, seedlings, and community infrastructure, can reach these farmers by delivering value without requiring financial intermediation. Collective benefit arrangements may also create accountability structures: when a community invests carbon revenues in a school or water point, the visible collective stake reinforces participation [
10].
2.4. Market Lifecycle, Gender, and Outcome Quality
Markets evolve through lifecycle stages that shape participant characteristics [
19]. Early adopters typically have more resources and better information access [
24]. As markets mature, participation may expand through mechanisms unavailable in earlier stages. If organizational infrastructure and payment flexibility lower entry barriers, we would expect newer participants to be overrepresented in pathways characterized by these mechanisms.
Women face distinctive barriers to carbon market participation that intersect with resource constraints [
25]: gender norms may limit mobility; women often have weaker land tenure rights [
26]; financial services are frequently less accessible to women. Organizational pathways may be particularly important for women’s participation. Women’s groups and mixed-gender farmer organizations can provide spaces where women access information and exercise voice [
27]. Alternative payment mechanisms that do not require formal financial infrastructure may circumvent gender gaps in financial access.
A final question concerns whether different pathways produce equivalent outcomes. Critics of inclusive approaches sometimes argue that targeting lower-resource farmers sacrifices environmental effectiveness. However, organizational mechanisms may provide monitoring, knowledge sharing, and accountability that individual resources cannot replicate. Peer monitoring within groups can increase effort [
28], and knowledge sharing accelerates learning about effective practices [
17].
2.5. Theoretical Contributions and Positioning
Our study aims to contribute to the literature in four ways. First, we advance collective action theory by demonstrating how organizational capital substitutes financial capital in market access contexts, extending Ostrom’s common-pool resource framework to market participation. Second, we contribute to the payment mechanism design literature by showing that payment flexibility functions as institutional innovation, enabling access, and not merely as accommodation for existing participants. Third, methodologically, we apply a pathway-based approach using model-based clustering that reveals heterogeneity masked by conventional regression analysis focused on average treatment effects. Fourth, we challenge the targeting paradigm in carbon program design by showing that investing in organizational infrastructure may yield higher returns than sophisticated individual screening when the binding constraint is institutional rather than individual.
4. Research Context and Data
This section describes our empirical setting, data sources, and sample characteristics. We begin with an overview of the TIST program in Kenya, emphasizing features that make it an appropriate context for studying participation pathways. We then describe our data sources, variable construction, and descriptive statistics.
4.1. The TIST Program in Kenya
The TIST represents one of the largest and longest-running agricultural carbon programs globally. Established in Kenya in 2004, TIST organizes smallholder farmers into small groups (typically 6–12 members) who plant and maintain trees on their individual plots. Groups elect leaders, receive training in sustainable agriculture and tree management, and collectively monitor member compliance. Carbon sequestration is verified through annual audits by internationally certified auditors who measure tree circumference and survival rates, with credits sold through voluntary carbon markets under standards such as Verra’s Verified Carbon Standard [
29].
Kenya’s TIST program exhibits several features that make it particularly appropriate for studying participation pathways. First, with nearly two decades of operation and over 100,000 participating farmers, the program has achieved institutional maturity, enabling stable organizational structures and well-developed payment mechanisms. Second, the 90.4% enrollment rate among surveyed farmers indicates near-saturation, providing sufficient variation to distinguish pathways while ensuring that non-participation reflects genuine barriers rather than program unavailability. Third, Kenya’s mobile money infrastructure (M-PESA) enables electronic payments to most farmers, creating observable variation between those who can and cannot access financial services. Fourth, the program permits flexible payment arrangements, with farmer groups able to negotiate alternatives to cash, including training, seedlings, and community infrastructure investments.
Payment mechanisms in TIST Kenya have evolved substantially since program inception. Initially, carbon revenues flowed primarily through bank transfers, limiting participation to farmers with formal accounts. The introduction of M-PESA mobile money in 2007 dramatically expanded payment accessibility, enabling cash transfers to farmers with only basic mobile phones. Beginning around 2008, the program began permitting alternative arrangements whereby farmer groups could direct a portion of their collective earnings toward community benefits rather than individual cash payments. These alternatives include agricultural inputs (improved seeds, seedlings, tools), training programs (agricultural techniques, financial literacy, health education), and community infrastructure (school buildings, water points, health facilities). Groups negotiate these arrangements through documented collective decision-making processes, with program staff facilitating implementation and verifying delivery.
This institutional evolution created the within-program variation that enables our analysis. Farmers face a common program structure, identical eligibility criteria, monitoring procedures, and verification standards, but access benefits through different mechanisms depending on their individual characteristics, organizational positions, and geographic locations. This variation allows us to examine how different pathways to participation emerge within a unified operational framework, holding constant program-level factors that would confound cross-program comparisons.
This study complements our analysis of payment complementarity across TIST operations in Kenya, Tanzania, Uganda, and India [
7]. While that work tested whether combining cash and community benefits produces super-additive effects on land-use intensity among enrolled farmers (
), the present study addresses a distinct question using a different population: how do resource-poor farmers achieve market access in the first place? We focus exclusively on Kenya (
surveyed farmers, including both enrolled and non-enrolled) to identify the organizational mechanisms that enable participation, rather than the payment mechanisms that enhance outcomes conditional on participation.
4.2. Data Sources
Our analysis draws on the Sustainable Development Goals Impact (SDGI) Survey, a comprehensive assessment of TIST program outcomes conducted between January 2022 and September 2023. The survey was designed to evaluate program contributions across multiple SDG dimensions, generating detailed information on farmer demographics, economic status, agricultural practices, program participation, and environmental outcomes. Professional translation into Swahili with back-translation verification ensured linguistic accessibility, while trained local enumerators conducted face-to-face interviews averaging 45 min per household.
The survey targeted all TIST participants in Kenya, with sampling stratified by administrative district to ensure geographic representativeness. Within each district, enumerators attempted complete coverage of registered participants, supplemented by a random sampling of non-participant households to provide contextual comparison. The final dataset includes 8894 Kenyan farmers with complete information on all variables used in our analysis, representing 98.7% of surveyed participants after excluding observations with missing values on key variables.
The target population comprises all smallholder farmers enrolled in or eligible for the TIST program across Kenya’s surveyed districts during the 2022–2023 data collection window. The sampling frame was the TIST program administrative registry, which lists all registered participants by district and small group. Non-participant comparison households were identified through village-level rosters maintained by local program coordinators. The sampling procedure used stratified enumeration: all registered participants in each stratum were approached (complete enumeration), with non-participants drawn via systematic random sampling within each district. The achieved sample size of
substantially exceeds conventional adequacy benchmarks. Using Cochran’s (1977) [
30] formula for estimating proportions at 95% confidence and a margin of error of ±1 percentage point (with
as the conservative worst-case), the required minimum sample is
. Our achieved
is equivalent at the ±1.04 pp margin, well within acceptable tolerance. For multivariate analysis, Bartlett et al. (2001) [
31] recommend a minimum of 5–10 observations per variable; our regression models with up to 12 predictors require
, a threshold our sample exceeds by a factor of more than 74. We therefore conclude that the sample size is more than adequate for the inferential analyses conducted.
Geographic coverage spans 52 districts across Kenya’s major agricultural regions, with the largest concentrations in Meru County (approximately 44% of observations) and the Central Highlands. This geographic distribution reflects both historical program development as TIST expanded outward from initial pilot sites and variation in agroecological suitability for tree planting. We address potential geographic confounding through district-level controls and robustness checks with district fixed effects.
4.3. Variable Construction
We organize variables by their role in the empirical design: (i) outcome variables that measure program success, (ii) pathway-identification covariates used to construct farmer pathways via clustering (and therefore excluded from the outcome space), (iii) mechanism variables that capture program channels through which pathways may translate into outcomes, and (iv) control variables that account for observable demographic and geographic heterogeneity in the regression analyses (see
Table 2).
4.3.1. Outcome Variables
We examine three outcome variables, capturing different dimensions of program success. Carbon enrollment is a binary indicator equal to one if the farmer is currently registered in the carbon program and has trees under monitoring, representing the primary participation outcome. Among our sample, 90.4% of farmers are enrolled. Tree count measures the number of trees currently maintained by each farmer as recorded in program monitoring data, capturing the intensive margin of environmental contribution. The distribution is highly right-skewed (mean = 305, median = 130, SD = 739), reflecting substantial heterogeneity in farmer engagement. Conservation farming is a binary indicator equal to one if the farmer practices at least three of the following: minimum tillage, crop rotation, cover cropping, composting, mulching, or agroforestry integration. This composite measure captures the broader adoption of sustainable practices beyond tree planting, with 35.8% of farmers meeting the threshold.
4.3.2. Pathway Identification Variables
We identify participation pathways using eight socioeconomic variables that capture farmer resource endowments and institutional connections without directly measuring program outcomes:
Log income: Natural logarithm of daily household income in USD, calculated as to accommodate zero values. Mean daily income is $2.53 (median = $1.68).
Log farm size: Natural logarithm of total farm area in hectares, with values capped at the 95th percentile (15 hectares). Mean farm size is 2.75 hectares (median = 2.00).
Bank/mobile access: Binary indicator equal to one if the farmer has either a formal bank account or registered mobile money account. Overall, 63.1% of farmers have such access.
Crop diversity: Count of distinct crop types cultivated, ranging from 0 to 12. Mean = 3.2 crops.
Livestock types: Count of distinct livestock categories owned (cattle, goats, sheep, poultry, etc.), ranging from 0 to 8. Mean = 2.1 types.
Education level: Ordinal scale from 0 (no formal education) to 4 (secondary or above). Mean = 2.67.
Organization membership: Binary indicator equal to one if the farmer belongs to any formal organization, including agricultural cooperatives, savings groups, women’s groups, or community associations. In total, 92.5% of farmers are organization members.
Leadership position: Binary indicator equal to one if the farmer holds a leadership role (chairperson, secretary, treasurer, or committee member) in any organization. Across roles, 25.2% hold leadership positions.
Critically, we exclude outcome variables, carbon enrollment, tree counts, and payment receipt from the clustering feature space. This separation ensures that pathway identification reflects ex-ante farmer characteristics rather than program outcomes, avoiding circular reasoning that would conflate pathway membership with the outcomes we seek to explain.
4.3.3. Mechanism Variables
Beyond the clustering variables, we examine two key mechanism variables. Alternative payment receipt is a binary indicator equal to one if the farmer has received program benefits in forms other than cash, including training, seedlings, or community infrastructure contributions; 5.7% of farmers (n = 509) report receiving alternative payments. Years in program measures tenure as a continuous variable based on enrollment date, capturing experience and potential learning effects; mean tenure is 0.52 years (median = 0), reflecting recent program expansion.
4.3.4. Control Variables
Regression analyses include controls for farmer demographics (age, gender), household composition, and geographic location (district indicators). Gender is particularly important given evidence of differential participation patterns: 36.4% of our sample is female. Secure land tenure, measured as a binary indicator for documented ownership or long-term lease, characterizes 97.4% of farmers, reflecting Kenya’s relatively strong property rights environment compared to other TIST countries.
4.4. Construct Operationalization
To ensure replicability and interpretive clarity, we provide explicit operationalizations for the three key constructs central to our theoretical framework.
Organizational Capital is operationalized through two binary indicators drawn from program administrative records: (1)
Organization membership (1 if the farmer belongs to any registered agricultural cooperative, savings group, women’s group, or community association; 0 otherwise); and (2)
Leadership position (1 if the farmer holds a formal leadership role—chairperson, secretary, treasurer, or committee member—in any such organization; 0 otherwise). These indicators enter both the GMM feature space (for pathway identification) and as covariates in the regression analyses. Their limitations as proxies are discussed in
Section 2.
Alternative Payments are operationalized as a binary indicator equal to 1 if the farmer received program compensation in any form other than direct cash transfer during the study period, including agricultural training, seedlings/inputs, or contributions to community infrastructure (school buildings, water points, health facilities). This variable is a
mechanism variable, excluded from the clustering feature space but included in downstream regression analyses. Its observed correlation with income and bank access (discussed in
Section 6.2) motivates the sensitivity analyses in
Section 6.9.
Carbon Enrollment is operationalized as a binary indicator equal to 1 if the farmer is currently registered in the TIST carbon program and has trees under active monitoring. This is the primary outcome variable and is excluded from the GMM clustering feature space to avoid circular reasoning between pathway identification and outcomes. The 90.4% enrollment rate among our sample reflects the near-saturation of the mature TIST program and provides within-group variation sufficient for the cross-pathway comparisons in
Section 6.
4.5. Descriptive Statistics
Table 3 further disaggregates key statistics by payment mechanism status, revealing several notable patterns. Several patterns merit attention. First, alternative payment recipients have substantially higher tree counts (605 vs. 286,
) and conservation farming rates (61.9% vs. 34.3%,
) than cash-only recipients. Second, alternative payment recipients are more likely to hold leadership positions (44.8% vs. 24.0%,
), consistent with H1b’s leadership bridge prediction. Third, alternative payment recipients have
higher average incomes (
$3.56 vs.
$2.47) and are
more likely to have bank/mobile access (72.5% vs. 62.5%), suggesting that alternative payments do not simply compensate for financial exclusion but may reflect strategic choices by relatively advantaged farmers. This pattern complicates simple interpretations of H2a; we explore this further in
Section 6.
6. Results
This section presents our empirical findings organized around the theoretical framework developed in
Section 2. We begin by characterizing the three participation pathways identified through GMM clustering (
Section 6.1). We then document the participation paradox, the counterintuitive finding that lower-income farmers achieve higher adoption rates (
Section 6.2). Subsequent sections test our six hypotheses: organizational membership as a necessary condition (
Section 6.3), leadership as a bridge to alternative payments (
Section 6.4), payment flexibility enabling participation (
Section 6.5), geographic clustering through diffusion (
Section 6.6), organizational pathways as an entry mechanism (
Section 6.7), and inclusion–effectiveness complementarity (
Section 6.8). We conclude with robustness assessments (
Section 6.9).
6.1. Three Pathways to Carbon Market Participation
GMM clustering reveals three distinct pathways through which Kenyan farmers participate in agricultural carbon markets.
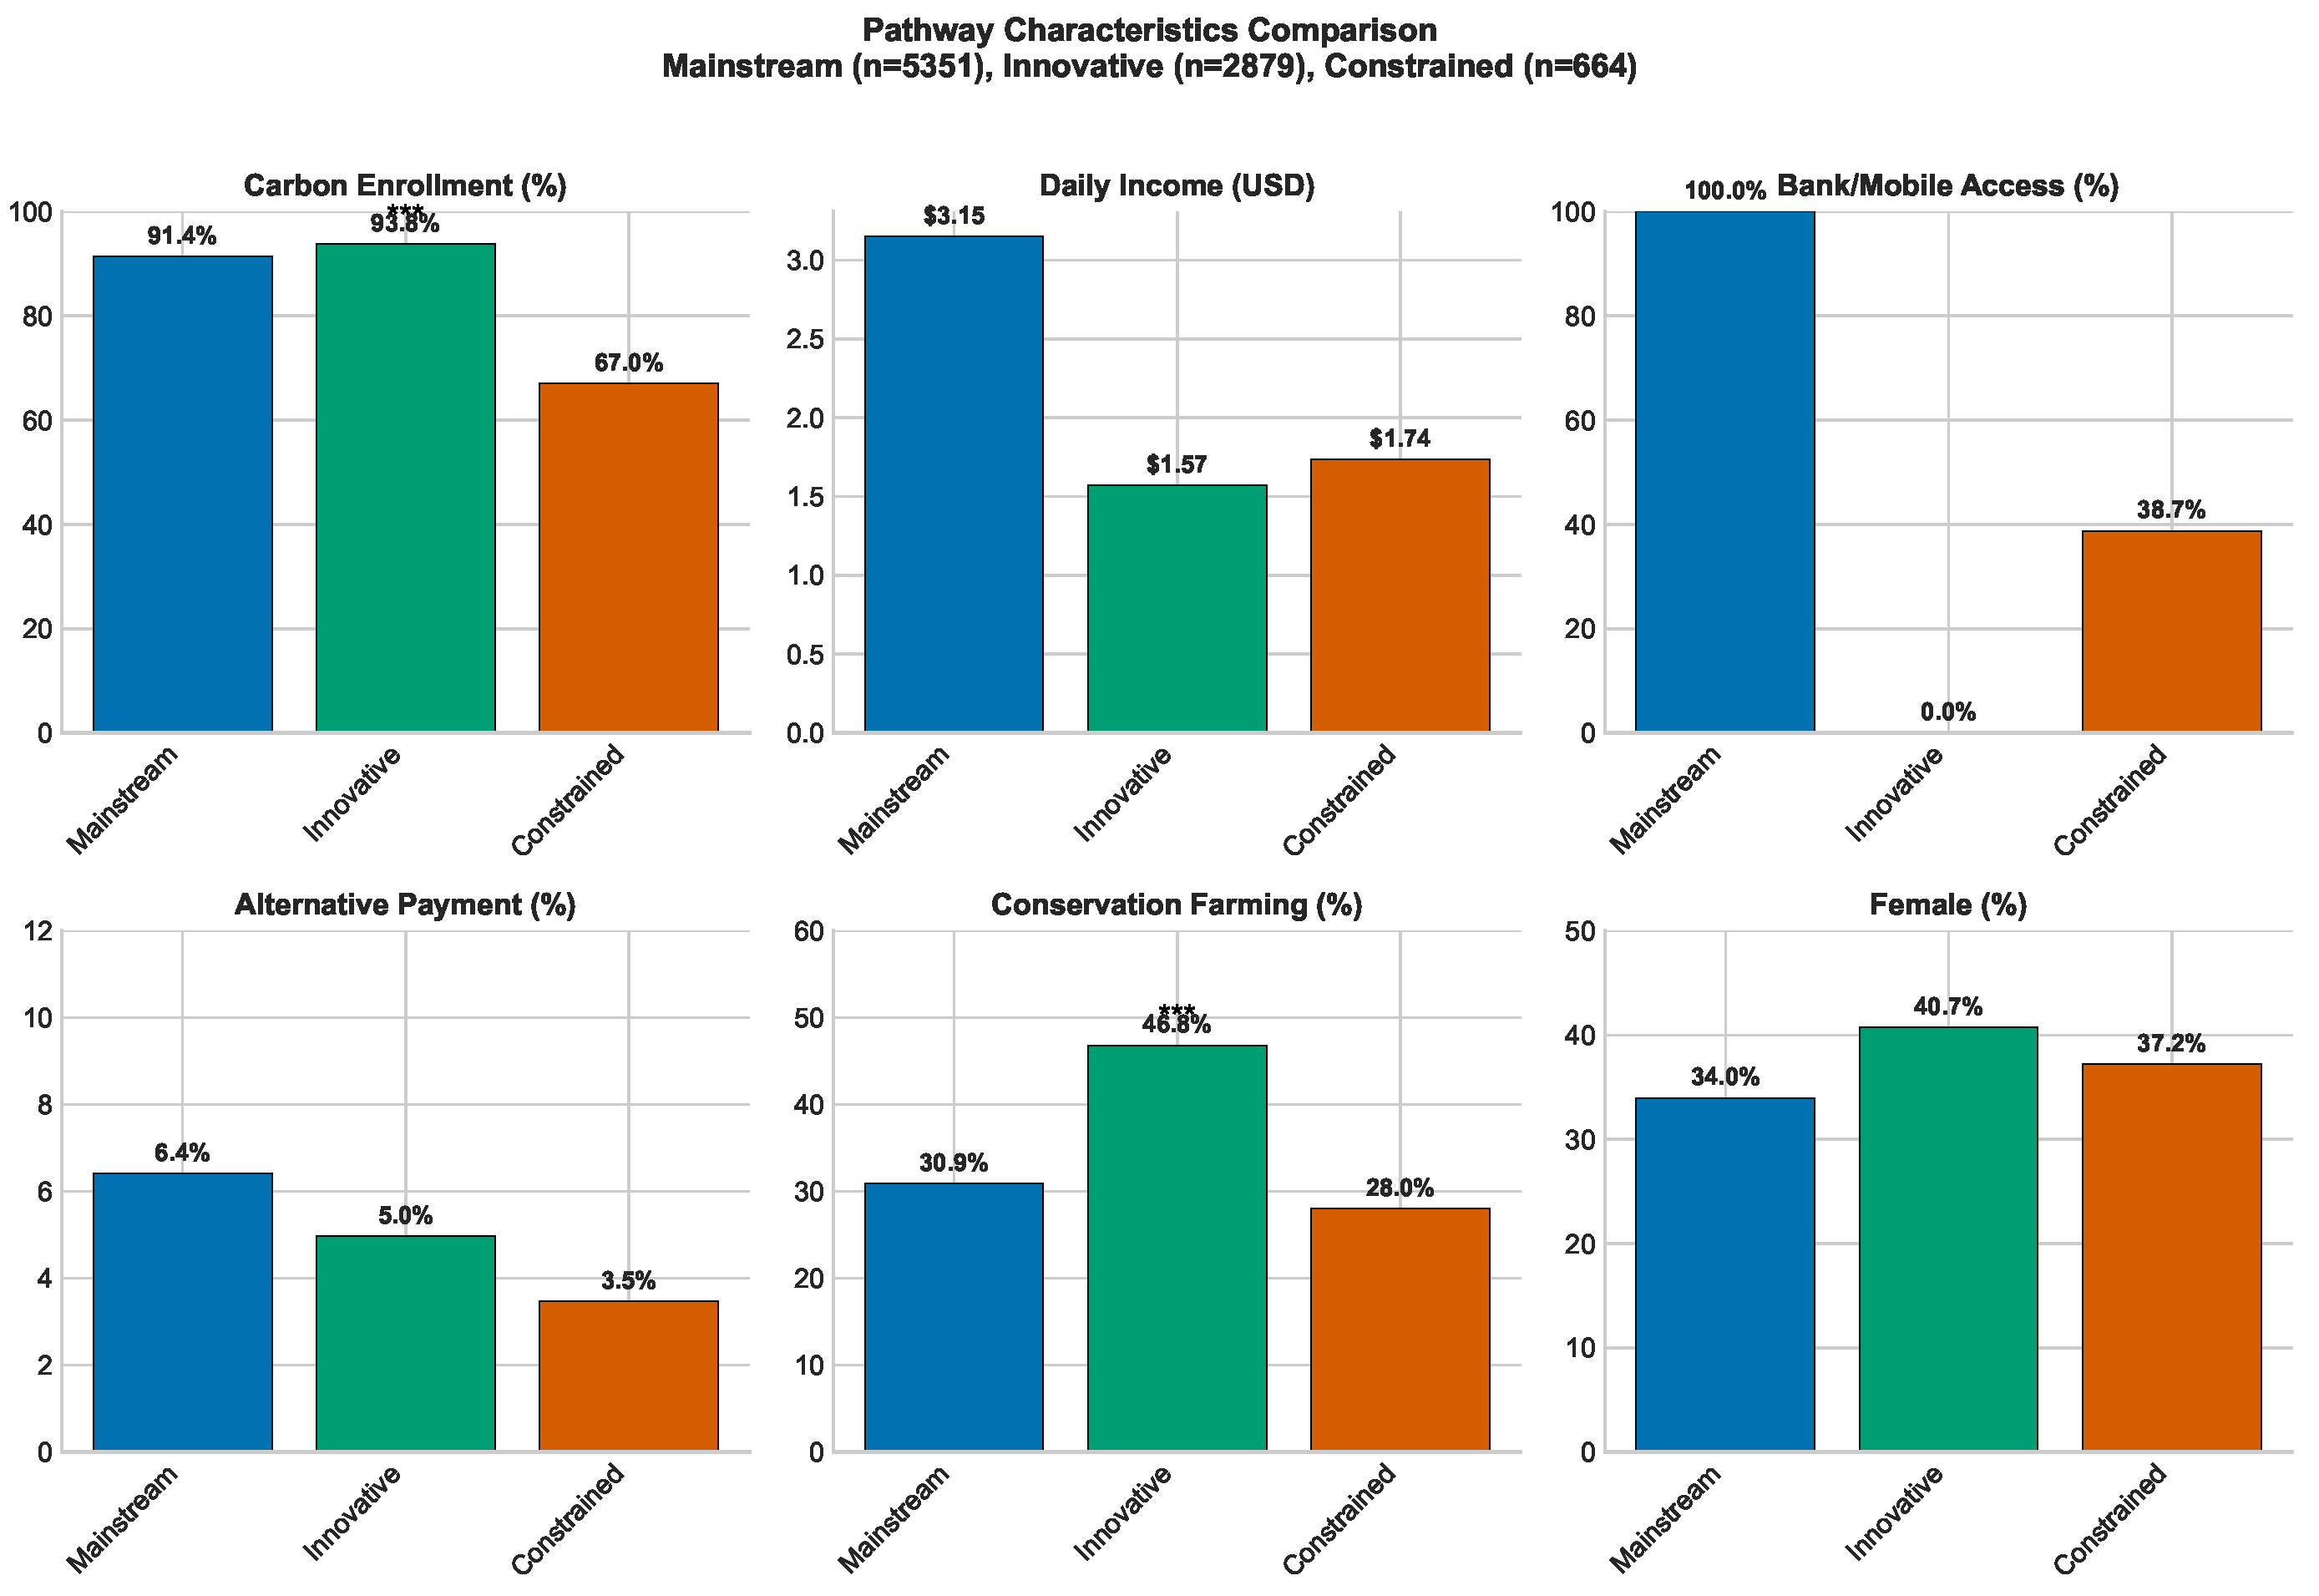
Table 5 presents comprehensive profiles of each pathway, while
Figure 2 visualizes key distinguishing characteristics.
The Mainstream pathway encompasses 60.2% of farmers () and represents conventional resource-based participation. These farmers have the highest average daily income ($3.15), universal bank or mobile money access (100%), and universal organizational membership (100%). Their adoption rate of 91.4% confirms that conventional resources, financial capital, financial infrastructure access, and organizational connections are associated with strong program participation. This pathway aligns with predictions from resource-based frameworks: farmers with adequate resources participate at high rates through standard market channels.
The Innovative pathway presents the central empirical puzzle. Comprising 32.4% of farmers (), this pathway combines the lowest average income ($1.57/day) with the highest adoption rate (93.8%), a 2.4 percentage point advantage over the better-resourced Mainstream pathway. Critically, no Innovative pathway farmers have bank or mobile money access, yet all maintain organizational membership. This pathway achieves the highest conservation farming rate (46.8%) and the highest female representation (40.7%). The combination of resource disadvantage with participation and outcome advantages constitutes the participation paradox we seek to explain.
The Constrained pathway includes 7.5% of farmers () who face genuine barriers to participation. With moderate income ($1.74/day), partial financial access (38.7%), and—crucially—zero organizational membership, these farmers achieve only 67.0% adoption. The Constrained pathway demonstrates that resource limitations alone do not explain low participation: Innovative pathway farmers have lower incomes and no financial access, yet achieve 26.8 percentage points higher adoption. The distinguishing factor is organizational membership, which is universal in high-adoption pathways and absent in the Constrained pathway.
6.2. The Participation Paradox
The pathway structure reveals a broader pattern that contradicts conventional expectations: across the full sample, lower-income farmers achieve
higher carbon market adoption.
Table 6 presents adoption rates by income quartile, demonstrating that farmers in the lowest income quartile (Q1) achieve 92.4% adoption compared to 86.3% in the highest quartile (Q4), a 6.1 percentage point difference in the “wrong” direction according to resource-based predictions.
This paradox is not a statistical artifact. The pattern persists when we employ alternative cluster specifications (see
Section 6.9), control for geographic factors, and examine different income measures.
Figure 3 visualizes the paradox, showing carbon adoption rates by income quartile.
The three-pathway model explains the paradox. Rather than a single relationship between resources and participation, two distinct mechanisms operate simultaneously:
Resource-based mechanism (Mainstream pathway): Higher-income farmers with financial access participate through conventional channels, achieving 91.4% adoption.
Organizational mechanism (Innovative pathway): Lower-income farmers without financial access participate through organizational channels that substitute financial resources, achieving even higher adoption (93.8%).
Exclusion mechanism (Constrained pathway): Farmers lacking both financial resources and organizational connections achieve only 67.0% adoption.
The aggregate inverse relationship between income and adoption emerges because the organizational mechanism is associated with high participation among low-income farmers, while the Constrained pathway (with genuine barriers) represents only 7.5% of the sample. Organizational capital, not financial capital, appears to be the binding constraint for carbon market participation in this mature market.
6.3. Organizational Membership as a Necessary Condition (H1a)
Hypothesis 1a predicted that organizational membership is a necessary condition for high-adoption pathways, regardless of financial resources. The evidence is consistent with this prediction, with important methodological caveats. As shown in Panel B of
Table 5, 100% of farmers in both high-adoption pathways (Mainstream and Innovative) are organizational members, while 0% of Constrained pathway farmers are members. This near-perfect separation is consistent with H1a’s prediction. However, readers should note that organizational membership was included as a GMM clustering feature; consequently, the separation of pathways on this variable is partly definitional rather than purely empirical. The finding should therefore be interpreted as “organizational membership is strongly associated with pathway assignment” rather than as an independent causal test of necessity.
To address this circularity, we conducted the sensitivity analysis described in
Section 5: excluding membership from the feature space and re-estimating the GMM. Even in this reduced specification, the cluster with the lowest income exhibits the highest adoption rate, consistent with the participation paradox, and membership rates differ substantially across emerging clusters. This provides evidence that the pathway structure is not purely an artifact of including membership in the clustering. The substantive interpretation is consistent with H1a: organizational membership is strongly associated with high-adoption pathways, regardless of financial resources. This finding is consistent with organizational capital serving as an important correlate of carbon market participation.
Policy Implication (H1a): These findings suggest that programs seeking to achieve near-universal participation should prioritize organizational access over individual resource targeting. Rather than screening farmers by income or asset levels, programs could assess organizational density and connectivity as eligibility criteria. Investing in farmer group formation and strengthening existing organizations in underserved areas may yield participation gains that financial subsidies alone cannot achieve.
6.4. Leadership as a Bridge to Alternative Payments (H1b)
Hypothesis 1b predicted that leadership positions enhance access to alternative payment mechanisms beyond the baseline effect of organizational membership.
Table 7 presents logistic regression results predicting alternative payment receipt.
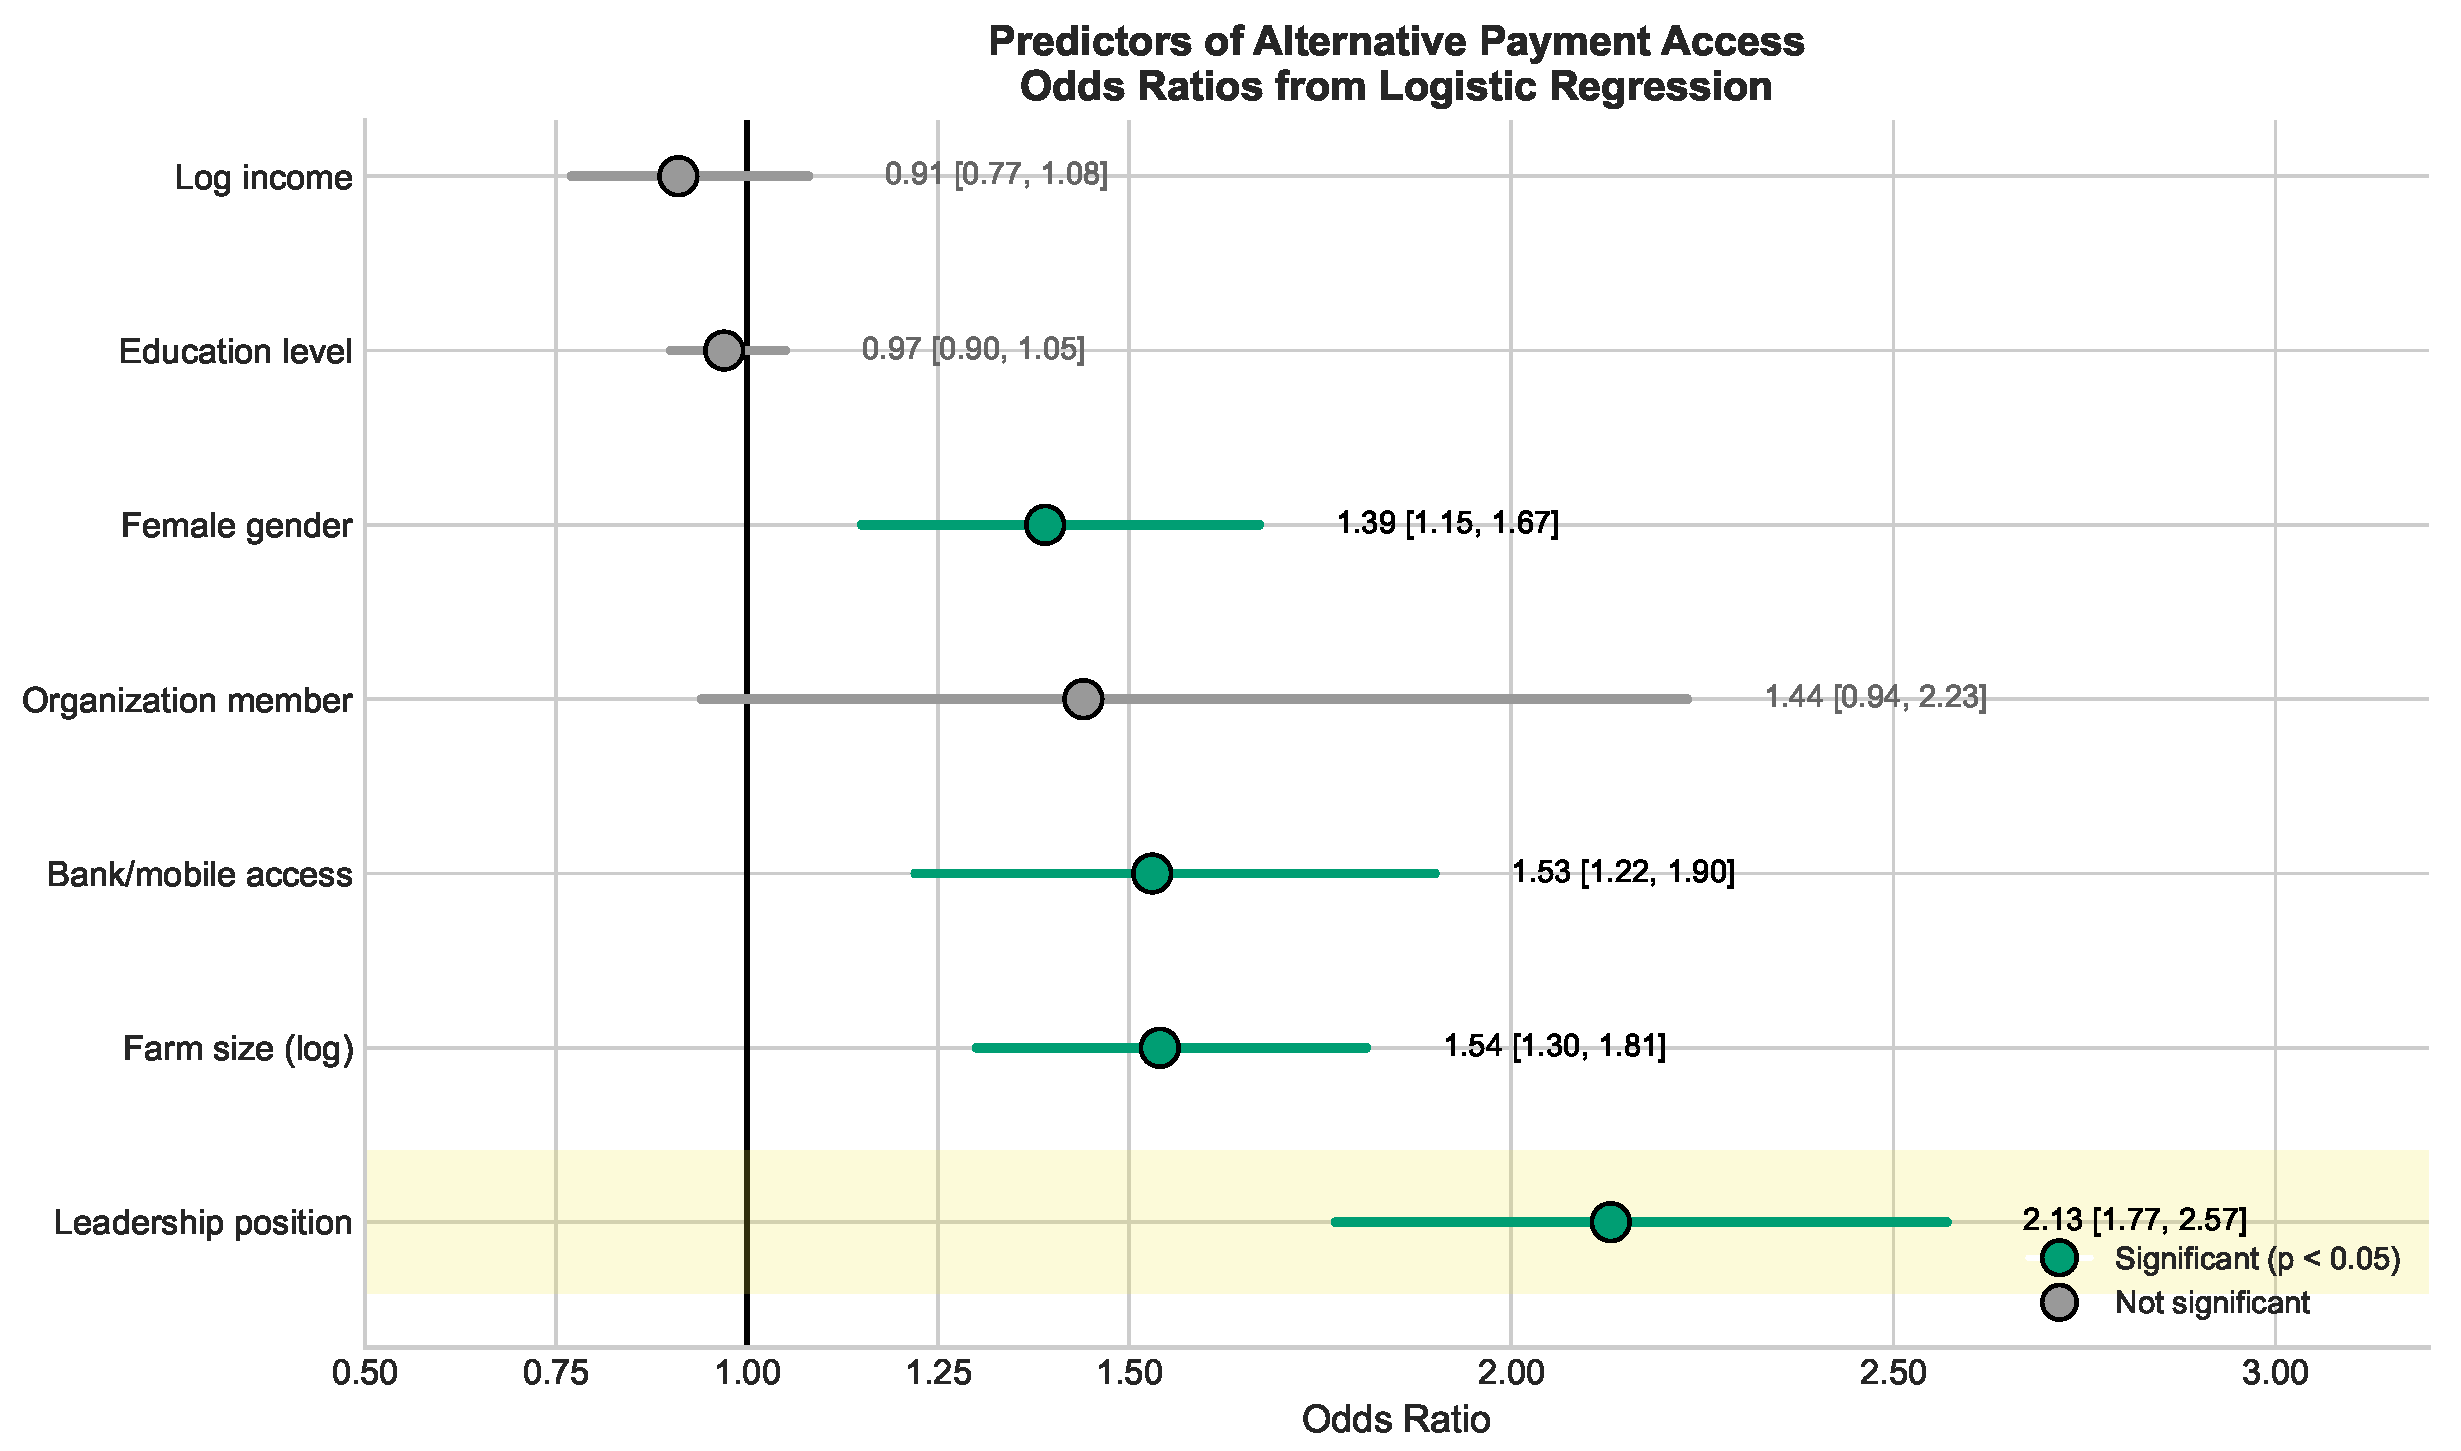
Leadership position emerges as the strongest predictor of alternative payment access (OR = 2.13, 95% CI: 1.77–2.57, ). Leaders are more than twice as likely to access alternative payments as non-leaders, controlling for organizational membership, income, education, farm size, gender, and program tenure. Notably, income has no significant effect on alternative payment access (OR = 0.91, ), indicating that these mechanisms do not simply serve higher-income farmers. These findings support H1b: leadership positions function as bridges to alternative payment mechanisms, independent of organizational membership.
Figure 4 presents a forest plot visualizing these coefficient estimates, highlighting leadership’s dominant role as a bridge to alternative payment mechanisms.
These findings support the theoretical framework linking organizational capital to participation through two channels. First, organizational membership provides the foundational infrastructure—information flows, peer support, and collective monitoring—that is associated with any participation pathway. Second, leadership positions provide privileged access to alternative payment mechanisms, connecting group members to non-cash benefits that circumvent financial infrastructure constraints. Leaders serve as “bridges”, linking resource-poor farmers to program benefits that would otherwise remain inaccessible.
Policy Implication (H1b): Leadership development deserves explicit investment as a programmatic strategy. Training group leaders in negotiation, benefit package design, and program requirements, and providing them with dedicated information resources, creates more effective bridges to alternative payment arrangements.
6.5. Payment Flexibility Enables Participation (H2a)
Hypothesis 2a predicted that alternative payment arrangements enable participation among farmers lacking formal financial infrastructure. The evidence reveals a striking pattern: alternative payment receipt is associated with complete carbon enrollment. Among 509 farmers receiving alternative payments, 100% are enrolled in the carbon program, a perfect separation that makes standard regression estimation impossible but provides powerful substantive evidence.
Table 8 presents the 2 × 2 cross-tabulation revealing this pattern.
Penalized logistic regression (Firth’s method) yields an odds ratio of 17.55 for alternative payment receipt, though this estimate should be interpreted cautiously given near-separation. The substantive conclusion is clear: alternative payments are strongly associated with enrollment. Moreover, examining the Innovative pathway (
Table 5, Panel A), we observe that these farmers have zero bank/mobile access yet achieve 93.8% enrollment, 7.2% through alternative payments. This demonstrates that payment flexibility enables participation without requiring formal financial infrastructure, supporting H2a.
6.5.1. The “Affluent Alternative-Pay” Tension
Before examining complementarity, we address an important descriptive tension in the data (flagged in
Table 3): alternative payment recipients have
higher average incomes (
$3.56 vs.
$2.47) and are
more likely to have bank/mobile access (72.5% vs. 62.5%) than cash-only recipients. This contradicts the intuition that alternative payments compensate for financial exclusion. To investigate, we estimate an interaction model predicting alternative payment receipt:
The interaction coefficient
tests whether leadership’s role as bridge to alternative payments differs by financial access status. Results show
(95% CI:
,
): the leadership bridge is somewhat stronger among financially excluded farmers than among those with bank access, consistent with alternative payments serving a compensatory function for the financially excluded when organizational leverage is available. Among farmers
without bank access, leaders are 2.71 times more likely to receive alternative payments (OR = 2.71, 95% CI: [2.01, 3.65]); among those
with bank access, the OR is 1.74 (95% CI: [1.39, 2.18]). The overall positive association between alternative payments and income thus reflects the selection of wealthier farmers into leadership roles rather than alternative payments primarily serving wealthy farmers. When we stratify by bank access and leadership, the compensatory pattern for the financially excluded emerges clearly.
6.5.2. Complementarity Between Mechanisms
The ceiling effect created by complete enrollment among alternative payment recipients complicates direct testing, but the pattern of adoption rates across the 2 × 2 matrix reveals the following relationship:
Non-members without alternative payment: 65.8% adoption.
Non-members with alternative payment: 100.0% adoption (+34.2 pp).
Members without alternative payment: 91.8% adoption (+25.9 pp effect of membership).
Members with alternative payment: 100.0% adoption (+8.2 pp).
The larger association of alternative payments among non-members (+34.2 pp) than members (+8.2 pp) reflects the ceiling effect: members already have high adoption (91.8%), leaving limited room for additional improvement. The key finding is that organizational membership is associated with a 25.9 percentage point adoption advantage in the absence of alternative payments, while alternative payments are associated with complete enrollment regardless of membership status. The mechanisms thus operate through distinct channels: organizational membership raises the floor, while payment flexibility is associated with ceiling achievement.
6.6. Geographic Clustering Through Diffusion (H2b)
Hypothesis 2b predicted that alternative payment arrangements cluster geographically, reflecting diffusion through organizational networks. Chi-square testing reveals a highly significant non-uniform distribution of alternative payments across districts (
,
).
Table 9 presents the top districts by alternative payment rate, revealing a striking concentration. Laikipia West emerges as the dominant innovation hotspot, with 75.8% of farmers receiving alternative payments compared to 5.7% nationally, a 13-fold difference. The top 10 districts account for 44.0% of all alternative payment recipients despite representing a much smaller share of total farmers.
Laikipia West exhibits distinctive characteristics that illuminate why payment innovation concentrates there. Compared to national averages, Laikipia West has significantly higher leadership density (36.4% vs. 25.2%, ) and dramatically higher conservation farming rates (83.3% vs. 35.8%, ). The Innovative pathway is overrepresented (54.5% vs. 32.4% nationally), suggesting that strong organizational infrastructure is associated with both payment innovation and the participation pathway it supports. These patterns support H2b: alternative payment arrangements cluster geographically, consistent with diffusion through organizational networks.
Policy Implication (H2a and H2b): Carbon programs should design payment flexibility into program structures from inception rather than adding it as accommodation for excluded participants. Permitting farmer groups to negotiate alternative benefit packages, with appropriate fiduciary oversight, may both expand participation and leverage social learning dynamics. The geographic clustering of alternative payment innovation suggests a strategic seeding approach: programs could invest in payment flexibility infrastructure in organizationally ready districts and rely on demonstrated diffusion through networks to expand take-up.
6.7. Organizational Pathways as Entry Mechanism (H3)
Hypothesis 3 predicted that organizational pathways function as entry mechanisms for new participants rather than destinations for experienced farmers, and that these pathways are more accessible to women.
6.7.1. Tenure Patterns
An analysis of program tenure strongly supports the entry mechanism interpretation.
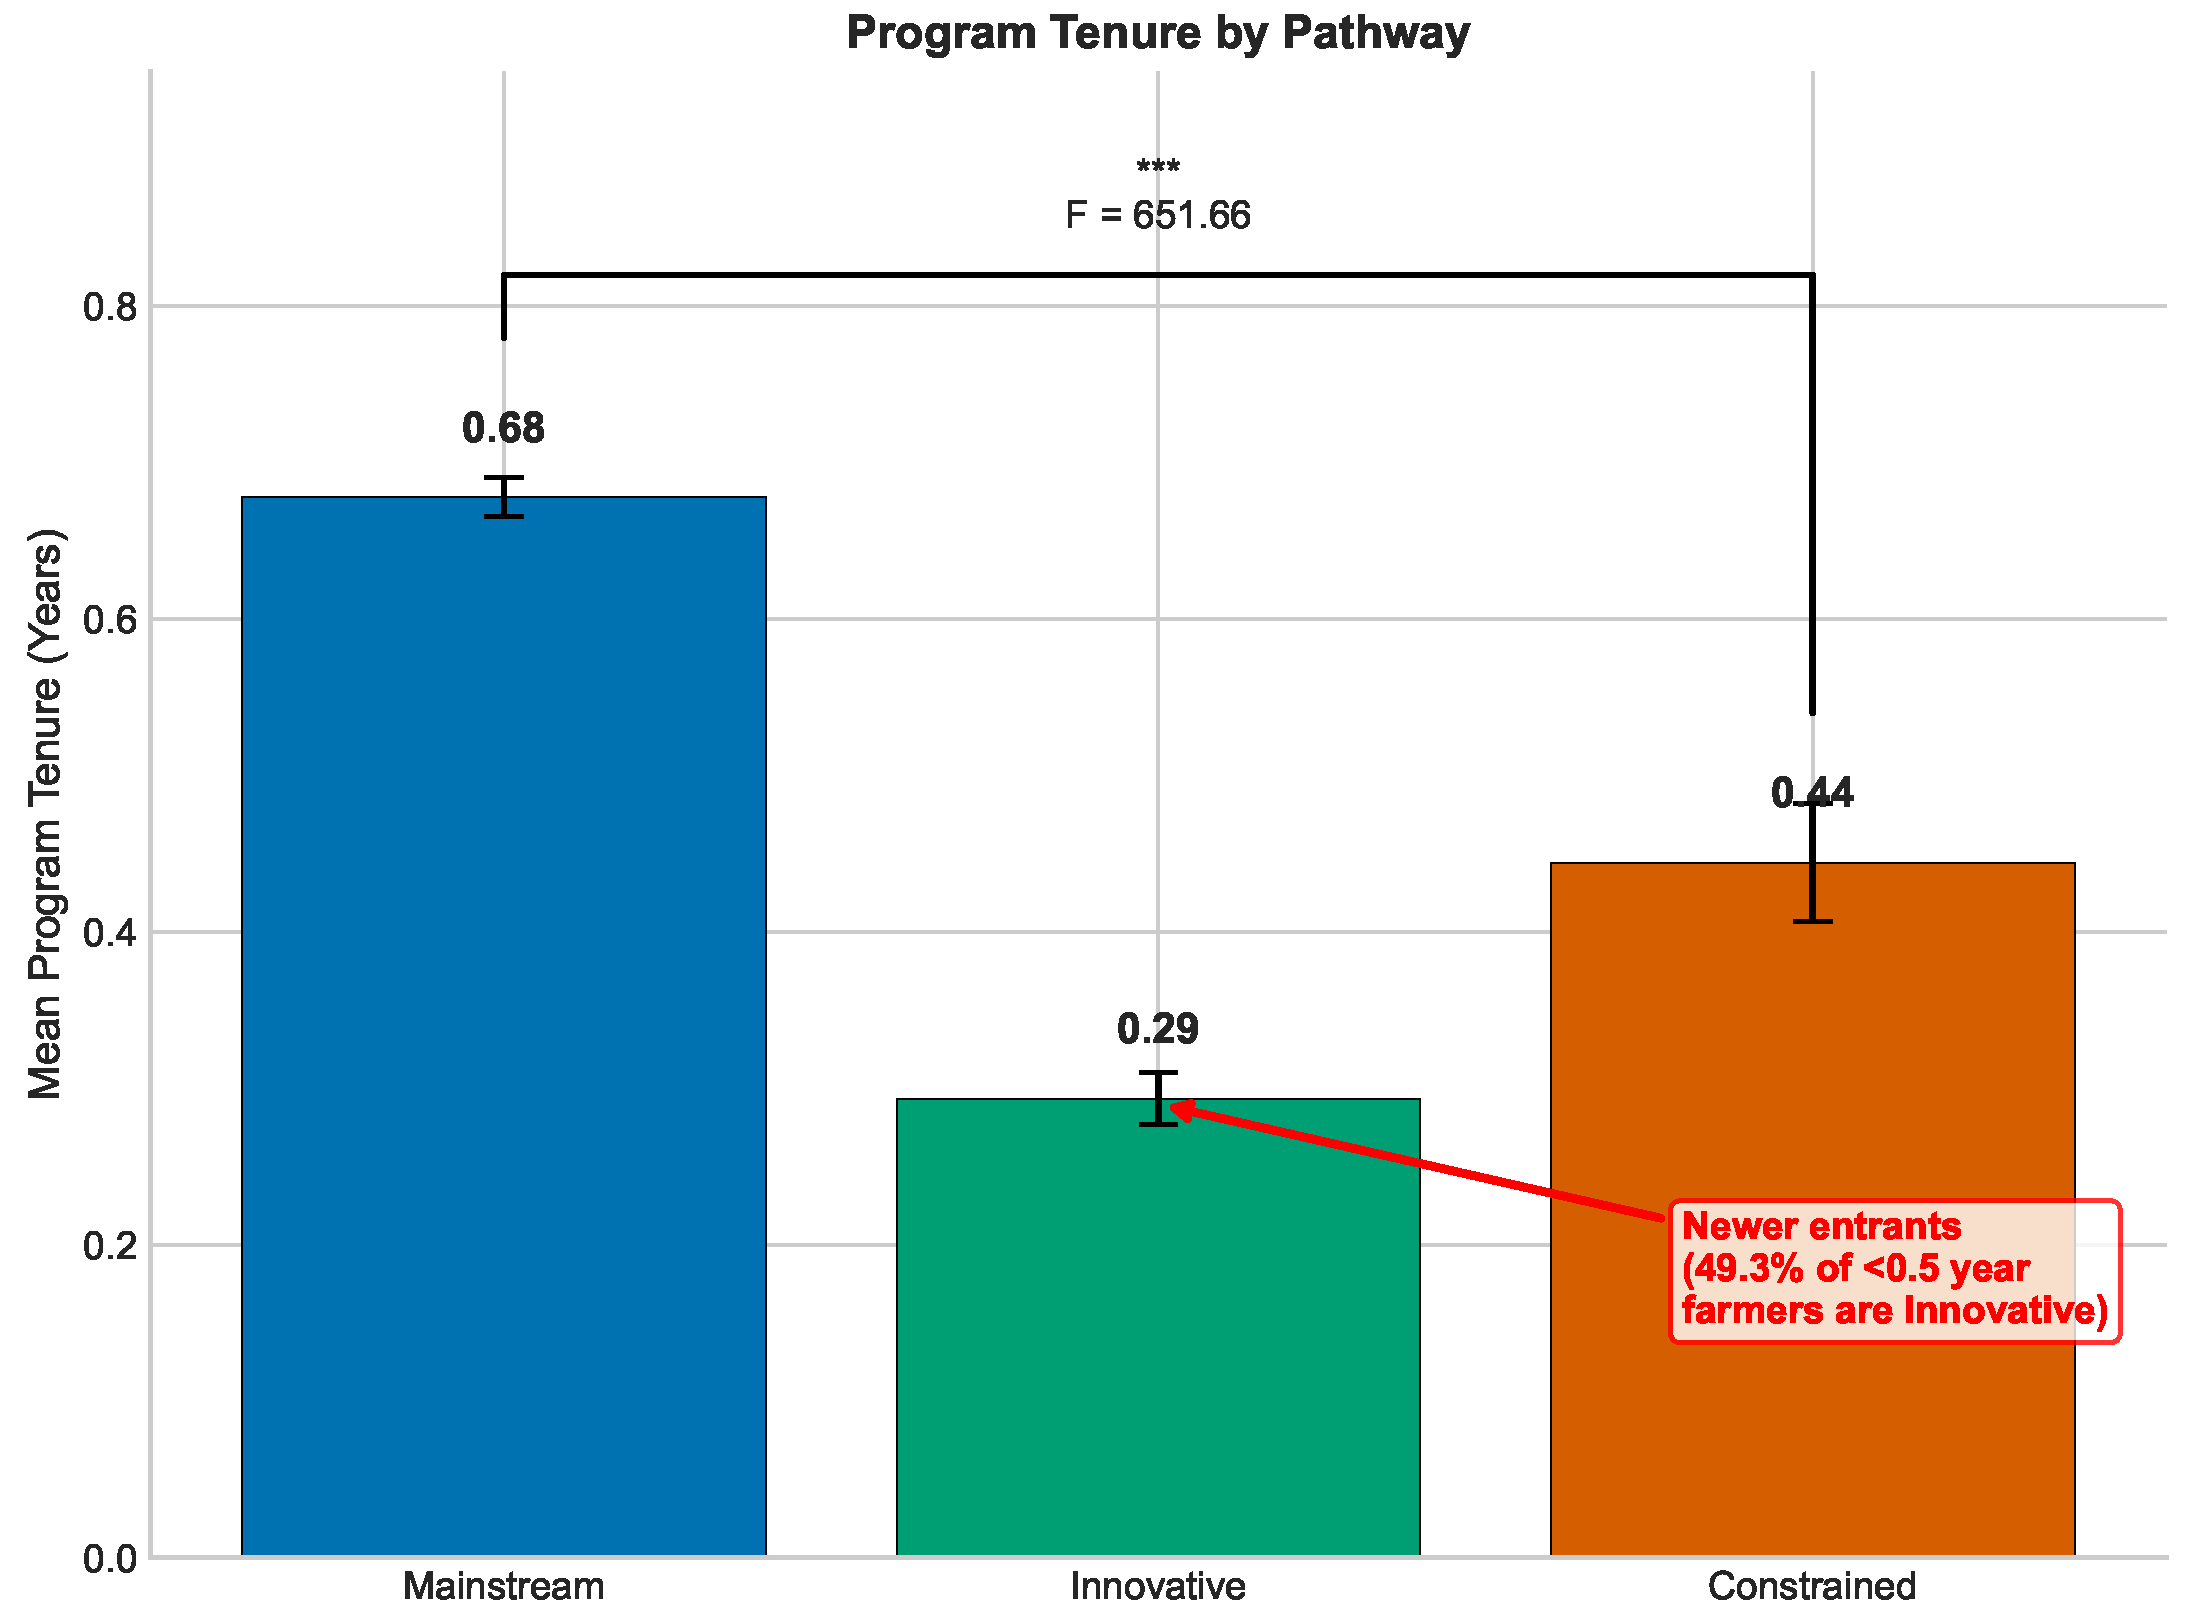
Table 10 presents mean tenure by pathway, revealing that Innovative pathway farmers have the
shortest program tenure (0.29 years) compared to Mainstream (0.68 years) and Constrained (0.44 years). This pattern contradicts a “learning” interpretation whereby farmers gradually discover organizational pathways; instead, it suggests that the Innovative pathway attracts newer entrants from the outset.
Cohort analysis reinforces this interpretation. Among the 4126 farmers with less than 0.5 years in the program (the newest cohort), nearly half (49.3%) belong to the Innovative pathway, compared to 41.8% in Mainstream and 8.9% in Constrained. This distribution differs markedly from farmers with longer tenure, where Mainstream dominates (76.1% of those with 0.5–1 years tenure). The chi-square test confirms significant association between tenure and pathway (, ).
Figure 5 visualizes the cohort pattern, demonstrating that the Innovative pathway serves as the primary entry point for new, resource-poor farmers.
This finding has important implications for understanding how payment flexibility may expand program reach. Rather than simply accommodating existing participants who lack financial access, alternative payment mechanisms appear to attract new participants who would otherwise face barriers to entry. The Innovative pathway thus represents not merely an alternative route for current farmers but an expansion of the participant pool to include farmers previously excluded by resource-based requirements.
6.7.2. Gender Equity Patterns
Women are significantly overrepresented in the Innovative pathway relative to other pathways. As shown in
Table 11, 40.7% of Innovative pathway farmers are female, compared to 34.0% in Mainstream and 37.2% in Constrained (
,
). This 6.7 percentage point difference between Innovative and Mainstream pathways indicates that the organizational route is more gender-equitable than the resource-based route.
Women are also overrepresented among alternative payment recipients. Among farmers receiving alternative payments, 43.6% are female, compared to 36.4% in the overall sample (
,
). The logistic regression in
Table 7 confirms that female gender independently predicts alternative payment access (OR = 1.39, 95% CI: 1.15–1.67,
), controlling for leadership, organizational membership, income, and other factors. Women are 39% more likely than men to receive alternative payments, net of other predictors.
These gender patterns align with theoretical expectations about women’s constraints in agricultural markets. Women often face barriers to financial account access, mobility restrictions that limit market participation, and weaker property rights. Alternative payment mechanisms, delivered through organizational channels rather than formal financial infrastructure, may circumvent these gender-specific barriers. The concentration of women in the Innovative pathway also suggests that organizational settings may be more gender-equitable than market settings. Together, the tenure and gender findings support H3: organizational pathways function as entry mechanisms that expand program reach to newer participants and are more accessible to women.
Policy Implication (H3): The finding that the Innovative pathway functions as an entry mechanism for newer and female participants has direct design implications. Programs seeking to expand reach to first-time participants and to achieve gender equity should invest in the organizational channels that characterize this pathway. This includes supporting women’s farmer groups, ensuring mixed-gender organizations maintain inclusive leadership structures, and designing alternative payment options (local delivery, collective benefits) that accommodate women’s mobility and financial constraints.
6.8. Inclusion–Effectiveness Complementarity (H4)
A critical question for program design is whether organizational pathways produce comparable environmental outcomes to resource-based pathways, or whether the inclusion of lower-resource farmers sacrifices effectiveness. Hypothesis 4 predicted that organizational pathways would achieve at least equivalent outcomes. The evidence reveals that the Innovative pathway is actually associated with superior environmental outcomes despite lower resource endowments.
6.8.1. Tree Maintenance
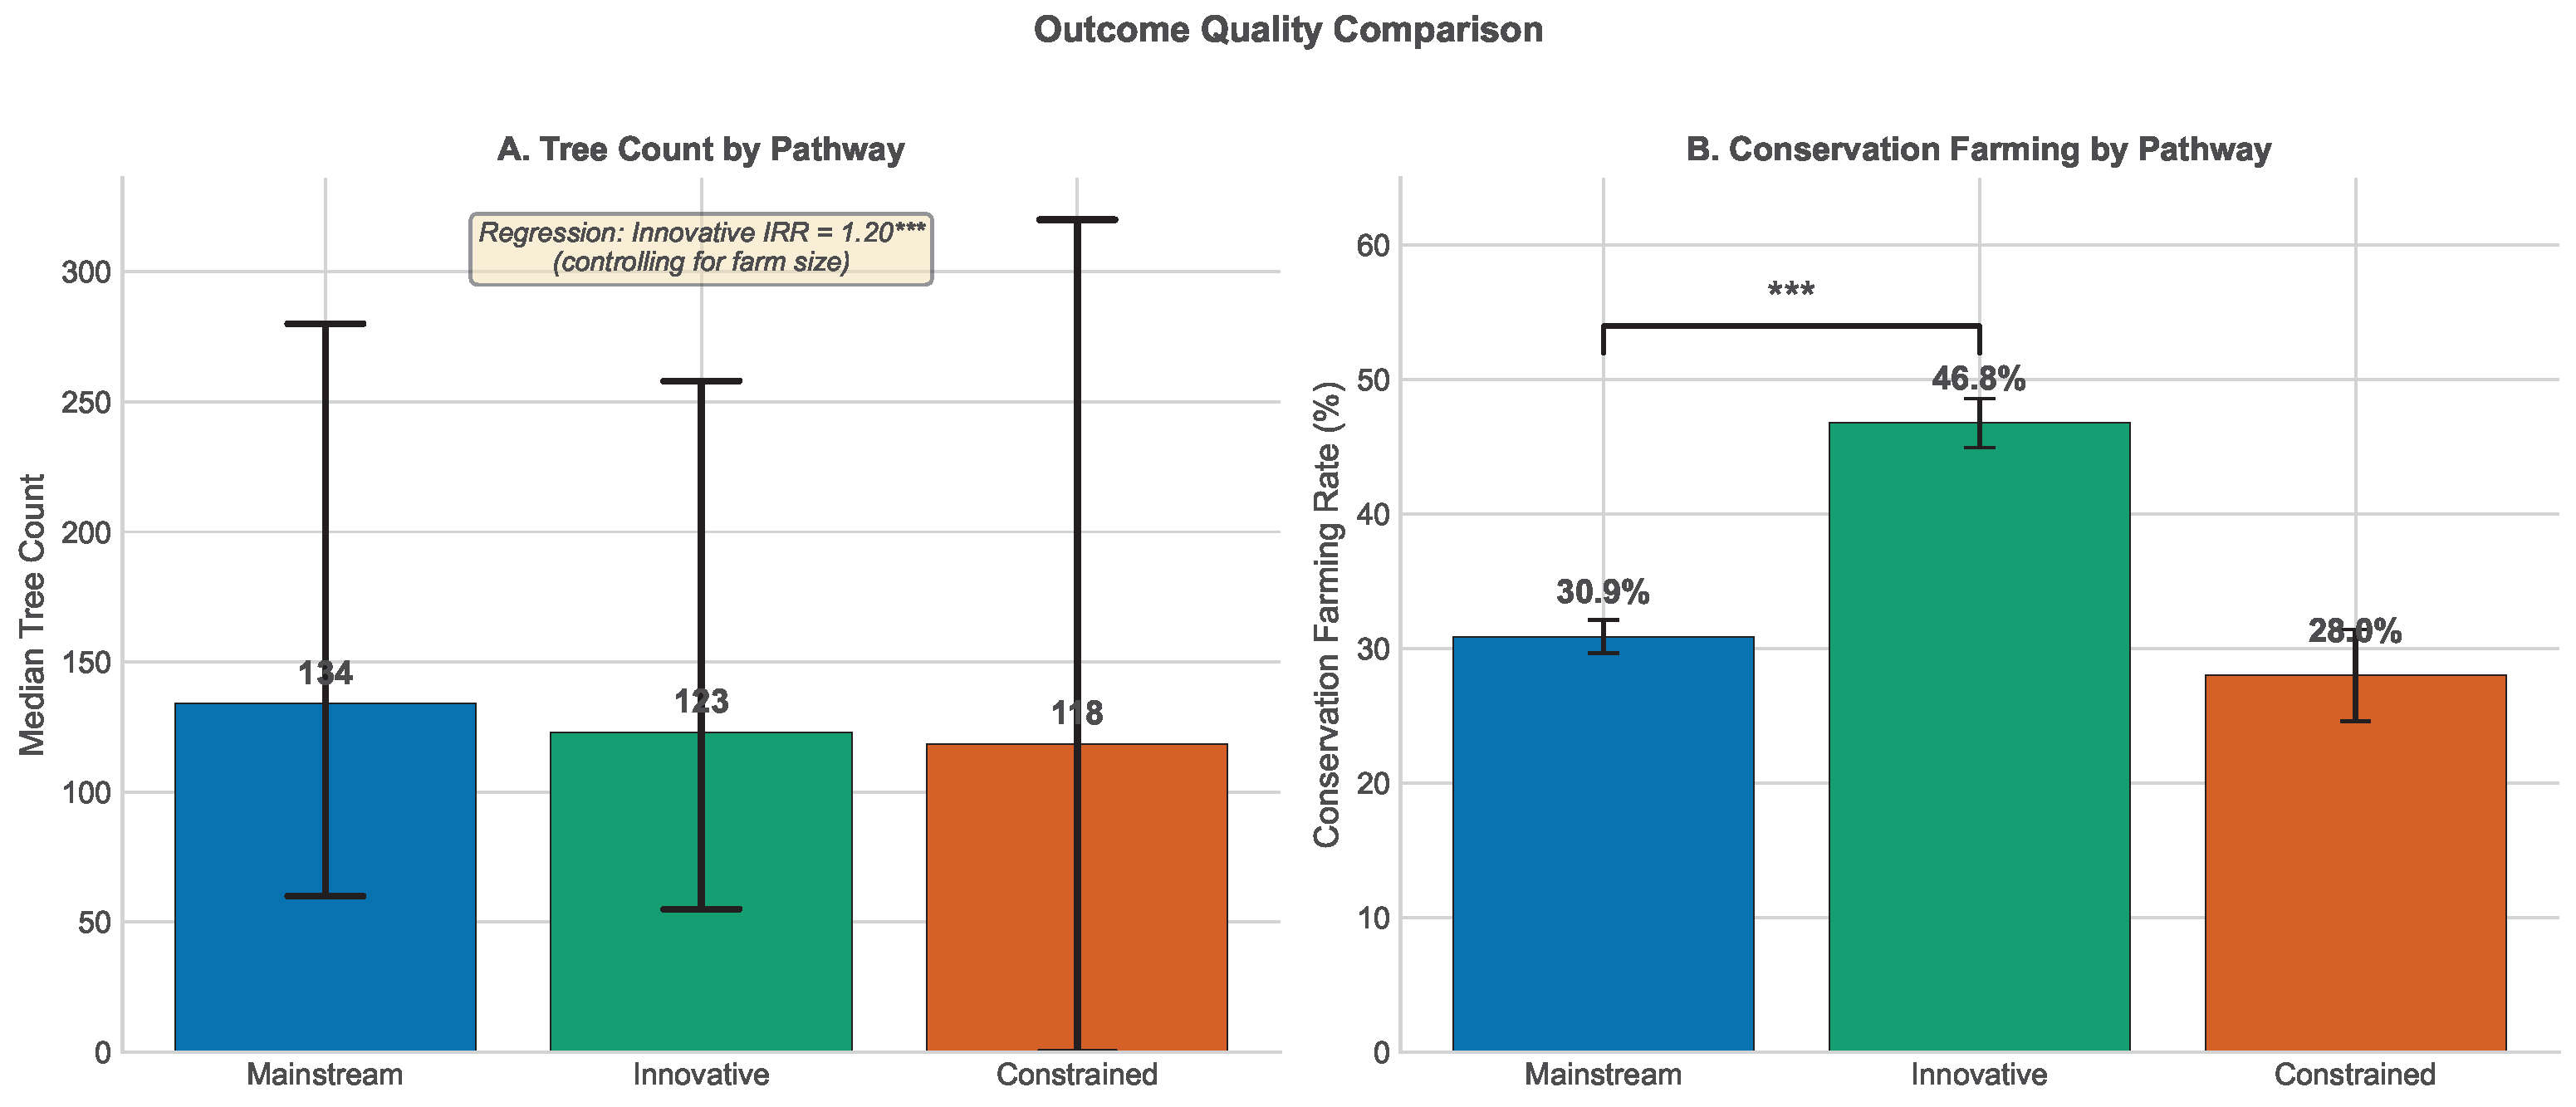
Table 12 presents negative binomial regression results when predicting tree counts. Controlling for income and farm size, Innovative pathway farmers maintain 20% more trees than Mainstream farmers (IRR = 1.20, 95% CI: 1.09–1.32,
). This finding is notable because Innovative pathway farmers have substantially lower incomes and smaller farms, factors that might be expected to reduce tree maintenance capacity.
6.8.2. Conservation Farming
The pattern is even more pronounced for conservation farming adoption. Innovative pathway farmers have 93% higher odds of practicing conservation farming compared to Mainstream farmers (OR = 1.93, 95% CI: 1.72–2.16, ). The raw rates confirm this advantage: 46.8% of Innovative pathway farmers practice conservation farming versus 30.9% of Mainstream farmers, a 15.9 percentage point difference.
6.8.3. Outcomes by Alternative Payment Status
Alternative payment recipients achieve substantially better outcomes than cash-only recipients across both measures:
Tree count: Alternative payment recipients maintain 605 trees on average, compared to 286 for cash-only recipients—2.1 times higher ().
Conservation farming: 61.9% of alternative payment recipients practice conservation farming versus 34.3% of cash-only recipients—nearly double the rate ().
Figure 6 visualizes these outcome differentials across pathways and payment mechanisms.
6.8.4. Interpretation
The superior outcomes associated with the Innovative pathway likely reflect organizational mechanisms that enhance rather than merely enable participation. Peer monitoring within farmer groups may create accountability for tree maintenance that isolated cash recipients lack. Knowledge sharing through organizational channels may transmit conservation techniques more effectively than individual learning. Social norms within groups may reinforce sustainable practices. The organizational infrastructure associated with participation thus may also enhance the quality of that participation.
These findings have important implications for the inclusion–effectiveness tradeoff often assumed in program design. Conventional wisdom suggests that targeting higher-resource farmers maximizes environmental impact, accepting reduced reach as a necessary cost. Our evidence challenges this assumption: the Innovative pathway that reaches lower-resource farmers through organizational mechanisms is associated with better environmental outcomes than the Mainstream pathway serving higher-resource farmers. These results support H4: inclusion and effectiveness are complements, not substitutes, in this mature carbon market.
Policy Implication (H4): The inclusion–effectiveness complementarity finding directly challenges the conventional assumption that reaching low-resource farmers requires the acceptance of weaker environmental outcomes. Programs and standards bodies that currently prioritize high-resource farmer targeting on environmental effectiveness grounds should reconsider this logic. Investing in organizational infrastructure not only expands inclusion but may enhance environmental performance through peer monitoring, knowledge sharing, and collective accountability mechanisms.
6.9. Robustness Assessments
We conduct three robustness checks to assess the stability of our findings.
6.9.1. Alternative Cluster Specification
The BIC-optimal solution selects four clusters rather than three. We re-estimate the GMM with four clusters to verify that the participation paradox is not an artifact of the three-cluster specification.
Table 13 presents the four-cluster solution.
The participation paradox persists in the four-cluster solution. Cluster 0, the lowest-income cluster at $1.48/day, achieves the highest adoption at 94.9%. Cross-tabulation reveals that our three-cluster Innovative pathway splits into Cluster 0 and part of Cluster 1 in the four-cluster solution, while the Constrained pathway maps exactly to Cluster 3. The paradox is robust to cluster specification.
6.9.2. District Fixed Effects
We re-estimate outcome regressions with district fixed effects to address geographic confounding. The Innovative pathway advantages persist: IRR = 1.18 for tree counts () and OR = 1.87 for conservation farming () with district fixed effects, compared to IRR = 1.20 and OR = 1.93 without. The modest attenuation suggests some geographic correlation, but pathway effects remain substantial and significant.
6.9.3. Placebo Test: Income as Outcome
As a specification check, we test whether pathways predict income, a variable used in pathway construction. If pathways capture meaningful farmer heterogeneity rather than arbitrary groupings, pathway membership should strongly predict income (since it was used to define pathways). Indeed, pathway indicators explain 47.3% of income variance (), confirming that the clustering successfully captured economically meaningful farmer heterogeneity.
6.10. Summary of Hypothesis Tests
Table 14 summarizes evidence for each hypothesis.
All six hypotheses receive empirical support, providing convergent evidence for the theoretical framework. Organizational membership functions as a necessary condition for high-adoption pathways (H1a), with leadership positions bridging members to alternative payment mechanisms (H1b). Payment flexibility enables participation without requiring financial infrastructure (H2a) and exhibits geographic clustering consistent with network diffusion, operating through channels complementary to organizational membership (H2b). The Innovative pathway functions as an entry mechanism for newer, resource-poor farmers and is more accessible to women (H3). Finally, organizational pathways are associated with superior rather than equivalent environmental outcomes, suggesting that inclusion and effectiveness may be complements rather than substitutes (H4).
The participation paradox, lower income associated with higher adoption, is explained by the coexistence of two high-adoption pathways: one resource-based (Mainstream) and one organizationally enabled (Innovative). Organizational capital appears to substitute financial capital, enabling participation among farmers who would be excluded by conventional resource-based requirements. The binding constraint for carbon market participation in this context is organizational connection, not financial resources.
7. Discussion
This study set out to explain a puzzling pattern in Kenya’s agricultural carbon market: why do the poorest farmers achieve the highest participation rates? Our analysis of 8894 TIST participants reveals that this participation paradox reflects not a statistical artifact but institutional design. Three distinct pathways to carbon market participation coexist, Mainstream, Innovative, and Constrained, with organizational capital and payment flexibility associated with the counterintuitive success of resource-poor farmers. In this section, we interpret these findings, explore their mechanisms, acknowledge limitations, and articulate contributions to theory and practice.
7.1. Relationship to Prior Work
This study complements our prior work examining payment complementarity across TIST’s four operating countries [
7]. While that analysis focused on how combining cash and community benefits enhances outcomes among enrolled participants (
), the present study addresses a logically prior question: what enables participation in the first place? By examining 8894 Kenyan farmers, including those not yet enrolled, we shift attention from outcome enhancement conditional on participation to the access mechanisms that determine who participates. The two studies thus address distinct stages of the carbon market engagement process, with the present analysis identifying organizational capital as a necessary condition that shapes who can benefit from the payment innovations documented in our earlier work.
7.2. Resolving the Participation Paradox
The participation paradox, lowest-income farmers achieving highest adoption rates, contradicts predictions from resource-based frameworks that dominate carbon market design. Conventional approaches assume that financial capital, land tenure security, and market access determine participation capacity, leading programs to target better-resourced farmers who can bear establishment costs and navigate verification requirements [
10,
11]. Our findings challenge this logic fundamentally.
The paradox resolves once we recognize that multiple pathways to participation exist simultaneously. The Mainstream pathway operates as resource-based theory predicts: farmers with higher incomes ($3.15/day) and universal financial access are associated with strong adoption (91.4%) through conventional market channels. But the Innovative pathway demonstrates an alternative logic: farmers with the lowest incomes ($1.57/day) and zero financial access achieve even higher adoption (93.8%) through organizational channels. The critical distinction is not income but organizational membership, which is universal in both high-adoption pathways and absent in the low-adoption Constrained pathway.
This pattern is consistent with Ostrom’s [
8] collective action framework applied to a new domain. Organizational membership may provide what financial capital cannot: information about program opportunities, peer support during the multi-year establishment period, collective bargaining power with program administrators, and access to alternative payment mechanisms that bypass financial infrastructure requirements. The farmer groups that characterize TIST’s operational model create several advantages: (1) information asymmetry reduction through peer-to-peer knowledge transfer; (2) risk pooling that reduces individual exposure to establishment period uncertainties; (3) enforcement mechanisms through peer monitoring and social sanctions; and (4) social capital accumulation that facilitates trust-based cooperation. These appear to constitute the institutional infrastructure that enables participation among farmers whom individual-focused approaches would exclude.
Leadership emerges as a crucial bridging mechanism within this framework. Leaders are 2.13 times more likely to access alternative payments than non-leaders, controlling for organizational membership and other factors. This finding aligns with network theories emphasizing the role of brokers who span structural holes between communities and external opportunities [
18,
20]. In TIST’s context, leaders may serve as conduits connecting group members to non-standard payment arrangements, negotiating with program staff, explaining options to members, and facilitating collective decisions about benefit packages. The organizational infrastructure provides the foundation; leadership may activate its potential.
7.3. Entry Mechanisms and Gender Equity
A striking finding concerns program tenure: Innovative pathway farmers have the shortest average tenure (0.29 years) rather than the longest. This pattern contradicts an intuitive “learning” interpretation whereby farmers gradually discover organizational pathways as they gain program experience. Instead, nearly half (49.3%) of the newest farmers, those with less than six months in the program, enter through the Innovative pathway.
This tenure pattern suggests that the Innovative pathway may function as an entry mechanism rather than a destination for experienced participants. Payment flexibility and organizational access do not merely accommodate existing participants who happen to lack financial infrastructure; they may attract new participants who would otherwise face insurmountable barriers. The Innovative pathway appears to expand the participant pool rather than simply reroute it.
Gender patterns reinforce this interpretation. Women are significantly overrepresented in both the Innovative pathway (40.7% vs. 34.0% in Mainstream) and among alternative payment recipients (43.6% vs. 36.4% overall). Women in agricultural contexts often face distinctive barriers that organizational channels may help to circumvent: limited access to formal financial accounts, mobility constraints that impede market participation, weaker property rights, and exclusion from male-dominated commercial networks [
25,
26]. Alternative payment mechanisms, training delivered at local sites, seedlings distributed through farmer groups, and community infrastructure benefiting entire households do not require bank accounts, market trips, or individual property claims. They meet women where they are rather than requiring them to overcome structural barriers.
The concentration of women in organizational pathways also likely reflects the social dynamics of farmer groups. Women’s groups, savings circles, and mixed-gender cooperatives often provide spaces where women can participate on more equal footing than in competitive market settings [
27]. The finding that female gender independently predicts alternative payment access (OR = 1.39,
), controlling for leadership and other factors, suggests that these mechanisms operate beyond simple compositional effects.
7.4. Geographic Clustering and Diffusion
Alternative payment arrangements exhibit striking geographic concentration. Laikipia West achieves a 75.8% alternative payment rate compared to 5.7% nationally, a thirteen-fold difference that cannot reflect random variation. This clustering, confirmed by chi-square testing (, ), suggests that payment innovation diffuses through social networks rather than emerging independently across locations.
What distinguishes Laikipia West? Our analysis points to organizational infrastructure density. The district exhibits significantly higher leadership rates (36.4% vs. 25.2% nationally) and dramatically higher conservation farming adoption (83.3% vs. 35.8%). The Innovative pathway is overrepresented (54.5% vs. 32.4% nationally). These patterns suggest a mutually reinforcing dynamic: strong organizational infrastructure may enable payment innovation, which attracts participants oriented toward organizational engagement, which further strengthens organizational capacity.
The diffusion mechanism likely operates through demonstration effects and social learning [
16,
17]. When farmers observe neighbors successfully accessing alternative payments, receiving training, seedlings, or community infrastructure investments, they learn that such arrangements are possible and desirable. Leaders who have navigated the negotiation process can guide others through it. Once a critical mass of alternative payment users exists in a location, the arrangement becomes normalized and self-reinforcing. This geographic concentration has practical implications: rather than attempting a uniform rollout of payment flexibility, programs might strategically seed innovation in locations with adequate organizational infrastructure, then leverage diffusion dynamics to spread successful arrangements.
7.5. Reconciling Inclusion and Effectiveness
Perhaps our most counterintuitive finding concerns environmental outcomes. The Innovative pathway, serving the lowest-income farmers through organizational channels, is associated with 20% higher tree counts (IRR = 1.20) and 93% higher conservation farming adoption (OR = 1.93) than the Mainstream pathway serving better-resourced farmers. Alternative payment recipients maintain 2.1 times more trees than cash-only recipients. These patterns directly contradict assumptions underlying conventional targeting approaches.
Several mechanisms may explain this outcome advantage. First, organizational involvement likely increases commitment and accountability. Farmers embedded in groups face peer monitoring and social pressure that isolated individuals do not; abandoning trees or neglecting conservation practices carries reputational costs within the group context [
8,
28]. Second, alternative benefits, particularly training programs, directly build capacity for sustainable practices. Farmers receiving technical training in conservation agriculture have knowledge that cash recipients may lack. Third, smaller farms characteristic of Innovative pathway farmers may be more intensively managed; conservation practices may be more feasible on plots where farmers can personally oversee all activities.
These findings challenge the implicit efficiency–equity tradeoff that often shapes program design. The conventional logic holds that maximizing environmental impact requires targeting farmers with the greatest capacity, larger farms, more resources, and stronger market connections, even if this sacrifices inclusion. Our evidence suggests this tradeoff may be false: the most inclusive pathway is associated with the best environmental outcomes. Inclusion and effectiveness may be complements, not substitutes, when organizational infrastructure enables participation and enhances practice quality.
7.6. Theoretical Contributions
Our findings contribute to collective action theory by demonstrating how organizational capital may substitute financial capital in market access. Ostrom’s framework emphasizes how communities can manage common-pool resources through appropriate institutional arrangements; we extend this logic to show how organizational membership is associated with market participation that individual resources alone cannot achieve. The farmer groups that characterize successful carbon programs are not merely administrative conveniences but may represent institutional solutions to market access barriers.
We also contribute to an understanding of payment mechanism design in development programs. The literature has extensively debated cash versus in-kind transfers, generally finding that cash provides greater flexibility and welfare gains [
22,
23]. Our findings suggest this framing may be incomplete for market access programs. Alternative payments in TIST do not merely substitute cash welfare; they may create access pathways that cash cannot. When financial infrastructure is unavailable, training and seedlings are not inferior substitutes for cash: they may be the only feasible compensation mechanism. Payment flexibility thus functions as an institutional innovation that expands program reach rather than merely accommodating existing participants.
Finally, we challenge the targeting paradigm that dominates carbon program design. The assumption that programs should identify and enroll high-capacity farmers, screening by income, assets, and market access, may systematically exclude farmers with the greatest potential for engagement when organizational pathways exist. Our evidence suggests that investing in organizational infrastructure may yield higher returns than sophisticated individual targeting: the binding constraint appears to be institutional, not individual.
7.7. From Paradox to Principle
The participation paradox with which we began—lowest income, highest adoption—is paradoxical only within a resource-based framework that treats individual endowments as determinative. Once we recognize that institutions mediate between individual characteristics and market outcomes, the paradox dissolves: organizational capital appears to substitute financial capital; payment flexibility may bypass infrastructure constraints; leadership may bridge members to opportunities. The “paradox” becomes a principle: well-designed institutional infrastructure can enable market participation, regardless of individual resource constraints.
This principle carries immediate practical implications. Carbon programs seeking inclusive participation should invest in organizational capacity, not as a delivery mechanism but as an access pathway. Payment flexibility should be designed into programs from the outset, not added as accommodation for excluded participants. Leadership development deserves explicit attention as the bridging mechanism that may activate organizational potential. And targeting approaches should shift from screening individuals to building communities.
Kenya’s experience demonstrates that high participation and poverty inclusion need not be in tension. The same organizational infrastructure associated with enabling resource-poor farmers to participate is also associated with superior environmental outcomes. In the urgent effort to scale agricultural carbon markets to meet climate goals, this complementarity offers grounds for optimism: the path to effective climate mitigation can run through, rather than around, the world’s poorest farmers.
8. Conclusions
Agricultural carbon markets are scaling rapidly to meet climate goals, yet a central design challenge persists: how to expand participation in ways that are inclusive of smallholder farmers, including those with limited private resources. Using Kenya’s TIST program, one of the largest and most established agricultural carbon initiatives, we examine how a mature market achieved very high participation (90.4%) while incorporating, rather than excluding, low-income farmers. We document a participation paradox: farmers in the lowest income quartile exhibit adoption rates 6.1 percentage points higher than those in the highest quartile. This pattern is consistent with three empirically distinct participation pathways, Mainstream (60.2%), Innovative (32.4%), and Constrained (7.5%), whose primary separator is organizational capital rather than financial capital. In particular, organizational membership distinguishes high-adoption from low-adoption pathways, and leadership roles are associated with increased access to non-standard (alternative) benefit arrangements.
These findings yield actionable implications for program design and for the governance of climate finance. First, programs should treat farmer organizations as enabling infrastructure rather than merely as administrative aggregators. Where organizational capacity is the binding constraint, investments in group formation, leadership development, and operational capability are likely to be more effective for inclusion than screening households based on private endowments. Second, payment flexibility should be embedded from inception. Alternative benefit arrangements can expand participation by relaxing requirements for standardized financial infrastructure, and their geographic clustering is consistent with diffusion through social learning, suggesting value in seeding payment innovations in organizationally ready communities while providing streamlined documentation and clear fiduciary safeguards. Third, targeting paradigms should move beyond individual eligibility screens that may inadvertently exclude farmers who can participate through collective capacity. Community readiness assessments and phased enrollment strategies that build organizational capability provide a coherent alternative and may raise participation without compromising performance.
Importantly, we do not find evidence of an inherent equity–efficiency tradeoff in this setting. The Innovative pathway—despite serving comparatively resource-constrained farmers—is associated with stronger environmental indicators, including approximately 20% higher tree counts and a substantially higher adoption of conservation farming (93% higher odds) relative to the Mainstream pathway. It also appears to function as an entry channel for new participants (49.3% of recent entrants) and is comparatively more gender inclusive (women comprise 40.7% versus 34.0% in the Mainstream pathway). Together, these patterns suggest that, when organizational infrastructure and benefit flexibility lower barriers to entry, inclusion and environmental effectiveness can be complements rather than substitutes.
Several limitations qualify interpretation and motivate future research.
Self-selection and observational design are central concerns: farmers are not randomly assigned to pathways, and self-selection into organizational membership, leadership roles, and alternative payment arrangements may be driven by unobserved factors (e.g., motivation, social capital, risk preferences, historical community investments) that affect both pathway assignment and outcomes. Although we control for observable characteristics and assess sensitivity to omitted variables using the Altonji–Elder–Taber–Oster framework [
40,
41], residual selection bias cannot be ruled out; the results should therefore be interpreted as associations descriptive of this sample rather than causal effects of pathway membership. A second limitation concerns
circularity in pathway construction: organizational membership is both a clustering feature and a key empirical result, so its strong separation of pathways partly reflects its role in pathway definition. We address this concern through sensitivity clustering that excludes membership from the feature space and through external validation using outcomes not included in clustering; nevertheless, the membership “separation” result should be interpreted with this caveat in mind. Third, because we study a single program in one country, generalizability to nascent programs, weaker institutional contexts, or different cultural settings requires caution. Finally, our measures of organizational capital and alternative payments are necessarily coarse, and richer measurement may uncover additional heterogeneity in mechanisms and impacts.
Future research can strengthen causal identification and portability in several ways. Longitudinal designs that track farmers before and after organizational formation or capacity-building interventions, and quasi-experimental approaches leveraging geographic discontinuities in organizational infrastructure or staggered program expansion, would provide more credible identification. In particular, panel tracking relative to matched controls, difference-in-differences designs exploiting a staggered rollout of alternative payment mechanisms, and quasi-experimental variation in program expansion across districts could sharpen causal inference. Comparative analysis across TIST’s four countries (Kenya, Tanzania, Uganda, India) would help to distinguish context-specific features from generalizable institutional mechanisms. Within observational designs, richer proxies for organizational quality (e.g., group age, meeting frequency, collective action history) would reduce measurement error and improve construct validity.