Article

Intergovernmental Cooperation in Zero-Waste City Development in China: An Evolutionary Game Analysis Under Prospect Theory


1
School of Business Administration, China University of Petroleum-Beijing at Karamay, Karamay 834000, China
2
School of Accountancy, Shanghai University of Finance and Economics, Shanghai 200433, China
3
School of Economics and Management, Xinjiang University, Urumqi 830002, China
*
Author to whom correspondence should be addressed.
Sustainability 2026, 18(5), 2636; https://doi.org/10.3390/su18052636
Submission received: 31 December 2025 / Revised: 24 February 2026 / Accepted: 5 March 2026 / Published: 8 March 2026
(This article belongs to the Section Waste and Recycling)

Abstract

Amid mounting environmental pressures and tightening resource constraints in China’s cities, advancing zero-waste city initiatives has become a critical avenue for sustainable urban governance. Zero-waste cities not only improve environmental quality but also enhance resource recycling and foster innovative urban governance models. This study develops an evolutionary game model that incorporates prospect theory to examine the strategic interactions between provincial and local governments. The results show that: (1) each side’s subjective perception of gains and losses significantly shapes its willingness to cooperate; (2) incentives and penalties exert asymmetric effects over the course of policy evolution: subsidies matter most during initiation, penalties are pivotal for overcoming resistance in the transition phase, and non-material incentives become increasingly important as the governance system matures; (3) zero-waste city development follows a three-stage evolutionary trajectory, moving from pilot programs to self-sustaining local governance. Using numerical simulations, this research further assesses how key parameters affect the strategic choices of both levels of government, generating policy-relevant insights for municipal solid waste management and intergovernmental cooperation in zero-waste city governance.

1. Introduction

The rapid accumulation of municipal solid waste (MSW) has become a pressing challenge for global environmental governance [1]. Global MSW generation reached 2.1 billion tons in 2024 and is projected to increase to 3.8 billion tons by 2050, with Asia, Africa, and North America expected to account for most of the future growth [2]. Notably, about 38% of solid waste remains uncontrolled, with much of it openly burned or disposed of in inadequately managed landfills. Such practices not only consume scarce land resources but also release greenhouse gases and hazardous pollutants through decomposition and combustion. The IPCC estimates that the waste sector directly contributes around 3% of global greenhouse gas emissions, yet improvements in waste and resource management could mitigate an estimated 15–25% of global emissions [2]. Together, these trends highlight the dual threat that solid waste poses to human health and climate goals, underscoring the need to balance waste prevention, resource recovery, and risk reduction.
China exemplifies both the scale and the complexity of the solid waste challenge [3]. In 2023, the 315 Chinese cities that publicly disclosed solid waste data reported generating a total of 9.32 billion tons of solid waste, including 3.80 billion tons of general industrial solid waste [4]. While the harmless disposal rate of municipal domestic waste, defined as the share treated through regulated and environmentally compliant processes such as sanitary landfilling and incineration with pollution control, has approached 100%, and the utilization rate of agricultural waste is about 82%, industrial solid waste management remains a persistent bottleneck. Large volumes continue to be stockpiled rather than effectively utilized or safely disposed of, creating long-term environmental and safety risks [4]. This structural imbalance exposes a critical vulnerability in China’s waste governance system: although municipal domestic waste is largely under control, the vast and heterogeneous industrial solid waste stream continues to exert ecological pressures and create systemic governance risks.
In response to these challenges, the Chinese government initiated the Zero-Waste City initiative in 2019 as a pilot program aimed at promoting waste reduction, recycling, and resource efficiency [5]. Importantly, zero-waste city development does not imply the complete elimination of waste generation. Instead, it refers to a governance-oriented approach that emphasizes source reduction, enhanced resource recovery and recycling, reduced reliance on landfills, and improved safety and efficiency of waste treatment across the entire lifecycle [3]. The initiative pursues concrete objectives such as lowering solid waste generation intensity, increasing comprehensive utilization rates, strengthening classified collection and treatment systems, and enhancing local institutional and regulatory capacity. Implementation is achieved through a combination of regulatory standards, performance assessment, fiscal incentives, and pilot-based experimentation, with local governments responsible for translating national targets into operational measures [5].
The initiative reflects a paradigm shift from end-of-pipe treatment to systemic resource management, underscoring coordinated governance and technological innovation [6]. However, the effectiveness of this transition depends not only on technological advances and fiscal investment but also on incentive alignment across different levels of government [7]. While the central and provincial governments are responsible for policy design, guidance, and intergovernmental fiscal transfers, the effective implementation largely depends on local governments’ incentives and administrative capacity [8]. In practice, fiscal burdens and competing development priorities may induce local governments to engage in low-effort implementation or strategic compliance [9], giving rise to a classic free-rider problem in collective environmental governance.
Although existing studies have examined waste management policies, zero-waste initiatives, and urban environmental governance, most focus on technological solutions or static policy evaluations. Relatively little attention has been paid to the dynamic strategic interaction between different levels of government, particularly under conditions of bounded rationality and subjective policy perception. Consequently, how provincial policy instruments shape the long-term evolution of local governments’ strategic behavior across different stages of zero-waste city development remains insufficiently explored.
To address this gap, this study develops an evolutionary game model between provincial and local governments that explicitly incorporates adaptive decision-making and heterogeneous incentive and cost structures. The analysis investigates how provincial incentives and penalty instruments influence local governments’ strategic adjustments over time, how perceived benefits and costs affect the stability of intergovernmental cooperation at different development stages, and under what conditions zero-waste city governance can evolve toward sustained and self-driven local participation.

2. Literature Review

2.1. Environmental Impacts of Solid Waste and Sustainability Challenges

Solid waste has long exerted persistent and adverse effects on regional ecosystems and public health. Wang et al. [10] reported that the composition of solid waste has become increasingly diverse, encompassing both industrial waste and municipal solid waste, which may diffuse into surrounding environments through rainfall infiltration and leaching processes. Bernstad et al. [11] further observed that solid waste disposal activities can generate secondary environmental problems, including greenhouse gas emissions. Zhang et al. [12] emphasized that the waste crisis has intensified over recent years, posing not only significant environmental pressures but also serious risks to public health and food safety. Building on these concerns, subsequent studies have increasingly linked solid waste issues with urban sustainable development. Fagerholm et al. [13] extended the analysis of solid waste impacts to both the ecological and social dimensions of sustainability. Hao et al. [14] further demonstrated that solid waste generation and mismanagement also undermine the sustainability of urban economic development. Accordingly, systematic research on solid waste management is of critical importance for advancing sustainable urban development.

2.2. Government Coordination in Solid Waste Management

The rapid accumulation of solid waste has spurred extensive research into governance mechanisms that can advance sustainable urban development. A growing body of scholarship underscores the pivotal role of governmental leadership in coordinating diverse stakeholders. Tan et al. [15] argued that governments should lead efforts to mobilize societal actors and leverage digital technologies to strengthen solid waste oversight and enable collaborative governance in zero-waste city development. Similarly, Liu et al. [16] emphasized the need to align the interests of relevant actors and advocated establishing national-level legal frameworks to standardize waste-sorting criteria, refine penalty mechanisms, and strengthen recycling systems. Wang et al. [17] further suggested that governments should establish dedicated funding programs to support innovation in waste-recycling technologies, while optimizing the energy consumption structure to encourage cleaner production and sustainable lifestyles among firms and residents. Further research suggests that effective collaboration among governments at different administrative levels is essential for improving solid waste management. Jiang et al. [18] argued that the central government should strengthen guidance regarding the scope and implementation of solid waste management subsidies allocated to local governments. Tan et al. [19] emphasized that effective municipal waste sorting relies on coordinated government action, emphasizing the joint roles of digital technology innovation, administrative attention allocation, publicity and education, and enforcement intensity. They further suggest that different combinations of governance tools can achieve high waste-sorting performance.

2.3. Evolutionary Game Theory in Solid Waste Management

Methodologically, evolutionary game theory has been widely used to model strategic interactions in solid waste governance. Li et al. [7] emphasized the dynamic incentive relationships between central and local governments across different stages of development. Qiao et al. [3] employed an evolutionary game model grounded in cost–benefit analysis to show that multi-stakeholder collaboration plays a critical role in advancing zero-waste city development. Qin et al. [20] constructed a government–enterprise evolutionary game model to simulate cooperative strategies, finding that cross-sectoral collaboration significantly improves the economic efficiency of resource utilization. These results underscore the importance of incentive and regulatory instruments alongside technological innovation in steering solid waste management toward higher efficiency and sustainability. Building on this line of work, Li et al. [21] developed a tripartite game model involving the government, e-waste recyclers, and the public. Their analysis indicates that the intensity of governmental incentive policies critically shapes strategic dynamics among the three actors and, in turn, affects the overall effectiveness of e-waste recycling governance.

2.4. Literature Review and Research Gaps

Previous studies have extensively examined the environmental and socio-economic impacts of solid waste, as well as the roles of various stakeholders involved in its management, thereby providing valuable insights. Nevertheless, several important research gaps remain, as outlined below. Most existing models assume fully rational actors, thereby overlooking psychological factors and risk perceptions that shape decision-making under uncertainty. This gap can be addressed by incorporating prospect theory, which captures bounded rationality and loss aversion in decision-making. Moreover, prior studies often focus on dyadic or triadic interactions. They seldom explicitly model the hierarchical relationship between provincial and local governments, which is central to China’s Zero-Waste City development. To bridge these gaps, this study integrates evolutionary game theory with prospect theory to model the strategic interactions between provincial and local governments, thereby providing a more realistic and dynamic account of intergovernmental cooperation in zero-waste governance.

3. Model Assumptions and Framework

Evolutionary game theory offers a dynamic framework for analyzing strategic interactions among boundedly rational governments whose decisions adjust over time. In this study, the model captures how provincial and local governments revise their governance strategies in the process of zero-waste city implementation. Payoffs under alternative strategy combinations are specified to derive expected payoffs and replicator dynamic equations, which describe the evolution of strategic choices over time. Equilibrium outcomes and their local stability are then examined. This approach is well suited to the zero-waste city initiative, as policy implementation proceeds through repeated evaluation cycles and involves heterogeneous incentives and capacities across different levels of government.

3.1. Evolutionary Game Strategy

In the early stages of China’s Zero-Waste City initiative, a pilot city model was adopted [22], under which provincial governments provided policy guidance and local governments were expected to participate actively. However, scaling up from localized pilots to nationwide implementation is a gradual and complex process that requires sustained intergovernmental cooperation. Both provincial and local governments play indispensable roles in advancing zero-waste city development, with the overarching goals of promoting urban sustainability, reducing solid waste generation, improving resource efficiency, and mitigating adverse environmental impacts.
Building on this institutional setting, this study conceptualizes provincial governments and local governments as the two main players in the evolutionary game. For provincial governments, adopting a non-guidance strategy implies bearing solid waste management costs as well as the associated economic and ecological losses attributable to pollution. By contrast, active guidance provides policy and financial support to local governments, strengthens implementation capacity, and enhances the provincial government’s reputation. Local governments also face distinct trade-offs. Choosing not to engage in zero-waste city development exposes local governments to ongoing waste management costs and ecological degradation and may also trigger penalties when provincial governments actively intervene. Conversely, pursuing an active development strategy makes local governments eligible for subsidies and financial transfers from provincial governments, while also enhancing their institutional reputation and governance image [23].
Accordingly, the evolutionary game specifies the following strategy sets. For provincial governments, the strategic options are active guidance or non-guidance. Under active guidance, provincial governments provide policy direction, implementation plans, and corresponding financial support, including funding, resource allocation, infrastructure, and equipment. They also promote solid waste recycling and safe disposal technologies, strengthen public awareness efforts, and establish monitoring and evaluation standards. Under non-guidance, provincial governments neither provide rewards nor impose penalties on local governments for their waste-management actions.
For local governments, the strategic options are active implementation of zero-waste city measures or non-implementation. Active implementation involves prioritizing environmental protection, reducing solid waste generation, and proactively implementing provincial government directives. Local governments under this strategy allocate fiscal resources to promote solid waste recycling and utilization, invest in relevant human capital for waste treatment technologies, and thus advance the local zero-waste agenda. Under non-implementation, by contrast, local governments take no substantive action and receive no subsidies or external support for zero-waste city development.

3.2. Notation and Parameter Definitions

Based on the strategy sets defined above and the institutional context, the parameters are specified in Table 1:
Provincial and local governments involved in zero-waste city development are modeled as two boundedly rational actors whose decisions are shaped by information asymmetry and stochastic disturbances. Both actors adopt strategies with the objective of payoff maximization and iteratively adjust their behavior through learning to converge to an evolutionarily stable state.
Let the probability that the provincial government adopts an active guidance strategy be x and the probability that it adopts a non-guidance strategy be 1 − x, with x ∈ (0, 1). If the provincial government chooses non-guidance, it incurs a pollution-control cost Ca and suffers environmental and economic losses eL arising from solid waste pollution. Under active guidance, the provincial government incurs a governance cost Cc and obtains a benefit Rc, respectively, where Rc captures improvements in governmental credibility and reputation, as well as reductions in pollution-control costs. In addition, the provincial government provides an incentive Z to local governments that actively implement zero-waste cities measures and imposes a fine, I, on those that do not.
Similarly, let the probability that the local government adopts an active implementation strategy be y, and the probability that it adopts a non-implementation strategy be 1 − y, with y ∈ (0, 1). The probability variables represent the proportion of governments adopting a given strategy over time under bounded rationality, rather than the likelihood of a single policy being legislatively adopted. If the local government chooses non-implementation, it incurs a pollution-control cost Cb and suffers environmental and economic losses L. Under an active implementation, its governance costs and benefits are denoted as Cl and Rl, respectively.
Because the strategic decisions of provincial and local governments are interdependent, this study introduces a risk transfer coefficient to capture interaction effects. It is assumed that risk-related losses are linearly related to this coefficient. Specifically, if the provincial government adopts an active guidance strategy while the local government chooses non-implementation, the risk-loss cost discount coefficient is m, where m ∈ (0, 1]. If the local government adopts active implementation while the provincial government opts for non-guidance, the corresponding risk-loss cost discount coefficient is n, where n ∈ (0, 1]. If the provincial and local governments adopt non-guidance and non-implementation strategies, respectively, the risk transfer coefficient is denoted by e, where e ≥ 0.

4. Model Establishment and Solution

4.1. Model Establishment

Active provincial guidance is interpreted as a package of vertical governance instruments in the zero-waste city program, such as earmarked incentives, performance evaluation and accountability pressure, and cross-department coordination. Active local implementation represents concrete actions including system and infrastructure building for source reduction, recycling and comprehensive utilization, and harmless treatment across major waste streams.
When the local government adopts an active implementation strategy, the provincial government’s expected payoff under the active guidance strategy is RcCcZ. Conversely, if the provincial government chooses not to provide guidance, its expected payoff is −CaneL. When the local government chooses non-implementation, the provincial government’s expected payoff under active guidance becomes ICameLCc, under the non-guidance strategy, the expected return is −CaeL.
When the provincial government adopts active guidance, the local government’s expected payoff under active implementation is RlCl + Z; under non-implementation, the expected payoff is −CbmLI. When the provincial government chooses non-guidance, the local government’s expected payoff under active implementation is −ClCbnL; under non-implementation, it is −CbL. The resulting payoff matrix is reported in Table 2.

4.2. Replication Dynamic Equation

Let U11 and U12 denote the provincial government’s expected payoffs under active guidance and non-guidance, respectively. U1 denotes the average payoff. Based on the payoff matrix above, the replicator dynamic equation for the provincial government F(x) is given by:
U11 = (y − 1)(Ca + Cc − I + Lem) − y(Cc − Rc + Z)
U12 = (Ca + Le)(y − 1) − y(Ca + Len)
U1 = x((y − 1)(Ca + Cc − I + Lem) − y(Cc − Rc + Z)) − ((Ca + Le)(y − 1) − y(Ca + Len))(x − 1)
F(x) = dx/dt = −x(x − 1)(I − Cc + Le + Cay − Iy + Rcy − Zy − Lem − Ley + Lemy + Leny)
Let U21 and U22 donate the local government’s expected payoffs under active implementation and non-implementation, respectively, and U2 denote the average payoff. Based on the payoff matrix above, the replicator dynamic equation for the local government F(y) is given by:
U21 = (x − 1)(Cb + Cl + Ln) + x(Rl − Cl + Z)
U22 = (x − 1)(Cb + L) − x(Cb + I + Lm)
U2 = y((x − 1)(Cb + Cl + Ln) + x(Rl − Cl + Z)) − ((x − 1)(Cb + L) − x(Cb + I + Lm))(y − 1)
F(y) = −y(y − 1)(L − Cl − Ln + Cbx + Ix − Lx + Rlx + Zx + Lmx + Lnx)

4.3. Jacobi Matrix and Equilibrium Points

To characterize equilibrium points of the two-player system, set F(x) = 0 and F(y) = 0. Because each player has two pure strategies, x and y can take boundary values of 0 or 1, yielding four equilibrium points: A(0,0), B(0,1), C(1,1), and D(1,0). Following the Lyapunov stability theory for planar dynamical systems, an equilibrium is locally asymptotically stable if all eigenvalues of the Jacobi matrix have negative real parts, and unstable if at least one eigenvalue has a positive real part. The Jacobi matrix of the two-party game is given by:
J = d F ( x ) d x   d F ( x ) d y   d F ( y ) d x   d F ( y ) d y
Among them:
dF(x)/dx = −(x − 1)(I − Cc + Le + Cay − Iy + Rcy − Zy − Lem − Ley + Lemy + Leny) − x(I − Cc + Le + Cay − Iy + Rcy − Zy − Lem − Ley + Lemy + Leny)
dF(x)/dy = −x(x − 1)(Ca − I + Rc − Z − Le + Lem + Len)
dF(y)/dx = −y(y − 1)(Cb + I − L + Rl + Z + Lm + Ln)
dF(y)/dy = −y(L − Cl − Ln + Cbx + Ix − Lx + Rlx + Zx + Lmx + Lnx) − (y − 1)(L − Cl − Ln + Cbx + Ix − Lx + Rlx + Zx + Lmx + Lnx)
Substituting the four-corner equilibria into the Jacobian matrix yields the corresponding eigenvalues. Table 3 reports the two eigenvalues, denoted by α1 and α2.

4.4. Parameter Simulation of Stability Point

Due to the limited availability of standardized and publicly comparable intergovernmental governance data, this study is not intended to provide an ex-post empirical evaluation of the Zero-Waste City initiative. Instead, scenario-based numerical simulations are employed as illustrative numerical experiments to clarify the evolutionary mechanisms embedded in the model, identify critical threshold conditions, and examine the sensitivity of strategic convergence to key policy parameters within plausible institutional settings.
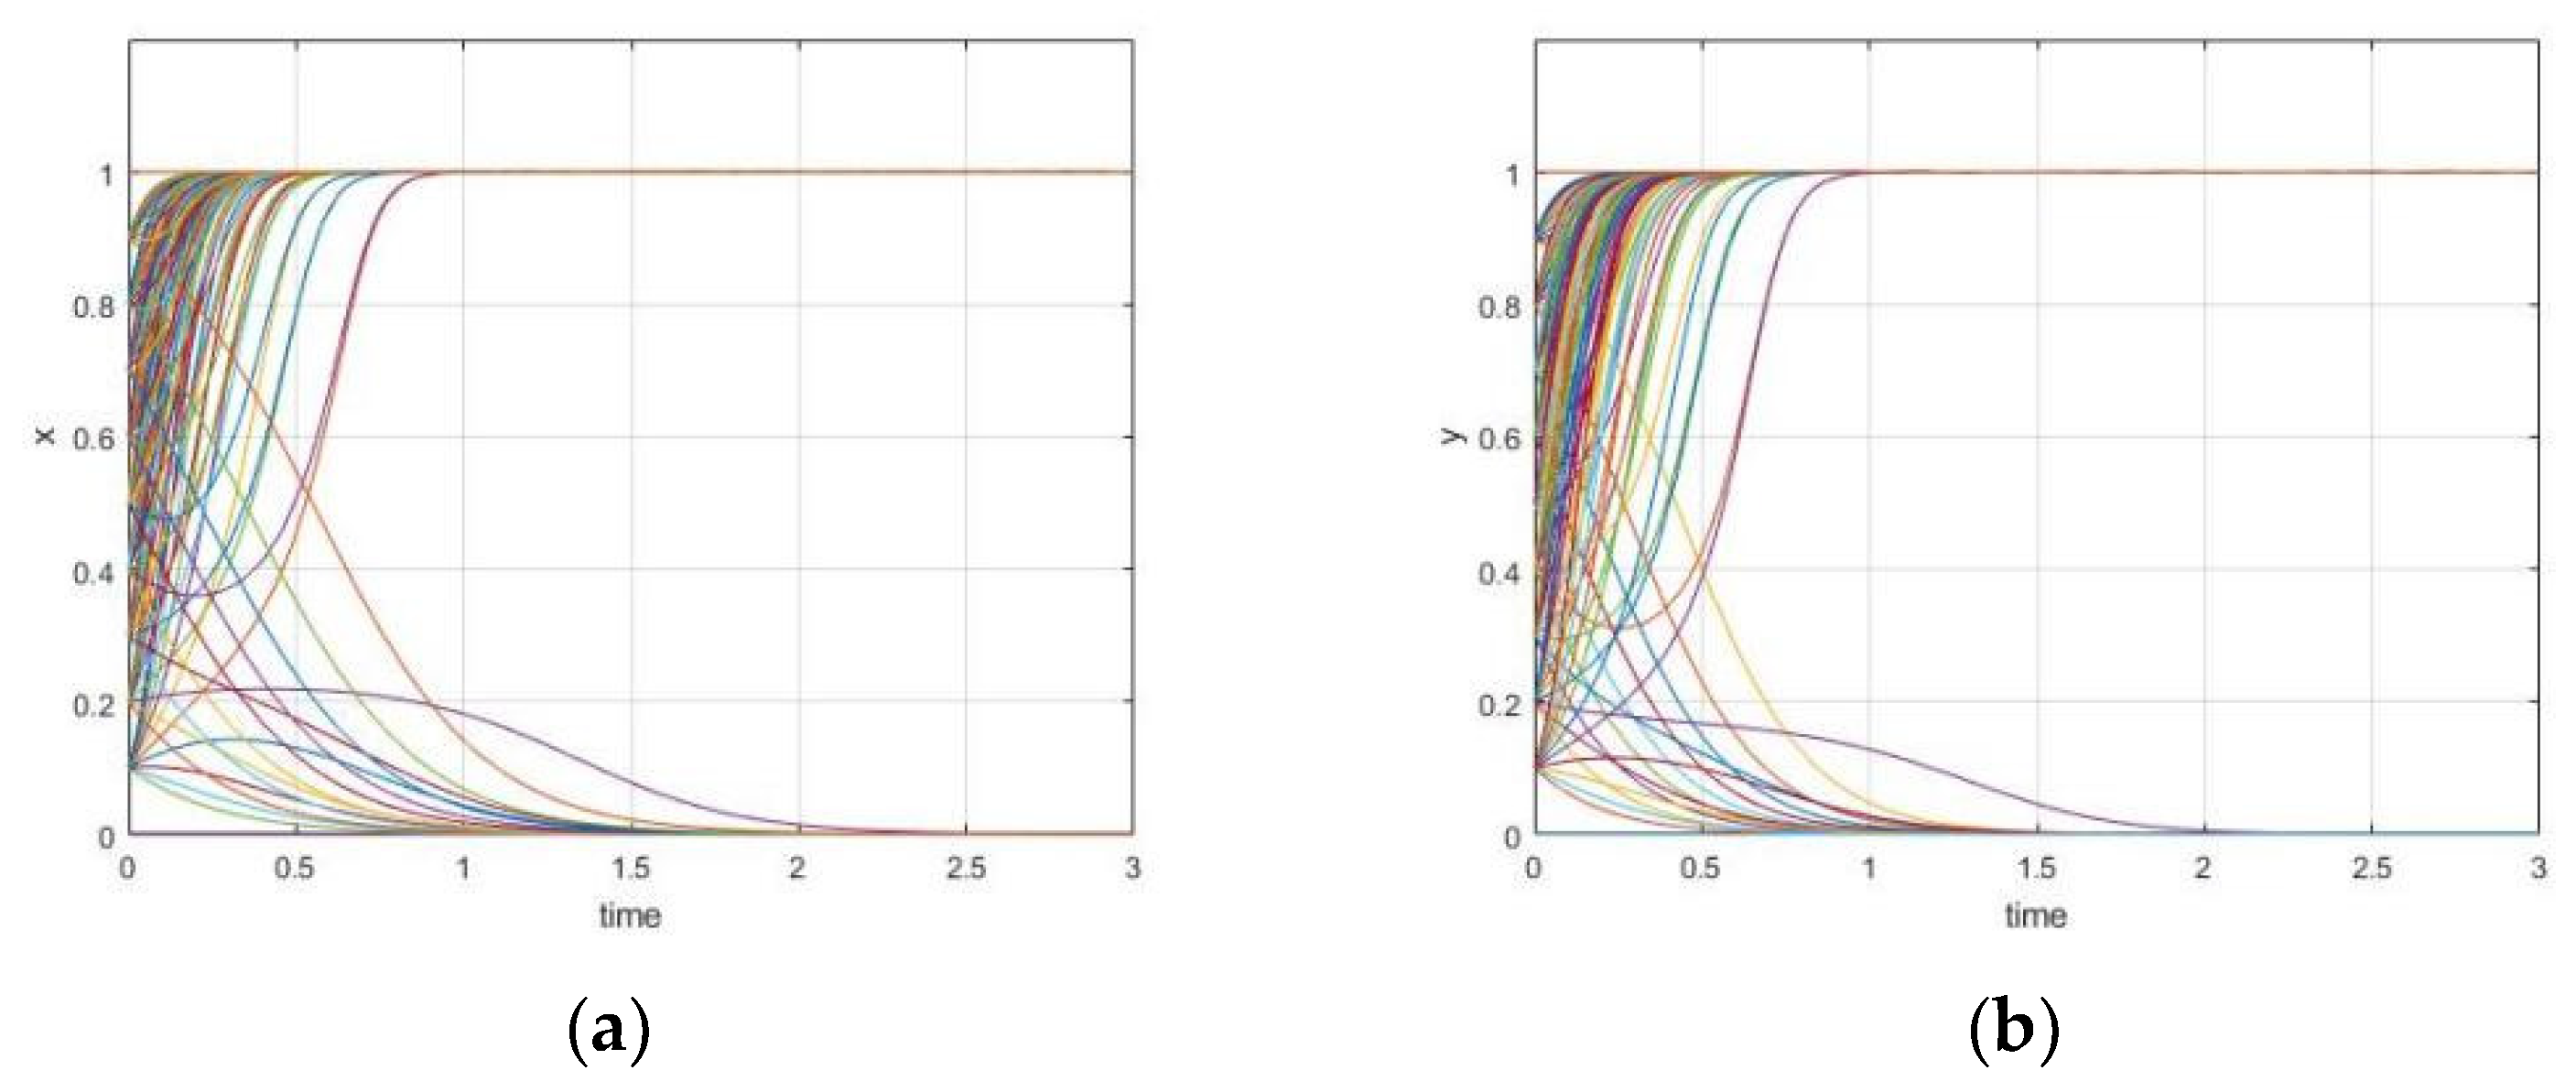
The model is simulated under alternative initial conditions around the equilibrium points using the parameter values specified below. Each trajectory in the figure depicts the evolution of the provincial government’s strategy share x and the local government’s strategy share y under different initial conditions.
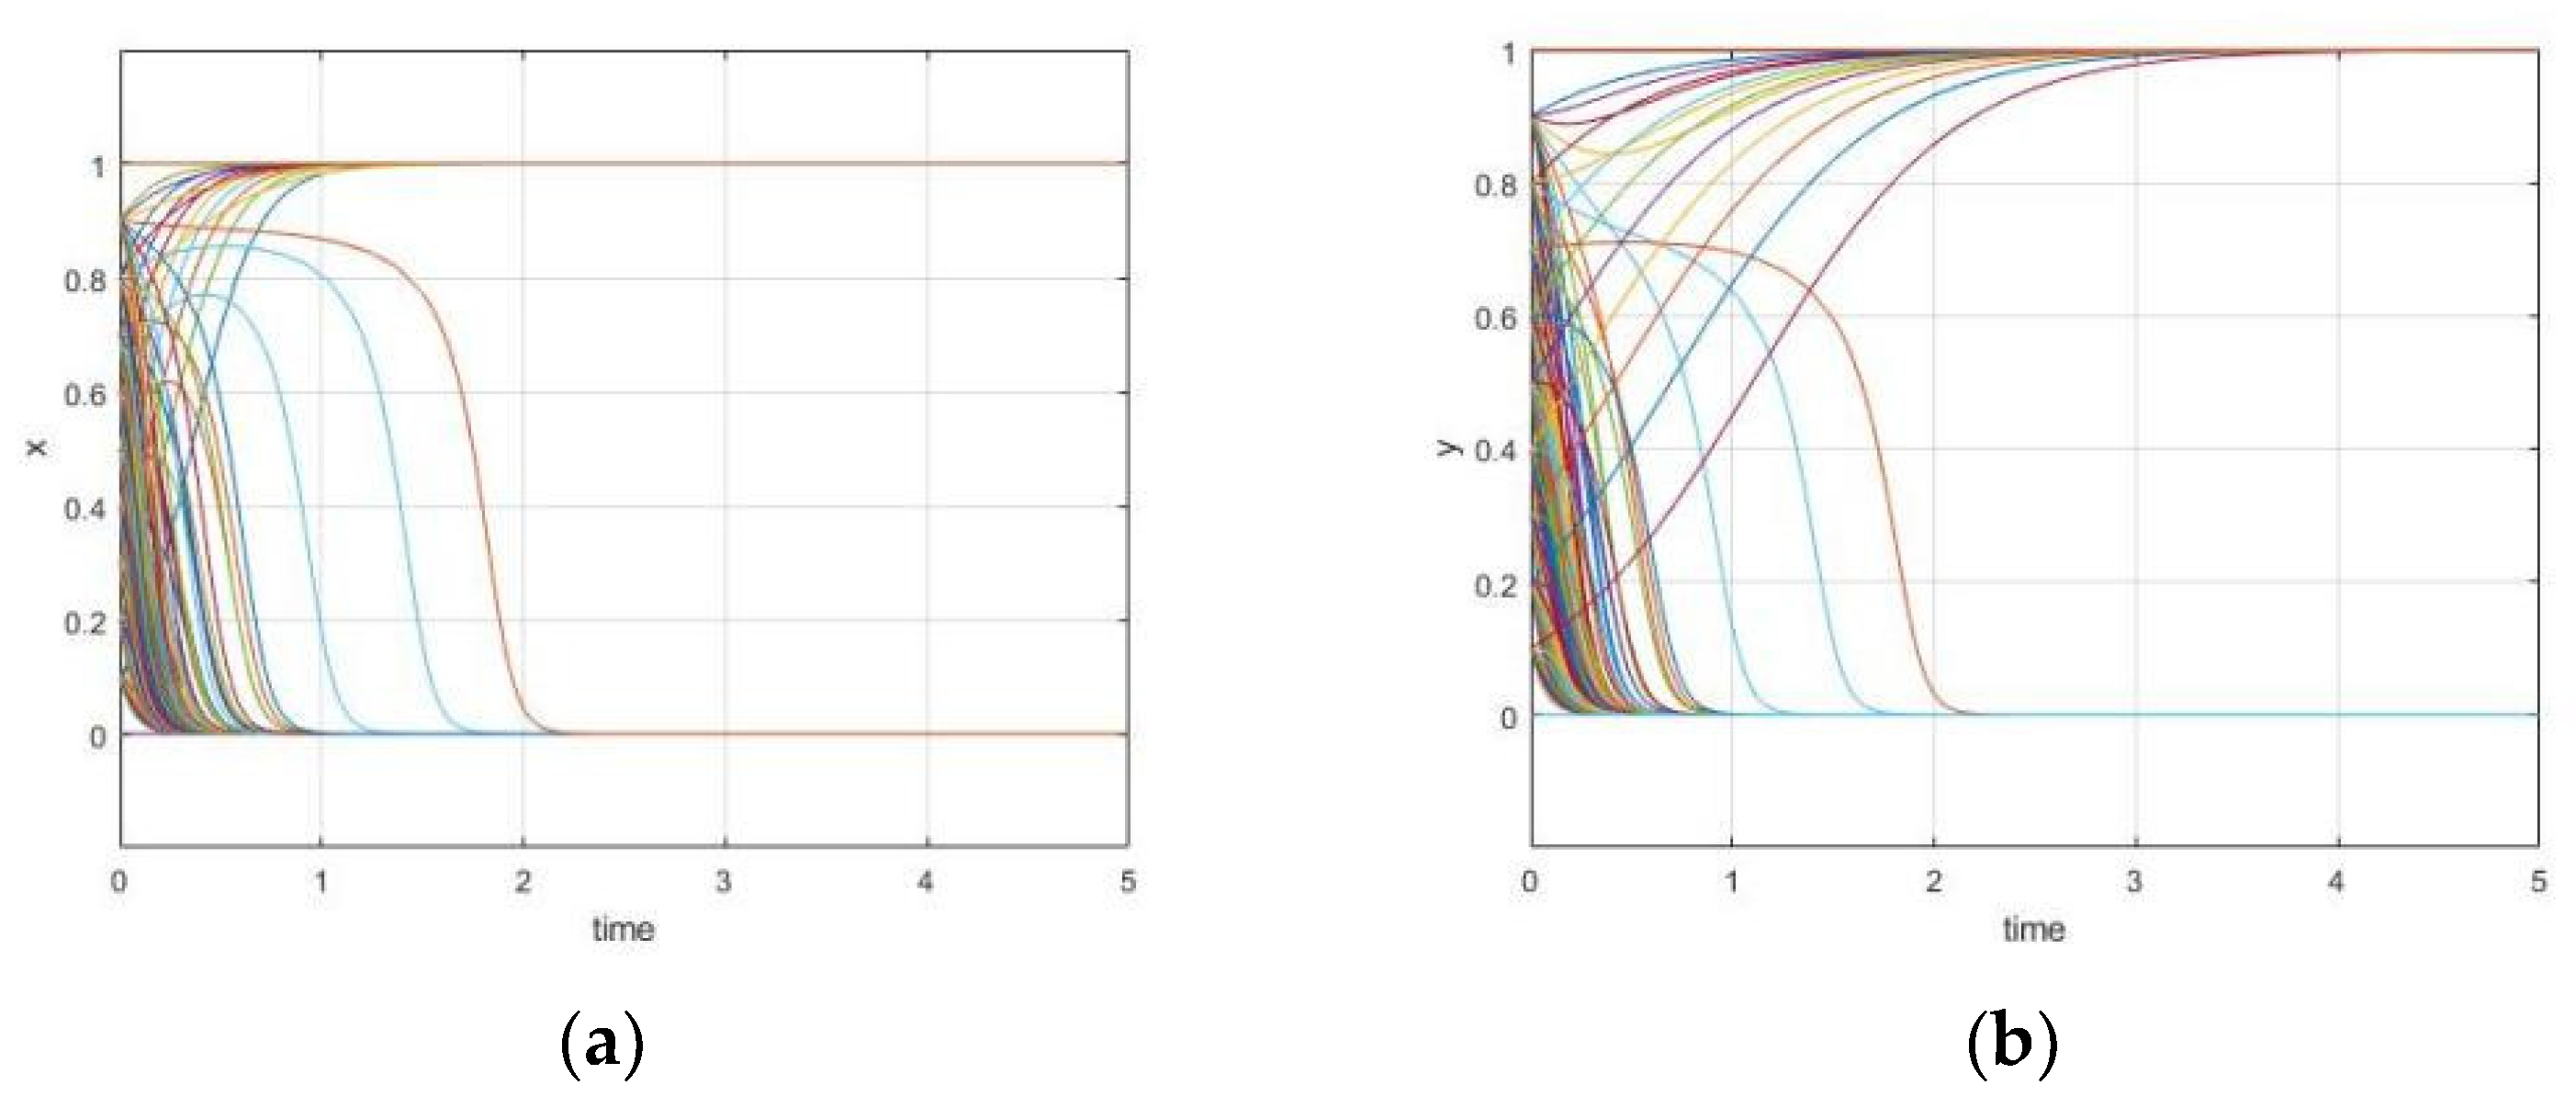
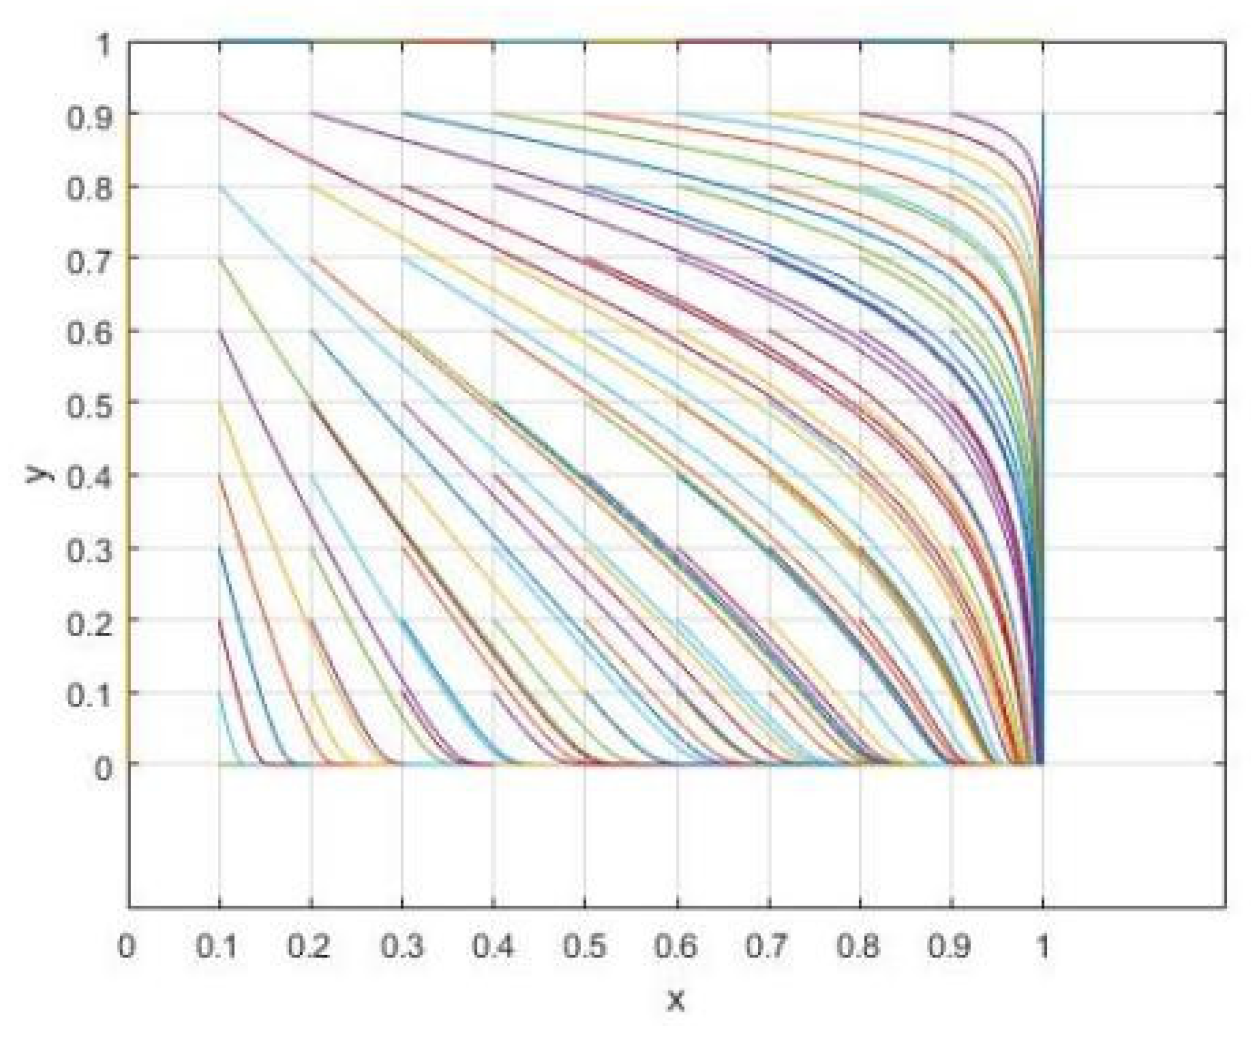
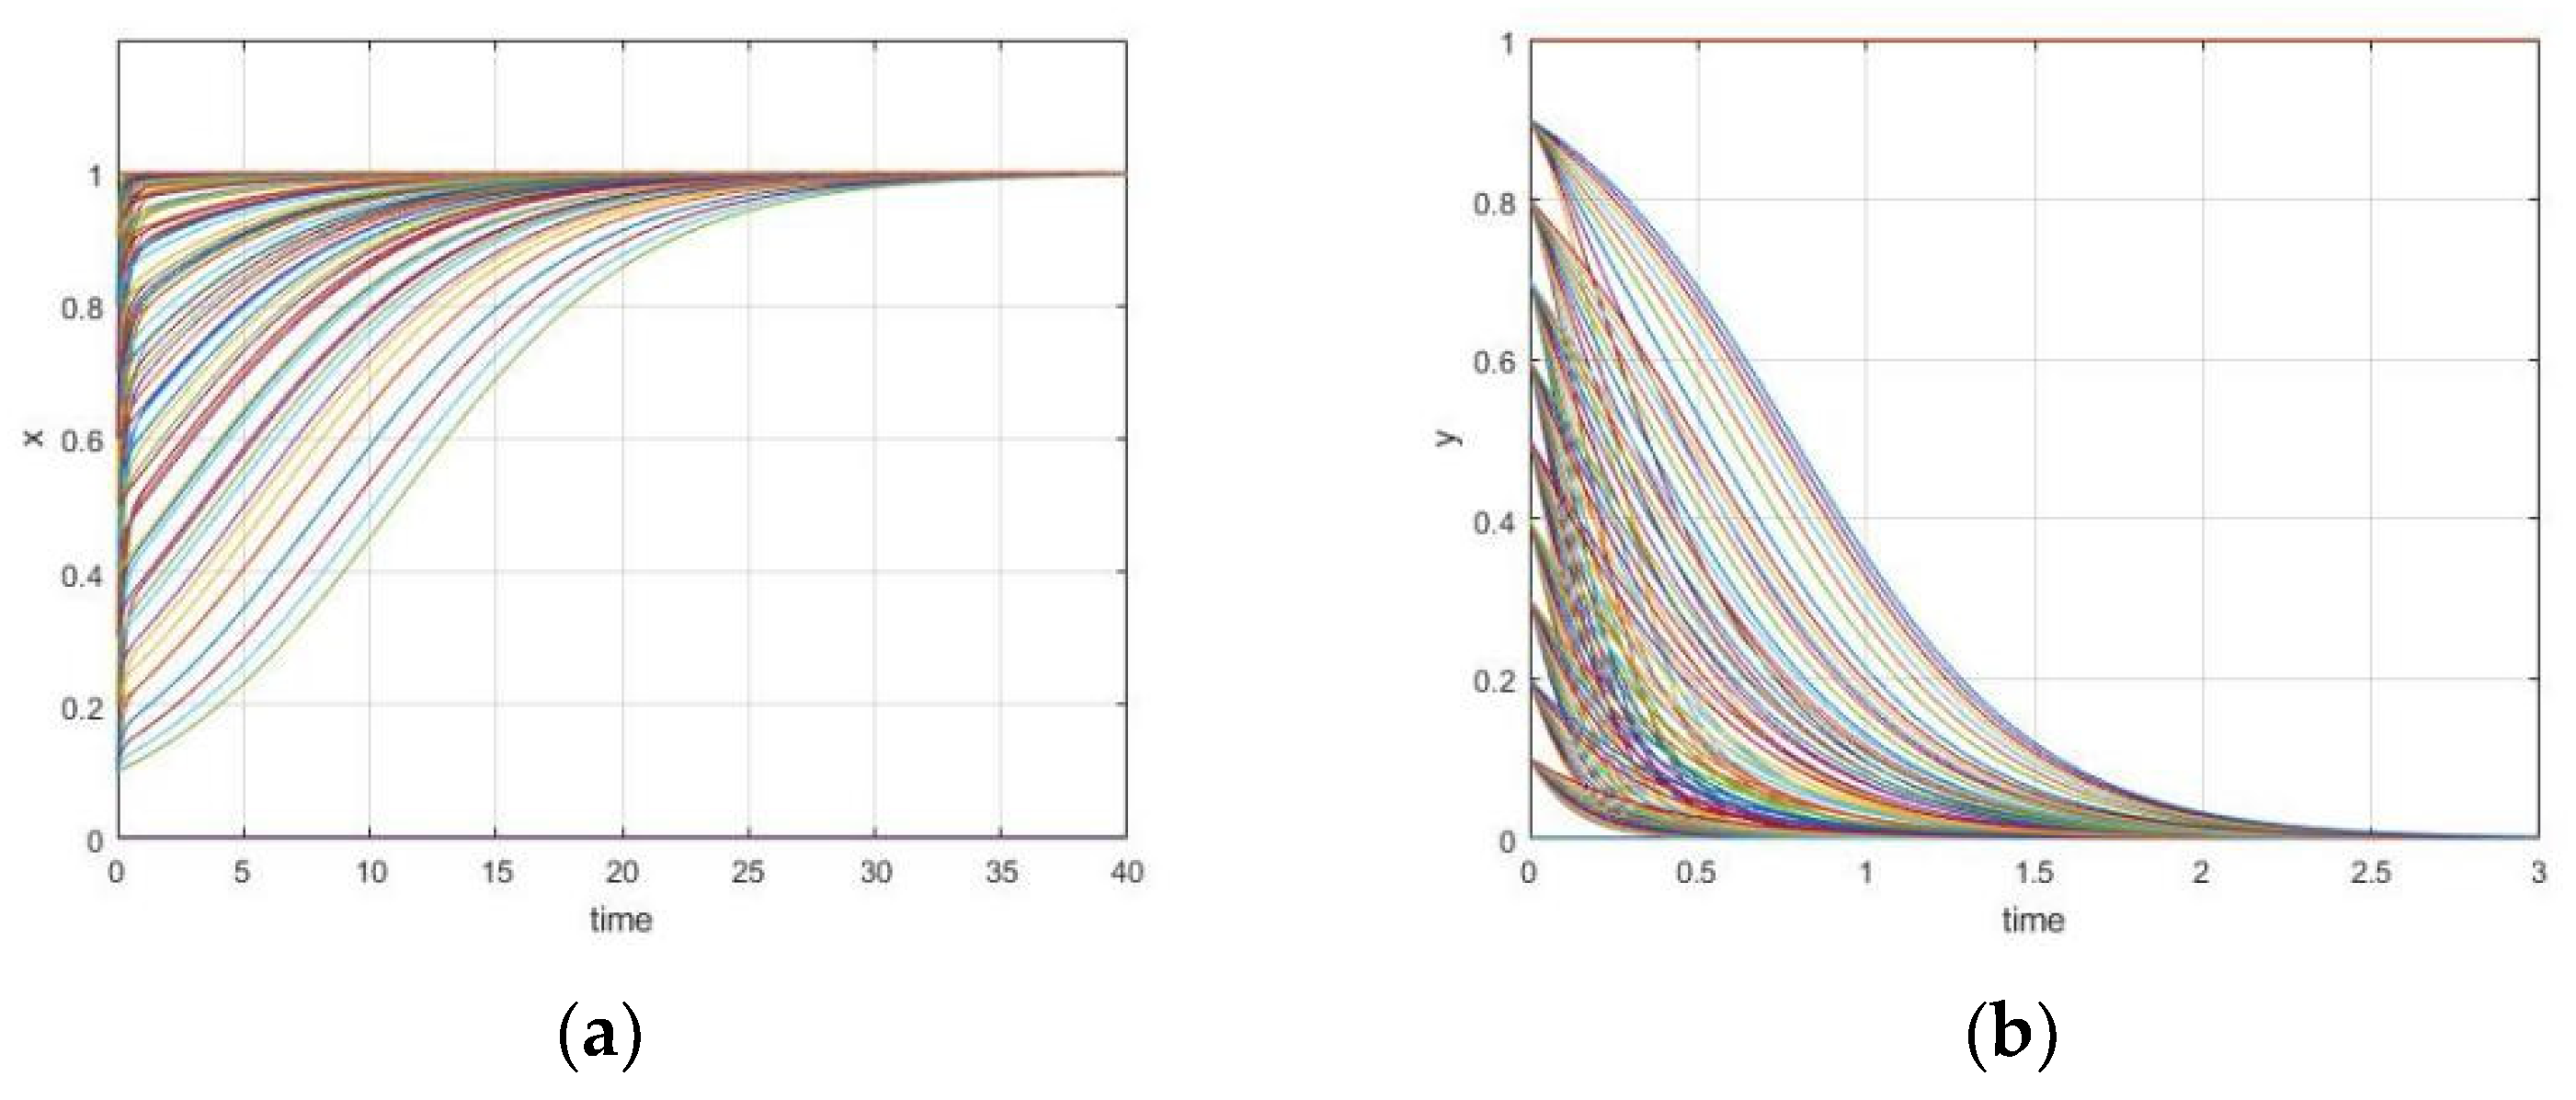
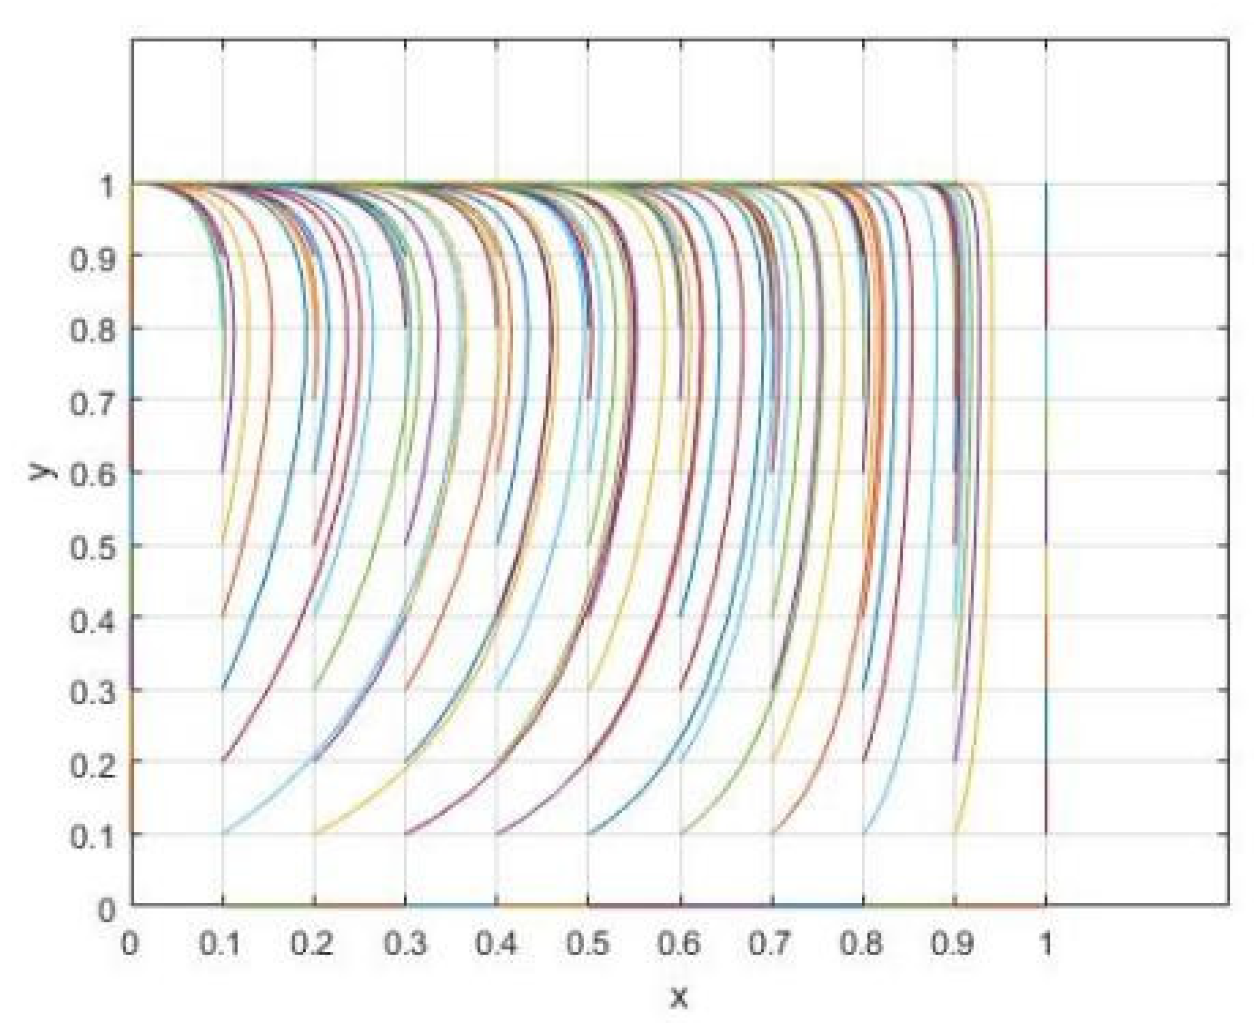
In the absence of a zero-waste city’s construction, the equilibrium point is (0,0), when LClnL < 0, ICl + eLmeL < 0 should be satisfied, and this point is the stable point of the evolutionary game. To satisfy these stability conditions, parameter values are calibrated to reflect the institutional context. Let Rc = 20, Rl = 10, Cc = 19, Cl = 16, Z = 3, Ca = 5, Cb = 3, e = 2, m = 0.5, n = 0.8, L = 2, and I = 1. Figure 1 and Figure 2 present the simulation results. Over time, both the provincial and local governments converge with non-guidance and non-implementation. This outcome reflects that, in the early stage of China’s industrialization and urbanization, local pollution-control costs and the associated economic and ecological losses were relatively low, whereas the budgeted cost of zero-waste city development was high. Consequently, the expected benefits are insufficient to offset the high implementation costs, leading both provincial and local governments to adopt conservative strategies.
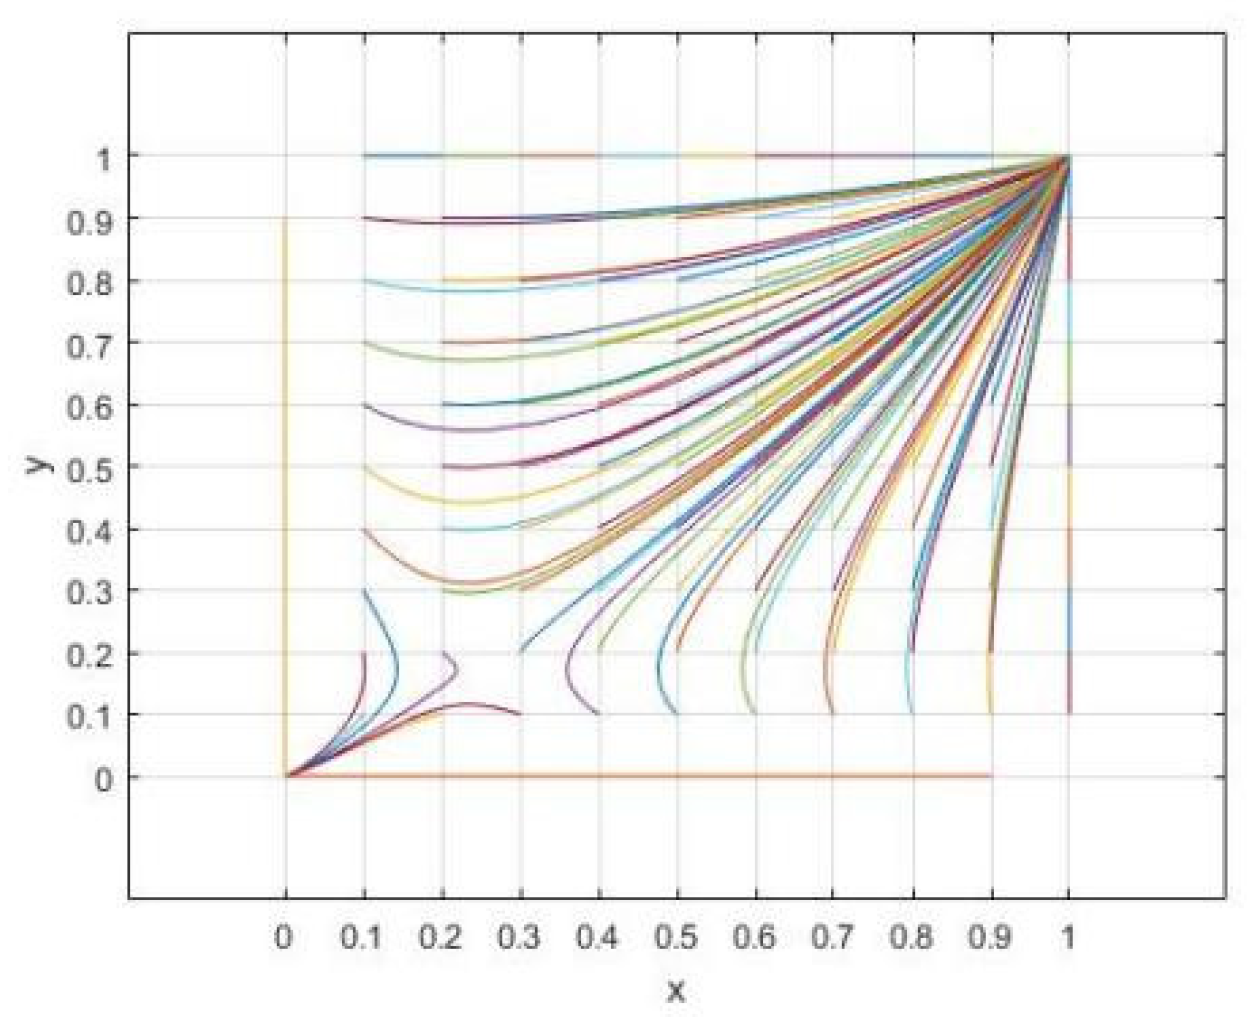
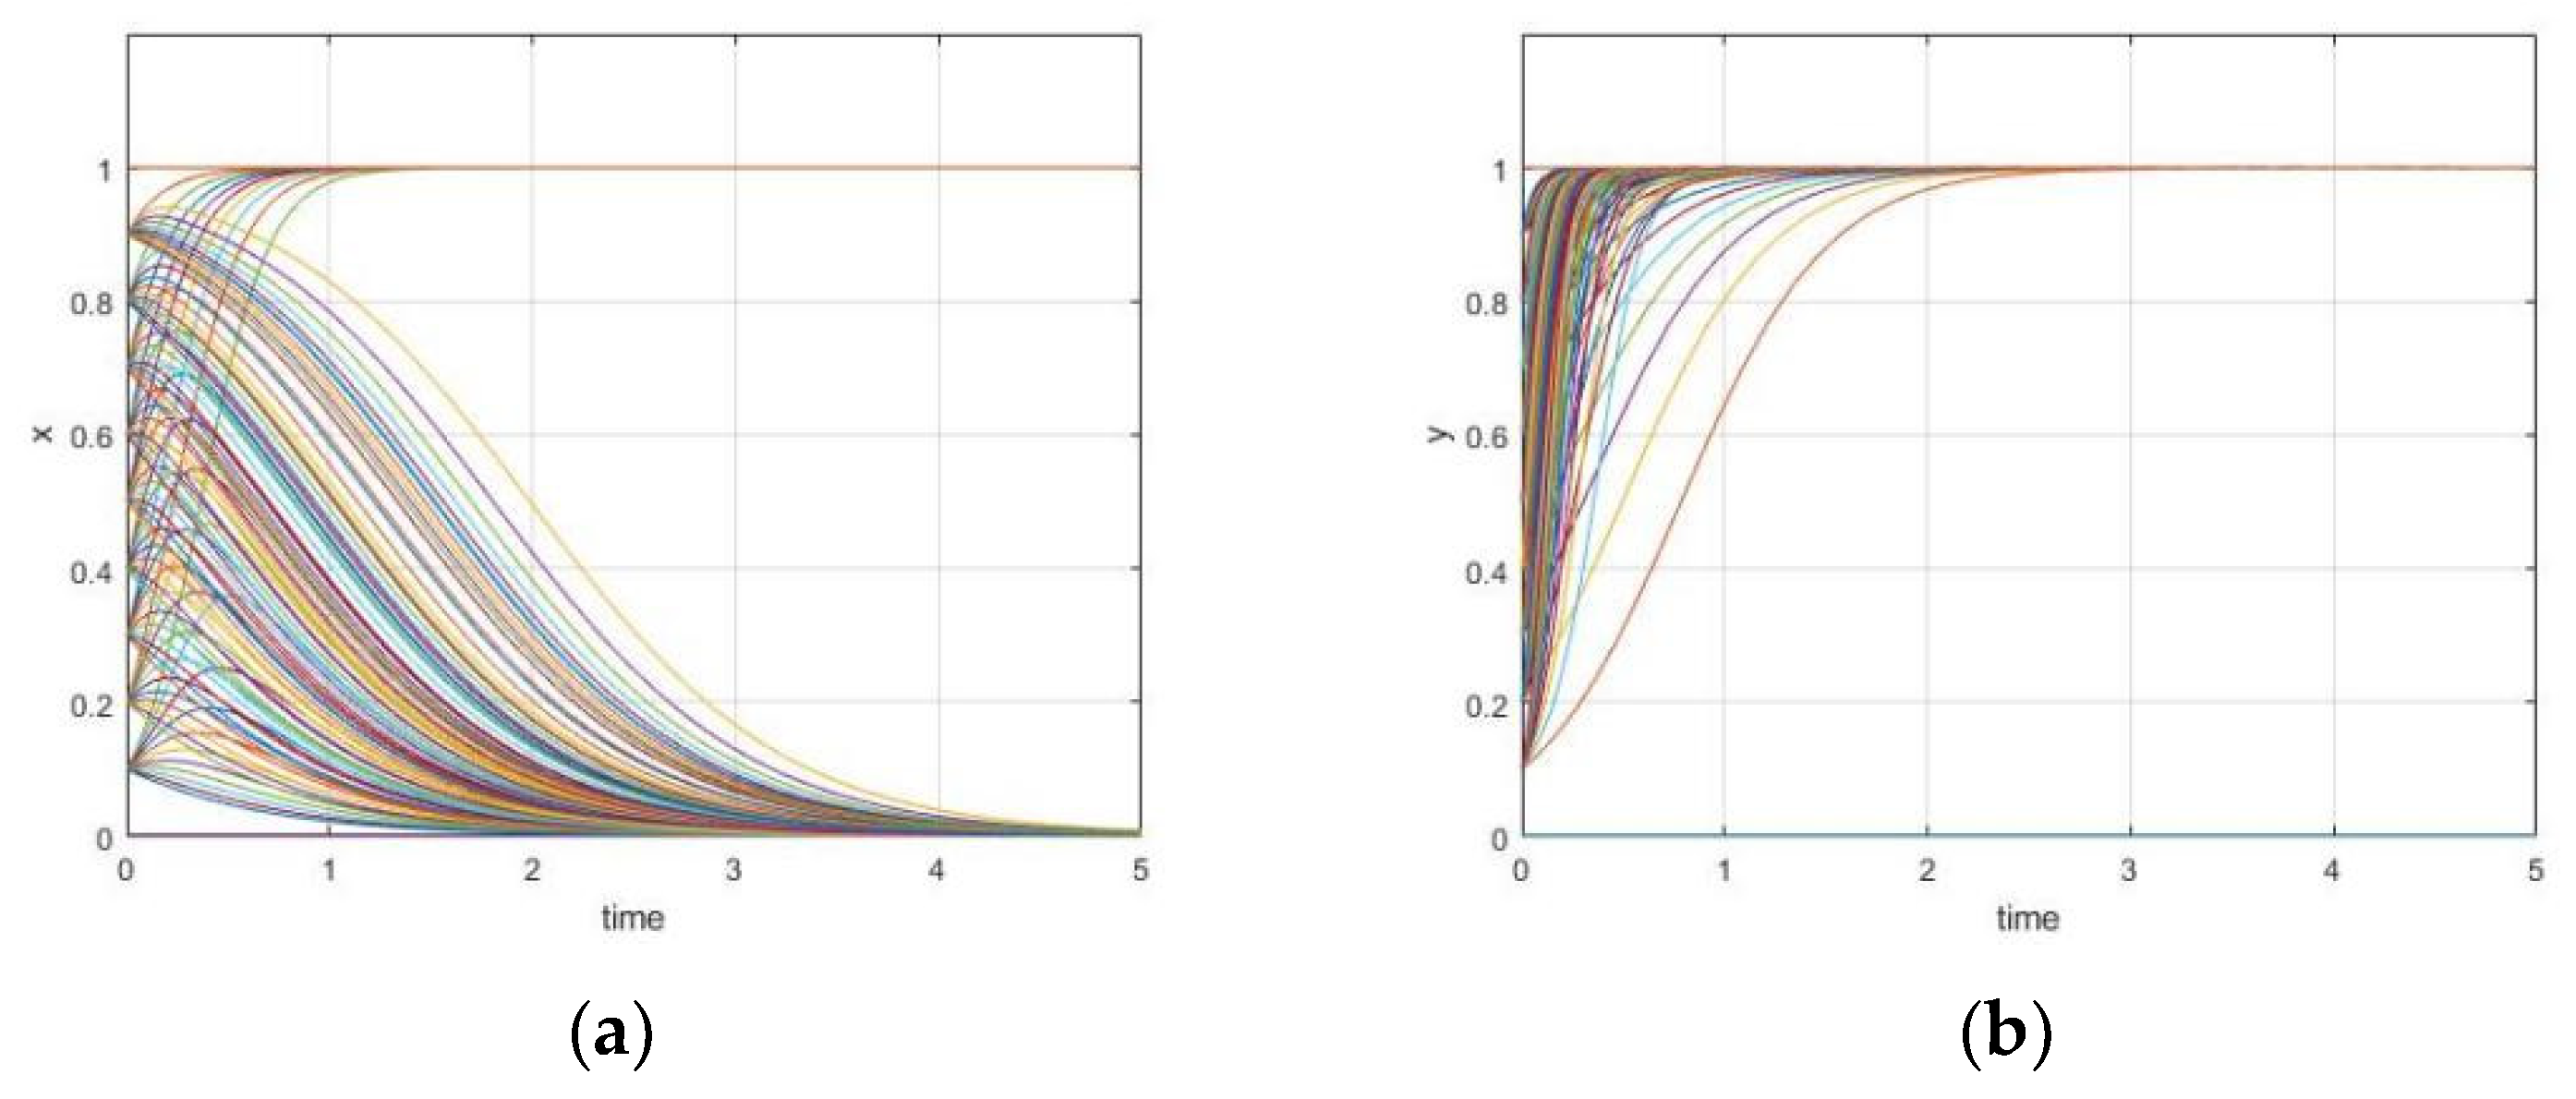
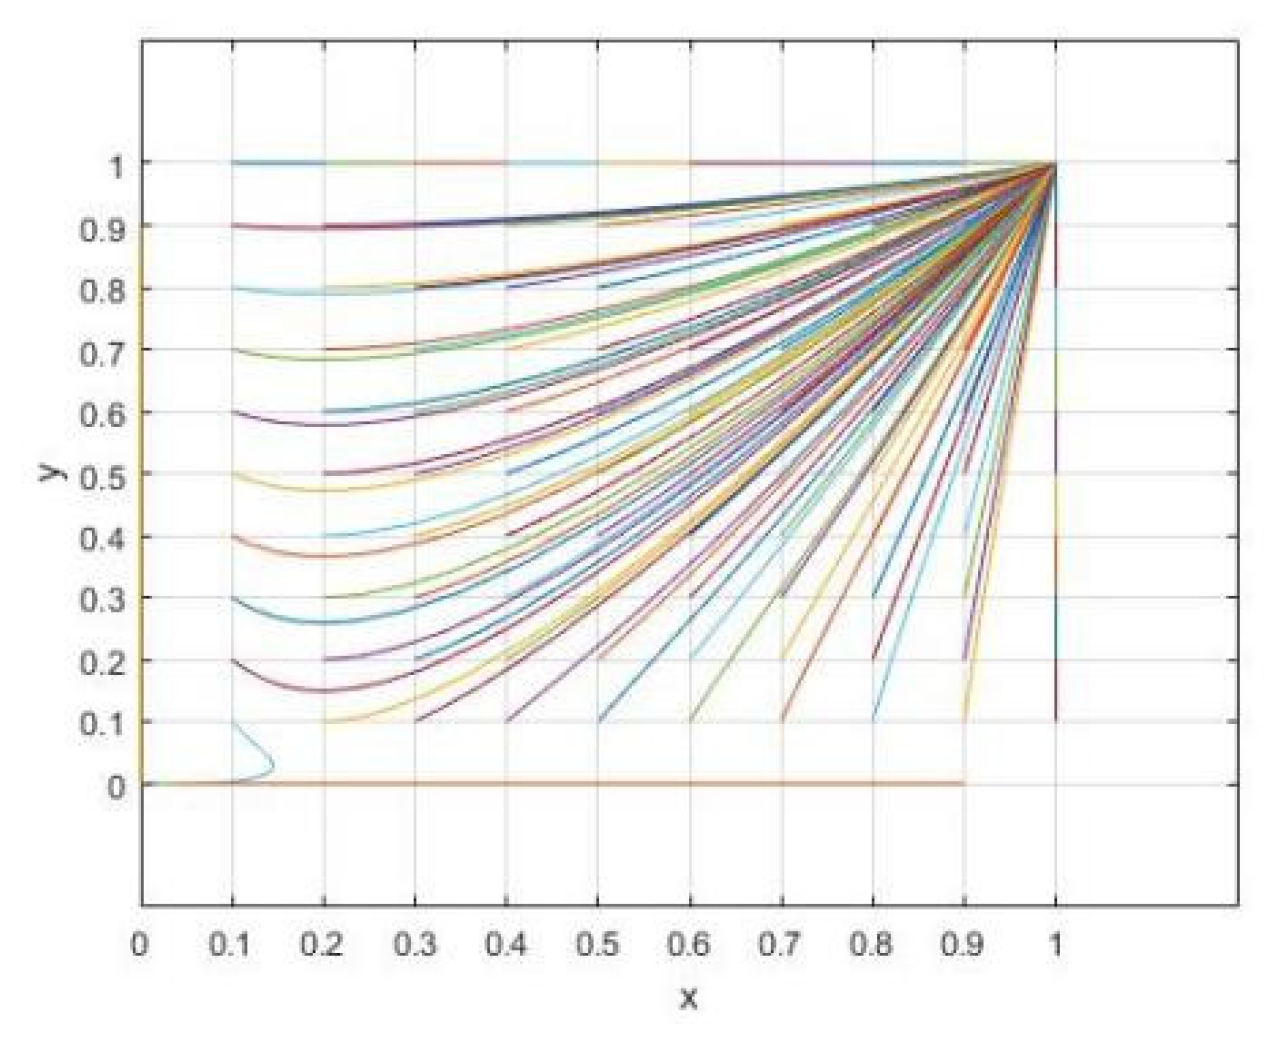
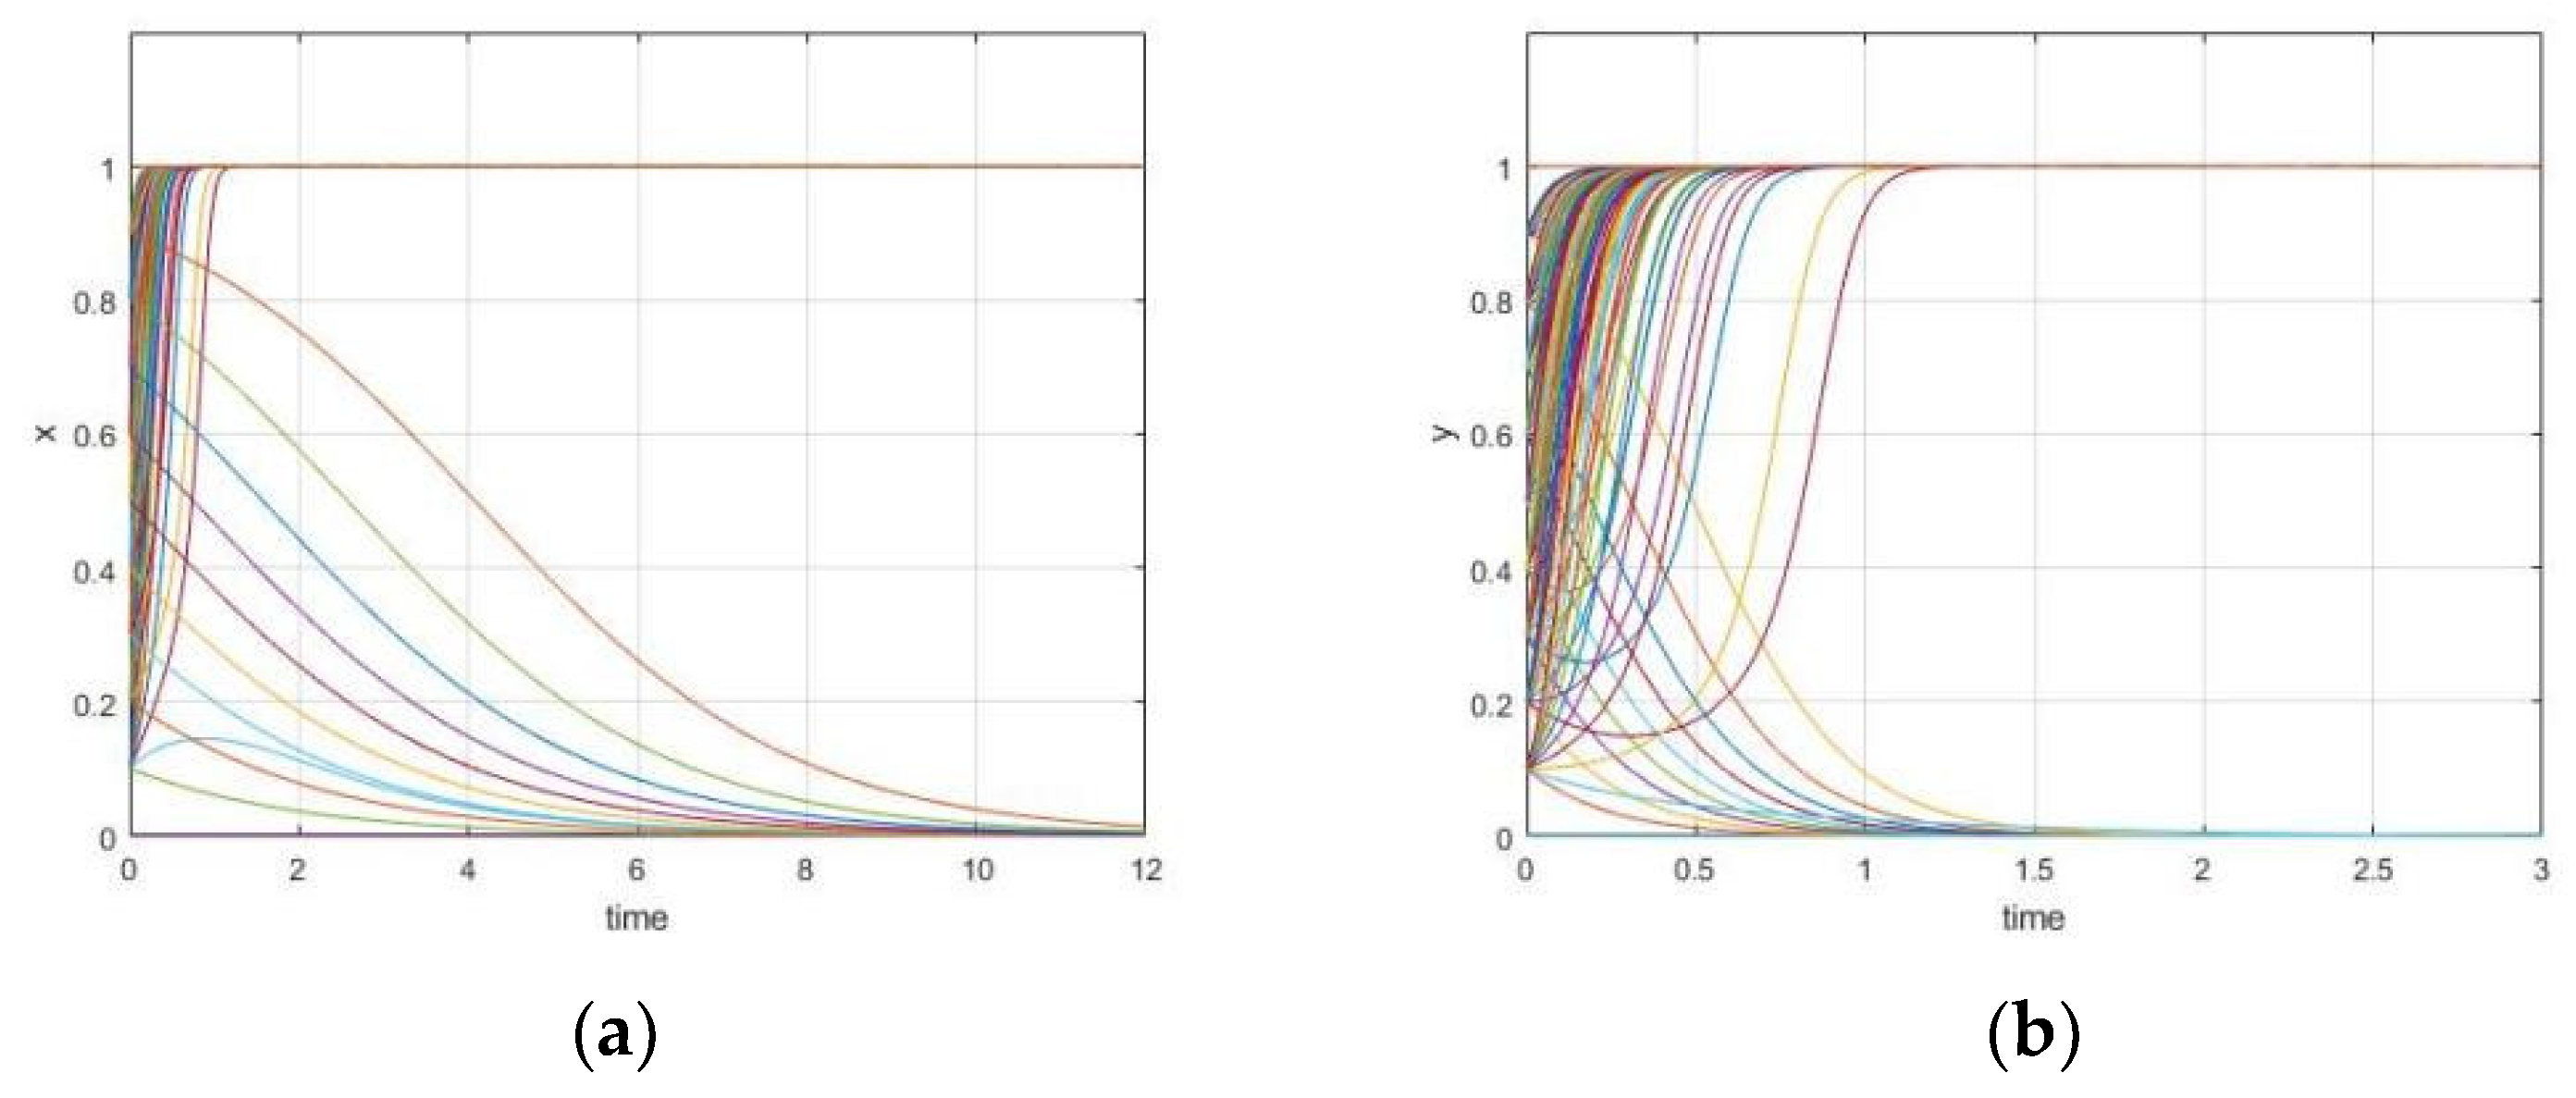
As industrialization and urbanization accelerate and zero-waste city pilots expand, the system may evolve toward a cooperative outcome in which the provincial government provides active guidance and the local government undertakes active implementation. The equilibrium (1,1) is locally asymptotically stable when CcCaRc + ZneL < 0 and ClCbIRlZmL < 0. To satisfy these stability conditions, parameter values are calibrated to reflect the institutional context. Let Rc = 25, Rl = 10, Cc = 10, Cl = 6, Z = 4, Ca = 7, Cb = 5, e = 2, m = 0.5, n = 0.8, L = 4, and I = 2. Figure 3 and Figure 4 present the simulation results under this parameterization. Over time, the provincial and local governments converge toward active guidance and active implementation. This convergence is driven by rising urban pollution-control costs and increasing economic and ecological losses associated with environmental pollution. As solid waste treatment technologies improve and industrial upgrading proceeds, implementation costs decline while incentive and penalty intensities increase. The zero-waste city approach can encourage the adoption of new technologies and innovative waste-management practices, which may generate new economic opportunities and support industrial restructuring. Under these conditions, incentive alignment can facilitate cooperation between provincial and local governments in advancing zero-waste city development, supporting environmental protection, sustainable development, and improvements in residents’ quality of life.
After successful pilots, scaling up zero-waste city development to nationwide implementation may encounter substantial challenges. These challenges include local fiscal constraints, weak policy enforcement in some cities, limited uptake of innovative solid waste treatment technologies, and monitoring and management difficulties arising from the large number of participating cities. Moreover, solid waste treatment typically involves a complex supply chain; weaknesses in collection, sorting, transport, and downstream utilization can undermine overall implementation. These constraints may weaken local governments’ implementation incentives and, consequently, hinder progress in zero-waste city development. The equilibrium (1,0) is locally asymptotically stable when ClIeL + meL < 0 and CbCl + I + Rl + Z + mL < 0. To satisfy these stability conditions, parameter values are calibrated to reflect the institutional context. Let Rc = 10, Rl = 2, Cc = 10, Cl = 9, Z = 1, Ca = 7, Cb = 1, e = 4, m = 0.1, n = 0.8, L = 2, and I = 2. Figure 5 and Figure 6 present the simulation results under this parameterization. Over time, the provincial government converges toward active guidance, whereas the local government converges toward non-implementation of zero-waste city measures. This pattern reflects relatively low local pollution-control costs and comparatively small economic and ecological losses from environmental pollution. At the same time, the expected implementation costs are high relative to the expected benefits. Moreover, provincial subsidies are insufficient to offset local costs, limiting their effectiveness in inducing active implementation.
After zero-waste city development reaches a mature stage, local governments have established robust solid waste management systems and accumulated implementation experience, with markedly improved monitoring and enforcement capacity. As innovative solid waste treatment technologies mature and industrial upgrading proceeds, the supply chain supporting zero-waste city implementation becomes more stable, creating jobs and fostering the circular economy. Urban environmental quality improves, and the government’s public image and policy credibility are strengthened. Under these conditions, even without provincial guidance, local governments can proactively implement zero-waste city policies, and effective solid waste utilization becomes routine. The equilibrium (0,1) is locally asymptotically stable when ClL + nL < 0 and CaCc + RcZ + neL < 0. To satisfy these stability conditions, parameter values are calibrated to reflect the institutional context. Let Rc = 7, Rl = 5, Cc = 5 Cl = 2, Z = 9, Ca = 3, Cb = 2, e = 2, m = 0.5, n = 0.2, L = 6, and I = 2. Figure 7 and Figure 8 present the simulation results under this parameterization. Over time, the provincial government converges toward non-guidance, whereas the local government converges toward active implementation of zero-waste city measures. This outcome is associated with the accumulation of local-implementation experience from earlier pilots and, in this parameterization, a higher level of provincial subsidies. Local governments can develop comprehensive governance arrangements for zero-waste city implementation, enabling progress in the local circular economy even in the absence of provincial financial support and oversight.

5. Model Optimization Under Prospect Theory

5.1. Value Perception Formula

Prospect theory is a behavioral framework that explains decision-making under risk and uncertainty. It posits that decisions are shaped, not only by objective outcomes, but also by subjective value perceptions and systematic behavioral regularities. Specifically, individuals evaluate choices in terms of gains and losses relative to a reference point rather than in terms of final outcomes [24]. This framework is particularly relevant for modeling the interactions between provincial and local governments in zero-waste city development because it captures bounded rationality and behavioral decision features related to subjective evaluation under uncertainty on both sides. Embedding prospect theory in the evolutionary game model enables a more nuanced account of strategic behavior and yields policy-relevant insights for improving cooperative outcomes.
Classical evolutionary game theory is grounded in expected utility theory, which assumes that agents behave with bounded rationality and make decisions to maximize their expected payoff. However, traditional game-theoretic models do not account for subjective perception mechanisms, such as risk preferences and reference-dependent evaluation. Prospect theory emphasizes that individuals evaluate gains and losses relative to a reference point rather than in absolute terms [25].
In this study, the prospect value V captures each player’s subjectively perceived payoff under a given strategy profile. It is defined as the product of a value function v(Δωi) and a probability weighting function π(pi), where pi denotes the perceived likelihood of the corresponding outcome. This relationship is expressed as:
V = i π p i v Δ ω i   v Δ ω i = { Δ ω i α , Δ ω i 0 λ Δ ω i β , Δ ω i < 0   π p i = p γ p γ + ( 1 p ) γ 1 / γ
where α and β are value function curvature parameters describing risk attitudes in gains and losses, indicating the marginal decreasing degree of the perceived value of loss and gain between the two sides of the game; larger values indicate a stronger degree of diminishing sensitivity. λ is the loss aversion coefficient of the actors, capturing actors’ sensitivity to losses; a larger λ implies greater loss sensitivity for both players. Let pi denote the probability of outcome i. Under prospect theory, low-probability events tend to be overweighted, whereas high-probability events tend to be underweighted. Formally, π(p) < p for large p and π(p) > p for small p, with π(0) = 0, and π(1) = 1. Accordingly, different strategy profiles between the provincial and local governments generate different realized gains and losses and, consequently, different cumulative prospect values.
Taking mutual cooperation as the reference point, we simplify the analysis by assuming that the external environment remains unchanged throughout zero-waste city development and that no additional decision-making bodies are involved beyond the provincial and local governments, who exhibit bounded rationality. Under these assumptions, strategic choices are guided not by objective payoffs alone, but by subjective evaluations of policy outcomes, as represented in the prospect theory value function.

5.2. Model Assumptions Under Prospect Theory

To simplify the analysis, we take mutual cooperation between provincial and local governments as the reference point. It is assumed that throughout zero-waste city development, the external environment remains stable, and no additional stakeholders are involved. Accordingly, the model focuses exclusively on the two primary actors, the provincial government and the local government, both of whom are boundedly rational and make decisions not only on objective payoffs, but also on psychological perceived values as described by prospect theory.
Under prospect theory, the prospect value of each party can be expressed as the product of a value function and a probability weighting function. For deterministic outcomes, probability weighting introduces no distortion, so perceived and objective evaluations coincide. In this model, the costs of pollution control and the implementation costs of zero-waste cities (Cc, Cl, Ca, Cb) are treated as deterministic fiscal expenditures and are therefore assumed to be objectively given.
By contrast, under uncertainty, gains and losses are evaluated relative to a reference point rather than in absolute terms. These include: economic benefits, improvements in government reputation, and pollution-control cost savings; ecological and economic losses due to environmental degradation, which depend on local environmental resource endowments; penalties imposed on the local government for failing to actively implement zero-waste city initiatives; and subsidies provided by the provincial government, which must be negotiated and are thus uncertain in both magnitude and timing.
Consequently, Rc, Rl, Z, I, and L are variables subject to subjective evaluation under uncertainty, whereas Cc, Cl, Ca, and Cb remain objective and deterministic. Table 4 reports the prospect-adjusted payoff matrix, whereas Table 5 summarizes the parameters and their definitions. This framework enables the model to capture both the objective economic dynamics and the subjective psychological drivers that jointly shape the strategic evolution of the provincial and local governments in zero-waste city initiatives.
By solving for parameters with value perception and bringing them into F(x) and F(y), we obtain, among others, the following,
V(−L) = π(P1)v(−L) + π(1 − P1)v(0) = −λ(L)β
V(−I) = π(P1)v(−I) + π(1 − P1)v(0) = −λ(I)β
V(I) = π(P1)v(I) + π(1 − P1)v(I) = (I)α
V(Rc) = π(P1)v(Rc) + π(1 − P1)v(0) = (Rc)α
V(Rl) = π(P1)v(Rl) + π(1 − P1)v(0) = (Rl)α
V(Z) = π(P1)v(Z) + π(1 − P1)v(0) = (Z)α
V(−Z) = π(P1)v(−Z) + π(1 − P1)v(0) = −λ(Z)β
F(x) = −x(x − 1)((I)α − Cl + Cay − Ccy + Cly − (I)αy − λ(Z)βy + λ(L)βe + (Rc)αy − λ(L)βem − λ(L)βey + λ(L)βemy + λ(L)βeny)
F(y) = −y(y − 1)(λ(L)β − Cl + Cbx + λ(I)βx + (Z)αx − λ(L)βn − λ(L)βx + (Rl)αx + λ(L)βmx + λ(L)βnx)

5.3. Parameter Simulation of Stability Point

At present, zero-waste city development in China is primarily driven by cooperative interactions between provincial and local governments. Pilot cities and regions are actively exploring policy frameworks, market mechanisms, technological innovations, and regulatory instruments to develop governance models that are both replicable and scalable [26]. As pilot projects expand toward broader implementation, several provinces, including Guangdong, Jilin, and Zhejiang, have introduced policy measures to further support the zero-waste city development. During the 14th Five-Year Plan period, the policy emphasis is expected to shift toward province-wide and cross-regional coordination, marking a critical transition from localized experimentation to broader diffusion.
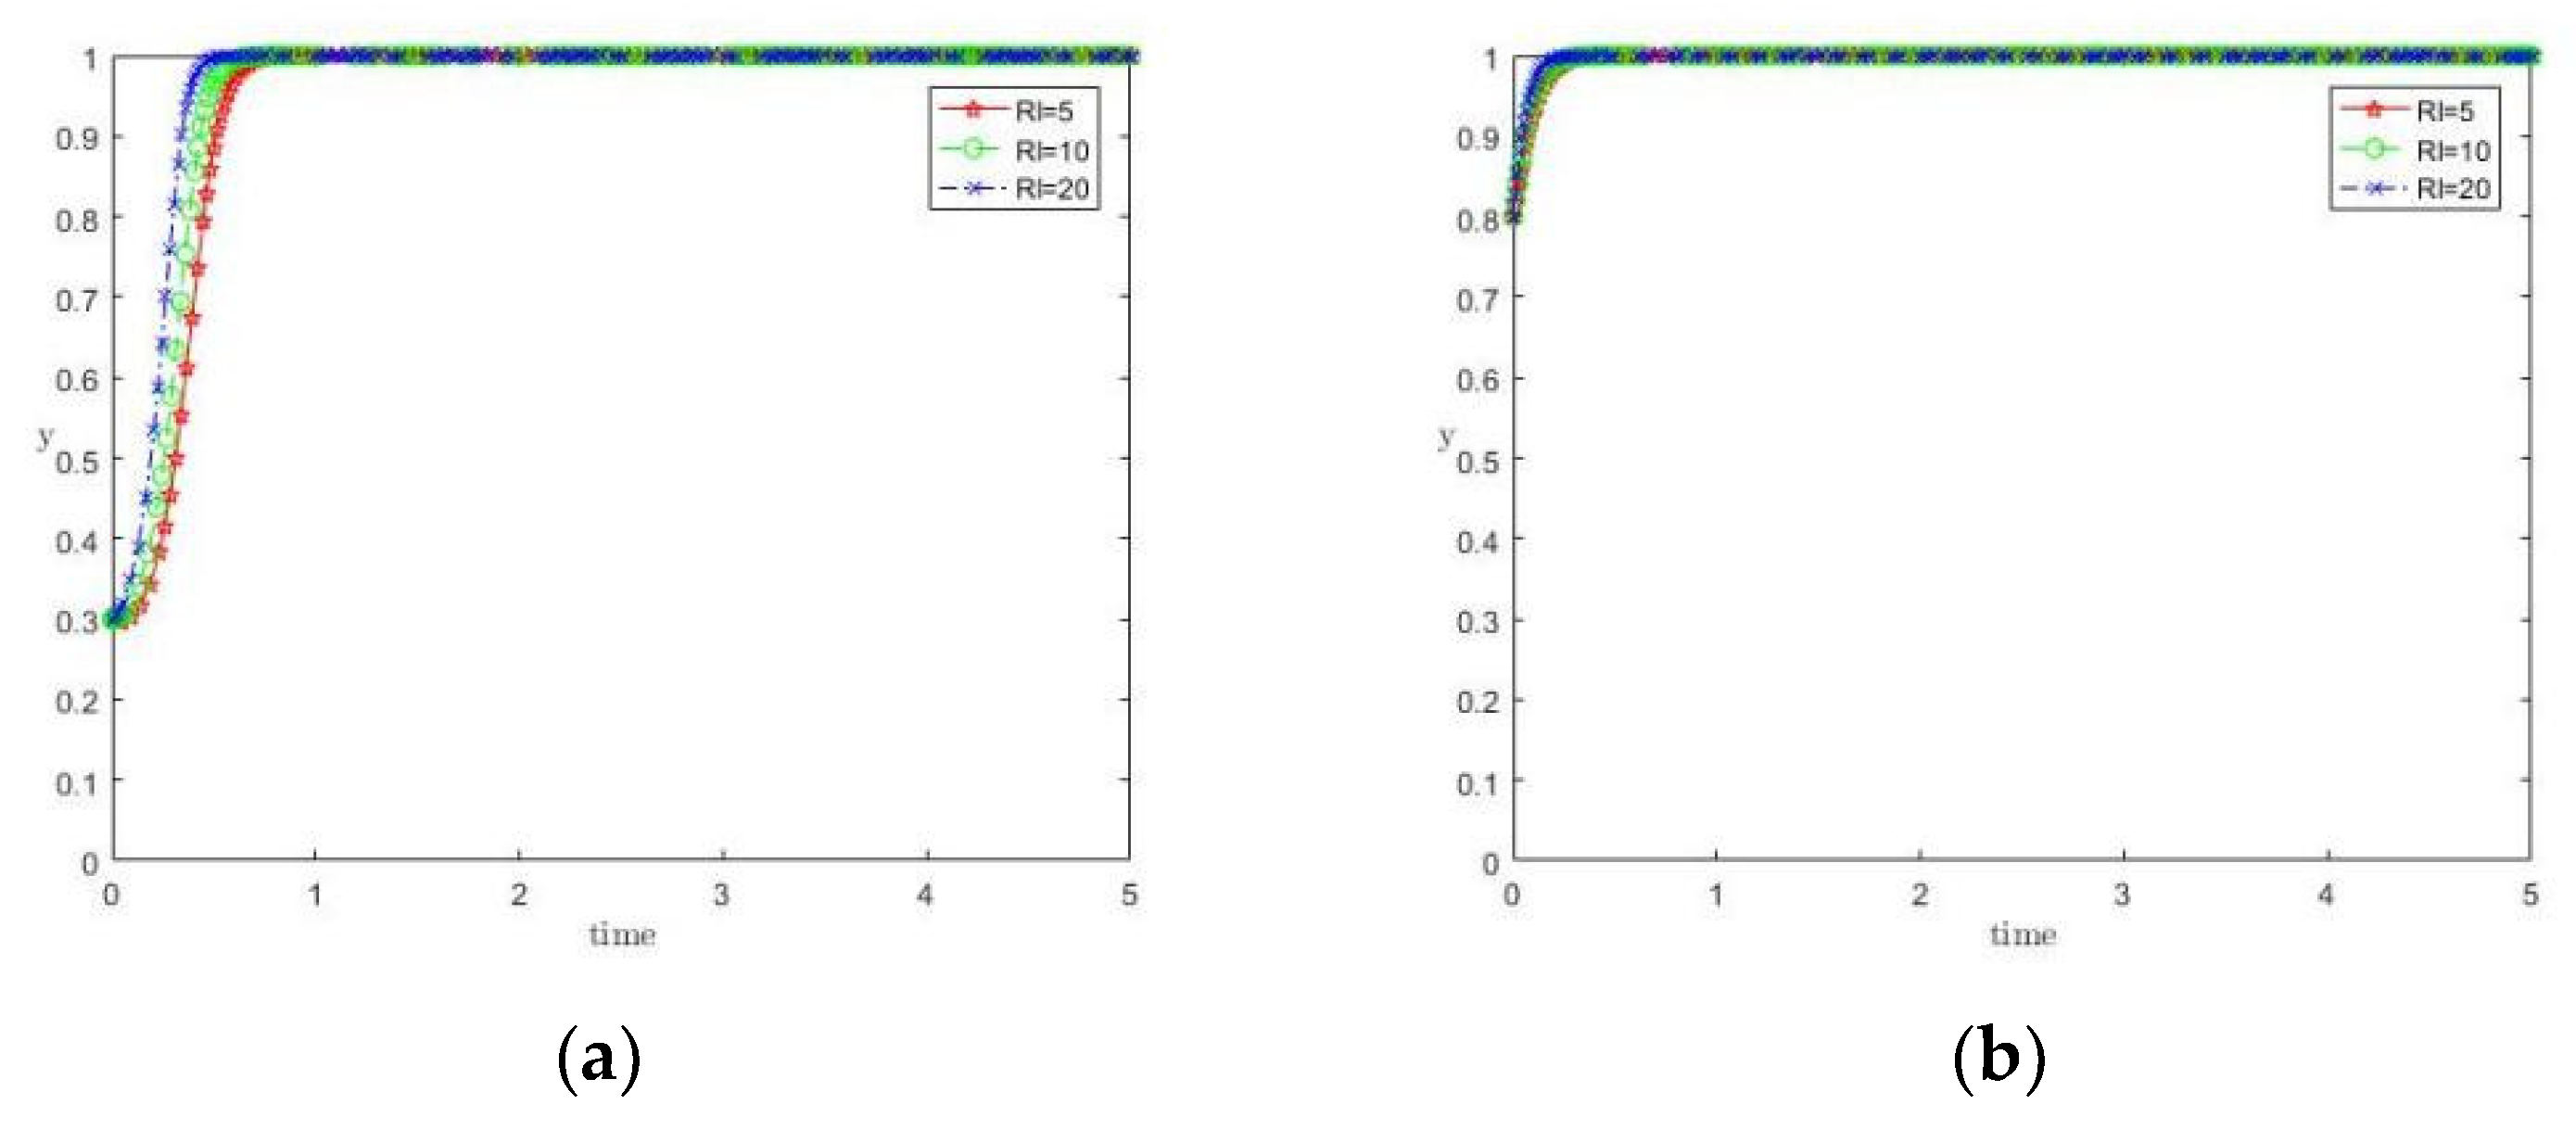
Within the evolutionary game framework, the equilibrium (1,1) represents the ideal scenario in which both provincial and local governments actively cooperate to advance zero-waste city development. This equilibrium is of particular importance as it corresponds to the intended outcome of cooperative governance. To examine the stability and sensitivity of this equilibrium, numerical simulations were conducted under prospect theory using MATLAB 2016. Parameters were initially set as λ = 2.25 and α = β = 0.88 while holding other parameters at their baseline levels, as illustrated in Figure 9 and Figure 10.

5.4. Simulation of Some Important Parameters

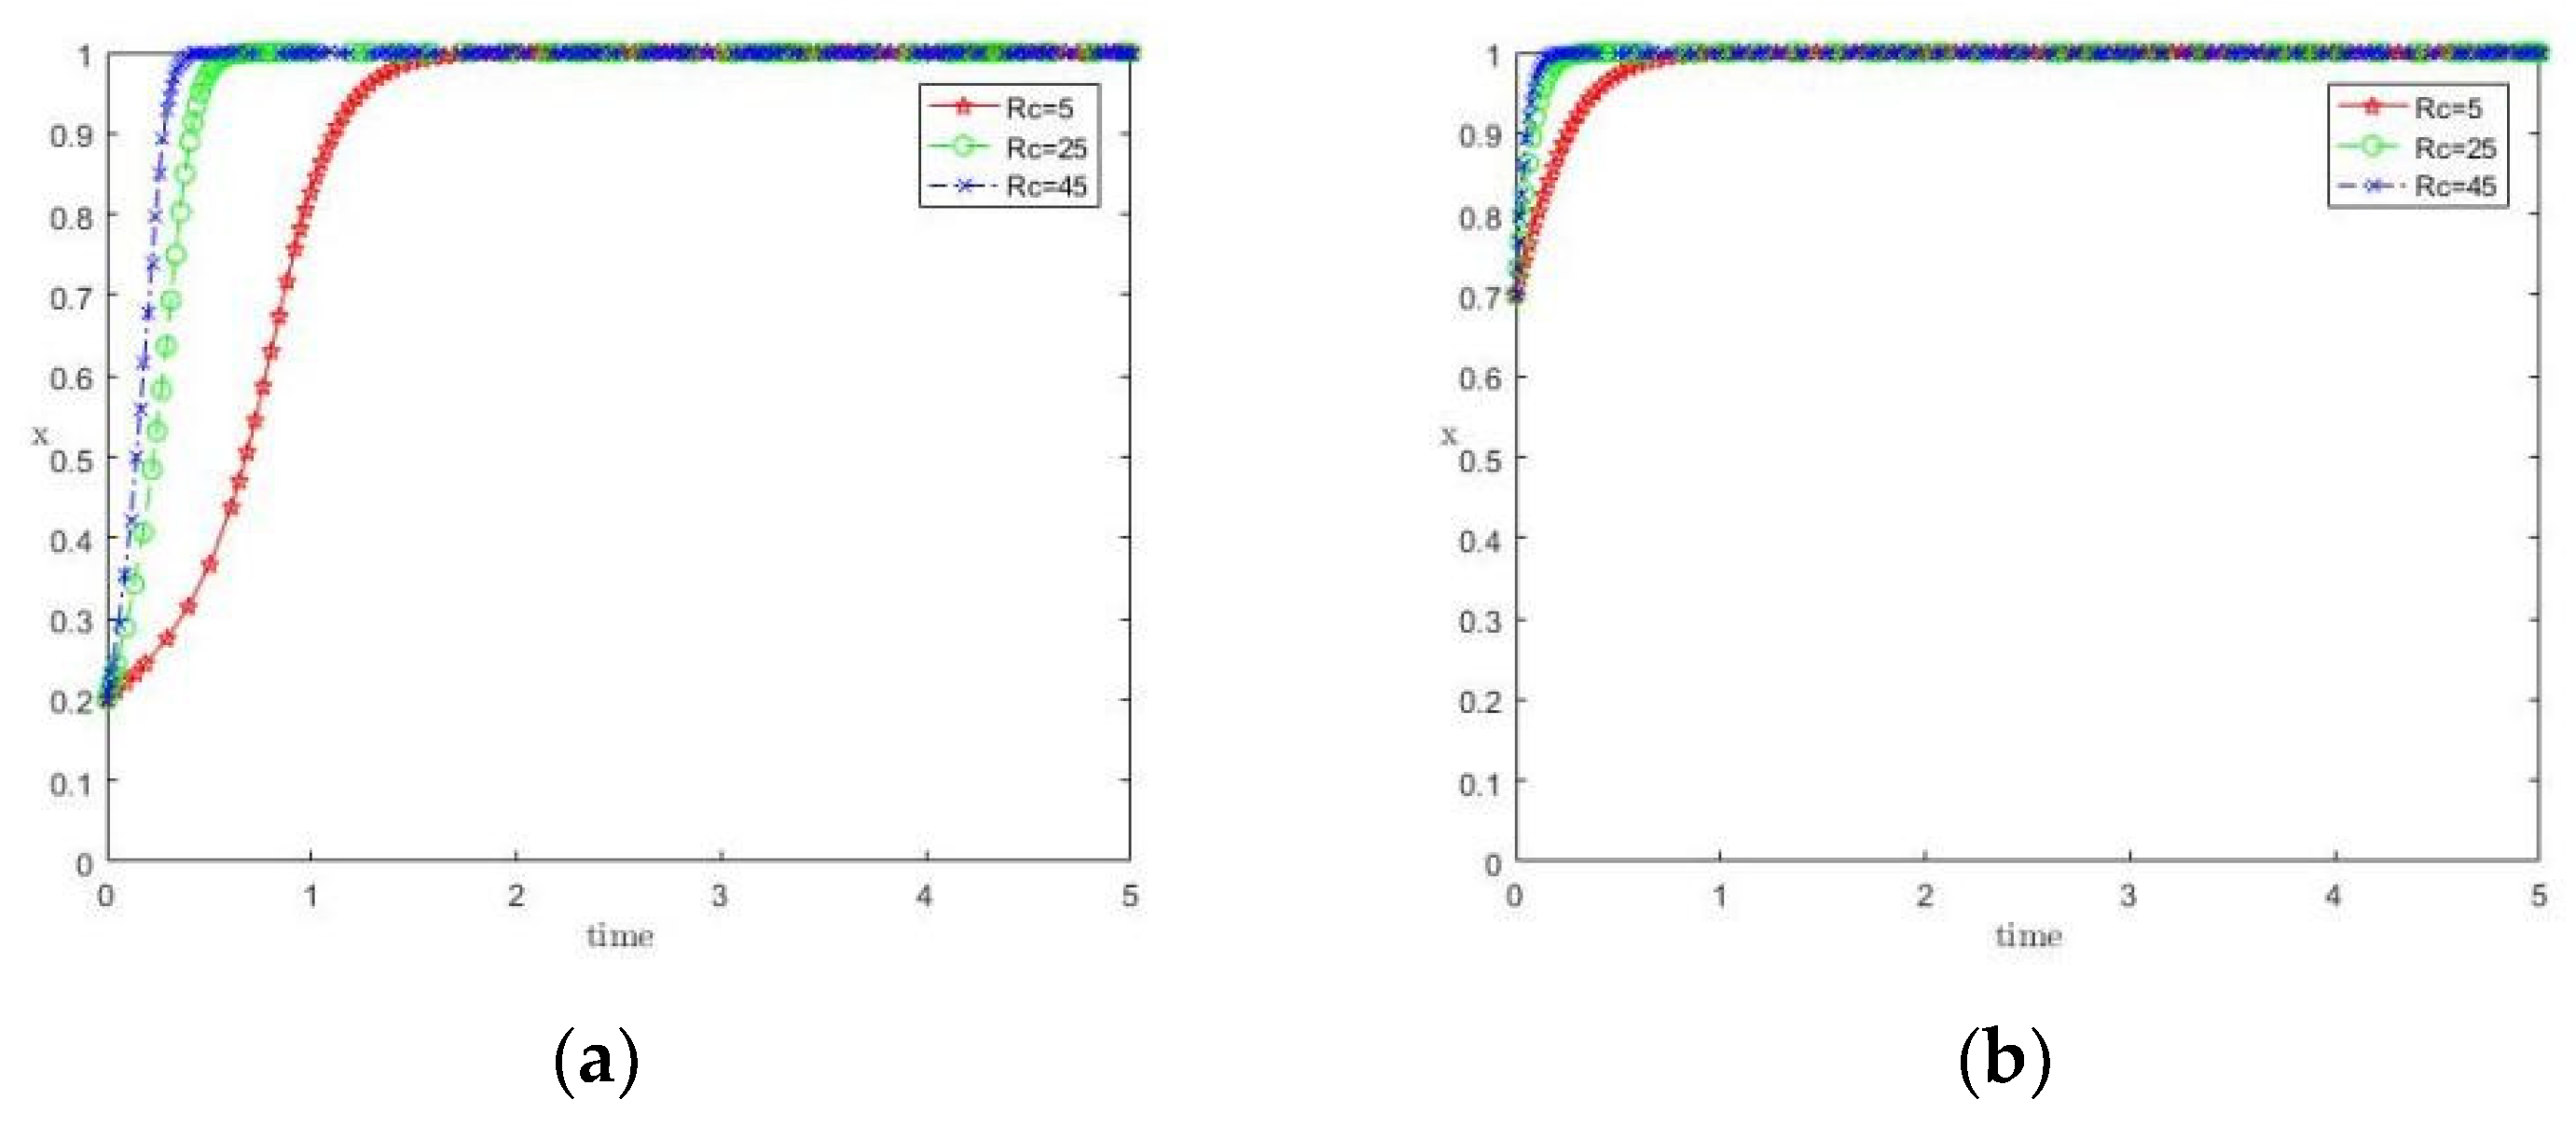
As shown in Figure 11, the provincial government’s perceived benefits Rc varied across three levels: 5, 25, and 45. The results indicate that higher perceived benefits significantly increase the provincial government’s propensity to adopt the active guidance strategy, indicating a clear positive relationship. This effect is particularly pronounced under low-probability weighting, where a lower Rc delays the provincial government’s transition toward active guidance.
These results suggest that enhancing provincial government’s recognition of the long-term economic and reputational returns of zero-waste initiatives is essential to incentivize proactive leadership.
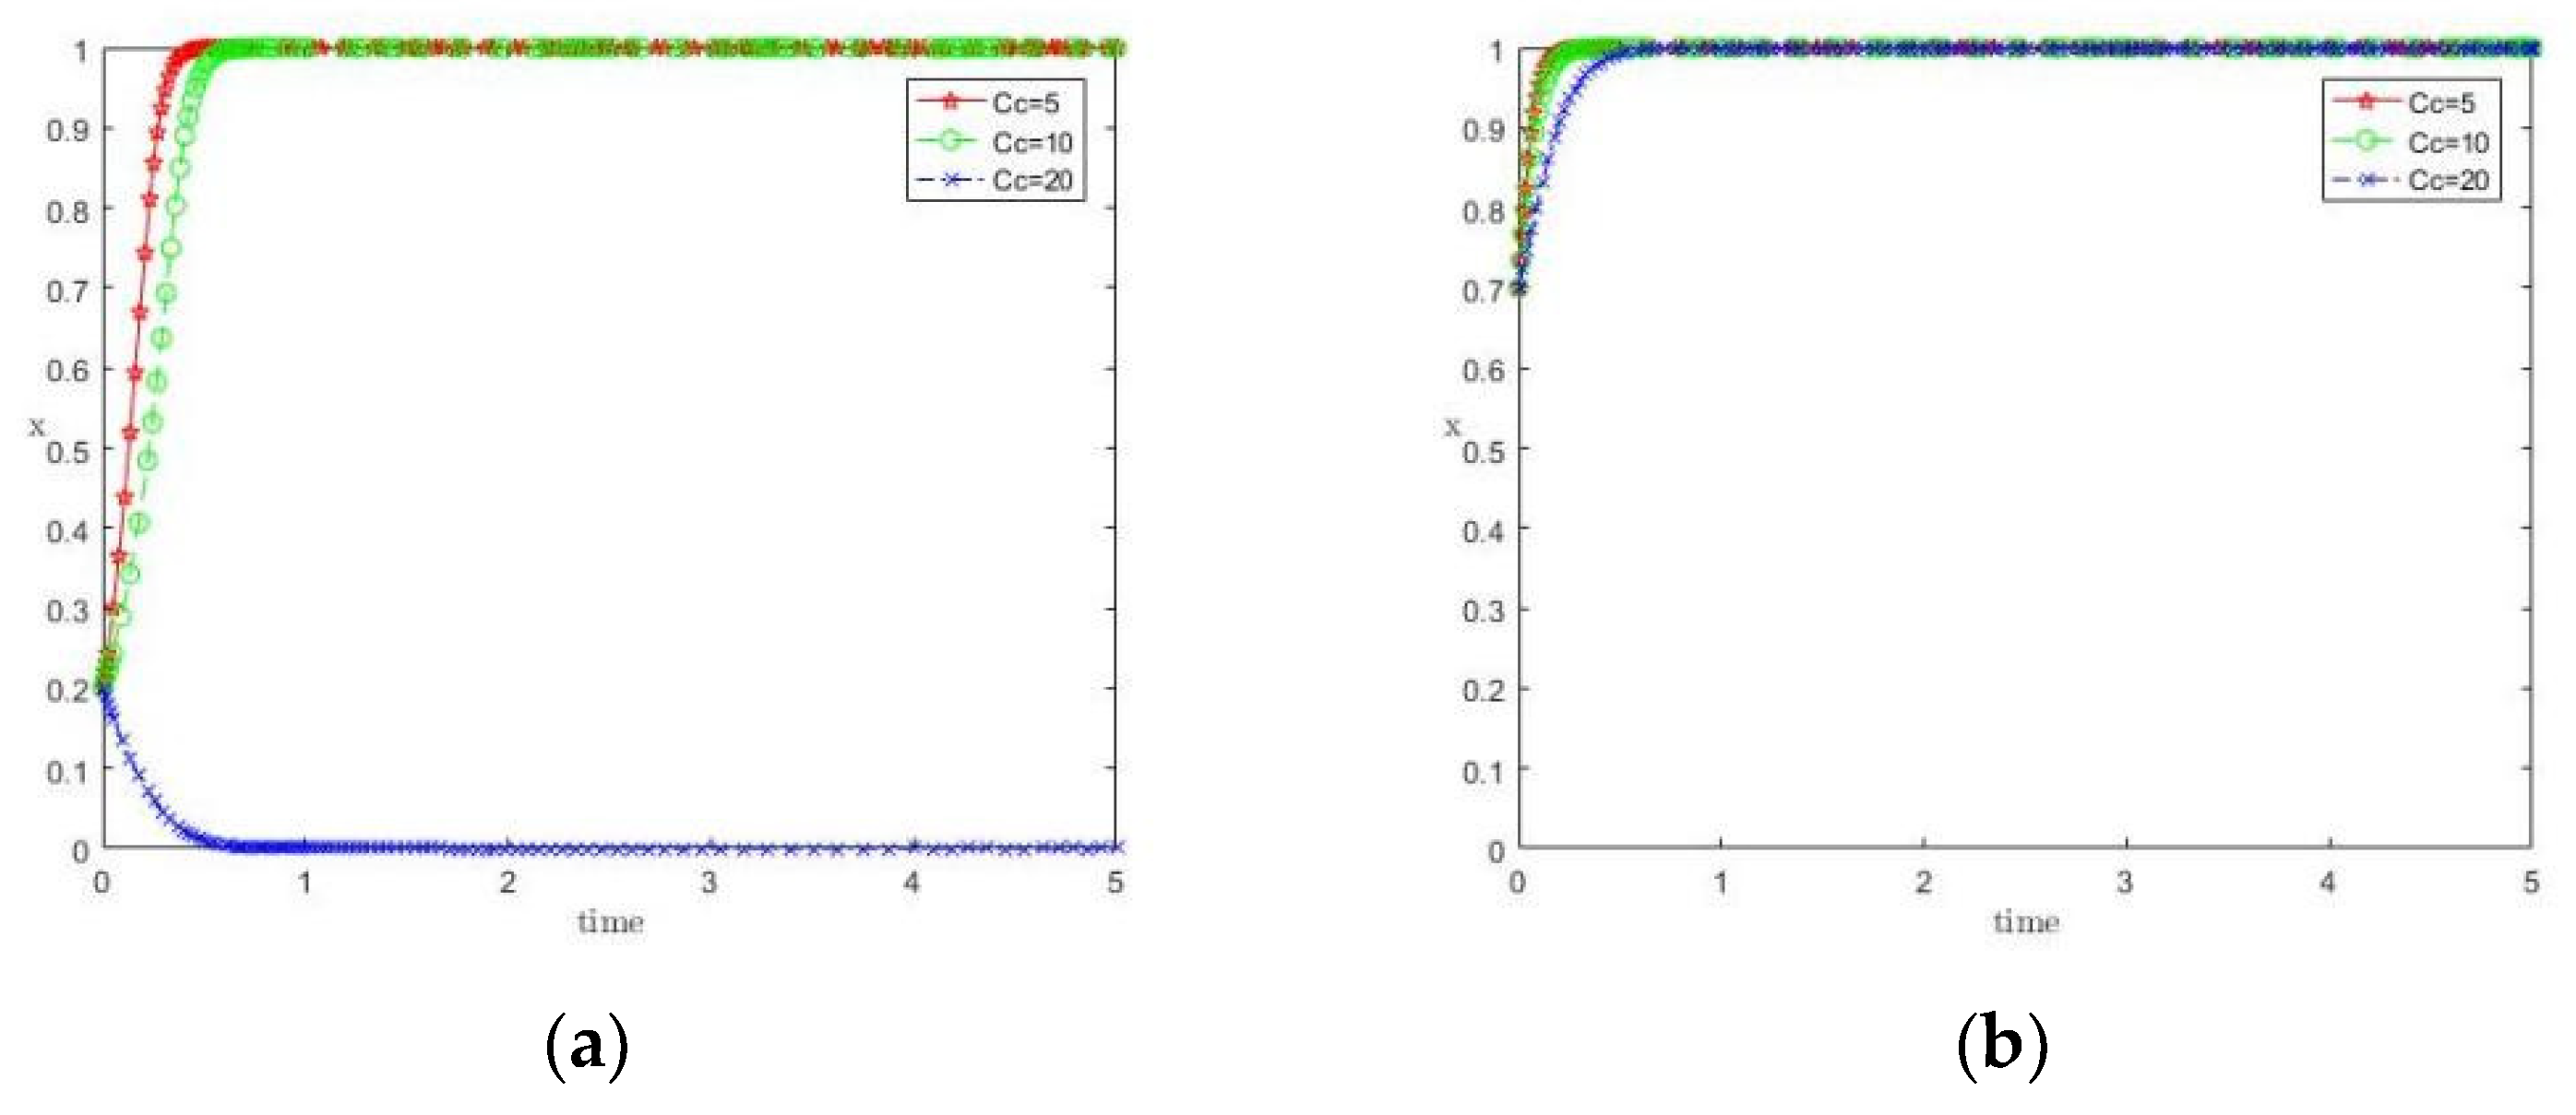
In Figure 12, the provincial government’s implementation cost Cc is examined at values of 5, 10, and 20. As Cc increases, the provincial government’s preference for active guidance declines steadily, indicating a negative relationship.
Under low-probability weighting, a higher Cc shifts the provincial government toward non-guidance strategies, indicating that excessive upfront investments may discourage provincial governments from initiating large-scale programs without external fiscal support.
Figure 13 examines the local government’s perceived benefit Rl under values of 5, 10, and 20. As Rl increases, local governments display a stronger inclination to adopt active implementation, with a positive relationship in both probability groups.
The effect is more pronounced in the low-probability weighting, suggesting that perceived benefits are critical in motivating initially reluctant local governments.
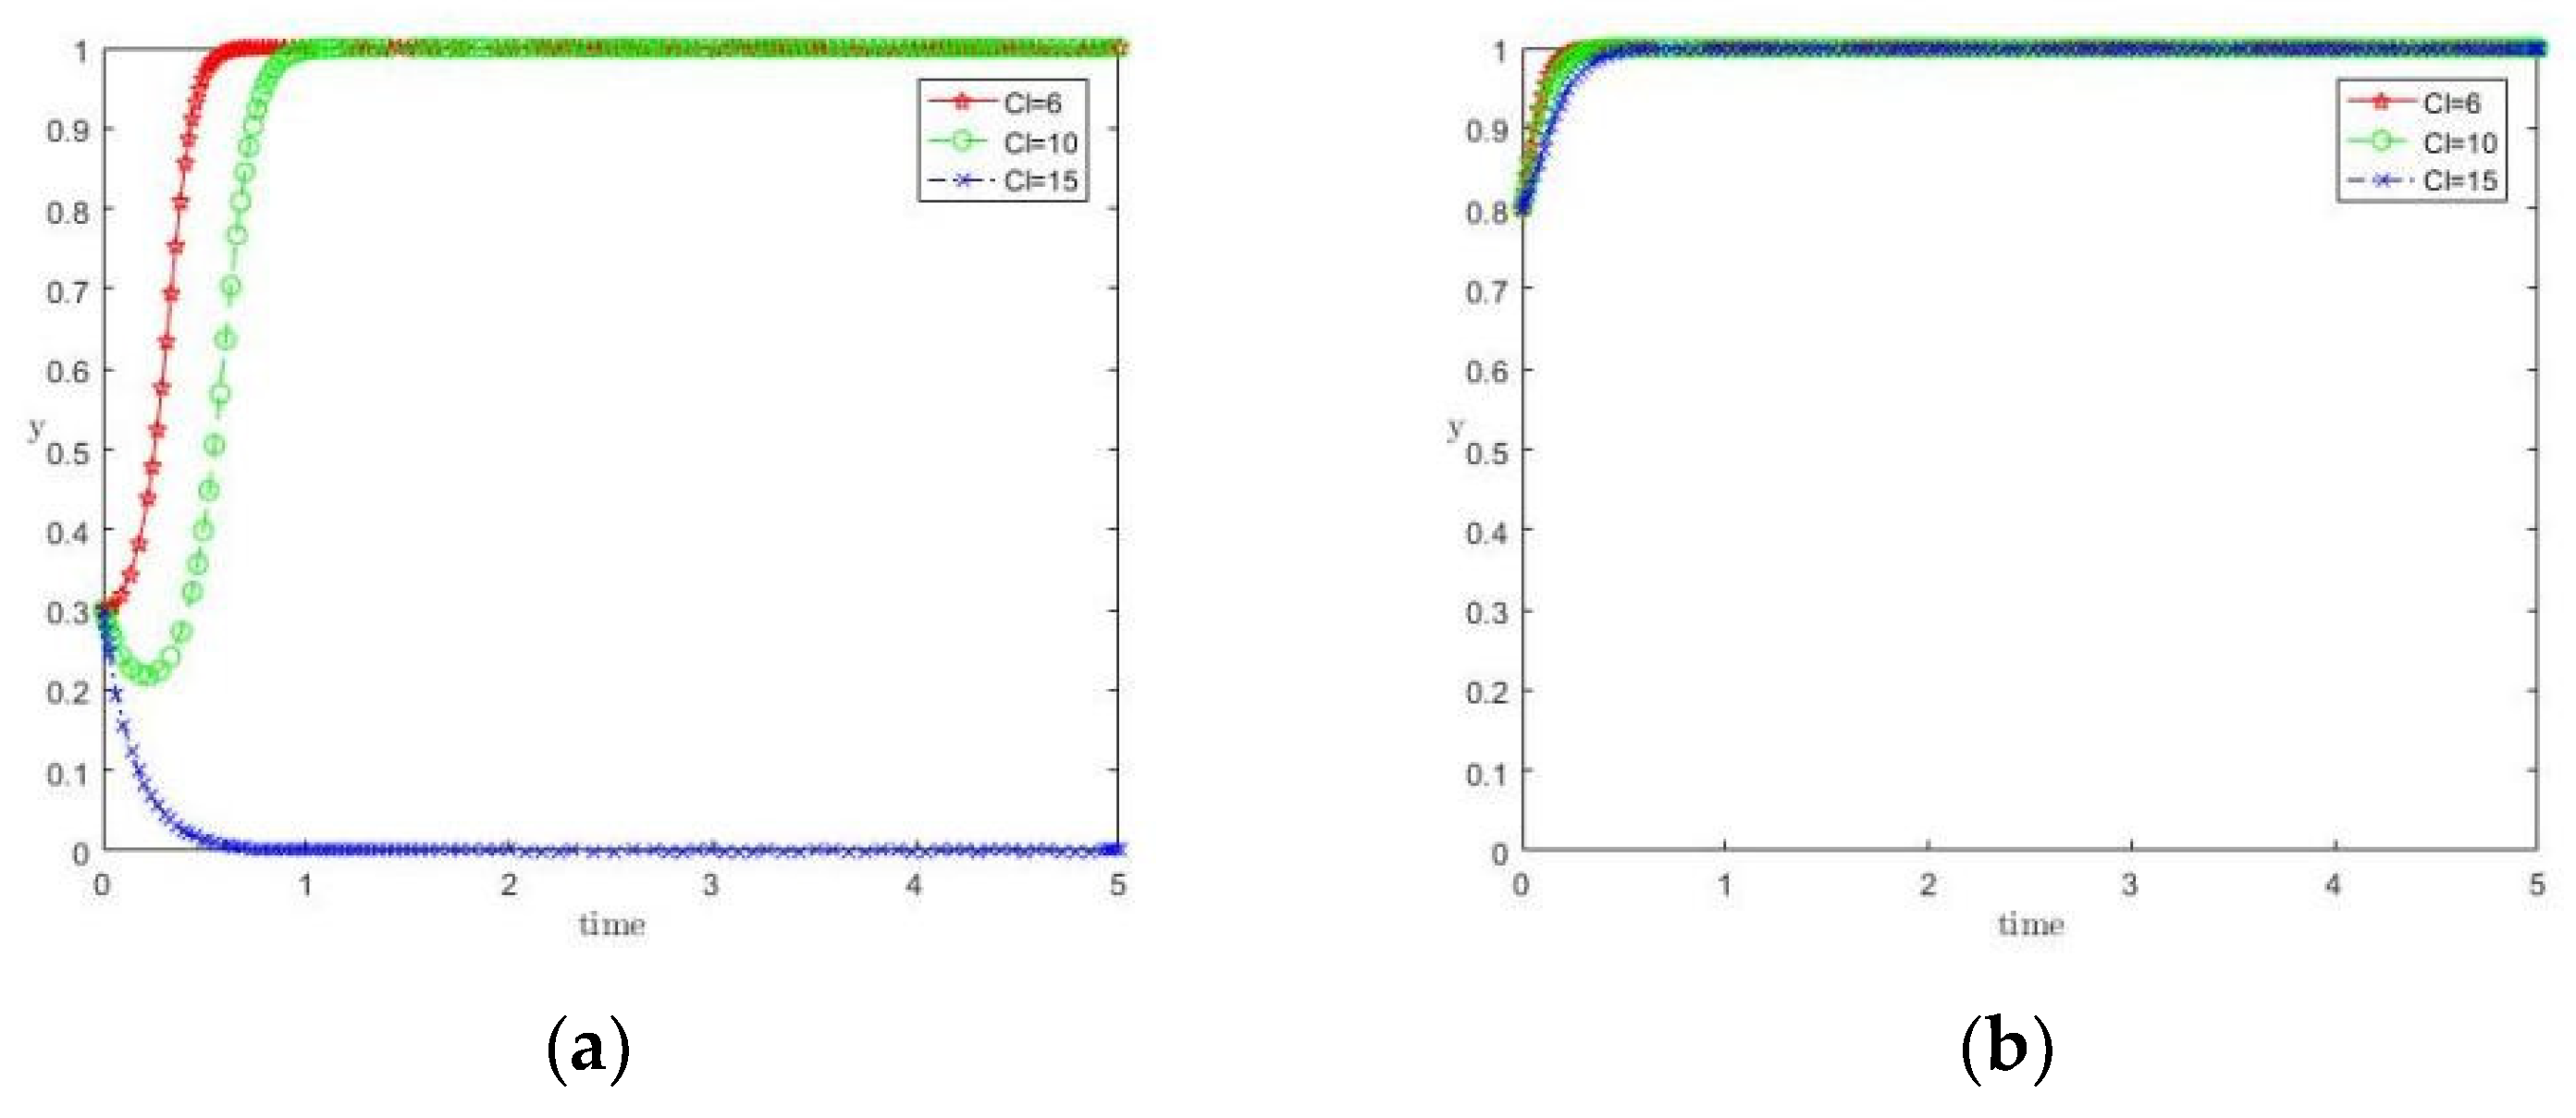
In Figure 14, Cl was set to 6, 10, and 15. As implementation costs increase, local governments are less likely to adopt the active implementation strategy, indicating a clear negative relationship between implementation costs and participation incentives.
This effect is strongest under low-probability weighting, where high costs can substantially deter participation, highlighting the importance of targeted subsidies and fiscal support to reduce local implementation barriers.
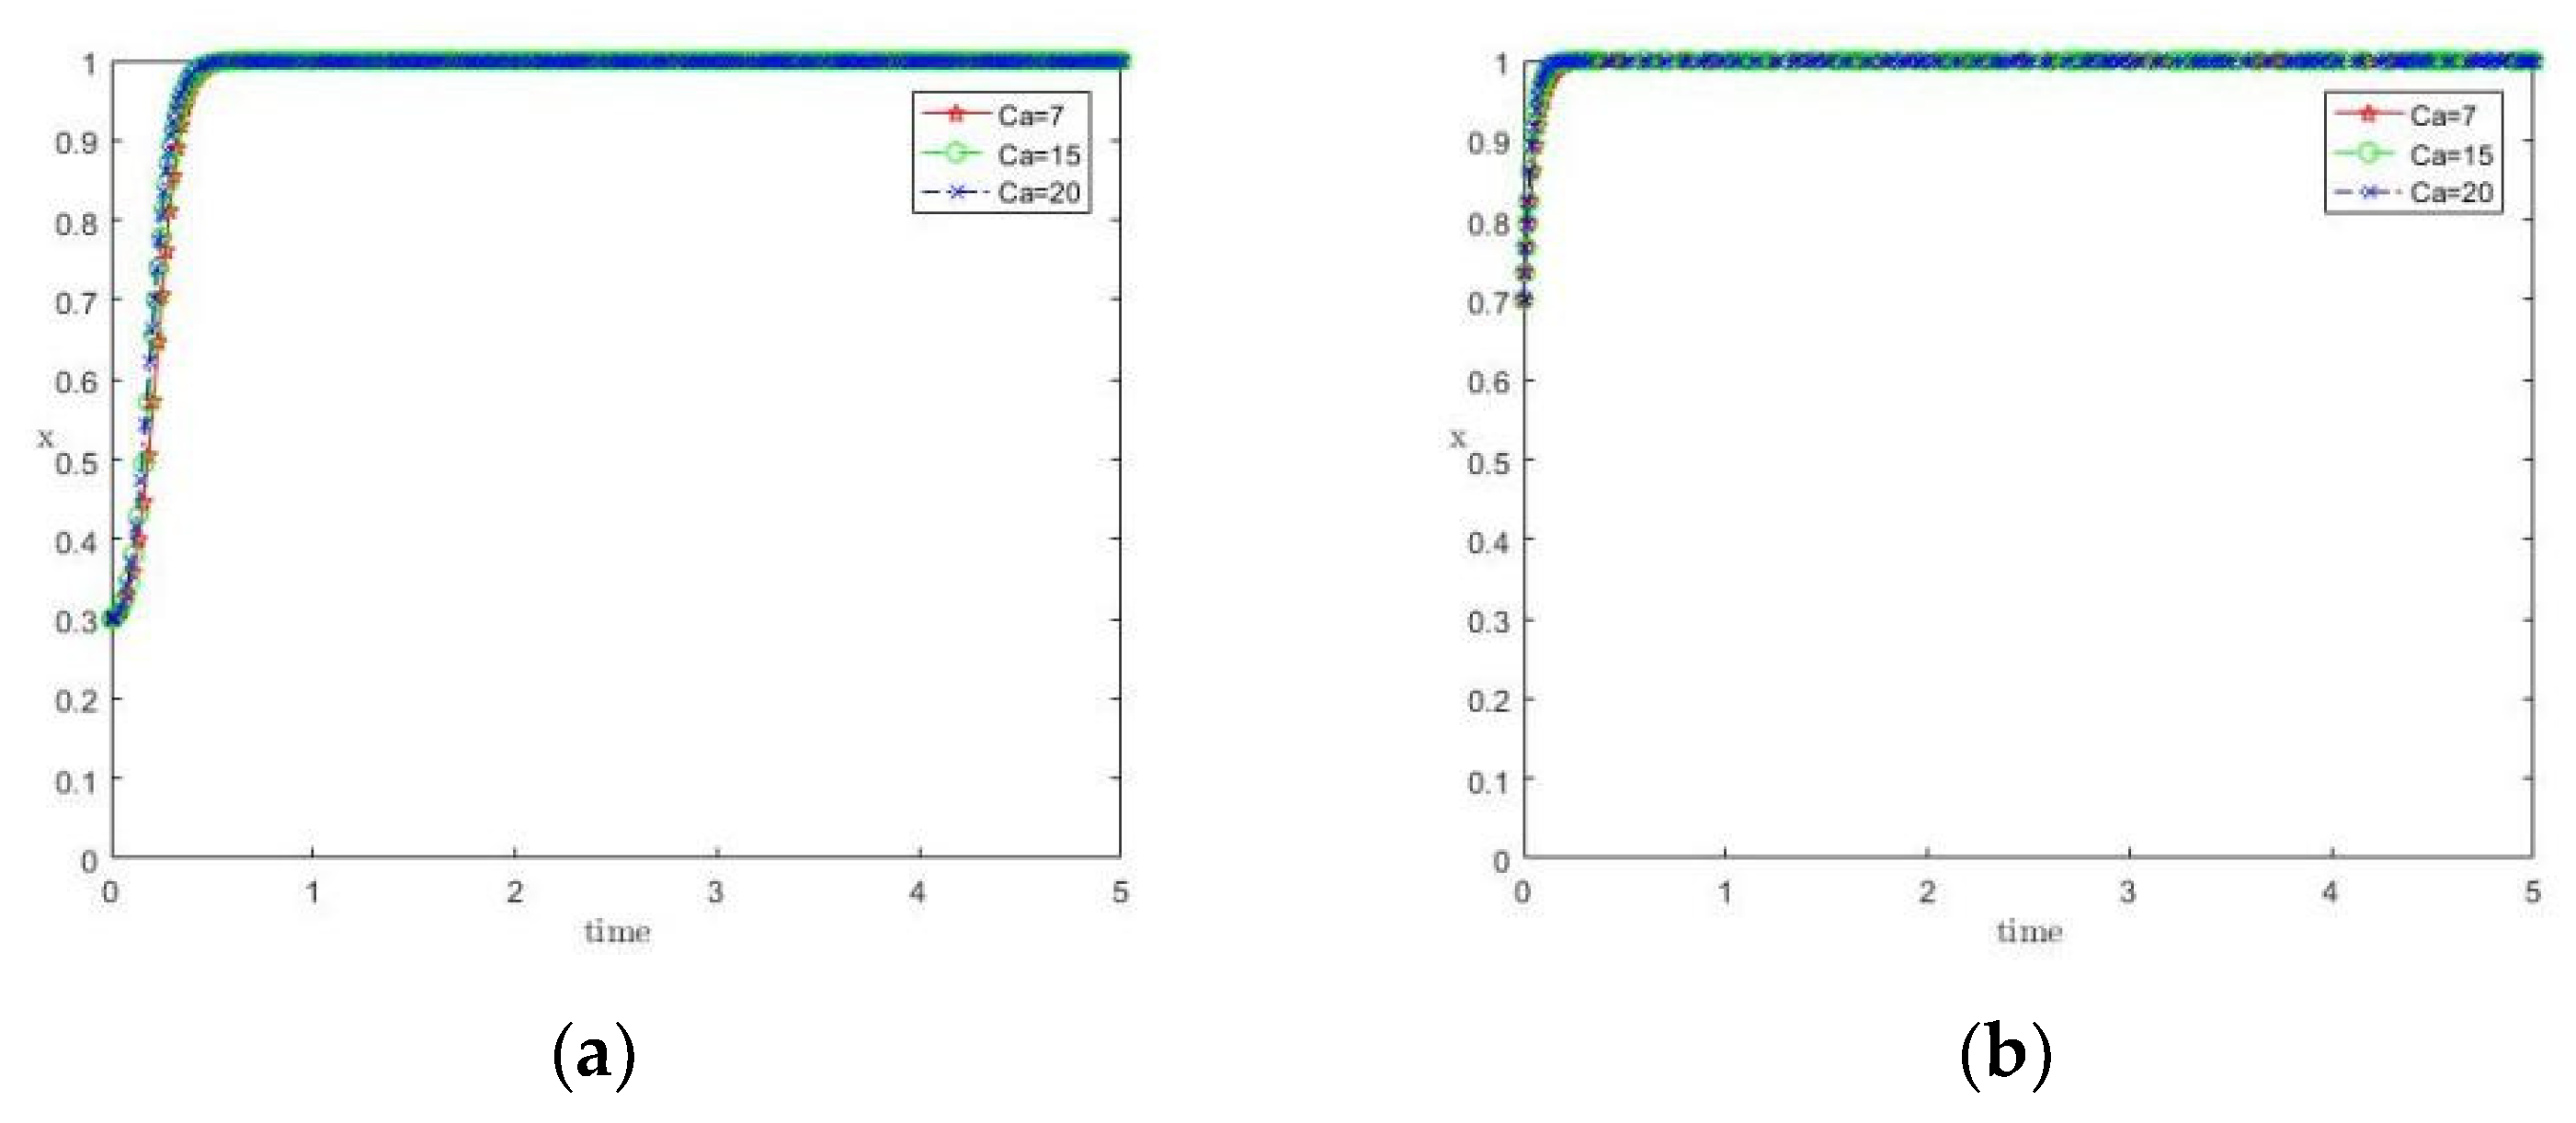
As shown in Figure 15, Ca values were tested at 7, 15, and 20. Higher pollution-control costs increase the provincial government’s propensity to adopt active guidance, indicating a positive relationship.
However, the effect is relatively marginal, as the provincial government ultimately tends to favor active guidance regardless of cost increases, suggesting that active guidance remains the dominant choice in the pursuit of long-term environmental stability.
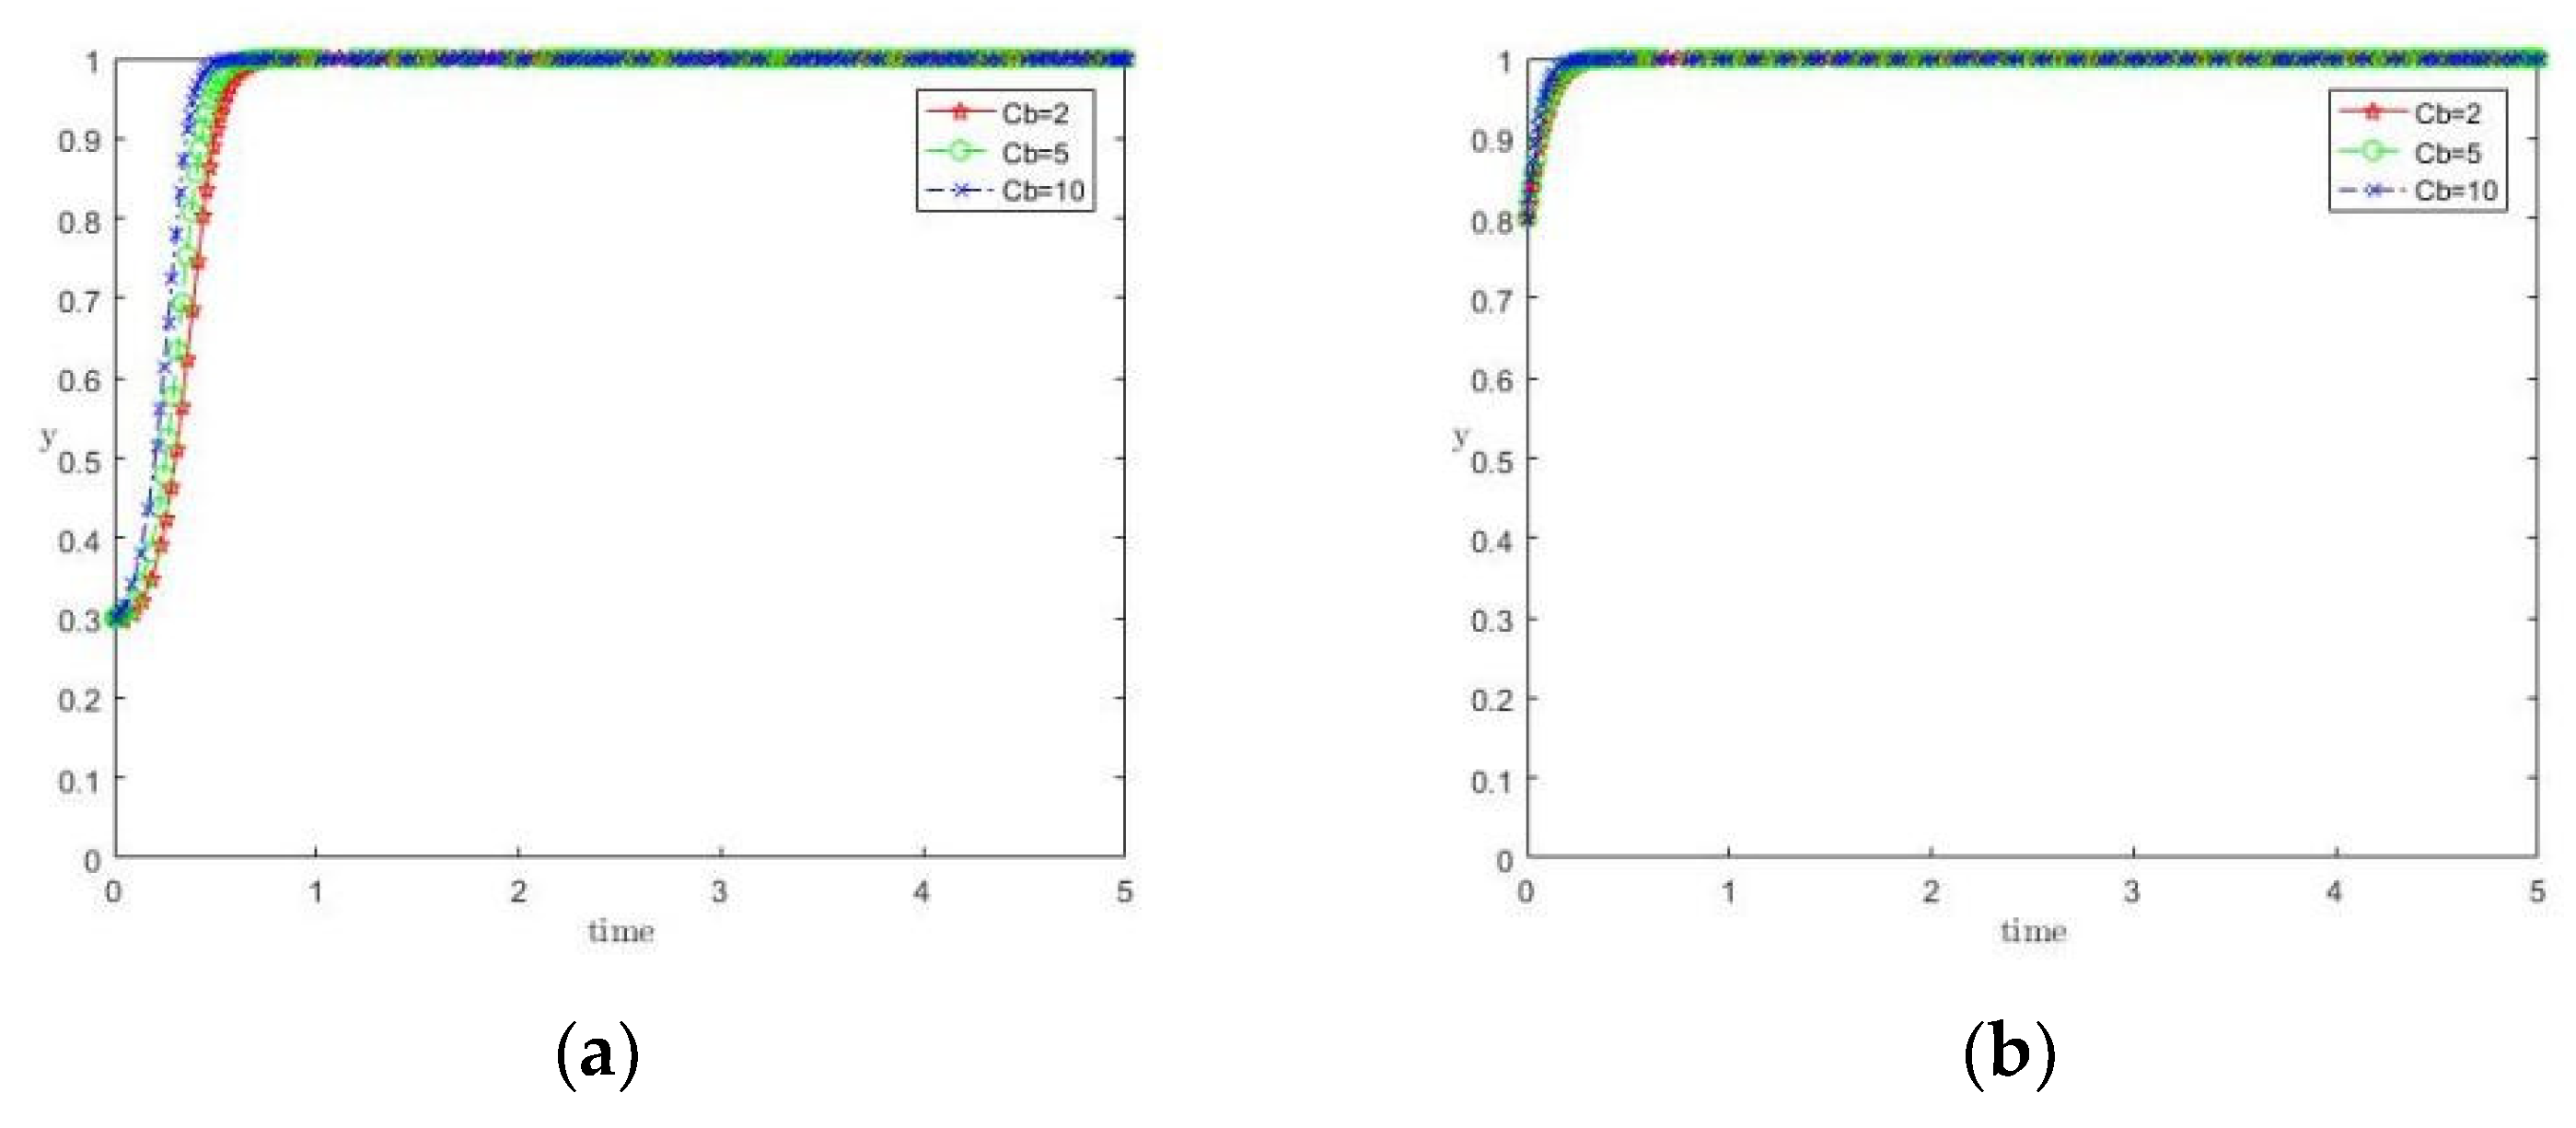
In Figure 16, Cb varies across 2, 5, and 10. As Cb increases, local governments exhibit a greater propensity to adopt active implementation, suggesting that higher inaction costs push them toward proactive environmental strategies.
This effect is most visible under low-probability weighting, indicating that cost pressures are particularly salient for initially hesitant local governments.
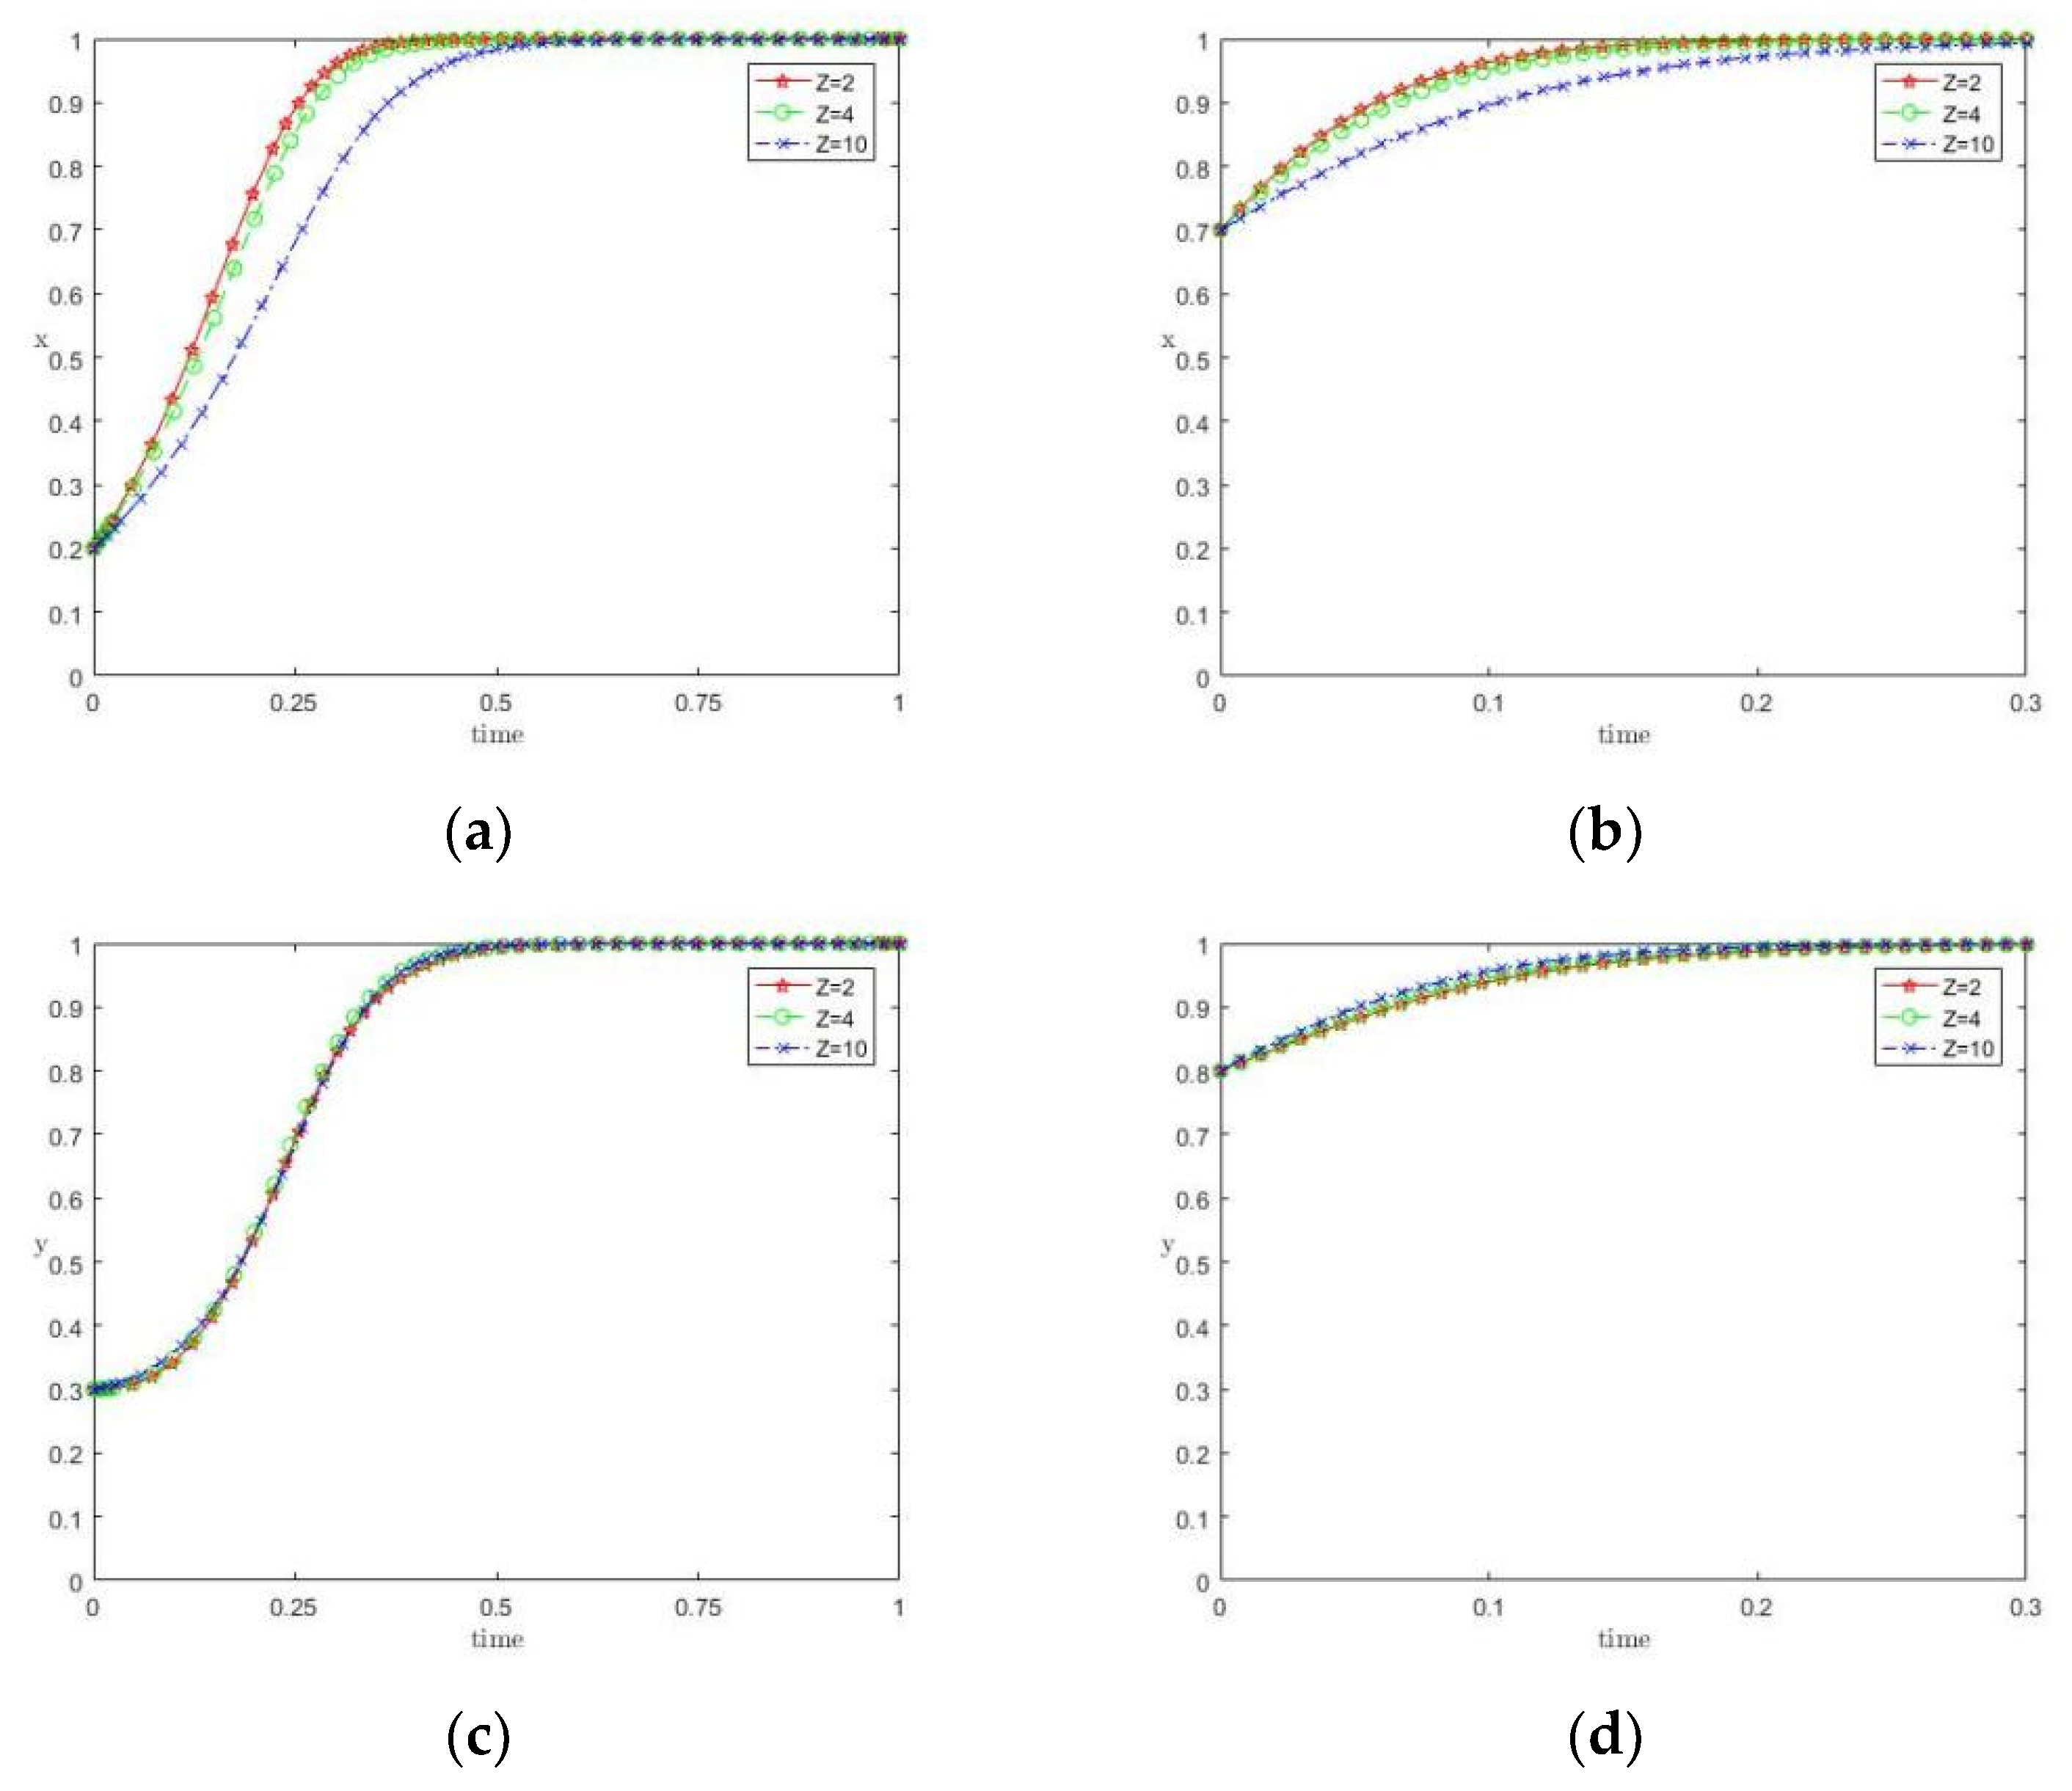
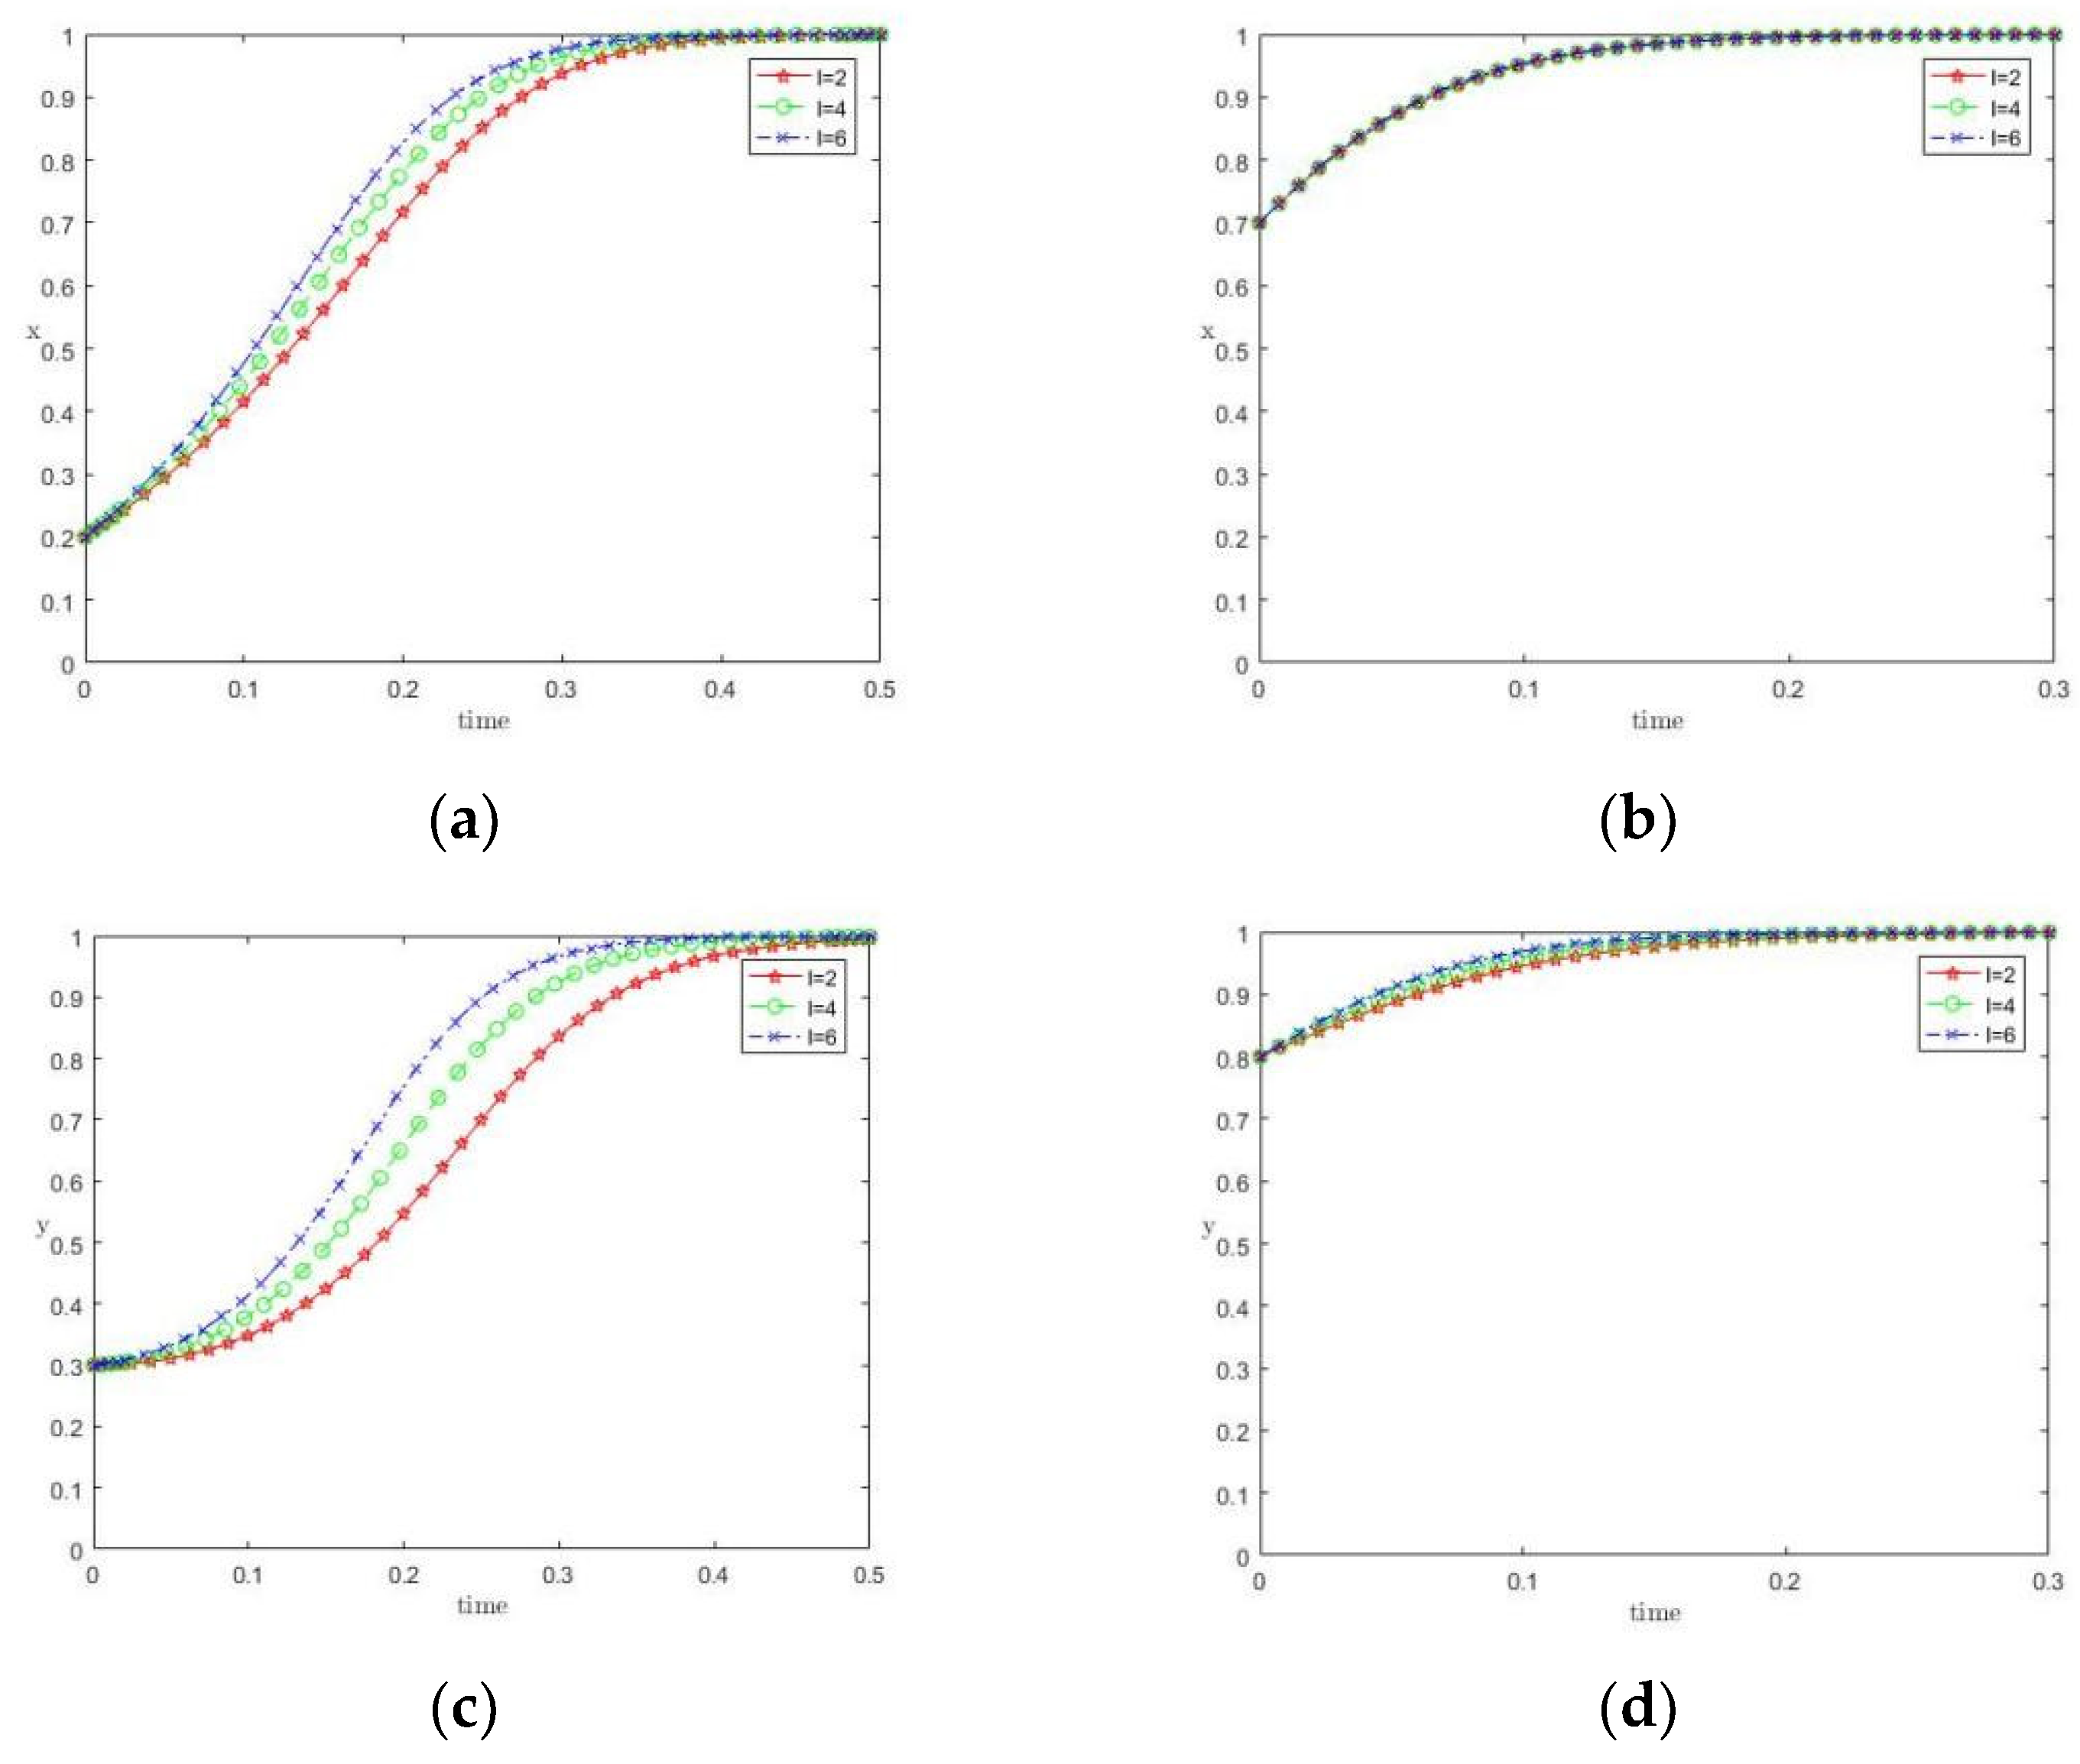
Figure 17 illustrates the impact of subsidies, with Z set at 2, 4, and 10. Higher subsidies significantly increase the local government’s propensity to adopt active implementation, while paradoxically reducing the provincial government’s propensity to provide active guidance, because larger subsidies impose greater fiscal burdens.
The effect of subsidies on local governments is relatively modest, whereas their impact on the provincial government is more pronounced when its initial propensity to guide is low.
In Figure 18, penalties I varied across 2, 4, and 6. Both provincial and local governments exhibit a greater propensity to adopt active strategies, indicating a clear positive relationship.
Penalties are particularly effective when local governments initially exhibit low implementation propensity, underscoring the importance of credible enforcement mechanisms.
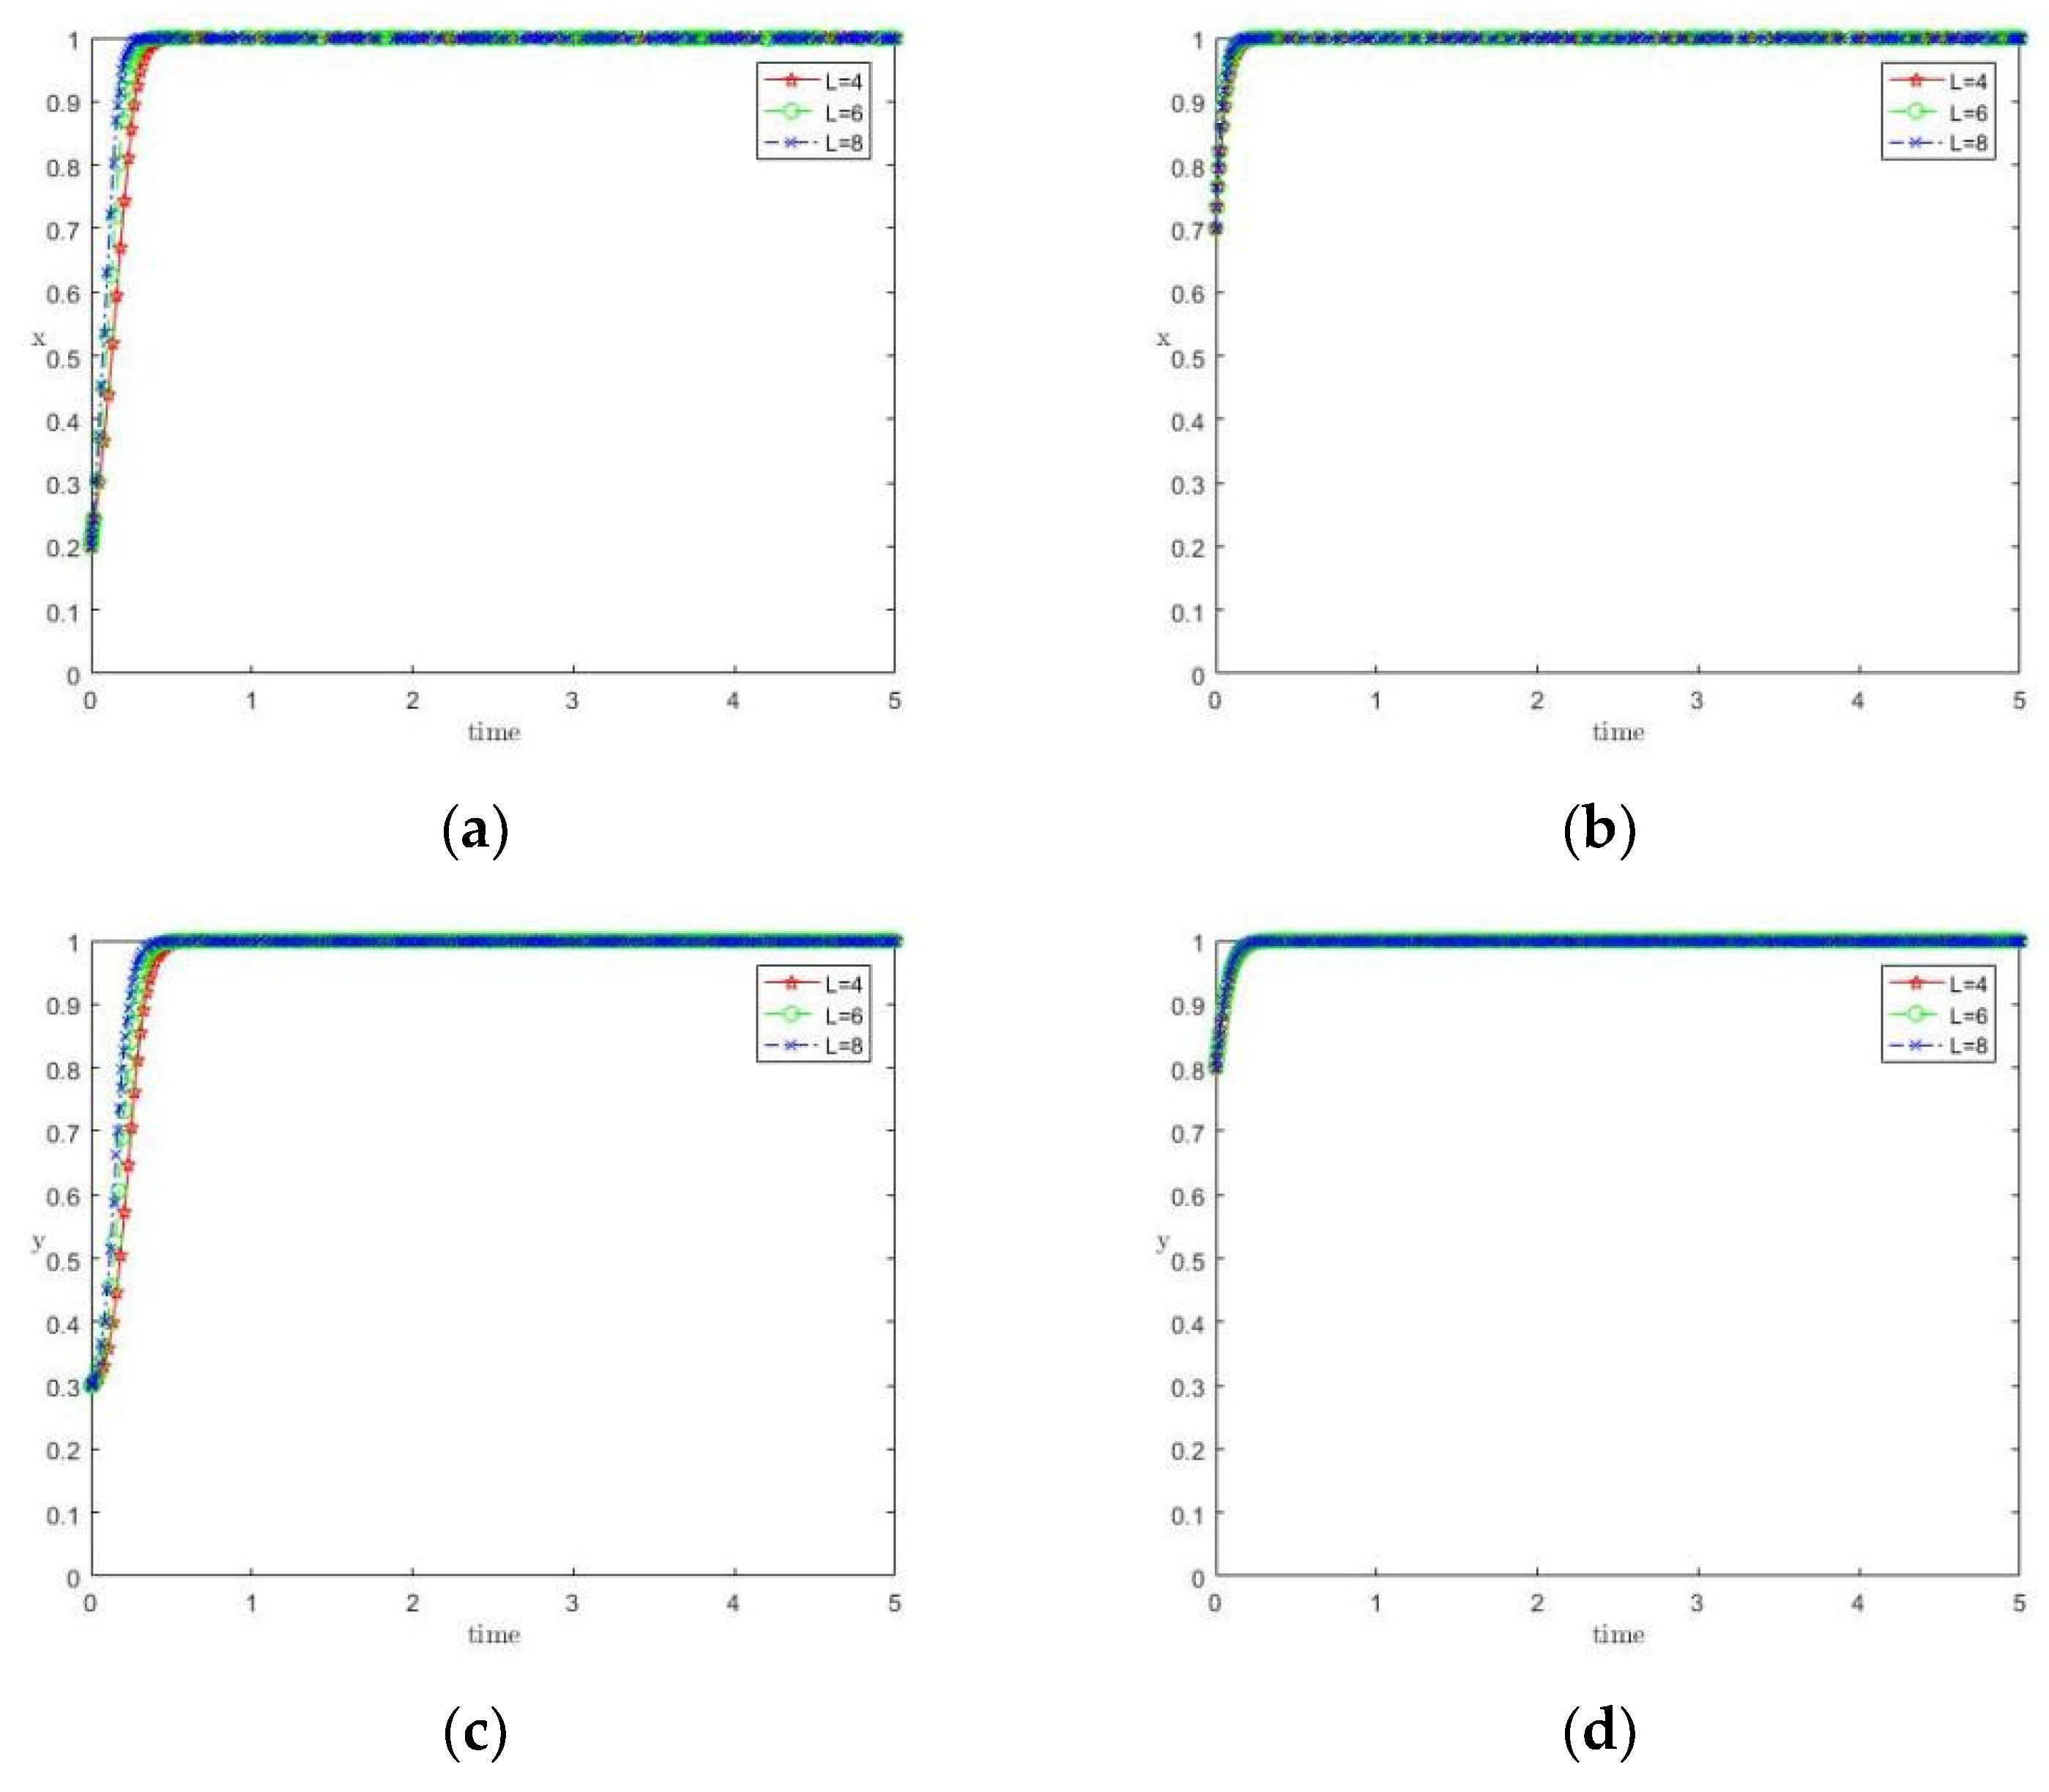
Figure 19 evaluates environmental and economic losses L by varying it across 4, 6, and 8. As losses increase, both provincial and local governments show greater propensities to adopt active strategies, indicating a positive relationship.
This effect is especially strong under low-probability weighting, suggesting that salient environmental degradation can shift decision-making toward more proactive action.

6. Conclusions

Based on the evolutionary game analysis and numerical simulation results, the analysis indicates that the evolution of zero-waste city development is driven by the interplay between governmental cognition and institutional adaptation. First, both provincial and local governments exhibit bounded rationality, and their cooperation depends critically on perceived rather than purely objective payoffs, as reflected in the simulation results under prospect theory. When the benefits of participating in zero-waste initiatives are clearly communicated and salient, cooperative behavior increases even under uncertainty. Conversely, adverse perceptions can suppress participation, which is consistent with the sensitivity of strategy evolution to perceived gains and losses observed in the numerical simulations.
Second, incentive and penalty instruments operate in a stage-contingent and asymmetric manner according to the evolutionary paths identified in the simulation analysis. Subsidies are the most effective in reducing early entry barriers, whereas penalties are particularly important during the transitional stage when local governments hesitate or resist. As institutional routines consolidate, local governments are increasingly likely to participate voluntarily, and reputational and normative incentives become more influential than direct fiscal transfers, a pattern that emerges from the transition between different stable equilibria in the model.
Third, zero-waste city development follows a gradual trajectory from provincial government mobilization to a mid-stage of strategic divergence and, finally, to mature self-driven governance, as indicated by the simulated evolutionary trajectories under different parameter settings. Long-term environmental transformation depends on whether local governments can internalize norms and develop stable institutional capacities that sustain participation over time, thereby allowing cooperative outcomes to persist beyond short-term incentives and administrative pressure.
These findings are broadly consistent with existing studies on solid waste governance and zero-waste city development, while offering additional insights into their dynamic implementation processes. Previous research has extensively documented the environmental and public health risks associated with inadequate solid waste management and has emphasized the necessity of coordinated governmental intervention to address these challenges [10,11,12,13,14]. Studies focusing on government coordination further highlight the importance of incentive alignment, regulatory enforcement, and fiscal support in improving solid waste management outcomes [15,16,17,18]. In line with these literature, our results indicate that incentive and penalty instruments play differentiated roles across development stages, as reflected in the simulated evolutionary trajectories.
From a methodological perspective, prior evolutionary game studies have demonstrated that incentive intensity and regulatory design significantly influence strategic interactions among stakeholders involved in solid waste governance [3,7]. Building on these studies, our analysis suggests that the effects of such policy instruments may vary over time as perceived benefits and costs change during the evolution of strategies. By incorporating prospect theory, this study provides a behavioral perspective that captures bounded rationality and subjective policy perception, thereby offering a complementary explanation for the emergence and stability of cooperative behavior under uncertainty.

7. Policy Recommendations

Policy design should prioritize shaping the cognitive evaluations of both provincial and local governments. Communicating long-term economic, environmental, and reputational gains can strengthen intrinsic motivation and reduce reliance on administrative enforcement. This can be achieved through public communication campaigns, performance benchmarking, and transparent reporting mechanisms [27].
Incentive structures should follow dynamic, stage-based sequences. In the initiation stage, subsidies should focus on lowering implementation costs, whereas the transition stage requires a balanced mix of rewards and penalties to curb free-riding [28]. In the maturation stage, reputational recognition, inter-regional comparisons and knowledge-sharing platforms can reinforce voluntary participation, reflecting the reduced dependence on direct fiscal incentives observed in the later stages of the simulations.
To sustain zero-waste city development, provincial governments should gradually shift from direct control to indirect support, a transition that aligns with the model’s implication of increasing local self-driven governance capacity. This shift entails helping local governments build robust implementation systems, including clear regulations, improved technologies, and data-driven management tools [29,30,31].
This manuscript is mechanism-oriented and relies on stylized parameterization and scenario-based numerical experiments rather than empirical validation. A feasible next step is to calibrate key parameters using pilot-city indicators and administrative proxies. For example, implementation costs and capacity constraints can be proxied by city-level waste-management investment, treatment capacity, and utilization indicators; intergovernmental incentives can be proxied by transfer payments and earmarked environmental expenditures, and enforcement intensity can be proxied by inspection and evaluation outcomes where available. In addition, we will conduct external consistency checks by comparing the model-implied stage patterns with observed policy stages and evaluation cycles in the pilot program. When more standardized panel data become available, future research can further validate the model by linking calibrated parameters to observed diffusion patterns and performance outcomes across pilot and non-pilot cities.

Author Contributions

Methodology, X.Q. and X.F.; resources, J.S. and Y.Z.; data curation and analysis, X.Q. and X.F.; writing—original draft, X.Q., X.F., J.S. and Y.L.; writing—review and editing, Y.L., X.Q. and J.S.; final checks, X.F., X.Q., J.S. and Y.L.; supervision, X.Q. and X.F. All authors have read and agreed to the published version of the manuscript.

Funding

The authors acknowledge the financial support of Soft Science Research of Henan Provincial Department of Education (242400412074), the Fundamental Research Funds for the Central Universities (2024110622), Innovation Environment Construction Project of Karamay (XQZX20250090).

Data Availability Statement

The original contributions presented in the study are included in the article, further inquiries can be directed at the corresponding author.

Conflicts of Interest

The authors declare no conflicts of interest.

References

  1. Sharma, K.D.; Jain, S. Municipal solid waste generation, composition, and management: The global scenario. Soc. Responsib. J. 2020, 16, 917–948. [Google Scholar] [CrossRef] [Scilit]
  2. United Nations Environment Programme (UNEP). Global Waste Management Outlook 2024; UNEP: Nairobi, Kenya, 2024. [Google Scholar]
  3. Qiao, X.; Lee, H.; Shen, Q.; Li, Y. Research on the Tripartite Evolutionary Game of Zero-Waste City Construction in China. Sustainability 2023, 15, 10507. [Google Scholar] [CrossRef] [Scilit]
  4. Ministry of Ecology and Environment, Solid Waste and Chemicals Management Technology Center. National Report on the Prevention and Control of Solid Waste Pollution (2024); Ministry of Ecology and Environment of the People’s Republic of China: Beijing, China, 2024.
  5. Qi, S.; Chen, Y.; Wang, X.; Yang, Y.; Teng, J.; Wang, Y. Exploration and practice of “zero-waste city” in China. Circ. Econ. 2024, 3, 100079. [Google Scholar] [CrossRef] [Scilit]
  6. Li, Y.; Shan, G.; Hao, S.; Li, J.; Li, J. Systemic governance and circular economy synergies: A multidimensional analysis of China’s “Zero-waste Cities” initiative. Circ. Econ. 2025, 4, 100153. [Google Scholar] [CrossRef] [Scilit]
  7. Li, Y.; Liu, L.; Li, J. Maximizing the Performance of Zero Waste City Successive Promotion: A study on the Promoting Strategy Based on the “Local-Central” Evolutionary Game Model. Chin. J. Environ. Manag. 2022, 14, 25–31. [Google Scholar]
  8. Banerjee, S.; Sarkhel, P. Municipal solid waste management, household and local government participation: A cross country analysis. J. Environ. Plan. Manag. 2020, 63, 210–235. [Google Scholar] [CrossRef] [Scilit]
  9. Peng, J.; Yi, H. Incentivizing recycling in local governments: The moderating role of fiscal conditions in the adoption of Pay-As-You-Throw recycling programs. Chin. Public Adm. Rev. 2024, 15, 241–252. [Google Scholar] [CrossRef] [Scilit]
  10. Wang, C.-Q.; Yu, L.; Zhang, J.-J. Production forecast, comprehensive utilization, management measures and visualization analysis of construction waste. Sustain. Chem. Pharm. 2024, 41, 101720. [Google Scholar] [CrossRef] [Scilit]
  11. Bernstad, A.; Malmquist, L.; Truedsson, C.; Jansen, J.L.C. Need for improvements in physical pretreatment of source-separated household food waste. Waste Manag. 2013, 33, 746–754. [Google Scholar] [CrossRef] [Scilit]
  12. Zhang, Z.; Chen, Z.; Zhang, J.; Liu, Y.; Chen, L.; Yang, M.; Osman, A.I.; Farghali, M.; Liu, E.; Hassan, D.; et al. Municipal solid waste management challenges in developing regions: A comprehensive review and future perspectives for Asia and Africa. Sci. Total. Environ. 2024, 930, 172794. [Google Scholar] [CrossRef] [Scilit]
  13. Fagerholm, A.-S.; Haller, H.; Warell, A.; Hedvall, P.-O. Zero Waste for All? Sustainable Practices in a Small-Scale Zero Waste Community from a Universal Design Perspective. Sustainability 2025, 17, 4092. [Google Scholar] [CrossRef] [Scilit]
  14. Hao, M.; Zhang, F. Regional Differences and Evolution Trends of Zero Waste Performance in China. Pol. J. Environ. Stud. 2025, 35, 157–168. [Google Scholar] [CrossRef] [Scilit]
  15. Tan, R.; Wu, L.; Shi, M. Jinhua’s Experience and Inspiration in Building a Zero-waste City Through Digital Empowerment. Environ. Prot. 2025, 53, 48–51. [Google Scholar] [CrossRef]
  16. Liu, W.; Hou, S. Improvement of the Legal System of Domestic Waste Classification for the Construction of Zero-waste Cities. Environ. Prot. 2024, 52, 62–65. [Google Scholar] [CrossRef]
  17. Wang, W. Breaking down the barriers to clean air: The effects of China’s Zero-Waste City policy on PM2.5 concentration. Chin. J. Popul. Resour. Environ. 2025, 23, 75–84. [Google Scholar] [CrossRef] [Scilit]
  18. Jiang, Y.; Zhang, L.; Wu, J. Evolutionary Game Study of Waste Separation Policy in the Context of the “Double Carbon” Target. Sustainability 2023, 15, 8320. [Google Scholar] [CrossRef] [Scilit]
  19. Tan, S.; Li, W.; Liu, X.; Wang, Y.; Wang, M. Exploring paths underpinning the implementation of municipal waste sorting: Evidence from China. Environ. Impact Assess. Rev. 2024, 106, 107510. [Google Scholar] [CrossRef] [Scilit]
  20. Qin, Q.; Zhou, J.; Zhang, J. Inter-stakeholder Collaborative Governance Mechanism for the Resource Utilization of Solid Waste towards the Construction of a Zero-waste City. J. China Univ. Geosci. (Soc. Sci. Ed.) 2025, 25, 100–115. [Google Scholar] [CrossRef]
  21. Li, B.; Li, J. Public participation in Governance of E-waste recycling: A tripartite evolutionary game analysis. Sustain. Futur. 2024, 8, 100323. [Google Scholar] [CrossRef] [Scilit]
  22. Ding, M.; Xu, Y. How Can “Zero Waste City” Construction Be Achieved Effectively?—Evidence from China’s First 16 Pilot Cities. Available online: https://ssrn.com/abstract=5391581 (accessed on 2 March 2026).
  23. Chen, X.; Yang, Y.; Cang, Y.; Chang, X.; Zhang, L. Finding the Green Sweet Spot: Local Government Environmental Attention and Corporate Value. Available online: https://papers.ssrn.com/sol3/papers.cfm?abstract_id=5736690 (accessed on 2 March 2026).
  24. Kai-Ineman, D.; Tversky, A. Prospect theory: An analysis of decision under risk. Econometrica 1979, 47, 363–391. [Google Scholar] [CrossRef] [Scilit]
  25. Kahneman, D.; Tversky, A. Prospect theory: An analysis of decision under risk. In Handbook of the Fundamentals of Financial Decision Making: Part I; World Scientific Publishing: Singapore, 2013; pp. 99–127. [Google Scholar]
  26. Chen, Q.; Chen, P.; Chu, Z. Riddled with challenges: Are zero-waste cities transitioning to circular economies? Insights from Chinese cities. J. Environ. Manag. 2025, 385, 125662. [Google Scholar] [CrossRef] [Scilit] [PubMed]
  27. Leslie, J.; Brown, P.J.; Pratt, S.; Edwards, M. Design principles for city waste reduction: Addressing gaps in public reporting for zero waste. Clean. Waste Syst. 2025, 12, 100326. [Google Scholar] [CrossRef] [Scilit]
  28. Meng, M.; Wen, Z.; Luo, W.; Wang, S. Approaches and Policies to Promote Zero-Waste City Construction: China’s Practices and Lessons. Sustainability 2021, 13, 13537. [Google Scholar] [CrossRef] [Scilit]
  29. Sosunova, I.; Porras, J. IoT-Enabled Smart Waste Management Systems for Smart Cities: A Systematic Review. IEEE Access 2022, 10, 73326–73363. [Google Scholar] [CrossRef] [Scilit]
  30. Ahmad, R.W.; Salah, K.; Jayaraman, R.; Yaqoob, I.; Omar, M. Blockchain for Waste Management in Smart Cities: A Survey. IEEE Access 2021, 9, 131520–131541. [Google Scholar] [CrossRef] [Scilit]
  31. Awogbemi, O.; Von Kallon, D.V.; Bello, K.A. Resource Recycling with the Aim of Achieving Zero-Waste Manufacturing. Sustainability 2022, 14, 4503. [Google Scholar] [CrossRef] [Scilit]
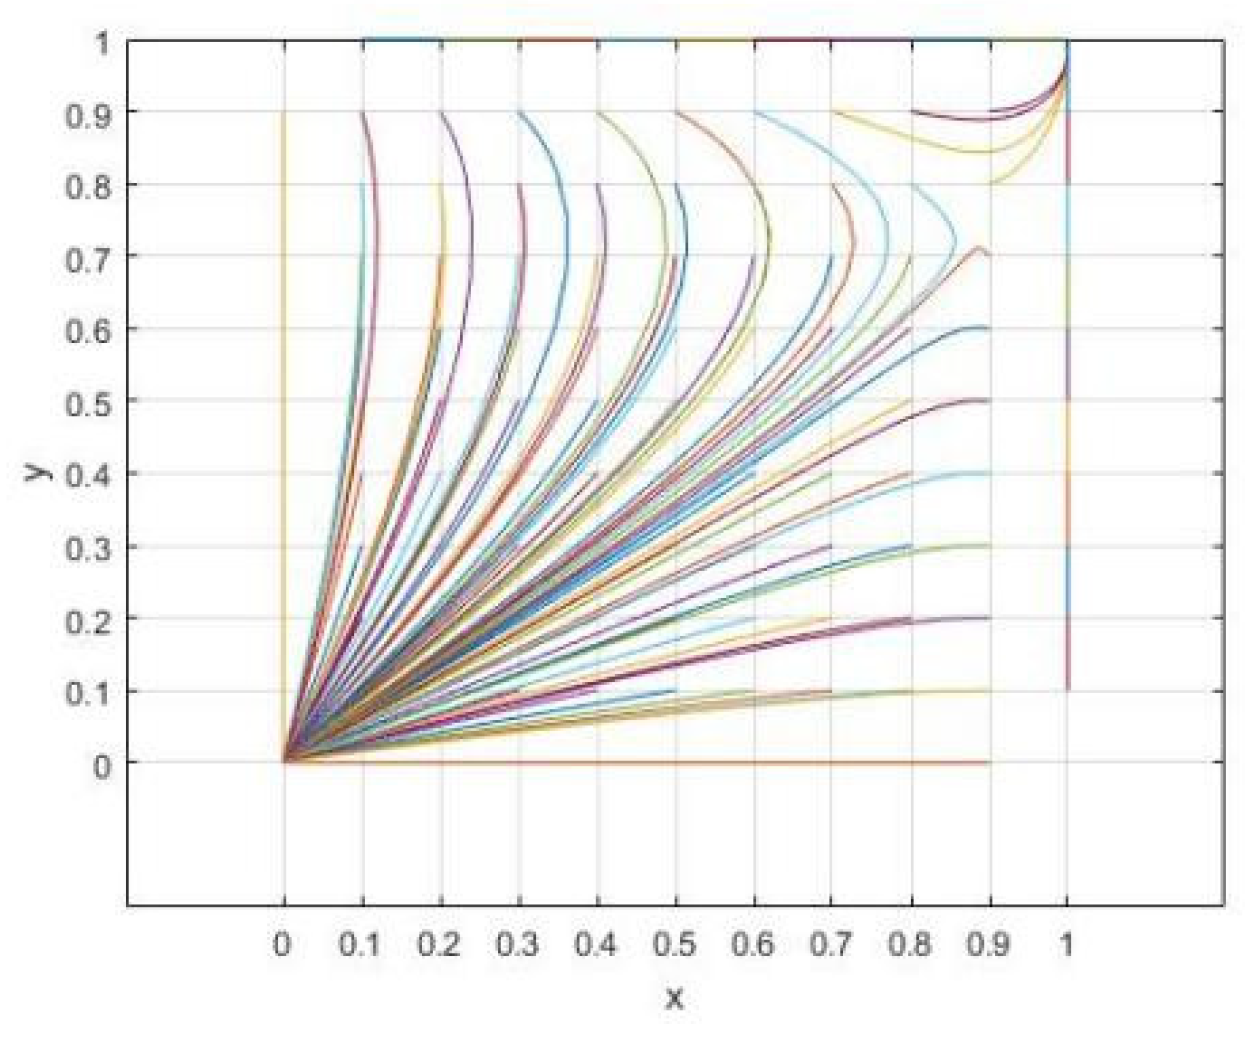
Figure 1. Parameter simulation of stable point (0,0). x and y denote the strategy proportions of the provincial and local governments, respectively.
Sustainability 18 02636 g001
Figure 2. Evolutionary process of different players: (a) provincial government; (b) local government. The horizontal axis represents time.
Sustainability 18 02636 g002
Figure 3. Parameter simulation of stable point (1,1). x and y denote the strategy proportions of the provincial and local governments, respectively.
Sustainability 18 02636 g003
Figure 4. Evolutionary process of different players: (a) provincial government; (b) local government. The horizontal axis represents time.
Sustainability 18 02636 g004
Figure 5. Parameter simulation of stable point (1,0). x and y denote the strategy proportions of the provincial and local governments, respectively.
Sustainability 18 02636 g005
Figure 6. Evolutionary process of different players: (a) provincial government; (b) local government. The horizontal axis represents time.
Sustainability 18 02636 g006
Figure 7. Parameter simulation of stable point (0,1). x and y denote the strategy proportions of the provincial and local governments, respectively.
Sustainability 18 02636 g007
Figure 8. Evolutionary process of different players: (a) provincial government; (b) local government. The horizontal axis represents time.
Sustainability 18 02636 g008
Figure 9. Parameter simulation of stable point (1,1) under prospect theory. x and y denote the strategy proportions of the provincial and local governments, respectively.
Sustainability 18 02636 g009
Figure 10. Evolutionary process of different players under prospect theory: (a) provincial government; (b) local government. The horizontal axis represents time.
Sustainability 18 02636 g010
Figure 11. The effect of Rc: (a) low probability group; (b) high probability group. The horizontal axis represents time; the curves correspond to different values of Rc (Rc = 5, 25, and 45).
Sustainability 18 02636 g011
Figure 12. The effect of Cc: (a) low probability group; (b) high probability group. The horizontal axis represents time; the curves correspond to different values of Cc (Cc = 5, 10, and 20).
Sustainability 18 02636 g012
Figure 13. The effect of Rl: (a) low probability group; (b) high probability group. The horizontal axis represents time; the curves correspond to different values of Rl (Rl = 5, 25, and 45).
Sustainability 18 02636 g013
Figure 14. The effect of Cl: (a) low probability group; (b) high probability group. The horizontal axis represents time; the curves correspond to different values of Cl (Cl = 6, 10, and 15).
Sustainability 18 02636 g014
Figure 15. The effect of Ca: (a) low probability group; (b) high probability group. The horizontal axis represents time; the curves correspond to different values of Ca (Ca = 7, 15, and 20).
Sustainability 18 02636 g015
Figure 16. The effect of Cb: (a) low probability group; (b) high probability group. The horizontal axis represents time; the curves correspond to different values of Cb (Cb = 2, 5, and 10).
Sustainability 18 02636 g016
Figure 17. The effect of Z: (a,c) low probability group; (b,d) high probability group. The horizontal axis represents time; the curves correspond to different values of Z (Z = 2, 4, and 10).
Sustainability 18 02636 g017
Figure 18. The effect of I: (a,c) low probability group; (b,d) high probability group. The horizontal axis represents time; the curves correspond to different values of I (I = 2, 4, and 6).
Sustainability 18 02636 g018
Figure 19. The effect of L: (a,c) low probability group; (b,d) high probability group. The horizontal axis represents time; the curves correspond to different values of L (L = 4, 6, and 8).
Sustainability 18 02636 g019
Table 1. Symbols and descriptions.
SymbolDescription
RcExpected benefits of the provincial government under the active guidance strategy, including enhanced credibility, reputation, and reductions in long-term pollution treatment costs.
RlExpected benefits of the local government under the active implementation strategy, such as improved governance performance and ecological outcomes.
CcCosts incurred by the provincial government for providing policy guidance and supporting the implementation of zero-waste city initiatives.
ClCosts incurred by the local government for actively implementing zero-waste city initiatives.
ZIncentives provided by the provincial government to support local governments’ active implementation of zero-waste city initiatives.
CaPollution-control costs borne by the provincial government under the non-guidance strategy.
CbPollution-control costs borne by the local government under the non-implementation strategy.
eRisk transfer coefficient, reflecting the systemic risk of provincial government when both provincial and local governments remain inactive.
mRisk-loss discount coefficient when the provincial government actively guides but the local government remains inactive.
nRisk-loss discount coefficient when the local government actively constructs but the provincial government provides no guidance.
LEconomic and ecological losses resulting from environmental pollution due to insufficient solid waste management.
IFine imposed by the provincial government on local governments that choose the non-implementation strategy when active guidance is provided.
Table 2. Strategy and return matrix.
PlayersLocal Government
Active Implementation (y)Non-Implementation (1 − y)
Provincial governmentActive guidance (x)Rc − Cc − Z,
Rl − Cl + Z
I − Ca − meL − Cc,
−Cb − mL − I
No guidance (1 − x)−Ca − neL,
−Cl − Cb − nL
−Ca − eL,
−Cb − L
Table 3. Eigenvalues corresponding to each equilibrium.
Equilibrium Pointsα1α2
A(0,0)L − Cl − LnI − Cc + Le − Lem
B(0,1)Cl − L + LnCa − Cc + Rc − Z + Len
C(1,1)Cc − Ca − Rc + Z − LenCl − Cb − I − Rl − Z − Lm
D(1,0)Cc − I − Le + LemCb − Cl + I + Rl + Z + Lm
Table 4. Strategy and return matrix under prospect theory.
PlayersLocal Government
Active Implementation (y)Non-Implementation (1 − y)
Provincial governmentActive guidance (x)V(Rc) − Cc − V(Z)
V(Rl) − Cl + V(Z)
V(I) − Ca − emV(L) − Cc
−Cb − mV(L) − V(I)
No guidance (1 − x)−Ca − neV(L)
−Cl − Cb − nV(L)
−Ca − eV(L)
−Cb − V(L)
Table 5. Symbols and descriptions under prospect theory.
SymbolDescription
V(Rc)Perceived value of benefits to the provincial government, incorporating subjective evaluation of economic returns, reputational gains, and pollution-control cost savings under prospect theory.
V(Rl)Perceived value of benefits to the local government, including economic gains, improvements in administrative reputation, and long-term environmental dividends.
CcDeterministic cost incurred by the provincial government for providing policy guidance and implementation support for zero-waste city initiatives.
ClDeterministic cost incurred by the local government for actively implementing zero-waste city initiatives.
V(Z)Perceived value of subsidies or incentives provided by the provincial government to the local government, incorporating uncertainty regarding negotiation outcomes and timing.
CaDeterministic cost of pollution control for the provincial government, representing fixed regulatory and remediation expenditures.
CbDeterministic cost of pollution control for the local government, reflecting objective expenditures without psychological distortion.
eRisk transfer coefficient, reflecting the systemic risk of provincial government when both provincial and local governments remain inactive.
mRisk-loss discount coefficient when the provincial government actively guides but the local government remains inactive.
nRisk-loss discount coefficient when the local government actively constructs but the provincial government provides no guidance.
V(L)Perceived value of environmental and economic losses arising from pollution and ecological degradation, incorporating uncertainty and psychological weighting effects.
V(I)Perceived value of penalties imposed by the provincial government on local governments under the non-implementation strategy, accounting for uncertainty in enforcement and reputational effects.
Disclaimer/Publisher’s Note: The statements, opinions and data contained in all publications are solely those of the individual author(s) and contributor(s) and not of MDPI and/or the editor(s). MDPI and/or the editor(s) disclaim responsibility for any injury to people or property resulting from any ideas, methods, instructions or products referred to in the content.