Article

Study on the Influence of ESG Performance on Carbon Emission Intensity in the Automotive Manufacturing Industry

College of Economics & Management, The North University of China, Taiyuan 030051, China
*
Author to whom correspondence should be addressed.
Sustainability 2026, 18(5), 2590; https://doi.org/10.3390/su18052590
Submission received: 9 January 2026 / Revised: 26 February 2026 / Accepted: 2 March 2026 / Published: 6 March 2026

Abstract

Embracing environmental, social, and governance (ESG) principles is essential for the automotive industry to align with the global low-carbon trend, and carbon emission intensity serves as the core metric for evaluating the sector’s emission reduction effectiveness. We construct a two-way fixed-effects model to assess the influence of ESG performance on carbon emission intensity in the automotive manufacturing sector of Chinese A-share-listed companies from 2009 to 2022 and arrive at the following conclusions: There is a significantly negative relationship between the ESG performance and carbon emission intensity of automotive manufacturing firms, and the finding remains valid according to a series of robustness and endogeneity tests. In addition, small-scale and non-state-owned enterprises appear to focus more on managing carbon emission intensity than their large-scale and state-owned firms do. We also find that ESG performance impacts the carbon emission intensity of automotive manufacturing companies through increased executive compensation incentives, while financing constraints have enhanced the influence of ESG performance on the sector’s carbon emission intensity.

1. Introduction

With the development of the economy and society, people are paying more attention to environmental conservation. Climate change and global warming have become significant challenges for everyone living on Earth. It is well-established that an increasing number of people are relying on automobiles for transportation, leading to a significant rise in vehicle numbers and a series of environmental issues [1]. In production, use, recycling and disposal, the automotive manufacturing industry is complex and energy-intensive, consuming a significant quantity of raw materials and producing a large quantity of carbon emissions [2]. It is a prime example of high energy consumption and emissions within the machinery manufacturing sector. Carbon reduction in the automotive manufacturing industry is not only crucial for its own sustainable development but also a vital lever for driving low-carbon transformation across the entire industrial chain and society at large. In 2024, the General Office of the State Council issued the “Work Plan for Accelerating the Establishment of a Dual-Control System for Carbon Emissions”, proposing that, during the 15th Five-Year Plan period, a dual-control system for carbon emissions will be implemented, with intensity control as the primary approach and total volume control as a supplementary measure; this has substantially impacted modern business operations. The control of carbon emission intensity, as a key focus area for China’s dual carbon targets over the next five years, will play a crucial role in achieving the nation’s carbon reduction goals. Meanwhile, Premier Li Qiang of the State Council emphasized at the 2024 Beijing International Automotive Exhibition that the focus should be on developing intelligent connected new energy vehicles, promoting high-quality development in the automotive industry, and advancing its green transformation. The advent of automobiles has profoundly transformed the way people travel and significantly impacted carbon emissions in our daily life. Automobiles are the main source of carbon emissions in the transportation sector. The transformation of the traditional automotive manufacturing industry toward electric new energy vehicles is a crucial pathway to achieving dual carbon goals. Therefore, it is essential to explore the carbon emission intensity in the automotive manufacturing industry. Today, environmental, social, and governance (ESG) is the most widely and commonly used scale for calculating the sustainable performance of companies [3], and can also evaluate companies’ sustainable development capabilities. It is well-established that enterprises with high ESG scores have better development prospects and social responsibilities. Newspapers are simultaneously publishing dedicated ESG newsletters, and customers are increasingly basing their purchasing decisions on a company’s ESG impact. As a result, the ESG performance of a company is important for its own development and technological progress to reduce carbon emissions.
Through the review and analysis of the existing literature, we find that most scholars argue that ESG is related to stock liquidity, investment efficiency, etc. For example, Krueger et al. (2024) document a positive effect of ESG disclosure mandates on firm-level stock liquidity [4]. Elamer & Boulhaga (2024) find a significant negative correlation between ESG controversies and firm performance [5]. ESG engagement is positively and significantly associated with investment efficiency [6]. The relationship between ESG ratings and green innovation is “U”-shaped [7]. Additionally, a rater’s overall view of a firm influences the measurement of specific categories [8].
Regarding the impact on carbon emissions in the automotive manufacturing sector, existing research has mainly focused on factors influencing carbon reduction in the industry and the feasibility of relevant policies. For example, Andrei et al. (2024) conducted a longitudinal case study of a state-of-the-art automotive paint shop, aiming to contribute to an enhanced understanding of the complexity of adopting decarbonization measures [9]. Hechelmann et al. (2023) argue that the abatement potential and economic feasibility of the decarbonization strategies of eight German manufacturing companies in different industries largely depend on individual preconditions and dynamic effects [10]. Hu et al. (2021) adopted the extended logarithmic division index (LMDI) method to decompose the factors affecting carbon emissions and found that research and development (R&D) intensity and energy intensity are the two principal factors for emission reduction [11].
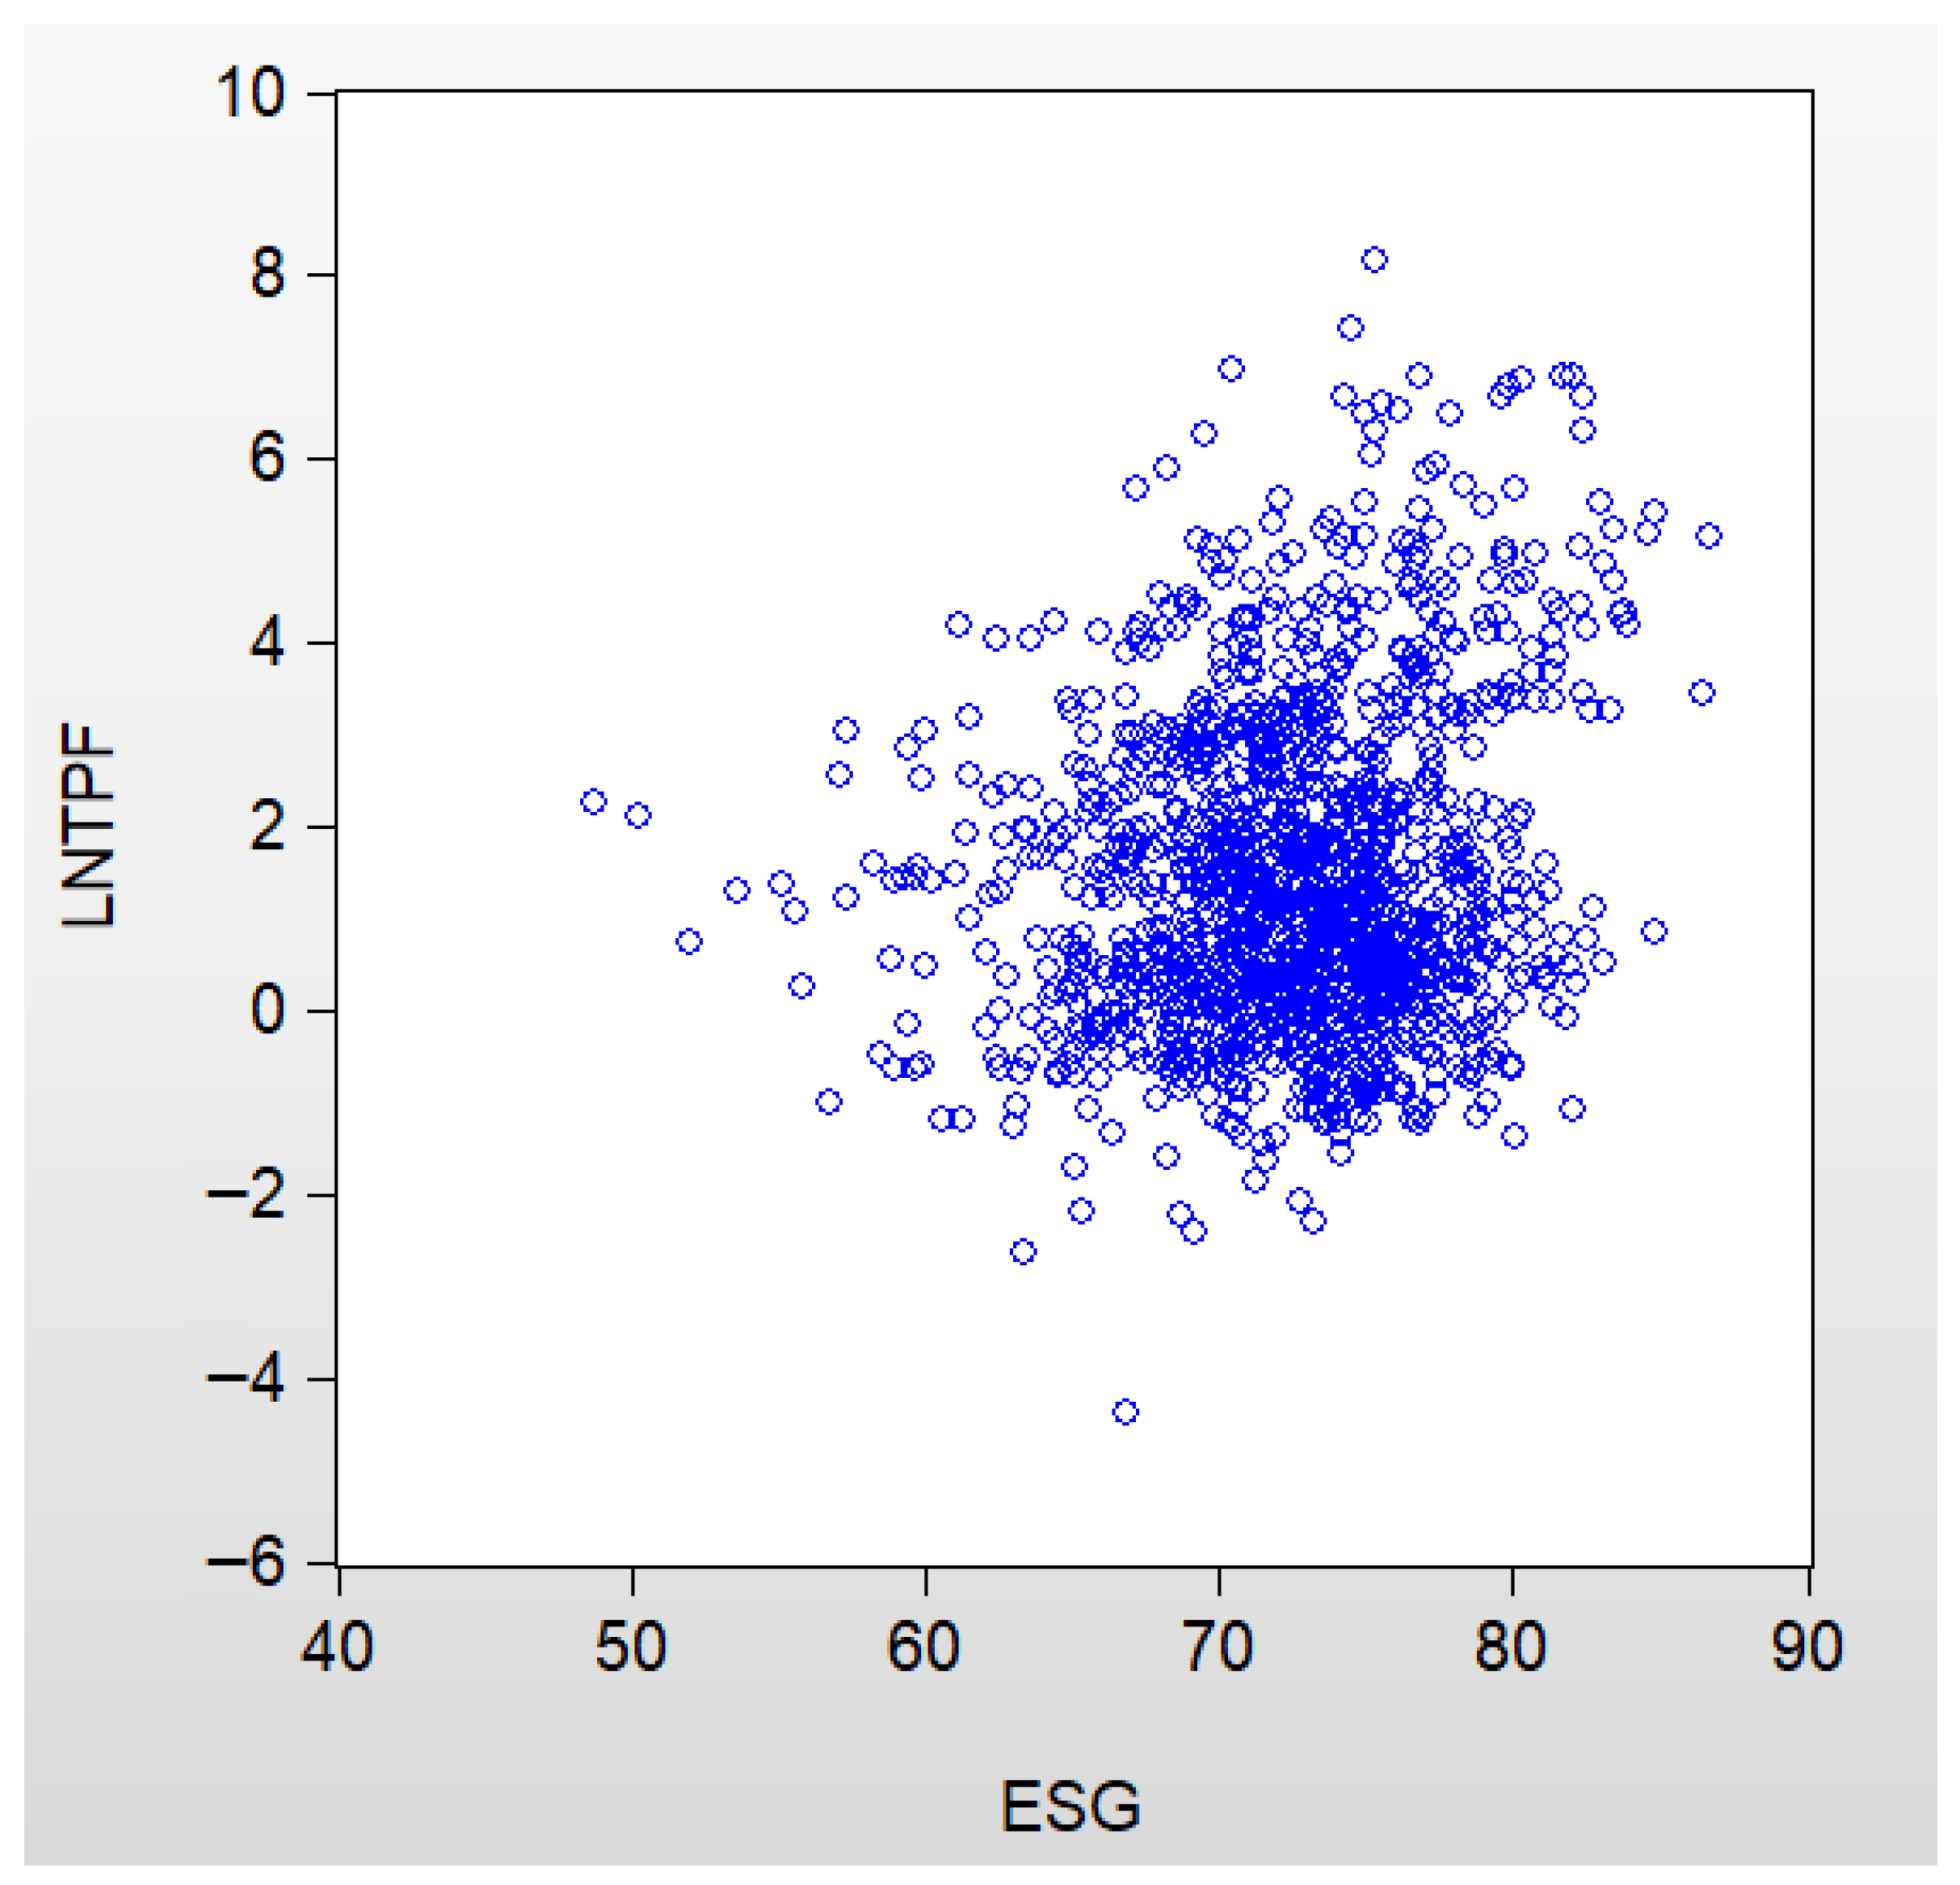
We also studied the current literature on the impact that ESG performance has on carbon emissions. Under the introduction of the Emissions Trading, Čadež & Czerny (2010) provide some original insights into corporate carbon management strategies by presenting a case study of two Slovenian manufacturing companies [12]. Implementing emissions trading systems (ETSs) leads to heightened environmental responsibility in the real estate sector [13]. A higher ESG rating significantly improves carbon efficiency and decreases carbon emission intensity [14,15,16]. In addition, Persakis (2024) conducted empirical analysis utilizing a large sample of 2640 firms from the US Fortune 1000 list and demonstrated that climate policy uncertainty positively affects ESG performance and negatively affects firm performance and carbon dioxide emission performance [17]. However, one author argues that companies with high ESG ratings do not necessarily have lower carbon emissions [18]. Thus, the relationship between ESG performance and carbon emission intensity warrants further exploration. Figure 1 illustrates the relationship between ESG performance and corporates’ carbon emissions. As illustrated in Figure 1, the area in the lower right corner exhibits the highest concentration of companies simultaneously achieving high ESG scores and low carbon emissions. However, carbon emissions data are not directly comparable across firms, and research on the correlation between ESG performance and carbon emission intensity remains limited. It is this research gap that motivates the study presented in this paper.
Most current papers argue that ESG is related to stock liquidity and investment efficiency, and that decarbonization strategies, R&D intensity, and energy intensity influence a company’s emission reduction potential in the automotive manufacturing sector, with an ESG rating significantly decreasing the carbon emission intensity. Despite the existing literature yielding substantial findings on ESG and carbon emissions, there is limited research on how ESG performance impacts corporate carbon emission intensity in the automotive manufacturing sector. First, existing studies have primarily focused on provincial and regional analyses, with relatively few investigations dedicated to specific industries. Second, they have mainly researched ESG and carbon emission policies, with much less focus on ESG with regard to carbon emission intensity. Moreover, the automotive manufacturing sector is a traditional manufacturing sector, whose carbon emission intensity is very important to control to achieve the double carbon target. Therefore, we chose sample data from 191 Chinese A-share listed companies in the automotive manufacturing industry from 2009 to 2022 based on the above considerations, to conduct empirical analysis, mediation effect analysis, and moderation effect analysis.
Our contribution to the existing literature is broadly three-fold. First, as a carbon-intensive industry, the automotive manufacturing sector has attracted less attention concerning its ESG performance and carbon emission intensity. This study will enrich the existing body of research in this field. Second, executive compensation incentives can affect both companies’ resource allocation efficiency and carbon emissions, and also influence their ESG performance; it is inadequate to only study the relationships between executive compensation incentives, ESG performance, and carbon emissions in the automotive manufacturing sector. Therefore, we chose monetary incentives for executives as the mediating variable to explore the degree to which it affects ESG performance and carbon emission intensity, and enrich the research on the mediating role of ESG in carbon emission intensity. Third, financing constraints play a significant role in corporate ESG performance, sustainable development, and firm performance. Thus, this study employed financing constraints as a moderating variable to conduct a moderation effect analysis. By delving into the moderating role of financing constraints in ESG performance and carbon emission intensity, it significantly enriches the research on the impact of ESG factors on corporate carbon emission intensity.
The remainder of the article is laid out as follows. Section 2 elaborates on the related literature and hypothesis development. In Section 3, we describe the sample data, variables of the study, and model specifications. Section 4 discusses the results regarding how ESG performance affects carbon emission intensity in the automotive manufacturing industry, presents robustness tests and heterogeneity analyses to enhance the persuasiveness of the article’s conclusions, and presents mediation tests and moderation effect tests to obtain related results. Section 5 presents the conclusions, suggestions, shortcomings, and outlook of the paper.

2. Literature Review and Research Hypotheses

The National Development and Reform Commission, with the approval of the State Council, issued the “14th Five-Year Plan for Circular Economy Development” and the “Action Plan for Carbon Peaking Before 2030”. These documents identified the automotive manufacturing sector as a key contributor to energy consumption and carbon emissions, and the primary source of carbon emissions within the transportation sector [19]. As daily life increasingly relies on automobiles, the advent of electrification and intelligent technologies subjects the automotive manufacturing sector to intense transformation pressures. Its exceptionally long global supply chains further complicate carbon emission management and ESG performance. Consequently, examining the relationship between ESG performance and carbon emission intensity within this sector holds significant research value.
In terms of ESG, financial technology can enhance the ESG performance and environmental information disclosure of new energy vehicles [20]. ESG disclosure regulation improves the information environment and has beneficial capital market effects [4]. Additionally, ESG initiatives can alleviate corporate financing constraints and stimulate green innovation, consequently driving enterprise value and deepening our understanding of how ESG influences enterprise value within the context of the dual carbon goal [21]. In terms of carbon emissions, at the global level, input digitization significantly reduces the carbon emission intensity of manufacturing, and the effect of carbon reduction increases gradually over time [22]. Energy management has a positive effect on the adoption of low-carbon production and, through this, indirectly on carbon and economic performance [23].
According to the current literature, we find that ESG performance can impact firms’ CO2 emissions. ESG ratings significantly inhibit corporate carbon emissions [16]. They can encourage enterprises to actively engage in environmental governance and reducing carbon emission intensity, thereby achieving the dual optimization of environmental and economic benefits, promoting enterprises’ green transformation [24]. Meanwhile, there is a positive relationship between firm-level perception of carbon risk and firm ESG performance [25].
In line with this strand of literature, we formulate our first research hypothesis as follows:
Hypothesis 1.
ESG performance exhibits a significant negative correlation with carbon emission intensity in the automotive manufacturing sector.
The impact of ESG performance and monetary incentives has substantially increased over the last few years. In particular, management compensation incentives significantly enhance corporate ESG performance [26]. On a similar note, ESG performance is related to management compensation in the context of European companies [27]. Interestingly, ESG performance can positively impact monetary incentives for executives [28,29]. Total compensation behaves according to stewardship theory and positively influences CSR engagement, breadth, and depth [30].
In terms of the impact of executive compensation incentives on corporate carbon emissions, executive compensation improves process-oriented carbon performance, but has no similar effect on actual carbon performance [31]. The study of Li et al. (2025) shows that the adoption of and a change in managerial stock-based compensation have a positive effect on carbon emission intensity [32]. Additionally, high carbon emissions increase CEOs’ risk of job loss [33].
We found a relationship between ESG performance, executive compensation incentives, and carbon emission intensity through the above analysis. Based on agency theory and stakeholder theory, outstanding ESG performance requires effective internal governance mechanisms to ensure and reinforce it; many firms have deeply integrated ESG metrics into their executive compensation systems. According to the behavioral agency model and resource allocation rights theory, when executives’ personal economic interests are directly linked to the company’s carbon reduction outcomes, their decision-making preferences shift, placing greater emphasis on resource allocation to reduce carbon emission intensity. Therefore, we deduce our second research hypothesis as follows:
Hypothesis 2.
ESG performance affects the carbon emission intensity of automotive manufacturing companies by increasing executive compensation incentives.
In addition to using monetary incentives as a mediating variable to conduct empirical analysis, some scholars argue that financing constraints can also affect the link between the ESG performance and carbon emissions of automobile manufacturing companies. For example, Zhang & Wang (2024) document that financing constraints are possibly related to firms’ carbon emissions [34]. Similarly, carbon emission reduction can significantly alleviate the level of financing constraints [35]. The effect of ESG mainly comes from easing financing constraints, promoting green innovation, and strengthening supervision [14]. Liu et al. (2025) found that the pilot zones for green finance reform and innovation reduce corporate carbon emissions via alleviating corporate financing constraints [36]. Financing constraints significantly positively impact the environmental disclosure hype [37]. In addition, Shi & Dong (2025) argue that financing constraints enhance the positive impact of technological innovation on ESG performance, but the moderating effect on executive incentives and ESG performance is not significant [38].
More specifically, we believe that financing constraints may impact the relationship between ESG performance and carbon emission intensity in the automobile manufacturing field. Hence, we hypothesize the following:
Hypothesis 3.
Financing constraints play a positive regulatory role in the relationship between ESG performance and carbon emission intensity in the automotive manufacturing sector.

3. Data and Variables

3.1. Data

Our sample comprises firms among the 191 Chinese A-share listed companies in the automotive manufacturing industry from 2009 to 2022. To enhance the reliability of this research, we processed the obtained data as follows: First, we eliminated enterprises listed on ST, ST*, and abnormal markets in the sample to ensure the accuracy and standardization of the sample data. Second, linear interpolation was used to supplement occasional missing data. Third, we performed 1% and 99% winsorization on whole variables, aiming to enhance the persuasiveness of the empirical results. After filtering for missing data, we were finally left with 1185 firm-year observations.
Enterprise ESG performance data was sourced from the Wind ESG evaluation system. Carbon emission-related indicators were obtained through multiple channels such as the annual reports of listed companies, social responsibility reports, official websites, and public information from environmental protection departments. The other relevant data for the listed companies came from the CSMAR and Wind database. Data related to executive compensation incentives was derived from the annual reports of listed companies. Financing constraints are calculated using the relevant formula.

3.2. Variables

3.2.1. Explained Variable

We used an explained variable (lnC) to recognize the carbon emission intensity of listed corporations. Following Shen & Huang (2019), we utilized the following formula (1) to estimate the carbon emission (CE) for listed companies in the automotive manufacturing industry [39]. The data for the cost of firm’ main business operations came from the annual reports of listed companies. The data for industry main business costs and total industry energy consumption were separately retrieved from the China Industrial Economy Statistical Yearbook and China Energy Statistical Yearbook. We refer to the Xiamen Energy Conservation Center’s Carbon Dioxide Calculation Standard; the carbon dioxide conversion factor for 1 metric ton of standard coal is 2.493, derived from the product of the carbon emission factor (0.68 tons of carbon per ton of standard coal) recommended by the Energy Research Institute of the National Development and Reform Commission and the CO2/C molecular weight conversion factor (44/12). The carbon emission intensity (lnC) equals the logarithm of the carbon emission divided by the company’s operating revenue.
CE = cost of firm’s main business operations/industry main business cost ×
total industry energy consumption × carbon dioxide conversion factor (2.493)

3.2.2. Explanatory Variable

We implemented an explanatory variable (ESG) to measure the ESG performance levels of automotive manufacturing enterprises. We chose the Wind ESG score as the measure of a company’s ESG performance, following Yin (2025) [40]. Our selection of Wind ratings is primarily based on the following considerations: First, Wind is one of the most influential data service providers in China’s financial markets, with its ESG database covering all A-share listed companies, enabling relatively comprehensive access to relevant corporate rating data. Second, Wind ESG ratings integrate international frameworks with China’s domestic regulatory requirements, and its assessment system provides relatively comprehensive coverage of environmental, social, and governance issues relevant to Chinese enterprises. Because using Wind ESG scores as the metric for automotive manufacturers’ ESG performance yields relatively limited results, robustness and endogeneity tests were performed as presented in Section 4.4.

3.2.3. Mediating Variable

We selected executive compensation incentives (Pay) as the mediating variable in this study. Following Yin et al. (2021), we used the natural logarithm of the total compensation of the top three executives to represent their compensation incentives [41].

3.2.4. Moderator Variable

We chose financing constraints (Sa) as the paper’s moderator variable. Following Shi & Dong (2025) and Ning & Li (2025), we used the following formula (2) to calculate financing constraints [38,42]. Sa refers to the difficulties and additional costs faced by enterprises when seeking external financing for valuable investment opportunities. A negative SA index with a greater absolute value (i.e., a more negative value) indicates a higher degree of financing constraints. To enhance the reliability of the research, SA underwent standardization and decentralization:
Sa = −0.737 × Size + 0.043 × Size2 − 0.040 × Age
where Size shows the firm’s size and Age represents the corporate age.

3.2.5. Control Variables

To increase the reliability of the study’s outcomes, following Perera et al. (2023), we selected the firm size (Size), leverage (Lev), and assets (Roa) as control variables [43]. On a similar note, we chose the nature of the company’s property rights (Soe) and board size (Board) as control variables of the study following Long et al. (2025) [44]. Additionally, referring to the research of Zhang (2024), we also opted for the independent director ratio (Indep) and Tobinq value (TobinQ) as the control variables of this research [45]. The reasons we chose the above variables as control variables are as follows. We controlled for Size because larger firms may have different resources and efficiencies for emission management, Lev because financial constraints might limit environmental investments, and Roa because profitability provides slack resources for green initiatives. A control variable for Soe is included, given the profound differences in objectives, constraints, and resources between SOEs and non-SOEs in China, which are likely to materially affect their environmental behavior. We chose Board and Indep as control variables because Board may affect decision-making efficiency for strategic issues like emission reduction. Indep is crucial because independent directors are expected to enhance oversight and advocate for broader stakeholder interests, including environmental responsibility. TobinQ is included to account for growth opportunities and market pressure, which can influence a firm’s long-term strategic focus, including on sustainability. All the variables’ definitions are summarized in Table 1.

3.3. Model Specification

3.3.1. Regression Modeling

Following Zhang (2024), we set up the regression model as in Equation (3) [45]:
lnCi,t = α0 + α1ESGi,t + α2controlsi,t + α3id + α4year + εi,t
where index i is the sample individual; t is the year; lnC represents the logarithmic carbon emission intensity of the automobile manufacturing firms; ESG is the Wind ESG scores of automobile manufacturing companies; controls represents the control variables for the sample data; id and year represent individual fixed effects and time fixed effects, respectively; εi,t is the random error.

3.3.2. Mediation Effect Model

Following Yin et al. (2021) and Jiang (2022), we establish the following mediation effect model in order to further explore the mechanism by which ESG performance impacts the carbon emission intensity of automobile manufacturing enterprises [41,46]:
lnCi,t = α0 + α1ESGi,t + α2Payi,t + α3controlsi,t + α4id + α5year + εi,t
In the above equation, Pay means executive compensation incentives. The definitions of the other variables are the same as those for Equation (3).

3.3.3. Moderator Effect Model

In an effort to research the moderating effect of financing constraints on the relationship between ESG performance and carbon emission intensity, following Ning & Li (2025), we construct the moderator effect model as in Equation (5) [42]:
lnCi,t = α0 + α1ESGi,t + α2Sai,t + α3ESGi,t × Sai,t + α4controlsi,t + α5id + α6year + εi,t
where Sa is financing constraints, and ESG × Sa is the interaction term between ESG performance and financing constraints. The definitions of the other variables are the same as those for Equation (3).

4. Empirical Analysis

4.1. Descriptive and Correlation Analysis

Table 2 presents the summary statistics of all the study variables. In this list, the average natural logarithm of the carbon emission intensity of the automotive manufacturing firms in our sample is −11.265. Its standard deviation is 0.581, and the minimum and maximum values are, respectively, −11.848 and −8.994. Moreover, the mean value of ESG is 72.771 in our sample data, and its standard deviation is 4.644. Detailed information for the other variables is shown in Table 2.
Table 3 presents the correlations of the above variables. ESG, in particular, shows statistically significant negative correlations with lnC, which offers some lead-in evidence for our first hypothesis on the impact of firms’ ESG performance on carbon emission intensity. There is also a significant correlation between carbon emission intensity and the levels of Lev, Soe, Board, and Indep.

4.2. F-Test, Hausman Test, and Heteroscedasticity Test

The results of the F-test and Hausman test, which were used to select the proper model for the panel data, are presented in Table 4. First, the F-test was conducted to choose between the ordinary least squares (OLS) and fixed-effects models. The result (p < 0.01) suggests that the fixed-effects model is more appropriate for our data. Second, the Hausman test was carried out to decide between the fixed- and random-effects models. The significant result of the Hausman test (p < 0.01) showed that the fixed-effects model was more appropriate; thus, we chose this model for our research.
To ensure the reliability of the fixed-effects model estimates, we conducted diagnostics. For the issue of heteroskedasticity across groups commonly found in panel data, we performed a Modified Wald test, whose results are shown in Table 5. The results indicate χ2 = 3.2 × 1030 (p = 0.0000), strongly refuting the null hypothesis of homoscedasticity. This indicates a severe problem of heteroscedasticity between groups across models. Therefore, we employed robust standard errors based on individual-level clustering in all regressions.

4.3. Benchmark Regression

Table 6 presents the impact of ESG performance on the carbon emission intensity of automotive manufacturing companies during the sample period. Column (1) presents the results for Equation (3) without control variables, while Column (2) shows the results with control variables included. The coefficient linking ESG performance to carbon emission intensity changed from −0.00251 to −0.00139 and is statistically significant at the 1% level. These outcomes reveal that ESG has a very significant negative effect on the carbon emission intensity of automotive manufacturing firms, regardless of whether control variables are included. In other words, stronger ESG performance is associated with a greater corporate focus on environmental protection, which translates into reduced carbon emission intensity. Thus, Hypothesis 1 is supported.

4.4. Robustness and Endogeneity Test

To ensure the reliability and accuracy of our findings for Hypothesis 1, we conducted a series of tests including replacing related variables, altering the time period of the sample data, and using multiple-period lags of the explanatory variable, following Yin et al. (2023) [47].
Table 7 shows the findings of the robustness test in the sample data. Column (1) represents the results of the benchmark regression. Column (2) and Column (3) show the results of replacing explanatory variables and altering the time period of the sample data, respectively. Following Feng et al. (2024), we chose Huazheng ESG ratings (ESG2) to replace the original explanatory variable [48]. Comparing the results in Columns (1) and (2), we find that the coefficient for ESG performance changes from −0.00139 to −0.00530 and remains statistically significant in the industry. Regardless of whether rating agencies change, this evidence suggests that there is a significantly negative relation between ESG performance and carbon emission intensity. As a robustness check to address concerns regarding the influence of COVID-19, we re-estimated the model using data from the 2009–2019 period. The result remains consistent: the coefficient for ESG performance is −0.00130 (significant at the 5% level). Column (4) shows the relationship between ESG performance and carbon emission intensity, as calculated using the replacement carbon emission methodology. The new carbon emission intensity is denoted by lnC1, where the new carbon emissions equal the sum of fossil fuel combustion emissions, biomass fuel combustion emissions, raw material extraction fugitive emissions, oil and gas system fugitive emissions, indirect carbon emissions from power import/export, production process emissions, solid waste incineration emissions, and emissions from sewage treatment and land use change (forest to industrial land). The results indicate that the inhibition relationship between ESG performance and carbon emission intensity remains valid after replacing the explained variable. Column 5 presents the regression results without the interpolation of sample data. The correlation coefficient between ESG performance and carbon emission intensity is −0.00155, indicating a highly significant negative relationship. This aligns with the benchmark regression results in Column 1, both demonstrating a negative correlation between ESG performance and carbon emission intensity among automotive manufacturers.
Our benchmark regression found that ESG performance in automotive manufacturing significantly negatively impacts carbon emission intensity, though this relationship may be confounded by endogeneity issues. To effectively mitigate endogeneity concerns, this study employed lagged multi-period explanatory variables as independent variables and regressed them against carbon emission intensity. Table 8 illustrates the outcomes of the endogeneity test using a one-period lag of the explanatory variable (lESG), a two-period lag of the explanatory variable (l2ESG), a three-period lag of the explanatory variable (l3ESG), and a four-period lag of the explanatory variable (l4ESG) in the study. Column (1) explains the relationship between the one-period lag of the explanatory variable and the explanatory variable. Column (2) shows the results of the influence of the one-period lag of ESG and carbon emission intensity. Its findings indicate that there is a significantly negative relationship between ESG and carbon emission intensity. Column (3) explains the relationship between the two-period lag of the explanatory variable and the explanatory variable. Column (4) shows the results of the influence of the two-period lag of ESG and carbon emission intensity. The results reveal that ESG performance remains negatively correlated with corporate carbon emission intensity even after lagging by two periods. Column (5) explains the relationship between the three-period lag of the explanatory variable and the explanatory variable. Column (6) shows the results of the influence of the three-period lag of ESG and carbon emission intensity. Column (7) explains the relationship between the four-period lag of the explanatory variable and the explanatory variable. Column (8) shows the results of the influence of the four-period lag of ESG and carbon emission intensity. Their outcomes show that the coefficient for ESG performance on carbon emission intensity is, separately, 0.00067 and 0.00074 (positive). The inhibitory effect of ESG performance on carbon emission intensity gradually weakens in subsequent years because past ESG performance is unaffected by future carbon emissions. This further ensures that the negative impact of ESG performance on carbon emission intensity is robust in the short-to-medium term (Lags 1 and 2), but dissipates over longer horizons. The lack of significance in later lags does not necessarily ensure a lack of endogeneity, but the robustness of Lags 1 and 2 supports the main Hypothesis 1. The detailed endogeneity results can be found in Table 8.
In a nutshell, our findings indicate that companies with stronger ESG performance exhibit lower carbon emission intensity, as demonstrated through robustness and endogeneity tests. Thus, Hypothesis 1 is proved again.

4.5. Expanded Analysis

To deeply examine the connection of ESG performance and carbon emission intensity in the automotive manufacturing industry, we performed a series of expanded tests. To this end, we conducted heterogeneity, mediation, and moderating effect analyses.

4.5.1. Heterogeneity Analysis

First, we selected Size and Soe as the variables of the heterogeneity analysis [49,50,51]. Second, firms were divided into large- and small-scale groups based on whether their size was above or below the sample average, incorporating interaction terms (ESG × Size) to enhance the robustness of the conclusions, and regression analyses were conducted on each group, respectively, to assess the different effects of firm size. Third, companies were categorized as state-owned enterprises if their values were 1, and non-state-owned enterprises otherwise. Regression models were run separately for each category to investigate the differential impacts. Additionally, the interaction terms (ESG × Soe) were incorporated into the model analysis to enhance the persuasiveness of the conclusions.
Table 9 illustrates the results of the heterogeneity analysis. Based on the regression results comparing large- and small-scale enterprises, we argue that small-scale enterprises prefer to pay attention to carbon emission intensity because the coefficient for small-scale enterprises is −0.05315 and statistically significant. This shows that higher ESG scores for small firms represent lower carbon emission intensity. As expected, the results in Columns (State-owned enterprise) and (Non-state-owned enterprises) of Table 9 reveal a negative and highly statistically significant impact of ESG on companies’ carbon emission intensity for non-state-owned firms. Thus, we argue that this discovery stems not solely from corporate image maintenance, but rather from the combined effects of the competitive structure within the automotive manufacturing market and the characteristics of global supply chains. Compared to state-owned enterprises, non-state-owned enterprises typically face stricter budget constraints and more urgent pressure to deliver capital returns. This necessitates achieving capital returns rapidly at minimal cost, making improved ESG performance one of the most effective avenues. Automobiles are complex and diverse in composition, with parts sourced from multiple countries. China, as the global hub for automotive component manufacturing, hosts numerous non-state-owned enterprises that serve as suppliers to major international corporations. As the international community increasingly prioritizes carbon reduction, these suppliers must enhance their ESG performance and reduce carbon emission intensity to ensure their survival. This is why non-state-owned enterprises outperform state-owned enterprises in carbon reduction efforts. State-owned enterprises bear multiple political, social, and economic objectives. Their managers’ promotions are often tied to local economic growth and other conditions, leading them to prioritize short-term economic and political goals in decision making. With relatively lenient financing environments and weaker competitive pressures, state-owned enterprises respond more slowly to ESG pressures from capital markets and consumers.
To sum up, there is adequate evidence proving that small-scale and non-state-owned corporations pay close attention to their carbon emission intensity in case it affects their corporate image and survival.

4.5.2. Mediation Effect Analysis

To explore the pathways through which the ESG performance of automotive manufacturing enterprises influences their carbon emission intensity, following Yin et al. (2021) and Jiang (2022), we substitute the sample data into Equation (4) for analysis, yielding the results shown in Table 10 [41,46]. Column (1) represents the results of the benchmark regression in the sample data. The outcomes in Columns (2) and (3) indicate the regression results of ESG on executive compensation incentives and ESG on carbon emission intensity after including the mediating variable, respectively. As shown in Table 9, the coefficient of ESG and lnC changed from −0.00139 to −0.00135, which means that Pay plays an important role in the relation between ESG and lnC. In other words, the ESG performance of automotive manufacturers strengthens executive compensation incentives, which in turn motivates greater carbon reduction efforts. Therefore, it is evident that the effect of a firm’s ESG performance on its carbon emission intensity is negative and statistically significant across the mediation effect analysis, supporting Hypothesis 2.
This study employed the Bootstrap mediation effect test for revalidation, yielding the results presented in Table 11. The bias-corrected 95% confidence intervals for the total effect, direct effect, and indirect effect of total utility are, respectively, [−0.01948, −0.00759], [−0.01537, −0.00241], and [−0.00742, −0.00229]. Both the upper and lower bounds of the Bootstrap 95% confidence interval for the direct effect of ESG performance and the indirect effect of executive compensation incentives are negative. This indicates that executive compensation incentives exert a partial mediating effect, thereby revalidating Hypothesis 2.

4.5.3. Moderation Effect Analysis

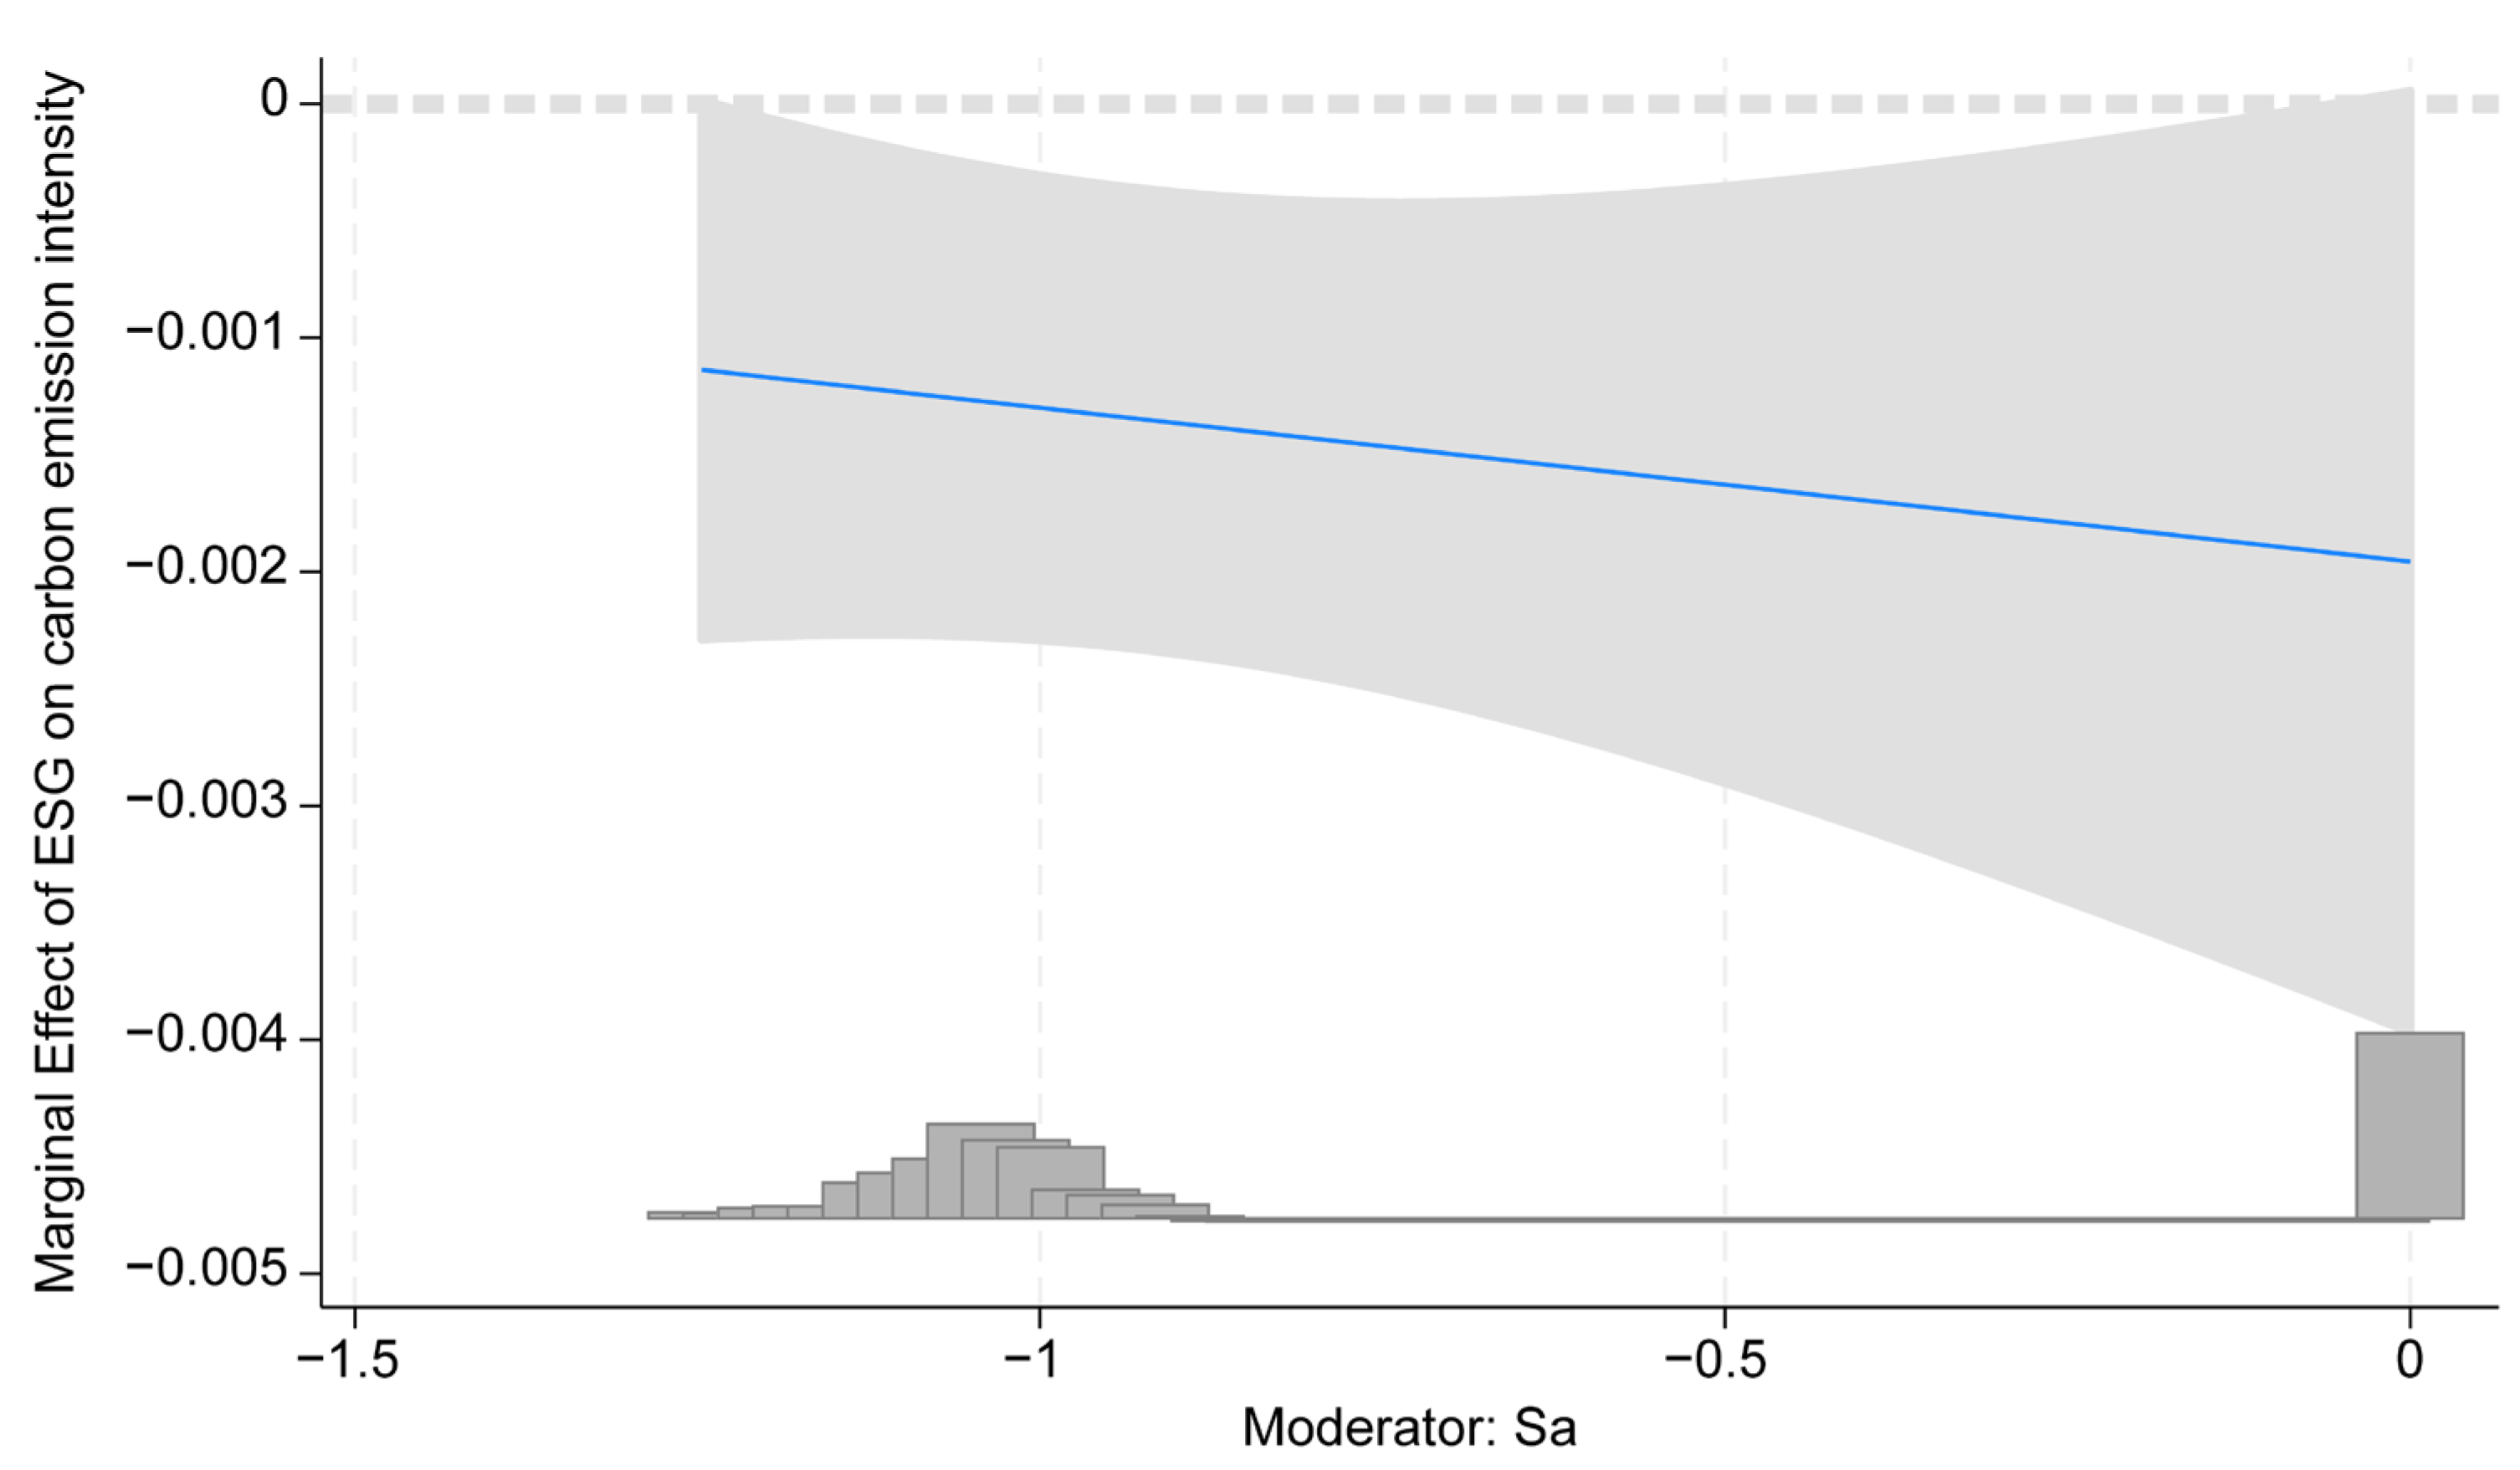
To examine whether there is a moderating variable influencing the relationship between ESG performance and carbon emission intensity in automotive manufacturing firms, we selected financing constraints (Sa) as the moderating variable and incorporated it into Equation (5) for regression analysis following Ning & Li (2025) [42]. The results are reported in Table 12. Column (1) presents the findings of the regression analysis of Equation (3), and Column (2) of Table 12 presents the results with the addition of the moderating variable (Sa) and the intersection term (ESG × Sa). More importantly, the coefficient of the interaction term (ESG × Sa) is found to be statistically significant and negative, revealing evidence of a strong effect of financing constraints on ESG and carbon emission intensity in the automotive industry. In other words, the impact of ESG performance on carbon emission intensity intensifies as financing constraints increase in manufacturing firms. This means that, if companies face stronger financing constraints, they will place greater emphasis on ESG and carbon emission intensity control, thereby earning higher credibility in capital markets to alleviate financing constraints. Hence, our findings support Hypothesis 3. To visually demonstrate the moderating effect of financing constraints, we plotted the marginal effect of ESG performance on carbon emission intensity (see Figure 2). This graph clearly reveals how the carbon reduction effect of ESG continuously varies with changes in Sa. As shown in the figure, the marginal effect curve exhibits a negative slope. Specifically, as financing constraints increase, the absolute value of the marginal effect of ESG performance on carbon emission intensity continues to rise (from approximately −0.001 to approximately −0.002). This indicates that the greater the financing constraints faced by a company, the larger the reduction in carbon emission intensity resulting from improvements in its ESG performance, indicating that such constraints are a key moderating factor in enhancing environmental performance.

5. Conclusions

Under the guidance of the dual carbon goals, an increasing number of firms in the automotive manufacturing industry find it more important to reduce their carbon emission intensity, protect the environment, and improve their ESG scores. In this study, using a sample of 191 Chinese A-share listed companies in the automotive manufacturing industry, we make strong inferences about the effect of corporate ESG performance on firms’ carbon emission intensity. The following conclusions are drawn. ESG performance significantly negatively impacts the carbon emission intensity of automotive manufacturing corporations. After undergoing a series of robustness and endogeneity tests, the conclusion remains valid. The negative impact of ESG on carbon emission intensity is more pronounced in small-scale and non-state-owned enterprises than in their large-scale and state-owned counterparts. We also find that the ESG performance of automotive manufacturing companies reduces the carbon emission intensity through the channel of executive compensation incentives, with this effect being significantly enhanced by financing constraints.
Hence, based on the above conclusions, we propose important policy implications for different stakeholder groups, including policymakers, managers, and other groups. In particular, for policymaker groups, it is essential to devise standard evaluation criteria for the ESG rating system, which may help firms to focus on self-development and carbon reduction, aiming to enhance their ESG performance. Under a standardized and unified ESG rating framework, large enterprises and state-owned enterprises should be subject to mandatory requirements, guidance, and accountability, while small enterprises and private enterprises should be prioritized for incentives, empowerment, and buffers. In the automotive manufacturing sector, a differentiated approach should be implemented for traditional and new energy vehicle industries. A gradual yet clear pathway should be established for traditional vehicle manufacturers, while preventing new energy vehicle enterprises from prioritizing scale over responsibility. Companies must fully leverage supply chain finance tools to translate ESG commitments into tangible financing advantages, unblock key transmission channels, and lay the groundwork for enhancing ESG performance and reducing carbon emission intensity. Meanwhile, policymakers should consider enterprise practice and acceptance capacities when formulating relevant carbon reduction policies. More importantly, it is advisable for company managers to promote the right ESG principles, consider the firm’s image, reduce the carbon emission intensity, and take responsibility to protect the environment, especially for large-scale and state-owned enterprises. Finally, our findings highlight the critical importance of the mediating role of executive compensation incentives and the moderating effect of financing constraints. All enterprises that actively utilize these mechanisms are better positioned to reduce carbon emission intensity and contribute to the achievement of China’s dual carbon goals.
This research is based on China’s A-share listed companies in the automotive manufacturing industry, information on which is limited in quantity and scope. Due to the difficulty in obtaining enterprise-level carbon emission data in China and the substantial workload involved, this study follows mainstream practices in the field by employing a calculation method based on total industry energy consumption and the company’s cost share. This approach is justified in terms of data availability, methodological transparency, and academic comparability, and aligns with the study’s focus on relative carbon emission intensity. However, because the CO2 conversion factor in Formula 1 is a relative estimate, the calculated carbon emission intensity results may contain a certain degree of error. The paper includes content in the robustness testing section to enhance persuasiveness. This study selected Wind ESG ratings as explanatory variables, yielding relatively limited conclusions. Thus, in a future study, we can choose companies from industries worldwide and beyond as sample enterprises to enlarge the scope of the study, with the purpose of ensuring more accurate and reliable conclusions. Future research may also incorporate additional mediating and moderating effects and consider employing new carbon emission intensity calculation methods and more comprehensive ESG rating approaches to obtain more holistic findings. Additionally, future studies could strengthen the persuasiveness and precision of their findings by controlling for industry-specific or region-specific shocks interacted with time in robustness checks. These issues would be a promising avenue to consider in future research.


Author Contributions

Writing—original draft, S.N.; writing—review and editing, W.D. and Z.Y. All authors have read and agreed to the published version of the manuscript.

Funding

This research was funded by the “Project of Shanxi Federation of Social Sciences” with grant number [SSKLZDKT2025129] (*funder*: Wei Du); by the “Youth Project of Humanities and Social Sciences Research, Ministry of Education” with grant number [24YJC790211] (*funder*: Zhipeng Yan); and by the “Philosophy and Social Sciences Planning Office of Shanxi Province” with grant number [2016246] (*funder*: Wei Du).

Institutional Review Board Statement

Not applicable.

Informed Consent Statement

Not applicable.

Data Availability Statement

The data presented in this study are available on request from the corresponding author.

Conflicts of Interest

The authors declare no conflicts of interest.

References

  1. Giampieri, A.; Ling-Chin, J.; Taylor, W.; Smallbone, A.; Roskilly, A.P. Moving towards low-carbon manufacturing in the UK automotive industry. Energy Procedia 2019, 158, 3381–3386. [Google Scholar] [CrossRef] [Scilit]
  2. Zhang, H.; Zhang, M.; Yan, W.; Liu, Y.; Jiang, Z.; Li, S. Analysis the Drivers of Environmental Responsibility of Chinese Auto Manufacturing Industry Based on Triple Bottom Line. Processes 2021, 9, 751. [Google Scholar] [CrossRef] [Scilit]
  3. Martiny, A.; Testa, F.; Taglialatela, J.; Iraldo, F. Determinants of environmental social and governance (ESG) performance: A systematic literature review. J. Clean. Prod. 2024, 456, 142213. [Google Scholar] [CrossRef] [Scilit]
  4. Krueger, P.; Sautner, Z.; Tang, D.Y.; Zhong, R. The effects of mandatory ESG disclosure around the world. J. Account. Res. 2024, 62, 1795–1847. [Google Scholar] [CrossRef] [Scilit]
  5. Elamer, A.A.; Boulhaga, M. ESG controversies and corporate performance: The moderating effect of governance mechanisms and ESG practices. Corp. Soc. Responsib. Environ. Manag. 2024, 31, 3312–3327. [Google Scholar] [CrossRef] [Scilit]
  6. Bilyay-Erdogan, S.; Danisman, G.O.; Demir, E. ESG performance and investment efficiency: The impact of information asymmetry. J. Int. Financ. Mark. Inst. Money 2024, 91, 101919. [Google Scholar] [CrossRef] [Scilit]
  7. Yang, C.; Zhu, C.; Albitar, K. ESG ratings and green innovation: A U-shaped journey towards sustainable development. Bus. Strategy Environ. 2024, 33, 4108–4129. [Google Scholar] [CrossRef] [Scilit]
  8. Berg, F.; Kölbel, J.F.; Rigobon, R. Aggregate confusion: The divergence of ESG ratings. Rev. Financ. 2022, 26, 1315–1344. [Google Scholar] [CrossRef] [Scilit]
  9. Andrei, M.; Rohdin, P.; Thollander, P.; Wallin, J.; Tångring, M. Exploring a decarbonization framework for a Swedish automotive paint shop. Renew. Sustain. Energy Rev. 2024, 200, 114606. [Google Scholar] [CrossRef] [Scilit]
  10. Hechelmann, R.H.; Paris, A.; Buchenau, N.; Ebersold, F. Decarbonisation strategies for manufacturing: A technical and economic comparison. Renew. Sustain. Energy Rev. 2023, 188, 113797. [Google Scholar] [CrossRef] [Scilit]
  11. Hu, S.; Yang, J.; Jiang, Z.; Ma, M.; Cai, W. CO2 emission and energy consumption from automobile industry in China: Decomposition and analyses of driving forces. Processes 2021, 9, 810. [Google Scholar] [CrossRef] [Scilit]
  12. Čadež, S.; Czerny, A. Carbon management strategies in manufacturing companies: An exploratory note. J. East Eur. Manag. Stud. 2010, 15, 348–360. [Google Scholar] [CrossRef] [Scilit]
  13. Lee, C.L.; Liang, J. The effect of carbon regulation initiatives on corporate ESG performance in real estate sector: International evidence. J. Clean. Prod. 2024, 453, 142188. [Google Scholar] [CrossRef] [Scilit]
  14. Qian, Y.; Liu, Y. Improve carbon emission efficiency: What role does the ESG initiatives play? J. Environ. Manag. 2024, 367, 122016. [Google Scholar] [CrossRef] [Scilit]
  15. Xie, Y. The interactive impact of green finance, ESG performance, and carbon neutrality. J. Clean. Prod. 2024, 456, 142269. [Google Scholar] [CrossRef] [Scilit]
  16. Li, J.; Xu, X. Can ESG rating reduce corporate carbon emissions?—An empirical study from Chinese listed companies. J. Clean. Prod. 2024, 434, 140226. [Google Scholar] [CrossRef] [Scilit]
  17. Persakis, A. The impact of climate policy uncertainty on ESG performance, carbon emission intensity and firm performance: Evidence from Fortune 1000 firms. Environ. Dev. Sustain. 2024, 26, 24031–24081. [Google Scholar] [CrossRef] [Scilit]
  18. Treepongkaruna, S.; Au Yong, H.H.; Thomsen, S.; Kyaw, K. Greenwashing, carbon emission, and ESG. Bus. Strategy Environ. 2024, 33, 8526–8539. [Google Scholar] [CrossRef] [Scilit]
  19. Li, X.; Song, Y. Industrial ripples: Automotive electrification sends through carbon emissions. Energy Policy 2024, 187, 114045. [Google Scholar] [CrossRef] [Scilit]
  20. Huang, X.; Li, D.; Sun, M. Fintech and Corporate ESG Performance: An Empirical Analysis Based on the NEV Industry. Sustainability 2025, 17, 434. [Google Scholar] [CrossRef] [Scilit]
  21. Qian, S. The effect of ESG on enterprise value under the dual carbon goals: From the perspectives of financing constraints and green innovation. Int. Rev. Econ. Financ. 2024, 93, 318–331. [Google Scholar] [CrossRef] [Scilit]
  22. Fang, H.; Jiang, C.; Hussain, T.; Zhang, X.; Huo, Q. Input digitization of the manufacturing industry and carbon emission intensity based on testing the world and development countries. Int. J. Environ. Res. Public Health 2022, 19, 12855. [Google Scholar] [CrossRef] [Scilit]
  23. Böttcher, C.; Müller, M. Insights on the impact of energy management systems on carbon and corporate performance. An empirical analysis with data from German automotive suppliers. J. Clean. Prod. 2016, 137, 1449–1457. [Google Scholar] [CrossRef] [Scilit]
  24. Xie, H.; Qin, Z.; Li, J. ESG performance and corporate carbon emission intensity: Based on panel data analysis of A-share listed companies. Front. Environ. Sci. 2024, 12, 1483237. [Google Scholar] [CrossRef] [Scilit]
  25. Guo, B.; Yang, Z. Firm-level carbon risk perception and ESG performance. Environ. Sci. Pollut. Res. 2024, 31, 12543–12560. [Google Scholar] [CrossRef] [Scilit] [PubMed]
  26. Lei, X.; Cao, H.; Shen, K. Executive Incentives and Enterprise ESG Performance from the Perspective of Compensation and Equity. J. Hefei Univ. Technol. (Soc. Sci.) 2025, 39, 130–144. (In Chinese) [Google Scholar]
  27. Dell’Erba, M.; Ferrarini, G. ESG & executive remuneration in Europe. Eur. Bus. Organ. Law Rev. 2024, 25, 439–479. [Google Scholar] [CrossRef] [Scilit]
  28. Chen, P.; Zhao, R. The Impact of ESG Performance on Executive Compensation Incentives. J. Reg. Financ. Res. 2024, 03, 33–42. (In Chinese) [Google Scholar]
  29. Zhang, K.; Shan, W.; Zhou, Y. Executive compensation, internal governance and ESG performance. Financ. Res. Lett. 2024, 66, 105614. [Google Scholar] [CrossRef] [Scilit]
  30. Bhaskar, R.; Bansal, S.; Abbassi, W.; Pandey, D.K. CEO compensation and CSR: Economic implications and policy recommendations. Econ. Anal. Policy 2023, 79, 232–256. [Google Scholar] [CrossRef] [Scilit]
  31. Haque, F.; Ntim, C.G. Executive compensation, sustainable compensation policy, carbon performance and market value. Br. J. Manag. 2020, 31, 525–546. [Google Scholar] [CrossRef] [Scilit]
  32. Li, S.; Qu, Z.; Wang, X.; Zhu, C. Does Managerial Stock-Based Compensation Improve Chinese Manufacturing Firms’ Carbon Performance? Regulating Preferences and Climate Risk Exposure. Account. Financ. 2025, 65, 3923–3945. [Google Scholar] [CrossRef] [Scilit]
  33. Amin, A.; Hossain, A.; Ranasinghe, T. Carbon emissions and CEO pay. Account. Financ. 2025, 65, 1128–1158. [Google Scholar] [CrossRef] [Scilit]
  34. Zhang, Y.J.; Wang, W. How Does China’s Carbon Emissions Trading Policy Affect the Financing of High-Carbon Enterprises? Energy J. 2024, 45, 223–245. [Google Scholar] [CrossRef] [Scilit]
  35. Li, R.; Wang, K.; Chen, S.; Lu, W. Impact of corporate carbon emission reduction on financing constraints. Environ. Sci. Pollut. Res. 2023, 30, 115228–115245. [Google Scholar] [CrossRef] [Scilit]
  36. Liu, X.; Cifuentes-Faura, J.; Wang, C.A.; Wang, L. Can green finance policy reduce corporate carbon emissions? Evidence from a quasi-natural experiment in China. Br. Account. Rev. 2025, 57, 101540. [Google Scholar] [CrossRef] [Scilit]
  37. Yuan, Z.; Bao, X. Corporate Financing Constraints and Environmental Information Disclosure Hype. Int. Rev. Econ. Financ. 2025, 102, 104284. [Google Scholar] [CrossRef] [Scilit]
  38. Shi, G.; Dong, A. Executive Incentives, Technological Innovation and ESG Performance: The Moderating Roles of Digital Transformation and Financing Constraints. J. Tech. Econ. Manag. 2025, 146–152. (In Chinese) [Google Scholar]
  39. Shen, H.; Huang, N. Will the Carbon Emission Trading Scheme Improve Firm Value? Financ. Trade Econ. 2019, 40, 144–161. (In Chinese) [Google Scholar]
  40. Yin, X. Impact of government procurement on ESG performance of enterprises: Based on empirical data from A-share. J. Liaoning Tech. Univ. (Soc. Sci. Ed.) 2025, 27, 460–468. (In Chinese) [Google Scholar]
  41. Yin, X.; Ming, H.; Geng, J. Impact of Executive Compensation Incentive on The Efficiency of Enterprise Resource Allocation—Distinguish Property Right and Industry. China Soft Sci. 2021, 260–267. (In Chinese) [Google Scholar]
  42. Ning, X.; Li, L. The Impact of Artificial Intelligence on the ESG Performance of Manufacturing Enterprises: A Perspective Based on Financing Constraints and Independent Director Oversight. Res. Financ. Account. 2025, 58–68+80. (In Chinese) [Google Scholar]
  43. Perera, K.; Kuruppuarachchi, D.; Kumarasinghe, S.; Suleman, M.T. The impact of carbon disclosure and carbon emissions intensity on firms’ idiosyncratic volatility. Energy Econ. 2023, 128, 107053. [Google Scholar] [CrossRef] [Scilit]
  44. Long, W.; Zhang, M.; Hu, J. Can emissions trading regulations promote the low-carbontransition of manufacturing industry?—Based on the research of corporate fixed-asset investment propensity. Nankai Bus. Rev. 2025, 1–36. Available online: https://link.cnki.net/urlid/12.1288.f.20250817.1905.002 (accessed on 1 March 2026). (In Chinese)
  45. Zhang, H.Y. Research on the Influence of ESG Information Disclosure on Corporate Carbon Emission Reduction. Mod. Ind. Econ. Inf. 2024, 14, 197–199. (In Chinese) [Google Scholar] [CrossRef]
  46. Jiang, T. Mediating Effects and Moderating Effects in Causal Inference. China Ind. Econ. 2022, 100–120. (In Chinese) [Google Scholar] [CrossRef]
  47. Yin, F.; Xiao, Y.; Cao, R.; Zhang, J. Impacts of ESG disclosure on corporate carbon performance: Empirical evidence from listed companies in heavy pollution industries. Sustainability 2023, 15, 15296. [Google Scholar] [CrossRef] [Scilit]
  48. Feng, H.; Zhang, Z.; Wang, Q.; Yang, L. Does a Company’s position within the interlocking director network influence its ESG performance?—Empirical evidence from Chinese listed companies. Sustainability 2024, 16, 4190. [Google Scholar] [CrossRef] [Scilit]
  49. Zhang, Z.; Feng, Y.; Zhou, H.; Chen, L.; Liu, Y. The impact of climate policy uncertainty on the ESG performance of enterprises. Systems 2024, 12, 495. [Google Scholar] [CrossRef] [Scilit]
  50. Cheng, Y.; Zeng, B.; Lin, W. Heterogenous effects of inclusive digital economy and resource distribution mismatch on corporate ESG performance in China. Resour. Policy 2024, 92, 104973. [Google Scholar] [CrossRef] [Scilit]
  51. Jia, G.; Bai, E. The green credit policy and the ESG performance of heavily polluting enterprises in China. Front. Earth Sci. 2025, 13, 1502190. [Google Scholar] [CrossRef] [Scilit]
Figure 1. This figure illustrates the relationship between automotive manufacturers’ ESG performance and carbon emissions. Here, the vertical axis LNTPF represents the logarithm of carbon emissions of automotive manufacturers, while the horizontal axis ESG represents ESG balance. Since we have taken the logarithm of corporate carbon emissions, negative values may appear on the vertical axis.
Sustainability 18 02590 g001
Figure 2. This is a marginal effect diagram. It demonstrates the ESG performance on carbon emission intensity effects across the range of financing constraints.
Sustainability 18 02590 g002
Table 1. Definition of variables.
Variable TypeVariableDescription and Measurement
Explained variablelnCLogarithmic carbon emission intensity
Explanatory variableESGWind ESG scores
Mediating variablePayNatural logarithm of the total compensation of the top three executives
Moderator variableSaSA index
Control variablesSizeNatural logarithm of the market capitalization of firms
LevRatio of total debt to total equity
RoaRatio of net income to total assets
SoeIf the enterprise’s ownership nature is state-owned, assign a value of 1; otherwise, assign a value of 0
BoardNatural logarithm of the number of board members
IndepNumber of independent directors/total number of board members
TobinQMarket value/total assets
Table 2. Summary statistics.
VariableObsMeanStd. Dev.MinMax
lnC1185−11.2650.581−11.848−8.994
ESG118572.7714.64459.4783.12
Size118522.4181.33919.98726.483
Lev11850.4570.1870.090.936
Roa11850.0430.051−0.1470.167
Soe11850.3330.47201
Board11852.1370.2161.6092.833
Indep118536.9184.95633.3357.14
TobinQ11851.6930.8580.8365.616
Table 3. Correlation analysis.
Variables(1)(2)(3)(4)(5)(6)(7)(8)(9)
(1) lnC1.000
(2) ESG−0.107 *1.000
(0.000)
(3) Size0.0460.233 *1.000
(0.115)(0.000)
(4) Lev0.217 *−0.116 *0.488 *1.000
(0.000)(0.000)(0.000)
(5) Roa0.0000.267 *−0.047−0.408 *1.000
(0.996)(0.000)(0.106)(0.000)
(6) Soe0.227 *−0.0540.382 *0.400 *−0.107 *1.000
(0.000)(0.063)(0.000)(0.000)(0.000)
(7) Board0.105 *−0.0350.330 *0.210 *−0.0520.377 *1.000
(0.000)(0.223)(0.000)(0.000)(0.074)(0.000)
(8) Indep−0.067 *0.146 *−0.032−0.051−0.044−0.140 *−0.558 *1.000
(0.022)(0.000)(0.277)(0.082)(0.132)(0.000)(0.000)
(9) TobinQ−0.006−0.140 *−0.366 *−0.197 *0.115 *−0.072 *−0.097 *0.0401.000
(0.840)(0.000)(0.000)(0.000)(0.000)(0.013)(0.001)(0.167)
Note: In all panels, * indicate statistical significance at the 10% levels.
Table 4. F- and Hausman test.
Explanatory VariableF TestHausman Test
ESGF-statisticp valueX2p value
26.77p > F = 0.00171.21p > X2 = 0.00
Table 5. Heteroscedasticity test.
Variable(1)(2)
Standard ErrorRobust Standard Error for Clustering
ESG−0.00139 ***−0.00139 ***
(0.00041)(0.00051)
Size−0.00302−0.00302
(0.00480)(0.01234)
Lev0.07874 ***0.07874 **
(0.01951)(0.03529)
Roa−0.65701 ***−0.65701 ***
(0.04190)(0.07332)
Soe0.000000.00000
(.)(.)
Board0.000970.00097
(0.01674)(0.02349)
Indep−0.00054−0.00054
(0.00056)(0.00064)
TobinQ−0.00494 **−0.00494
(0.00241)(0.00504)
_cons−8.93301 ***−8.93301 ***
(0.11399)(0.24870)
N11851185
idYESYES
yearYESYES
R20.992830.99380
Modified Wald testχ2 = 3.2 × 1030 ***(p = 0.0000)
Note: The values in parentheses represent cluster-wise robust standard errors at the individual level. The Modified Wald test revealed significant between-group heteroscedasticity (χ2 = 3.2 × 1030, p = 0.0000), necessitating the use of cluster-wise robust standard errors. In all panels, **, and *** indicate statistical significance at the 5% and 1% levels, respectively. (.) Since this study employs panel fixed effects, Soe—a firm characteristic that does not change over time (i.e., whether a firm is state-owned typically remains constant)—is absorbed by the fixed effects, resulting in unestimable coefficients.
Table 6. Baseline regression results.
Variable(1)(2)
lnClnC
ESG−0.00251 ***−0.00139 ***
(0.00056)(0.00051)
Size −0.00302
(0.01234)
Lev 0.07874 ***
(0.03529)
Roa −0.65701 ***
(0.07332)
Soe 0.00000
(.)
Board 0.00097
(0.02349)
Indep −0.00054
(0.00064)
TobinQ −0.00494
(0.00504)
_cons−8.95634 ***−8.93301 ***
(0.04082)(0.24870)
N11851185
idYESYES
yearYESYES
R20.991750.99380
F8567.071769232.77621
Note: The R2 in the table represents the within-group R2 (Within R2), reflecting the extent to which ESG performance and control variables explain the temporal variation in a company’s internal carbon emission intensity. Because the automotive manufacturing industry is capital-intensive and technology-intensive, carbon emission intensity is primarily determined by factors such as production processes, energy structure, and equipment levels. These factors are either captured by firm-specific effects or reflected through ESG performance and control variables. Consequently, core variables and firm-specific effects collectively explain most of the variation in emissions within firms, leading to elevated partial R2 values within groups. The same applies below. In all panels, *** indicate statistical significance at the 1% levels.
Table 7. Robustness test results.
Variable(1)(2)(3)(4)(5)
lnClnClnClnC1lnC
ESG−0.00139 *** −0.00130 **−0.00676 ***−0.00155 ***
(0.00051) (0.00059)(0.00258)(0.00057)
ESG2 −0.00530 **
(0.00227)
Size−0.00302−0.00311−0.015430.05476−0.00348
(0.01234)(0.01237)(0.01031)(0.03581)(0.01305)
Lev0.07874 ***0.07983 **0.08590 **0.29972 ***0.07532 *
(0.03529)(0.03514)(0.03606)(0.10395)(0.03834)
Roa−0.65701 ***−0.66250 ***−0.64897 ***0.72724 **−0.56967 ***
(0.07332)(0.07344)(0.08133)(0.29227)(0.15856)
Soe0.000000.000000.000000.000000.00000
(.)(.)(.)(.)(.)
Board0.000970.002460.009250.03794−0.01959
(0.02349)(0.02351)(0.03325)(0.09956)(0.03746)
Indep−0.00054−0.00053−0.00043−0.00101−0.00085
(0.00064)(0.00064)(0.00086)(0.00335)(0.00087)
TobinQ−0.00494−0.00474−0.004550.00856−0.00732
(0.00504)(0.00505)(0.00670)(0.01864)(0.00707)
_cons−8.93301 ***−9.01574 ***−8.69671 ***−1.75898 **−8.84949 ***
(0.24870)(0.25307)(0.23662)(0.85679)(0.31322)
N118511857589541185
idYESYESYESYESYES
yearYESYESYESYESYES
R20.993800.993780.996780.048350.99212
F9232.776219305.4961310,674.121093.797947258.58704
Note: We use varying numbers of asterisks in the table footer primarily to indicate the significance of statistical tests, with more asterisks signifying greater statistical significance. *, ** and *** indicate statistical significance at the 10%, 5% and 1% levels, respectively. (.) Since this article employs panel fixed effects, Soe—a firm characteristic that does not change over time (i.e., whether a firm is state-owned typically remains constant)—is absorbed by the fixed effects, resulting in unestimable coefficients.
Table 8. Endogeneity test results.
Variable(1)(2)(3)(4)(5)(6)(7)(8)
ESGlnCESGlnCESGlnCESGlnC
lESG0.37106 ***−0.00101 **
(0.03254)(0.00050)
l2ESG 0.28238 ***−0.00062
(0.04172)(0.00069)
l3ESG 0.32871 ***0.00067
(0.04996)(0.00076)
l4ESG 0.29616 ***0.00074
(0.05986)(0.00092)
Size−0.275060.001360.259920.005931.39290 *0.002460.50727−0.00081
(0.45064)(0.01544)(0.61976)(0.01983)(0.71287)(0.02306)(0.84339)(0.02349)
Lev0.594330.07139 *2.112060.085891.525360.093651.284030.08599
(1.77389)(0.04253)(1.97470)(0.05345)(2.35710)(0.06121)(3.13850)(0.05870)
Roa12.72571 ***−0.63600 ***5.24810−0.57475 ***−1.24331−0.51091 ***−15.22197 ***−0.57220 ***
(3.64643)(0.08314)(4.14456)(0.09355)(3.96536)(0.09785)(4.70172)(0.09417)
Soe0.000000.000000.000000.000000.000000.000000.000000.00000
(.)(.)(.)(.)(.)(.)(.)(.)
Board−2.31291−0.00333−1.32253−0.008132.45157−0.017465.21478 ***−0.01148
(1.71340)(0.02860)(1.59953)(0.03462)(1.59391)(0.03573)(1.57934)(0.03868)
Indep−0.01564−0.000680.00112−0.000720.05306−0.001060.12983 ***−0.00081
(0.04987)(0.00077)(0.05850)(0.00097)(0.04934)(0.00115)(0.04862)(0.00130)
TobinQ−0.22496−0.007620.44472 *−0.010890.19536−0.01557 *0.33283−0.02312 **
(0.17619)(0.00561)(0.23208)(0.00673)(0.30336)(0.00799)(0.24343)(0.00925)
_cons54.40206 ***−9.00867 ***47.22193 ***−11.45285 ***9.27140−11.47505 ***22.86180−11.52323 ***
(10.44812)(0.32477)(14.91968)(0.41828)(15.78043)(0.50615)(18.29672)(0.52528)
N980980791791652652531531
idYESYESYESYESYESYESYESYES
yearYESYESYESYESYESYESYESYES
R20.181230.989270.085640.881450.126830.891370.138340.90673
F14.779395972.913485.96984214.579976.74477192.9344810.67449165.58182
Note: We use varying numbers of asterisks in the table footer primarily to indicate the significance of statistical tests, with more asterisks signifying greater statistical significance. *, ** and *** indicate statistical significance at the 10%, 5% and 1% levels, respectively. (.) Since this study employs panel fixed effects, Soe—a firm characteristic that does not change over time (i.e., whether a firm is state-owned typically remains constant)—is absorbed by the fixed effects, resulting in unestimable coefficients.
Table 9. Results of heterogeneity analysis.
VariableLarge-Scale EnterprisesSmall-Scale EnterprisesState-Owned EnterpriseNon-State-Owned Enterprises
lnClnClnClnC
ESG−0.00540−0.05315 *0.00064−0.00221 ***
(0.00772)(0.02904)(0.00073)(0.00062)
ESG × Size0.000200.00238 *
(0.00033)(0.00135)
ESG × Soe 0.000000.00000
(.)(.)
Size−0.00053−0.19990 *0.00223−0.01522
(0.02855)(0.10174)(0.01462)(0.01652)
Lev0.017840.047350.005030.10176 **
(0.04291)(0.04888)(0.05025)(0.04135)
Roa−0.49897 ***−0.82376 ***−0.57950 ***−0.63528 ***
(0.09023)(0.12115)(0.09782)(0.10083)
Soe0.000000.000000.000000.00000
(.)(.)(.)(.)
Board0.01519−0.085060.02908−0.02697
(0.02541)(0.07445)(0.03110)(0.03396)
Indep−0.00049−0.00192−0.00033−0.00093
(0.00088)(0.00130)(0.00094)(0.00089)
TobinQ−0.00826 *−0.01131−0.00651−0.00659
(0.00434)(0.00704)(0.00438)(0.00691)
_cons−8.97151 ***−4.50654 **−9.16451 ***−8.60451 ***
(0.65327)(2.25251)(0.27589)(0.34768)
N560585395790
idYESYESYESYES
yearYESYESYESYES
R20.995010.985730.996940.98973
F5248.061482310.5144134,228.259894248.15177
Note: We use varying numbers of asterisks in the table footer primarily to indicate the significance of statistical tests, with more asterisks signifying greater statistical significance. *, ** and *** indicate statistical significance at the 10%, 5% and 1% levels, respectively. (.) Since this study employs panel fixed effects, Soe—a firm characteristic that does not change over time (i.e., whether a firm is state-owned typically remains constant)—is absorbed by the fixed effects, resulting in unestimable coefficients.
Table 10. Results of mediation effect analysis.
Variable(1)(2)(3)
lnCPaylnC
ESG−0.00139 ***0.00781 **−0.00135 **
(0.00051)(0.00355)(0.00050)
Pay −0.45098 *
(0.21806)
Size−0.003020.25949 ***−0.00424
(0.01234)(0.06701)(0.01228)
Lev0.07874 **−0.170080.08193 *
(0.03529)(0.17625)(0.03524)
Roa−0.65701 ***1.31157 ***−0.65888 ***
(0.07332)(0.35279)(0.07306)
Soe0.000000.000000.00000
(.)(.)(.)
Board0.00097−0.135310.00032
(0.02349)(0.15700)(0.02360)
Indep−0.00054−0.00667−0.00058
(0.00064)(0.00576)(0.00064)
TobinQ−0.00494−0.01361−0.00493
(0.00504)(0.02135)(0.00499)
_cons−8.93301 ***8.23835 ***−8.69528 ***
(0.24870)(1.52387)(0.27787)
N118511251185
idYESYESYES
yearYESYESYES
R20.993800.449120.99392
F9232.7762118.118208889.88787
Note: We use varying numbers of asterisks in the table footer primarily to indicate the significance of statistical tests, with more asterisks signifying greater statistical significance. *, ** and *** indicate statistical significance at the 10%, 5% and 1% levels, respectively.
Table 11. Bootstrap mediated effect test table.
EffectBootSEBootstrapping
Bias-Corrected 95% CIPercentile 95%
LowerUpperLowerUpper
Total effect0.00326−0.01948−0.00759−0.01930−0.00750
Direct effect0.00321−0.01537−0.00241−0.01537−0.00241
Indirect effect0.00127−0.00742−0.00229−0.00720−0.00206
Table 12. Results of moderation effect analysis.
Variable(1)(2)
lnClnC
ESG−0.00139 ***−0.00222 ***
(0.00051)(0.00048)
Sa 0.02344 **
(0.00805)
ESG × Sa −0.00479 **
(0.00151)
Size−0.003020.00195
(0.01234)(0.00505)
Lev0.07874 **0.07579 ***
(0.03529)(0.02037)
Roa−0.65701 ***−0.67582 ***
(0.07332)(0.04386)
Soe0.000000.00000
(.)(.)
Board0.00097−0.00296
(0.02349)(0.01683)
Indep−0.00054−0.00066
(0.00064)(0.00056)
TobinQ−0.00494−0.00622 *
(0.00504)(0.00246)
_cons−8.93301 ***−8.93715 ***
(0.24870)(0.11664)
N11851064
idYESYES
yearYESYES
R20.993800.99485
F9232.776218146.64191
Note: We use varying numbers of asterisks in the table footer primarily to indicate the significance of statistical tests, with more asterisks signifying greater statistical significance. *, ** and *** indicate statistical significance at the 10%, 5% and 1% levels, respectively. (.) Since this study employs panel fixed effects, Soe—a firm characteristic that does not change over time (i.e., whether a firm is state-owned typically remains constant)—is absorbed by the fixed effects, resulting in unestimable coefficients.
Disclaimer/Publisher’s Note: The statements, opinions and data contained in all publications are solely those of the individual author(s) and contributor(s) and not of MDPI and/or the editor(s). MDPI and/or the editor(s) disclaim responsibility for any injury to people or property resulting from any ideas, methods, instructions or products referred to in the content.