Article

Does Sustainability Pay in Tourism? Market Segmentation and Green Premiums in the Restaurant Industry


School of Business Administration, Southwestern University of Finance and Economics, 555 Liutai Avenue, Chengdu 611130, China
*
Author to whom correspondence should be addressed.
Sustainability 2026, 18(5), 2363; https://doi.org/10.3390/su18052363
Submission received: 2 February 2026 / Revised: 23 February 2026 / Accepted: 27 February 2026 / Published: 28 February 2026

Abstract

Within the hospitality sector, restaurants face growing pressure to integrate sustainable practices while maintaining economic viability. Two fundamental questions remain: do sustainability practices command price premiums, and does this relationship vary across market segments? This study employs dictionary-based text analysis to quantify sustainability practices from approximately 4.4 million consumer reviews spanning 38,930 U.S. restaurants (2018–2023). We make two methodological contributions: First, we identify a measurement artifact—sigmoid normalization applied to sparse keyword data can inflate regression coefficients by 25–44×—and we propose a log-density transformation that preserves measurement validity. Second, using hedonic pricing models with city and cuisine fixed effects, ordered logit specifications, and interaction models, we document a monotonically decreasing relationship between restaurant quality and sustainability-associated price premiums. Lower-rated establishments (<3.0 stars) exhibit a positive premium of +2.60%, mid-tier restaurants (3.0–4.0 stars) exhibit −0.61%, and higher-rated establishments (>4.0 stars) exhibit −2.06%. The interaction between sustainability and star rating is strongly negative ( β int = 0.042 , p < 0.001 ), indicating that sustainability’s marginal pricing association diminishes by approximately 4.2 percentage points per additional star. These results suggest that sustainability functions as a quality signal in lower-tier markets but transitions to a baseline expectation in higher-quality segments. The findings inform differentiated strategies for restaurant operators, certification bodies, and policymakers.

1. Introduction

The tourism and hospitality industries occupy a central position in global sustainability transformation. As the sector recovers from pandemic-era disruptions, stakeholders face growing pressure to reconcile business operations with environmental imperatives while preserving economic viability [1,2]. Digital technologies increasingly facilitate evidence-based sustainability assessment across hospitality ecosystems [3]. Within this context, food service establishments—integral to destination competitiveness and visitor experience—represent both significant environmental liabilities [4,5] and potential pathways for sustainable innovation [6].
Restaurants constitute a critical yet insufficiently examined dimension of hospitality sustainability. The food service sector accounts for approximately 8–10% of global greenhouse gas emissions through energy-intensive operations, supply chain logistics, and food waste generation [7]. In the United States alone, restaurants generate over 11 million tons of annual food waste while consuming substantial water and energy resources [8]. These environmental externalities directly intersect with the United Nations Sustainable Development Goals, particularly SDG 12 (Responsible Consumption and Production) and SDG 13 (Climate Action).
Consumer environmental awareness has intensified in recent years [9], with diners showing growing interest in sustainable dining options beyond superficial “greenwashing” claims [10]. Restaurants respond through sustainability practices including local and organic sourcing, waste reduction protocols, energy-efficient equipment, and water conservation technologies [11,12]. The concept of “sustainable sushi,” for example, illustrates how leading sushi restaurants globally are implementing self-disclosed food sustainability measures [13]. The economic viability of these sustainability practices, specifically, whether they command sufficient price premiums to offset implementation costs, presents a complex challenge: do these practices command sufficient price premiums to offset implementation costs or do they necessitate ongoing subsidization?
Existing empirical evidence yields divergent conclusions regarding sustainability’s economic returns in hospitality. Some studies document positive “green premiums,” including eco-certification revenue effects in hotels [14], consumer willingness to pay for sustainable food products [15], brand-framing effects on green hotel premiums [16], and legacy-motivated packaging premiums [17]. Others report ambiguous or negative effects: Andreica Mihuţ et al. [18] explored the “green paradox” whereby perceived greenwashing erodes consumer trust, producing negative economic consequences; Haldorai et al. [19] found through longitudinal analysis that the relationship between environmental practices and financial performance remains inconclusive, as implementation costs may offset financial gains; and Elhoushy et al. [20] confirmed in a systematic review that sustainable tourism certifications yield mixed results, with many failing to deliver the expected economic returns. We contend that these contradictions reflect several interrelated methodological shortcomings: Standard text analysis normalization techniques can substantially distort coefficient estimates when applied to sparse keyword data—a computational artifact we identify and quantify below. Existing studies also share a sampling constraint: reliance on small samples (typically N < 1000) and self-reported metrics limits statistical power and external validity. Compounding both issues, the prevailing failure to accommodate market positioning heterogeneity obscures segment-specific dynamics that pooled estimates cannot capture.
The central research questions guiding this investigation are: how does the association between sustainability practices and restaurant pricing vary across market quality segments, and what measurement considerations affect the reliability of text-based sustainability quantification?
This study analyzes 38,930 U.S. restaurants and approximately 4.4 million consumer reviews (2018–2023) to examine how sustainability-associated price premiums vary across market segments. Using dictionary-based text analysis, hedonic pricing models with city and cuisine fixed effects, ordered logit specifications, and interaction models, we document a monotonically decreasing pattern: sustainability practices are associated with positive price premiums in lower-rated restaurants (+2.60%), declining to negative associations in mid-rated (−0.61%) and higher-rated (−2.06%) establishments. This pattern is confirmed by a strongly negative sustainability × stars interaction ( β = 0.042 , p < 0.001 ) and is robust to alternative specifications including ordered logit models and city-clustered standard errors.
These findings carry implications for operators, policymakers, and researchers alike. Restaurant operators can calibrate sustainability investment strategies to their market positioning, while certification bodies and policymakers may benefit from designing differentiated support programs rather than uniform incentive structures. From a methodological standpoint, pooled estimates of sustainability premiums can obscure meaningful variation across quality segments—a risk that extends to the broader empirical literature.
The study makes three contributions: Methodologically, we identify and demonstrate a measurement artifact whereby sigmoid normalization applied to sparse keyword counts can inflate coefficient estimates by 25–44× depending on normalization parameters, and we propose a log-density transformation that preserves measurement validity. Empirically, we provide large-scale evidence that the sign and magnitude of the sustainability–price association vary systematically with restaurant quality positioning. Theoretically, the results shed new light on how sustainability may transition from a competitive differentiator to a baseline expectation as market quality rises.
The remainder of this paper is organized as follows: Section 2 reviews the literature. Section 3 describes data and methods. Section 4 presents results. Section 5 discusses implications and limitations. Section 6 concludes.

2. Literature Review

2.1. Hospitality Sustainability and Restaurant Innovation

While the restaurant sector’s environmental liabilities are well documented (Section 1), the academic response has increasingly shifted from quantifying impacts to investigating mitigation pathways. Circular economy frameworks—encompassing food waste recovery, reusable packaging, and closed-loop supply chains—offer both environmental and economic benefits [21,22]. Emerging scholarship is investigating behavioral interventions, such as menu design nudges and default option manipulation, to promote sustainable dining choices [23,24], while industry-level transitions toward carbon-neutral operations align with broader climate mitigation targets [25,26].
Despite these advances, adoption barriers impede sustainability diffusion among small and medium-sized independent restaurants—the dominant ownership structure in the industry. Principal obstacles include substantial upfront capital costs, limited sustainable supplier availability, and knowledge deficits concerning best practices [11,27]. The pandemic-era disruption of established business models created windows for green innovation adoption yet also intensified financial constraints that limit investment capacity [1,8]. Critically, uncertainty regarding economic returns remains the most consequential barrier: insufficient evidence on whether sustainability generates price premiums or requires ongoing subsidization creates informational asymmetries that impede rational investment decisions.
The growing availability of large-scale consumer review platforms offers a promising avenue for addressing this evidence gap. Online reviews have demonstrated significant influence in purchasing decisions and business performance [28] and carry real economic consequences—including effects on small business lending [29]—establishing that review-derived measures have material economic validity. However, the integrity of online reviews faces systematic threats, including organized fraudulent review production [30] and reputation bias [31], requiring careful methodological design when leveraging such data for empirical analysis. We therefore turn to existing theory and empirical evidence to examine what determines whether sustainability investments command price premiums.

2.2. The Green Premium Debate: Theory and Evidence

Economic theory yields competing predictions regarding sustainability and pricing. The theoretical foundations for green premium formation draw on several complementary frameworks. Signaling theory [32] posits that costly sustainability investments serve as credible signals of otherwise unobservable quality attributes, a mechanism particularly effective under information asymmetry. Value–Belief–Norm (VBN) theory extends this logic by modeling the psychological pathway from environmental values to behavioral intentions. Majeed et al. [33] applied this framework to green corporate social responsibility (CSR) in hospitality, demonstrating that consumers’ environmental worldview, awareness of consequences, and ascription of responsibility sequentially mediate willingness-to-pay premiums for green hotel attributes. Complementing VBN theory, Pan and Zhou [34] synthesized evidence on pro-environmental behavior in hospitality, identifying social norms, perceived behavioral control, and environmental attitude as key antecedents of sustainable consumption—mechanisms that collectively underpin the demand-side basis for green pricing power. Additionally, conspicuous conservation facilitates identity expression and social status signaling, particularly among environmentally conscious consumers [35].
Empirical evidence on green premiums in hospitality has grown substantially in recent years, though findings remain heterogeneous. In the hotel sector, willingness-to-pay (WTP) studies document positive premiums for eco-certified attributes [16,36], yet these effects vary by cultural context and consumer segment. In the restaurant and food service sector, Kesgin et al. [17] found significant WTP premiums for sustainable food packaging, moderated by environmental concern and dining context. Meta-analytic evidence reinforces these positive signals: Li and Kallas [37] synthesized 80 global studies and documented an average willingness-to-pay premium of 29.5% for sustainable food products, while Yu et al. [38] demonstrated that comparative advertising for organic ingredients significantly elevates WTP premiums in restaurant contexts. However, certification-based studies reveal important boundary conditions: Mao et al. [39] found that TripAdvisor’s GreenLeaders certification had mixed revenue effects—positive for luxury-tier properties but negligible or negative for economy-tier establishments—an early indication that sustainability’s economic returns may depend on market positioning. Similarly, Assaker and O’Connor [40] reported that certification influenced booking intentions primarily among environmentally committed consumer segments, suggesting limited pricing power beyond niche markets.
Conversely, the null-or-negative hypothesis identifies pathways whereby sustainability might fail to generate pricing power. If implementation costs substantially exceed consumer willingness to pay, restaurants may absorb costs through margin compression rather than price increases. Specific sustainable practices—waste reduction, energy efficiency, local sourcing—may reduce operating costs, facilitating price reductions while preserving profitability [8]. As sustainability practices proliferate, competitive dynamics may erode first-mover advantages. Longitudinal evidence confirms that environmental practices do not reliably translate to financial gains, as implementation costs may offset revenue benefits [19], and systematic reviews of sustainable tourism certifications have found mixed or negligible economic returns across certification programs [20]. Context-dependent associations between environmental practices and pricing outcomes further underscore the absence of a universal green premium [18].
Taken together, the empirical literature reveals a paradox: individual studies document either positive or null/negative premiums, yet no consensus emerges. We contend that this inconsistency reflects two interrelated limitations: First, a substantive gap: existing studies share common methodological constraints such as reliance on stated-preference surveys (typically N < 1000), single-certification designs, and failure to account for market segment heterogeneity. Second, a measurement gap: text-based approaches to sustainability measurement involve normalization, weighting, and aggregation choices that can substantially affect results [41,42,43], yet these choices are rarely subjected to systematic scrutiny in hospitality applications. Dictionary-based text analysis of consumer reviews—combining transparency and reproducibility [44,45] with scalability across large corpora [46]—offers a pathway to address both gaps simultaneously, yet, in applying this approach, we identify a previously undocumented measurement artifact whereby sigmoid normalization of sparse keyword counts can inflate coefficient estimates by 25–44×, underscoring that the measurement gap remains an active methodological challenge. Closing the substantive gap in turn requires explicit attention to whether premiums vary across market segments—the theoretical question we develop next.

2.3. Market Segmentation and Quality-Dependent Premiums

Restaurant markets exhibit pronounced stratification. Quality tiers—from fast food to casual dining to fine dining—serve distinct clientele segments with divergent price sensitivities, value perceptions, and sustainability expectations. The hedonic pricing framework [47] provides the conceptual foundation for decomposing product prices into implicit valuations of constituent attributes. Recent applications of hedonic methods to hospitality have exploited large-scale online data: Sanchez-Lozano et al. [48] applied big data hedonic pricing models to hospitality establishments, demonstrating that location, amenities, online reputation, and service attributes jointly explain substantial pricing variation, with online reputation measures (star ratings, review sentiment) emerging as particularly influential determinants. Signaling theory [49] predicts that sustainability’s utility as a quality signal should diminish as baseline quality increases: in low-quality segments where information asymmetry is high, sustainability provides a valuable credible signal; in high-quality segments where quality is already well established, sustainability adds less informational value.
Identity-based consumption frameworks predict that sustainability facilitates self-expression most effectively for middle-status consumers pursuing differentiation [35]. High-status consumers may perceive sustainability as a baseline requirement rather than a differentiator, while price-sensitive consumers may prioritize affordability over environmental attributes [50,51]. The empirical evidence reviewed above provides indirect support for this quality-contingent hypothesis: Mao et al.’s (2023) [39] finding that GreenLeaders certification benefits luxury but not economy hotels and Assaker and O’Connor’s (2023) [40] finding that certification effects concentrate among committed segments both suggest that sustainability’s pricing power varies systematically across market positions.
These theoretical perspectives lead us to hypothesize that sustainability premiums decrease monotonically with restaurant quality, being positive in lower-tier segments (quality signaling mechanism), diminishing through mid-tier segments, and approaching zero or becoming negative in upper-tier segments (baseline expectation). The empirical framework and measurement approach employed to test this hypothesis are described in the following section.

3. Data and Methods

3.1. Data Sources

We employ the Yelp Academic Dataset (2023 release), which provides business and review data for commercial establishments across the United States. From the full dataset, we extract all establishments classified as “Restaurants” or “Food,” yielding 52,268 establishments. We apply two filters: price tier information availability (retaining 44,484 establishments) and minimum review volume (at least 10 reviews, yielding 38,930 establishments). Table 1 documents this sample construction process.
For each establishment, we compile the (1) aggregate star rating (1–5 scale), (2) price tier ($, $$, $$$, $$$$), (3) review count, (4) location (city, state), (5) business categories, (6) business name (for chain identification), and (7) the full text of all user reviews. The sample encompasses approximately 4.4 million reviews spanning 2018–2023.
This dataset offers several advantages for studying sustainability pricing: the large sample size enables detection of heterogeneous effects across segments; consumer-generated reviews represent authentic dining experiences rather than hypothetical survey responses susceptible to social desirability bias, with documented associations between online reviews and business outcomes [29]; and comprehensive sustainability capture encompasses both formal certification and informal practices as perceived by actual patrons.
However, consumer-generated reviews have well-documented limitations: First, representativeness: online reviewers constitute a self-selected sample that may skew toward younger, more digitally engaged demographics [28,31]. Second, manipulation: while Yelp employs proprietary algorithms to filter fraudulent content [30], some inauthentic reviews may persist. Third, extremity bias: voluntary reviewers tend to over-represent extreme experiences. We note that sustainability-related keyword mentions are unlikely targets for strategic manipulation (unlike star ratings or general praise), partially mitigating these concerns for our specific measurement approach.

3.2. Variable Construction

3.2.1. Dependent Variable: Price

Yelp categorizes restaurants into four price tiers based on approximate per-person meal cost: $ (<$10), $$ ($10–25), $$$ ($25–60), and $$$$ (>$60). Following standard hedonic pricing methodology [47], as applied to restaurant contexts by Sanchez-Lozano et al. [48], we convert these ordinal tiers to approximate dollar midpoints for regression analysis: $8.00, $17.50, $42.50, and $80.00, respectively. The first three values represent the approximate midpoints of their respective ranges; the fourth ($80) represents a conservative estimate for the open-ended upper tier. We log-transform these values for OLS estimation.
Because this conversion introduces the measurement imprecision inherent to ordinal-to-continuous mapping, we implement three validation strategies: First, we conduct sensitivity analyses, varying the Tier 4 assignment across a wide range ($65–$120), demonstrating that substantive conclusions are invariant to this choice. Second, we estimate ordered logit models treating price tier as an ordinal outcome, avoiding any cardinal assumption. Third, we verify that the monotonically decreasing subgroup pattern holds across all specifications.

3.2.2. Independent Variable: Sustainability Score

We construct a sustainability measure using dictionary-based keyword analysis of consumer review text, an approach grounded in the “text as data” paradigm, which treats unstructured text as quantifiable empirical evidence [41,42]. Dictionary-based methods—which count occurrences of pre-specified keyword lists—represent one of the most established and transparent approaches in computational text analysis [44,45,46], with documented applications across social science disciplines [43]. Rather than relying on self-reported practices or third-party certifications—which capture only the subset of restaurants pursuing formal recognition—we extract sustainability signals from unstructured review text. This approach captures the full spectrum of sustainability practices as perceived by consumers.
Three keyword categories are defined: The environmental dimension comprises nine terms: organic, local, sustainable, farm-to-table, seasonal, eco-friendly, zero-waste, compost, and renewable. Social sustainability is captured through six terms: fair-trade, ethical, community, family-owned, local business, and minority-owned. A third certification category incorporates five terms: USDA organic, certified organic, LEED certified, B-corp, and green certified.
Keyword matching employs a case-insensitive search with phrase-level matching for multi-word terms (e.g., “farm-to-table” and “farm to table” are both matched; see Appendix A for the complete pre-processing pipeline). We acknowledge that some terms (particularly “local” and “community”) can appear in non-sustainability contexts, introducing measurement noise. We address this limitation through robustness checks using subsets of less ambiguous keywords (environmental-only and social-only scores) and by noting that any resulting attenuation bias would work against finding significant effects.
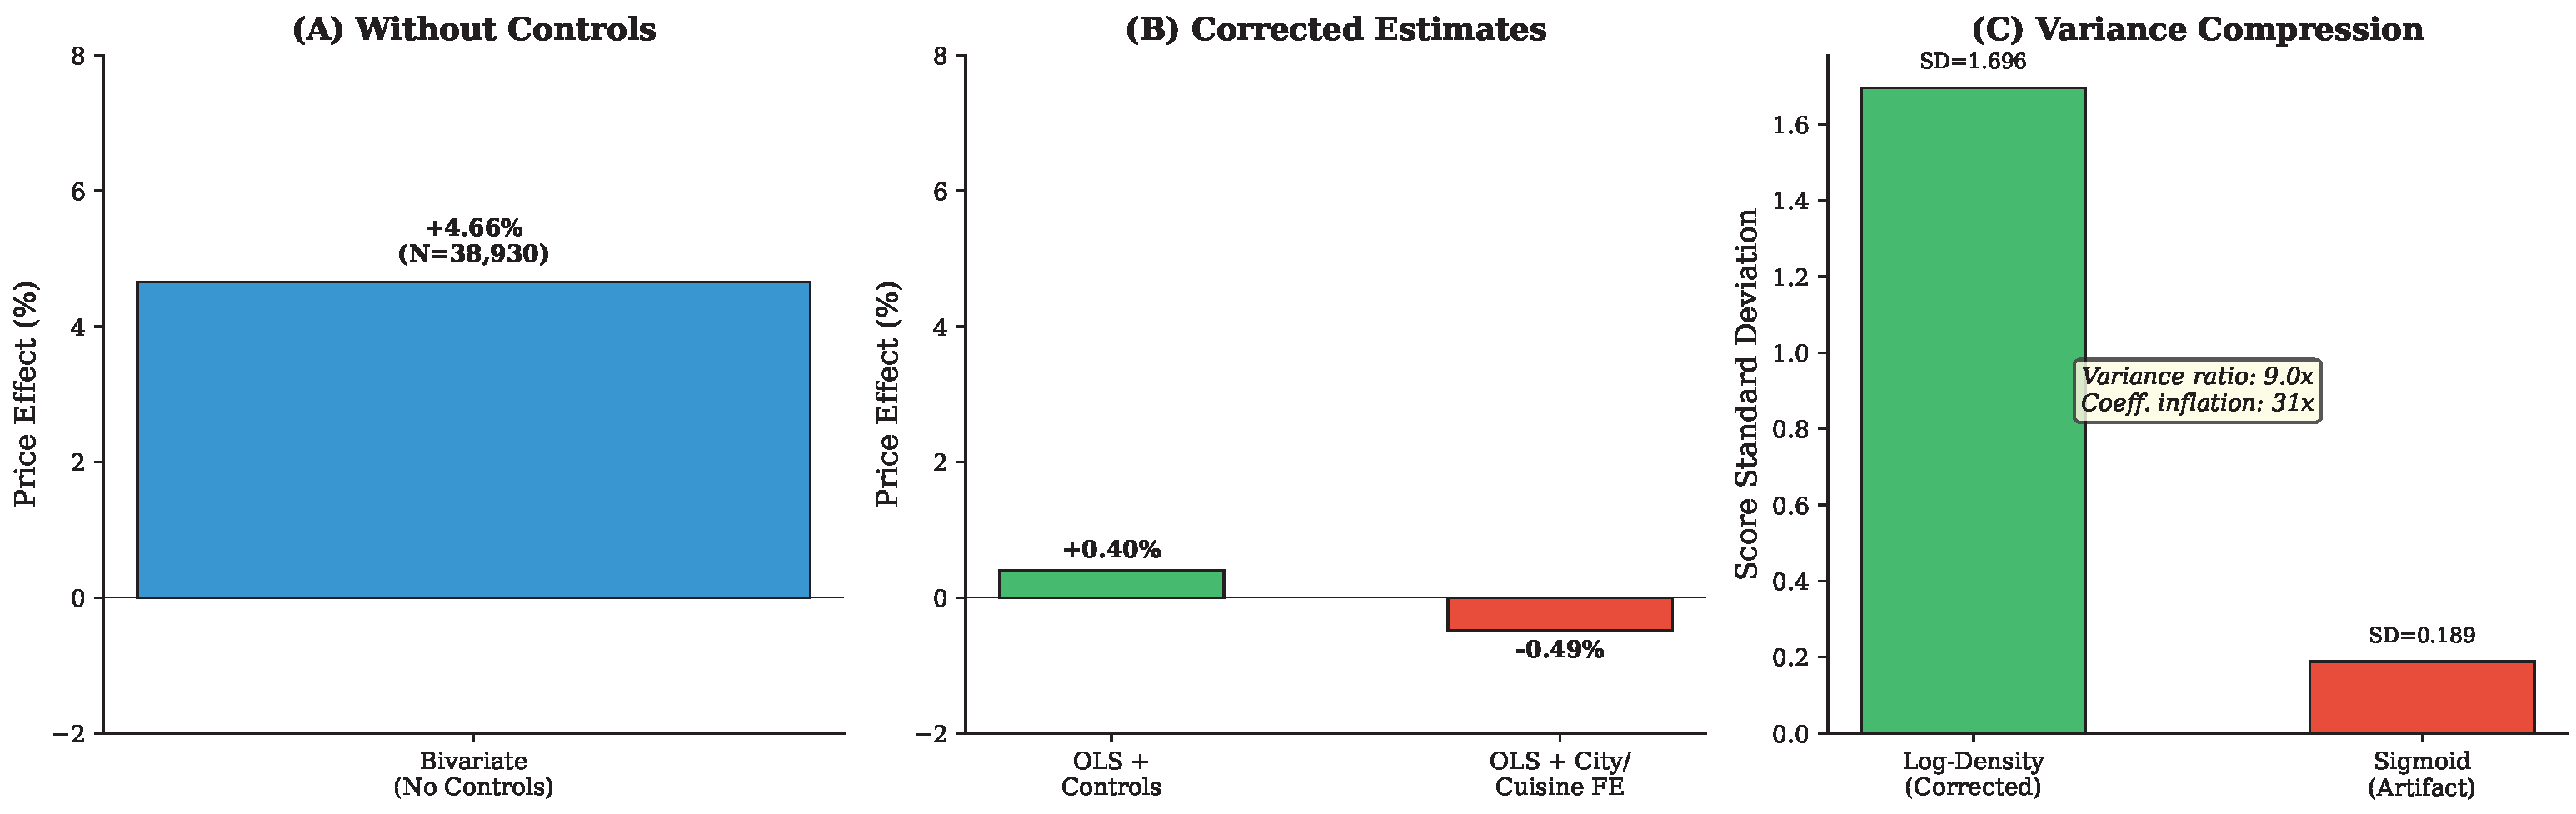
A consequential issue with sigmoid normalization, commonly employed in text analysis applications, warrants attention before proceeding: the sigmoid function S ( x ) = 1 / ( 1 + e a x ) maps inputs to ( 0 , 1 ) . For sparse keyword data where most establishments have zero or few mentions, this creates a floor effect, S ( 0 ) = 0.5 , assigning non-trivial scores to establishments with no sustainability keywords. The resulting variance compression can inflate regression coefficients substantially. Across scaling parameters ( a = 0.1 to 2.0 ), sigmoid normalization inflates the sustainability coefficient by 25–44× relative to our proposed alternative; under the standard sigmoid ( a = 1.0 ), the inflation factor is approximately 31× (see Appendix B for detailed quantification).
To avoid this artifact, we employ a log-density transformation:
Score = log 1 + KeywordCount ReviewCount × 1000
This assigns score = 0 to establishments with no keywords (preserving the zero baseline), scales by review volume (controlling for exposure), and log-transforms to handle skewness. The resulting scores range from 0 to 7.98 with standard deviation 1.70 (see Appendix C for qualitative face validation).
We construct three component scores—environmental, social, and overall (weighted composite: 0.4 × environmental + 0.3 × social + 0.3 × certification)—where the weights reflect the relative frequency distribution of keyword categories in the corpus (environmental terms are most prevalent; see Table 2). Primary analyses use the overall score; robustness checks examine components separately.

3.2.3. Control Variables

We control for (1) star rating (1–5 scale), capturing establishment quality; (2) log of review count, capturing visibility and popularity; (3) chain indicator (=1 if the business name appears ≥5 times in dataset), controlling for chain vs. independent effects; (4) cuisine type (27 categories extracted from the Yelp business categories), absorbing cuisine-specific pricing norms; and (5) city fixed effects (131 cities with ≥50 establishments; remaining cities grouped as “Other”), controlling for local cost-of-living and market conditions.

3.3. Analytical Strategy

We begin with global OLS baseline hedonic pricing models:
ln ( Price i ) = β 0 + β 1 Sustainability i + β 2 Stars i + β 3 ln ( Reviews i ) + γ Controls i + ε i
Four specifications are estimated sequentially: (M1) bivariate, (M2) with quality controls, (M3) with full city/cuisine fixed effects, chain indicator, and quality controls, and (M4) omitting star rating to examine potential mediation.
To test whether premiums vary by market segment, we then stratify the sample by star rating into three tiers—Low (<3.0 stars), Mid (3.0–4.0 stars), High (>4.0 stars)—and re-estimate the model separately for each, both with basic controls and with full fixed effects. Ordered logit models are estimated in parallel, treating price tier as an ordinal outcome and thereby avoiding the cardinal assumptions of OLS.
A continuous interaction specification then tests whether quality moderates the sustainability effect across the full rating range:
ln ( Price i ) = β 0 + β 1 Sustainability i + β 2 Stars i + β 3 ( Sustainability i × Stars i ) + Controls + ε i
A negative β 3 would indicate diminishing premiums as quality increases. Marginal effects are computed at key star values to characterize the economic profile. Finally, robustness analyses examine sensitivity to alternative Tier 4 price codings ($65–$120), alternative sustainability measures (environmental-only, social-only, binary), alternative minimum review thresholds (20, 50 reviews), and city-clustered standard errors. All OLS specifications employ heteroskedasticity-robust (HC1) standard errors.

4. Results

4.1. Descriptive Statistics

Table 2 summarizes the sample’s characteristics. The average restaurant has a star rating of 3.50, charges approximately $14.74 per meal, and has 112 reviews. Sustainability scores exhibit substantial variation (SD = 1.70), with 20.5% of restaurants scoring zero (no sustainability keyword mentions) and 1.1% scoring above 6.0 (high sustainability emphasis). Environmental keywords are more prevalent (mean = 3.99) than social keywords (mean = 1.33).

4.2. Global Results: The Misleading Average

Table 3 presents pooled OLS results. Model 1 (bivariate) yields a sustainability coefficient of +0.0455 ( p < 0.001 ), which is substantially attenuated to +0.0040 ( p = 0.012 ) upon adding quality controls in Model 2. A one-unit increase in the sustainability score (SD = 1.70) is associated with a +0.40% change in price (Model 2 with basic controls). For a one-standard-deviation increase (1.70 units), the implied association is +0.68%.
Model 3 adds city fixed effects (131 cities), cuisine fixed effects (27 categories), and a chain indicator. Notably, the sustainability coefficient reverses sign to 0.0049 ( p < 0.001 ), suggesting that the positive global association in Model 2 partly reflects omitted variable bias: sustainable restaurants tend to cluster in more expensive cities and cuisine categories. The R-squared increases substantially (from 0.115 to 0.291), confirming the importance of these controls.
Model 4 omits star rating to examine whether stars mediate the sustainability–price relationship. The sustainability coefficient increases to +0.0110 ( p < 0.001 ), consistent with partial mediation: sustainability practices may influence star ratings, which, in turn, affect pricing. However, this interpretation requires caution given the cross-sectional design.
The sign instability across specifications underscores that the global average effect is fragile and should not be the focus of interpretation. As the subgroup analysis reveals, this instability masks systematic heterogeneity across market segments.
Figure 1 presents the methodological comparison illustrating the sigmoid normalization artifact. Panel A shows the bivariate estimate without controls (+4.66%). Panel B shows the corrected estimates with controls (+0.40% OLS, −0.49% with fixed effects). Panel C displays the variance compression under sigmoid normalization, demonstrating a 31× coefficient inflation under the standard sigmoid function.

4.3. Subgroup Analysis: Quality-Dependent Premiums

Table 4 presents our central finding: sustainability price associations vary monotonically across market segments.
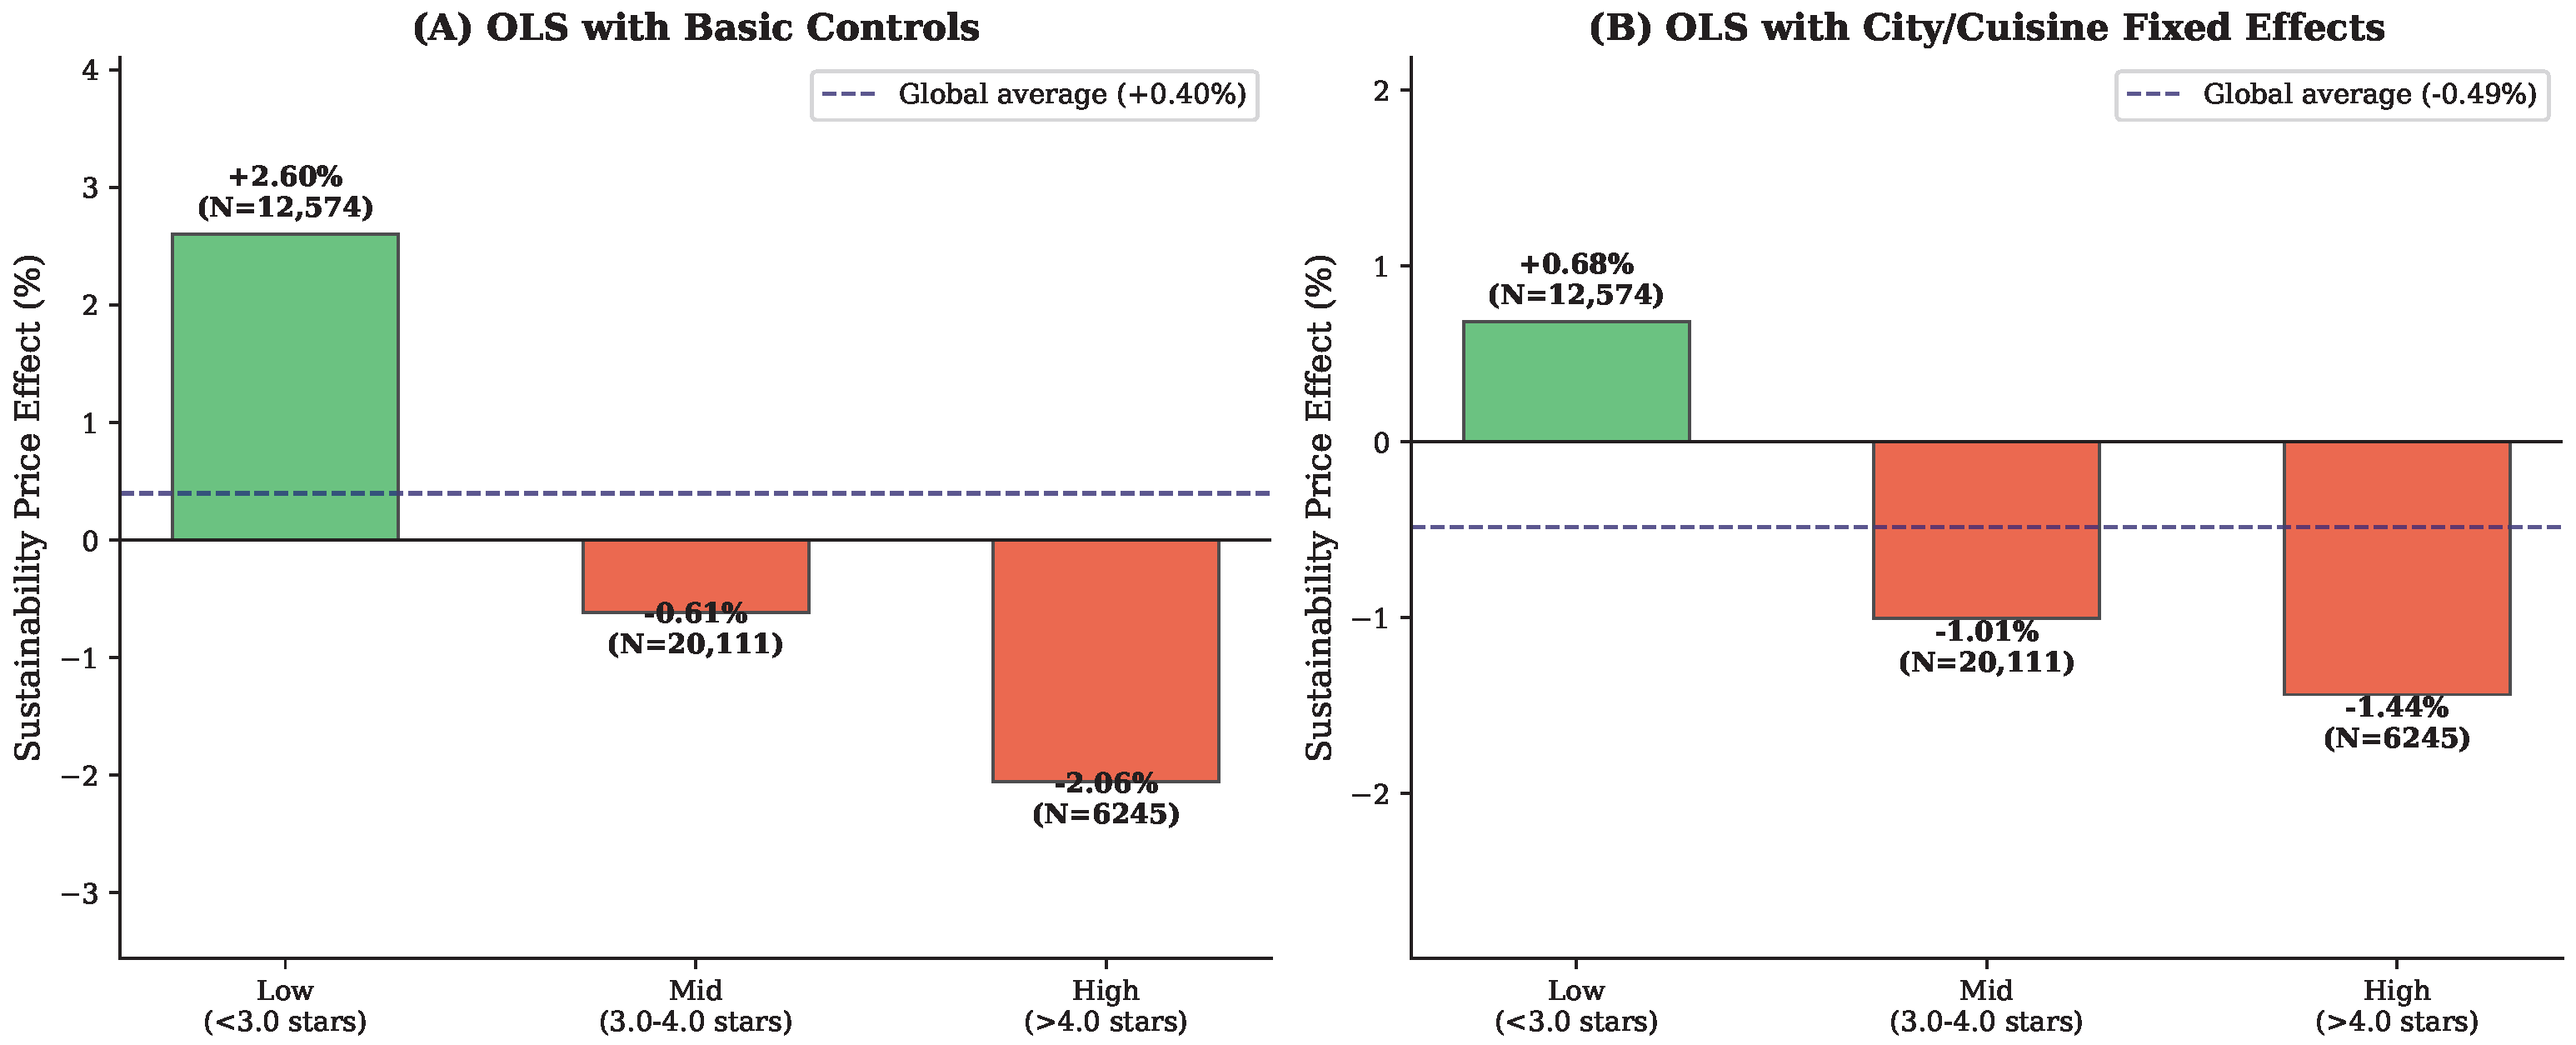
Among lower-rated establishments (<3.0 stars, N = 12,574), the sustainability coefficient of +0.0257 ( p < 0.001 ) documents a +2.60% price premium. The association persists with full city/cuisine fixed effects (coefficient = +0.0068, p = 0.004 , +0.68%), and the ordered logit confirms a positive and significant result ( β = + 0.135 , p < 0.001 ). This pattern is consistent with sustainability functioning as a quality signal in a segment where information asymmetry is high.
The mid-quality segment (3.0–4.0 stars, N = 20,111) tells a markedly different story. The coefficient reverses sign to −0.0062 ( p = 0.006 ), indicating a small negative association of −0.61%. Under full fixed effects, this strengthens to −0.0101 ( p < 0.001 , −1.01%). The ordered logit corroborates the reversal ( β = 0.027 , p = 0.008 ). Sustainability no longer confers a pricing advantage in this competitive segment.
The pattern continues in the same direction among higher-rated establishments (>4.0 stars, N = 6245). The coefficient of −0.0208 ( p < 0.001 ) represents a −2.06% price discount. With fixed effects, the estimate is −0.0145 ( p < 0.001 , −1.44%), confirmed by the ordered logit ( β = 0.078 , p < 0.001 ). In upscale dining, sustainability appears to function as a baseline expectation rather than a differentiating attribute.
The monotonically decreasing pattern (+2.60% → −0.61% → −2.06%) is robust to the inclusion of city and cuisine fixed effects (+0.68% → −1.01% → −1.44%), confirmed by ordered logit models, robust to city-clustered standard errors (all subgroup effects remain significant), and stable when restricting to restaurants with ≥20 reviews (+2.17% → −1.04% → −3.01%, all p < 0.001 ).
Figure 2 visualizes the monotonically decreasing sustainability premium across market segments, showing consistency between basic controls (Figure 2A) and full fixed effects (Figure 2B).

4.4. Interaction Effects

Table 5 examines the sustainability–quality interaction using a continuous specification. The interaction term ( β = 0.0418 , p < 0.001 ) confirms that sustainability’s pricing association diminishes monotonically with restaurant quality. The main effect of sustainability is positive and large (+0.1489, p < 0.001 ) at the intercept (i.e., at zero stars), but this is offset by the strongly negative interaction as star rating increases.
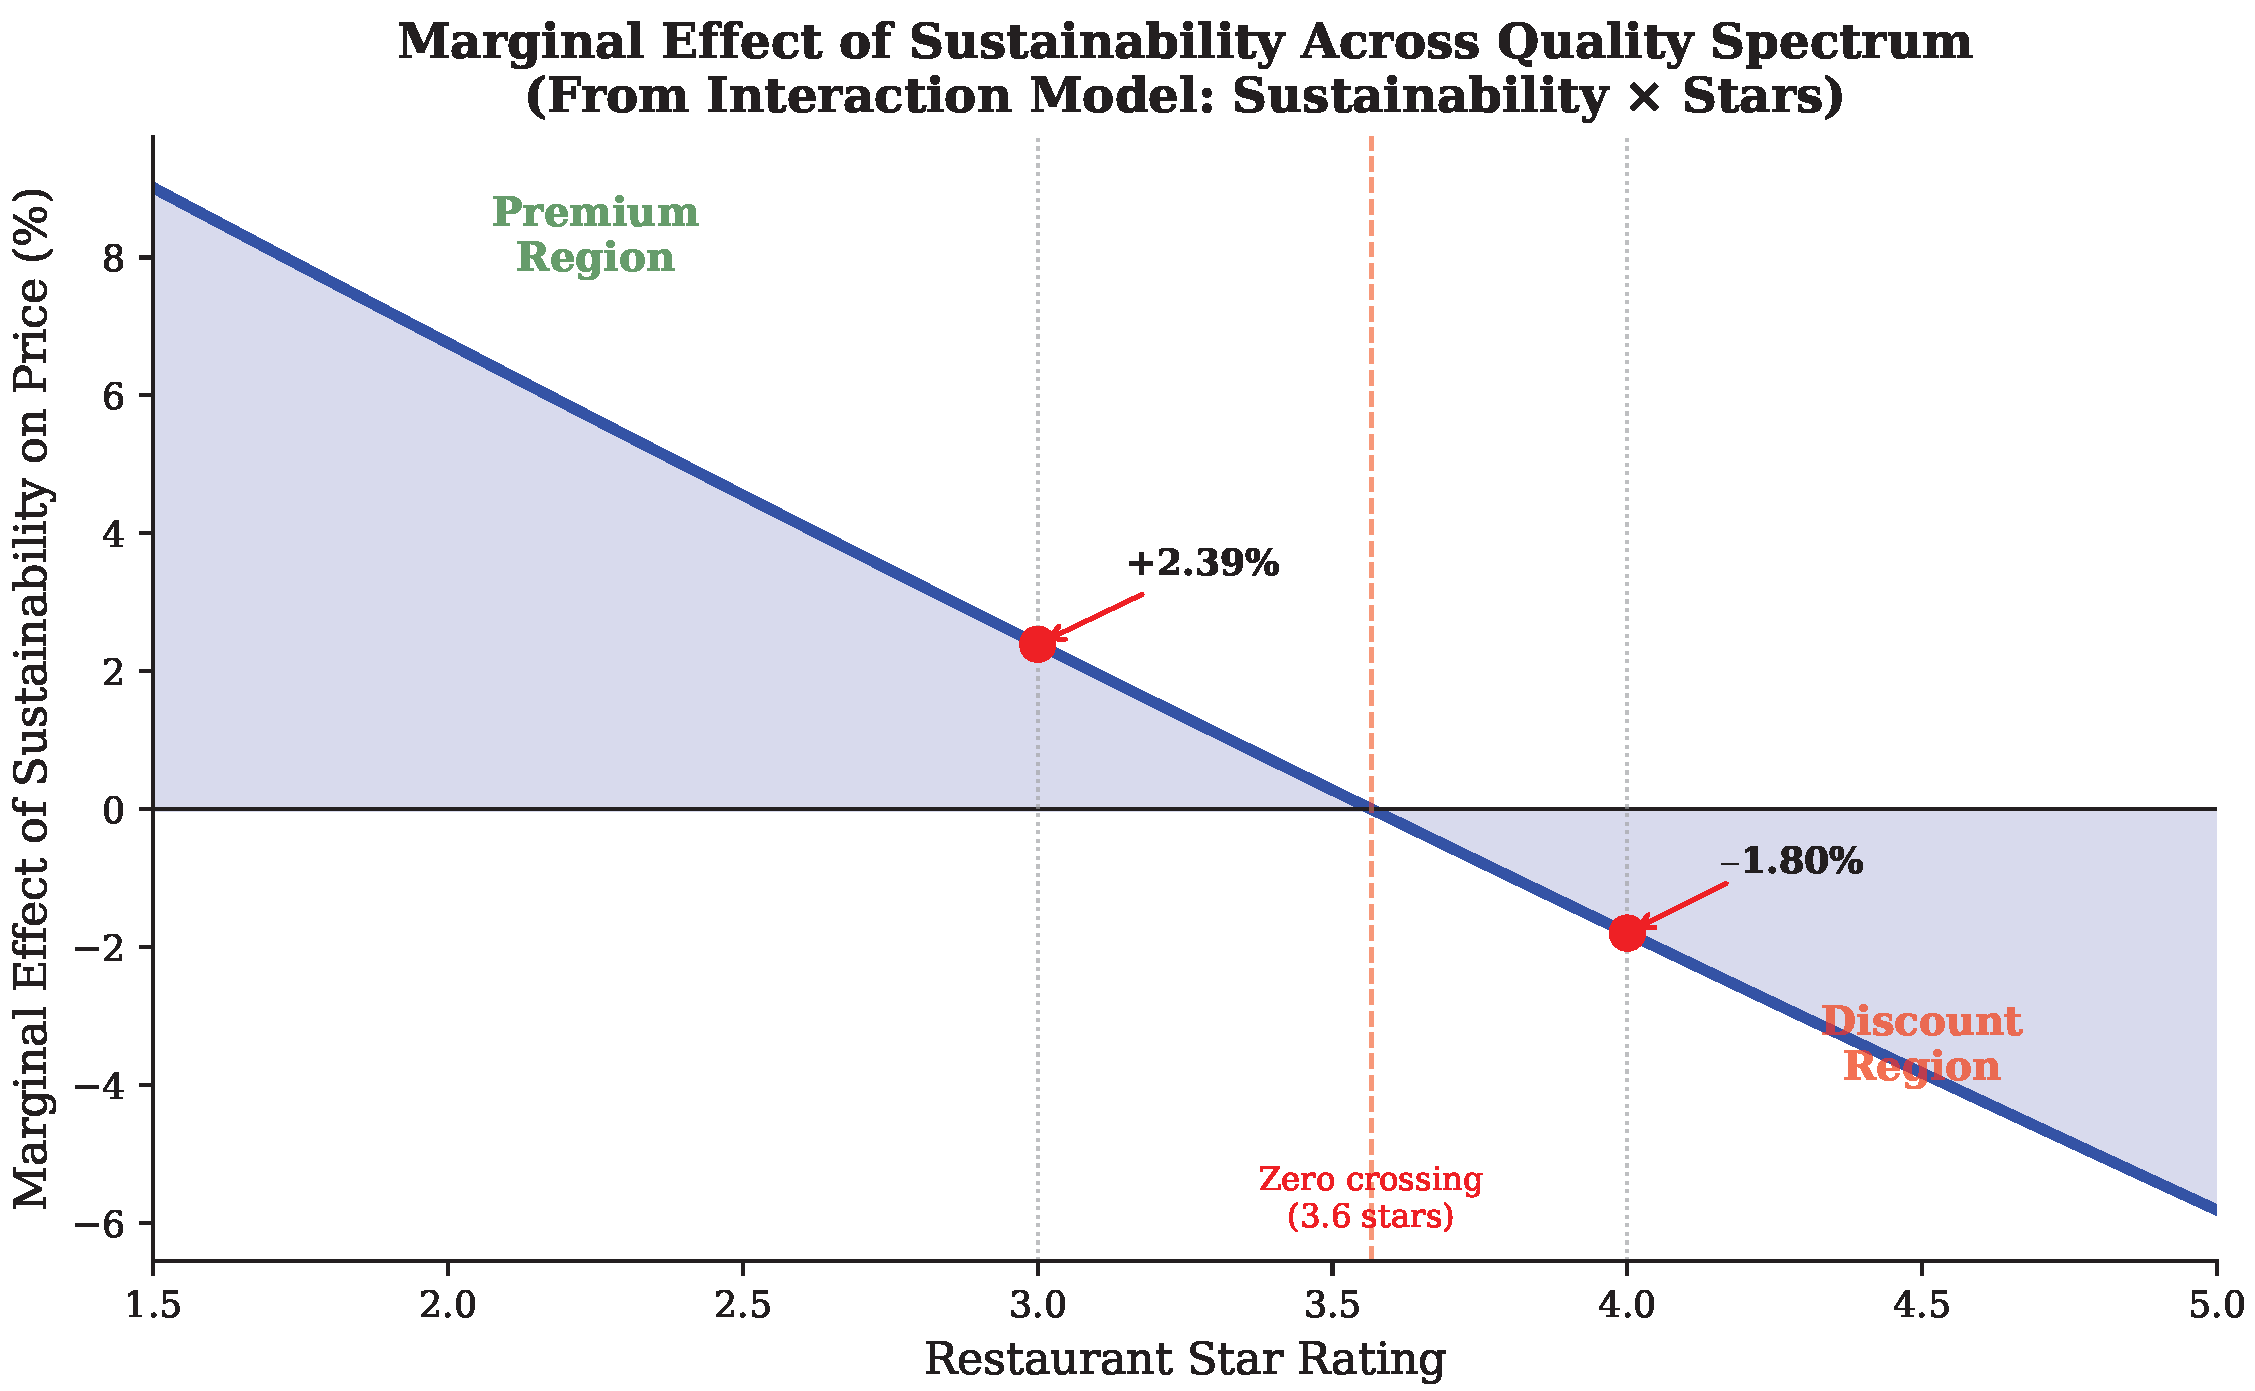
Computing marginal effects at specific star values reveals the economic pattern: at 2.5 stars, a one-unit increase in sustainability is associated with a +4.54% price premium; at 3.0 stars, the association is +2.38%; at 3.5 stars, the association is essentially zero (+0.26%); at 4.0 stars, it becomes negative (−1.81%); and at 4.5 stars, it is −3.84%. The cross-over from positive to negative occurs at approximately 3.6 stars, which falls within the mid-tier segment.
Figure 3 displays the marginal effect of sustainability across the continuous quality spectrum, derived from the interaction model. The positive-to-negative cross-over occurs at approximately 3.6 stars.

4.5. Robustness and Sensitivity

Table 6 summarizes several robustness analyses. Regarding price coding, the Tier 4 ($$$$) midpoint assignment is inherently uncertain given the open-ended upper range: varying this value from $65 to $120 yields global sustainability coefficients ranging from +0.0042 to +0.0036 (all p < 0.05 ), demonstrating that substantive conclusions are invariant to this choice. Turning to alternative sustainability measures, environmental keywords alone yield a positive and significant association (+1.18%, p < 0.001 ), while social keywords alone show a negative association (−2.24%, p < 0.001 ). The binary (above-median) indicator is not significant ( p = 0.55 ), consistent with continuous variation being more informative than a dichotomous threshold.
With respect to sample composition, restricting to restaurants with ≥20 reviews yields a non-significant global effect, yet the subgroup pattern is fully preserved (Low, +2.17%; Mid, −1.04%; High, −3.01%; all, p < 0.001 ): with ≥50 reviews, the global coefficient becomes significantly negative (−2.35%, p < 0.001 ). City-clustered standard errors approximately double relative to HC1 robust standard errors (0.0031 vs. 0.0016), rendering the global effect non-significant ( p = 0.20 ) and further pointing to the importance of segment-level analysis. All subgroup effects, however, remain significant under clustering (Low: p < 0.001 ; Mid: p = 0.009 ; High: p < 0.001 ).
To directly address the relevance of our findings to tourism contexts, we classify cities by tourism intensity based on established visitor volume statistics. Cities in states with major tourism sectors (Florida, Louisiana, Tennessee, Nevada, and Arizona)—encompassing prominent destinations including New Orleans, Nashville, Tampa, Tucson, and Reno—are classified as high-tourism, yielding 21,567 restaurants (55.4%) in high-tourism cities and 17,363 (44.6%) in non-tourism baseline cities. The monotonically decreasing sustainability–price pattern is fully reproduced within tourism-intensive cities: Low-star +1.95% ( p < 0.001 ), Mid-star −0.71% ( p = 0.020 ), High-star −2.41% ( p < 0.001 ). A Chow test confirms statistically significant structural differences between tourism and non-tourism restaurant markets ( F = 56.11 , p < 0.001 ), and a triple interaction model (sustainability × stars × tourism) yields a significant three-way interaction ( β = 0.009 , p = 0.003 ), indicating that tourism context meaningfully moderates the quality-dependent premium pattern.

5. Discussion

The following practical and policy implications are informed by the associational patterns documented in our corrected empirical analyses. Given the cross-sectional, observational nature of our research design, these recommendations should be interpreted as evidence-informed hypotheses warranting validation through experimental or quasi-experimental investigation rather than as established causal prescriptions.

5.1. Practical Implications for Restaurant Operators

Our findings provide a framework for sustainability investment decisions that varies by market positioning (Table 7).
For budget restaurants, sustainability offers modest positive pricing associations (+2.60%). To illustrate the potential economic magnitude, consider a hypothetical low-star restaurant serving 200 customers daily at a $13.17 average check (the mean for our low-star segment). Under the estimated association of +2.60% for this segment, this would correspond to approximately $25,000 in annual incremental revenue—an illustrative scenario conditional on the assumptions of constant customer volume, full pass-through of sustainability associations to pricing, and applicability of average effects to individual establishments. We note that this association is substantially smaller in the pooled sample (+0.40%) and reverses in higher-star segments. Selective, visible adoption—such as organic options, local sourcing, and compostable packaging—may function as quality signals in a segment where information asymmetry is high. Cost-effective practices that simultaneously reduce operating expenses (e.g., waste reduction, energy efficiency) may offer the best return.
For mid-market establishments, our results suggest sustainability does not command positive price premiums in this segment. However, sustainability adoption may yield non-price benefits including operational cost savings, brand differentiation, customer loyalty, and alignment with consumer values. Restaurants in this segment should evaluate sustainability investments based on total business value rather than pricing power alone.
For high-end restaurants, sustainability appears to function as a baseline expectation rather than a differentiating attribute. Prominent marketing of environmental credentials may detract from other value dimensions central to luxury positioning. Sustainability should be integrated as standard practice rather than highlighted as a competitive advantage.
We note that the following strategic implications derive from observed associations in cross-sectional data rather than experimentally validated causal effects. While the patterns are robust across multiple specifications and consistent with theoretical predictions, practitioners should interpret these recommendations as evidence-informed guidance warranting validation through pilot implementation and longitudinal monitoring rather than as deterministic causal prescriptions.

5.2. Implications for Hospitality Policy

Our findings suggest that uniform “one-size-fits-all” sustainability incentive programs may not optimally serve all market segments. Lower-tier restaurants, where sustainability generates positive pricing associations, may benefit most from technical assistance connecting them to local suppliers and low-cost operational improvements. Certification bodies might differentiate outreach strategies by market segment, recognizing that the economic case for certification varies across quality tiers.
However, we note important caveats. First, our analysis examines Yelp-listed U.S. restaurants, which may not represent the full restaurant population. Second, while Yelp reviews are generated by the general dining public (including both tourists and residents), our tourism intensity stratification (Table 6, Panel E) confirms that the quality-dependent pattern is fully reproduced in tourism-intensive cities, supporting the direct applicability of these implications to tourism destination management. Third, policy recommendations based on cross-sectional associations should be treated as preliminary until validated by causal research designs.

5.3. Theoretical Contributions

Our results contribute to the sustainability economics and consumer behavior literature in three ways:
First, we demonstrate that green premiums are not a universal phenomenon but rather a market segment-contingent outcome. The monotonically decreasing pattern we document—positive premiums in lower-quality segments transitioning to negative associations in higher-quality segments—may help reconcile apparently contradictory findings in the prior literature. Studies reporting positive premiums [14,16,36] and those finding mixed or negative effects [18,19] may both be accurate within their respective market segments.
Second, we provide quantitative evidence consistent with multiple theoretical mechanisms operating simultaneously. In low-quality segments, positive premiums align with signaling theory [32]: sustainability may serve as a costly signal of otherwise unobservable quality. In higher-quality segments, the null or negative association is consistent with sustainability transitioning to a baseline expectation—a hygiene factor rather than a differentiator.
Third, the variance compression mechanism we identify constitutes a cautionary case for computational social science applications employing sigmoid or hyperbolic tangent normalization on sparse count data, contributing to the broader methodological discourse on rigor in text-as-data applications [41,45]. While we cannot estimate the precise prevalence of this specific pipeline configuration across the broader literature without systematic review, the underlying mathematical mechanism—mapping zeros to 0.5 rather than 0.0—affects any application where normalization functions with non-zero intercepts are applied to count variables exhibiting substantial zero inflation, a common data structure in keyword-based text analysis. Our log-density transformation provides one alternative, though we note that other approaches (e.g., TF-IDF weighting, Bayesian shrinkage) may also be appropriate depending on the research context.

5.4. Limitations and Future Research

Several limitations warrant acknowledgment: Our cross-sectional design establishes associations between sustainability practices and pricing outcomes but cannot definitively establish causal directionality. Several plausible confounding pathways warrant explicit acknowledgment: First, reverse causality: higher-priced restaurants may possess greater resources and marketing sophistication to communicate environmental practices in ways that generate sustainability-related review content, without those practices necessarily driving pricing power. Second, neighborhood-level confounding: restaurants situated in wealthier, more educated neighborhoods may simultaneously command higher prices and attract environmentally conscious patrons who generate more sustainability-related review language, producing a spurious association driven by geographic sorting rather than sustainability’s direct pricing effects. Third, construct conflation: our text-based sustainability score may partially capture broader quality dimensions—operational care, ingredient freshness, management professionalism—that correlate with both sustainability communication and pricing rather than isolating the independent contribution of environmental practices per se. The sign reversal between Model 2 and Model 3 (Table 3) illustrates the sensitivity of estimates to control variable specification. Future research using natural experiments—certification program rollouts or sustainability mandate implementations—could provide causal identification.
A second set of concerns relates to measurement. The dictionary-based keyword approach captures consumer perceptions of sustainability rather than verified practices—a common limitation of text-as-data methods in social science [43,44]. Terms such as “local” and “community” can appear in non-sustainability contexts (keyword ambiguity), restaurants with genuine sustainability commitments may receive no keyword mentions (false negatives), and the composite weighting scheme (0.4/0.3/0.3) is asserted rather than empirically validated. Validating scores against external certification data or manual coding would strengthen future applications. The dependent variable warrants a similar caution: despite our sensitivity analyses, converting four ordinal price tiers to continuous values introduces measurement imprecision. Ordered logit results confirm the directional patterns, but continuous dollar magnitudes should be interpreted accordingly.
Third, generalizability is constrained by the U.S. sample, which may not transfer to contexts with different regulatory environments, cultural norms, or consumer expectations. Evidence from diverse markets [33,36] documents varying sustainability premium patterns, suggesting meaningful cultural and institutional moderation. International comparative analysis would help clarify these boundary conditions.
Tourism-specific interpretation merits separate consideration. The tourism intensity stratification in Table 6 (Panel E) demonstrates that the quality-dependent pattern is fully reproduced in tourism-intensive cities, with effect magnitudes comparable to or larger than the full-sample estimates (Low: +1.95%, Mid: −0.71%, High: −2.41%). The significant Chow test ( F = 56.11 , p < 0.001 ) and triple interaction ( p = 0.003 ) confirm that tourism context meaningfully moderates these relationships. However, we cannot distinguish individual tourist reviews from resident reviews within our data. Future work employing tourism-specific platforms (e.g., TripAdvisor) or reviewer origin data could further refine tourism-specific implications.
Finally, the cross-section spans 2018–2023, and, as sustainability transitions from niche to mainstream, the quality-dependent pattern documented here may itself evolve. Longitudinal analysis would illuminate whether these segment-specific dynamics persist, intensify, or collapse over time. Together, these limitations point toward a research agenda encompassing causal identification through quasi-experiments, measurement validation against external sustainability indicators, international replication, and tourism-specific analyses incorporating destination intensity data.

6. Conclusions

This study examines the relationship between sustainability practices and restaurant pricing across market segments, analyzing 38,930 U.S. restaurants and approximately 4.4 million consumer reviews. Two principal contributions emerge. Methodologically, we identify a measurement artifact in text-mining applications: sigmoid normalization applied to sparse keyword counts creates variance compression that can inflate regression coefficients by 25–44× depending on scaling parameters. A log-density transformation is proposed as an alternative that preserves measurement validity, and its properties are demonstrated quantitatively.
Empirically, the association between sustainability and pricing varies monotonically with restaurant quality: lower-rated restaurants (<3.0 stars) exhibit positive price premiums (+2.60%), while mid-rated (3.0–4.0 stars, −0.61%) and higher-rated (>4.0 stars, −2.06%) establishments show negative associations. A strongly negative sustainability × stars interaction ( β = 0.042 , p < 0.001 ) confirms this gradient, which is robust to ordered logit specifications, city/cuisine fixed effects, and clustered standard errors; the cross-over from a positive to a negative premium occurs at approximately 3.6 stars. Taken together, these results suggest that sustainability transitions from a competitive differentiator in lower-quality segments—where it may function as a quality signal—to a baseline expectation in higher-quality establishments, a pattern that may help reconcile apparently contradictory prior findings in the green premium literature.
We acknowledge important limitations: the cross-sectional design precludes causal inference, the dictionary-based sustainability measure captures consumer perceptions rather than verified practices, and the ordinal price variable introduces measurement imprecision. The practical implications discussed—differentiated sustainability strategies by market segment—should be treated as hypotheses for further investigation rather than established prescriptions.
As sustainability practices continue their transition from niche to mainstream across the hospitality industry, understanding the market segment-specific dynamics documented here may help inform both business strategy and policy design. However, causal validation through experimental or quasi-experimental research remains essential before these associations can confidently guide resource allocation decisions.

Author Contributions

Conceptualization, Z.L. and Z.X.; methodology, Z.X.; software, Z.L.; formal analysis, Z.L.; investigation, Z.L. and X.G.; data curation, Z.L.; writing—original draft preparation, Z.L.; writing—review and editing, Z.X. and X.G.; visualization, Z.L.; supervision, Z.X.; project administration, Z.X.; funding acquisition, Z.X. All authors have read and agreed to the published version of the manuscript.

Funding

This work was supported by Guanghua Talent Project of Southwestern University of Finance and Economics and received grants from the National Natural Science Foundation of China (no. 71701167) and the Humanities and Social Science Projects of the Ministry of Education of China (no. 17YJC630078).

Institutional Review Board Statement

Not applicable.

Informed Consent Statement

Not applicable.

Data Availability Statement

The Yelp Academic Dataset employed in this study is publicly accessible at https://www.yelp.com/dataset (accessed on 20 January 2024). Replication code and aggregated analytical results are available from the corresponding author upon reasonable request.

Acknowledgments

The authors gratefully acknowledge the Yelp Academic Dataset Program for providing access to the review data employed in this research.

Conflicts of Interest

The authors declare no conflicts of interest.

Appendix A. Text Analysis Pre-Processing Documentation

This appendix documents the text pre-processing pipeline for the dictionary-based sustainability measure described in Section 3.2.2. All review text undergoes the following pre-processing pipeline prior to keyword matching:
  • Case folding: All text is lowercased before matching.
  • Phrase matching: Hyphenated variants are handled via pattern matching (e.g., “farm-to-table” also matches “farm to table”); multi-word terms are matched as n-grams (up to trigrams).
  • Disambiguation protocol: To reduce false positives from ambiguous terms, “local” is matched only when appearing within a three-word window of food-related terms (e.g., “local produce,” “local farm,” “locally sourced”), excluding geographic references (e.g., “local bar,” “local hangout”). Similarly, “community” is matched only near terms such as “supported,” “owned,” or “engagement.”
  • Tokenization: Whitespace- and punctuation-based segmentation, with n-gram matching for multi-word terms.

Appendix B. Sigmoid Normalization Artifact Demonstration

This appendix provides quantitative evidence for the sigmoid normalization artifact discussed in Section 3.2.2.
Distribution comparison. In our sample, 20.5% of restaurants have zero sustainability keyword mentions, and the distribution of raw keyword counts is strongly right-skewed. Under sigmoid normalization ( S ( x ) = 1 / ( 1 + e a x ) ), zeros are mapped to 0.5 rather than 0.0, compressing the effective score range to [0.50, 1.00]. Under our log-density transformation, zeros map to 0.0, preserving the full [0.00, 7.98] range.
Variance quantification. The standard deviation under log-density transformation is 1.70, compared to 0.19 under the standard sigmoid ( a = 1.0 )—a variance ratio of approximately 9:1.
Multi-scale coefficient comparison. We apply sigmoid normalization with five scaling parameters ( a = 0.1 , 0.3 , 0.5 , 1.0 , 2.0 ) to the sustainability keyword counts and re-estimate the baseline hedonic pricing model. The sustainability coefficient under sigmoid normalization ranges from 25× to 44× the log-density coefficient across all parameterizations (31× under the standard sigmoid, a = 1.0 ). This inflation is structurally inherent to sigmoid normalization of sparse count data, not an artifact of a specific parameter choice.

Appendix C. Qualitative Face Validation

This appendix provides qualitative face validation for the dictionary-based sustainability measure constructed in Section 3.2.2, presenting representative examples from the extremes of the score distribution.
High-scoring restaurants (sustainability score ≥ 90th percentile):
  • Community Cafe (St. Petersburg, FL; 4.5⋆, $, score = 7.41): “Sustainable food and business practices, supporting local businesses, and supporting the LGBTQ+ community.”
  • Joe Coffee Bar (Philadelphia, PA; 4.0⋆, $, score = 7.33): “Joe Coffee Bar was one of the first, about ten years ago, to feature fair-trade coffee.”
  • Food For Ascension Cafe (Tucson, AZ; 4.5⋆, $$, score = 7.26): “The restaurant claims that their food is locally grown and it sure tastes like it.”
Zero-scoring restaurants (sustainability score = 0):
  • iSushi (Carmel, IN; 3.5⋆, $$): Typical reviews discuss sushi quality and atmosphere; zero sustainability keyword matches.
  • Blackjack Pizza & Salads (Tucson, AZ; 2.0⋆, $$): Reviews discuss pizza quality and delivery speed; zero sustainability keyword matches.
  • McDonald’s (Eagle, ID; 2.0⋆, $): Reviews discuss convenience and service speed; zero sustainability keyword matches.
High scores correspond to restaurants whose reviewers explicitly discuss sustainability practices (organic sourcing, fair trade, local ingredients), while zero scores correspond to establishments with no sustainability-relevant content, confirming the measure’s face validity.

References

  1. Mahendru, M.; Arora, V.; Chatterjee, R.; Sharma, G.D.; Shahzadi, I. From over-tourism to under-tourism via COVID-19: Lessons for sustainable tourism management. Eval. Rev. 2024, 48, 177–210. [Google Scholar] [CrossRef] [Scilit]
  2. Long, Y.; Liu, Q.; Cheng, M.; Wang, Y. Tourism recovery and sustainable development: The case of revenge tourism in China. Curr. Issues Tour. 2025, 1–18. [Google Scholar] [CrossRef] [Scilit]
  3. Alves, J.; Arantes, L.; Moreira, A.C. AI-powered sustainable tourism: Aligning innovations with the sustainable development goals. Tour. Hosp. Res. 2025, 14673584251409416. [Google Scholar] [CrossRef] [Scilit]
  4. Ashton, M.; Sezerel, H.; Filimonau, V.; Gunay, S. Gender dynamics and sustainable practices: Exploring food waste management among female chefs in the hospitality industry. J. Sustain. Tour. 2025, 33, 1658–1683. [Google Scholar] [CrossRef] [Scilit]
  5. Guimarães, N.S.; Reis, M.G.; Costa, B.V.d.L.; Zandonadi, R.P.; Carrascosa, C.; Teixeira-Lemos, E.; Costa, C.A.; Alturki, H.A.; Raposo, A. Environmental footprints in food services: A scoping review. Nutrients 2024, 16, 2106. [Google Scholar] [CrossRef] [Scilit]
  6. Principato, L.; Comis, C.; Yu, M.; Secondi, L. Food sharing platforms as a technology to reduce food waste at food service level: Recommendations for businesses and society. Bus. Ethics Environ. Responsib. 2025. [Google Scholar] [CrossRef] [Scilit]
  7. Iqbal, B.; Alabbosh, K.F.; Jalal, A.; Suboktagin, S.; Elboughdiri, N. Sustainable food systems transformation in the face of climate change: Strategies, challenges, and policy implications: B. Iqbal et al. Food Sci. Biotechnol. 2025, 34, 871–883. [Google Scholar] [CrossRef] [Scilit]
  8. Cardenas, M.; Schivinski, B.; Brennan, L. Circular practices in the hospitality sector regarding food waste. J. Clean. Prod. 2024, 472, 143452. [Google Scholar] [CrossRef] [Scilit]
  9. Nichifor, B.; Zait, L.; Timiras, L. Drivers, barriers, and innovations in sustainable food consumption: A systematic literature review. Sustainability 2025, 17, 2233. [Google Scholar] [CrossRef] [Scilit]
  10. Hossan, F.; Hasan, M.; Islam, T. Green Practices to the Owners and Management of Restaurant Business: An Empirical Study. Manag. Sustain. Dev. 2024, 16, 58–74. [Google Scholar] [CrossRef] [Scilit]
  11. Baloglu, S.; Raab, C.; Malek, K. Organizational motivations for green practices in casual restaurants. Int. J. Hosp. Tour. Adm. 2022, 23, 269–288. [Google Scholar] [CrossRef] [Scilit]
  12. Madanaguli, A.; Dhir, A.; Kaur, P.; Srivastava, S.; Singh, G. Environmental sustainability in restaurants. A systematic review and future research agenda on restaurant adoption of green practices. Scand. J. Hosp. Tour. 2022, 22, 303–330. [Google Scholar] [CrossRef] [Scilit]
  13. Hamada, I. The global rise of “sustainable sushi” practices: Restaurant responses and challenges. Food Foodways 2024, 32, 56–78. [Google Scholar] [CrossRef] [Scilit]
  14. Arbelo, A.; Arbelo-Pérez, M.; De Vera, V.; Bilgihan, A. Green premiums: Assessing the revenue impact of eco-certification in the hospitality sector. Int. J. Contemp. Hosp. Manag. 2025, 37, 64–83. [Google Scholar] [CrossRef] [Scilit]
  15. Mouchtaropoulou, E.; Mallidis, I.; Giannaki, M.; Koukaras, K.; Früh, S.; Ettinger, T.; Benmehaia, A.M.; Kacem, A.; Achour, L.; Detzel, A.; et al. Consumer willingness to pay for fair and sustainable foods: Who profits in the agri-food chain? Front. Sustain. Food Syst. 2024, 8, 1504985. [Google Scholar] [CrossRef] [Scilit]
  16. Xue, J.; Han, W.; Zhang, S. Dual reference-point synergy model: Brand biography and message framing effect on willingness to pay a premium for green hotels. Int. J. Hosp. Manag. 2026, 134, 104552. [Google Scholar] [CrossRef] [Scilit]
  17. Kesgin, M.; Can, A.S.; Ding, L.; Legg, M.; Schuler, D. Legacy matters: Encouraging willingness to pay a premium for environmentally friendly off-premises food packaging. Int. J. Hosp. Manag. 2025, 126, 104037. [Google Scholar] [CrossRef] [Scilit]
  18. Andreica Mihuţ, I.S.; Sterie, L.G.; Mican, D. The green dilemma: What drives consumers to green purchase intention in an emerging EU economy? J. Appl. Econ. 2025, 28, 2536323. [Google Scholar] [CrossRef] [Scilit]
  19. Haldorai, K.; Kim, W.G.; Phetvaroon, K. Environmental and financial performance in Thailand’s hospitality industry: A longitudinal analysis. J. Hosp. Tour. Insights 2025, 1–16. [Google Scholar] [CrossRef] [Scilit]
  20. Elhoushy, S.; Elzek, Y.; Font, X. Sustainable tourism certification: A systematic literature review and suggested ways forward. J. Sustain. Tour. 2025, 355–381. [Google Scholar] [CrossRef] [Scilit]
  21. Mehta, R.; Oh, C. Institutional food waste and the circular economy: Is it time to revisit produce waste in global food supply chains? Glob. Food Secur. 2024, 43, 100819. [Google Scholar] [CrossRef] [Scilit]
  22. Gál, T.; Kovács, S.; Bugyó-Nyakas, E. A comprehensive analysis of food waste through historical context: A bibliometric study from 2019 to 2024. Clean. Waste Syst. 2025, 11, 100318. [Google Scholar] [CrossRef] [Scilit]
  23. Fechner, D.; Karl, M.; Grün, B.; Dolnicar, S. How can restaurants entice patrons to order environmentally sustainable dishes? Testing new approaches based on hedonic psychology and affective forecasting theory. J. Sustain. Tour. 2024, 32, 2225–2244. [Google Scholar]
  24. Voss, S.; Andre, H.; Kock, F.; Karl, M.; Josiassen, A. Guiding pro-environmental behaviour: Examining the impact of cognitive and behavioural interventions on sustainable food choices in hospitality. J. Sustain. Tour. 2026, 34, 21–41. [Google Scholar] [CrossRef] [Scilit]
  25. Mutale, B.; Dai, S.; Chen, Z.; Maulu, S. Enhancing food security amid climate change: Assessing impacts and developing adaptive strategies. Cogent Food Agric. 2025, 11, 2519800. [Google Scholar] [CrossRef] [Scilit]
  26. Lavaredas, A.; Campos, F.; Almeida, G.G.F.; Dias, F.; Almeida, P. Sustainable development goals in tourism research. Discov. Sustain. 2025, 6, 759. [Google Scholar] [CrossRef] [Scilit]
  27. Li, Y.; He, P.; Shan, Y.; Li, Y.; Hang, Y.; Shao, S.; Ruzzenenti, F.; Hubacek, K. Reducing climate change impacts from the global food system through diet shifts. Nat. Clim. Change 2024, 14, 943–953. [Google Scholar] [CrossRef] [Scilit]
  28. Chen, N.; Li, A.; Talluri, K. Reviews and self-selection bias with operational implications. Manag. Sci. 2021, 67, 7472–7492. [Google Scholar] [CrossRef] [Scilit]
  29. Huang, R. The financial consequences of online review aggregators: Evidence from Yelp ratings and SBA loans. Manag. Sci. 2025, 71, 59–82. [Google Scholar] [CrossRef] [Scilit]
  30. He, S.; Hollenbeck, B.; Proserpio, D. The market for fake reviews. Mark. Sci. 2022, 41, 896–921. [Google Scholar] [CrossRef] [Scilit]
  31. Zervas, G.; Proserpio, D.; Byers, J.W. A first look at online reputation on Airbnb, where every stay is above average. Mark. Lett. 2021, 32, 1–16. [Google Scholar] [CrossRef] [Scilit]
  32. Spence, M. Job market signaling. In Uncertainty in Economics; Elsevier: Amsterdam, The Netherlands, 1978; pp. 281–306. [Google Scholar]
  33. Majeed, S.; Kim, W.G.; Kim, T. Perceived green psychological benefits and customer pro-environment behavior in the value-belief-norm theory: The moderating role of perceived green CSR. Int. J. Hosp. Manag. 2023, 113, 103502. [Google Scholar] [CrossRef] [Scilit]
  34. Pan, T.; Zhou, W. Navigating pro-environmental behavior among tourists: The role of value-belief-norm theory, personality traits, and commitment. J. Hosp. Tour. Manag. 2024, 61, 226–239. [Google Scholar] [CrossRef] [Scilit]
  35. Griskevicius, V.; Tybur, J.M.; Van den Bergh, B. Going green to be seen: Status, reputation, and conspicuous conservation. J. Personal. Soc. Psychol. 2010, 98, 392. [Google Scholar] [CrossRef] [Scilit] [PubMed]
  36. Nelson, K.M.; Partelow, S.; Stäbler, M.; Graci, S.; Fujitani, M. Tourist willingness to pay for local green hotel certification. PLoS ONE 2021, 16, e0245953. [Google Scholar] [CrossRef] [Scilit]
  37. Li, S.; Kallas, Z. Meta-analysis of consumers’ willingness to pay for sustainable food products. Appetite 2021, 163, 105239. [Google Scholar] [CrossRef] [Scilit]
  38. Yu, W.; Han, X.; Cui, F. Increase consumers’ willingness to pay a premium for organic food in restaurants: Explore the role of comparative advertising. Front. Psychol. 2022, 13, 982311. [Google Scholar] [CrossRef] [Scilit]
  39. Mao, Z.; Yang, Y.; Zhou, J. Are GreenLeaders also performance leaders? An econometric analysis of TripAdvisor hotel certification of GreenLeaders. J. Sustain. Tour. 2023, 31, 2150–2172. [Google Scholar] [CrossRef] [Scilit]
  40. Assaker, G.; O’Connor, P. The importance of green certification labels/badges in online hotel booking choice: A conjoint investigation of consumers’ preferences pre-and post-COVID-19. Cornell Hosp. Q. 2023, 64, 401–414. [Google Scholar] [CrossRef] [Scilit]
  41. Grimmer, J.; Roberts, M.E.; Stewart, B.M. Text as Data: A New Framework for Machine Learning and the Social Sciences; Princeton University Press: Princeton, NJ, USA, 2022. [Google Scholar]
  42. Ash, E.; Hansen, S. Text algorithms in economics. Annu. Rev. Econ. 2023, 15, 659–688. [Google Scholar] [CrossRef] [Scilit]
  43. Macanovic, A. Text mining for social science–The state and the future of computational text analysis in sociology. Soc. Sci. Res. 2022, 108, 102784. [Google Scholar]
  44. Mehraliyev, F.; Chan, I.C.C.; Kirilenko, A.P. Sentiment analysis in hospitality and tourism: A thematic and methodological review. Int. J. Contemp. Hosp. Manag. 2022, 34, 46–77. [Google Scholar] [CrossRef] [Scilit]
  45. Alantari, H.J.; Currim, I.S.; Deng, Y.; Singh, S. An empirical comparison of machine learning methods for text-based sentiment analysis of online consumer reviews. Int. J. Res. Mark. 2022, 39, 1–19. [Google Scholar] [CrossRef] [Scilit]
  46. Lekmiti, A.; Stolk, P.J.; Taylor, A.; Ramachandran, S.; Yap, N.K. Text mining in tourism and hospitality research: A bibliometric perspective. J. Hosp. Tour. Technol. 2025, 16, 588–610. [Google Scholar]
  47. Rosen, S. Hedonic prices and implicit markets: Product differentiation in pure competition. J. Political Econ. 1974, 82, 34–55. [Google Scholar] [CrossRef] [Scilit]
  48. Sanchez-Lozano, G.; Pereira, L.N.; Chavez-Miranda, E. Big data hedonic pricing: Econometric insights into room rates’ determinants by hotel category. Tour. Manag. 2021, 85, 104308. [Google Scholar] [CrossRef] [Scilit]
  49. Connelly, B.L.; Certo, S.T.; Ireland, R.D.; Reutzel, C.R. Signaling theory: A review and assessment. J. Manag. 2011, 37, 39–67. [Google Scholar]
  50. Van Phuong, N.; Mergenthaler, M.; Quynh, P.N.H. Consumer transition: Analyzing the impact of environmental and health consciousness on green food choices in Vietnam. Discov. Sustain. 2025, 6, 415. [Google Scholar] [CrossRef] [Scilit]
  51. Mat’ová, H.; Triznová, M.O.; Kaputa, V.; Loučanová, E.; Vlosky, R.P. Strategic Environmental Consumer Segmentation: An Exploratory Case Study in Slovakia. SAGE Open 2024, 14, 21582440241240638. [Google Scholar] [CrossRef] [Scilit]
Figure 1. Methodological comparison. (A) Bivariate OLS without controls yields a +4.66% sustainability effect driven by confounding. (B) Corrected estimates with controls (+0.40%) and with city/cuisine fixed effects (−0.49%). (C) Sigmoid normalization compresses variance (SD: 1.70 vs. 0.19), inflating coefficients by approximately 31× under the standard sigmoid.
Sustainability 18 02363 g001
Figure 2. Quality-dependent sustainability premium. Sustainability price associations across three market segments showing a monotonically decreasing pattern. (A) OLS with basic controls (Low: +2.60%, Mid: −0.61%, High: −2.06%). (B) OLS with city/cuisine fixed effects (Low: +0.68%, Mid: −1.01%, High: −1.44%). The dashed line indicates the global average, which masks segment-specific heterogeneity.
Sustainability 18 02363 g002
Figure 3. Marginal effect of sustainability across the quality spectrum, derived from the interaction model (sustainability × stars) and showing the estimated price effect of a one-unit increase in sustainability score at each star rating level. The cross-over from positive to negative occurs at approximately 3.6 stars. Red markers indicate effects at tier boundaries (3.0 and 4.0 stars).
Sustainability 18 02363 g003
Table 1. Sample construction.
StepN
All restaurant/food businesses52,268
With price tier information44,484
With ≥10 reviews (final sample)38,930
Table 2. Descriptive statistics (N = 38,930).
VariableMeanSDMin.Max.
Price ($, corrected)14.748.248.0080.00
Star Rating3.500.791.05.0
Review Count111.8213.0107568
Sustainability Score2.801.700.007.98
   Environmental Score3.992.39
   Social Score1.331.93
Score = 0 (%)20.5%
Score > 6.0 (%)1.1%
Table 3. Global hedonic pricing models.
Model 1
(Bivariate)
Model 2
(Controls)
Model 3
(Full FE)
Model 4
(No Stars)
Sustainability Score+0.0455 ***+0.0040 *−0.0049 ***+0.0110 ***
(0.0013)(0.0016)(0.0015)(0.0015)
Star Rating+0.0410 ***−0.0237 ***
ln (Review Count)+0.1266 ***
Chain Indicator−0.1876 ***
City Fixed EffectsNoNoYes (131)No
Cuisine Fixed EffectsNoNoYes (27)No
R-Squared0.0280.1150.2910.111
N38,93038,93038,93038,930
Heteroskedasticity-robust standard errors in parentheses. *** p < 0.001 , * p < 0.05 . Model 4 omits star rating to examine potential mediation.
Table 4. Sustainability premium by market segment.
Low Stars
(<3.0)
Mid Stars
(3.0–4.0)
High Stars
(>4.0)
Panel A: OLS with Basic Controls
Sustainability Score+0.0257 ***−0.0062 **−0.0208 ***
(0.0026)(0.0023)(0.0040)
Price Effect+2.60%−0.61%−2.06%
R-Squared0.1660.0940.086
Panel B: OLS with City/Cuisine Fixed Effects
Sustainability Score+0.0068 **−0.0101 ***−0.0145 ***
(0.0024)(0.0021)(0.0039)
Price Effect+0.68%−1.01%−1.44%
R-Squared0.3660.2600.249
Panel C: Ordered Logit
Sustainability Score+0.1348 ***−0.0271 **−0.0784 ***
(0.0128)(0.0102)(0.0174)
N12,57420,1116245
Avg Price$13.17$15.68$14.92
Robust standard errors in parentheses. *** p < 0.001 , ** p < 0.01 .
Table 5. Interaction model: sustainability × star rating.
OLS (Sust × Stars)
Sustainability Score+0.1489 ***
(0.0054)
Star Rating+0.1343 ***
Sust × Stars−0.0418 ***
(0.0015)
ln (Review Count)included
R-Squared0.130
N38,930
Marginal effect of sustainability at
   2.5 stars+4.54%
   3.0 stars+2.38%
   3.5 stars+0.26%
   4.0 stars−1.81%
   4.5 stars−3.84%
HC1 robust standard errors in parentheses. *** p < 0.001 . Marginal effect = ( exp ( β sust + β int × stars ) 1 ) × 100 .
Table 6. Robustness and sensitivity analyses.
Specification β sust Effect (%)N
Panel A: Tier 4 Price Sensitivity
Tier 4 = $65+0.0042+0.42%38,930
Tier 4 = $80 (baseline)+0.0040+0.40%38,930
Tier 4 = $100+0.0038+0.38%38,930
Tier 4 = $120+0.0036+0.36%38,930
Panel B: Alternative Sustainability Measures
Environmental keywords only+0.0117+1.18% ***38,930
Social keywords only−0.0226−2.24% ***38,930
Binary (above median)−0.0029−0.29%38,930
Panel C: Alternative Minimum Reviews
Min. 20 reviews−0.0006−0.06%31,257
Min. 50 reviews−0.0235−2.35% ***19,830
Panel D: Standard Error Comparison (Global Model)
HC1 robust SESE = 0.0016, p = 0.012
City-clustered SESE = 0.0031, p = 0.201
Panel E: Tourism Intensity Stratification
Tourism cities (global)−0.0003−0.03%21,567
   Low stars+0.0193+1.95% ***6620
   Mid stars−0.0071−0.71% *11,212
   High stars−0.0244−2.41% ***3735
Non-tourism cities (global)+0.0063+0.64% **17,363
Chow test (F-stat) F = 56.11 , p < 0.001
*** p < 0.001, ** p < 0.01, * p < 0.05. All models include stars and ln(reviews) as controls.
Table 7. Decision framework for restaurant operators.
Market PositionAssociationMechanismSuggested Strategy
Budget (<$15/meal,
<3 stars)
+2.60%
(positive)
Quality
signal
Selective adoption of visible practices:
organic options, local sourcing.
Communicate as quality improvement.
Mid-Market ($15–25/meal,
3–4 stars)
−0.61%
(small
negative)
Neutral/consumer expectationAdopt for operational cost savings and
brand alignment rather than pricing
power. Benefits may be non-price.
High-End
(>$25/meal,
>4 stars)
−2.06% (negative)Baseline expectationImplement as baseline practice without
prominent marketing. Emphasize chef
artistry, service, ambiance.
Disclaimer/Publisher’s Note: The statements, opinions and data contained in all publications are solely those of the individual author(s) and contributor(s) and not of MDPI and/or the editor(s). MDPI and/or the editor(s) disclaim responsibility for any injury to people or property resulting from any ideas, methods, instructions or products referred to in the content.