


Abstract
Digitalization and decarbonization are unfolding in parallel, yet firm-level evidence on whether digital economy development delivers substantive low-carbon performance remains mixed. Using a 2008–2022 panel of Chinese listed firms matched to a city-level digital economy index, we estimate lagged fixed-effects models and examine capability and governance channels through firm digital transformation and ESG disclosure. The local digital economy is positively associated with the green transition level (GT beta = 0.0044, p < 0.01) and transition speed (GTS beta = 0.0039, p < 0.10), and it significantly increases digital transformation (DT beta = 0.1431, p < 0.01) and ESG disclosure (ESG beta = 0.9790, p < 0.01), consistent with partial mediation. By contrast, effects on carbon intensity are small and become insignificant once year effects are included, indicating that short-run emissions outcomes are dominated by macro energy conditions and potential rebound forces. Overall, digital development appears to accelerate strategic transition and disclosure capacity more quickly than operational emissions efficiency. Policy implications are twofold: align digital infrastructure with ESG data governance and verification, and coordinate digitalization with energy-system reforms to enable sustained emissions reductions.
1. Introduction
Digitalization and decarbonization are unfolding as intertwined transitions that increasingly shape firm strategy and public policy. Digital technologies such as data platforms, analytics, and cloud infrastructure can improve measurement, prediction, and coordination, which in turn supports more precise energy management and carbon monitoring [1,2,3]. These features make it plausible that digital infrastructure can support firm-level low-carbon transition [4,5], and recent evidence links regional digitalization to industrial efficiency gains and progress toward SDG-7 [6,7].
A central challenge is measurement. Sustainability assessment increasingly relies on indicators that are interpretable, comparable, and linked to management levers. Yet firm-level low-carbon transition is multi-dimensional and rarely captured by a single metric. We therefore adopt an indicator suite that combines green transition level (GT), green transition speed (GTS), and carbon intensity (EI), consistent with indicator selection principles that emphasize conceptual relevance, feasibility, and responsiveness [8,9,10].
The digital economy is an ecosystem rather than a single technology. It includes broadband and data infrastructure, digital finance, software services, and platform-based coordination that reduces transaction costs and enables new organizational forms. Because these components are locally embedded, firms face heterogeneous digital opportunity sets even within a unified regulatory regime. Access to digital services and finance can reshape the feasibility and returns to low-carbon investment, especially for firms that lack in-house capabilities.
Digitalization is not inherently green. Data centers, devices, and networks draw electricity and can trigger rebound effects when efficiency gains lower costs and expand output [11,12,13,14]. The net environmental effect depends on energy mix, grid carbon intensity, and the pace of capital turnover. This ambiguity reinforces the need to distinguish strategic transition signals from operational emissions outcomes.
China provides an informative setting. The country combines rapid digital infrastructure rollout with ambitious climate commitments, while regions vary widely in digital capacity, industrial structure, and energy mix. Listed firms face growing disclosure pressure, yet emissions data remain incomplete, which makes disclosure-based indicators both useful and potentially sensitive to interpretation.
Against this background, we ask whether local digital economy development facilitates corporate low-carbon transition and through which channels. We link a city-level digital economy index to a 2008–2022 panel of Chinese listed firms and estimate lagged fixed-effects models for GT, GTS, and EI. We examine capability and governance channels through firm digital transformation and ESG disclosure to clarify how external digital conditions translate into firm behavior.
This study contributes in three ways. First, it offers an indicator-based measurement framework that separates transition level, speed, and emissions intensity. Second, it provides mechanism evidence on capability building and disclosure governance, helping explain when digitalization translates into low-carbon trajectories. Third, it yields policy implications for sequencing: digital infrastructure can accelerate strategic transition and disclosure capacity, but sustained emissions reductions require complementary energy-system reforms and credible ESG governance.
The remainder of the paper is organized as follows. Section 2 reviews the literature and develops hypotheses. Section 3 describes the data and indicator construction. Section 4 presents the empirical strategy. Section 5 reports baseline, mechanism, and robustness results. Section 6 and Section 7 discuss implications and conclusions.
2. Literature Review and Hypotheses
Research on sustainability assessment argues that complex socio-environmental processes should be summarized by a concise, interpretable indicator set that balances sensitivity and feasibility. This supports our use of GT/GTS (disclosure-based transition dynamics) alongside carbon intensity (operational outcome) as a monitoring suite [8,9,10].
2.1. Digital Economy and Environmental Outcomes
Digital economy scholarship treats it as a general-purpose technology that reshapes production and organization [4,5]. Studies of digital innovation and strategy add that data-driven decision rights and platform architectures reorganize firms and supply chains [1,2,3]. By lowering information frictions and enabling real-time coordination, these systems can lift productivity and facilitate energy-saving process optimization, implying that digital infrastructure can complement environmental regulation by reducing monitoring, verification, and compliance costs [4,5,6]. This logic aligns with regulation-innovation arguments and directed technical change frameworks [15,16,17]. Recent empirical studies for China also report heterogeneous associations between digital economy development and emissions outcomes, suggesting that net environmental effects may vary across regions and industries [18,19,20,21,22,23].
Digital tools can also make environmental performance more observable by enabling more granular monitoring of energy use and process conditions [6]. Smart devices and data systems help firms identify bottlenecks and optimize production and logistics, and firm-level evidence links stronger digital orientation to improvements in energy efficiency and environmental performance during technological change [6,24]. These functions are particularly relevant in energy-intensive sectors, where small efficiency improvements can translate into sizable emissions reductions [6].
Yet the environmental impact of digitalization is ambiguous. Efficiency gains can trigger rebound effects when lower costs stimulate output or consumption [12,13,14], and the digital economy itself consumes energy through data centers, networks, and device production [11]. The net effect depends on the balance between efficiency gains, scale expansion, and the carbon intensity of the energy system.
Empirical evidence therefore remains mixed [18,19,20,21,22,23]. Many China-focused studies report positive associations between digital development and green performance, while others emphasize trade-offs and rebound forces or find heterogeneous effects across regions and industries [12,13,14,18,19,20,21,22,23]. This mix highlights the value of firm-level analysis that separates disclosure-based transition dynamics from operational emissions outcomes. Firm-level evidence also indicates that digital orientation can improve environmental performance during technological change [24].
Digital economy development also generates local spillovers because firms benefit from shared infrastructure, talent pools, and supplier networks [4]. Local digital conditions can therefore influence behavior even when firm-specific adoption is limited. By lowering search, tracking, and verification costs, local digital services can reshape inter-firm coordination, and recent work documents spatial spillover effects of digital economy development on carbon emissions [23].
Beyond geographic spillovers, digital platforms can reconfigure supply-chain coordination and governance by enabling shared data interfaces and common standards [2,3,4]. Such interfaces can reduce information asymmetry and coordination frictions and can transmit environmental expectations and reporting norms across connected firms [2,3,4]. Accordingly, local digital ecosystems may influence environmental behavior even among firms that are not digital leaders, implying that digital economy development can diffuse low-carbon practices through supply chains and industrial clusters [2,3,4].
China is a useful laboratory because digital infrastructure and policy support expanded rapidly, yet local digital governance, data capacity, and energy structure remain uneven. This regional heterogeneity enables firm-level tests of whether local digital economy development translates into stronger transition outcomes beyond what aggregate studies can show [18,19,20,21,22,23].
2.2. Capability and Governance Channels
Firm digital transformation refers to the adoption of digital technologies and the redesign of routines so that data inform decisions [1]. From a dynamic-capabilities perspective, digital transformation enhances sensing, seizing, and reconfiguring by providing real-time information and flexible coordination [25]. Such capability building can support operational efficiency and facilitate the integration of environmental metrics into decision-making, consistent with natural-resource-based arguments about capability-driven environmental performance [26] and with evidence linking digitalization and digital orientation to energy efficiency and environmental performance [6,24].
Digital transformation can create intangible assets such as data architecture, analytics, and digital governance routines [1,2,3]. From a natural-resource-based view, such organizational capabilities can be valuable for environmental management and low-carbon process innovation [26]. They can also increase internal transparency, allowing managers to identify emissions hotspots and prioritize abatement investments [24,26].
Digital transformation is costly and path dependent. It requires investments in data infrastructure, systems integration, and human capital. Firms in regions with stronger digital economies face lower adoption costs and better access to complementary digital services, which should increase the likelihood of transformation. This implies a capability channel from local digital development to green transition [1,2,4,25].
However, the link between digital transformation and environmental performance is not automatic. When digital tools are used mainly for marketing or customer analytics, environmental co-benefits may be limited; moreover, efficiency improvements can be partly offset by scale expansion and rebound effects [12,13,14]. Environmental gains are more likely when transformation is embedded in production and energy management, motivating tests that connect digital transformation to GT/GTS and examine how the local digital economy shapes capability building [24].
While firm-level studies link digital transformation to innovation and environmental management, few explicitly connect local digital economy development to firm transformation and then to green transition. Prior work tends to focus either on regional digitalization and emissions outcomes [18,19,20,21,22,23] or on firm digital transformation as a strategic capability [1,2,3,25,26], leaving the cross-level mechanism under-tested. We therefore hypothesize that digital economy development increases digital transformation, which in turn improves green transition outcomes.
ESG disclosure and governance provide a second channel. ESG reporting reduces information asymmetry and strengthens accountability for environmental commitments [27,28,29,30]. High-quality disclosure is often associated with better environmental management and stronger stakeholder oversight [27,28,29,30]. Digital systems can facilitate this process by enabling integrated data collection, automated reporting, and verification, thereby reducing the marginal cost of transparent disclosure [1,2,3,27,28,29,30].
ESG disclosure also functions as an internal management tool. Standardized metrics and regular reporting embed environmental objectives into budgeting and performance evaluation, which is particularly salient for listed firms facing growing investor and regulatory pressure [27,28,29,30].
The digital economy can thus advance green transition by lowering the cost of ESG disclosure and improving the transparency of environmental information. Firms in digitally advanced regions can standardize data, accelerate reporting cycles, and respond to regulatory and investor expectations, potentially translating digital development into higher ESG scores and more substantive transition actions [1,2,3,27,28,29,30].
This channel is particularly relevant in China, where disclosure standards are evolving and digital reporting platforms are becoming more common. We hypothesize that digital economy development improves ESG disclosure quality and that ESG disclosure contributes positively to green transition [27,28,29,30].
ESG disclosure also interacts with capital markets and stakeholder monitoring. Investors increasingly rely on ESG scores and disclosure quality in capital allocation decisions, which means that improvements in reporting can affect financing conditions and reputational pressure. The disclosure literature suggests that transparency can strengthen managerial accountability and reduce information asymmetry [27,28,29,30]. When digital tools reduce the cost of data collection and verification, these capital-market and stakeholder channels can become more powerful, reinforcing transition incentives.
Capability building is also path dependent. Firms accumulate digital assets and routines over time, and early movers can compound advantages through data governance, analytics, and process redesign [24,25,26]. This implies that local digital economy development may widen gaps between firms with strong transformation capability and those without, even within the same industry. Such path dependence motivates the capability and governance mediators in our empirical strategy.
2.3. Carbon Intensity, Rebound Effects, and Indicator Implications
Carbon intensity captures emissions per unit of activity and reflects physical decarbonization. Digital technologies can lower carbon intensity through process optimization, smart energy management, and logistics improvements. Yet rebound effects, energy-price dynamics, and the energy use of digital infrastructure can offset these gains [11,12,13,14,31]. Carbon intensity is also sensitive to energy mix, grid changes, and industry shocks beyond firm control.
Carbon intensity also depends on capital turnover and technology replacement, which are slow in heavy industries. As a result, digital economy effects on EI may be smaller or slower than effects on disclosure-based transition indices, and EI results may be more sensitive to year effects that capture macro energy conditions and energy-price dynamics [31].
These considerations suggest that the digital economy-carbon intensity link is likely weaker and less robust than the link to GT and GTS. We therefore expect a negative effect on carbon intensity, but anticipate a smaller magnitude and greater sensitivity to time effects [12,13,14,18,19,20,21,22,23].
Carbon intensity is also shaped by accounting boundaries and activity measures. Differences in output denominators, scope coverage, and reporting conventions affect comparability across firms and years. For these reasons, we treat EI as a conservative, complementary outcome and interpret it alongside disclosure-based indicators; indicator-selection frameworks recommend combining outcome indicators with more sensitive process/behavior indicators to balance feasibility and interpretability [8,9,10].
2.4. Research Gap, Conceptual Framework, and Hypotheses
Figure 1 summarizes this conceptual framework and the hypothesized pathways from digital economy development to the indicator suite.
Figure 1.
Conceptual framework linking city digital economy development to the low-carbon indicator suite and mediating capabilities.
Taken together, the literature points to a layered set of expectations. Digital economy development should be linked more strongly to disclosure-based indicators (GT and GTS) that capture governance and strategic commitment, while carbon intensity should respond more slowly and be more sensitive to macro conditions. These expectations guide the hypotheses below and the interpretation of the empirical results [12,13,14,18,19,20,21,22,23,24,27,28,29,30].
Based on the above, we propose the following hypotheses.
H1.
Local digital economy development increases firm green transition level (GT) (expected sign: +).
H2.
Local digital economy development increases firm green transition speed (GTS) (expected sign: +).
H3.
Local digital economy development reduces firm carbon intensity (EI) (expected sign: −), but the effect is expected to be weaker and more sensitive to macro shocks and rebound forces than the effects on disclosure-based indicators.
H4.
Local digital economy development improves (a) firm digital transformation (DT) and (b) ESG disclosure quality (expected signs: + for both).
H5.
DT and ESG disclosure partially mediate the relationship between digital economy development and firm green transition (GT), consistent with capability-building and governance-transparency channels.
Although the literature recognizes links between digitalization and environmental performance [18,19,20,21,22,23,24], it often treats local digital economy development and firm digital transformation as interchangeable [1,2,3]. This overlooks the possibility that external digital infrastructure provides opportunities that translate into outcomes only when firms build complementary capabilities. By separating the local digital economy index from firm-level transformation, our framework aligns with theories that emphasize the interaction between external conditions and internal capabilities [25,26].
The literature also provides limited evidence on the joint relationship between digital economy development, disclosure-based transition indicators, and carbon intensity [18,19,20,21,22,23,24,27,28,29,30]. Emissions-focused studies often lack detailed disclosure measures [18,19,20,21,22,23], while disclosure-based studies rarely test operational outcomes such as carbon intensity [27,28,29,30]. By combining GT, GTS, and EI, we address this gap and capture both strategic and operational dimensions of transition.
Mechanisms are frequently assumed rather than tested [18,19,20,21,22,23,24]. We explicitly examine two channels that are central to contemporary governance: digital transformation capability and ESG disclosure [1,2,3,27,28,29,30]. These channels are prominent in theory and policy, yet firm-level evidence remains limited; our hypotheses integrate digital economy development, capability building, and disclosure governance into a testable framework.
The conceptual framework highlights multiple pathways. A strong digital economy can reduce information frictions and enable data sharing, lowering the cost of monitoring and compliance [2,3,4]. It can also facilitate adoption of digital transformation tools that improve internal efficiency and support green innovation [1,2,3,6,25,26]. Finally, digital reporting platforms reduce the cost of ESG disclosure, increasing transparency and external pressure for performance [27,28,29,30].
These pathways imply both direct and indirect effects. Direct effects operate through improved access to digital services and information, even without deep internal transformation. Indirect effects operate through capability building and disclosure governance. The relative strength of these pathways likely depends on firm resources, management priorities, and regulatory context, which motivates the inclusion of mediators [25,26,30].
Digital finance is a further potential channel because it captures the digitization of financial services—an element included in many composite digital economy indices used in prior studies [18,19,20,21,22,23]. In principle, this component may operate through financing-related mechanisms, but we do not separately identify it in the baseline models.
Measurement choices also shape interpretation. Text-based indices for green transition and digital transformation capture disclosure intensity rather than physical outputs [32]. This implies that digital development may first influence how firms communicate and manage environmental issues, with physical outcomes following later. Including carbon intensity provides a complementary check but remains sensitive to macro trends and data availability [8,9,10].
The literature implies that empirical work should distinguish local digital economy conditions from firm-specific transformation choices [4,18,19,20,21,22,23,24]. Our use of a local digital economy index with firm fixed effects separates external variation from time-invariant firm traits and addresses a key challenge in digital economy research.
Another implication is timing. Digital economy development does not translate into firm behavior instantly; adoption and integration take time [1,25]. By lagging the digital economy index, we capture this temporal sequence and reduce reverse-causality concerns.
Finally, multiple outcomes are required to capture the complexity of low-carbon transition [8,9,10]. Disclosure-based indices reflect strategic orientation and communication, while carbon intensity reflects operational outcomes. Combining these measures yields a more balanced assessment of how digitalization affects reporting behavior and emissions efficiency.
Existing empirical studies typically report a positive association between digitalization and green development indicators at the regional level, but effect sizes vary by region and period [18,19,20,21,22,23]. Heterogeneity likely reflects differences in energy structure, industrial composition, and governance capacity, reinforcing the need for firm-level analysis that controls for fixed differences and focuses on within-firm changes.
Firm-level evidence on digital transformation and environmental performance is also mixed [24]. Some studies find that digital adoption enhances green innovation and efficiency, while others report limited or delayed effects. Differences in measurement, sample period, and outcome definitions contribute to this variation; text-based indices provide broad coverage but introduce measurement noise that can attenuate effects [32].
Overall, the literature indicates that digital economy impacts depend on complementary capabilities and governance [1,2,3,25,26,27,28,29,30]. Our empirical strategy tests these conditions by examining mediation through digital transformation and ESG disclosure and by comparing disclosure-based outcomes with carbon intensity.
Indicator validity is therefore central. Text-based measures can capture managerial attention and the institutionalization of environmental routines, but they require transparent dictionaries, stable preprocessing, and normalization [32]. Combining text-based indicators with an outcome measure such as EI helps guard against purely symbolic disclosure and provides a richer basis for policy interpretation [8,9,10].
Beyond measurement, structural change is a plausible pathway [2,3,4,18,33,34]. Digital platforms can facilitate servitization, enable remote monitoring and maintenance, and support product-service systems that reduce material throughput. They can also improve matching in input markets, which may reduce resource misallocation and shift production toward less carbon-intensive activities. These structural effects are gradual and may not register immediately in EI, but they can shape longer-term trajectories that eventually show up in operational emissions outcomes.
Remaining gaps include the need for more granular measures of digital adoption and for causal identification based on exogenous digital infrastructure shocks. These limitations motivate ongoing data collection and methodological innovation, and they provide a roadmap for future research to build on the evidence presented here [1,4].
Future research should explore how digital economy development interacts with environmental regulation and energy market reforms. The sequencing of digital infrastructure expansion and policy tightening may shape the magnitude of environmental outcomes. Studies that exploit policy discontinuities or phased infrastructure rollout could provide more credible causal evidence and shed light on heterogeneous effects across regions and industries [15,16,17,18,19,20,21,22,23,35].
Another priority is integrating micro-level digital adoption data with emissions information. Such data would allow researchers to disentangle the effects of digital capability from local digital environment factors and to test whether specific digital technologies, such as industrial internet platforms or AI-based energy management systems, yield stronger emissions reductions than general digitalization. These advances would deepen understanding of the mechanisms emphasized in this paper [1,5,6].
A final agenda item concerns cross-border supply chains. Digital platforms increasingly connect firms across regions and countries, which means that digital economy effects may spill over beyond local boundaries. Studying these spillovers would clarify how local digital development influences global emissions and how firms can leverage digital tools to coordinate low-carbon supply chains [2,3,4,33,34].
Future work should also evaluate how measurement choices shape conclusions. Comparing dictionary-based indices with machine-learning-based measures or with direct emissions data can improve validity and clarify which dimensions of green transition are most sensitive to digital economy development. This is especially important for policy, where decisions rely on robust and interpretable evidence [9,10,32,36].
3. Data and Variable Construction
3.1. Sample and Data Sources
We use the compiled firm-year dataset covering Chinese listed firms. It integrates green transition indices, digital economy measures, carbon intensity, ESG scores, and standard financial controls. After lagging core regressors by one year and excluding observations with missing baseline variables, the main regressions include 35,504 to 35,853 firm-year observations. Carbon-intensity models use a smaller sample of 23,881 observations because EI is available for fewer firms.
The sample spans 2008–2022, covering rapid digital infrastructure expansion and tighter climate policy while providing sufficient time variation for fixed-effects estimation. All continuous variables are winsorized at the 1st and 99th percentiles to limit the influence of outliers.
To reduce simultaneity concerns, core explanatory variables are lagged by one year and models are estimated on the resulting panels for each outcome. Sample sizes differ across GT, GTS, and EI because of data availability and the lag structure. We report sample sizes in each table and keep the lag structure consistent across robustness checks to maintain comparability.
Missingness is not random across outcomes: emissions data are more common among larger and more energy-intensive firms, whereas GT and GTS are available for a broader set of listed companies. We therefore interpret EI estimates as conservative and report them as a complement to disclosure-based measures. Consistent patterns across GT/GTS and robustness to alternative indices mitigate, but do not eliminate, concerns about sample selection.
We also inspected the distribution of key indices across years and industries to ensure that no single year or sector dominates variation. The standardized digital economy index retains meaningful dispersion throughout the sample window, supporting the use of lagged fixed effects rather than a small set of shock years. While these checks do not replace formal causal identification, they reduce the likelihood that results are driven by a narrow subset of observations.
The dataset combines firm-level financial records with text-based indices derived from annual and CSR reports, and it links local digital economy indices to firm outcomes by location. The panel spans a wide range of industries and regions, enabling firm fixed effects to control for unobserved heterogeneity while exploiting within-firm variation over time.
Firm locations are matched to city-level digital economy indices using registered headquarters cities. This matching captures the external digital environment in which firms operate, including local infrastructure, digital finance, and data-service availability. Because the index varies at the city-level, it provides within-industry and within-firm variation over time that can be leveraged once fixed effects are included.
3.2. Digital Economy Index
The key explanatory variable is the local digital economy index, EDI total (EDI). It draws on official statistics covering digital infrastructure, digital finance, and digital industry development. We standardize the index within the sample and lag it by one year to mitigate simultaneity. Robustness checks use alternative index variants (DE1 and DE2), also standardized.
Formally, for city c in year t, the composite index can be written as , where denotes standardized sub-indicators (e.g., infrastructure, digital finance, and digital-industry/service development) and are entropy-based weights. We winsorize the city index (1st/99th percentiles) and then standardize it to mean 0 and standard deviation 1; the lagged standardized value enters the firm-level regressions.
EDI captures the local digital environment rather than firm-specific adoption. This distinction matters because local digital conditions shape access to services, data infrastructure, and digital finance. By using lagged values, we focus on how pre-existing digital environments influence subsequent firm behavior.
3.3. Green Transition Level and Speed
Green transition level (GT) captures the intensity of low-carbon transition disclosure in firm reports, while green transition speed (GTS) captures the year-on-year momentum of that transition discourse. Conceptually, GT reflects how strongly a firm emphasizes transition-related actions and commitments in a given year, whereas GTS reflects whether that emphasis is accelerating or decelerating over time. Because strategic commitments and disclosure capacity can adjust faster than operational energy use, GT/GTS may increase even when short-run carbon-intensity outcomes remain unchanged.
Construction and formulas. Let denote the total number of tokens in firm i’s report in year t, and let denote the matched keyword count from the green-transition dictionary. We construct . Transition speed is measured as the year-on-year growth rate of the underlying transition text index (gt): . We winsorize GT and GTS at the 1st/99th percentiles. In robustness checks we use an alternative transition proxy (GTRSP). Table A1 summarizes definitions, units/scale, and expected behaviors for the indicator suite.
Text processing follows a transparent, dictionary-based pipeline to preserve interpretability and replicability. Documents are cleaned and standardized, keywords are matched using curated dictionaries for green transition and digital transformation, and indices are normalized by document length or log-scaled as appropriate. Detailed preprocessing steps, dictionary lists, and scripts are provided in the replication package and described in Appendix A.2 [32].
3.4. Carbon Intensity
Carbon intensity (EI) is measured as firm-level CO2 emissions intensity per unit of activity. In the dataset, EI is constructed as CO2 emissions scaled by an activity proxy (e.g., operating revenue), so that lower values indicate stronger operational decarbonization. . EI is available for only a subset of firms, so analyses use a reduced sample. We estimate EI regressions with firm fixed effects and also report two-way fixed effects and sensitivity checks (Appendix A Table A4).
Because EI is a physical outcome tied to energy use and output, it likely responds more slowly to digitalization than disclosure-based indices. We therefore interpret EI as a complementary but more conservative indicator of operational decarbonization.
3.5. Digital Transformation and ESG Disclosure
Digital transformation (DT) is measured using a report-based text index that captures firms’ digitalization-related disclosure intensity. Following common practice in listed-firm studies, we construct DT as , where is the matched count of digital-transformation keywords in firm reports (Appendix A.2). ESG disclosure is measured by ESG score, which aggregates environmental, social, and governance information from firm reporting and third-party assessments. Both DT and ESG score serve as mediators to test whether the digital economy affects green transition through capability building and transparency.
3.6. Control Variables and Data Treatment
The control set follows the replication package and includes standard firm financial indicators (size, leverage, profitability, liquidity, growth, and governance attributes), along with industry or ownership characteristics where available. Controls are lagged where appropriate to reduce simultaneity. Detailed definitions and sources appear in Appendix A and the replication package (Supplementary Materials).
Baseline models include firm and year fixed effects to account for time-invariant firm traits and common macro shocks. Continuous variables are winsorized, and the digital economy index is standardized to ease interpretation of coefficients.
3.7. Descriptive Statistics and Initial Patterns
Table 1 summarizes descriptive statistics. Mean GT is 0.1098 (SD 0.0513), indicating substantial variation in transition intensity across firms. GTS is more dispersed (SD 0.2449), reflecting heterogeneity in transition speed. The standardized digital economy index has mean near zero and SD near one, consistent with normalization. DT and ESG scores also show meaningful variation.
Table 1.
Descriptive Statistics.
Figure A1 shows upward trends in the digital economy and green transition indices, while Figure A2 highlights the distributional spread in DE and GT. The upward GT trend suggests increasing disclosure and strategic emphasis, yet dispersion indicates that firm-specific factors remain important. These patterns motivate the regression analysis that follows.
The EI subsample is smaller and likely more concentrated in heavy industries, which may reduce precision. We interpret EI results cautiously and emphasize that they complement, rather than replace, disclosure-based transition measures. Future data expansion could improve the representativeness of emissions outcomes.
We assess whether any single year or industry dominates variation in key indices. The standardized distribution of DE and winsorization of continuous variables help ensure results are not driven by extremes, providing a stable basis for fixed-effects regressions.
Text-based indices are subject to measurement error and may capture disclosure emphasis rather than physical action. To mitigate this, we standardize indices within the sample and rely on multiple outcomes. The replication package (Supplementary Materials) documents dictionaries and processing steps to support transparency and replication.
ESG score and DT coverage varies slightly across firms and years, explaining minor sample-size differences across models. We report sample sizes in each table and interpret mediation results with this coverage in mind. Future research with more comprehensive ESG and emissions data would improve comparability across outcomes.
4. Methodology
4.1. Baseline Fixed Effects Specification
Lag structure and fixed effects. We lag the digital economy index by one year to mitigate contemporaneous simultaneity and to reflect adjustment lags in capability building, reporting systems, and investment planning. Firm fixed effects absorb time-invariant heterogeneity (e.g., business model, baseline technology), while year fixed effects absorb common macro shocks (e.g., energy prices, national policy cycles) that are particularly important for emissions-related outcomes. In Table A3, we show that the positive association between DE and GT remains when using a two-year lag and when controlling for lagged outcomes in a dynamic specification; for carbon intensity, Table A4 reports sensitivity tests with industry-year effects and alternative normalizations (ln(EI)).
We estimate the baseline relationship between the digital economy and green transition using firm fixed effects with year dummies, consistent with the specification above.
The one-year lag of the digital economy index reduces contemporaneous reverse causality and reflects the time required for local infrastructure to influence firm behavior. Firm fixed effects control for time-invariant heterogeneity (e.g., industry classification or corporate culture), while year fixed effects absorb macro shocks and national policies. Standard errors are clustered at the firm-level to account for serial correlation.
Because DE is standardized, coefficients can be interpreted as the change in the outcome associated with a one standard deviation increase in the digital economy index. This improves comparability across models and aids interpretation of economic significance relative to variation in GT, GTS, and EI.
We interpret coefficients as associations between changes in local digital economy conditions and within-firm changes in outcomes. Standardization makes magnitudes comparable across GT, GTS, and EI, which helps distinguish strategic disclosure responses from operational emissions responses. Full coefficient tables are reported to facilitate replication and sensitivity checks.
4.2. Mechanism Tests
To test mechanisms, we regress digital transformation (DT) and ESG disclosure on the digital economy index using the same fixed effects and controls. A significant relationship indicates that local digital economy development shapes firm capabilities and governance. We then include DT or ESG in green-transition regressions to evaluate attenuation of the digital economy effect.
4.3. Mediation Framework
We implement a stepwise (Baron–Kenny style) mediation decomposition with fixed effects: (i) estimate DE → Mediator (DT or ESG score); (ii) estimate DE → GT; and (iii) estimate DE → GT controlling for the mediator. If DE significantly predicts the mediator and the mediator is positively associated with GT while the DE coefficient attenuates (but remains significant), the pattern is consistent with partial mediation. Because mediators are observational and potentially endogenous, we interpret mediation evidence as descriptive channel diagnostics rather than causal decomposition.
To improve transparency, Table 2, Table 3, Table 4 and Table 5 report each step explicitly: Table 2 presents baseline DE effects on GT and GTS; Table 3 reports baseline DE effects on EI; Table 4 presents the DE effects on DT and ESG disclosure, and Table 5 reports GT regressions including each mediator. The comparison across columns indicates the extent to which capability building (DT) and governance transparency (ESG disclosure) account for the DE–GT association.
Table 2.
Baseline Results: Digital Economy and Green Transition.
Table 3.
Baseline Results: Digital Economy and Carbon Intensity.
Table 4.
Mechanism tests: DE effects on DT and ESG disclosure.
Table 5.
Mediation Analysis.
4.4. Heterogeneity and Complementary Capabilities
We discuss heterogeneity as a conceptual extension: digital economy effects may depend on regulatory pressure or green-finance depth. Consistent moderator series are not available for all firm-years, so interaction models are not estimated in the main analysis.
We interpret mediation results through a complementary-capabilities lens. Digital transformation and ESG disclosure are likely complements rather than substitutes, implying stronger effects when both are present. While we do not estimate formal DT-ESG interactions, mediation results and marginal effect plots provide suggestive evidence of complementarity.
4.5. Robustness Strategy
Robustness checks use alternative digital economy indices (DE1 and DE2), an alternative transition proxy (GTRSP), and alternative specifications for GTS. These checks verify that results are not driven by a particular index or outcome definition. We also confirm that 2008–2022 is the longest window with consistent digital economy and text-based measures in the dataset.
The robustness strategy is designed to test sensitivity to measurement choices rather than to impose additional structure. Alternative indices and outcomes are drawn from the same data sources to avoid introducing new measurement noise, and all specifications retain the same fixed-effects structure for comparability.
4.6. Identification Considerations
Endogeneity concerns include reverse causality (firms’ transition strategies may influence local digital services), correlated time-varying factors (e.g., regional green policy intensity), and measurement error in text-based indices. The one-year lag structure and two-way fixed effects mitigate simultaneity and common shocks but cannot fully eliminate omitted-variable bias.
To strengthen credibility, we provide additional sensitivity analyses. Table A3 reports timing and dynamic specifications: (i) a two-year lag of DE, which reduces contemporaneous feedback, and (ii) a dynamic model that controls for the lagged dependent variable to account for persistence in transition disclosure. The DE-GT association remains positive and statistically significant across these specifications, supporting the interpretation that digital development precedes strategic transition disclosure changes. For emissions intensity, Table A4 shows that results are robust to absorbing sector-specific macro shocks with industry-year effects and to using ln(EI) as an alternative normalization; EI estimates remain small and sensitive, consistent with stronger macro constraints and potential rebound forces.
Because the digital economy index varies at the city level, inference can be sensitive to the clustering level. We therefore report robustness checks with alternative standard-error clustering at the firm level, at the city level, and with two-way clustering by firm and city. In addition, we control for report length (ln words) in the GT and DT regressions to ensure that results are not mechanically driven by changes in disclosure volume. Table A5 shows that the main conclusions for GT and the mechanism variables remain stable under these inference and specification variants.
Overall, we interpret the evidence as robust within-firm associations consistent with the proposed capability and governance channels. Stronger causal identification (e.g., policy shocks or valid instruments for digital infrastructure) remains a valuable direction for future research and can be pursued as additional data become available.
5. Empirical Results
To maintain a clear empirical logic, we first document descriptive patterns and simple correlations (Section 5.1), then establish baseline fixed-effects associations for the indicator suite (Section 5.2), and finally examine mechanisms and robustness/sensitivity analyses (Section 5.3 and Section 5.4).
5.1. Descriptive Patterns
Table 1 reports summary statistics for the main variables. GT shows meaningful cross-firm dispersion, while GTS is more volatile, consistent with episodic changes in transition discourse. The standardized digital economy index also exhibits substantial variation, supporting within-firm estimation with lagged regressors.
Appendix A Figure A1, Figure A2 and Figure A3 provide additional descriptive evidence. Figure A1 indicates upward trends in DE and GT over time, whereas GTS and EI fluctuate more strongly. Figure A2 highlights the right-skewed distributions of DE and GT after standardization, and Figure A3 shows a positive bivariate association between lagged DE and GT. These patterns motivate the baseline fixed-effects models and contextualize the later mechanism and robustness analyses.
5.2. Baseline Effects on Green Transition Level and Speed
Table 2 reports baseline fixed-effects results. Column (1) shows that the lagged standardized digital economy index is positive and highly significant for GT (0.0044, SE 0.0004). A one standard deviation increase in local digital economy development corresponds to a 0.0044 increase in GT. Column (3) shows a positive, marginally significant association for GTS (0.0039, SE 0.0023), indicating faster transition in more digitalized regions.
Model fit and interpretation. The within R-squared values are modest, which is common in firm fixed-effects models when outcomes are noisy and variation is largely within-firm over time (especially for text-based indices and change measures like GTS). We therefore emphasize coefficient stability across specifications, clustered inference, and robustness checks (Table 6, Table 7, Table A3 and Table A4) rather than raw goodness-of-fit.
Table 6.
Robustness and Alternative Measures.
Table 7.
Alternative carbon-intensity outcomes (CO2 intensity reduction speed and level).
Table 3 reports EI regressions. In a firm fixed-effects specification without year dummies, the DE coefficient is positive and significant, whereas the two-way fixed effects estimate is close to zero and insignificant. This sensitivity indicates that short-run emissions-intensity dynamics are strongly influenced by common macro shocks absorbed by year effects. It may also reflect measurement noise and sample selection: EI coverage is concentrated among larger and more energy-intensive firms, and activity denominators differ across sectors. To investigate these concerns, Table 7 reports alternative carbon-intensity outcomes and Table A4 adds industry-year effects and a log normalization; EI estimates remain small and sensitive. Overall, the evidence suggests that digital development accelerates strategic transition and disclosure capacity more robustly than it reduces operational emissions intensity over the sample window.
Figure A3 shows a positive association between lagged DE and GT. Figure 2 summarizes baseline DE coefficients across GT, GTS, and EI, showing robust effects for GT, smaller positive effects for GTS, and small, time-sensitive effects for EI. These visual patterns complement the regressions and reinforce the interpretation that the digital economy primarily affects strategic transition indicators rather than immediate emissions intensity.
Figure 2.
Baseline DE coefficients across GT, GTS, and carbon intensity (two-way fixed effects; 95% CI).
When digital transformation is included in the GT regression, the DE coefficient remains positive and significant (0.0032, SE 0.0004), while DT is also positive and significant (0.0052, SE 0.0003). These estimates indicate partial mediation through firm digital transformation. The baseline GTS specification remains positive without imposing a mediation structure.
The GT coefficient is modest but economically meaningful. With a GT standard deviation of 0.0513, a 0.0044 increase equals about 8.6 percent of one standard deviation (and 0.0032 equals about 6.2 percent). Comparing firms in regions two standard deviations above versus below the digital economy mean implies a GT gap of about 0.0176, roughly 34 percent of the GT standard deviation. This indicates that regional digital economy gaps can translate into sizable differences in transition intensity.
For GTS, the coefficient represents a smaller fraction of its standard deviation, consistent with higher volatility and greater exposure to year-specific shocks. This suggests that transition speed may respond to episodic policy changes or firm initiatives, while transition level reflects more persistent strategic orientation.
The EI sample is smaller, reducing precision, and the outcome is influenced by sector-specific energy intensity. These features may explain the less stable EI estimates. The results nonetheless point to a plausible pathway: digitalization may contribute to emissions efficiency, but the effect is contingent on broader energy conditions and may require more time to materialize.
Overall, baseline results indicate that digital economy development is positively associated with green transition level and speed, with statistically significant and economically moderate effects. Carbon intensity effects are weak and specification-sensitive. These patterns motivate deeper analysis of mechanisms and mediating channels.
The contrast between GT, GTS, and EI highlights the layered nature of low-carbon transition. Disclosure-based measures respond more quickly to changes in the digital economy environment, while carbon intensity responds more slowly and is influenced by macro energy trends and rebound effects. This suggests digitalization can accelerate strategic transition and reporting even when physical abatement progresses gradually.
Modest within R2 values are typical for firm fixed-effects models with noisy text-based outcomes and do not undermine the statistical significance of key coefficients. Consistent signs and significance across specifications support the interpretation that the digital economy is positively associated with green transition, even if magnitudes are moderate. The pattern aligns with gradual capability building rather than abrupt shifts.
Attenuation of the DE coefficient when DT is included provides further evidence of a capability channel. It indicates that part of the digital economy effect operates through firm-level digital transformation, aligning with the mechanism and mediation results. This pattern suggests that external digital conditions translate into transition outcomes primarily through internal capability building.
The GT coefficient corresponds to roughly 4 percent of mean GT, indicating that digital economy development contributes incrementally but meaningfully to transition intensity. This magnitude is consistent with gradual, cumulative environmental change and suggests that policies raising local digital development can yield measurable improvements over time.
GTS appears more sensitive to firm capabilities than transition level, but we focus mediation tests on GT because GTS is a short-run change measure and less stable for channel identification. This highlights the importance of capability building for accelerating transition pace while preserving interpretability in the mediation framework.
With mean GTS at 0.0664, the baseline coefficient of 0.0039 implies a modest but nontrivial change in transition speed. This reinforces the view that the digital economy contributes to incremental acceleration rather than dramatic shifts and that capability building is essential for sustained improvements.
5.3. Mechanisms and Mediation
Table 4 reports mechanism regressions. The coefficient of lagged DE on digital transformation is 0.1431 (SE 0.0105), significant at the 1 percent level. With a DT standard deviation of about 1.05, a one standard deviation increase in DE raises DT by roughly 14 percent of a standard deviation. This sizeable association supports the capability channel: a stronger digital economy environment is linked to higher firm digital transformation intensity.
Figure 3 visualizes the mechanism coefficients for DT and ESG.
Figure 3.
Mechanism coefficients: DE effects on DT and ESG (two-way fixed effects; 95% CI).
Table 5 presents mediation regressions for GT. When DT is added, both DE and DT remain significant and the DE coefficient declines from 0.0044 to 0.0032, a reduction of about 27 percent that indicates partial mediation. When ESG score is included, DE remains significant at 0.0037 and ESG score is positive and significant at 0.0004, indicating a second mediation path through disclosure quality.
Digital transformation can support green transition by enabling real-time monitoring, predictive maintenance, and data-driven optimization. These capabilities help firms identify energy losses and implement targeted efficiency improvements. The strong association between DE and DT suggests that local digital infrastructure reduces the cost of adopting such capabilities.
The same table shows that DE also significantly increases ESG disclosure. The estimated coefficient is 0.9790 (SE 0.0565), significant at the 1 percent level. Relative to the ESG standard deviation of about 5.01, this effect equals roughly 19.5 percent of one standard deviation. This indicates that digital economy development improves reporting quality and transparency, strengthening environmental governance.
Digital tools reduce the cost of collecting ESG data, automate reporting, and facilitate third-party verification. These functions are especially valuable for listed firms facing tighter disclosure requirements. The evidence indicates that digital economy development improves these governance processes, reinforcing green transition commitments.
Together, these results show that the digital economy is strongly associated with both capability building and disclosure practices. The magnitudes are larger than the direct GT coefficients, consistent with a mediation structure in which the digital economy influences green transition primarily through internal capabilities and governance rather than direct operational change. The next section examines mediation explicitly.
These results suggest that the digital economy does not simply raise green transition through external conditions; it influences firm behavior by enabling digital transformation and improved ESG disclosure. The persistence of the DE coefficient implies that other channels may also contribute, such as access to digital finance, improved supply-chain coordination, or data-driven innovation not fully captured by DT and ESG.
The mediation results highlight complementarity between digital transformation and ESG disclosure. Digital systems provide the data backbone for credible reporting, while disclosure standards create incentives to embed environmental metrics in digital workflows. This implies that digital infrastructure investments should be paired with governance and reporting standards to realize environmental benefits. Figure A4 illustrates stronger marginal effects of DE on GT at higher ESG percentiles.
This perspective is consistent with a capability-based view in which firms need both technical capacity and governance mechanisms to achieve strategic change. Digital transformation without ESG governance may yield efficiency gains but limited transparency, while ESG disclosure without digital systems may be costly and less reliable. The strongest transition outcomes are likely when both capabilities are present.
For managers, the findings imply that digital transformation should be integrated with environmental management rather than treated as a stand-alone IT modernization effort. Investments in sensors, analytics, and automation are most likely to translate into green transition when linked to environmental KPIs, verification processes, and ESG reporting routines. Firms that align digital transformation with disclosure and accountability are more likely to realize the benefits of local digital economy development.
5.4. Robustness and Additional Analyses
Table 6 confirms that baseline patterns are not driven by a specific digital economy index or green transition definition. Using alternative indices (DE1 and DE2), GT coefficients remain positive and significant. The alternative transition proxy (GTRSP) also yields a positive and significant DE coefficient, strengthening confidence in robustness.
Figure 4 summarizes robustness coefficients across alternative indices and outcomes.
Figure 4.
Robustness checks with alternative digital economy indices and outcome definitions (two-way fixed effects; 95% CI).
Using GTRSP as an alternative outcome yields a DE coefficient of 0.0181 (SE 0.0081), significant at the 5 percent level. This confirms that the positive effect extends to alternative transition proxy measures.
We further examine alternative carbon-intensity outcomes based on CO2 intensity reduction speed and reduction level. DE coefficients are small and statistically insignificant once year effects are included, and weak negative effects in firm-fixed models do not survive two-way fixed effects (Table 7). These results reinforce the view that carbon-intensity indicators are sensitive to macro energy conditions and rebound forces.
We do not report heterogeneity interactions in the baseline tables because the dataset lacks consistent coverage for candidate moderators. Conceptually, digital economy effects may be stronger where environmental regulation is tighter or green-finance markets are deeper, but testing these interactions requires local policy indicators outside the current replication scope. We therefore treat heterogeneity analysis as a priority extension.
The analysis uses the 2008–2022 window, the longest period with consistent digital economy and text-based indices in the dataset. Extending the sample would require updated digital economy indices and additional text processing. Within this window, robustness results indicate that the positive relationship between digital economy development and green transition is stable.
6. Discussion and Policy Implications
The findings indicate that local digital economy development operates as an enabling environment for corporate low-carbon transition. The positive GT/GTS effects, together with the mediation results, align with information-infrastructure perspectives and with dynamic-capabilities arguments that emphasize the interaction between external opportunities and internal reconfiguration.
The contrast between disclosure-based indicators and carbon intensity is especially important. GT and GTS respond to digital development, whereas EI becomes statistically indistinguishable from zero once year effects are included. This pattern suggests that reporting and strategic transition signals adjust earlier, while operational emissions remain dominated by energy mix, rebound effects, and capital turnover.
Mechanism estimates highlight the role of capability building and governance. Digital infrastructure alone is not sufficient; firms still need digital transformation and ESG reporting systems that translate data availability into management routines. The results therefore help explain why stronger effects tend to appear in digitally advanced regions.
For policy, the implication is integration rather than parallelism. Investments in digital infrastructure should be paired with environmental data standards, disclosure rules, and verification protocols. This alignment strengthens the transparency channel and reduces greenwashing risks.
Implementation matters for these policy recommendations. Digital reporting systems require interoperable data standards, secure data-sharing protocols, and audit trails that allow regulators and investors to verify emissions claims. Without clear governance on data quality and access, digitalization can raise reporting volume without improving credibility. A practical implication is that ministries and exchanges can align ESG disclosure templates with digital reporting standards to reduce compliance costs while improving comparability.
Innovation management is another lever. Digital transformation affects low-carbon outcomes when it is embedded in operations, not when it sits in parallel IT projects. Firms that integrate sustainability teams with data, operations, and finance functions are better positioned to translate analytics into abatement actions. Incentive design also matters: linking digital KPIs to environmental targets can turn data visibility into operational change.
Regional policy design should recognize uneven capability. In less digitalized regions, infrastructure investment alone may be insufficient; complementary measures such as digital finance, training programs, and shared industrial platforms can help smaller firms adopt low-carbon practices. In energy-intensive clusters, targeted digital tools for monitoring and process control can amplify the emissions benefits of digital upgrades.
These lessons are relevant beyond China. Many emerging economies are expanding digital infrastructure while pursuing climate targets, yet they face similar constraints from energy systems and institutional capacity. The results therefore speak to broader debates on how digitalization can serve as carbon-management infrastructure rather than merely a productivity tool.
Corporate governance implications are also notable. Digital transition projects often sit with IT or operations, while ESG oversight may sit with finance or compliance. The results suggest that coordination across these functions matters: without shared accountability, data visibility may not translate into operational change. Boards can support integration by assigning ownership for environmental data quality, linking executive incentives to verified emissions metrics, and ensuring that digital investments align with transition strategy.
Another implication concerns ESG rating agencies and assurance providers. As disclosure quality becomes more central, differences in verification and scoring methodologies can shape how the market interprets reported progress. Digital reporting systems can enable more frequent and granular data, but they also raise questions about comparability and auditability. Encouraging third-party assurance and harmonized reporting standards would improve the credibility of digital-enabled ESG disclosure.
Digital finance can broaden access to green investment, yet it can also create new forms of exclusion when smaller firms lack the data footprint needed for algorithmic credit screening. Policymakers may need to combine digital finance with capacity-building programs that help smaller firms produce credible ESG data and demonstrate energy-efficiency improvements. This combination would reduce the risk that digitalization widens transition gaps across firm size or ownership.
Finally, data security and privacy considerations are not peripheral. Environmental data systems often integrate operational, supply-chain, and financial information; weak security can undermine trust and deter adoption. Robust cybersecurity standards and clear data rights are therefore complements to the digital-ESG governance agenda.
Policy evaluation also benefits from the indicator suite. GT and GTS can serve as early-warning signals of whether digital policies are translating into governance and disclosure improvements, while EI provides a later-stage check on operational efficiency. A monitoring system that tracks all three dimensions can inform whether policy packages are working as intended or whether they are producing only symbolic compliance.
A related risk is the substitution of visibility for substance. As reporting systems become easier to operate, firms may be tempted to focus on narrative disclosure rather than process change. The indicator suite mitigates this risk by anchoring disclosure to operational outcomes, but it cannot eliminate it on its own. Strong verification, credible assurance, and alignment with energy-system reforms remain essential if digital reporting is to translate into measurable emissions reductions rather than improved optics.
Another practical implication concerns sequencing between digital infrastructure rollout and environmental regulation. Where carbon markets and enforcement are weak, digital investments may mainly improve monitoring and disclosure without inducing substantive abatement. When regulatory signals and energy pricing are stronger, the same digital tools can accelerate investment in efficiency and cleaner processes. This suggests that digital economy policy should be coordinated with regulatory and energy reforms, including carbon pricing, grid decarbonization, and incentives for low-carbon capital stock replacement. Coordination across agencies matters: digital ministries, environmental regulators, and energy authorities need shared data standards and aligned policy timelines so that data visibility translates into real operational change.
Regional capability gaps also matter. Firms in less digitalized areas are unlikely to benefit fully without targeted support such as digital finance, training, and shared platforms. Sector-specific reporting templates and industrial internet tools can help energy-intensive industries convert digital capacity into measurable abatement.
For managers, the results emphasize execution. Digital systems generate data, but emissions reductions materialize only when environmental KPIs are embedded in digital transformation roadmaps and linked to incentives. ESG disclosure can serve as a management tool rather than a compliance formality.
Limitations remain. The green-transition and digital-transformation measures are text-based and therefore capture disclosure intensity rather than direct physical action, and carbon-intensity coverage is incomplete. Lagged fixed effects mitigate endogeneity but do not fully resolve policy targeting or time-varying shocks, so causal claims should be made cautiously.
Future work should exploit quasi-experimental variation in digital infrastructure rollout, connect firm-level digital adoption to finer emissions data, and examine supply-chain spillovers. With richer data, it will be possible to test whether digitalization reduces emissions at the system level rather than primarily changing disclosure.
Data governance and interoperability are additional levers. Common definitions, consistent formats, and secure sharing protocols can reduce reporting costs and improve comparability across firms and regions.
Finally, the relevance extends beyond China. Many emerging economies are scaling digital infrastructure while pursuing climate goals; the evidence here suggests that the green benefits depend on capability building and disclosure governance, not digital investment alone.
7. Conclusions
Using a 2008–2022 panel of Chinese listed firms, this study shows that local digital economy development is associated with higher green transition level and speed. The digital economy also raises firm digital transformation and ESG disclosure, and both channels partially mediate the transition effects.
Carbon intensity responds differently. Once year effects are included, the digital economy coefficient is small and statistically insignificant, implying that short-run emissions outcomes are shaped largely by macro energy conditions and potential rebound effects rather than local digital development.
Taken together, the results indicate that digitalization accelerates strategic and disclosure-based transition signals, but operational emissions improvements require complementary governance and energy-system reforms. Policies that pair digital infrastructure with ESG standards, data transparency, and energy-management practices are therefore more likely to deliver measurable abatement.
The study contributes firm-level evidence and an indicator-based monitoring framework that can be replicated in other settings. It also clarifies the distinction between disclosure-based transition metrics and emissions outcomes, which is critical for interpreting digital-economy effects.
From a practical perspective, the indicator suite can help managers and regulators track both strategic commitment and operational performance. GT and GTS capture how firms communicate and institutionalize transition efforts, while EI provides a conservative check on physical efficiency. Using these measures together reduces the risk that disclosure substitutes for action and provides a clearer basis for accountability.
For policy design, the evidence suggests that digital infrastructure investment should be sequenced with energy-system reforms and ESG governance. Digitalization can accelerate the organizational side of transition, but emissions outcomes depend on energy prices, grid mix, and capital turnover. Coordinated policy packages are therefore more likely to deliver sustained reductions in carbon intensity.
Taken together, the evidence suggests that digital economy policy should be judged not only by productivity gains but also by its ability to build credible transition infrastructure. The indicator suite provides a practical way to monitor whether digital investments are translating into substantive environmental improvements, and it can be adapted to other contexts where emissions data are incomplete or uneven.
By positioning digital economy development as part of a broader sustainability toolkit, the study aligns with the Sustainability agenda of integrating technological innovation and environmental governance. The indicator suite and mechanism evidence can be adapted to other contexts and can inform how digital infrastructure investment is evaluated against climate objectives.
A further contribution is methodological transparency. The indicator suite, variable construction, and robustness checks are documented in a way that facilitates replication and comparison across settings. For Sustainability readers, such transparency matters because it allows cross-country learning and meta-analytic synthesis in a field where data availability is uneven. Replication-oriented design also helps policymakers evaluate whether digital investments are delivering measurable environmental benefits rather than only improving narrative disclosure. This transparency also facilitates independent verification and reuse. It strengthens credibility for stakeholders.
Limitations include the text-based nature of GT/GTS, partial EI coverage, and residual endogeneity despite fixed effects and lagging. Future research should leverage policy experiments such as broadband rollouts or digital-pilot programs and integrate facility-level or supply-chain emissions data.
Overall, digital economy policy should be treated as part of a broader green-transition portfolio. Coordinated monitoring of disclosure and emissions indicators can help distinguish symbolic compliance from substantive decarbonization and inform evidence-based policy design.
Supplementary Materials
The following supporting information can be downloaded at: https://www.mdpi.com/article/10.3390/su18042144/s1, The replication package (analysis-ready dataset and code) that reproduces all tables and figures is provided as Supplementary Materials (Replication Package). Appendix A reports additional definitions, tables, and figures.
Author Contributions
Conceptualization, M.Y. and S.L.; methodology, M.Y. and S.L.; software, M.Y.; validation, M.Y. and S.L.; formal analysis, M.Y.; investigation, M.Y.; resources, S.L.; data curation, M.Y.; writing—original draft preparation, M.Y.; writing—review and editing, M.Y. and S.L.; visualization, M.Y.; supervision, S.L.; project administration, M.Y. and S.L.; funding acquisition, M.Y. and S.L. All authors have read and agreed to the published version of the manuscript.
Funding
This work was supported by (1) the Sichuan Science and Technology Program (Grant No. 2021JDR0248); (2) the Sichuan Science and Technology Program (Grant No. 2019JDR0039); and (3) the Sichuan Science and Technology Program—Research on Network Contagion and Spillover Effects of Financial Risks under the New Dual-Circulation Pattern (Grant No. MZGC20230001).
Institutional Review Board Statement
Not applicable.
Informed Consent Statement
Not applicable.
Data Availability Statement
Replication code and an analysis-ready dataset (.dta) containing the derived variables used in the empirical analysis are provided in the Supplementary Materials (Replication Package). Some underlying raw inputs are obtained from proprietary databases and therefore cannot be redistributed in their original form; access to those raw sources can be requested from the respective providers. Additional information is available from the corresponding author upon reasonable request.
Conflicts of Interest
The authors declare no conflicts of interest.
Abbreviations
The following abbreviations are used in this manuscript: DE, digital economy index; GT, green transition level; GTS, green transition speed; EI, carbon intensity; DT, digital transformation; ESG, environmental, social, and governance.
Appendix A
Appendix A.1. Data Sources and Sample Construction
The analysis uses the compiled firm-year dataset. The dataset integrates firm-level financials, text-based indices from annual and CSR/sustainability reports, city-level digital economy indices, ESG scores, and carbon-intensity measures for Chinese listed firms from 2008 to 2022. We focus on non-financial A-share firms and exclude observations with missing core variables. Firm-level financial data and ESG scores are sourced from licensed databases and cannot be redistributed; the replication package provides code and documentation to reproduce all tables and figures conditional on data access.
The unit of analysis is a firm-year. City-level digital economy indicators are linked to firms via headquarters location. To mitigate short-term simultaneity, the digital economy index and controls are lagged by one year in baseline models.
Appendix A.2. Variable Definitions and Construction
Table A1 provides definitions, construction details, units/scale, and interpretation notes for all variables used in the analysis.
Text-based indicator construction (GT, GTS, and DT). The GT and DT indices are derived from firms’ annual reports and CSR/sustainability reports. Documents are converted to plain text, with tables/figures, boilerplate headers/footers, and duplicated sections removed. We apply consistent encoding, standardize punctuation, and normalize whitespace to reduce noise across years and reporting formats.
Dictionary formation and validation. We use two curated keyword dictionaries: (i) a green/low-carbon transition dictionary covering climate, energy efficiency, renewable energy, green supply chains, and environmental management; and (ii) a digital transformation dictionary covering digital infrastructure and applications (e.g., big data, cloud computing, AI, industrial internet, and platformization). Dictionaries were developed from policy and academic terminology and iteratively refined to remove ambiguous terms; the final keyword lists and scripts are provided in the replication package (see “data and code/dict/.txt” and “data and code/dict/.txt”).
Scoring and normalization. Let denote the total number of tokens in firm i’s report in year t, and let denote the total matched keyword count. The transition-level indicator is constructed as . The digital transformation indicator is constructed as . Transition speed is measured as the year-on-year growth rate of the underlying transition text index (gt): . All continuous variables are winsorized at the 1st/99th percentiles to mitigate outliers. The city-level digital economy index is winsorized and then standardized (mean 0, SD 1) before entering regressions.
Reliability and robustness. We report alternative index variants (DE1, DE2) and an alternative transition proxy (GTRSP) as robustness checks (Table 6), and we provide additional timing and dynamic specifications (Table A3) to assess sensitivity to lag choices and persistence in outcomes. These steps strengthen transparency and replicability while retaining the interpretability advantages of dictionary-based measures.
Table A1.
Variable definitions and construction.
Appendix A.3. Empirical Specification
Baseline model (for GT, GTS, and EI):
where is GT, GTS, or EI; is the lagged standardized digital economy index; is the vector of lagged controls (Size, Leverage, ROA, Growth); and denote firm and year fixed effects. Standard errors are clustered at the firm-level.
Mechanism and mediation tests use:
Mediators include DT and ESG score. The mediation framework is descriptive and interprets coefficient attenuation as partial mediation.
Appendix A.4. Data Treatment and Cleaning
All continuous variables are winsorized at the 1st and 99th percentiles. Digital economy indices are standardized to mean 0 and standard deviation 1. DE and all controls are lagged by one year. Observations with missing DE or outcome variables are excluded from each regression.
Appendix A.5. Table A2: Alternative Carbon-Intensity Outcomes
Table A2 reports alternative carbon-intensity outcomes based on CO2 intensity reduction speed and reduction level.
Table A2.
Alternative carbon-intensity outcomes.
Additional robustness tables. Table A3 reports timing and dynamic specifications that justify the one-year lag structure and clarify persistence adjustments. Table A4 reports carbon-intensity sensitivity tests using industry-year effects and alternative normalizations (ln(EI)). Table A5 reports robustness checks using alternative clustering and report-length controls.
Table A3.
Timing and Dynamic Specifications (Robustness).
Table A4.
Carbon-Intensity Sensitivity Tests (Industry-Year Effects and Alternative Normalizations).
Table A5.
Robustness Checks: Alternative Clustering and Report-Length Controls.
Appendix A.6. Figures
Figure A1.
Trends in DE, GT, GTS, and EI (standardized means).
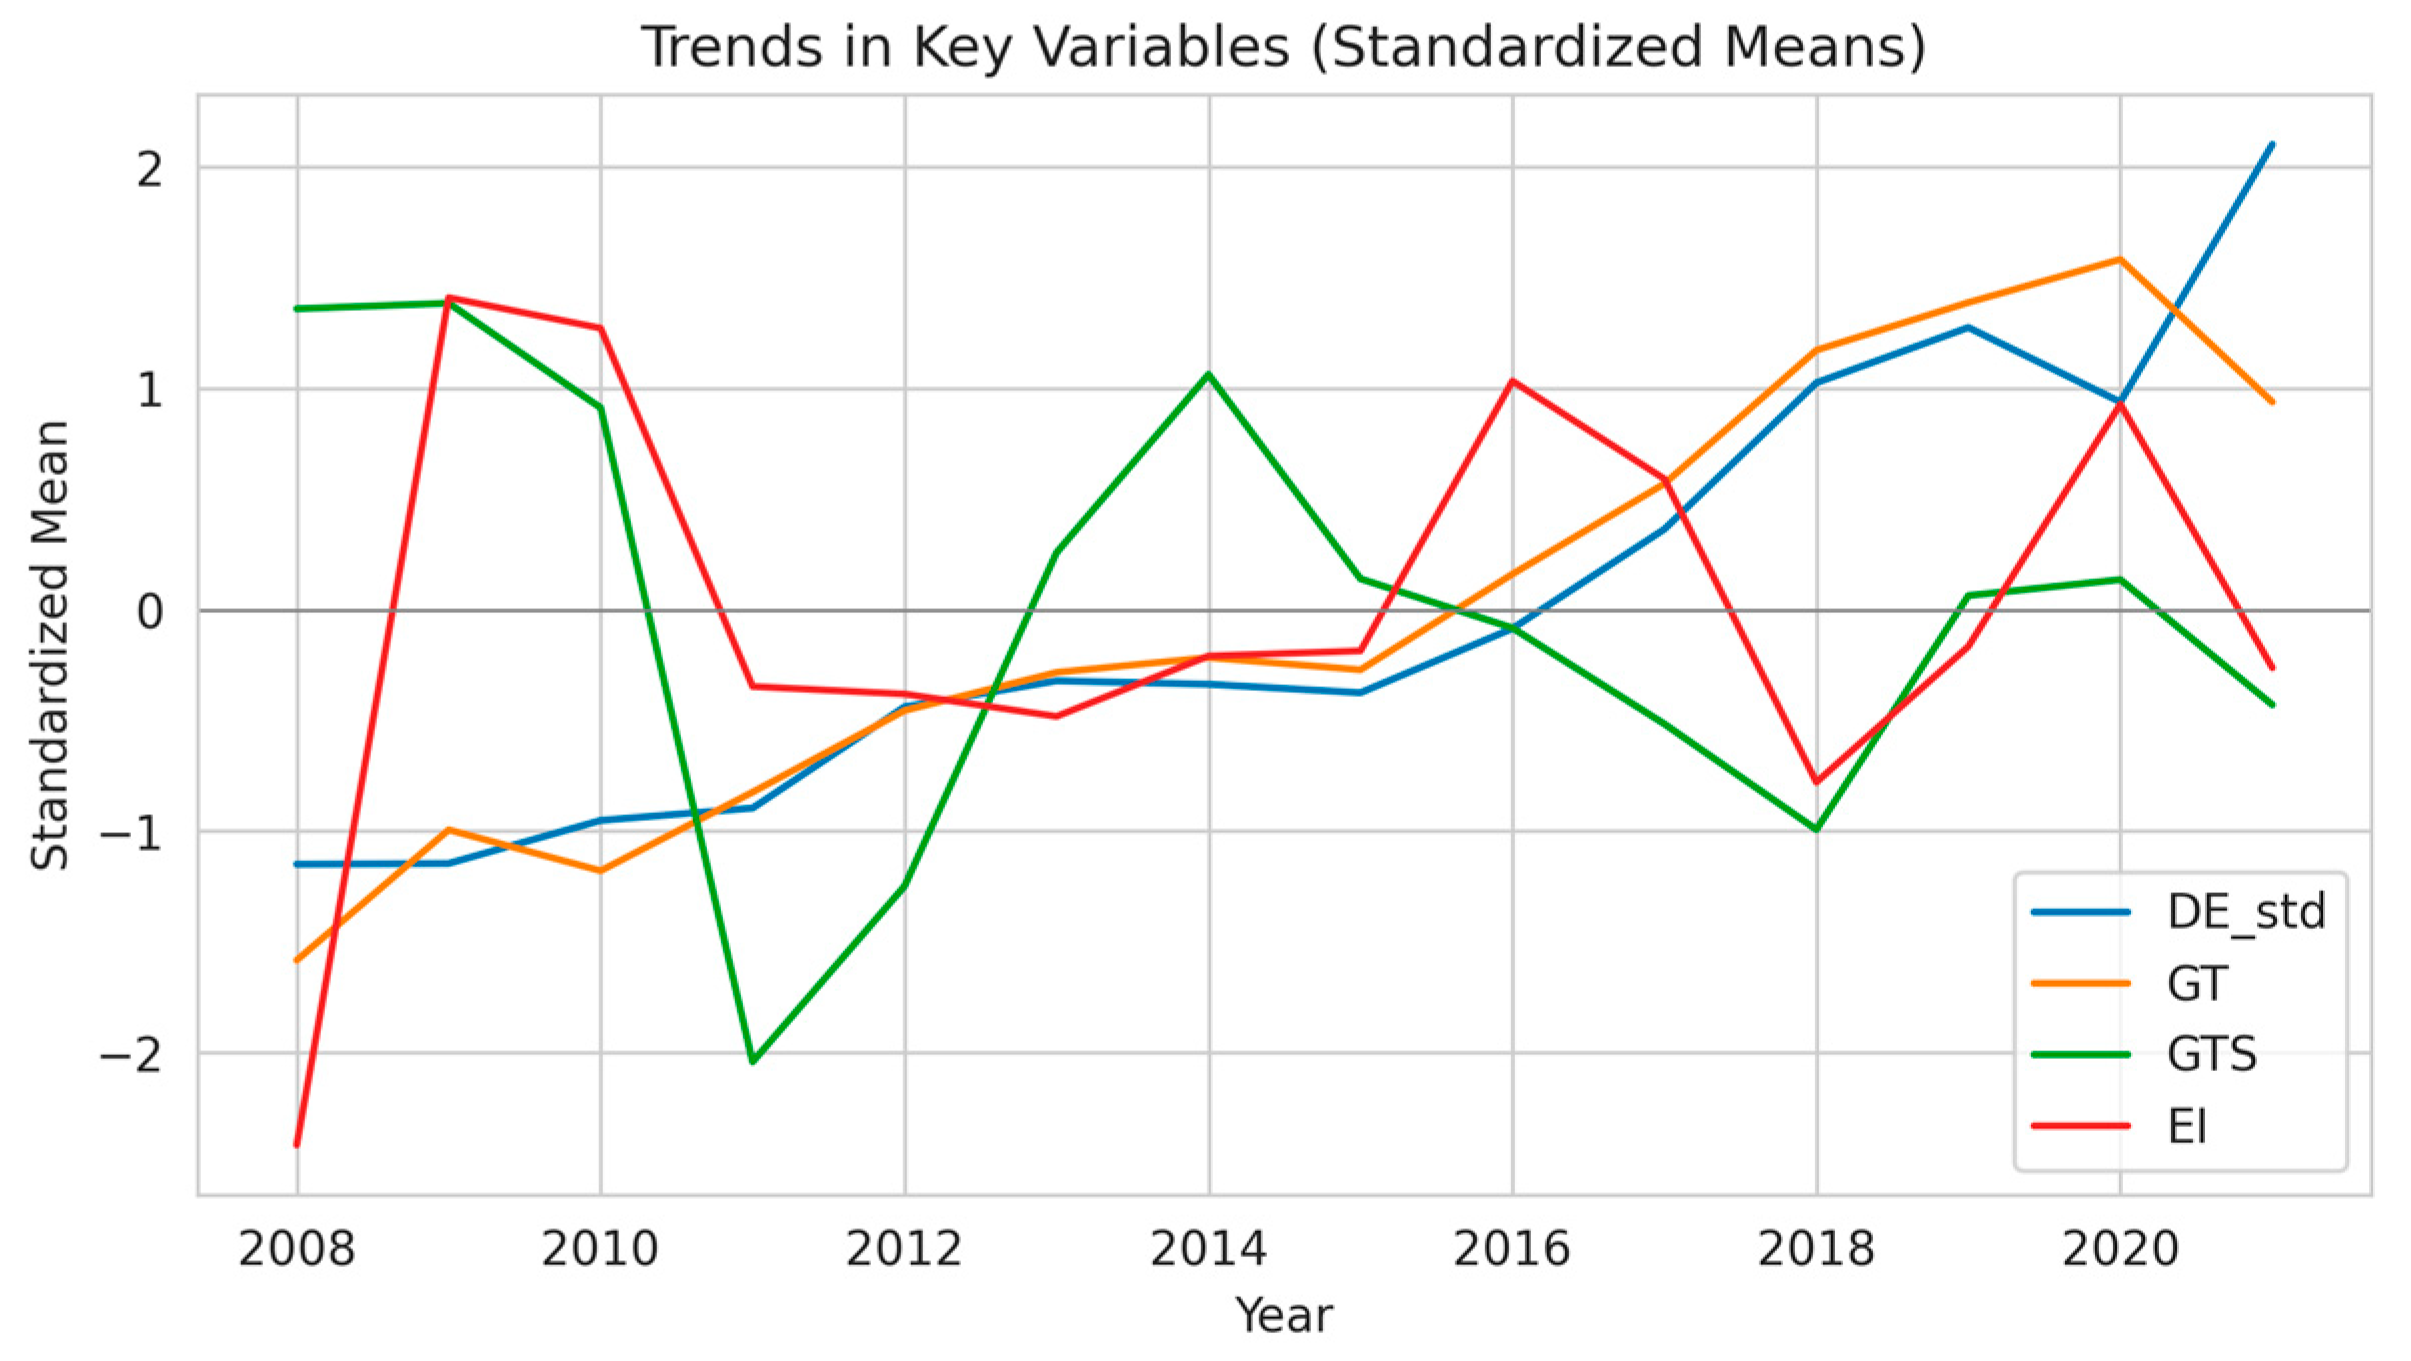
Figure A2.
Distributions of DE and GT.
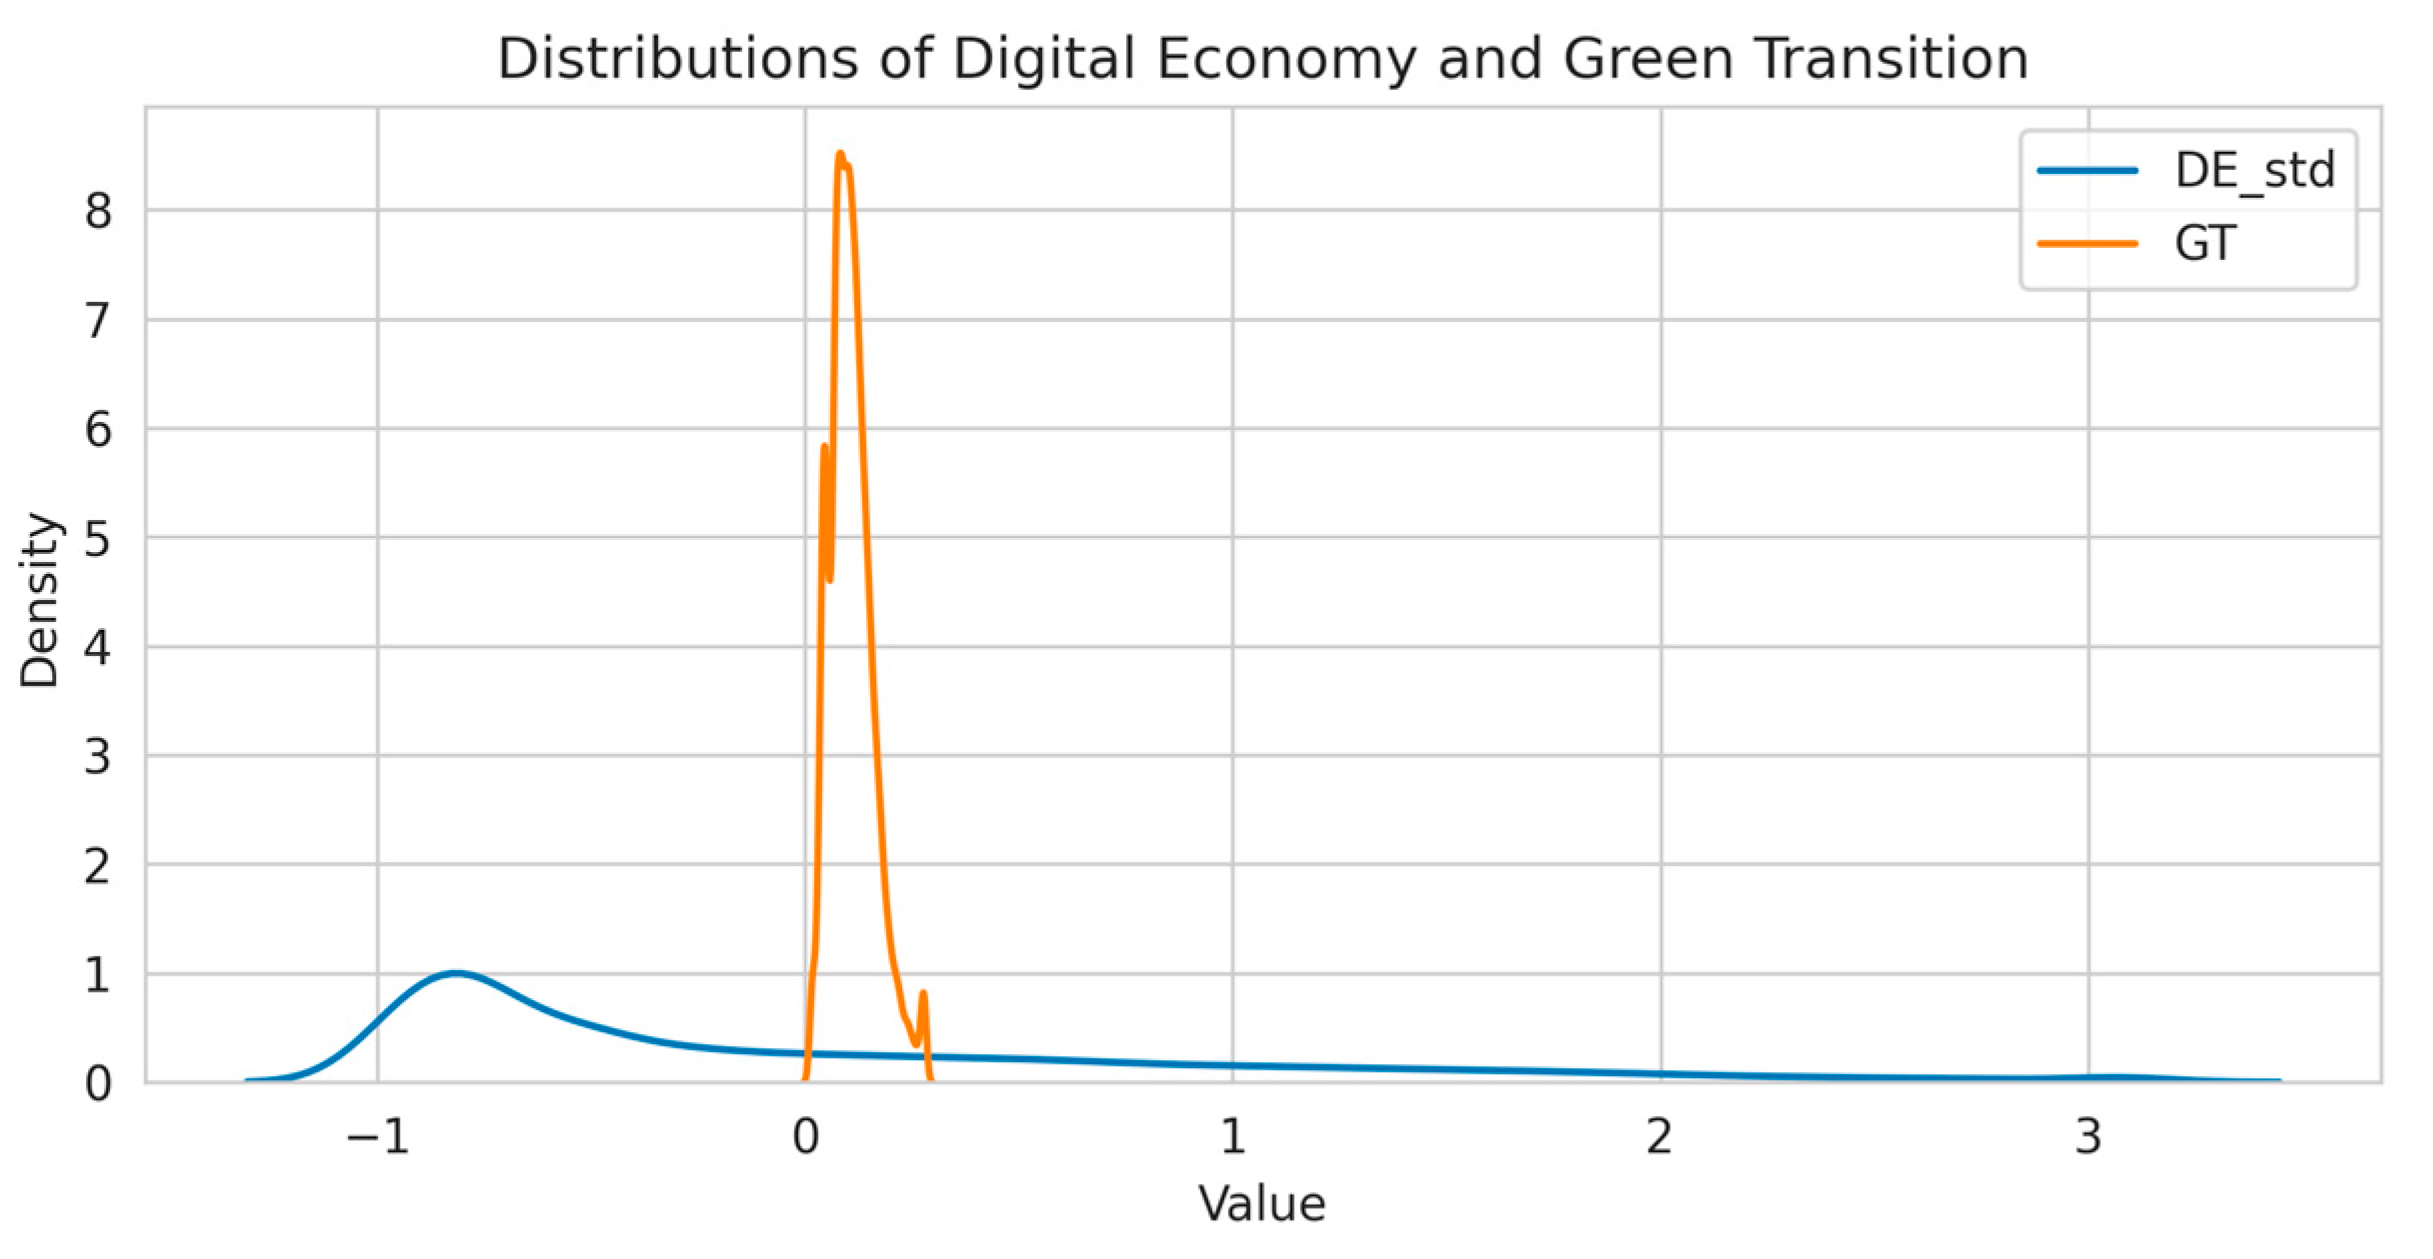
Figure A3.
Scatter of lagged DE and GT.
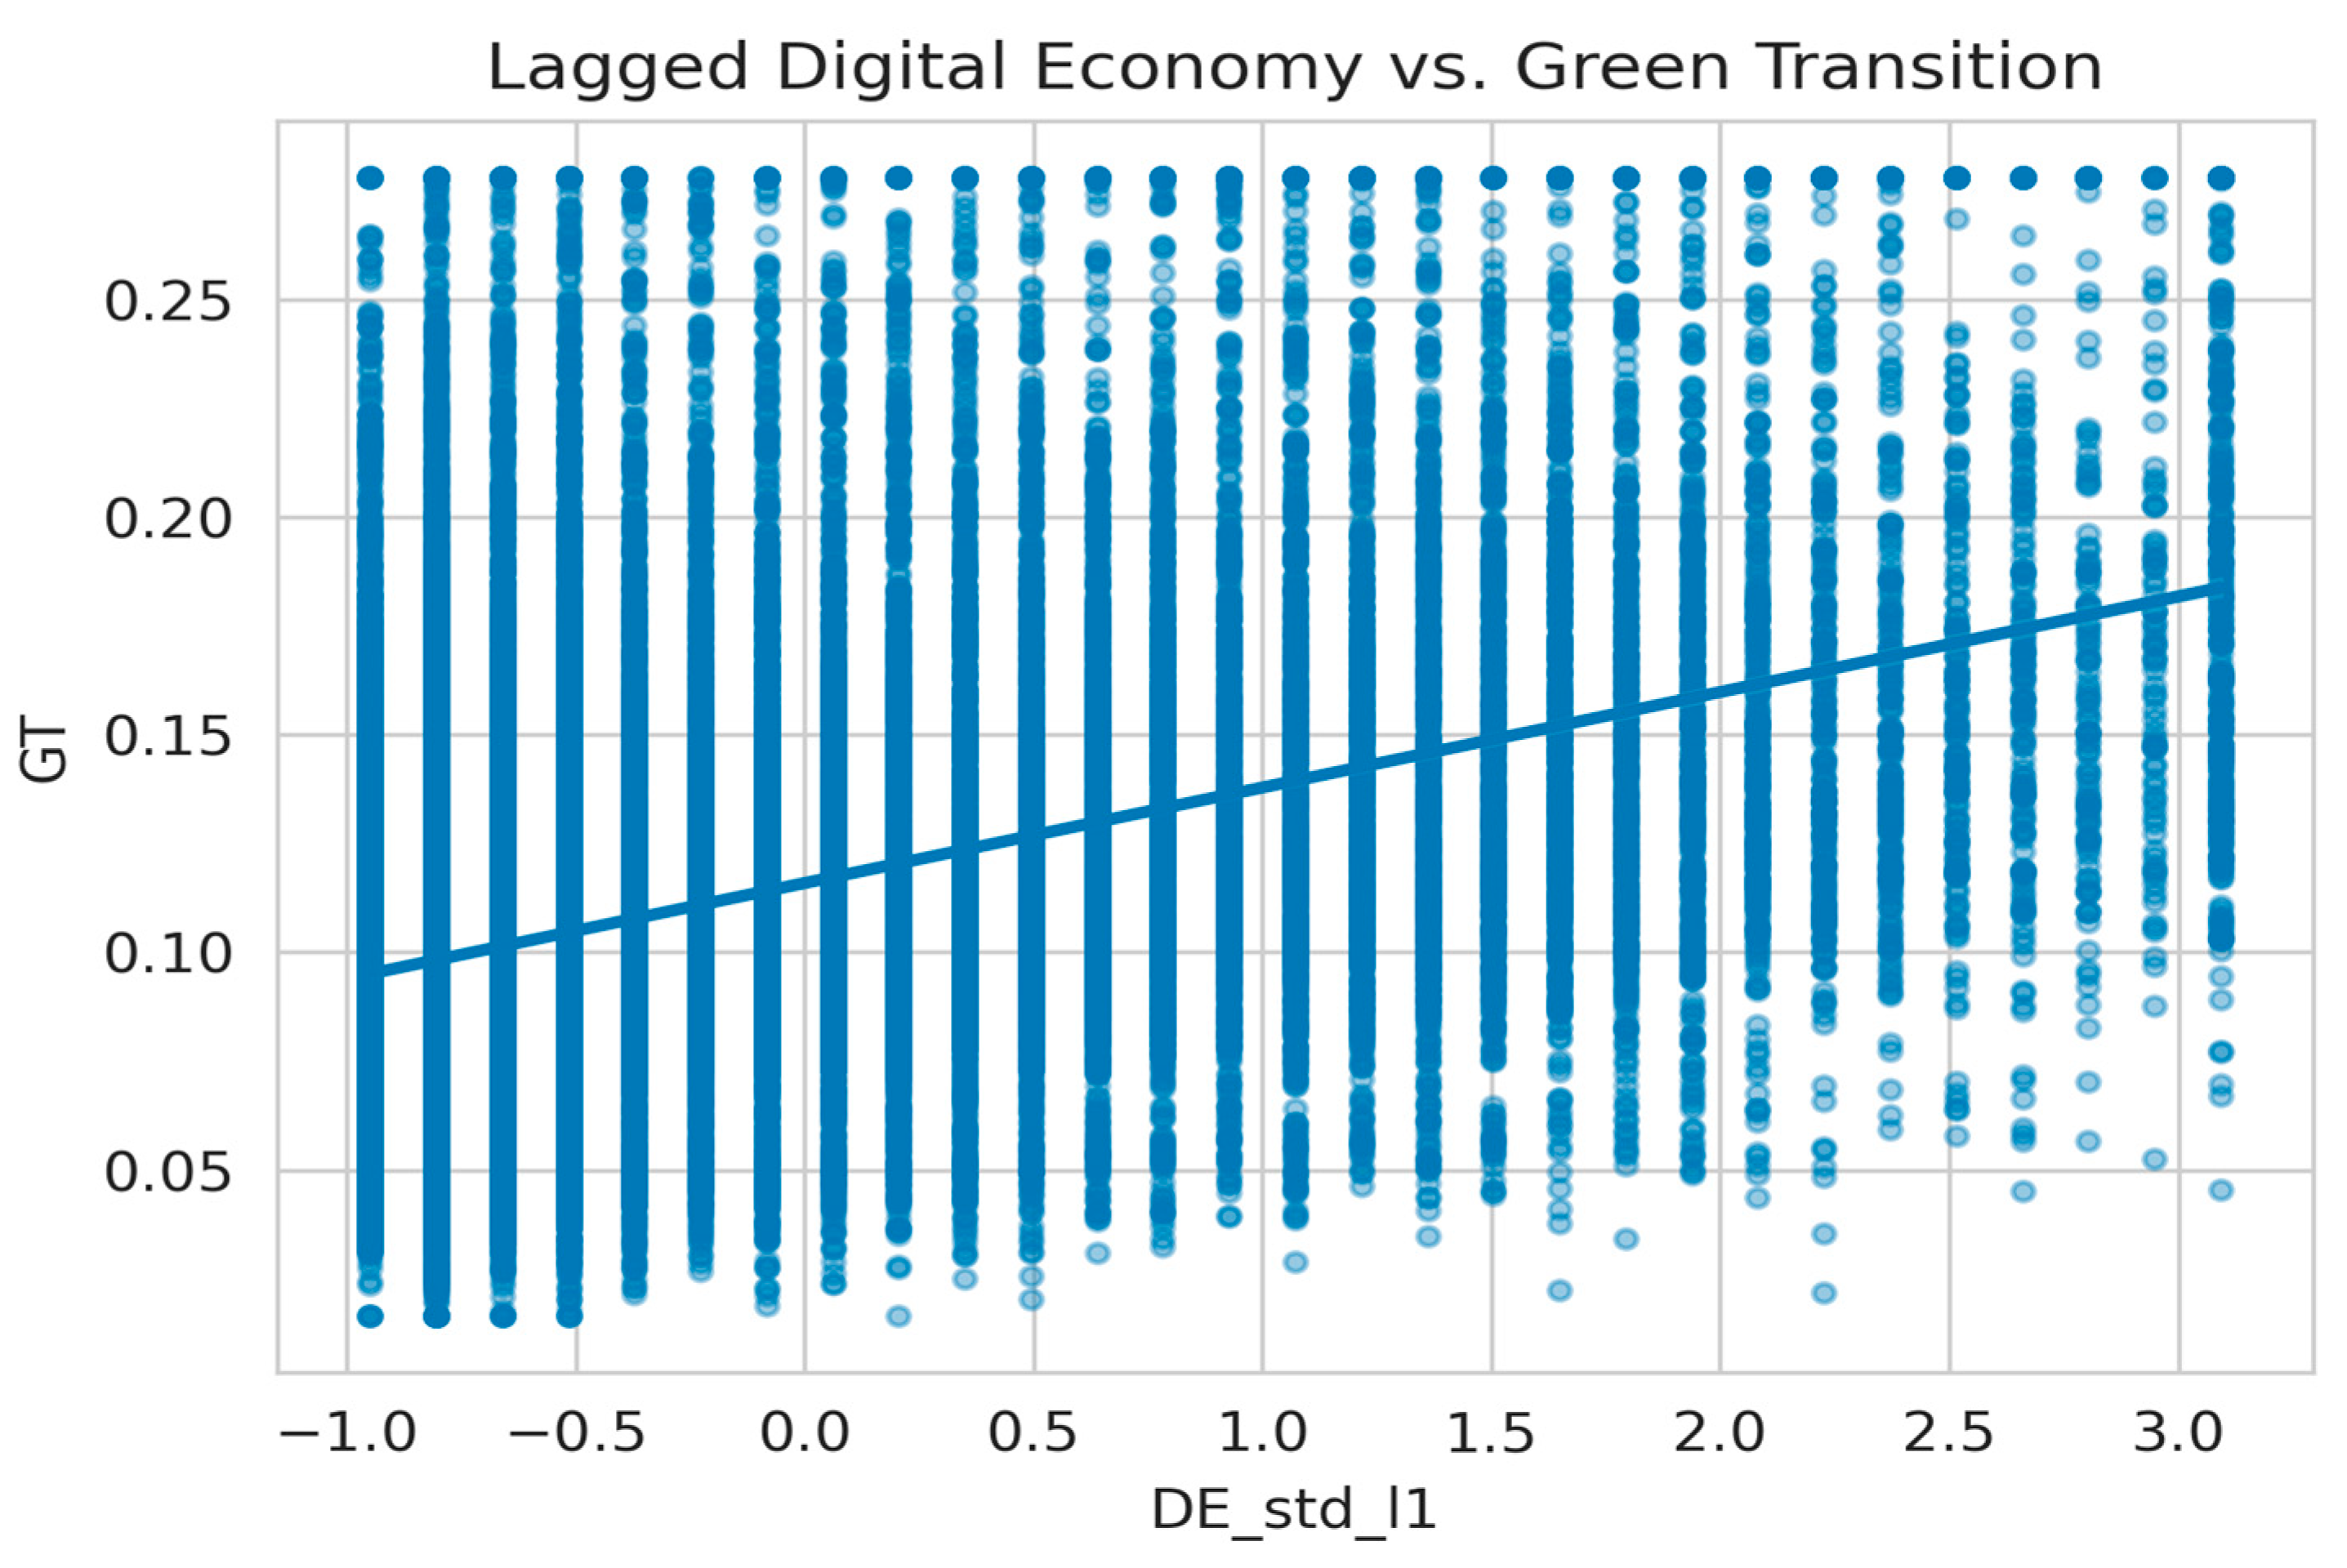
Figure A4.
Marginal effect of DE on GT across ESG percentiles.
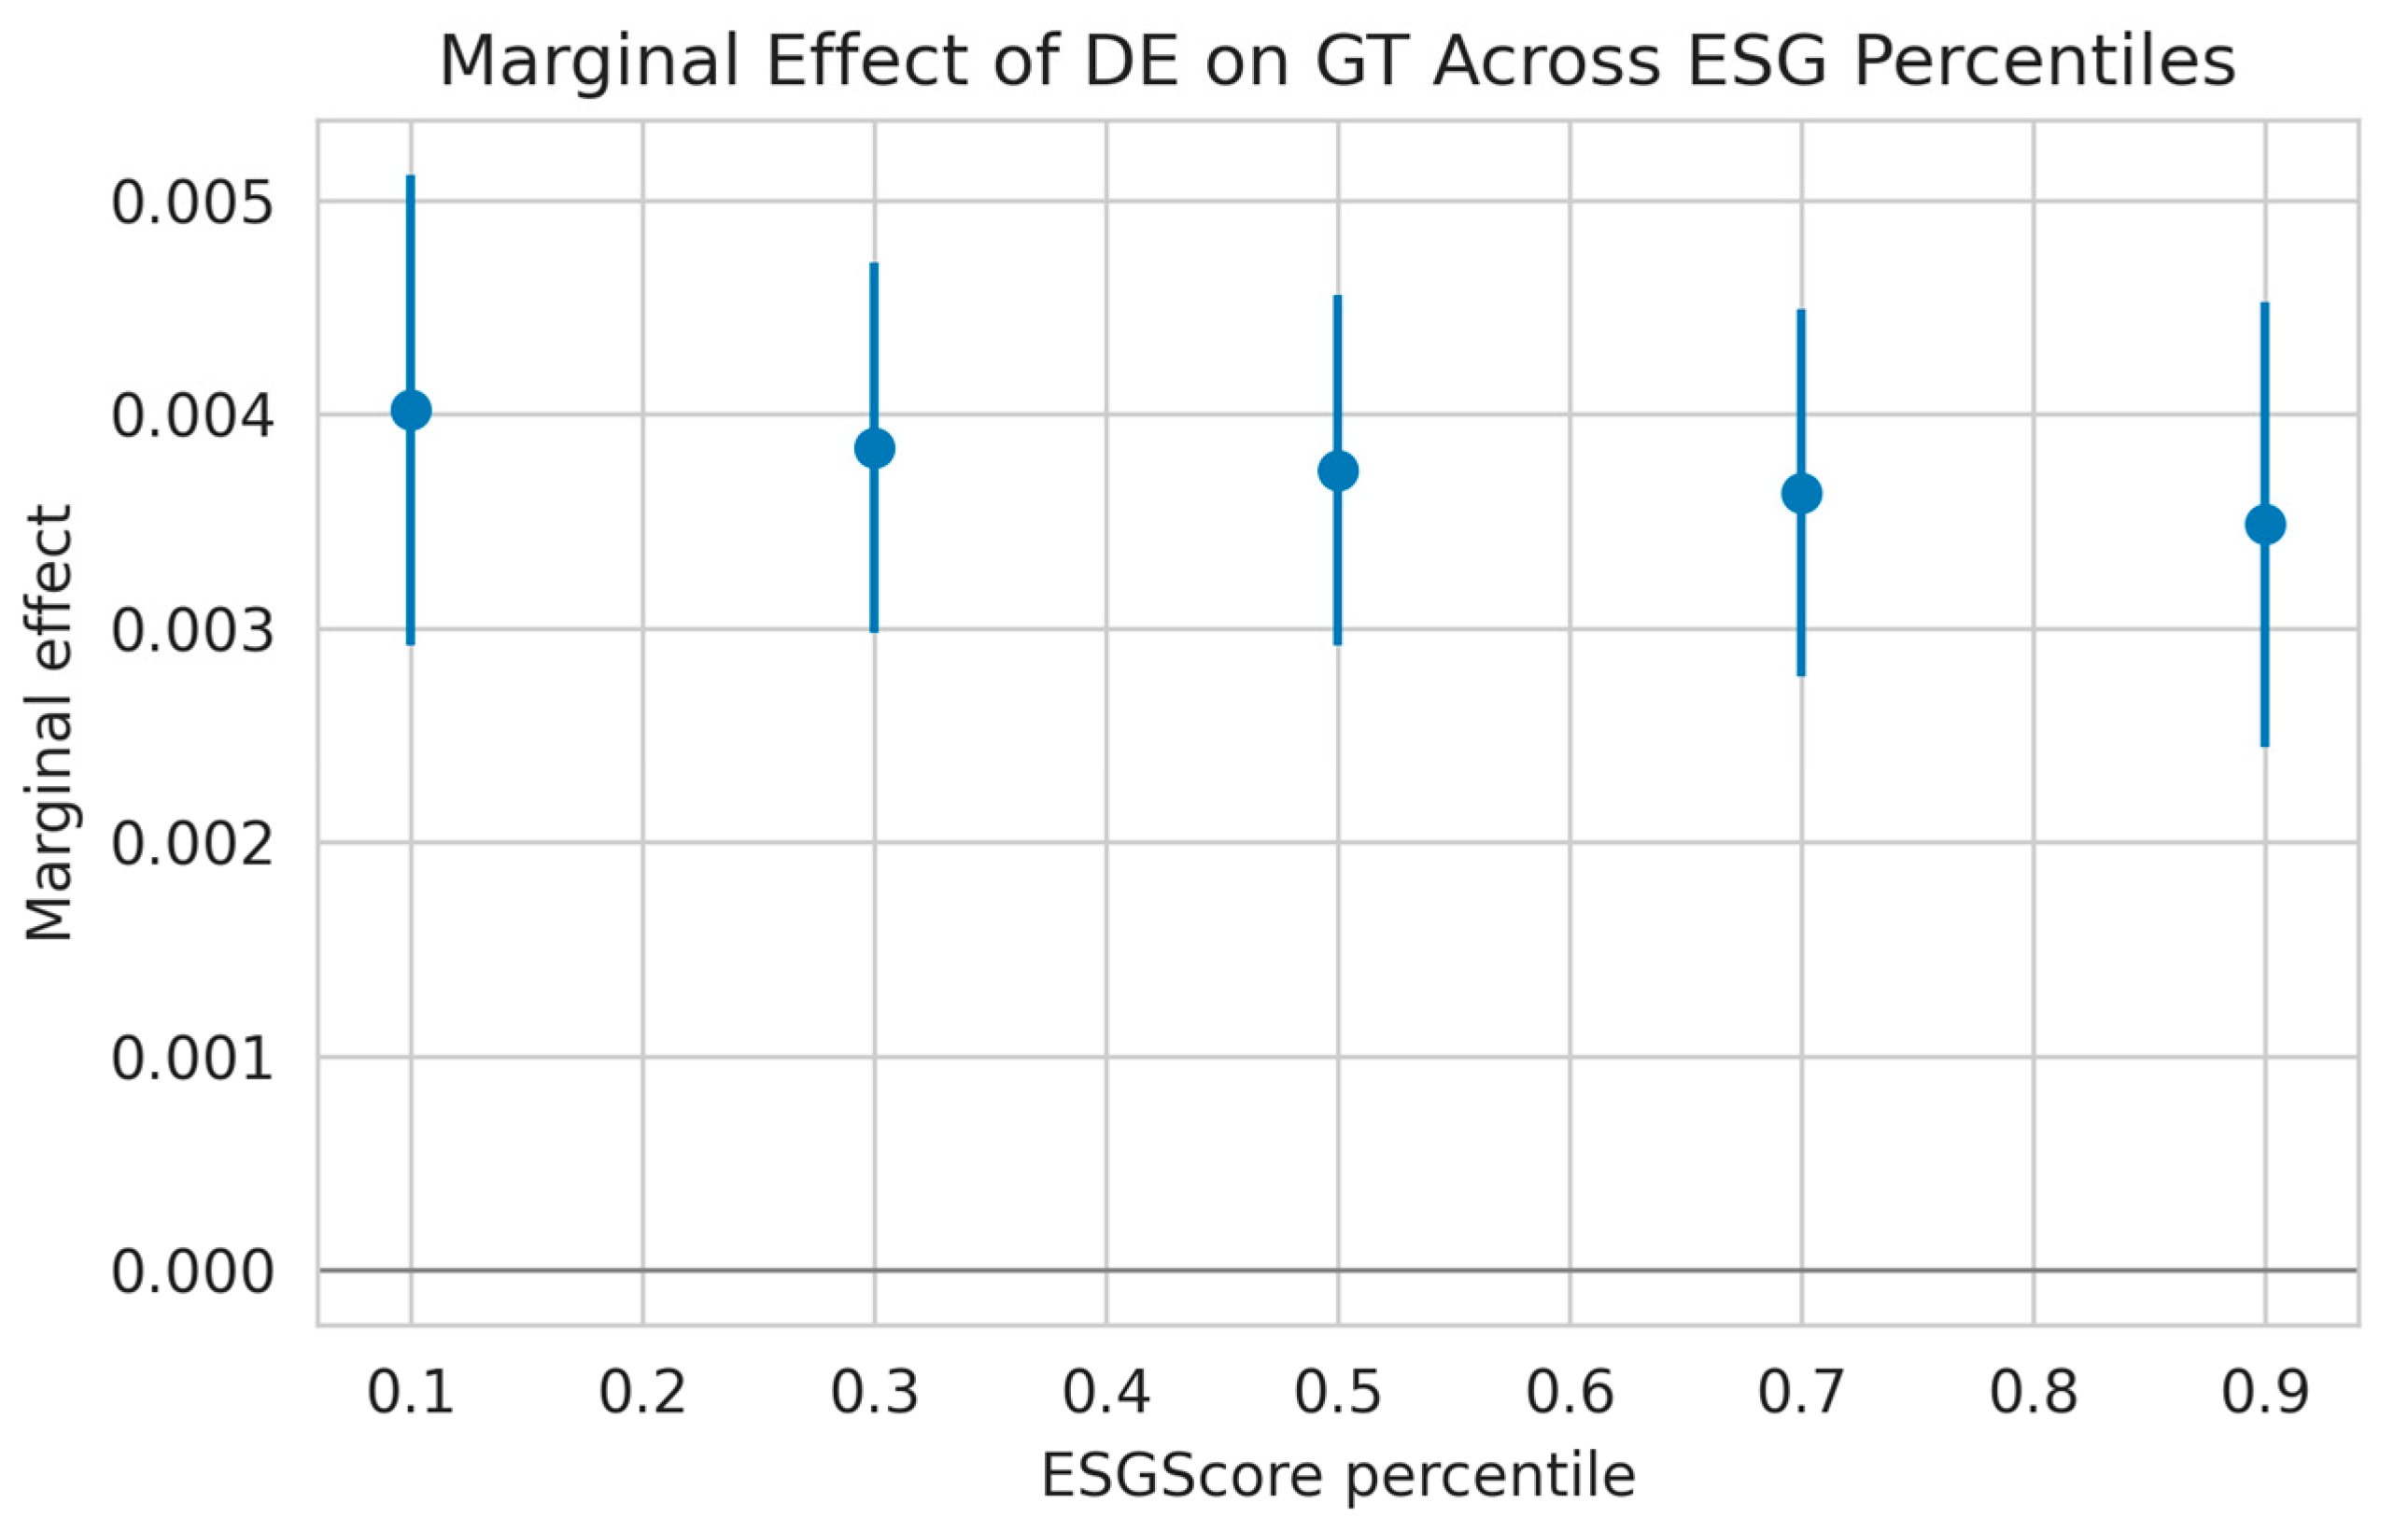
Appendix A.7. Replication Steps
- Open code/.py in the replication package and confirm the points to the local data file.
- Install the listed Python 3.12.3 dependencies (pandas 2.2.2; numpy 1.26.4; linearmodels 6.0; pyreadstat 1.2.7; matplotlib 3.10.8; seaborn 0.13.2).
- Run the script to generate tables in output/ and figures in output/figures.
- Compare outputs to the files provided in the replication package.
Appendix A.8. Replication Checklist
Confirm data licenses for firm financials, ESG scores, and report texts.
Verify variable coverage and sample window (2008–2022).
Document software versions and random seeds if additional bootstrapping is used.
References
- Vial, G. Understanding digital transformation: A review and a research agenda. J. Strateg. Inf. Syst. 2019, 28, 118–144. [Google Scholar] [CrossRef] [Scilit]
- Bharadwaj, A.; El Sawy, O.A.; Pavlou, P.A.; Venkatraman, N. Digital business strategy: Toward a next generation of insights. MIS Q. 2013, 37, 471–482. [Google Scholar] [CrossRef] [Scilit]
- Yoo, Y.; Henfridsson, O.; Lyytinen, K. Research commentary-The new organizing logic of digital innovation: An agenda for information systems research. Inf. Syst. Res. 2010, 21, 724–735. [Google Scholar] [CrossRef] [Scilit]
- Goldfarb, A.; Tucker, C. Digital economics. J. Econ. Lit. 2019, 57, 3–43. [Google Scholar] [CrossRef] [Scilit]
- Brynjolfsson, E.; McElheran, K. The rapid adoption of data-driven decision-making. Am. Econ. Rev. 2016, 106, 133–139. [Google Scholar] [CrossRef] [Scilit]
- Jia, S.; Chen, X.; Jin, J. Digital disruption and energy efficiency: The impact of regional digitalization on China’s industrial sector. Energy 2024, 300, 131542. [Google Scholar] [CrossRef] [Scilit]
- Yu, M.; Kubiczek, J.; Ding, K.; Jahanzeb, A.; Iqbal, N. Revisiting SDG-7 under energy efficiency vision 2050: The role of new economic models and mass digitalization in OECD. Energy Effic. 2021, 15, 1. [Google Scholar] [CrossRef] [Scilit]
- Jackson, L.E.; Kurtz, J.C.; Fisher, W.S. Evaluation Guidelines for Ecological Indicators; U.S. Environmental Protection Agency, Office of Research and Development: Washington, DC, USA, 2000. [Google Scholar]
- Niemeijer, D.; de Groot, R.S. A conceptual framework for selecting environmental indicator sets. Ecol. Indic. 2008, 8, 14–25. [Google Scholar] [CrossRef] [Scilit]
- van Oudenhoven, A.P.E.; Petz, K.; Alkemade, R.; Hein, L.; de Groot, R.S. Framework for systematic indicator selection to assess effects of land management on ecosystem services. Ecol. Indic. 2012, 21, 110–122. [Google Scholar] [CrossRef] [Scilit]
- Sadorsky, P. Information communication technology and electricity consumption in emerging economies. Energy Policy 2012, 48, 130–136. [Google Scholar] [CrossRef] [Scilit]
- Sorrell, S.; Dimitropoulos, J.; Sommerville, M. Empirical estimates of the direct rebound effect: A review. Energy Policy 2009, 37, 1356–1371. [Google Scholar] [CrossRef] [Scilit]
- Greening, L.A.; Greene, D.L.; Difiglio, C. Energy efficiency and consumption—The rebound effect—A survey. Energy Policy 2000, 28, 389–401. [Google Scholar] [CrossRef] [Scilit]
- Gillingham, K.; Kotchen, M.J.; Rapson, D.S.; Wagner, G. The rebound effect is overplayed. Nature 2013, 493, 475–476. [Google Scholar] [CrossRef] [Scilit]
- Porter, M.E.; van der Linde, C. Toward a new conception of the environment-competitiveness relationship. J. Econ. Perspect. 1995, 9, 97–118. [Google Scholar] [CrossRef] [Scilit]
- Jaffe, A.B.; Palmer, K. Environmental regulation and innovation: A panel data study. Rev. Econ. Stat. 1997, 79, 610–619. [Google Scholar] [CrossRef] [Scilit]
- Acemoglu, D.; Aghion, P.; Bursztyn, L.; Hemous, D. The environment and directed technical change. Am. Econ. Rev. 2012, 102, 131–166. [Google Scholar] [CrossRef] [Scilit]
- Xie, B.; Liu, R.; Dwivedi, R. Digital economy, structural deviation, and regional carbon emissions. J. Clean. Prod. 2024, 434, 139890. [Google Scholar] [CrossRef] [Scilit]
- Tian, H.; Zhao, T.; Wu, X.; Wang, P. The impact of digital economy development on carbon emissions: Based on the perspective of carbon trading market. J. Clean. Prod. 2024, 434, 140126. [Google Scholar] [CrossRef] [Scilit]
- Chen, L.; Lu, Y.; Meng, Y.; Zhao, W. Research on the nexus between the digital economy and carbon emissions: Evidence at China’s province level. J. Clean. Prod. 2023, 413, 137484. [Google Scholar] [CrossRef] [Scilit]
- Zeng, J.; Yang, M. Digital technology and carbon emissions: Evidence from China. J. Clean. Prod. 2023, 430, 139765. [Google Scholar] [CrossRef] [Scilit]
- Li, Y.; Li, N.; Li, Z. Evolution of carbon emissions in China’s digital economy: An empirical analysis from an entire industry chain perspective. J. Clean. Prod. 2023, 414, 137419. [Google Scholar] [CrossRef] [Scilit]
- Niu, X.; Ma, Z.; Ma, W.; Yang, J.; Mao, T. The spatial spillover effects and equity of carbon emissions of digital economy in China. J. Clean. Prod. 2024, 434, 139885. [Google Scholar] [CrossRef] [Scilit]
- Bendig, D.; Schulz, C.; Theis, L.; Raff, S. Digital orientation and environmental performance in times of technological change. Technol. Forecast. Soc. Change 2023, 188, 122272. [Google Scholar] [CrossRef] [Scilit]
- Teece, D.J.; Pisano, G.; Shuen, A. Dynamic capabilities and strategic management. Strateg. Manag. J. 1997, 18, 509–533. [Google Scholar] [CrossRef] [Scilit]
- Hart, S.L. A natural-resource-based view of the firm. Acad. Manag. Rev. 1995, 20, 986–1014. [Google Scholar] [CrossRef] [Scilit]
- Clarkson, P.M.; Li, Y.; Richardson, G.D.; Vasvari, F.P. Revisiting the relation between environmental performance and environmental disclosure: An empirical analysis. Account. Organ. Soc. 2008, 33, 303–327. [Google Scholar] [CrossRef] [Scilit]
- Eccles, R.G.; Ioannou, I.; Serafeim, G. The impact of corporate sustainability on organizational processes and performance. Manag. Sci. 2014, 60, 2835–2857. [Google Scholar] [CrossRef] [Scilit]
- Friede, G.; Busch, T.; Bassen, A. ESG and financial performance: Aggregated evidence from more than 2000 empirical studies. J. Sustain. Finance Investig. 2015, 5, 210–233. [Google Scholar] [CrossRef] [Scilit]
- Delmas, M.A.; Toffel, M.W. Organizational responses to environmental demands: Opening the black box. Strateg. Manag. J. 2008, 29, 1027–1055. [Google Scholar] [CrossRef] [Scilit]
- Popp, D. Induced innovation and energy prices. Am. Econ. Rev. 2002, 92, 160–180. [Google Scholar] [CrossRef] [Scilit]
- Loughran, T.; McDonald, B. When is a liability not a liability? Textual analysis, dictionaries, and 10-Ks. J. Finance 2011, 66, 35–65. [Google Scholar] [CrossRef] [Scilit]
- Saberi, S.; Kouhizadeh, M.; Sarkis, J.; Shen, L. Blockchain technology and its relationships to sustainable supply chain management. Int. J. Prod. Res. 2019, 57, 2117–2135. [Google Scholar] [CrossRef] [Scilit]
- Schmidt, C.G.; Wagner, S.M. Blockchain and supply chain relations: A transaction cost theory perspective. J. Purch. Supply Manag. 2019, 25, 100552. [Google Scholar] [CrossRef] [Scilit]
- Lange, S.; Pohl, J.; Santarius, T. Digitalization and energy consumption. Does ICT reduce energy demand? Ecol. Econ. 2020, 176, 106760. [Google Scholar] [CrossRef] [Scilit]
- Gentzkow, M.; Kelly, B.; Taddy, M. Text as data. J. Econ. Lit. 2019, 57, 535–574. [Google Scholar] [CrossRef] [Scilit]
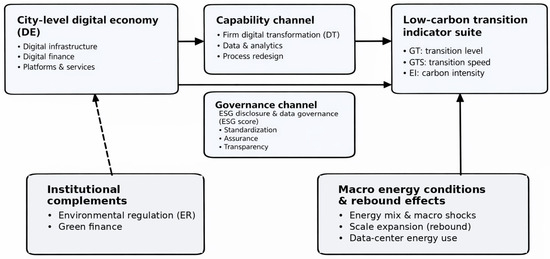
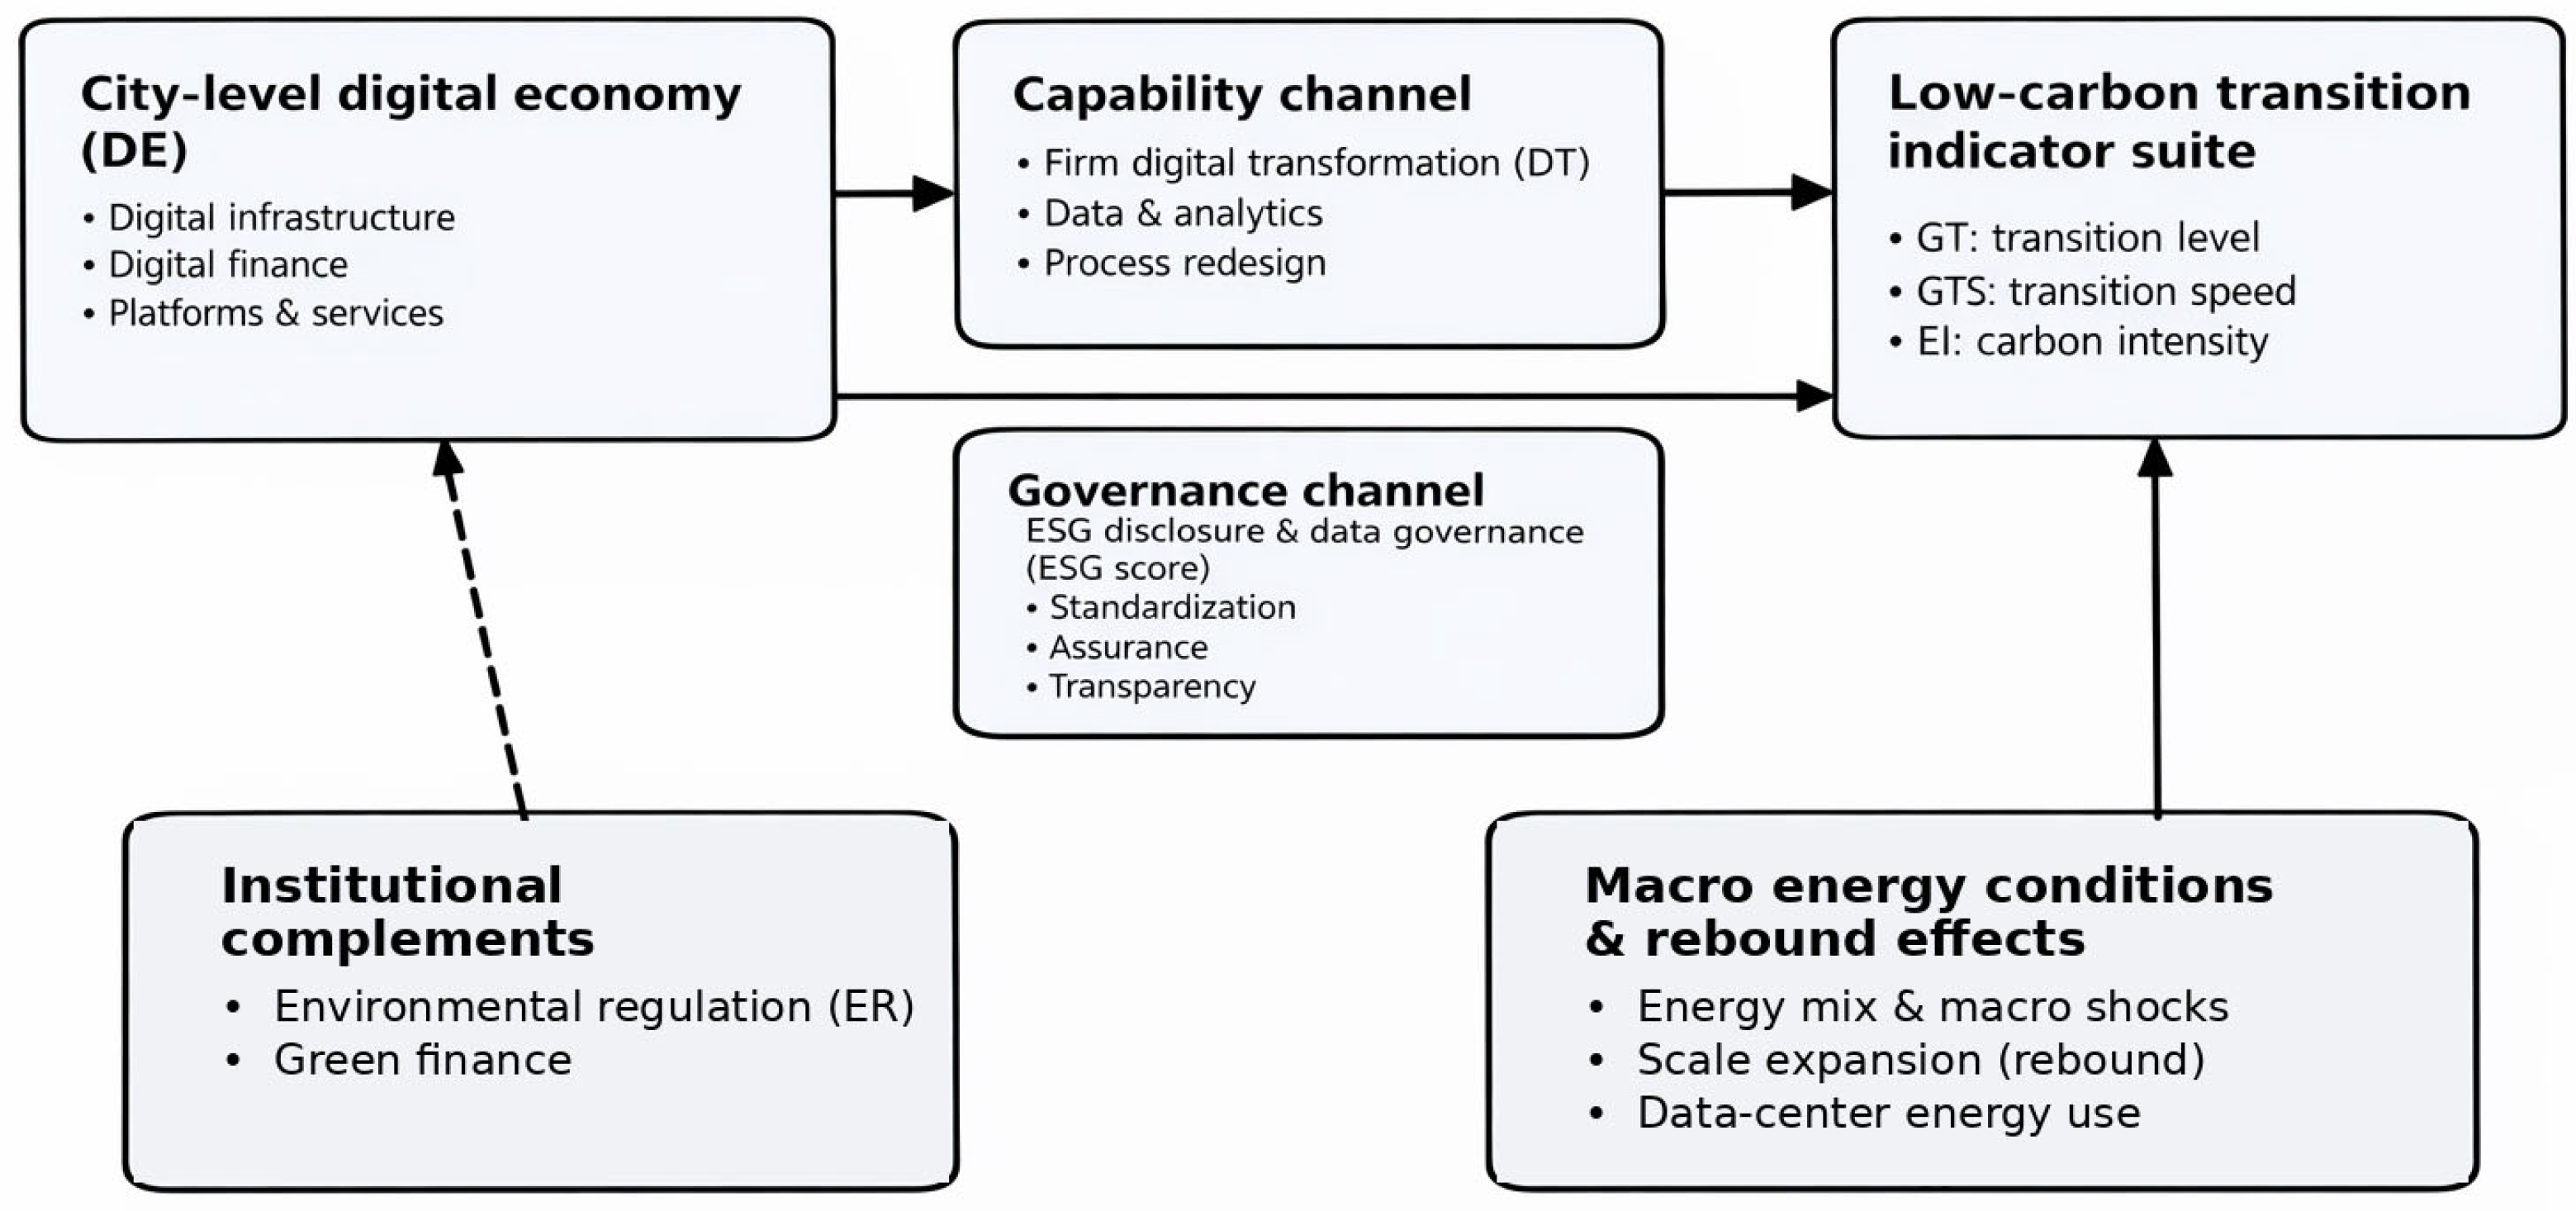
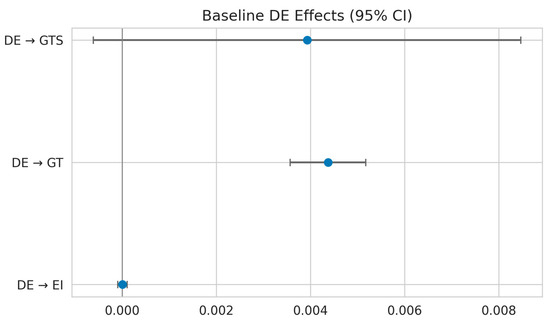
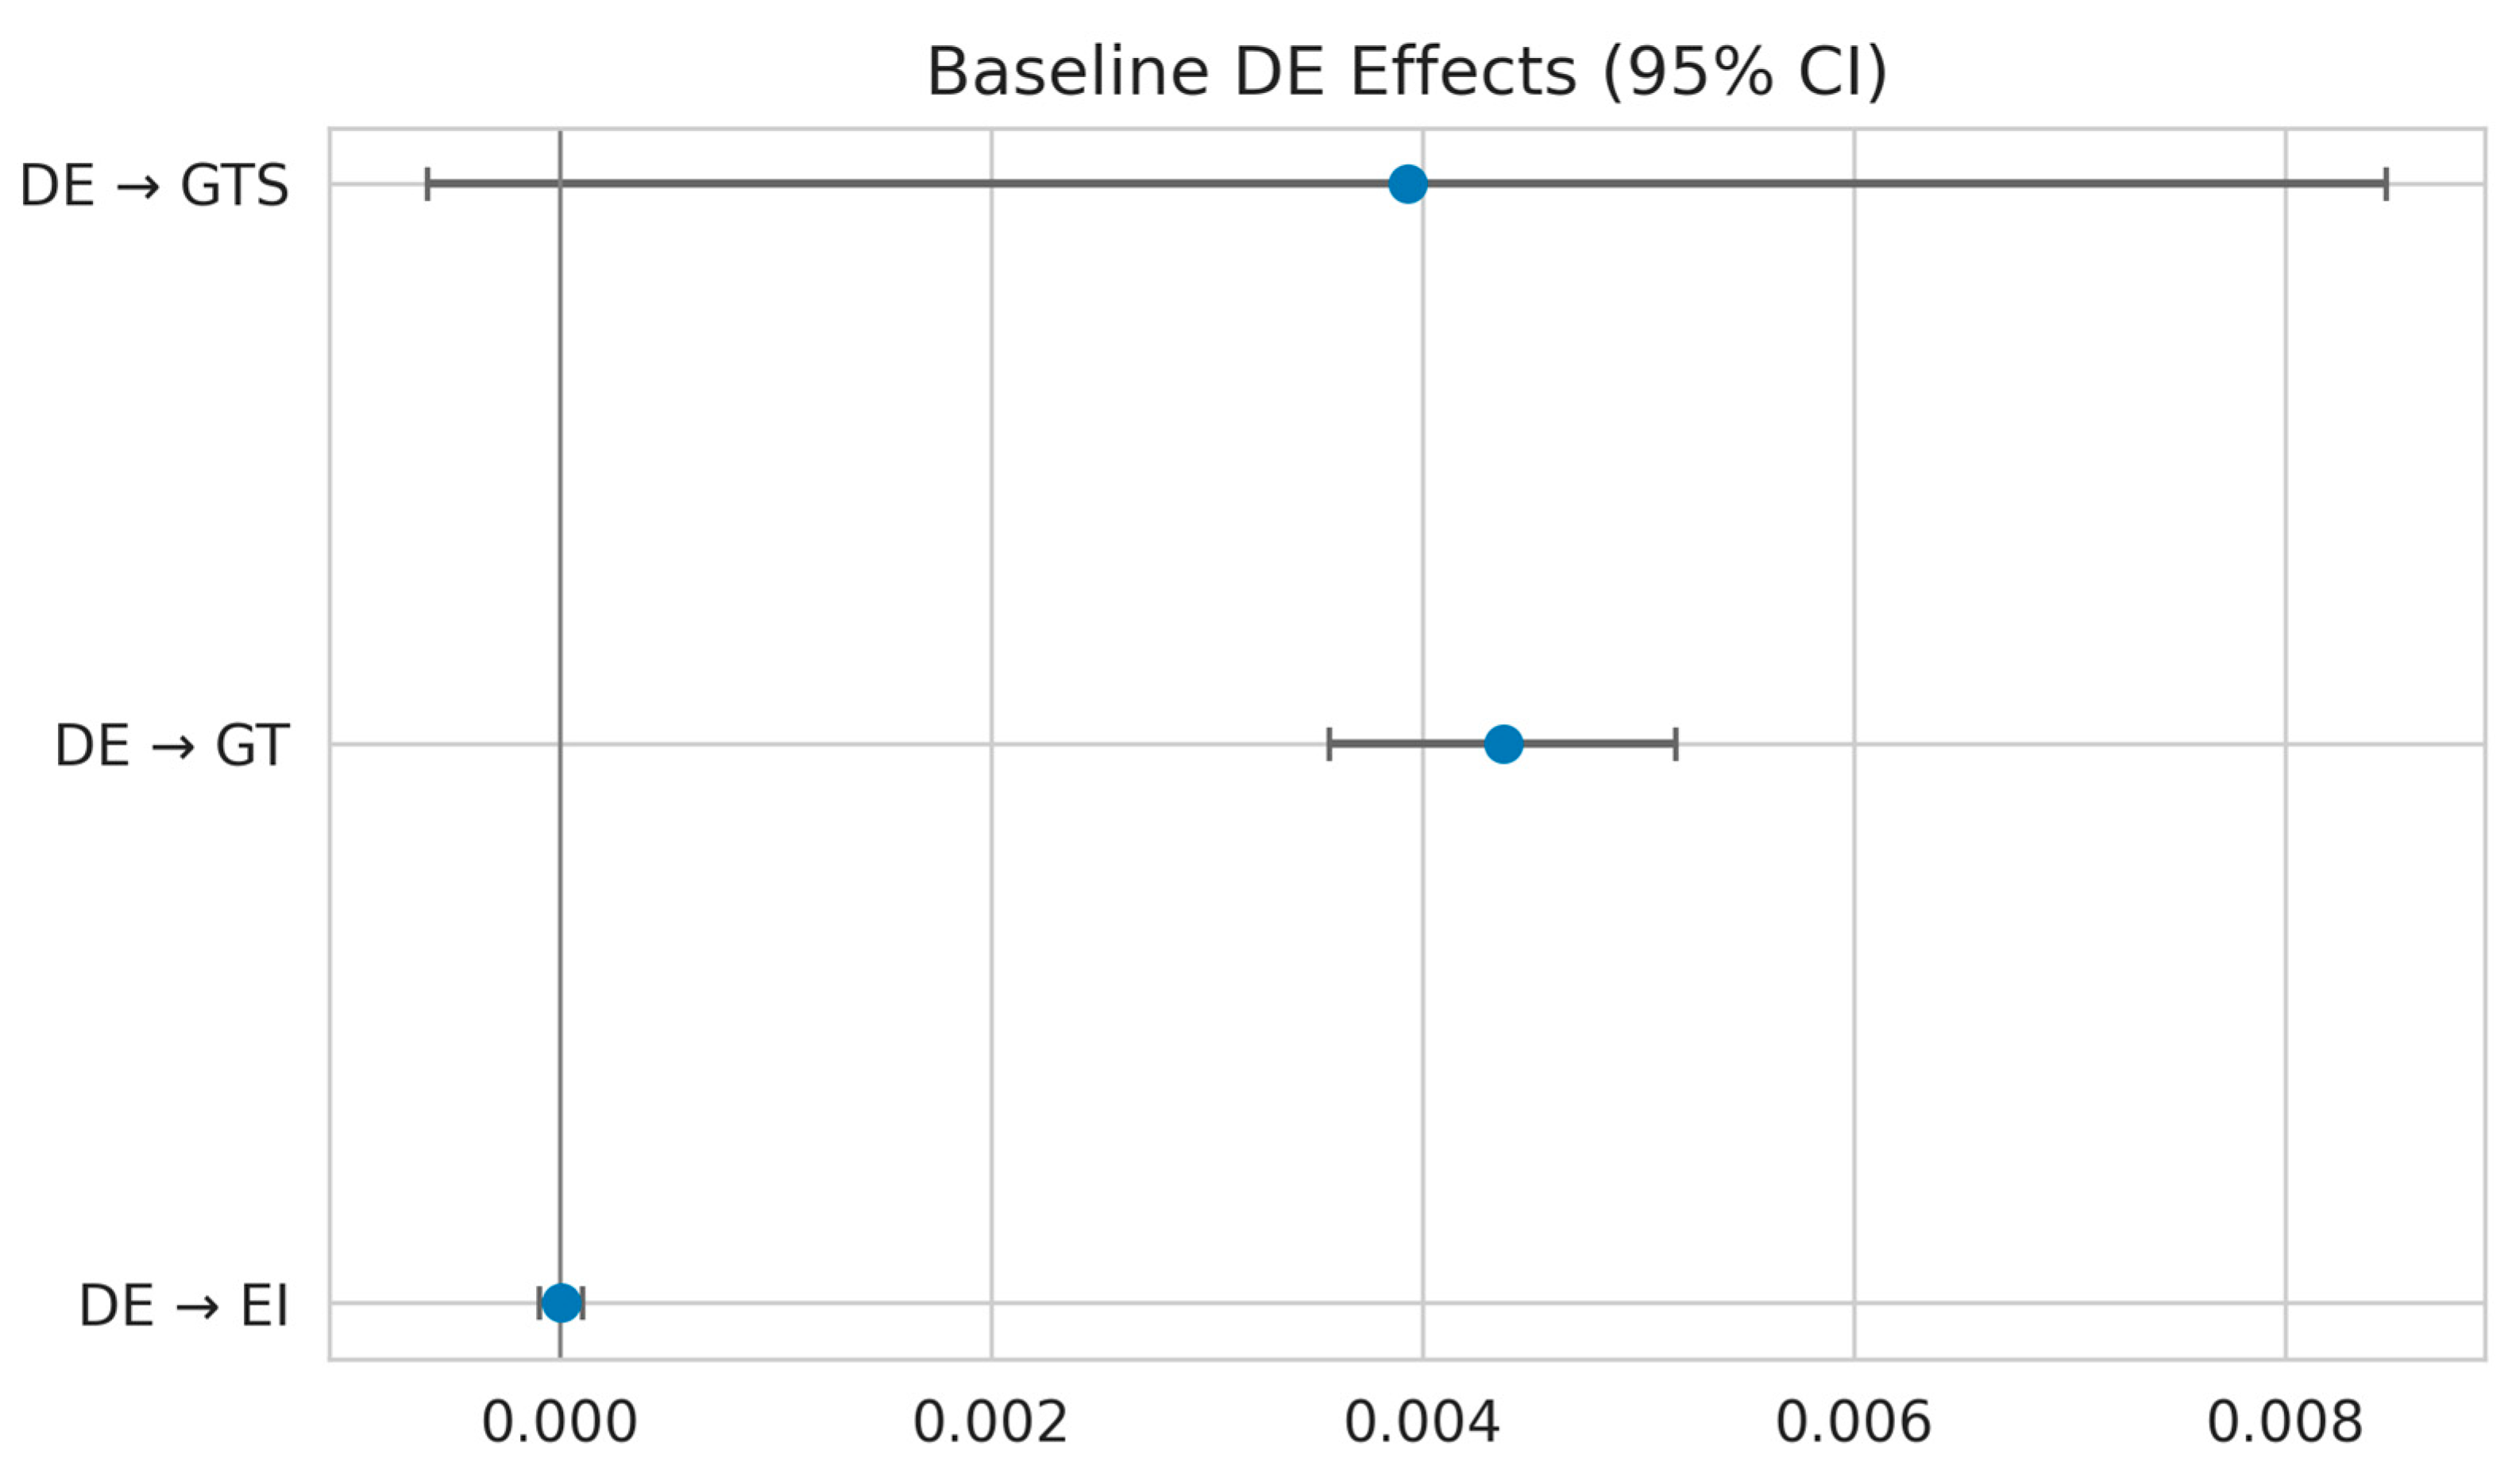
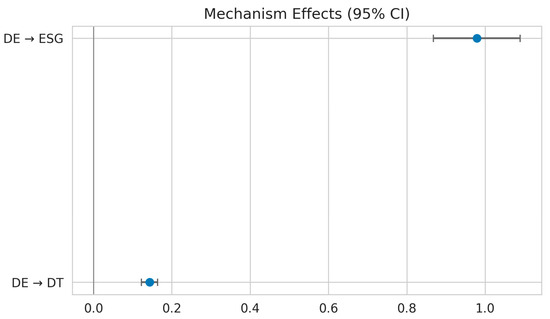
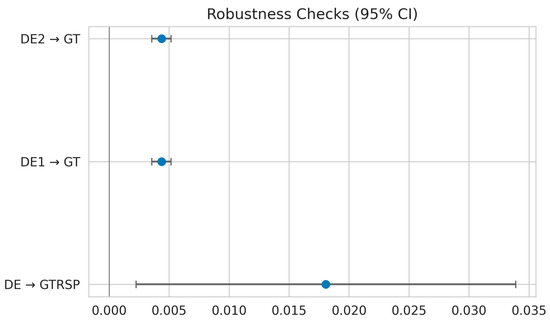

Disclaimer/Publisher’s Note: The statements, opinions and data contained in all publications are solely those of the individual author(s) and contributor(s) and not of MDPI and/or the editor(s). MDPI and/or the editor(s) disclaim responsibility for any injury to people or property resulting from any ideas, methods, instructions or products referred to in the content. |
© 2026 by the authors. Licensee MDPI, Basel, Switzerland. This article is an open access article distributed under the terms and conditions of the Creative Commons Attribution (CC BY) license.