


Abstract
Managing electronic waste (e-waste) in the Philippines is a critical challenge, no with roughly 80% handled by an informal sector using hazardous methods. This study develops a context-specific Circular Economy (CE) framework for urban Manila by quantifying the behavioral, institutional, and socio-economic factors influencing recycling efficiency. Using a hybrid methodology, quantitative data were collected from 435 informal recyclers. Structural Equation Modeling (SEM) supported 16 of 18 hypothesized pathways from the Theory of Planned Behavior (TPB), though Perceived Behavioral Control did not directly affect Intention. An Artificial Neural Network (ANN) sensitivity analysis identified economic factors, Income Level (84.01%) and Financial Incentives (82.86%), as the dominant predictors of behavior, followed by the Cultural–Cognitive Pillar (80.98%). This necessitates modifying the TPB for subsistence economies, where economic survival acts as a super-moderator. The resulting CE framework mandates inclusive policies, prioritizing “Economic First Interventions” like buy-back schemes to equitably integrate informal recyclers into formal Extended Producer Responsibility systems.
1. Introduction
Electronic waste (e-waste) represents one of the world’s fastest-growing and most hazardous waste streams, fueled by rapid technological turnover and rising consumption [1]. In 2022, approximately 62 million tonnes of e-waste were generated globally, yet only 22.3% was formally collected and recycled [2]. Improper disposal releases toxic substances including lead, mercury, and brominated flame retardants, into the environment, posing serious public health and climate risks [3].
In many developing economies, the informal sector serves as the de facto backbone of e-waste management [4]. The Philippines exemplifies this trend, where an estimated 80% of discarded electronics are handled by over 100,000 informal recyclers waste pickers, junkshop operators, and itinerant buyers [5,6]. While these networks provide essential collection services, they often employ hazardous methods such as open burning and acid stripping to recover valuable materials [7,8]. As a result, material recovery remains low (≈5%), and severe environmental contamination and occupational health risks are widespread [9,10].
Despite the sector’s scale and importance, national policies remain fragmented and exclusionary. Key legislation, including the Ecological Solid Waste Management Act (RA 9003) and the Extended Producer Responsibility (EPR) Act (RA 11898), lacks provisions to integrate informal workers [11,12]. This gap perpetuates a cycle of informality: recyclers remain marginalized, while formal initiatives struggle with low collection rates due to competition from informal networks [13,14].
The Circular Economy (CE) paradigm offers a promising alternative, emphasizing resource efficiency, reuse, and safe recovery [15]. However, current CE discourse in the Philippines often overlooks the informal sector’s realities and potential [16,17]. A genuine transition requires a hybrid approach that formalizes, optimizes, and safeguards existing informal circular activities while improving safety, income stability, and environmental outcomes.
Research Gap
While prior studies have documented the environmental and health impacts of informal e-waste recycling [7,9], and others have advocated for policy reforms like EPR [11,18], there is a critical lack of integrative, evidence-based frameworks that:
- Quantify the complex interplay between informal recyclers’ socio-economic conditions, behavioral drivers (attitudes, norms, perceived control), and on-ground recycling efficiency.
- Model how policy interventions (e.g., EPR incentives, formalization schemes) could dynamically alter this system and drive a transition toward a safer, more productive CE.
- Propose a context-sensitive CE integration model that is co-developed with and tailored to the realities of the Philippine informal recycling sector.
This study aims to fill these gaps. Focusing on Metro Manila, it employs a novel hybrid Structural Equation Modeling–Artificial Neural Network (SEM-ANN) methodology to analyze the behavioral and institutional determinants of recycling efficiency and simulate policy outcomes. The ultimate goal is to develop and propose a participatory, inclusive CE framework that transforms informal recyclers from marginalized waste handlers into recognized, empowered, and efficient agents of urban resource recovery.
2. Literature Review
2.1. The Central Role and Challenges of the Informal E-Waste Sector
In the absence of robust formal systems, informal recyclers dominate e-waste management across Asia, achieving high collection coverage through adaptive, low-cost networks [4,19]. In the Philippines, this sector is the primary interface for household and business e-waste, operating through a hierarchy of waste pickers, junkshops, and dismantlers [6,20]. However, this efficiency in collection is negated by hazardous and inefficient processing methods. Studies in Payatas and Tondo have documented dangerously high levels of lead, cadmium, and copper in workers’ blood and hair samples, linked to practices like open burning and acid baths [9,21]. Economically, the sector is characterized by precarious incomes, exploitation by middlemen, and the destruction of reusable components and low-value materials (e.g., mixed plastics), which undermines both recovery rates and environmental sustainability [22,23]. While these studies highlight the systemic role and challenges of the informal sector, they often treat behavioral, economic, and institutional factors in isolation. An integrative analytical framework is needed to explain how these dimensions interact to constrain or enable a transition toward safe and efficient circular practices.
2.2. Theoretical Framework and Evolution of Philippine E-Waste Research
Research on e-waste management in the Philippines has evolved from early diagnostic and policy-focused studies toward integrative frameworks that include the informal sector. Foundational work identified systemic barriers and low public awareness [5,11]. Subsequent studies examined specific recycling technologies [7] and local governance models [24]. Recent research explicitly connects e-waste to circular economy (CE) principles and formal–informal integration [12,16,18]. Globally, similar country-specific analyses using material flow approaches have advanced our understanding of e-waste systems in diverse contexts, such as the comprehensive CE assessment for Kuwait by Al-Salem et al. (2022) [25]. While such studies provide valuable technological and material recovery insights, they often focus on formal systems and macro-level flows, leaving a gap in understanding the behavioral and institutional drivers within informal recycling networks, which is precisely the focus of this study.
Despite this progression, a key gap remains: the lack of a predictive, quantitative model integrating behavioral, institutional, and economic dimensions to explain informal recyclers’ efficiency. Prior studies have been either integrative but qualitative, or analytical but focused on single dimensions (see Supplementary Figure S1).
This study addresses this gap by employing a hybrid SEM-ANN methodology to develop a predictive framework. It integrates the Theory of Planned Behavior [26] and Institutional Theory [27] within a CE context to quantify the drivers of recycling efficiency, offering an evidence-based tool for designing inclusive policies.
2.3. Theoretical Underpinnings and Conceptual Framework
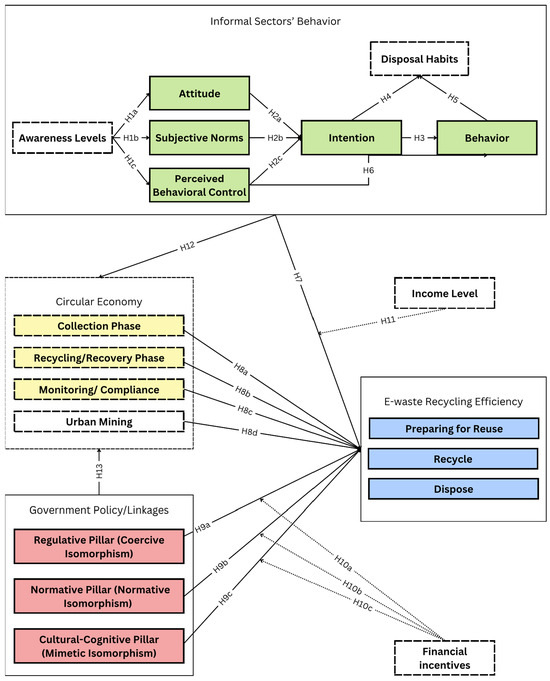
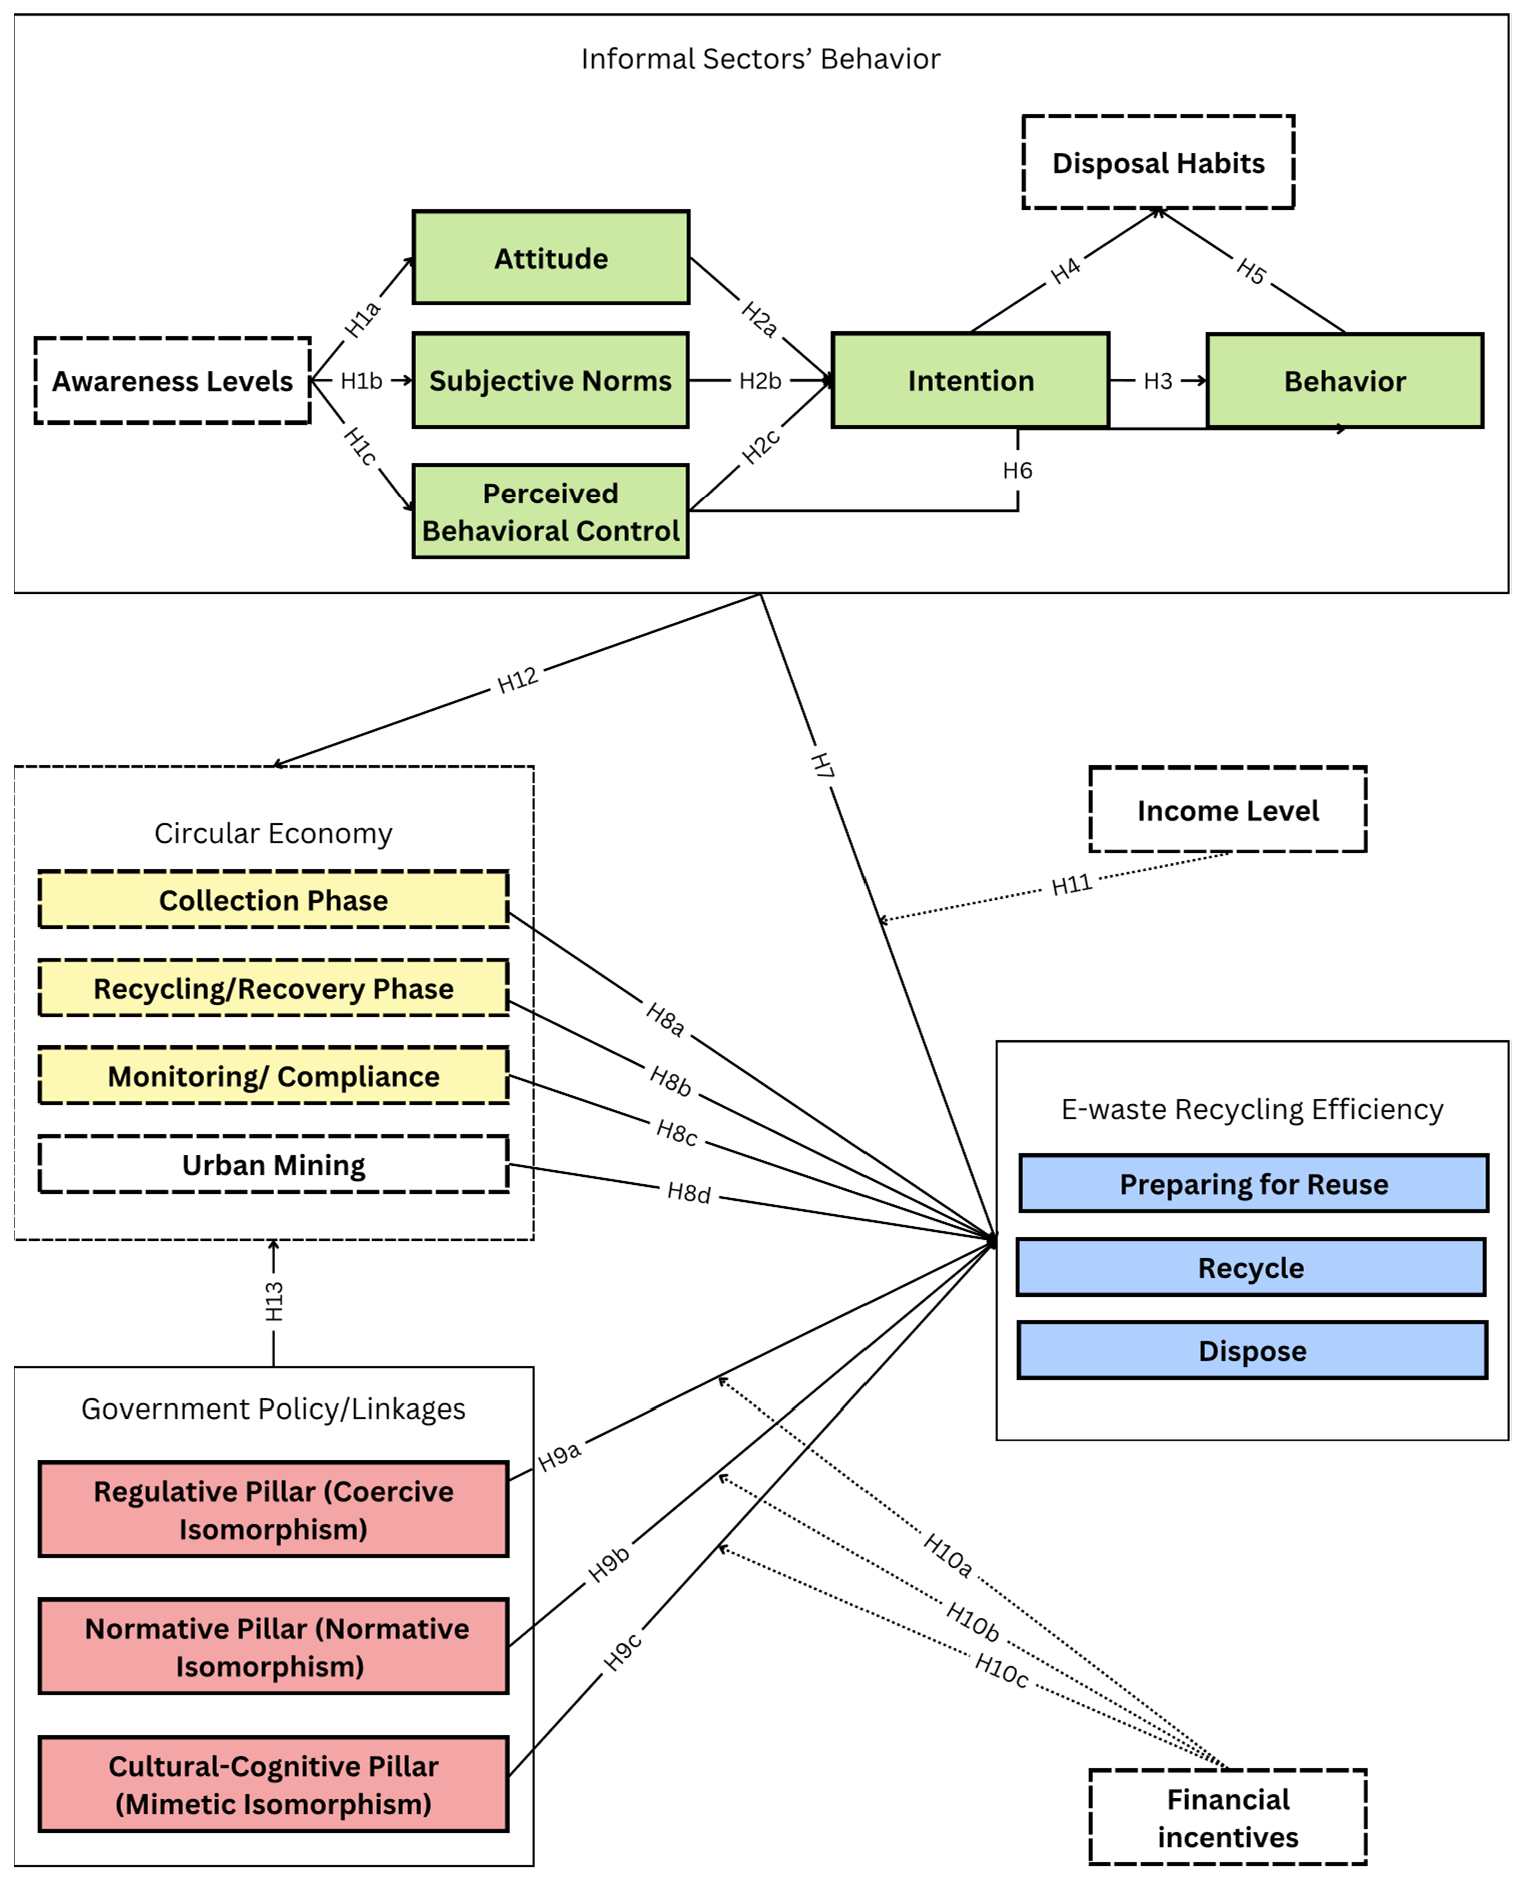
This study addresses this integrative gap by synthesizing the Theory of Planned Behavior (TPB), Institutional Theory, and Circular Economy (CE) principles into a unified framework. Rather than applying theories separately, we model how macro-institutional pressures shape micro-level behavioral constructs, and how CE interventions—such as Extended Producer Responsibility (EPR) can reconfigure these dynamics. This approach allows us to formally extend TPB for informal economies by proposing dual-layered Perceived Behavioral Control (micro-task and macro-institutional control) and institutionally embedded subjective norms (as seen in Figure 1).
Figure 1.
Circular economy framework for an informal recycler.
2.3.1. Theory of Planned Behavior (TPB) and Hypotheses
The TPB [26] provides a robust framework for understanding how individual motivations shape recycling actions. For informal recyclers, attitude toward safe recycling is influenced by awareness of health risks and long-term benefits [28]. Subjective norms are shaped by prevailing practices within their communities and economic networks, often prioritizing immediate income over safety [29]. Perceived behavioral control (PBC) is critically low, constrained by a lack of access to safe tools, protective equipment, and formal collection channels [30]. These three factors collectively drive recycling intention, which is a key precursor to actual behavior and enduring disposal habits [14]. Based on TPB, the following hypotheses are proposed as seen in Table 1.
Table 1.
List of direct hypotheses related to TPB.
2.3.2. Conceptualizing Recycling Efficiency and Circular Economy (CE) Phase Hypotheses
A functional CE for e-waste involves interconnected phases: collection, recycling/recovery, monitoring/compliance, and urban mining. The informal sector is dominant in collection but uses hazardous methods in recycling/recovery [35]. Monitoring/compliance is weak, and urban mining potential is underexploited [36,37]. To evaluate the system’s performance, this study conceptualizes e-waste recycling efficiency as a multi-dimensional construct reflecting the perceived effectiveness and productivity of informal recycling activities within the CE framework [15,17]. Since the informal sector operates predominantly in the “recycling/recovery” and “disposal” stages of the CE hierarchy, this construct captures recyclers’ self-reported assessments across three key dimensions aligned with CE principles:
- Perceived Material Recovery: Informal recyclers’ self-assessment of their effectiveness in extracting valuable materials (e.g., copper, aluminum, gold) from collected e-waste, including the perception of captured material value versus waste [10,36].
- Perceived Economic Viability: Informal recyclers’ evaluation of their economic returns relative to efforts and costs, encompassing perceptions of income stability and profit margins from current methods [23,34].
- Perceived Safety and Environmental Practice: Informal recyclers’ self-reported adherence to safer handling methods and awareness of minimizing environmental harm compared to hazardous alternatives [9,21].
This operational definition is measured via a 5-point Likert scale in the survey, where recyclers rate their agreement with statements related to these dimensions. The following hypotheses (Table 2) examine how each CE phase contributes to this holistic measure of recycling efficiency.
Table 2.
List of direct hypotheses related to Circular Economy phases.
2.3.3. Institutional Theory and Policy Isomorphism Hypotheses
Institutional Theory [37] explains how external pressures shape practices. Coercive isomorphism stems from laws and regulations. Normative isomorphism arises from societal expectations. Cultural–cognitive isomorphism results from mimicking accepted practices [38]. The following hypotheses are proposed as seen in Table 3.
Table 3.
List of direct hypotheses related to Institutional theory.
2.3.4. The Moderating and Catalytic Role of Incentives, Income, and Policy
Financial incentives can strengthen compliance, align practices with norms, and make safer techniques acceptable [39,40]. Income level may moderate the relationship between behavior and efficiency [41]. Ultimately, inclusive government policy is crucial for CE adoption [42]. The following hypotheses are proposed as seen in Table 4.
Table 4.
List of moderating hypothesis.
2.4. E-Waste Management and the Informal Sector in the Philippines
The transition from the current linear model to a proposed circular model fundamentally reimagines the role of the informal recycler, as summarized in Table 5.
Table 5.
Contrasting the linear and circular e-waste management models.
3. Materials and Methods
3.1. Study Design and Setting
This study adopted a sequential mixed-methods design, structured into four phases: (1) Conceptualization, involving a literature review and problem identification; (2) Instrumentation, encompassing survey design and pilot testing; (3) Analysis, integrating Structural Equation Modeling (SEM) and Artificial Neural Networks (ANN); and (4) Policy Integration, involving stakeholder interviews and policy alignment checks. The study was conducted in Metro Manila, Philippines, the country’s epicenter for e-waste generation and informal recycling, accounting for approximately 25% of national e-waste due to its dense urban population and extensive informal sector networks [5,45]. Focusing on Manila provided a critical and representative context for analyzing systemic inefficiencies in informal e-waste management.
Justification for the Sequential SEM-Then-ANN Approach
The sequential hybrid Structural Equation Modeling (SEM) followed by Artificial Neural Network (ANN) approach was selected to address the study’s dual objectives of theory validation and nonlinear predictive modeling within the complex socio-environmental context of informal e-waste recycling.
SEM was employed as the initial analytical stage because it allows for confirmatory testing of the theoretically derived hypotheses involving latent constructs from the Theory of Planned Behavior and Institutional Theory [26,37]. This step validates the proposed structural relationships and identifies which independent variables (e.g., attitudes, norms, policy pressures) have statistically significant linear effects on recycling efficiency [46]. By reducing the predictor set to these significant variables, SEM mitigates the risk of model overfitting and provides a parsimonious, theory-grounded foundation for the subsequent analysis [47].
While SEM excels at testing hypothesized linear relationships, it may overlook complex, nonlinear interactions and threshold effects common in human behavioral and institutional systems [48]. ANN was subsequently applied to model these intricate, non-compensatory patterns among the SEM-validated predictors. As a universal approximator, ANN can capture nonlinear dynamics such as how the impact of financial incentives might accelerate only after reaching a certain income threshold without requiring predefined functional forms [49]. This step enhances the model’s predictive accuracy and ability to simulate responses to policy interventions (e.g., varying EPR incentive levels).
This two-stage approach synergistically combines the explanatory power of SEM (theory testing, latent variable handling) with the predictive flexibility of ANN (nonlinear pattern detection) [50]. It is particularly suited for this research because: (1) it respects the theoretical framework while uncovering data-driven complexities; (2) it provides both causal inference (paths from SEM) and robust prediction (from ANN) for policy simulation; and (3) it addresses the limitations of using either method in isolation: SEM’s linearity assumptions and ANN’s “black-box” nature and tendency to overfit with many predictors [51]. This methodology is established in behavioral and environmental research for modeling complex systems where theory and empirical patterns must both be accommodated [52].
3.2. Participants and Sampling
The study was conducted in Metro Manila, Philippines. The selection of this major urban area as the primary research setting is justified on three grounds. First, Metro Manila is the unequivocal epicenter of the country’s e-waste generation and informal recycling activity, accounting for an estimated 25% of the national total due to its extreme population density, high rates of electronic consumption, and the concentration of informal sector networks [5,12]. Second, its extensive and well-established informal recycling ecosystem presents a critical case for analyzing the systemic inefficiencies, behavioral drivers, and institutional gaps that characterize e-waste management challenges in the Philippines [7,24]. Third, focusing on Metro Manila ensured logistical feasibility for the intensive fieldwork required while providing a context that is both intense and representative of the pressures faced by other growing urban centers in the country. Insights generated here are intended to inform scalable strategies for secondary cities with similar socio-economic and infrastructural profiles [13].
The target population was informal e-waste recyclers operating outside formal regulatory frameworks. A hybrid sampling approach combining convenience, snowball, and stratified methods was employed to access this hard-to-reach group [53,54]. The sample size was calculated using Cochran’s formula for an unknown population (Z = 1.96, p = 0.5, e = 0.05), yielding a target of 385 participants [55]. The final sample of 435 respondents exceeded this minimum. Participants were stratified by their role in the value chain (e.g., collectors, dismantlers) and proportionally allocated across Manila’s 14 administrative districts based on 2020 population density (see Table 6).
Table 6.
Sample size allocation based on population density in Manila.
3.3. Instrumentation and Measures
The primary instrument was a structured survey questionnaire developed from established theoretical frameworks: the Theory of Planned Behavior (TPB), Extended Producer Responsibility (EPR), Institutional Theory, and the EU Waste Hierarchy. The questionnaire assessed latent constructs across behavioral, economic, regulatory, and technical dimensions. It was meticulously translated into Filipino to ensure conceptual and cultural equivalence and validated by a language education expert. The instrument employed 5-point Likert scales (1 = Strongly Disagree to 5 = Strongly Agree) for reflective and formative constructs, and multiple-choice or open-ended formats for demographic and behavioral observed variables.
A pilot test was conducted with 59 participants, a sample size determined to be sufficient to detect issues affecting ≥ 5% of the population with 95% confidence [56]. The pilot served two main purposes: to assess the reliability of the measurement scales and to gather qualitative feedback on the clarity and appropriateness of the items. Reliability was analyzed using Cronbach’s alpha. All constructs demonstrated excellent internal consistency, with values significantly exceeding the 0.70 threshold [57] (e.g., Attitude α = 0.961, Subjective Norms α = 0.825, Institutional Constructs α = 0.857–0.949).
Qualitative feedback from pilot participants and enumerators indicated that the survey was generally well-understood. However, based on this feedback, minor revisions were made to enhance clarity. This included simplifying the phrasing of two items perceived as slightly complex (Perceived Behavioral Control-PBC4 and Awareness Level-AL3) and providing enumerators with additional scripted clarifications for key terms like “urban mining” to ensure consistent explanation during administration. No items were dropped, as the statistical reliability analysis confirmed that all measured their intended construct effectively. This pilot phase confirmed the instrument’s robustness, leading to its finalization for the main study.
3.4. Data Collection and Ethical Considerations
Data were collected over ten weeks using a hybrid approach: an online questionnaire via Google Forms and printed copies for participants with limited digital access. The process adhered to the Philippines’ Data Privacy Act of 2012 (Republic Act No. 10173). Informed consent was obtained from all participants, explained verbally in Filipino to address literacy barriers. Participants received food tokens as appreciation, and their anonymity and right to withdraw were guaranteed.
3.5. Data Analysis
The analysis followed a two-stage hybrid SEM-ANN approach using SmartPLS 4.0 and ANN using IBM SPSS 26.0 to test the hypothesis.
- Data Preprocessing: Data cleansing involved handling missing values via pairwise deletion or mean imputation, detecting outliers using Mahalanobis distance, and checking for multicollinearity (VIF < 5). Variables were normalized for ANN compatibility.
- Structural Equation Modeling (SEM): The measurement model was validated by assessing reliability (Cronbach’s Alpha, Composite Reliability > 0.7) and validity (Average Variance Extracted > 0.5, Heterotrait–Monotrait Ratio < 0.9). Confirmatory Factor Analysis (CFA) confirmed construct validity. The structural model tested 24 hypotheses (see Table 2) concerning relationships between awareness, attitudes, norms, perceived control, intention, behavior, institutional pillars, EPR phases, and recycling efficiency.
- Artificial Neural Network (ANN): An Artificial Neural Network (ANN) model was developed using a multi-layer perceptron (MLP) architecture. The specific configuration of two hidden layers (with 8 and 4 neurons, using ReLU and sigmoid activation functions, respectively) was determined to be optimal through an iterative process of model tuning. This architecture effectively balances model complexity with the risk of overfitting, given our sample size (n = 435) and the number of input predictors (13 latent constructs). The ReLU (Rectified Linear Unit) activation function in the first hidden layer efficiently handles non-linear relationships, while the sigmoid function in the second layer is suitable for producing output values in a range appropriate for our behavioral outcome variables [58,59]. The model was trained via the Scaled Conjugate Gradient algorithm, selected for its efficiency with moderately sized datasets. The input layer consisted of the 13 significant latent constructs from the SEM. The output layer contained three neurons representing key behavioral outcomes related to efficiency: Preparing for Reuse (RU), Recycle (RC), and Dispose (DP).
- SEM-ANN Integration: This sequential integration used SEM for causal validation and hypothesis testing, and ANN for non-linear predictive modeling and policy simulation, particularly for evaluating Extended Producer Responsibility (EPR) incentive schemes.
4. Results
4.1. Demographic Profile of Respondents
The final sample comprised 435 informal recyclers from Metro Manila. The demographic profile is presented in Table 7. The respondents were predominantly middle-aged, with the largest groups being 41–45 years old (22.53%) and 31–35 years old (20.23%). In terms of education, 23.68% had primary-level education and 21.84% reported no formal education. The most common reported daily household income was in the range of 401–500 PHP (23.22%), closely followed by 501–600 PHP (21.61%) and 301–400 PHP (21.38%). Regarding their role in the informal sector, waste picking from dumps (21.38%) and street waste picking (20.69%) were the most prevalent. The primary motivation for entering recycling work was generational livelihood (58.39%), while a significant 54.25% of respondents indicated they did not understand the term “e-waste” without additional explanation.
Table 7.
Demographic characteristics of the respondent sample (n = 435).
4.2. Descriptive Statistics and Normality Assessment
Descriptive statistics for all measurement items are presented in Table 8. The mean scores for most items ranged between 2.7 and 3.3 on the 5-point scale, indicating moderate agreement. Standard deviations were below 0.85, suggesting low response dispersion. The values for skewness and kurtosis were well within the acceptable range of ±1.0, supporting the assumption of univariate normality and the suitability of the data for subsequent SEM analysis [60].
Table 8.
Descriptive statistics for measurement items (n = 435).
4.3. Initial Model Validation (EFA & CFA)
4.3.1. Exploratory Factor Analysis (EFA)
An Exploratory Factor Analysis (EFA) was conducted to identify the underlying structure of the measurement model and validate the constructs [61]. The Kaiser–Meyer–Olkin (KMO) measure of sampling adequacy was 0.967, and Bartlett’s test of sphericity was significant (χ2 = 6975.222, p < 0.001), confirming the data’s suitability for factor analysis [62,63]. Principal Axis Factoring with Direct Oblimin rotation was employed, given the expected theoretical correlations among constructs [64]. The analysis yielded 19 factors, explaining 68.39% of the total variance, which is acceptable in social science research [65].
The communalities for all 76 items were examined, with the mean extraction communality being 0.681. All constructs exceeded the acceptable threshold of 0.40, indicating that the common factors sufficiently explained the variance in the items [66]. Key constructs like Normative Pillar (NP), Monitoring/Compliance (MC), and Attitude (AT) exhibited particularly high communalities (>0.79).
A robust factor loading threshold of |0.7| was applied to ensure strong indicator-construct relationships [67]. The analysis revealed that 72 of the 76 items met or exceeded this criterion. Four items (PBC1, AL2, AL4, BH1) loaded between 0.674 and 0.699. As their loadings remained above the conventional minimum of 0.5 and were deemed theoretically relevant, they were retained for subsequent Confirmatory Factor Analysis (CFA) evaluation [68].
4.3.2. Confirmatory Factor Analysis (CFA)
A Confirmatory Factor Analysis (CFA) was performed to validate the factor structure identified in the EFA. The refined model, excluding the four weaker items, demonstrated excellent measurement properties.
- Factor Loadings and Reliability: All 72 remaining indicators exhibited strong standardized outer loadings, meeting or exceeding the 0.7 benchmark (see Table 9). The lowest loading was 0.747 (BH3), indicating strong convergent validity at the item level [69]. Internal consistency was assessed via Cronbach’s Alpha (α) and Composite Reliability (ρc). All constructs exceeded the 0.7 threshold for both metrics, confirming high reliability (see Table 10) [66]. For instance, Cronbach’s Alpha values ranged from 0.712 (Awareness Levels) to 0.948 (Normative Pillar).
- Convergent and Discriminant Validity: Convergent validity was supported as the Average Variance Extracted (AVE) for all constructs exceeded 0.50 (range: 0.692 to 0.875) [68]. Discriminant validity was established using the Heterotrait–Monotrait (HTMT) ratio of correlations and the Fornell–Larcker criterion. All HTMT values were well below the conservative threshold of 0.85 (highest value: 0.175), indicating excellent discriminant validity [70,71]. All HTMT values were well below the conservative threshold of 0.85 (highest value: 0.175), indicating excellent discriminant validity [70,71]. This notably low ratio is not an error but reflects the high distinctiveness of the constructs within our integrated TPB-Institutional Theory framework. It resulted from a rigorous scale purification process during EFA, which eliminated cross-loadings and ensured that each latent variable captured a unique theoretical dimension relevant to the informal recycling context [64,68]. The Fornell–Larcker criterion was also satisfied (see Table 11). A diagnostic note is warranted regarding the magnitudes of the bivariate correlations in Table 10 (e.g., Awareness → Attitude, r = 0.056), which are low despite corresponding positive, significant path coefficients in the structural model (e.g., β = 0.512, p < 0.001 for H1a). This is a recognized phenomenon in multivariate analysis where simple correlations can mask true direct relationships within a complex network [65,67]. The discrepancy suggests the presence of interdependencies, such as suppression or mediation effects, where other model constructs account for shared variance [72]. The structural equation model correctly isolates the direct effect, revealing the substantive theoretical link between constructs when the model’s full complexity is considered.
- Multicollinearity Assessment: Variance Inflation Factor (VIF) values for all outer model indicators were below the critical threshold of 5.0 (highest VIF: 4.837), confirming that multicollinearity was not a concern for the measurement model [67].
Table 9.
Standardized outer loadings from CFA (selected constructs).
Table 10.
Reliability and convergent validity of constructs.
Table 11.
Fornell–Larcker criterion for discriminant validity (selected constructs).
4.4. Structural Model and Hypothesis Testing
The structural model was assessed using bootstrapping with 5000 resamples. The model demonstrated a good fit, with a Standardized Root Mean Square Residual (SRMR) of 0.042, indicating excellent approximate fit [73]. Out of 24 hypothesized relationships, 22 were statistically significant (p < 0.05). A summary of key hypothesis tests is presented in Table 12.
Table 12.
Summary of Key Hypotheses Testing.
Notably, all paths from the Theory of Planned Behavior (TPB) core constructs (Attitude, Subjective Norms) to Intention were significant, except for Perceived Behavioral Control (PBC) → Intention (β = 0.149, p = 0.141). Intention strongly predicted Behavior (β = 0.534, p < 0.001). Among institutional factors, the Recycling/Recovery Phase had the strongest impact on Recycling Efficiency (β = 0.512, p < 0.001). Financial Incentives positively influenced the Regulative and Normative Pillars but showed a significant negative interaction with the Cultural–Cognitive Pillar on disposal practices (β = −0.114, p < 0.05), suggesting a potential “crowding-out” effect [74].
The path from Urban Mining to Recycling Efficiency was not significant (β = 0.154, p = 0.137); therefore, this construct was removed for final model clarity. The final refined structural model is shown in Supplementary Figure S2.
4.5. Artificial Neural Network (ANN) Validation
To complement the SEM analysis and capture potential non-linear relationships, an Artificial Neural Network (ANN) model was developed using a Multilayer Perceptron (MLP) architecture (Table 13) [58,59]. The input layer consisted of the 13 significant latent constructs from the SEM (e.g., AT, SN, PBC, RP). The output layer contained three neurons representing the dependent variables: Preparing for Reuse (RU), Recycle (RC), and Dispose (DP). The dataset was partitioned into training (80%) and testing (20%) sets.
Table 13.
Artificial Neural Network Model Performance Summary.
The network was trained using the Scaled Conjugate Gradient algorithm. Over ten independent runs, the model showed consistent and robust performance (see Table 5). The small performance gap between training and testing Root Mean Square Error (RMSE) (average difference: 0.024) indicates excellent generalization without overfitting [75,76]. The sensitivity analysis revealed that Behavioral Intention (IN), Attitude (AT), and the Recycling/Recovery Phase (RR) were among the most important predictors in the network, aligning with the SEM findings and confirming the robustness of these key drivers.
The ANN complements SEM by capturing nonlinear relationships and threshold effects among validated predictors. Its sensitivity analysis ranks predictor importance, while its predictive capacity allows simulation of policy scenarios, such as varying financial incentive levels under different income thresholds (see Section 6.2).
5. Results of Sensitivity Analysis and Qualitative Validation
5.1. Normalized Importance of Predictors
The sensitivity analysis of the ANN model provides a ranked order of importance for predictors of e-waste management behaviors among informal workers, as presented in Table 14. As detailed in Section 3.3, the ‘Income Level’ (IL) construct measured perceived income adequacy, not absolute earnings. This analysis quantifies the relative influence of each latent construct, offering critical insights for both theory and practice.
Table 14.
Normalized Importance of Predictor Variables.
5.1.1. Dominance of Economic and Institutional Factors
The highest-ranked predictors were economic variables: Income Level (IL: 84.01%) and Financial Incentives (FI: 82.86%). This finding suggests an economic rationality framework is paramount for explaining environmental behavior in contexts of scarcity, where livelihood security is a primary driver [77,78]. Among institutional factors, the Cultural–Cognitive Pillar (CC: 80.98%) ranked highest, indicating that shared understandings and tacit assumptions significantly shape recycling practices [79]. Concurrently, the high importance of Collection Phase (CP: 78.71%) and Recycling/Recovery Phase (RR: 78.66%) underscores the physical infrastructure of the circular economy as a key determinant of behavioral outcomes.
5.1.2. Contextual Role of Behavioral Constructs
Constructs from the Theory of Planned Behavior (TPB), such as Subjective Norms (SN: 78.95%) and Intention (IN: 77.66%), showed substantial but moderate predictive importance. This indicates that psychological factors remain relevant but are contextualized within a framework dominated by economic and institutional forces [80].
5.2. Focus Group Discussion: Thematic Validation
A Focus Group Discussion (FGD) was conducted in October 2025 with four participants (as seen in Table 15) from an e-waste junkshop collective in Santa Rosa, Laguna, to validate and contextualize the quantitative findings. Thematic analysis of the transcript revealed four central themes. The FGD was not designed for statistical validation but for explanatory triangulation within the mixed-methods framework [81]. Its purpose was to explore the lived experiences and reasoning behind key quantitative patterns such as the dominance of economic drivers or the intention–behavior gap thereby adding contextual depth and narrative meaning to the statistical model.
Table 15.
Profile of FGD Participants.
5.2.1. Theme 1: Economic Priority and Calculated Informality
This theme confirmed the dominance of Income Level (IL) and Financial Incentives (FI). Participants described a state of “economic coercion,” where immediate income needs systematically override safety or environmental concerns. Daily income volatility (reported swings of 50–60%) fostered a survival mindset, making long-term planning impossible. Informality was a rational choice, based on a sophisticated risk assessment that weighed the known precarity of informality against the perceived unreliability and exclusionary nature of formal systems [27].
5.2.2. Theme 2: Embodied Epistemology and Awareness–Action Disconnect
The high ranking of the Cultural–Cognitive Pillar (CC) and the low ranking of Awareness (AL) were justified by this theme. Participants operated within a self-contained, mimetic knowledge system. Skills were acquired solely through observation and practice within the junkshop environment, with formal training unanimously rejected as unnecessary (“Hindi na kailangan”). While participants expressed high macro-level environmental awareness, this knowledge was decoupled from daily practice, failing to translate into safer behavior when it conflicted with economic imperatives.
5.2.3. Theme 3: Institutional Distrust and Functional Informality
Participants viewed formal regulatory systems as active barriers rather than supports, citing exclusion from municipal waste collection and pandemic aid. This historical distrust explained the resistance to formalization. In the vacuum left by formal institutions, sophisticated self-organized systems have emerged. These systems manage complex supply chains, internal quality norms, and even social welfare mechanisms (e.g., Christmas bonus funds from saved copper), demonstrating the functional resilience of informality [82].
5.2.4. Theme 4. Duality of Perceived Behavioral Control and Economic Coercion
This theme explains the contradictory quantitative findings for Perceived Behavioral Control (PBC). Participants exhibited high Technical PBC (confidence in dismantling skills) but very low Contextual PBC (control over economic and regulatory conditions). Consequently, PBC predicted the performance of income-generating tasks but not the formation of safety intentions. A pervasive sense of fatalism (“mangyari’t mangyari”—it will happen regardless) severed the link between control and intention. Ultimately, external economic pressures acted as a final “override mechanism,” compelling workers to prioritize speed and income over safety, despite their awareness and technical capability.
6. Discussion
6.1. Theoretical Implications
6.1.1. Extending the Theory of Planned Behavior (TPB)
The model challenges the universal application of TPB in subsistence economies. While Attitude → Intention and Intention → Behavior paths were significant, the Perceived Behavioral Control → Intention path was not (β = 0.149, p > 0.05). The ANN confirmed economic factors (IL, FI) as supreme predictors. This suggests a survival-based decision hierarchy where economic imperatives can short-circuit the standard TPB sequence [83]. The study proposes a dual conceptualization of PBC into Technical (task execution) and Contextual (environmental control) dimensions to resolve such contradictions in informal settings.
6.1.2. Rebalancing Institutional Theory
Contrary to institutional theory’s traditional emphasis on regulative pillars [82], the Cultural–Cognitive Pillar was the strongest institutional predictor (80.98%). The FGD revealed this stems from a powerful, self-reinforcing system of mimetic isomorphism a “street science” learned through imitation. This culturally embedded epistemology normalizes practice and filters out external awareness, suggesting an inverted institutional hierarchy in deeply informal sectors where cultural–cognitive forces dominate.
6.1.3. Reconciling the Awareness–Action Paradox
The study elucidates the long-standing paradox of high environmental awareness not leading to pro-environmental behavior [84]. Awareness (AL) was the weakest predictor (63.84%). The FGD showed that economic survival acts as a super-moderator, nullifying the awareness–behavior link. Participants cognitively compartmentalized macro-environmental benefits from micro-level risky practices, using fatalistic rationalizations to manage dissonance. This positions economic fulfillment as a precondition for norm-activated pro-environmental behavior in poverty contexts.
6.1.4. Informing Extended Producer Responsibility (EPR) for Informal Economics
The significant effects of Financial Incentives on both Regulative (β = 0.421) and Normative (β = 0.385) Pillars highlight that financial mechanisms are central to institutional compliance and community norms in the informal sector. Effective EPR policies must not attempt to replace existing informal incentive networks but must augment and interconnect with them. Furthermore, historical institutional distrust emerges as a critical, often overlooked barrier that cannot be overcome by financial incentives alone [85].
6.2. Practical and Policy Implications
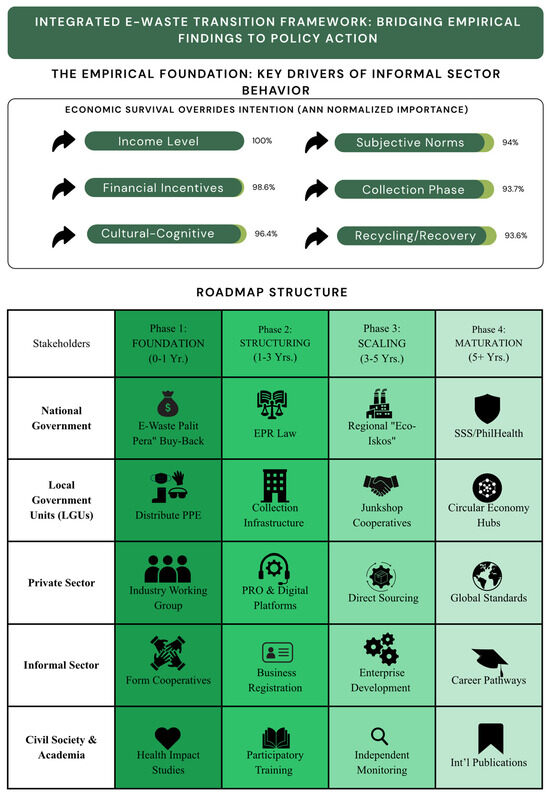
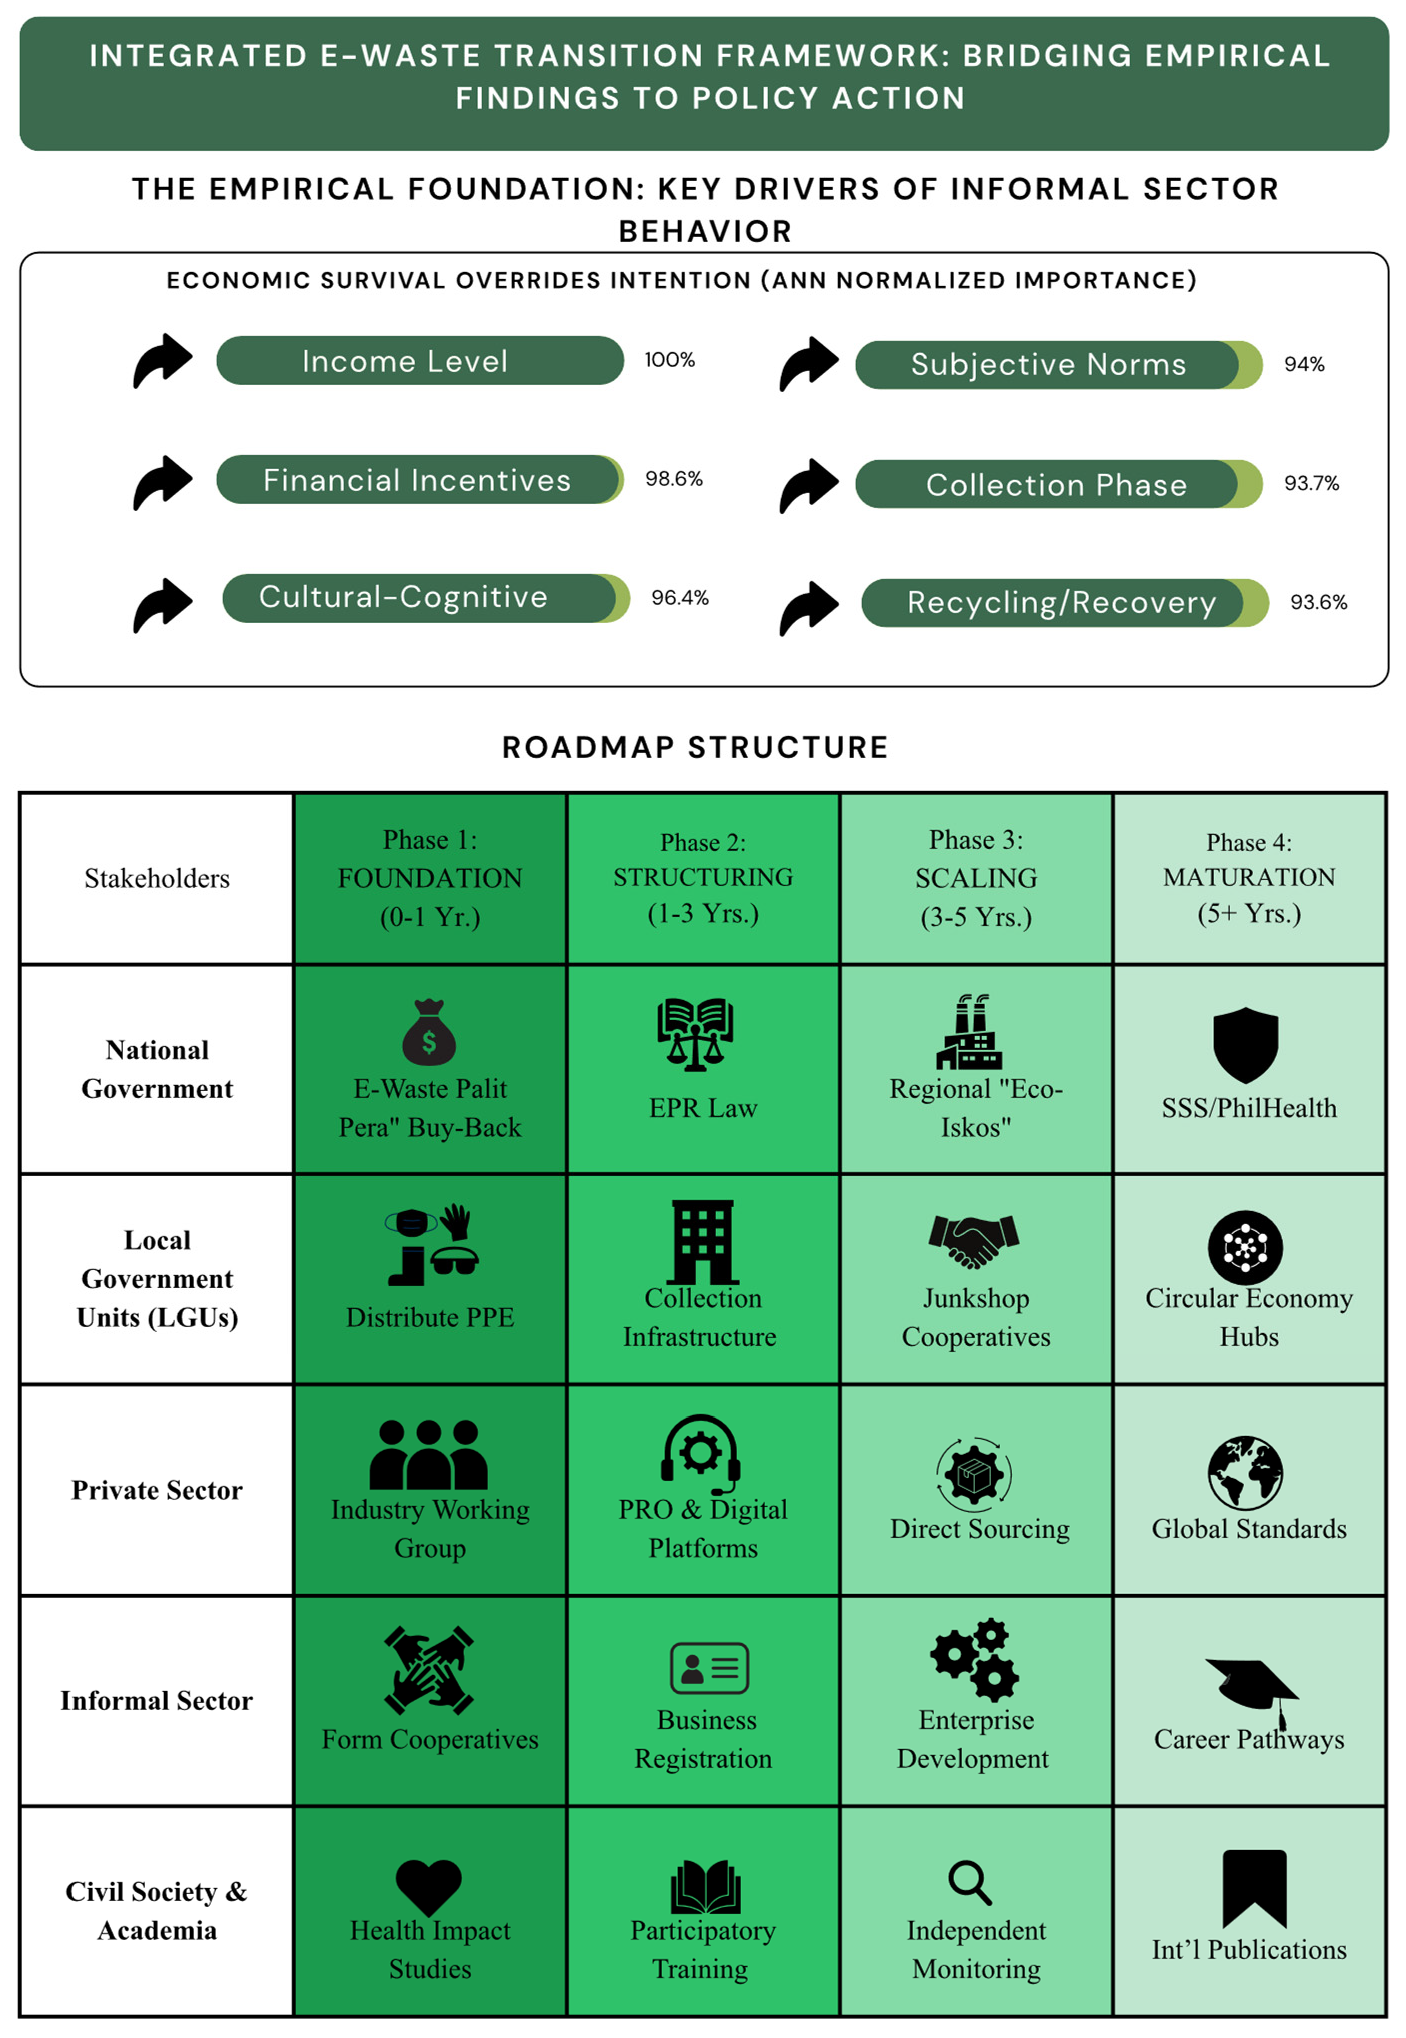
The integrated findings advocate for a sequenced, multi-tiered policy approach centered on economic stabilization, trust-building, and leveraging existing informal systems. Figure 2 presents the logic model derived from the study’s empirical hierarchy of drivers.
Figure 2.
Logic Model for Informal Sector Integration Based on Empirical Findings.
The integrated findings advocate for a sequenced, multi-tiered policy approach, as outlined in the roadmap in Table 16.
Table 16.
Phased Policy Roadmap for Integrating the Informal E-Waste Sector in the Philippines.
- Principle 1: Economic Priority First. Initial interventions must directly address livelihood security through immediate financial incentives. This principle is dictated by the finding that Income Level (84.01%) and Financial Incentives (82.86%) were the two strongest predictors in the ANN model. The FGD theme of “Economic Coercion” confirmed that survival needs systematically override all other intentions, making economic stabilization the essential first step for any behavioral or systemic change.
- Principle 2: Progressive Formalization via Inclusive Models. Forced, rapid formalization is predicted to fail. This principle is derived from the FGD theme of “Calculated Informality,” where historical institutional distrust creates high resistance, and the significant SEM path where Financial Incentives strengthen the Normative Pillar (H10b: β = 0.385). Policies must therefore follow inclusive business models that use financial mechanisms and cooperative structures to build trust and internal norms, gradually integrating workers without disrupting the livelihoods upon which they depend [86].
- Principle 3: Co-Design for Cultural Compatibility. Interventions must be co-created with the informal sector. This is a necessary response to the finding that the Cultural–Cognitive Pillar was the strongest institutional predictor (80.98%, Rank 3). The FGD revealed a closed, mimetic knowledge system that filters out external, top-down information. Leveraging these existing social learning processes is therefore crucial for adoption, requiring frameworks developed with workers, not merely for them [80].
- Principle 4: Digital Integration. Technology should be used to reduce information asymmetries and transaction costs. This principle addresses the root cause of economic precarity identified in the FGD (Sub-theme “Precarious Livelihood”), namely extreme price volatility and market opacity. By ensuring fair pricing, transparent payments, and efficient logistics, digital tools directly enhance the economic returns that the model identifies as the primary driver of behavior.
7. Conclusions
This study employed a sequential SEM-ANN approach, validated by focus group discussions, to empirically identify the drivers of recycling efficiency among informal e-waste workers in Metro Manila, Philippines. The Structural Equation Modeling results confirmed 16 of 18 hypothesized paths. Key behavioral drivers were validated, including the significant effects of Attitude (β = 0.534, p < 0.001) and Subjective Norms (β = 0.198, p = 0.041) on Intention, which in turn strongly predicted Behavior (β = 0.534, p < 0.001). However, the path from Perceived Behavioral Control to Intention was not significant (β = 0.149, p = 0.141), challenging a core assumption of the Theory of Planned Behavior in this context. Among Circular Economy phases, the Recycling/Recovery phase was the strongest predictor of efficiency (β = 0.512, p < 0.001).
The Artificial Neural Network sensitivity analysis provided a critical hierarchy of predictor importance, quantifying the non-linear relationships. Economic factors were paramount, with Income Level (normalized importance = 84.01%) and Financial Incentives (82.86%) as the top two predictors. This was followed by the Cultural–Cognitive Pillar (80.98%), indicating the powerful role of mimetic, community-based learning. In contrast, traditional behavioral constructs like Awareness (63.84%) and Attitude (74.45%) had comparatively lower predictive power, revealing a “poverty-driven imperative” where livelihood security overrides psychological and awareness factors.
These integrated findings necessitate important theoretical extensions. First, they support a hierarchically adapted TPB for subsistence economies, where economic survival acts as a super-moderator. Second, they suggest a dual conceptualization of Perceived Behavioral Control into Technical (task skill) and Contextual (environmental constraint) dimensions. Third, they demonstrate the primacy of cultural–cognitive isomorphism over regulative pressures in shaping practices within deeply informal institutional settings.
The evidence translates directly into a phased, four-stage policy roadmap spanning stabilization to maturation. The immediate priority must be “Economic First Interventions,” such as a national buy-back scheme, to address the dominant drivers identified. Subsequent phases should focus on trust-based formalization via cooperatives, capacity building, and digital integration to ensure fair pricing and traceability. Future research must empirically test the proposed theoretical models, employ longitudinal designs to assess policy impact, and expand the geographical scope to validate and adapt this framework for other urban and rural contexts in the developing world.
8. Limitations and Future Research
This study has several limitations that warrant consideration and guide future research directions. First, the geographical focus was on specific barangays in Metro Manila. This may not fully capture the diversity of practices, challenges, and institutional contexts in rural areas or other Philippine regions. Second, the reliance on self-reported data, while necessary, introduces the potential for response bias. Third, the cross-sectional design limits insights into the long-term evolution of behaviors and the sustained impact of policies.
Future studies should address these limitations and build upon the theoretical extensions proposed:
- Empirical Model Validation: Conduct studies to empirically test the proposed hierarchical TPB model and the dual structure of PBC (Technical vs. Contextual) in other informal economy settings.
- Longitudinal and Impact Assessments: Implement longitudinal research to monitor the socio-economic and health impacts of inclusive business models (e.g., cooperatives) and digital tools on informal recyclers’ livelihoods over time.
- Geographical and Contextual Expansion: Expand the research scope to other urban and rural contexts in the Philippines and other developing economies to validate, refine, and adapt the proposed framework.
- Formal–Informal Interface: Investigate effective mechanisms for building trust and bridging the gap between formal regulatory systems and informal sector practices, moving beyond purely financial incentive models [86].
- Larger-scale qualitative designs such as multiple FGDs and in-depth interviews across diverse segments and regions to further refine and generalize the thematic findings.
Supplementary Materials
The following supporting information can be downloaded at: https://www.mdpi.com/article/10.3390/su18041968/s1, Figure S1: Evolution of e-waste management research in the Philippines, mapping conceptual focus against methodological approach. The trajectory shows a progression from descriptive policy/technology studies toward integrative systems thinking, highlighting the predictive modeling gap filled by this study.; Figure S2: Final structural equation model with standardized path coefficients. Significant paths are shown in solid lines; the non-significant path (PBC > Intention) is shown as a dashed line. Urban Mining has been omitted.
Author Contributions
Conceptualization, K.K., K.P.B., C.S.S. and E.L.B.; investigation, K.K., K.P.B., C.S.S. and E.L.B.; methodology, K.K., K.P.B., C.S.S. and E.L.B.; writing—review and editing, K.K., K.P.B., C.S.S. and E.L.B. All authors have read and agreed to the published version of the manuscript.
Funding
This research received no external funding.
Institutional Review Board Statement
This study was conducted in accordance with the Declaration of Helsinki and approved by the De La Salle University (Manila) Research Ethics Review Committee (RERC). The project code 2025-272C was granted ethical clearance (valid from 17 September 2025 to 16 September 2026) for the research proposal titled ‘A Circular Economy Approach to Developing an Efficient E-Waste Recycling Framework for Informal Recyclers in Urban Philippines’ on 17 September 2025.
Informed Consent Statement
Informed consent for participation was obtained from all subjects involved in the study.
Data Availability Statement
The data presented in this study are not publicly available due to privacy restrictions.
Conflicts of Interest
The authors declare no conflicts of interest.
References
- Islam, M.T.; Huda, N. Reverse logistics and closed-loop supply chain of waste electrical and electronic equipment (WEEE)/E-waste: A comprehensive literature review. Resour. Conserv. Recycl. 2021, 173, 105734. [Google Scholar] [CrossRef] [Scilit]
- E-Waste Monitor. The Global E-Waste Monitor 2024. 12 December 2024. Available online: https://ewastemonitor.info/the-global-e-waste-monitor-2024/ (accessed on 23 February 2025).
- The Growing Environmental Risks of E-Waste. Geneva Environment Network. Available online: https://www.genevaenvironmentnetwork.org/resources/updates/the-growing-environmental-risks-of-e-waste/ (accessed on 24 February 2025).
- Priyashantha, A.K.H.; Pratheesh, N.; Pretheeba, P. E-waste scenario in South-Asia: An emerging risk to environment and public health. Environ. Anal. Health Toxicol. 2022, 37, e2022022. [Google Scholar] [CrossRef] [Scilit] [PubMed]
- Alam, Z.F. The assessment of the e-waste management generated from cellular phones, laptops, and personal computers in the Philippines. Manila J. Sci. 2016, 9, 27–42. [Google Scholar]
- World Bank. Philippines—Social Inclusion and Alternative Livelihood for the Informal Waste Sector Project: Indigenous Peoples Planning Framework. 17 April 2012. Available online: https://documents.worldbank.org/curated/en/642291468334134929 (accessed on 3 March 2025).
- Yoshida, A.; Terazono, A.; Ballesteros, F.C., Jr.; Nguyen, D.Q.; Sukandar, S.; Kojima, M.; Sakata, S. E-waste recycling processes in Indonesia, the Philippines, and Vietnam: A case study of cathode ray tube TVs and monitors. Resour. Conserv. Recycl. 2016, 106, 48–58. [Google Scholar] [CrossRef] [Scilit]
- Ventabal, R.A.; Cruz, Z.M.S.; Santos, J.F.; Basilio, E. Inventory of electronic waste (e-waste) and residues in junkshops: A step towards residual waste management. Int. J. Environ. Eng. Educ. 2024, 6, 107–118. [Google Scholar] [CrossRef] [Scilit]
- Alam, Z.F.; Ang, C.L.J.; Bondoc, I.V. Analysis of heavy metals in the human hair to establish the e-waste toxicity among the Filipino informal recyclers located at various e-waste dumpsites in and around Manila, Philippines. Nat. Environ. Pollut. Technol. 2018, 17, 757–766. [Google Scholar] [CrossRef] [Scilit]
- Manomaivibool, P. Extended producer responsibility in a non-OECD context: The management of waste electrical and electronic equipment in India. Resour. Conserv. Recycl. 2009, 53, 136–144. [Google Scholar] [CrossRef] [Scilit]
- Carisma, B. Drivers of and Barriers to E-Waste Management in the Philippines. Master’s Thesis, International Institute for Industrial Environmental Economics (IIIEE), Lund University, Lund, Zweden, 2009. [Google Scholar]
- Garcia, R.; Marcilla, A.; Flores, L.; Lapong, E. Toward sustainable e-waste management: Bridging gaps and insights from General Santos City, Philippines. J. Interdiscip. Perspect. 2024, 3, 232–248. [Google Scholar] [CrossRef] [Scilit]
- Premakumara, D.G.J. Development of E-Waste Management Policy at the Local Level: A Case Study of Cebu City, Philippines; Institute for Global Environmental Strategies (IGES): Kitakyushu City, Japan, 2016. [Google Scholar]
- Kumar, A. Exploring young adults’ e-waste recycling behaviour using an extended theory of planned behaviour model: A cross-cultural study. Resour. Conserv. Recycl. 2018, 141, 378–389. [Google Scholar] [CrossRef] [Scilit]
- Ghisellini, P.; Cialani, C.; Ulgiati, S. A review on circular economy: The expected transition to a balanced interplay of environmental and economic systems. J. Clean. Prod. 2016, 114, 11–32. [Google Scholar] [CrossRef] [Scilit]
- Murthy, V.; Ramakrishna, S. A Review on Global E-Waste Management: Urban Mining towards a Sustainable Future and Circular Economy. Sustainability 2022, 14, 647. [Google Scholar] [CrossRef] [Scilit]
- Ouro-Salim, O. Urban mining of e-waste management globally: Literature review. Clean. Waste 2024, 10, 100162. [Google Scholar] [CrossRef] [Scilit]
- Grandhi, S.P.; Dagwar, P.P.; Dutta, D. Policy pathways to sustainable E-waste management: A global review. J. Hazard. Mater. Adv. 2024, 16, 100473. [Google Scholar] [CrossRef] [Scilit]
- Sengupta, D.; Ilankoon, I.M.S.K.; Kang, K.D.; Chong, M.N. Circular economy and household e-waste management in India: Integration of formal and informal sectors. Miner. Eng. 2022, 184, 107661. [Google Scholar] [CrossRef] [Scilit]
- Paul, J.G.; Arce-Jaque, J.; Ravena, N.; Villamor, S.P. Integration of the informal sector into municipal solid waste management in the Philippines—What does it need? Waste Manag. 2012, 32, 1386–1392. [Google Scholar] [CrossRef] [Scilit] [PubMed]
- Parvez, S.M.; Jahan, F.; Brune, M.N.; Gorman, J.F.; Rahman, M.J.; Carpenter, D.; Islam, Z.; Rahman, M.; Aich, N.; Knibbs, L.D.; et al. Health consequences of exposure to e-waste: An updated systematic review. Lancet Planet. Health 2021, 5, e905–e920. [Google Scholar] [CrossRef] [Scilit]
- Romallosa, A.R.D.; Penetrante, M.O.T.; Ravena, N.G. Junkshops as recycling chain actors in the recovery of waste resources from a highly urbanized city in the Philippines. Appl. Environ. Res. 2024, 46, 16. [Google Scholar] [CrossRef] [Scilit]
- Terazono, A.; Oguchi, M.; Yoshida, A.; Ballesteros, F.C., Jr. Material recovery and environmental impact by informal e-waste recycling site in the Philippines. In Sustainability Through Innovation in Product Life Cycle Design; Springer: Singapore, 2017; pp. 167–179. [Google Scholar] [CrossRef] [Scilit]
- Campit, N. E-Waste Management in the Philippines: An Assessment: How Effective Are the Existing Environmental Governance Initiatives in Implementing e-Waste Management in the Philippines? 2017. Available online: https://www.academia.edu/42793087/E_WASTE_MANAGEMENT_IN_THE_PHILIPPINES_An_Assessment_How_effective_are_the_existing_environmental_governance_initiatives_in_implementing_e_waste_management_in_the_Philippines (accessed on 5 March 2025).
- Al-Salem, S.M.; Leeke, G.A.; El-Eskandarany, M.S.; Van Haute, M.; Constantinou, A.; Dewil, R.; Baeyens, J. On the implementation of the circular economy route for E-waste management: A critical review and an analysis for the case of the state of Kuwait. J. Environ. Manag. 2022, 323, 116181. [Google Scholar] [CrossRef] [Scilit] [PubMed]
- Ajzen, I. The theory of planned behavior. Organ. Behav. Hum. Decis. Process. 1991, 50, 179–211. [Google Scholar] [CrossRef] [Scilit]
- Scott, W.R. Institutions and Organizations: Ideas, Interests, and Identities, 4th ed.; Sage Publications: Thousand Oaks, CA, USA, 2014. [Google Scholar]
- Suryanto, A.; Nurdin, N.; Andriansyah, A.; Rahayu, N.S.; Irawati, E. Predicting supply chain management of e-waste recycling behavior using an extended theory of planned behavior model. Uncertain Supply Chain Manag. 2023, 11, 1001–1008. [Google Scholar] [CrossRef] [Scilit]
- George, N.; Cekuls, A. Driving sustainable e-waste recycling behaviors in India: Challenges, models, and solutions. J. Environ. Manag. 2024, 335, 120456. [Google Scholar]
- Noor, N.H.M.; Soleman, N.A.F.; Azuan, A.S.K. To recycle or not to recycle? Factors affecting Malaysian residents’ intention for recycling e-waste. Malays. J. Soc. Sci. Humanit. (MJSSH) 2023, 8, e002102. [Google Scholar] [CrossRef] [Scilit]
- Lu, B.; Wang, J. How can residents be motivated to participate in waste recycling? An analysis based on two survey experiments in China. Waste Manag. 2022, 141, 105–116. [Google Scholar] [CrossRef] [Scilit] [PubMed]
- Michael, L.K.; Hungund, S.S.; KV, S. Factors influencing the behavior in recycling of e-waste using integrated TPB and NAM model. Cogent Bus. Manag. 2024, 11, 2295605. [Google Scholar] [CrossRef] [Scilit]
- Sheeran, P.; Webb, T.L. The intention–behavior gap. Soc. Personal. Psychol. Compass 2016, 10, 503–518. [Google Scholar] [CrossRef] [Scilit]
- Dutta, D.; Goel, S. Understanding the gap between formal and informal e-waste recycling facilities in India. Waste Manag. 2021, 123, 456–467. [Google Scholar] [CrossRef] [Scilit]
- Fatema, K.; Hassan, M.N.; Hasan, S.; Roy, H. E-waste recycling in an optimized way for copper recovery by leaching and a case study on E-waste generation and management in Dhaka city. Heliyon 2024, 10, e41453. [Google Scholar] [CrossRef] [Scilit]
- Gunarathne, N.; de Alwis, A.; Alahakoon, Y. Challenges facing sustainable urban mining in the e-waste recycling industry in Sri Lanka. J. Clean. Prod. 2019, 119, 641. [Google Scholar] [CrossRef] [Scilit]
- Ankhi, I.J.; Hossain, G.A.; Faisal, A.K.M.; Hasan, M.R.-U.; Barua, S.; Masud, M.H. Material flow analysis and risk evaluation of informal and formal E-waste recycling processes in Bangladesh: Towards sustainable management strategies. J. Clean. Prod. 2025, 486, 145090. [Google Scholar] [CrossRef] [Scilit]
- Ranta, V.; Aarikka-Stenroos, L.; Ritala, P.; Makinen, S.J. Exploring institutional drivers and barriers of the circular economy: A cross-regional comparison of China, the US, and Europe. Resour. Conserv. Recycl. 2018, 135, 70–82. [Google Scholar] [CrossRef] [Scilit]
- Feng, Z.; Luo, N.; Wu, S.; Yan, Z.J. Navigating the recycling intention of electronics manufacturers in collaborating with a third-party collector: A Stackelberg game analysis. J. Clean. Prod. 2024, 434, 142460. [Google Scholar] [CrossRef] [Scilit]
- Denčić-Mihajlov, K.; Krstić, M. Financial stimulation policy as a part of socioeconomic intervention in the area of waste electrical and electronic equipment recycling. In Circular Economy in Textiles and Apparel; Ghosh, B.P.S.R., Ed.; Elsevier: Amsterdam, The Netherlands, 2021; pp. 189–210. [Google Scholar] [CrossRef] [Scilit]
- Nikou, V.; Sardianou, E. Bridging the socioeconomic gap in E-waste: Evidence from aggregate data across 27 European Union countries. Clean. Prod. Lett. 2023, 5, 100052. [Google Scholar] [CrossRef] [Scilit]
- Lahane, S.; Kant, R. Evaluating the circular supply chain implementation barriers using Pythagorean fuzzy AHP-DEMATEL approach. Clean. Supply Chain 2021, 1, 100014. [Google Scholar] [CrossRef] [Scilit]
- Kirchherr, J.; Reike, D.; Hekkert, M. Conceptualizing the circular economy: An analysis of 114 definitions. Resour. Conserv. Recycl. 2017, 127, 221–232. [Google Scholar] [CrossRef] [Scilit]
- International Labour Organization (ILO). Conceptual Framework for Statistics on the Informal Economy; ILO: Geneva, Switzerland, 2022; Available online: https://www.ilo.org/sites/default/files/wcmsp5/groups/public/@dgreports/@stat/documents/meetingdocument/wcms_867429.pdf (accessed on 31 October 2025).
- Garcia, R.M. Localized e-waste recycling framework for General Santos City: A circular economy approach. J. Interdiscip. Perspect. 2025, 3, 280–296. [Google Scholar] [CrossRef] [Scilit]
- Hair, J.F.; Hult, G.T.M.; Ringle, C.M.; Sarstedt, M. A Primer on Partial Least Squares Structural Equation Modeling (PLS-SEM), 3rd ed.; Sage: Thousand Oaks, CA, USA, 2022. [Google Scholar]
- Wang, Y.; Herrando, C. Does privacy assurance on social commerce sites matter to millennials? Int. J. Inf. Manag. 2019, 44, 164–177. [Google Scholar] [CrossRef] [Scilit]
- Leong, L.Y.; Hew, T.S.; Ooi, K.B.; Lee, V.H.; Hew, J.J. A hybrid SEM–neural network analysis of social media addiction. Expert Syst. Appl. 2019, 133, 296–316. [Google Scholar] [CrossRef] [Scilit]
- Hornik, K.; Stinchcombe, M.; White, H. Multilayer feedforward networks are universal approximators. Neural Netw. 1989, 2, 359–366. [Google Scholar] [CrossRef] [Scilit]
- Leong, L.Y.; Hew, T.S.; Ooi, K.B.; Lin, B. Do electronic word-of-mouth and elaboration likelihood model influence hotel booking? J. Comput. Inf. Syst. 2019, 59, 146–160. [Google Scholar] [CrossRef] [Scilit]
- Ringle, C.M.; Sarstedt, M.; Straub, D.W. A critical look at the use of PLS-SEM in MIS Quarterly. MIS Q. 2012, 36, iii–xiv. [Google Scholar] [CrossRef] [Scilit]
- Khan, G.F.; Sarstedt, M.; Shiau, W.L.; Hair, J.F.; Ringle, C.M.; Fritze, M.P. Methodological research on partial least squares structural equation modeling (PLS-SEM): An analysis based on social network approaches. Internet Res. 2019, 29, 407–429. [Google Scholar] [CrossRef] [Scilit]
- Mor, R.S.; Sangwan, K.S.; Singh, S.; Singh, A.; Kharub, M. E-waste management for environmental sustainability: An exploratory study. Procedia CIRP 2021, 98, 29–34. [Google Scholar] [CrossRef] [Scilit]
- Adanu, S.K.; Gbedemah, S.F.; Attah, M.K. Challenges of adopting sustainable technologies in e-waste management at Agbogbloshie, Ghana. Heliyon 2020, 6, e04548. [Google Scholar] [CrossRef] [Scilit]
- Cochran, W.G. Sampling Techniques, 3rd ed.; John Wiley & Sons: Hoboken, NJ, USA, 1977. [Google Scholar]
- Viechtbauer, W.; Smits, L.; Kotz, D.; Budé, L.; Spigt, M.; Serroyen, J.; Crutzen, R. A simple formula for the calculation of sample size in pilot studies. J. Clin. Epidemiol. 2015, 68, 1375–1379. [Google Scholar] [CrossRef] [Scilit]
- Nunnally, J.C.; Bernstein, I.H. Psychometric Theory, 2nd ed.; McGraw-Hill: New York, NY, USA, 1978. [Google Scholar]
- Abiodun, O.I.; Jantan, A.; Omolara, A.E.; Dada, K.V.; Mohamed, N.A.; Arshad, H. State-of-the-art in artificial neural network applications: A survey. Heliyon 2018, 4, e00938. [Google Scholar] [CrossRef] [Scilit] [PubMed]
- Leong, C.M.; Tan, K.L.; Puah, C.H.; Chong, S.M. Predicting mobile wallet resistance: A two-staged structural equation modeling-artificial neural network approach. Int. J. Inf. Manag. 2020, 51, 102047. [Google Scholar] [CrossRef] [Scilit]
- West, S.G.; Finch, J.F.; Curran, P.J. Structural equation models with nonnormal variables: Problems and remedies. In Structural Equation Modeling: Concepts, Issues, and Applications; Hoyle, R.H., Ed.; Sage: Thousand Oaks, CA, USA, 1995; pp. 56–75. [Google Scholar]
- Brown, T.A. Confirmatory Factor Analysis for Applied Research; Guilford Publications: New York, NY, USA, 2015. [Google Scholar]
- Kaiser, H.F. An index of factorial simplicity. Psychometrika 1974, 39, 31–36. [Google Scholar] [CrossRef] [Scilit]
- Field, A. Discovering Statistics Using IBM SPSS Statistics, 5th ed.; Sage Publications: Thousand Oaks, CA, USA, 2018. [Google Scholar]
- Fabrigar, L.R.; Wegener, D.T.; MacCallum, R.C.; Strahan, E.J. Evaluating the use of exploratory factor analysis in psychological research. Psychol. Methods 1999, 4, 272. [Google Scholar] [CrossRef]
- Hair, J.F.; Black, W.C.; Babin, B.J.; Anderson, R.E. Multivariate Data Analysis, 8th ed.; Cengage Learning: London, UK, 2019. [Google Scholar]
- Costello, A.B.; Osborne, J. Best practices in exploratory factor analysis: Four recommendations for getting the most from your analysis. Pract. Assess. Res. Eval. 2005, 10, 7. [Google Scholar]
- Tabachnick, B.G.; Fidell, L.S. Using Multivariate Statistics, 7th ed.; Pearson: London, UK, 2019. [Google Scholar]
- Fornell, C.; Larcker, D.F. Evaluating structural equation models with unobservable variables and measurement error. J. Mark. Res. 1981, 18, 39–50. [Google Scholar] [CrossRef] [Scilit]
- Henseler, J.; Ringle, C.M.; Sarstedt, M. A new criterion for assessing discriminant validity in variance-based structural equation modeling. J. Acad. Mark. Sci. 2015, 43, 115–135. [Google Scholar] [CrossRef] [Scilit]
- Hair, J.F., Jr.; Hult, G.T.M.; Ringle, C.M.; Sarstedt, M.; Danks, N.P.; Ray, S. Partial Least Squares Structural Equation Modeling (PLS-SEM) Using R: A Workbook; Springer Nature: Cham, Switzerland, 2021; p. 197. [Google Scholar]
- MacKinnon, D.P.; Krull, J.L.; Lockwood, C.M. Equivalence of the mediation, confounding and suppression effect. Prev. Sci. 2000, 1, 173–181. [Google Scholar] [CrossRef] [Scilit]
- Hu, L.T.; Bentler, P.M. Cutoff criteria for fit indexes in covariance structure analysis: Conventional criteria versus new alternatives. Struct. Equ. Model. 1999, 6, 1–55. [Google Scholar] [CrossRef] [Scilit]
- Frey, B.S.; Jegen, R. Motivation crowding theory. J. Econ. Surv. 2001, 15, 589–611. [Google Scholar] [CrossRef] [Scilit]
- Albahri, A.S.; Alnoor, A.; Zaidan, A.A.; Albahri, O.S.; Hameed, H.; Zaidan, B.B.; Peh, S.S.; Zain, A.B.; Siraj, S.B.; Alamoodi, A.H.; et al. Based on the multi-assessment model: Towards a new context of combining the artificial neural network and structural equation modelling: A review. Chaos Solitons Fractals 2021, 151, 111445. [Google Scholar] [CrossRef] [Scilit]
- LeCun, Y.; Bengio, Y.; Hinton, G. Deep learning. Nature 2015, 521, 436–444. [Google Scholar] [CrossRef] [Scilit]
- Asim, M.; Batool, S.A.; Chaudhry, M.N. Scavengers and their role in the recycling of waste in Southwestern Lahore. Resour. Conserv. Recycl. 2012, 58, 152–162. [Google Scholar] [CrossRef] [Scilit]
- Velis, C.A. Waste pickers in Global South: Informal recycling sector in a circular economy era. Waste Manag. Res. 2017, 35, 329–331. [Google Scholar] [CrossRef] [Scilit]
- DiMaggio, P.J.; Powell, W.W. The iron cage revisited: Institutional isomorphism and collective rationality in organizational fields. Am. Sociol. Rev. 1983, 48, 147–160. [Google Scholar] [CrossRef] [Scilit]
- Anantharaman, M. Networked ecological citizenship, the new middle classes and the provisioning of sustainable waste management in Bangalore, India. J. Clean. Prod. 2014, 63, 173–183. [Google Scholar] [CrossRef] [Scilit]
- Schroeder, P.; Dewick, P.; Kusi-Sarpong, S.; Hofstetter, J.S. Circular economy and power relations in global value chains: Tensions and trade-offs for lower income countries. Resour. Conserv. Recycl. 2018, 136, 77–78. [Google Scholar] [CrossRef] [Scilit]
- Creswell, J.W.; Plano Clark, V.L. Designing and Conducting Mixed Methods Research, 3rd ed.; SAGE Publications: Thousand Oaks, CA, USA, 2017. [Google Scholar]
- Sniehotta, F.F.; Presseau, J.; Araújo-Soares, V. Time to retire the theory of planned behaviour. Health Psychol. Rev. 2014, 8, 1–7. [Google Scholar] [CrossRef] [Scilit] [PubMed]
- Ajzen, I. Perceived behavioral control, self-efficacy, locus of control, and the theory of planned behavior. J. Appl. Soc. Psychol. 2002, 32, 665–683. [Google Scholar] [CrossRef] [Scilit]
- Kollmuss, A.; Agyeman, J. Mind the gap: Why do people act environmentally and what are the barriers to pro-environmental behavior? Environ. Educ. Res. 2002, 8, 239–260. [Google Scholar] [CrossRef] [Scilit]
- Lyu, C.; Li, X.; Yuan, P.; Song, Y.; Gao, H.; Liu, X.; Liu, R.; Yu, H. Nitrogen retention effect of riparian zones in agricultural areas: A meta-analysis. J. Clean. Prod. 2021, 315, 128143. [Google Scholar] [CrossRef] [Scilit]
- Gutberlet, J.; Carenzo, S.; Kain, J.-H.; de Azevedo, A.M.M. Waste Picker Organizations and Their Contribution to the Circular Economy: Two Case Studies from a Global South Perspective. Resources 2017, 6, 52. [Google Scholar] [CrossRef] [Scilit]
- Coletto, D.; Bisschop, L. Waste pickers in the informal economy of the Global South: Included or excluded? Int. J. Sociol. Soc. Policy 2017, 37, 280–294. [Google Scholar] [CrossRef] [Scilit]
- Dias, S.M. Waste pickers and cities. Environ. Urban. 2016, 28, 375–390. [Google Scholar] [CrossRef] [Scilit]
- Samson, M. Forcing Change Through the Polluter Pays Principle: The Waste Picker Perspective; Women in Informal Employment: Globalizing and Organizing (WIEGO): Geneva, Switzerland, 2015. [Google Scholar]

Disclaimer/Publisher’s Note: The statements, opinions and data contained in all publications are solely those of the individual author(s) and contributor(s) and not of MDPI and/or the editor(s). MDPI and/or the editor(s) disclaim responsibility for any injury to people or property resulting from any ideas, methods, instructions or products referred to in the content. |
© 2026 by the authors. Licensee MDPI, Basel, Switzerland. This article is an open access article distributed under the terms and conditions of the Creative Commons Attribution (CC BY) license.