Article

Can Government Regulation Promote the Development of Agricultural Insurance Technology? Evidence from China

College of Economics and Management, Shenyang Agricultural University, Shenyang 110866, China
*
Author to whom correspondence should be addressed.
Sustainability 2026, 18(4), 1908; https://doi.org/10.3390/su18041908
Submission received: 21 November 2025 / Revised: 2 February 2026 / Accepted: 10 February 2026 / Published: 12 February 2026

Abstract

As a core formal institutional arrangement within the agricultural insurance governance system, government regulation plays an important role in promoting the development of agricultural insurance technology (AIT). However, the role of government regulation in this domain remains insufficiently explored. Using data from 278 prefecture-level cities in China from 2012 to 2022, this study examines the impact of government regulation on the development of AIT. The results show that government regulation significantly promotes AIT development, with administrative penalties and market access playing a dominant role, while information disclosure has yet to yield a significant impact due to an underdeveloped system. Heterogeneity analysis reveals that the positive impact of government regulation on AIT development is more pronounced in major grain-producing areas and high-risk regions. Moreover, public attention, as an informal institution, reinforces the impact of government regulation on AIT development. This study extends the institutional perspective on AIT development and provides practical implications for optimizing regulatory frameworks and accelerating the digital transformation of agricultural insurance.

1. Introduction

Global agricultural insurance is undergoing a profound digital transformation. As climate risks and market uncertainties continue to intensify, the traditional operating model of agricultural insurance faces severe challenges in risk identification, actuarial pricing, and claims efficiency. Consequently, this model can no longer meet the practical demands of modern agricultural risk management [1,2]. Against the backdrop of ongoing agricultural modernization and the evolution of production systems, agricultural risks have become increasingly concentrated and complex, which in turn objectively amplifies the limitations of traditional agricultural insurance models in risk management [3]. Meanwhile, rapid advances in digital technologies, such as artificial intelligence and big data, have created new opportunities to reshape agricultural insurance operations, giving rise to a new paradigm known as agricultural insurance technology (AIT) [4]. In this study, AIT is defined as an innovative model that integrates digital technologies into the core business processes of agricultural insurance, thereby facilitating its digitalization and intelligent transformation [5,6]. Existing research suggests that AIT holds substantial potential to improve operational efficiency, enhance resilience to climate shocks, and strengthen risk management capabilities in agricultural insurance [7,8]. However, in many emerging economies, including China, the development of AIT remains limited in both depth and breadth, and its application in core business processes has yet to be fully realized [9]. Against this backdrop, identifying the driving mechanisms behind the development of AIT and accelerating the digital transformation of agricultural insurance have become critical issues requiring urgent attention.
In response to this issue, existing studies have explored the driving mechanisms underlying the development of AIT, but most have focused primarily on internal factors within agricultural insurers. Specifically, high technological investment costs and difficulties in data acquisition and sharing are widely recognized as the main constraints on the adoption of new technologies by insurers [10,11]. Despite these valuable insights, the existing studies fail to reveal the fundamental causes of the pronounced regional disparities in AIT. In fact, analyses confined to the insurer level provide only a partial understanding of the broader evolutionary logic governing the development of AIT. The compatibility between institutional environment and regulatory frameworks largely determines whether digital technologies can be effectively embedded within the agricultural insurance ecosystem [12]. Given this, relying solely on market forces is insufficient to sustain the development of AIT; rather, the external institutional environment has become a crucial driving force in shaping its evolutionary trajectory.
Within the external institutional environment, government regulation—as a key formal institutional arrangement in the governance framework of agricultural insurance—plays a crucial role in promoting technological adoption and innovation. In this study, government regulation primarily refers to coercive regulation, namely a set of binding and supervisory measures implemented by governments through legal, policy, and administrative instruments to standardize the operation of agricultural insurance markets [13]. From the perspective of institutional economics, government regulation not only helps maintain market stability but also guides agricultural insurers to develop adaptive mechanisms centered on technological advancement by setting compliance standards, reinforcing enforcement pressure, and incentivizing innovation [14,15]. In other words, government regulation can effectively transform external institutional pressures into internal innovation momentum. Moreover, informal institutional factors such as public supervision and media scrutiny may reinforce the effects of formal institutions, thereby shaping both the process and trajectory of technological diffusion [16,17]. Although previous studies have recognized the importance of government regulation, most remain at the qualitative level, lacking systematic theoretical frameworks and empirical validation. Therefore, under the condition of limited endogenous motivation within agricultural insurers, examining whether and how government regulation impacts the development of AIT is of great significance for understanding the institutional logic and policy pathways underlying the digital transformation of agricultural insurance.
Building on the above discussion, this study employs data from 278 prefecture-level cities in China from 2012 to 2022 and applies a two-way fixed-effects model and moderating-effect model to examine the impact of government regulation on AIT development. Specifically, this study seeks to answer the following questions: Does government regulation impact AIT development? Can public attention, as an informal institution, reinforce the impact of government regulation on AIT development? Compared with existing studies, this paper makes three main contributions. First, unlike existing research that primarily focuses on internal incentive factors within agricultural insurers, this paper adopts an external institutional perspective by examining the role of government regulation. It systematically reveals how government regulation impacts the development of AIT, thereby enriching the research dimensions of the driving forces behind AIT development and deepening theoretical understanding of how institutional factors shape technological innovation trajectories. Second, to address the limitations of existing studies in quantifying AIT development, this paper constructs an AIT development index using a text mining method. The index allows for a dynamic portrayal of technological diffusion and identification of regional disparities, overcoming the lack of precision and temporal sensitivity in traditional proxy indicators, while also offering a replicable and operational tool for related fields. Third, this paper further reveals the moderating mechanism. Specifically, public attention, as an informal institution, is incorporated into the analytical framework to examine its reinforcing role in the process by which government regulation impacts the development of AIT. By doing so, this study deepens the understanding of the synergistic relationship between formal and informal institutions and provides new theoretical insights and policy implications for building a pluralistic governance framework that promotes the digital transformation of agricultural insurance.
The remainder of this paper is organized as follows. Section 2 offers a theoretical analysis. Section 3 describes the research design, including model specification and indicator construction. Section 4 presents the empirical results, analyses, and robustness tests. Section 5 concludes the paper with key findings and policy implications.

2. Theoretical Hypotheses

2.1. Basic Assumption

Government regulation constitutes not only a formal institutional arrangement aimed at maintaining market order and ensuring industry stability, but also an essential exogenous force that drives technological innovation and industrial upgrading [18,19,20]. From the perspective of institutional economics, government regulation shapes the behavioral boundaries and resource allocation patterns of market entities through legal norms, policy requirements, and administrative measures [21,22]. In this institutional context, market entities are not merely passive rule followers; rather, they actively formulate adaptive strategies centered on technological innovation and organizational transformation, shaped by the interplay between institutional pressures and internal capabilities. Nevertheless, the impact of government regulation on innovation is inherently dual in nature. Regulatory stringency may dampen innovation by elevating compliance costs, resulting in a compliance cost effect [23,24], whereas well-designed regulation can induce market entities to innovate in order to compensate for these costs, leading to the innovation compensation effect [25,26].
In the agricultural insurance market, the impact of government regulation on the development of AIT primarily manifests as an innovation compensation effect, which stems from the high transaction cost structure inherent in this sector. Agricultural insurance involves a highly dispersed pool of insured entities, severe information asymmetry, and complex risk assessment, all of which contribute to persistently high transaction costs across underwriting, claims settlement, and risk identification processes [19]. As regulatory requirements and compliance standards become increasingly stringent, agricultural insurers that continue to rely on traditional, labor-intensive, and case-by-case operational models face mounting challenges. These models not only make it difficult to meet regulatory expectations for precise underwriting, transparent claims, and effective information disclosure [27,28], but also result in escalating compliance and operational costs. The cumulative effect of institutional pressure and cost constraints renders the traditional operating model unsustainable, thereby stimulating an endogenous drive toward technological innovation.
In response, these insurers are progressively adopting digital technologies—such as remote sensing imagery, geographic information systems, blockchain, and the Internet of Things—to enhance the precision and efficiency of risk identification, claims verification, and data management. Through such innovations, agricultural insurers can simultaneously reduce compliance and operational costs while meeting regulatory requirements. This adaptive mechanism, driven by technological innovation, transforms external institutional pressure into a catalyst for innovation, reshaping it from a constraining force into a driving one. Consequently, the agricultural insurance sector demonstrates a developmental pattern dominated by the innovation compensation effect. Based on this analysis, this study proposes hypothesis 1:
H1: 
Government regulation can promote the development of AIT.

2.2. Mediating Effect of Public Attention

The institutional framework comprises not only formal institutions such as laws and regulations, but also informal institutions including social norms, public opinion, and societal pressure. The latter play a critical role in compensating for the deficiencies of formal institutions and enhancing governance performance [29]. As a typical form of informal institutional constraint, public attention can amplify the overall effect of government regulation by influencing regulatory intensity and enforcement efficiency, thereby strengthening its role in resource allocation, behavioral regulation, and institutional implementation [30,31].
Within the institutional context of the agricultural insurance market, public attention reinforces the role of government regulation and magnifies the resulting innovation compensation effect primarily through two mechanisms: reducing information asymmetry and enhancing social accountability. On one hand, continuous public scrutiny of market operations and regulatory violations helps alleviate information asymmetry in policy enforcement, improving the government’s ability to identify potential risk areas and regulatory blind spots, thus increasing the precision and effectiveness of regulatory interventions [32]. On the other hand, heightened public sensitivity to misconduct and the accompanying opinion pressure strengthens social accountability, compelling governments to further intensify regulatory efforts and improve enforcement efficiency [33,34]. Under a more stringent and effective regulatory environment, agricultural insurers face greater compliance pressure and higher violation costs. To mitigate governance and reputational risks, these insurers tend to increase technological investment and accelerate digital transformation, thereby further reinforcing the innovation compensation effect induced by government regulation. Based on the above discussion, this study proposes hypothesis 2:
H2: 
Public attention positively moderates the impact of government regulation on the development of AIT.

3. Methodology

3.1. Models

3.1.1. Baseline Model

To explore the impact of government regulation on the development of AIT, this study employs a two-way fixed-effects model, which is specified as follows:
A I T i t = α 0 + δ 1 G O V i t 1 + δ 2 X i t + λ i + θ t + μ i t
where A I T i t denotes the development of AIT in city i and year t. G O V i t 1 represents government regulation in city i in year t − 1. Considering that the impact of government regulation on the development of AIT may exhibit a time lag, and to mitigate potential endogeneity issues, the variable of government regulation is lagged by one period. X i t denotes a set of control variables. α 0 is a constant term. δ 1 and δ 2 are the coefficients to be estimated for the core explanatory and control variables, respectively. λ i and θ t represent city and year fixed effects, while μ i t denotes the random error term.

3.1.2. Moderating-Effect Model

To test the moderating role of public attention in the relationship between government regulation and the development of AIT, the following model is constructed:
A I T i t = γ 0 + γ 1 G O V i t 1 + γ 2 P P i t 1 + γ 3 G O V i t 1 × P P i t 1 + γ 4 X i t + λ i + θ t + μ i t
where P P i t 1 denotes the moderating variable, which in this study refers to public attention. The definitions of all other variables are consistent with those in Equation (1).

3.2. Explained Variable

3.2.1. Explained Variable: AIT Development

Following Wan et al. [35] and Li et al. [36], this study constructs a prefecture-level index of AIT development based on AIT-related news text retrieved from the Baidu search engine. The validity of this proxy rests on two considerations. First, the development of AIT is typically manifested through observable and externally verifiable events, such as technological rollouts, business launches, and pilot programs, which are routinely documented by media outlets. In contexts where direct operational or investment data are unavailable, such media disclosures provide an informative reflection of regional progress in AIT development. Second, Baidu, as the most widely used Chinese language search engine, offers extensive coverage of publicly released information across regions [37]. Its news retrieval results therefore provide a relatively comprehensive and cross-regionally comparable information base, enabling this study to capture regional variations in AIT development with reasonable precision.
Specifically, this study first refers to the Issues Paper on the Use of Big Data Analytics in Insurance [38], the 14th Five-Year Plan for the Development of Insurance Technology [39], as well as reports from mainstream media and industry research. Using a text mining method, a total of 44 AIT-related keywords were extracted and organized (see Table 1). These keywords were selected to capture digital technologies that have been practically applied across key business stages of agricultural insurance, including pricing, underwriting, loss assessment, claims settlement, risk control, data management, and fraud detection. Subsequently, these keywords were systematically combined with the names of all prefecture-level cities to form standardized search queries in the format of “prefecture-level city name + agricultural insurance + keyword.” Web scraping techniques were subsequently employed to retrieve and aggregate the annual number of relevant news texts for each prefecture-level city. To mitigate the influence of extreme values and smooth the data distribution, the resulting indicator was transformed using the natural logarithm, yielding the final AIT development index.
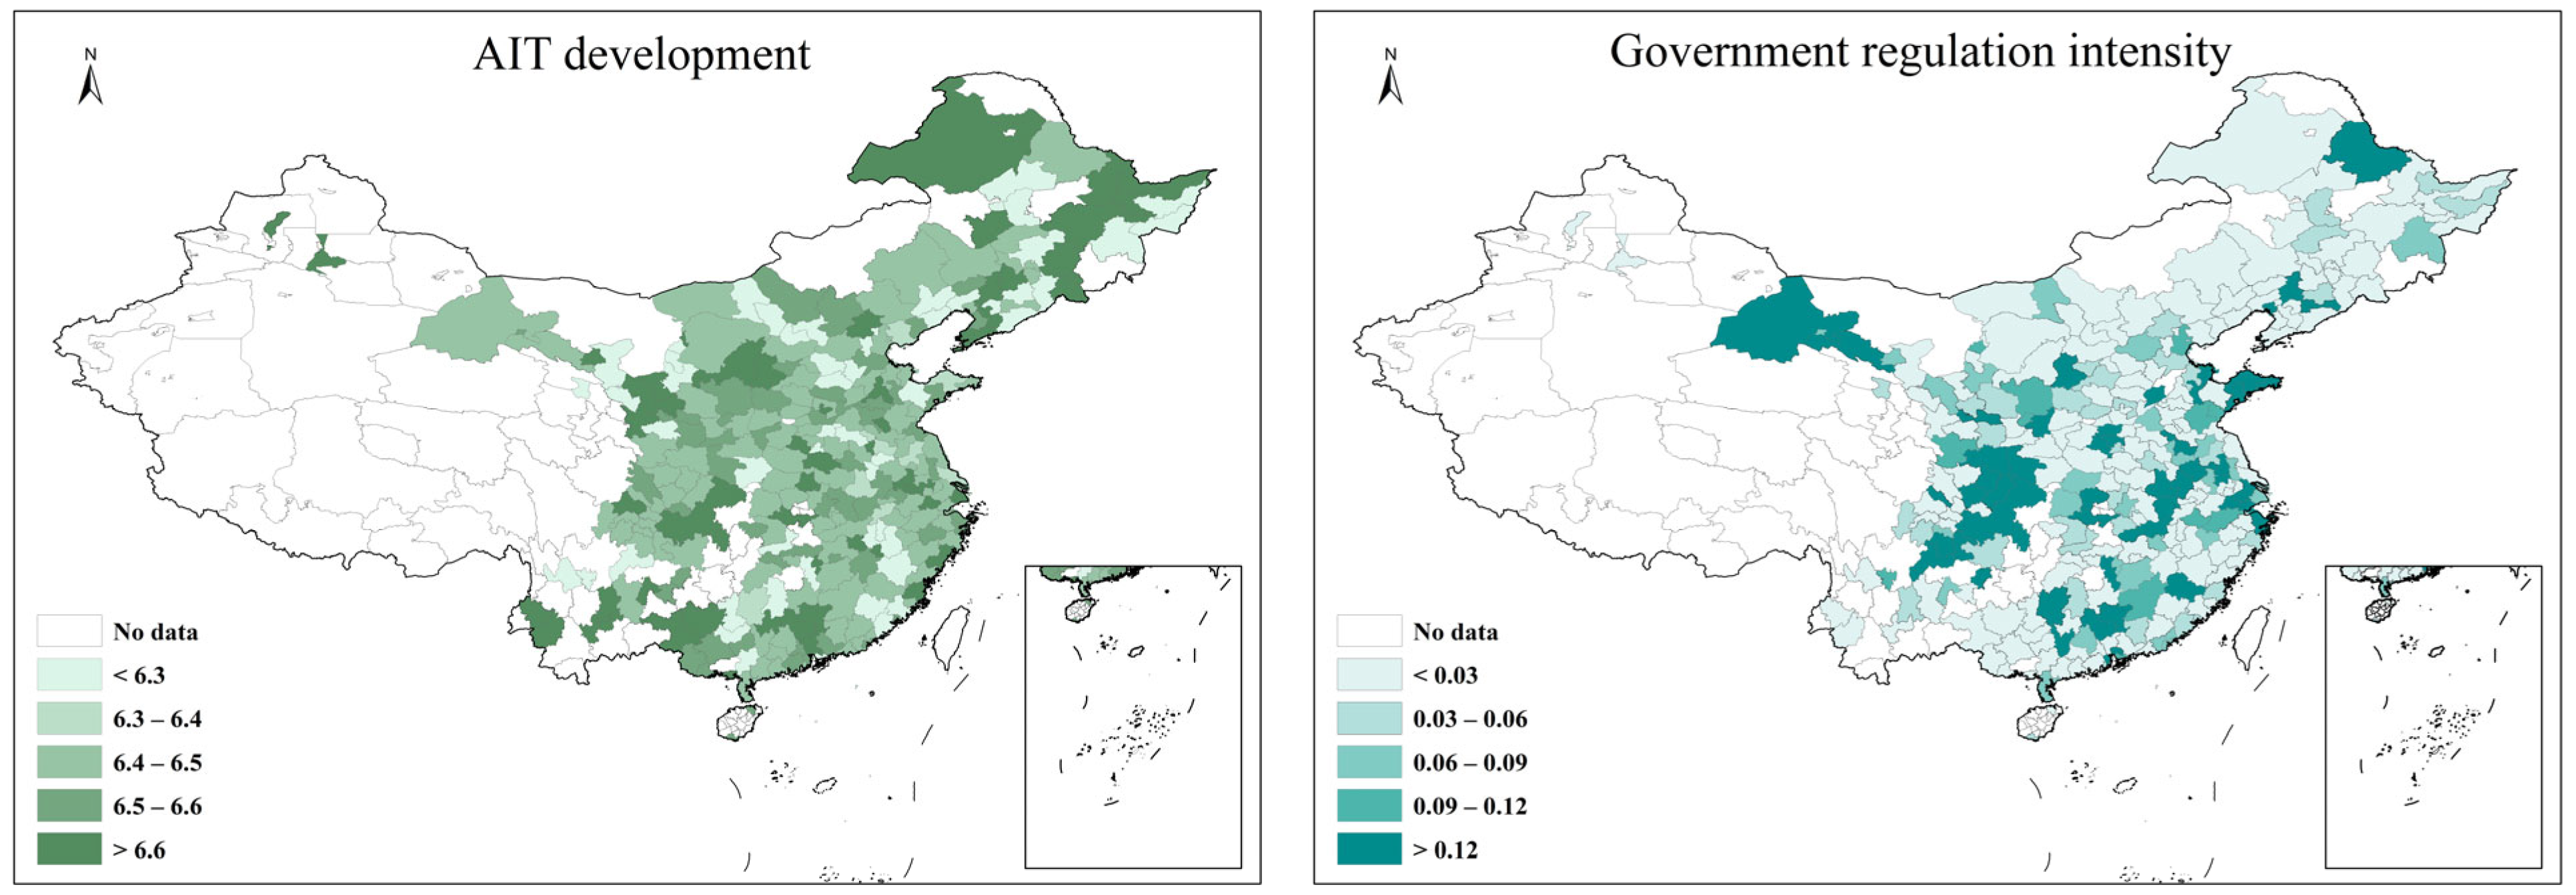
Figure 1 depicts the spatial distribution of the average level of AIT development across China from 2012 to 2022. Overall, AIT development does not display strong geographical concentration; instead, it exhibits a spatial pattern characterized by multiple dispersed centers and broad diffusion.

3.2.2. Core Explanatory Variable: Government Regulation Intensity

This study employs a policy text analysis method to measure government regulation intensity across three regulatory measures: administrative penalties, information disclosure, and market access (see Table 2). As carriers of governmental intent, regulatory instruments, and enforcement logic, policy texts provide a reliable means of capturing spatiotemporal variation in regulatory orientation and intensity [40,41]. Compared with event-based or survey-based indicators, this method offers broader coverage, greater temporal continuity, and stronger cross-regional comparability, making it suitable for analyzing dynamic regional differences in government regulation intensity.
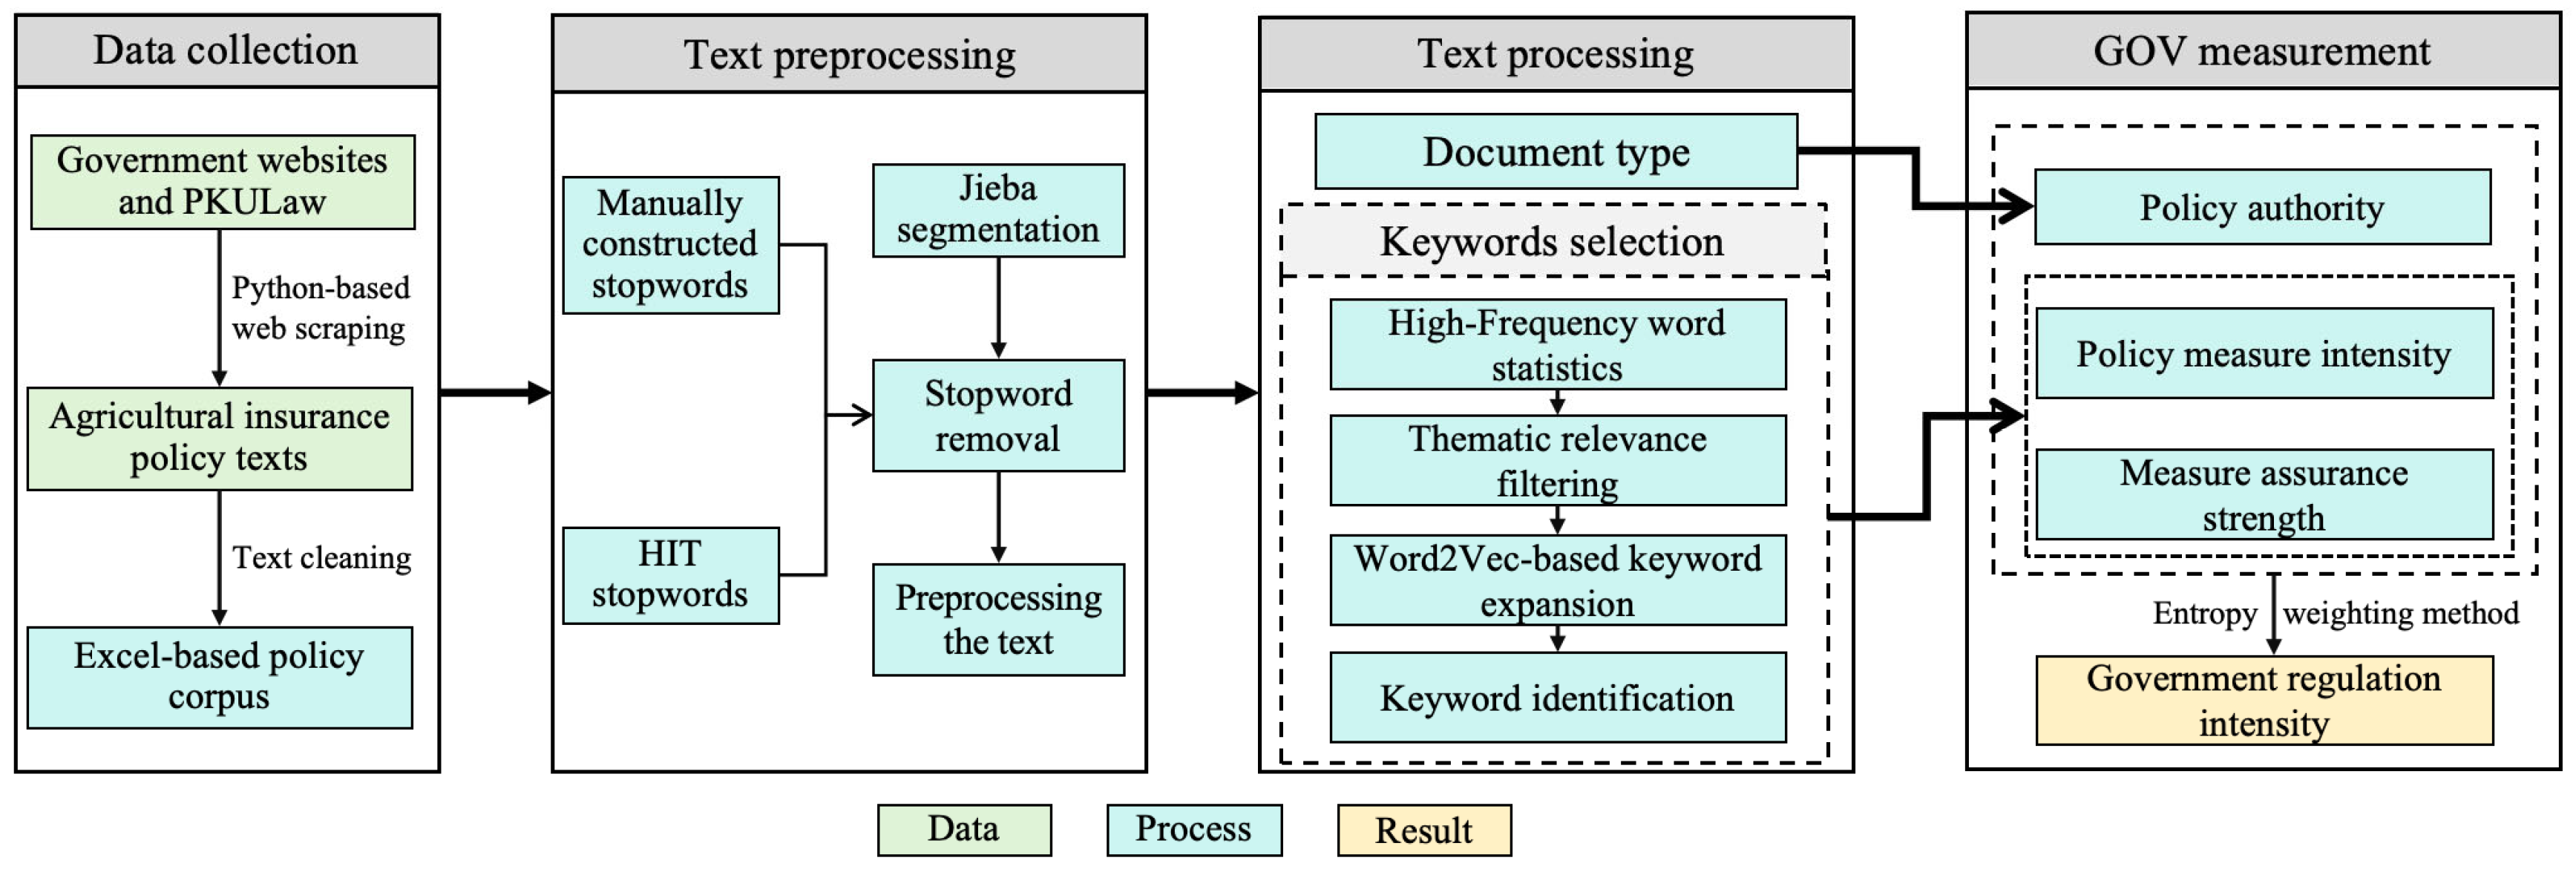
Specifically, this study employs web scraping techniques to collect policy texts related to agricultural insurance issued by prefecture-level cities across China from 2012 to 2022, resulting in a total of 5361 policy texts. Approximately 70% of these texts mainly include government news, department updates and work progress. Based on these texts, government regulation intensity is measured along three analytical dimensions: policy authority, policy measure intensity, and measure assurance strength. Policy authority reflects the substantive validity and administrative influence of each policy, with quantitative standards defined following Chong et al. [42] (see Table 3). Policy measure intensity captures the degree of governmental emphasis on specific regulatory measures and is measured by the proportion of paragraphs containing relevant keywords. Measure assurance strength reflects the comprehensiveness of regulatory content and is quantified by counting the number of relevant keywords in each policy text [43].
The keyword selection process for different regulatory measures is described as follows. Specifically, policy texts related to agricultural insurance issued by prefecture-level cities in China from 2012 to 2022 are first compiled as the text corpus and preprocessed, including stopword removal, Jieba-based word segmentation, and word frequency statistics. The terms are then ranked in descending order of frequency, and the top 500 high-frequency terms are selected as the initial pool of candidate keywords, with the aim of covering the main, substantively meaningful regulatory information contained in the policy texts. Subsequently, the candidate terms are systematically classified by incorporating policy context and applying a semantic similarity-based keyword expansion approach, thereby constructing the final keyword sets used to characterize different regulatory measures, as reported in Table A1.
Based on the above procedure, the intensity of each regulatory measure is calculated as follows:
G O V i = 1 n p o l i c y   a u t h o r i t y × p o l i c y   m e a s u r e   i n t e n s i t y × m e a s u r e   a s s u r a n c e   s t r e n g t h
In Equation (3), G O V i denotes the intensity of regulatory measure i , where i = 1 , 2 , a n d   3 correspond to administrative penalties, information disclosure, and market access, respectively. n represents the number of policy texts related to each regulatory measure i .
On this basis, given that the indicators of different government regulatory measures may differ in their numerical scales, we first standardize the indicators to ensure comparability. Subsequently, following Zhang et al. [44], the entropy weighting method is employed to assign objective weights to different regulatory measures. This method helps reduce biases arising from subjective weighting and, to some extent, alleviates information overlap among multiple indicators. Finally, a composite government regulation intensity index is constructed by taking a weighted sum of the standardized regulatory intensity indicators. The measurement process of government regulation intensity is shown in Figure 2.
Figure 1 presents the spatial distribution of the average intensity of government regulatory across China from 2012 to 2022. Overall, government regulation exhibits a highly dispersed spatial pattern, with greater concentration in the central and eastern regions, while substantial heterogeneity persists across cities.

3.2.3. Control Variables

To ensure the accuracy of the estimation results while considering data availability, this study incorporates several control variables that may affect the development of AIT. These control variables include economic development level, measured by GDP per capita (Gdp); industrial structure, measured by the ratio of the gross output value of the primary industry to regional GDP (Ind); local fiscal pressure, proxied by the ratio of agricultural insurance premium subsidies to government expenditure on agriculture, forestry, and water affairs (Fisc); educational attainment of rural residents, measured by their average years of schooling (Edu); urbanization rate, measured by the ratio of the urban resident population to the total population (Urb); agricultural insurance depth, measured by the share of agricultural insurance premium income to the value added of the primary industry (Aid); agricultural insurance density, measured by the ratio of agricultural insurance premium income to the agricultural population (Aiden); market competition intensity, measured by the Herfindahl–Hirschman Index (HHI) based on agricultural insurers’ premium income, where a higher HHI indicates lower competition; the proportion of agricultural population, measured by the ratio of rural permanent residents to total permanent population (Agripop); and internet penetration rate, measured by the ratio of broadband internet users to total permanent population (Internet).

3.2.4. Moderator Variable

Following Pan and He [45], this study measures public attention using the Baidu Index. Specifically, web scraping techniques are employed to collect daily search volume data for the keyword “agricultural insurance” from both the PC and mobile terminals of the Baidu Index platform across all prefecture-level cities. The two data series are then aggregated into annual total search volumes, which serve as an indicator of the level of public attention toward agricultural insurance in each city. To mitigate the effects of regional size differences and extreme values, the indicator is transformed using the natural logarithm.

3.3. Data Source

This study uses data from 278 prefecture-level cities in China from 2012 to 2022. The year 2012 is selected as the starting point because China’s policy-oriented agricultural insurance program, which was initiated as a pilot in 2007, had achieved full coverage across all 31 provinces (excluding Hong Kong, Macao, and Taiwan) by 2012, when the institutional framework became relatively stable. Therefore, using 2012 as the base year provides an appropriate foundation for examining the impact of government regulation on the development of AIT. The year 2022 is chosen as the endpoint of the sample period, as it represents the most recent year for which core variable data remain complete and consistent across most prefecture-level cities, ensuring the reliability of the empirical analysis.
In terms of data collection, the news text data used to measure the development of AIT were obtained from the advanced search function of Baidu News. Data on government regulation intensity were compiled from policy texts released by six major prefecture-level departments, including the People’s Government, Development and Reform Commission, Financial Bureau, Finance Bureau, Agricultural and Rural Affairs Bureau, and the National Financial Supervision Administration (formerly the China Banking and Insurance Regulatory Commission), supplemented by information from the PKULaw Database. Public attention data were derived from the Baidu Index, while other control variables were collected from the China Population and Employment Statistical Yearbook, China Insurance Yearbook, China Urban Statistical Yearbook, and prefecture-level statistical yearbooks. To address missing data in some variables, linear interpolation was applied. As a widely applied technique for handling time-series data, this method generates smooth and interpretable estimates when the proportion of missing observations is small, thereby enhancing the completeness and reliability of the dataset. Descriptive statistics of the main variables are presented in Table 4.

4. Empirical Results

4.1. Correlation Analysis

Appendix A Table A2 reports the Pearson correlation coefficients among the main variables used in this study. The results show that government regulation intensity is positively correlated with AIT development at the 1% significance level, indicating that regions with stronger government regulation tend to exhibit higher levels of AIT development. This finding provides preliminary support for Hypothesis H1. In addition, most of the control variables are significantly correlated with the explained variable, suggesting that the selected controls appropriately capture key factors associated with AIT development.
Furthermore, variance inflation factor (VIF) tests were conducted to assess potential multicollinearity among all explanatory variables. The maximum VIF value is 4.97, and the mean VIF value is 2.69, both well below the conventional threshold of 10, indicating that multicollinearity is not a serious concern in the empirical analysis.

4.2. Analysis of Baseline Regression Results

Table 5 reports the empirical results of the baseline regression specified in Equation (1). Column (1) controls only for city and year fixed effects, while Column (2) further includes additional control variables. The results show that, without the inclusion of control variables, the estimated coefficient of government regulation is 0.7038, which is statistically significant at the 5% level. When control variables are added, as shown in Column (2), the coefficient of government regulation decreases slightly to 0.6443, but remains statistically significant at the 10% level. Therefore, the null hypothesis corresponding to Hypothesis H1 cannot be rejected, indicating that the external institutional pressure and compliance constraints imposed by government regulation promote the development of AIT. Unlike previous studies suggesting that administrative intervention may inhibit innovation [46], our empirical findings demonstrate that, in the institution-intensive and policy-driven agricultural insurance sector, government regulation stimulates agricultural insurers to increase technological investment, thereby exerting a positive innovation compensation effect and promoting the development of AIT.
This study further investigates the impacts of different types of government regulation on the development of AIT. Columns (3)–(5) of Table 5 report the regression coefficients for administrative penalties ( G O V 1 ), information disclosure ( G O V 2 ), and market access ( G O V 3 ), respectively. The results indicate that administrative penalties and market access have positive impacts on AIT development, both statistically significant at the 5% level, while the positive impact of information disclosure is not significant. These findings suggest that the impacts of government regulation on the development of AIT vary significantly across regulatory measures. Administrative penalties and market access, as stronger forms of regulation, exert more direct and profound influences on the behavioral decisions of agricultural insurers. In contrast, information disclosure mainly operates by enhancing market transparency and reducing information asymmetry, making its impact more dependent on market mechanisms and the institutional environment. However, the information disclosure system in China’s agricultural insurance remains underdeveloped, limiting the full realization of its innovation compensation effect [47]. Therefore, policymakers should seek to optimize the configuration of regulatory instruments by reinforcing incentives within stringent regulations and improving information disclosure systems, thereby fostering the sustainable development of AIT.

4.3. Robustness Checks

4.3.1. Alternative Measurement of the Core Explanatory Variable

Given potential concerns regarding the accuracy of the measurement of government regulation, the original evaluation method is replaced with Entropy Weight TOPSIS method. Column (1) of Table 6 describes the results, which continue to show that government regulation significantly promotes the development of AIT, thereby further confirming the robustness of the previous conclusions.

4.3.2. Alternative Composition of the Core Explanatory Variable

To examine whether the government regulation index is sensitive to the selection of specific regulatory measures, this study further conducts a robustness check by adjusting the regulatory measures included in the index. Specifically, after excluding one regulatory dimension at a time, the entropy weight method is still applied to reassign weights to the remaining regulatory measures, and the government regulation intensity index is reconstructed and re-estimated in the regression analysis. Columns (2)–(4) of Table 6 report the regression results obtained by excluding administrative penalties, information disclosure, and market access, respectively. The results show that, after excluding any single regulatory measure, the impact of government regulation on the development of AIT remains significantly positive. This indicates that the main findings are not sensitive to the selection of regulatory measures used to construct the government regulation index, thereby confirming the robustness of the results.

4.3.3. Replacing the Explained Variable

Considering potential measurement error in the construction of AIT development, we employ three alternative measures for robustness checks.
First, we replace the log-transformed AIT development used in the baseline regressions with an alternative indicator based on the annual total number of AIT-related news texts to assess whether the results are sensitive to the logarithmic transformation.
Second, given that indicators constructed from news texts may be influenced by regional differences in media activity, we construct a relative AIT development measure by taking the ratio of the number of AIT-related Baidu news texts to the total volume of media reports. This approach helps mitigate the confounding influence of uneven media activity across regions. The total volume of media reports for prefecture-level cities is obtained from the INFOBANK Database (http://www.bjinfobank.com, accessed on 16 December 2025).
Finally, we use the logarithm of the number of financial technology (fintech) firms as an alternative proxy for AIT development, given that AIT development relies on external digital technology resources, and that insurers often promote technology adoption by procuring services from fintech firms. Therefore, this measure can capture, to some extent, the technological foundation underlying regional AIT development [48].
Table 6, columns (5)–(7), report the corresponding regression results. Across all three robustness checks using alternative explained variables, the coefficient on government regulation remains significantly positive and consistent with the baseline results. These findings indicate that the conclusions of this study are robust.

4.3.4. Excluding Municipalities

Considering that municipalities directly under the central government tend to implement stronger regulatory policies due to their developmental priorities and economic advantages, and that their agricultural insurance markets are typically more mature, their inclusion may bias the estimated effects of government regulation. Accordingly, this study re-estimates the model after excluding observations from the four municipalities. The regression results, presented in column (1) of Table 7, show that government regulation continues to exert a significantly positive impact on the development of AIT, thereby reinforcing the robustness of the baseline findings.

4.3.5. Winsorizing the Sample at the 1% Level

To mitigate the influence of extreme observations on the estimation results, all continuous variables are winsorized at the 1% level on both tails. As shown in column (2) of Table 7, government regulation continues to exert a significantly positive impact on the development of AIT. This finding is consistent with the baseline regression, indicating that the conclusions are not driven by outliers and remain robust.

4.3.6. PSM Analysis

To mitigate potential sample selection bias stemming from endogenous regional characteristics that may impact AIT, this study applies Propensity Score Matching (PSM) following Churchill et al. [49]. Specifically, the sample is divided into a high-regulation (treatment) and a low-regulation (control) group based on the median value of government regulation intensity. Using the control variables from the baseline model as covariates, individual propensity scores are estimated, and both nearest-neighbor and kernel matching are performed within the common support region to identify comparable control samples. Balance test results show that, for both matching methods, all covariates have standardized mean differences below 10%, and t-tests detect no significant differences between the treatment and control groups, satisfying the balance condition. Finally, the regressions are re-estimated using the matched samples, with the results for the nearest-neighbor and kernel matching reported in columns (3) and (4) of Table 7, respectively. The results indicate that the impact of government regulation on the development of AIT remains significantly positive, confirming the robustness of the preceding findings.

4.4. Endogeneity Test

Although the baseline regression includes a one-period lag of the core explanatory variable and multiple robustness checks have been conducted to ensure the validity of the results, potential endogeneity concerns may still exist. To further mitigate this issue, this study constructs a Bartik instrumental variable following the approach of Goldsmith-Pinkham et al. [50]. Specifically, given that the baseline model already includes a one-period lag of the core explanatory variable, the instrumental variable (Bartik_IV) is defined as the interaction between the two-period lag of local government regulation intensity and the first-difference of its national average (excluding the corresponding city). The construction of this instrument rests on two main considerations. First, the nationwide variation in government regulation intensity is unlikely to be influenced by the policy changes of any single city, and thus can be regarded as relatively exogenous to a specific locality, satisfying the exogeneity condition of the instrumental variable. Second, the two-period lag of local government regulation is expected to be strongly correlated with the one-period lag used in the baseline model, fulfilling the relevance condition required for valid instrumentation.
Column (1) of Table 8 reports the first-stage regression results, showing that the coefficient of the instrumental variable is 11.9880 and statistically significant at the 1% level, indicating a strong correlation between the instrument and the endogenous explanatory variable. Column (2) presents the second-stage estimation results, where the coefficient of government regulation remains positive and significant at the 5% level, consistent with the baseline findings. Furthermore, the LM statistic is significant at the 1% level, and the Wald F-statistic exceeds the critical value of 16.38, rejecting the null hypotheses of under-identification and weak instruments. These results confirm that the selected instrumental variable is valid and that the estimation successfully passes the endogeneity test.

4.5. Heterogeneity Analysis

Owing to China’s vast territorial scope and pronounced regional variation in agricultural functions, economic structures, and production risks, both the intensity of government regulation and its impact on the development of AIT are expected to differ across regions. To capture these spatial dynamics, heterogeneity analyses are conducted across two dimensions—grain functional zones and agricultural risk levels—with the results summarized in Table 9.

4.5.1. Heterogeneity Based on Grain Functional Zones

Under China’s food security strategy, government policy priorities and resource allocations differ significantly across various grain functional zones. Examining the heterogeneous impacts of government regulation on the development of AIT from the perspective of grain production functions is therefore essential. Following Zhou et al. [51], the sample is divided into major grain-producing areas (major GPAs) and non-major grain-producing areas (non-major GPAs) according to regional grain production needs and characteristics. As shown in columns (1) and (2) of Table 9, government regulation exerts a significantly positive impact on the development of AIT in major grain-producing areas, whereas the impact is insignificant in non-major grain-producing areas.
This result aligns with the widely recognized view that major grain-producing areas benefit from stronger policy support and resource advantages. Our findings further suggest that these advantages are reflected in higher regulatory intensity and more effective policy implementation, thereby amplifying the positive impact of government regulation on the development of AIT. This conclusion is consistent with Wang et al. [52], who found that the positive impact of fiscal support on agricultural production efficiency is mainly concentrated in major grain-producing areas, indicating that differences in institutional environment and policy supply are key determinants of policy effectiveness.

4.5.2. Heterogeneity Based on Agricultural Risk Levels

Different levels of agricultural risk may also influence government regulation intensity and its impact on the development of AIT. In this study, agricultural risk is measured by the regional grain yield reduction rate. The sample is divided into low-risk and high-risk regions according to the 50th percentile of this indicator, and separate regressions are conducted for each subsample. As reported in columns (3) and (4) of Table 9, government regulation exerts a significantly positive impact on the development of AIT in high-risk regions, while the impact is statistically insignificant in low-risk regions.
This heterogeneity arises not only from differences in regulatory intensity but also from the distinct incentive mechanisms associated with technology adoption under varying risk environments. Our data indicate that the average regulatory intensity in high-risk regions (0.0315) exceeds that in low-risk regions (0.0295). This suggests that frequent agricultural disasters and higher exposure to risks motivate local governments to implement stricter regulatory measures to safeguard production stability and prevent systemic risks.
Moreover, in high-risk regions, agricultural insurers face greater uncertainty and heavier claim burdens, making technological innovation particularly valuable for improving risk identification, precision pricing, and claims efficiency. These benefits create stronger incentives for agricultural insurers to expand technological investment under external regulatory pressure. In contrast, in low-risk regions, the lower probability of disasters and weaker compliance pressures reduce the marginal returns to technology adoption, dampening agricultural insurers’ responsiveness to regulatory signals. Consequently, the innovation compensation effect of government regulation becomes less pronounced in these regions.

4.6. Moderating-Effect Test

Table 10 reports the moderating effect of public attention. Column (1) controls only for city and year fixed effects, while column (2) further includes additional control variables. The results show that the estimated coefficient of L.GOV × L.PP is significantly positive in both specifications. Accordingly, the null hypothesis corresponding to H2 is rejected, suggesting that public attention strengthens the positive impact of government regulation on the development of AIT by mitigating information asymmetry and enhancing social accountability.
Our results demonstrate that informal institutions can complement and reinforce formal regulatory mechanisms, which is consistent with the classical proposition of institutional theory [53]. Similarly, this finding resonates with Liu et al. [54], who identify a synergy between environmental social feedback and government regulation. The results further underscore the importance of institutional complementarity in advancing the digital transformation of agricultural insurance. Enhancing the synergy between public attention and government regulation is therefore essential to improving regulatory effectiveness and fostering collaborative, multi-actor governance.

5. Conclusions and Implications

5.1. Conclusions

Using data from 278 prefecture-level cities in China from 2012 to 2022, this study employs a two-way fixed-effects model and moderating-effect model to examine the impact of government regulation on the development of AIT and its underlying mechanisms. The results indicate that government regulation significantly promotes the development of AIT. Among the different regulatory measures, administrative penalties and market access, which represent more stringent forms of regulation, play a dominant role, while information disclosure has yet to yield a significant impact due to underdeveloped institutional frameworks. Heterogeneity analysis reveals that the positive impact of government regulation on the development of AIT is more pronounced in major grain-producing areas and high-risk regions. Furthermore, mechanism analysis demonstrates that public participation reinforces the positive impact of government regulation on the development of AIT.

5.2. Policy Implications

Based on this study’s findings, our policy implications are as follows. First, the government regulatory framework should be optimized to enhance both the strength and effectiveness of implementation. The government should reinforce binding regulatory measures, such as administrative penalties and market access restrictions, by imposing stricter sanctions on non-compliant agricultural insurers and strengthening external constraints on market operations. Meanwhile, technological capability and digitalization should be incorporated into market entry requirements to guide the overall technological advancement of the agricultural insurance industry. In addition, it is essential to improve the information disclosure system and establish unified data disclosure standards. These efforts can accelerate the adoption of AIT among agricultural insurers and enhance the implementation effectiveness of government regulatory enforcement.
Second, greater attention should be paid to the regional heterogeneity of government regulation, and regulatory effectiveness should be enhanced in line with local conditions. In major grain-producing and high-risk regions, regulation intensity should be further strengthened to reinforce its innovation compensation effect and accelerate the digital transformation of the agricultural insurance market. In contrast, in non-major grain-producing and low-risk regions, a dual approach is recommended: tightening compliance standards and supervisory constraints to raise the opportunity cost of not adopting AIT, while providing incentives such as technology application subsidies and tax preferences to improve the expected returns on technological investment. These measures can jointly stimulate the innovation responsiveness of agricultural insurers and enhance the implementation efficiency of government regulation.
Third, the public participation mechanism should be strengthened to amplify the impact of government regulation on the development of AIT. The government should introduce supporting policies that encourage public participation and promote the establishment of an integrated digital platform covering all stages of agricultural insurance—including underwriting, claims, supervision, and feedback. This platform should incorporate functions such as information disclosure, feedback collection, and case tracking to improve accessibility and interaction in public participation. Moreover, enhancing the publicity of agricultural insurance policies can raise public awareness and rights consciousness, thereby motivating broader participation and strengthening the implementation effectiveness of government regulation.

5.3. Limitations and Future Research Directions

This study constructs composite indices of government regulation intensity and AIT development in prefecture-level cities in China to examine their macro-level characteristics and relationship. Although indicator construction based on policy texts and news texts has been widely adopted in the existing literature and is considered both practically feasible and reasonable, such measures remain proxy variables. As a result, they may not fully capture the actual implementation of government regulation or the underlying level of AIT development, thereby limiting the empirical identification of the relationship between the two. Future research could incorporate case studies or more granular firm-level data from insurance companies to further deepen the understanding of how government regulation influences AIT development.


Author Contributions

Conceptualization, W.Z. and F.X.; methodology, W.Z. and B.H.; software, J.F.; validation, W.Z., B.H. and F.X.; formal analysis, W.Z.; investigation, J.F. and F.X.; resources, J.F.; data curation, W.Z.; writing—original draft preparation, W.Z.; writing—review and editing, F.X.; visualization, B.H.; supervision, F.X.; project administration, W.Z. and J.F.; funding acquisition, F.X. All authors have read and agreed to the published version of the manuscript.

Funding

This work was funded by National Social Science Fund (23BJY171); General Research Project of Humanities and Social Sciences of the Ministry of Education (20YJC790149).

Institutional Review Board Statement

Not applicable.

Informed Consent Statement

Not applicable.

Data Availability Statement

The data used to support the findings of this study are available from the corresponding author upon request.

Conflicts of Interest

The authors declare no conflicts of interest that influence the work reported in this study.

Appendix A

Table A1. Keywords for government regulation measures.
Regulatory MeasuresKeywords
Administrative penaltiesGovernance, Oversight, Regulation, Standardization, Violation, Rectification, Inspection and supervision, Verification, Investigation, Audit, Penalty
Information disclosureDisclosure, Announcement, Public, Notification, Information, Online, Right to know, List, Data, Procedure, Standard, Transparency
Market accessSelection, Bidding, Winning bid, Performance, Competition, Evaluation, Assessment, Undertaking, Agency, Declaration, Application, Qualification, Approval, License
Table A2. Pearson correlation matrix and VIF statistics of main variables.
VariableAITGOVGdpIndFiscEduUrbAidAidenHHIAgripopInternet
AIT1.0000
GOV0.1008 ***1.0000
Gdp0.0416 **0.1022 ***1.0000
Ind−0.0174−0.0667 ***−0.5771 ***1.0000
Fisc−0.0499 ***0.0285−0.0632 ***0.2098 ***1.0000
Edu0.0872 ***0.0787 ***0.1915 ***−0.0495 ***0.02911.0000
Urb0.01450.0879 ***0.7358 ***−0.5298 ***0.0610 ***0.1866 ***1.0000
Aid−0.02670.0796 ***−0.0347 *0.1292 ***0.6773 ***−0.1978 ***0.1209 ***1.0000
Aiden−0.01800.0801 ***0.1374 ***0.1676 ***0.6571 ***−0.0614 ***0.3074 ***0.7981 ***1.0000
HHI−0.0810 ***−0.0487 **−0.0866 ***0.0387 **−0.2498 ***−0.0932 ***−0.0494 ***−0.2989 ***−0.3059 ***1.0000
Agripop−0.0433 **−0.0564 ***−0.4342 ***0.4273 ***−0.0530 **−0.0642 ***−0.7592 ***−0.2306 ***−0.3741 ***0.02431.0000
Internet0.0887 ***0.1703 ***0.6551 ***−0.3987 ***0.0470 **0.2720 ***0.6634 ***0.1262 ***0.2764 ***−0.1951 ***−0.4873 ***1.0000
VIF1.043.182.142.291.274.973.704.471.223.072.26
Note: ***, **, and * denote statistical significance at the 1%, 5%, and 10% levels, respectively.

References

  1. Cao, S.; Lyu, H.; Xu, X. InsurTech development: Evidence from Chinese media reports. Technol. Forecast. Soc. Change 2020, 161, 120277. [Google Scholar] [CrossRef]
  2. Duan, Y.; Yang, R.; Long, W. Research on the challenges and countermeasures for agricultural insurance to serve agricultural modernization. Res. Agric. Mod. 2025, 45, 422–433. [Google Scholar] [CrossRef]
  3. Srebro, B.; Mavrenski, B.; Bogojević Arsić, V.; Knežević, S.; Milašinović, M.; Travica, J. Bankruptcy risk prediction in ensuring the sustainable operation of agriculture companies. Sustainability 2021, 13, 7712. [Google Scholar] [CrossRef]
  4. Eling, M.; Nuessle, D.; Staubli, J. The impact of artificial intelligence along the insurance value chain and on the insurability of risks. Geneva Pap. Risk Insur. Issues Pract. 2022, 47, 205–241. [Google Scholar] [CrossRef]
  5. Puschmann, T. Fintech. Bus. Inf. Syst. Eng. 2017, 59, 69–76. [Google Scholar] [CrossRef]
  6. Cosma, S.; Rimo, G. Redefining insurance through technology: Achievements and perspectives in Insurtech. Res. Int. Bus. Financ. 2024, 70, 102301. [Google Scholar] [CrossRef]
  7. Dhakar, R.; Sehgal, V.K.; Chakraborty, D.; Sahoo, R.N.; Mukherjee, J.; Ines, A.V.; Kumar, S.N.; Shirsath, P.; Roy, S.B. Field scale spatial wheat yield forecasting system under limited field data availability by integrating crop simulation model with weather forecast and satellite remote sensing. Agric. Syst. 2022, 195, 103299. [Google Scholar] [CrossRef]
  8. Dong, Y.; Jia, C.; Su, L. The impact of digital agricultural insurance on farmers’ fertilizer reduction technology adoption: Evidence from China. China Agric. Econ. Rev. 2025, 17, 379–397. [Google Scholar] [CrossRef]
  9. Hou, D.; Wang, X. The impact of InsurTech on advancing sustainable specialty agricultural product insurance in China. Front. Sustain. Food Syst. 2024, 8, 1477773. [Google Scholar] [CrossRef]
  10. Gao, Y.; Jin, S. Corporate nature, financial technology, and corporate innovation in China. Sustainability 2022, 14, 7162. [Google Scholar] [CrossRef]
  11. Osorio, C.P.; Leucci, F.; Porrini, D. Analyzing the Relationship between agricultural AI adoption and government-subsidized insurance. Agriculture 2024, 14, 1804. [Google Scholar] [CrossRef]
  12. Herrmann, H.; Masawi, B. Three and a half decades of artificial intelligence in banking, financial services, and insurance: A systematic evolutionary review. Strateg. Change 2022, 31, 549–569. [Google Scholar] [CrossRef]
  13. Mahul, O.; Stutley, C.J. Government Support to Agricultural Insurance: Challenges and Options for Developing Countries; World Bank Publications: Washington, DC, USA, 2010. [Google Scholar]
  14. DiMaggio, P.J.; Powell, W.W. The iron cage revisited: Institutional isomorphism and collective rationality in organizational fields. Am. Sociol. Rev. 1983, 48, 147–160. [Google Scholar] [CrossRef]
  15. Oliver, C. Strategic responses to institutional processes. Acad. Manag. Rev. 1991, 16, 145–179. [Google Scholar] [CrossRef]
  16. Park, N.; Ham, J. Does public opinion shape public policy? Effect of citizen dissent on legislative outcomes. Inf. Soc. 2022, 38, 269–289. [Google Scholar] [CrossRef]
  17. Yang, Y.; Zhang, X.; Wu, T. Does Public Participation Reduce Regional Carbon Emissions? A Quasi-Natural Experiment from Environmental Information Disclosure in China. Pol. J. Environ. Stud. 2023, 32, 1899–1917. [Google Scholar] [CrossRef] [PubMed]
  18. Beerepoot, M.; Beerepoot, N. Government regulation as an impetus for innovation: Evidence from energy performance regulation in the Dutch residential building sector. Energy Policy 2007, 35, 4812–4825. [Google Scholar] [CrossRef]
  19. Cai, W.; Li, G. The drivers of eco-innovation and its impact on performance: Evidence from China. J. Clean. Prod. 2018, 176, 110–118. [Google Scholar] [CrossRef]
  20. Jiao, H.; Yang, J.; Cui, Y. Institutional pressure and open innovation: The moderating effect of digital knowledge and experience-based knowledge. J. Knowl. Manag. 2022, 26, 2499–2527. [Google Scholar] [CrossRef]
  21. North, D.C. Institutions, Institutional Change and Economic Performance; Cambridge University: Cambridge, UK, 1990. [Google Scholar]
  22. Richard, S.W. Institutions and Organizations: Ideas and Interests; Sage Publications: Los Angeles, CA, USA, 2008. [Google Scholar]
  23. Aghion, P.; Bergeaud, A.; Van Reenen, J. The impact of regulation on innovation. Am. Econ. Rev. 2023, 113, 2894–2936. [Google Scholar] [CrossRef]
  24. Breuer, M.; Leuz, C.; Vanhaverbeke, S. Reporting regulation and corporate innovation. J. Account. Econ. 2025, 80, 101769. [Google Scholar] [CrossRef]
  25. Porter, M.E.; Linde, C.V.D. Toward a new conception of the environment–competitiveness relationship. J. Econ. Perspect. 1995, 9, 97–118. [Google Scholar] [CrossRef]
  26. Zhu, D.; Zhu, H.; Arkorful, V.E. Institutional pressure and eco-innovation: The moderating role of environmental uncertainty. Sci. Technol. Soc. 2024, 29, 160–182. [Google Scholar] [CrossRef]
  27. Gupta, S.; Ghardallou, W.; Pandey, D.K.; Sahu, G.P. Artificial intelligence adoption in the insurance industry: Evidence using the technology–organization–environment framework. Res. Int. Bus. Financ. 2022, 63, 101757. [Google Scholar] [CrossRef]
  28. Patel, R.; Migliavacca, M.; Oriani, M.E. Blockchain in banking and finance: A bibliometric review. Res. Int. Bus. Financ. 2022, 62, 101718. [Google Scholar] [CrossRef]
  29. North, D.C. Institutions. J. Econ. Perspect. 1991, 5, 97–112. [Google Scholar] [CrossRef]
  30. Tao, Y.; Wang, D.; Ye, Y.; Wu, H.; Zhang, Y. The role of public environmental concern on corporate social responsibility: Evidence from search index of web users. Energy Econ. 2023, 126, 107041. [Google Scholar] [CrossRef]
  31. Yan, X. Media attention, urban environmental regulation and corporate environmental responsibility. Financ. Res. Lett. 2023, 58, 104532. [Google Scholar] [CrossRef]
  32. Li, X.; Hu, Z.; Cao, J.; Xu, X. The impact of environmental accountability on air pollution: A public attention perspective. Energy Policy 2022, 161, 112733. [Google Scholar] [CrossRef]
  33. Shen, D.; Xia, M.; Zhang, Q.; Elahi, E.; Zhou, Y.; Zhang, H. The impact of public appeals on the performance of environmental governance in China: A perspective of provincial panel data. J. Clean. Prod. 2019, 231, 290–296. [Google Scholar] [CrossRef]
  34. Chen, L.; Duan, L. Can informal environmental regulation restrain air pollution?—Evidence from media environmental coverage. J. Environ. Manag. 2025, 377, 124637. [Google Scholar] [CrossRef]
  35. Wan, S.; Lee, Y.H.; Sarma, V.J. Is Fintech good for green finance? Empirical evidence from listed banks in China. Econ. Anal. Policy 2023, 80, 1273–1291. [Google Scholar] [CrossRef]
  36. Li, X.; Ye, Y.; Liu, Z.; Tao, Y.; Jiang, J. FinTech and SME’ performance: Evidence from China. Econ. Anal. Policy 2024, 81, 670–682. [Google Scholar] [CrossRef]
  37. Gao, Y.; Li, Y.; Wang, Y. The dynamic interaction between investor attention and green security market: An empirical study based on Baidu index. China Financ. Rev. Int. 2023, 13, 79–101. [Google Scholar] [CrossRef]
  38. International Association of Insurance Supervisors (IAIS). Issues Paper on the Use of Big Data Analytics in Insurance; IAIS: Basel, Switzerland, 2020. [Google Scholar]
  39. China Insurance Association. The 14th Five-Year Plan for the Development of Insurance Technology; China Insurance Association: Beijing, China, 2021. [Google Scholar]
  40. Zhao, X.; Meng, X.; Zhou, Y.; Li, P. Policy inducement effect in energy efficiency technology: An empirical analysis of China. Energy 2020, 211, 118726. [Google Scholar] [CrossRef]
  41. Chen, J.; Li, Q.; Wang, X. Does the government’s environmental attention improve enterprise green innovation?—Evidence from China. Front. Environ. Sci. 2022, 10, 999492. [Google Scholar] [CrossRef]
  42. Chong, Z.; Wang, Q.; Wang, L. Is the photovoltaic power generation policy effective in China? A quantitative analysis of policy synergy based on text mining. Technol. Forecast. Soc. Change 2023, 195, 122770. [Google Scholar] [CrossRef]
  43. Xue, D.; Ding, Y.; Yu, L.; Deng, X. The impact of green institutional pressure from local governments on corporate innovation: An empirical evidence from foreign-invested enterprises in China. Sustainability 2023, 15, 11678. [Google Scholar] [CrossRef]
  44. Zhang, S.; Zhang, H.; Xie, F.; Wu, D. Climate change and sustainable agriculture: Assessment of climate change impact on agricultural resilience. Sustainability 2025, 17, 7376. [Google Scholar] [CrossRef]
  45. Pan, K.; He, F. Does public environmental attention improve green investment efficiency?—Based on the perspective of environmental regulation and environmental responsibility. Sustainability 2022, 14, 12861. [Google Scholar] [CrossRef]
  46. Luo, J.; Jin, X.; Hu, Y. Top-down or bottom-up? Government policies, public awareness and carbon reduction. Econ. Anal. Policy 2024, 83, 118–129. [Google Scholar] [CrossRef]
  47. Yang, R. Agricultural insurance: Theory, empirical research and experience-based on farmers household data. China Agric. Econ. Rev. 2018, 10, 173–175. [Google Scholar] [CrossRef]
  48. Braun, A.; Jia, R. InsurTech: Digital technologies in insurance. Geneva Pap. Risk Insur. Issues Pract. 2025, 50, 1–7. [Google Scholar] [CrossRef]
  49. Churchill, S.A.; Smyth, R. Energy poverty and health: Panel data evidence from Australia. Energy Econ. 2021, 97, 105219. [Google Scholar] [CrossRef]
  50. Goldsmith-Pinkham, P.; Sorkin, I.; Swift, H. Bartik instruments: What, when, why, and how. Am. Econ. Rev. 2020, 110, 2586–2624. [Google Scholar] [CrossRef]
  51. Zhou, M.; Cao, Y.; Huang, L. Digital Economy, Industrial Structure Optimization, and Agricultural Green Development Efficiency: A Double Machine Learning Causal Analysis. Aust. Econ. Pap. 2025, 9, 1–10. [Google Scholar] [CrossRef]
  52. Wang, Z.; Wu, Z.; Wei, L. Effects of fiscal support for agriculture on grain production technical efficiency: Empirical evidence from Chinese farms. J. Appl. Econ. 2024, 27, 2347687. [Google Scholar] [CrossRef]
  53. Helmke, G.; Levitsky, S. Informal Institutions and Comparative Politics: A Research Agenda; Edward Elgar Publishing: Cheltenham, UK, 2012. [Google Scholar] [CrossRef]
  54. Liu, Z.; Tang, Y.; Wilson, J.; Tao, X.L.; Lv, B.J.; Wang, Z.Y.; Xu, Y.Y.; Zhang, Z.; Zhang, Y.L.; Zhao, W. Influence of government attention on environmental quality: An analysis of 30 provinces in China. Environ. Impact Assess. Rev. 2023, 100, 107084. [Google Scholar] [CrossRef]
Figure 1. Spatial distribution of average AIT development and government regulation intensity from 2012 to 2022 in China.
Sustainability 18 01908 g001
Figure 2. Measurement process of government regulation intensity.
Sustainability 18 01908 g002
Table 1. AIT keywords.
VariablesKeywords
AITInformatization, Form Digitization, Electronization, Process Automation, Internet, Mobile Internet, Internet of Things, GIS, GPS, RS, Mobile Surveying, Self-Service Underwriting, Self-Service Claims Processing, Sensors, Image Processing Technology, Optical Technology, Meteorological Technology, Communication Technology, Mobile Applications, Multi-Source Data Fusion Technology, Satellite Communication, Map-Based Underwriting, Map-Based Claims Settlement, Map-Based Risk Control, Edge Computing, Big Data, Artificial Intelligence, Blockchain, Satellite Remote Sensing, Unmanned Aerial Vehicle, Cloud Computing, Spatial Information Management, Robotic Process Automation, Satellite Imagery, DNA Biometrics Identification Technology, 5G, Cloud Storage, Intelligent Recognition, Remote Claims Processing, Machine Learning, Smart Wearable Devices, Smart Platform, Intelligentization, Onlineization
Note: Given the cross-cutting application of digital technologies across multiple stages of agricultural insurance operations, strict classification by operational segments is difficult. Accordingly, an aggregated keyword-based approach is adopted, which does not materially affect the measurement of AIT development.
Table 2. Measurement indicators of government regulation.
Regulatory MeasuresVariable Classification and Measurement Methods
Administrative penaltiesPolicy measure intensityProportion of paragraphs containing keywords related to administrative penalties (%)
Measure assurance strengthNumber of keywords related to assessment, penalties, orders for correction, cancelation of business qualifications, etc.
Information disclosurePolicy measure intensityProportion of paragraphs containing keywords related to information disclosure (%)
Measure assurance strengthNumber of keywords related to the publicizing entity, time limits, publicizing content and methods, etc.
Market accessPolicy measure intensityProportion of paragraphs containing keywords related to market access (%)
Measure assurance strengthNumber of keywords related to applicant qualifications, announcement period, budget, assessment mechanisms, etc.
Table 3. Key criteria and scoring standards for policy authority.
Detailed Evaluation CriteriaScore
Regulations, rules, plans, measures, charters, circulars, etc., issued by municipal (district) government authorities3
Opinions, programs, notices, work reports, etc., issued by municipal (district) government authorities2
Government news, department updates, work progress, etc., issued by municipal (district) government authorities1
Table 4. Descriptive statistics of variables.
VariableNMeanSDMinMax
AIT30585.88520.88781.79186.6970
GOV30580.03050.05800.00000.3129
PP30580.05100.08710.00000.5028
Gdp30585.86763.98721.687517.1936
Ind305812.04197.29940.030049.8900
Fisc30580.32770.25770.00701.3561
Edu30582.23860.75580.43495.4896
Urb305857.666414.487317.521499.7500
Aid30580.82580.58500.03263.7450
Aiden3058105.649090.85751.1788568.0652
HHI30580.50320.29410.00001.0000
Agripop305839.448111.58356.200368.5100
Internet305826.501916.60560.347299.7344
Note: As described in the model specification section, GOV is lagged by one period. Therefore, the number of observations used in the subsequent empirical analysis is 2780, which is 278 fewer than in the descriptive statistics.
Table 5. Baseline regression results.
Variables(1)(2)(3)(4)(5)
AITAITAITAITAIT
L.GOV0.7038 **0.6443 *
(0.3457)(0.3418)
L. G O V 1 2.1462 **
(1.0394)
L. G O V 2 0.9991
(1.3829)
L. G O V 3 1.9793 **
(0.7979)
Control variablesNoYesYesYesYes
Constant5.4754 ***6.1430 ***6.1446 ***6.1613 ***6.1264 ***
(0.0277)(0.5402)(0.5404)(0.5415)(0.5397)
City fixed effectsYesYesYesYesYes
Year fixed effectsYesYesYesYesYes
Observations27802780278027802780
R20.11030.11880.11890.11800.1194
Note: L. denotes a one-period lag of the corresponding variable. ***, **, and * denote statistical significance at the 1%, 5%, and 10% levels, respectively. Robust standard errors are reported in parentheses.
Table 6. Robustness tests: alternative specifications of the core explanatory variable and the explained variable.
Variables(1)(2)(3)(4)(5)(6)(7)
AITAITAITAITAITAITAIT
L.GOV0.6578 **0.5882 *0.7124 **0.0460 *137.7964 **0.0460 *0.5426 *
(0.3309)(0.3349)(0.2983)(0.0265)(63.3717)(0.0265)(0.3006)
Control variablesYesYesYesYesYesYesYes
Constant6.1408 ***6.1432 ***6.1332 ***0.1676 ***374.0215 ***0.1676 ***−494.8064 ***
(0.5401)(0.5402)(0.5399)(0.0274)(114.2579)(0.0274)(21.3439)
City fixed effectsYesYesYesYesYesYesYes
Year fixed effectsYesYesYesYesYesYesYes
Observations2780278027802780278027802780
R20.11890.11890.11840.31250.46180.31250.6367
Note: L. denotes a one-period lag of the corresponding variable. ***, **, and * denote statistical significance at the 1%, 5%, and 10% levels, respectively. Robust standard errors are reported in parentheses.
Table 7. Robustness tests excluding municipalities, winsorizing and PSM analysis.
Variables(1)(2)(3)(4)
AITAITAITAIT
L.GOV0.6552 *0.6427 *0.5966 *0.6336 *
(0.3552)(0.3422)(0.3364)(0.3380)
Control variablesYesYesYesYes
Constant6.0949 ***6.1499 ***6.3328 ***6.2027 ***
(0.5475)(0.5415)(0.5406)(0.5312)
City fixed effectsYesYesYesYes
Year fixed effectsYesYesYesYes
Observations2740278026552773
R20.11720.11930.11490.1193
Note: L. denotes a one-period lag of the corresponding variable. *** and * denote statistical significance at the 1% and 10% levels, respectively. Robust standard errors are reported in parentheses.
Table 8. Results of endogeneity test.
Variables(1)(2)
L.GOVAIT
L.GOV10.9397 **
(4.3995)
IV11.9880 ***
(2.4880)
Control variables
Wald F-statistic23.216
LM statistic26.068 ***
Constant0.0191
(0.0266)
City fixed effectsYesYes
Year fixed effectsYesYes
Observations25022502
R2
Note: L. denotes a one-period lag of the corresponding variable. *** and ** denote statistical significance at the 1% and 5% levels, respectively. Robust standard errors are reported in parentheses.
Table 9. Results of heterogeneity analysis.
Variables(1) Major GPA(2) Non-Major GPA(3) Low-Risk(4) High-Risk
AITAITAITAIT
L.GOV0.6802 *0.10450.00431.0052 *
(0.3658)(0.6107)(0.5080)(0.6010)
Control variablesYesYesYesYes
Constant5.3824 ***5.9114 ***5.7087 ***6.3272 ***
(0.8013)(0.7058)(0.7333)(0.7392)
City fixed effectsYesYesYesYes
Year fixed effectsYesYesYesYes
Observations1660112013681412
R20.10930.18700.16500.1063
Note: L. denotes a one-period lag of the corresponding variable. *** and * denote statistical significance at the 1% and 10% levels, respectively. Robust standard errors are reported in parentheses.
Table 10. Results of moderating-effect test.
Variables(1)(2)
AITAIT
L.GOV0.43670.3817
(0.4410)(0.4400)
L.PP0.0498 *0.0540 **
(0.0261)(0.0244)
L.GOV × L.PP0.4786 *0.4573 *
(0.0335)(0.5397)
Control variablesNoYes
Constant5.4987 ***6.1794 ***
(0.0335)(0.5397)
City fixed effectsYesYes
Year fixed effectsYesYes
Observations27802780
R20.10140.1094
Note: L. denotes a one-period lag of the corresponding variable. ***, **, and * denote statistical significance at the 1%, 5%, and 10% levels, respectively. Robust standard errors are reported in parentheses.
Disclaimer/Publisher’s Note: The statements, opinions and data contained in all publications are solely those of the individual author(s) and contributor(s) and not of MDPI and/or the editor(s). MDPI and/or the editor(s) disclaim responsibility for any injury to people or property resulting from any ideas, methods, instructions or products referred to in the content.