Article

Occurrence, Composition, and Risk Assessment of Microplastics and Adsorbed Polycyclic Aromatic Hydrocarbons (PAHs) in Urban Drainage Sediments Along the Yangtze River, China

1
School of Environmental and Chemical Engineering, Shanghai University of Electric Power, Shanghai 201306, China
2
State Key Laboratory of Pollution Control and Resources Reuse, Institute of Carbon Neutrality, College of Environmental Science and Engineering, Tongji University, Shanghai 200092, China
3
Key Laboratory of Urban Water Supply, Water Saving and Water Environment Governance in the Yangtze River Delta, Ministry of Water Resources, Tongji University, Shanghai 200092, China
4
School of Civil and Environmental Engineering, Nanchang Institute of Science and Technology, Nanchang 330108, China
5
Ireland Knowledge Centre for Carbon, Climate and Community Action (IKC3), Munster Technological University, V92 CX88 Tralee, Ireland
6
Shanghai Institute of Pollution Control and Ecological Security, Shanghai 200092, China
*
Authors to whom correspondence should be addressed.
Sustainability 2026, 18(3), 1502; https://doi.org/10.3390/su18031502
Submission received: 12 November 2025 / Revised: 10 January 2026 / Accepted: 15 January 2026 / Published: 2 February 2026

Abstract

Microplastics (MPs) represent pervasive contaminants in aquatic ecosystems, acting as carriers for persistent organic pollutants like polycyclic aromatic hydrocarbons (PAHs). This study systematically investigated the occurrence, composition, and ecological risks of MPs and adsorbed polycyclic aromatic hydrocarbons in urban drainage sediments from three Yangtze River cities: Chongqing (Yongchuan), Changzhou (Jintan), and Shanghai (Tongji University campus). The key findings revealed MPs’ abundances ranging from 130 to 564 items/100 g (mean: 346 items/100 g), with peak concentrations in campus commercial areas (498.4 items/100 g) and academic zones (420 items/100 g). Predominant polymers included polypropylene (PP, 15.29%), polyethylene terephthalate (PET, 15.88%), and chlorinated polyethylene (CPE, 14.98%). Granular MPs (75–300 μm) dominated particle size (50.09%), while colored MPs (66.54%)—particularly red (32.84%) and black (27.92%)—were most prevalent. Polycyclic aromatic hydrocarbons adsorbed on MPs ranged from 0.88 to 120.59 ng/g (mean: 5.76–67.66 ng/g), dominated by four-ring compounds (44.59%). Sediment-associated polycyclic aromatic hydrocarbons ranged from 0.63 to 60.09 ng/g (mean: 2.12–36.96 ng/g), with 5–6-ring polycyclic aromatic hydrocarbons (42%) as primary constituents. Significant correlations emerged between four-ring polycyclic aromatic hydrocarbons and fibrous MPs (r = 0.33, p = 0.021) and black MPs (r = 0.23, p = 0.04). This study underscores urban drainage sediments as critical reservoirs and transport pathways for MPs and polycyclic aromatic hydrocarbons, which is crucial for sustainable management for urban drainage systems. We advocate for implementing targeted management strategies that prioritize three interconnected approaches: enhanced monitoring of high-risk zones (particularly commercial areas), focused control of small-sized MPs (<300 μm) due to their elevated ecological threats, and systematic mitigation of PAH-MP co-contamination in densely populated catchments to disrupt pollutant transmission pathways.

1. Introduction

Microplastics (MPs) represent a significant environmental challenge due to their persistence and slow degradation. These tiny particles, measuring less than 5 mm in diameter, contaminate ecosystems and enter the food chain, potentially risking both wildlife and human health [1]. They primarily form when larger plastic items break down through ultraviolet radiation and mechanical abrasion [2,3]. The widespread use of plastic across various social sectors has exacerbated this issue. In 2021, global plastic production increased to approximately 390.7 million tons [4], with China contributing about a third of this total. Rivers play a crucial role in transporting plastic debris to oceans, with estimates ranging from 1.15 to 241 thousand tons annually, with urban water systems playing a crucial role in the land-to-sea transfer of MPs [5,6].
Urban runoff is a major contributor to microplastic pollution in transporting MPs. It carries road dust, tire wear particles, and discarded plastic debris into streams and rivers [7,8]. Studies in New Jersey, USA, have revealed significantly higher concentrations of MPs in urban stormwater runoff compared to wastewater or atmospheric emissions [9]. Once in drainage systems, MPs tend to settle due to their density (>1 g/m3) and attached contaminants such as persistent organic pollutants (POPs) and heavy metals. However, intense rainfall can remobilize these particles, making drainage pipe sediments both a reservoir and a potential source of contamination [10,11]. Despite extensive research on microplastic pollution in major water bodies like oceans, rivers, and lakes, the study of MPs in drainage pipe sediments and their migration through these pipes has received limited attention, which is crucial for sustainable management.
MPs in aquatic ecosystems pose a threat when ingested by organisms, potentially causing physical harm or mortality. Their large surface area and hydrophobic nature allow them to adsorb harmful substances like polycyclic aromatic hydrocarbons (PAHs), potentially increasing their biological hazards [12,13]. Sediments, natural adsorbents of PAHs, also influence the interaction between MPs and PAHs, as demonstrated in laboratory experiments [14,15]. PAHs were chosen because they have a high level of hydrophilic affinity to MPs, they are common in urban runoff, and they have a proven carcinogenic and ecologic significance in Chinese urban watersheds [16]. While previous studies have quantified PAHs on microplastic surfaces in the environment, fewer have investigated the partitioning behavior of PAHs between sediments and MPs in natural settings [17]. The extent of microplastic pollution in drainage pipe sediments varies with human activities, climatic conditions, and seasonal changes [18]. Land-use patterns also influence this pollution, primarily originating from surface runoff [19]. Understanding the interactions between PAHs and MPs is crucial for assessing the potential for MPs to transfer pollutants and their environmental impacts on aquatic life.
To address these issues, this study sampled drainage pipe sediments from three cities along China’s Yangtze River, including areas with different land uses and a university campus. The research aimed to (1) examine the occurrence and distribution of MPs in drainage pipe sediments across various cities; (2) investigate the distribution of PAHs on sediments and MPs; and (3) assess the ecological risk posed by PAHs from sediments and MPs.

2. Materials and Methods

2.1. Sample Collection and Sites

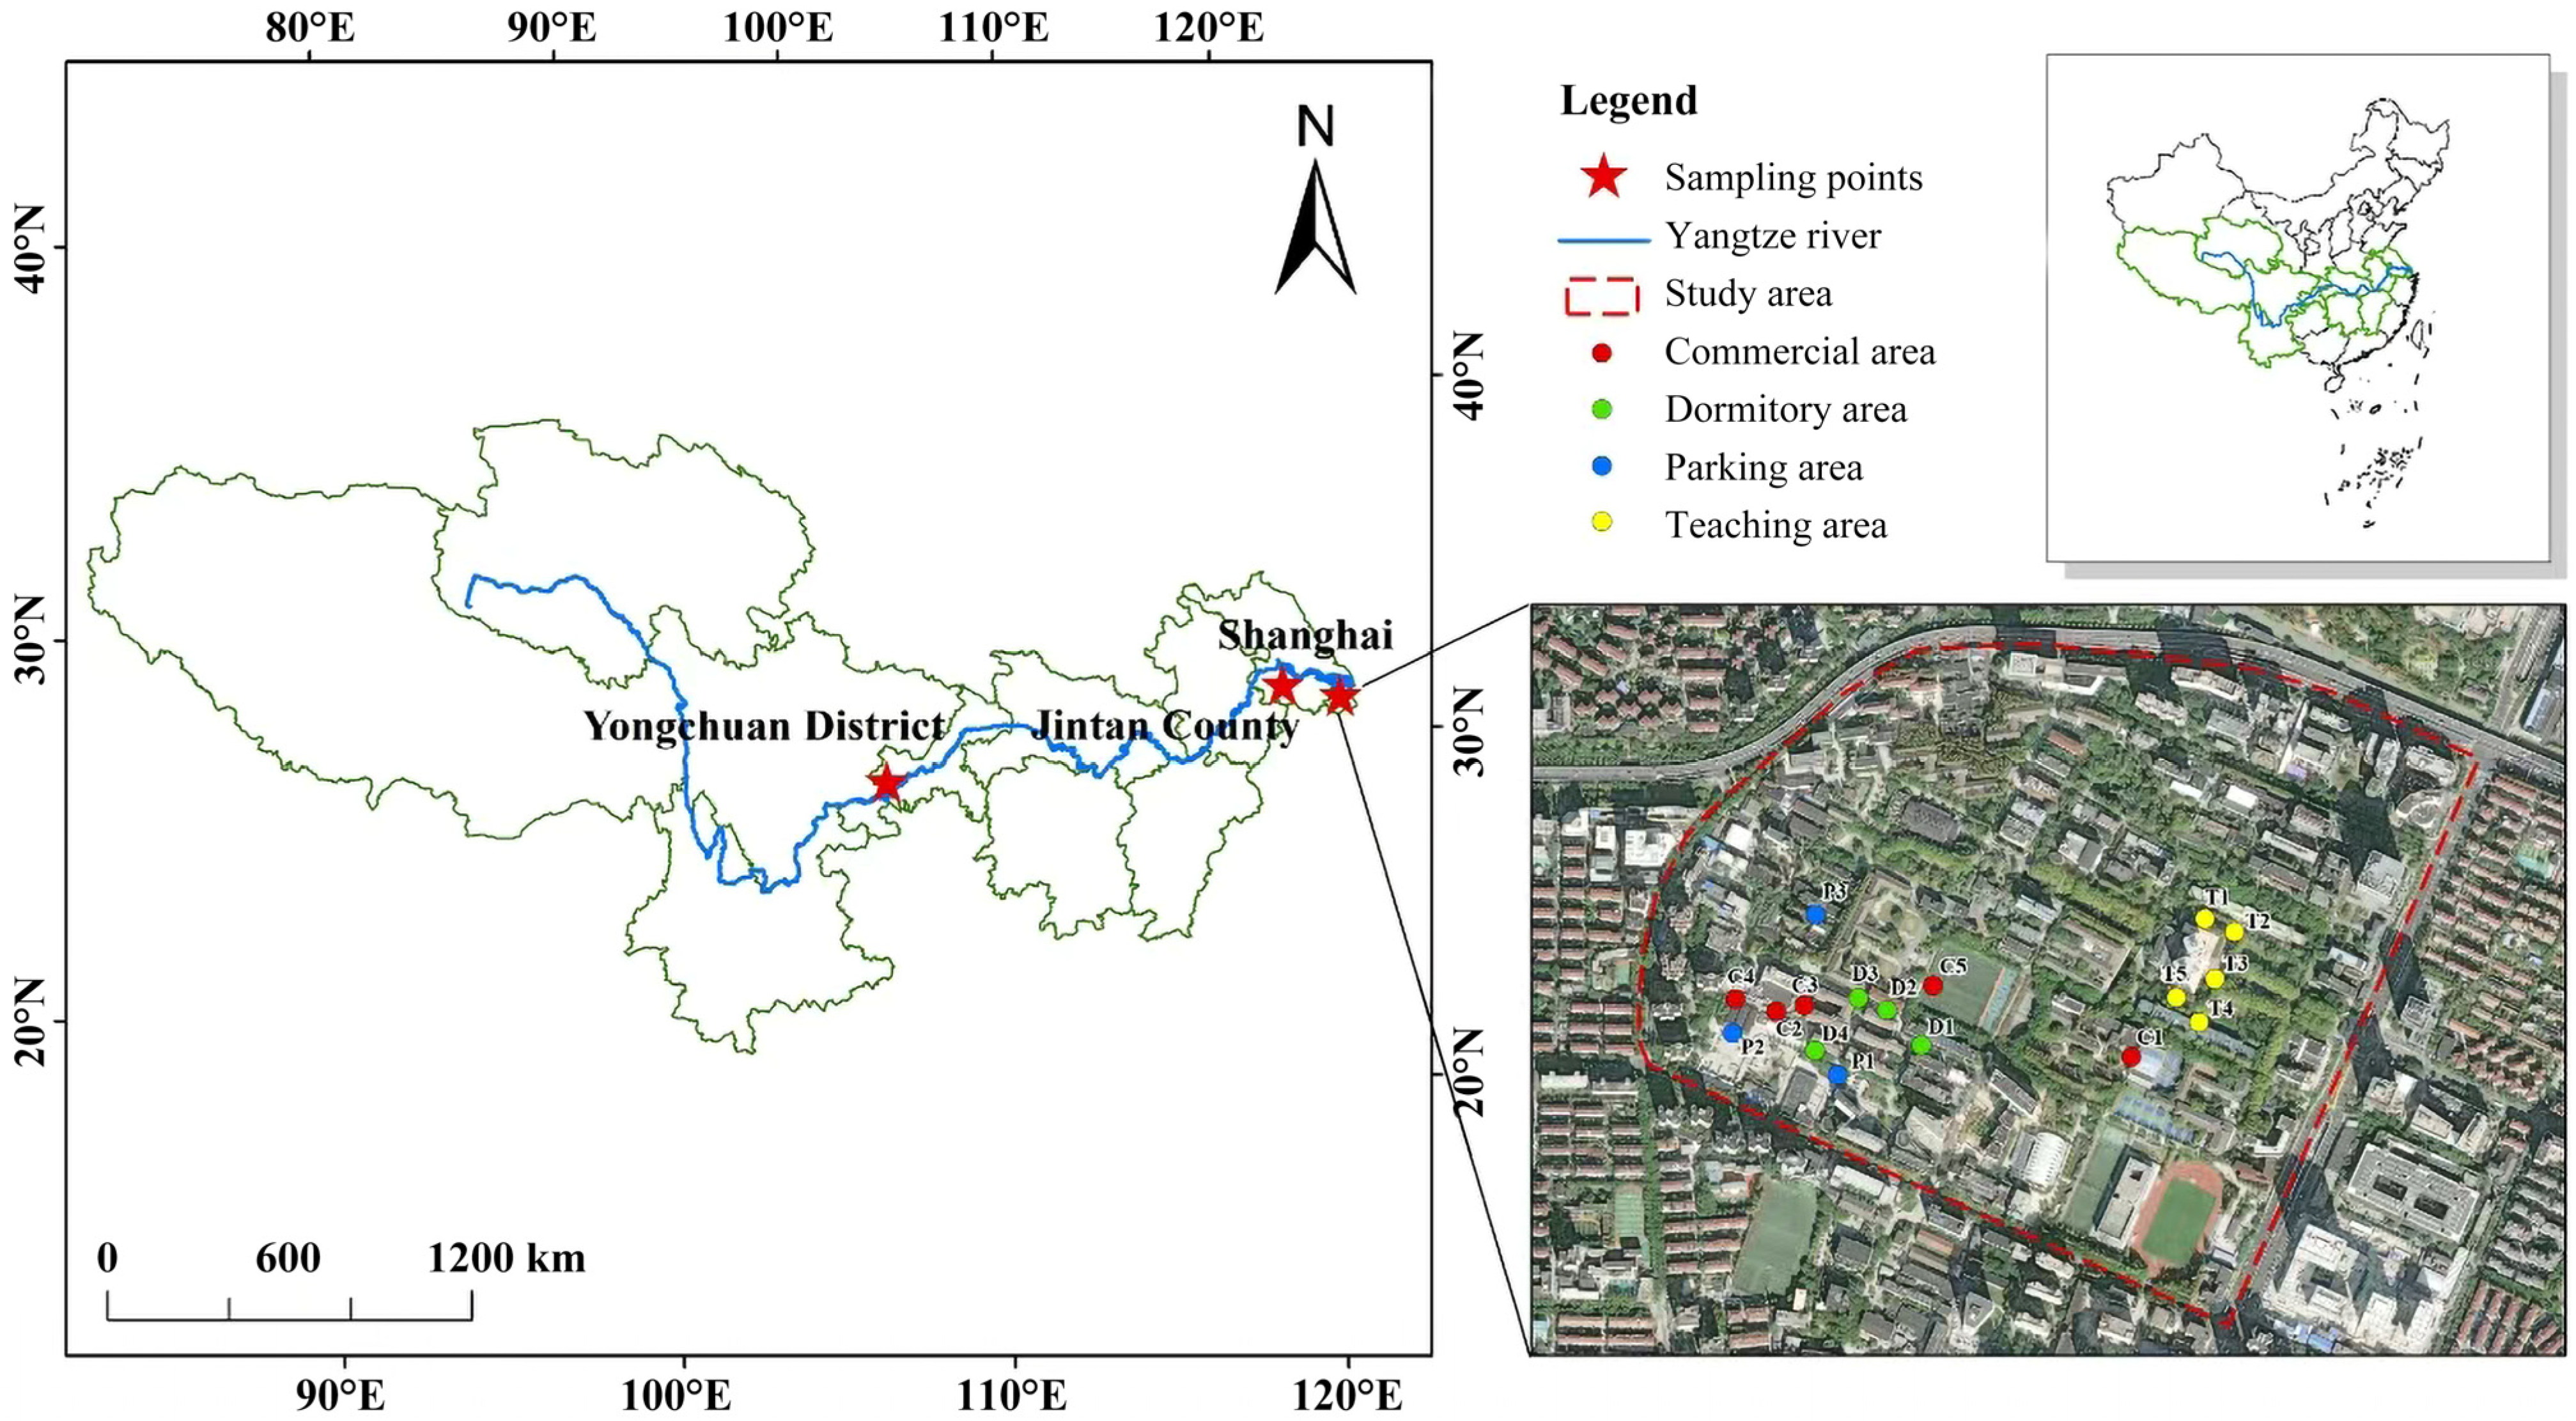
This research examines three sampling cities along the Yangtze River, from its upper to lower reaches, namely Chongqing (Yongchuan District), Changzhou (Jintan District), and Shanghai, as illustrated in Figure 1. Chongqing, in the upper reaches, serves as a crucial transportation hub. Changzhou, located in Jiangsu Province, sits at the heart of the Yangtze River Delta, forming the center of a triangle with Nanjing, Shanghai, and Hangzhou. Shanghai, at the river’s estuary, is a key part of the Yangtze River Delta’s alluvial plain.
Detailed comprehensive information for sampling in the three cities was prepared. Changzhou (Jintan District): in the old town, there were six drainage pipes (JC1–JC6) near Jinsha Bridge from the combined sewer system of sewage and rainwater; in the new town, there were two separate stormwater drainage pipes (JS1 and JS2) near Shuangxi Bridge. J stands for Jintan, C for combined sewer system, and S for separated sewer system. Chongqing (Yongchuan District): there were eight combined underdrains (YC1–YC8, YC stands for Yongchuan) at the intersection of Shengli Road and Yuxi Avenue’s western section, near Shengli River. Shanghai (Tongji University, Siping Road Campus): seventeen samples were collected across four zones including the teaching area (T1–T5), parking area (P1–P3), dormitory area (D1–D4), and commercial area (C1–C5) [20,21]. The Siping Road Campus of Tongji University is located in Shanghai’s Yangpu District, in the northeastern part of the central urban area.
Each sample was carefully extracted using a shovel, with 2–5 kg of sediments removed from stormwater wells and packed in aluminum foil self-sealing bags. All the samples were promptly transported to the Laboratory in Tongji University and refrigerated at temperatures ranging from 2 to 4 °C.

2.2. Sample Preparation and Analysis

The extraction of MPs from sediment samples was conducted using the density separation method. The internal standards were numbered as naphthalene-D8, anthracene-D10, and benzo[a]pyrene-D12 and were added to all the samples before the extraction process to allow for proper quantification. The separation was performed using chromatography on an Agilent DB-5MS UI (Agilent Technologies, Inc., Santa Clara, CA, USA) capillary column (30 m × 0.25 mm × 0.25 μm). The GC oven program was initiated at 70 °C and allowed to stay; then, it was raised after 2 min to 180 °C, which was then raised at a rate of 40 °C/min, then 230 °C at a rate of 5 °C/min, and finally 290 °C at a rate of 7 °C/min. A mass spectrometer was used in electron ionization (EI) mode at 70 eV, and the quantification of PAH was carried out in multiple reaction monitoring (MRM) mode. The calibration of the instruments was checked through the 5-point standard curves with R2 > 0.995. According to previous studies, initially, the sediment samples were desiccated in a blast dryer at 60 °C until they were completely arid. Subsequently, these dried samples underwent primary sieving through a 5 mm sieve. All abundances of microplastics in this paper are reported on a dry-weight basis. The sediment samples were dried in the oven and then stored to be counted (units/100 g dry sediment). MPs refer to plastic particles with a diameter < 5 mm. Due to the limitations of LDIR (Laser Direct Infrared Imaging), particles < 20 μm were excluded from counting. The 20 μm–5 mm range was measured in two segments: particles between 20 and 500 μm were automatically identified and counted by the LDIR system, while larger particles > 500 μm were manually counted under a polarized light microscope. The extraction process involved taking 30 g of the sieved sample and placing it in a beaker, to which 100 mL of saturated zinc chloride solution (density: 1.6 g/cm3) was added. The mixture was then stirred for 5 min to ensure homogeneity and left to stand for 24 h before the supernatant was collected. This procedure was repeated three times to ensure the extraction of all MPs from the sediments [22].
The collected supernatant was then vacuum-filtered through a 0.45 μm PTFE filter membrane and transferred to a conical flask. Chemical ablation was performed by adding 30 mL of 30% of H2O2 and allowing it to react for 24 h [23]. Post-ablation, the sample was subjected to another round of vacuum filtration. The filter membrane, now bearing the MPs, was placed in a Petri dish, covered with aluminum foil (punctured with small holes for ventilation), and dried in an oven at 60 °C. This prepared the samples for subsequent quantitative and qualitative analysis. For quantitative analysis, polarized light microscopy (Olympus-bx53m, Olympus Corporation, Tokyo, Japan) was employed. The size, color, and shape of the MPs were systematically counted. For the characterization of MPs, a Laser Infrared Imaging Spectrometer (Agilent 8700 LDIR, Agilent Technologies, Inc.) was utilized [24]. The automatic test method was set up (match > 0.65, particle size range 20–500 μm) to perform the analysis. The lower limit of the technical detection is 20 μm, which is due to the nature of the Agilent 8700 LDIR apparatus, which could not produce dependable results on particles smaller than 20 μm, so the automated analysis did not detect particles smaller than 20 μm. Qualitative analysis based on the spectral library determined the composition of the detected MP particles. The experimental procedure for detecting MPs is shown in Figure S2. Particles smaller than 75 μm (to the limit of about 20 μm) and larger than 500 μm were plotted on microscopic scales, and the LDIR system only plotted particles between the 20 and 500 μm size range. The larger fragments (>500 μm) were manually counted during polarized microscopy. This is the reason why the LDIR detection range is different with the size classes, as seen in Figure 2C.
MPs were isolated from lyophilized samples, and ethanol was used to wash away natural organic matter from their surfaces to prevent interference with the PAHs testing. The determination of PAHs on the surfaces of MPs and sediments was carried out using gas chromatography–triple quadrupole tandem mass spectrometry (Agilent 7890B-5977B, Agilent Technologies, Inc.). Samples were weighed and placed in 10 mL reaction tubes with 5 mL of toluene extraction solvent containing internal standards and then extracted in an ultrasonic water bath at 60 °C for 60 min. After filtration through a 0.22 μm filter membrane, the samples were analyzed by GC-MS (Agilent DB-5MS UI). A blank sample, prepared using quartz sand in place of the actual sample, was also analyzed following the same procedure. Naphthalene-D8, anthracene-D10, and benzo(a)pyrene-D12 served as the internal standards for quantitative testing. The samples were injected into a capillary column, with the temperature program starting at 70 °C, increasing to 180 °C at 40 °C/min, then to 230 °C at 7 °C/min, holding for 7 min, and finally to 290 °C at 5 °C/min, after which it was held for 5 min. Mass spectra were acquired in electron ionization mode at 70 eV. The lower detection threshold of microplastic identification used in this research was 20 μm, which is based on the resolution of the LDIR system.
The GC-MS/MS technique (Agilent 7890B-5977B, DB-5MS UI column) was programmed to detect all 16 U.S. EPA priority PAHs, such as naphthalene (Nap), acenaphthylene (Acy), acenaphthene (Ace), fluorene (Flu), phenanthrene (Phe), anthracene (Ant), fluoranthene (Fla), pyrene (Pyr), and benz[a]anthracene (B the whole set of EPA-registered PAHs are covered by the range of detection of this protocol (Figure S1 chromatogram)).
An illustrative GC-MS/MS chromatogram of the 16 PAHs separation and detection is shown in Figure S1. Signal-to-noise ratios of 3 and 10 were used to determine the limits of detection (LOD) and limits of quantification (LOQ) of individual analytes of PAH, and these limits are reported in Table 1. All the PAH and microplastic concentrations in this work are given on a dry-weight basis to facilitate consistency with the prior literature.

2.3. Risk Assessment of PAHs with Toxic Equivalent Method

The total toxic equivalency quotient (TEQ) of PAHs was calculated using the following equation. The toxicity of benzo(a)pyrene (BaP) was used as a criterion to assess the toxicity of other PAHs [25,26],
B E Q i = C i × T E F i
T E Q   ( T O X I C   E Q U I V A L E N T   Q U A N T I T Y ) = C i × T E F i
where B E Q i is the toxic equivalence (ng·g−1) of monomer PAHs, T E F i is the toxic equivalence factor of monomer PAHs, C i is the concentration of the monomer PAHs, and the TEQ (toxic equivalent quantity) is the total toxic equivalence of 16 (PAHs) based on BaP [27].

2.4. Statistical Analysis

MP and PAH mental text correlation analysis was carried out using R language (Version 4.1.1), and redundancy analysis (RDA) was used to expose the correlation between environmental factors and PAHs using Canoco5 software (Version 5.15). The measurements were taken in terms of sediment TN (total nitrogen), TP (total phosphorus), TOC (total organic carbon), and pH with standard Hach protocols. TN was assessed through alkaline persulfate digestion, TP through molybdate colorimetry, TOC through the TOC-L analyzer, and pH through the calibrated glass electrode.

3. Results and Discussion

3.1. Distribution of Microplastics in Drainage Pipe Sediments

3.1.1. Abundance of Microplastics in Sediment Samples

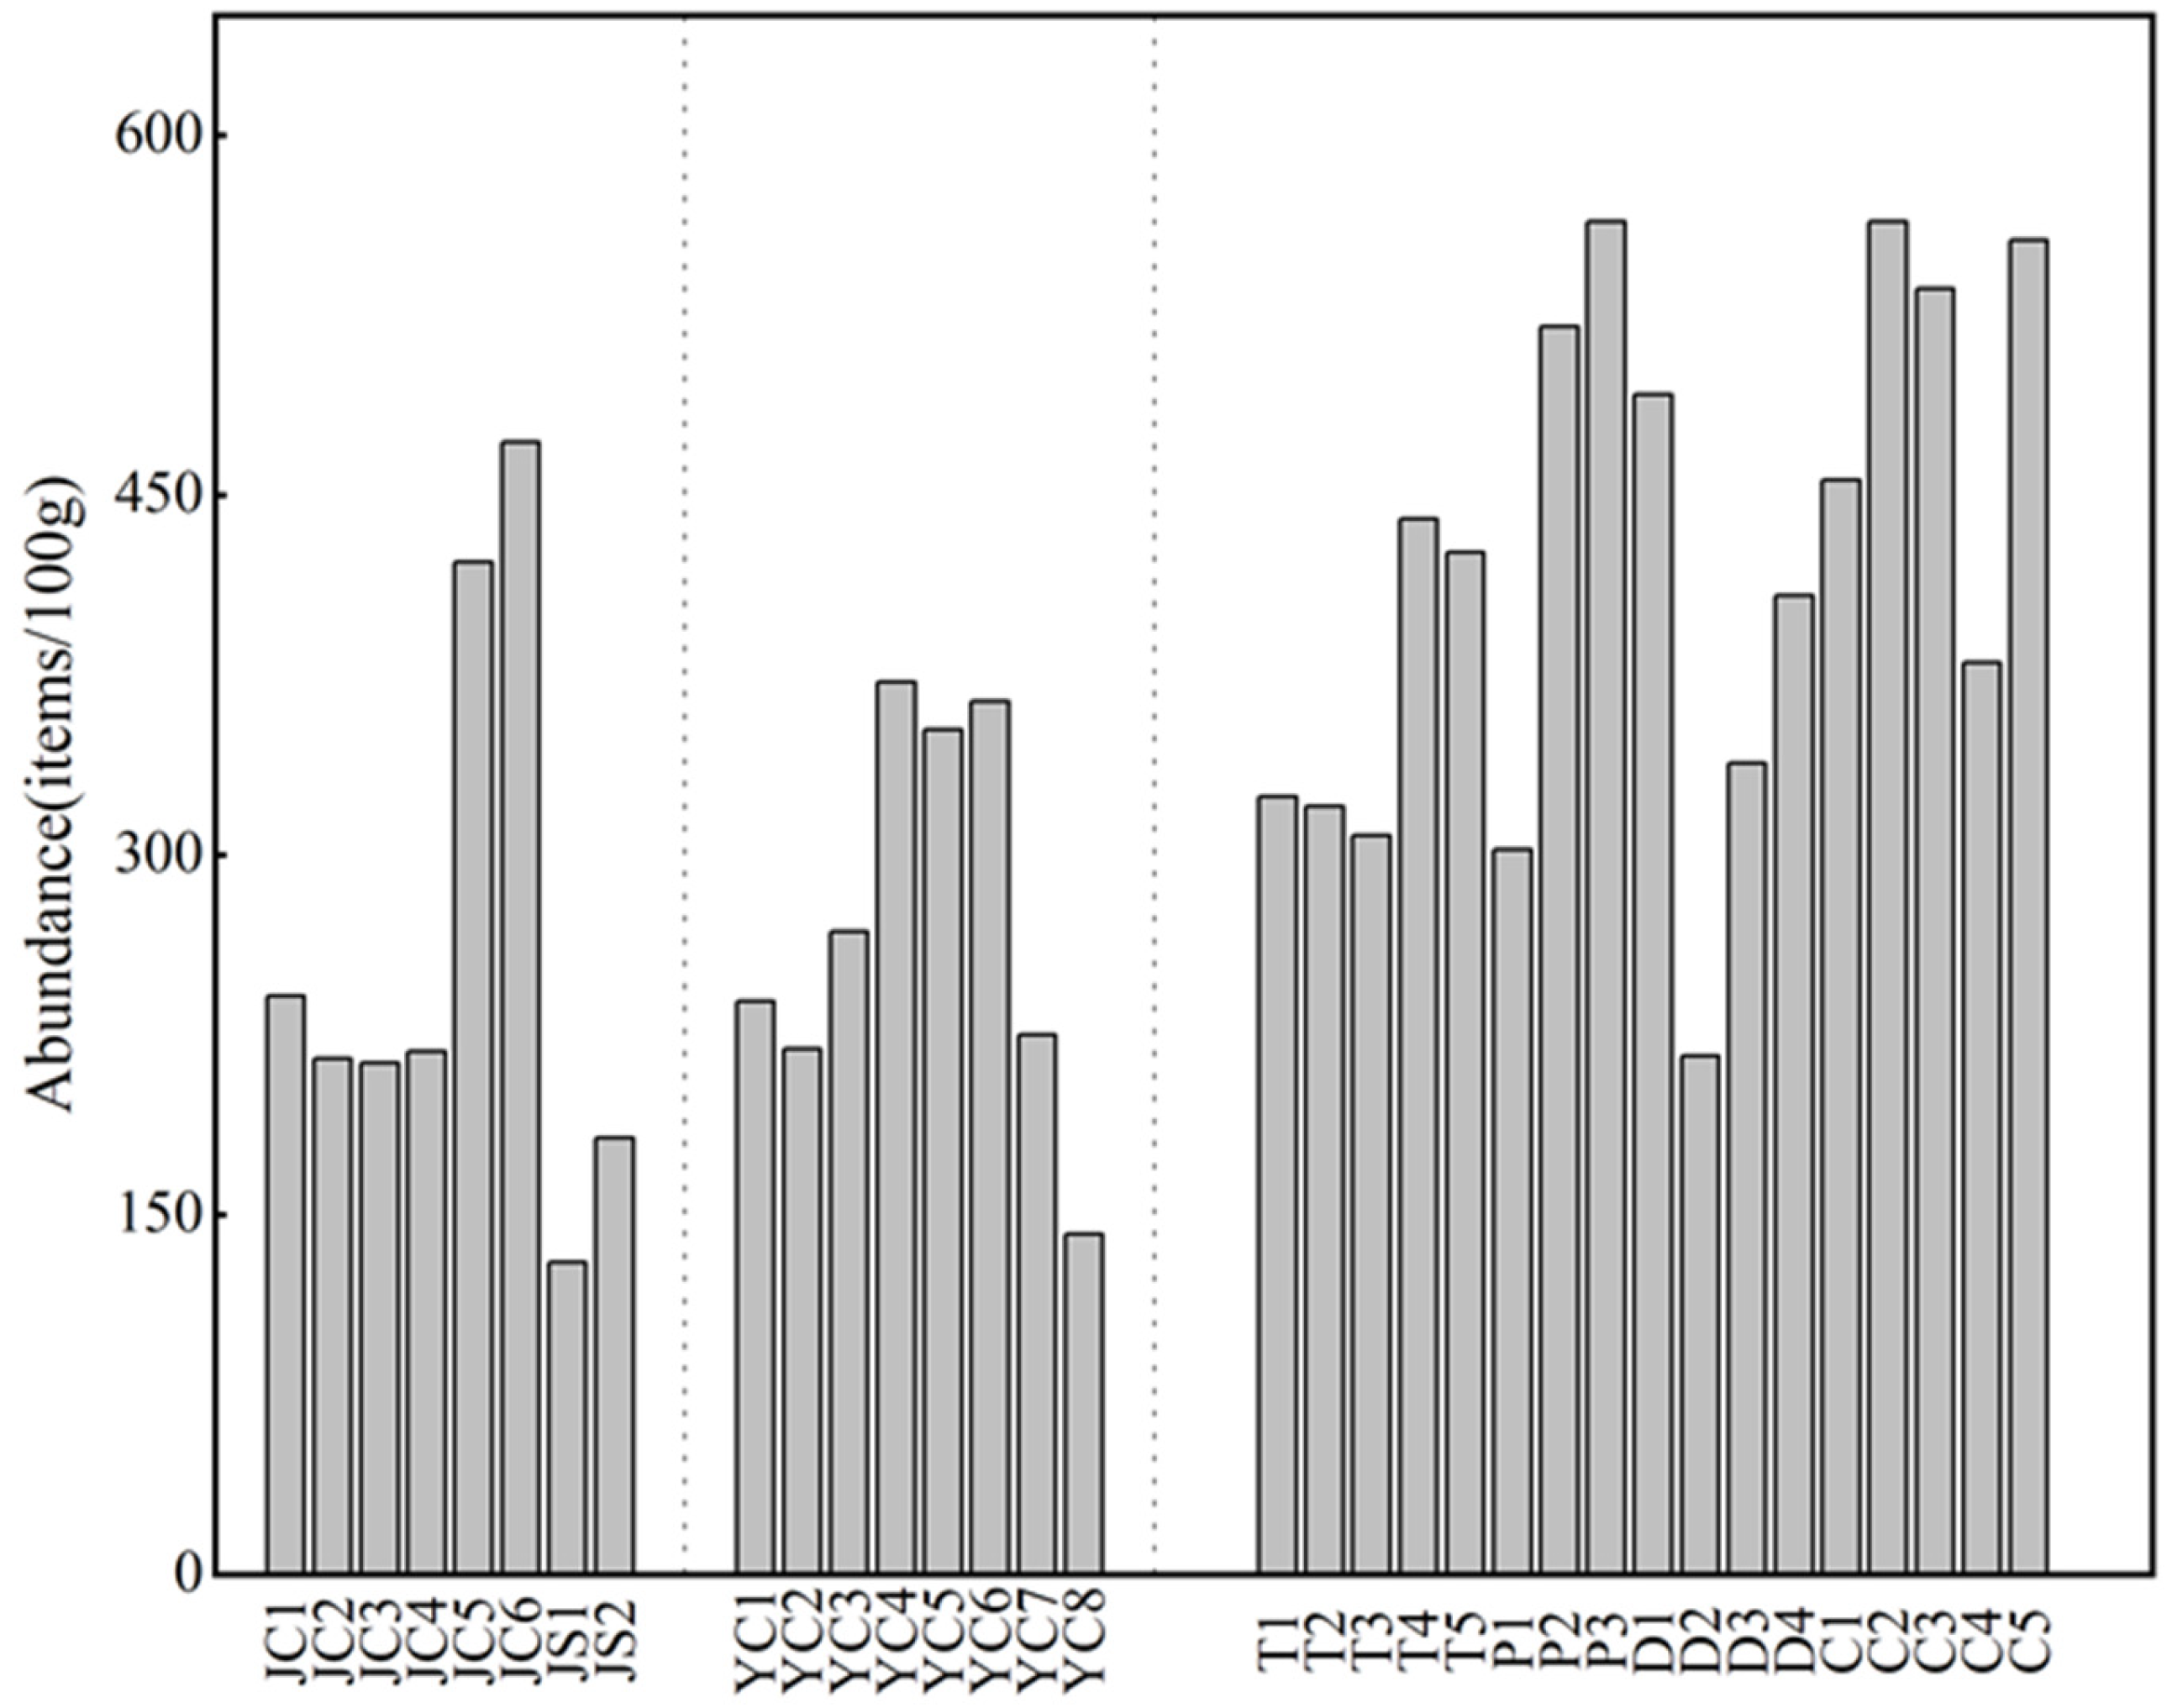
MPs were detected in all sediment samples analyzed in this study. All abundances reported herein are on a dry-weight basis. Figure 3 presents the number of MPs found in 33 samples from drainage pipes. Nguyen et al. measured MPs over a wide size range of up to several millimeters; they did not limit their results to the 20–500 μm size range, indicating that their dataset contained smaller particles below 20 μm in diameter and larger particles that were out of the bounds of the automated mode of LDIR in our experiment. This difference in methodology is one of the reasons why their claimed 5 × 10³–178 × 103 items/kg and our 130–564 items/100 g differ in terms of order of magnitude [28].
The highest concentration of MPs was observed in samples collected within a campus area, averaging 420 items/100 g. This could be attributed to the high population density and level of human activities, such as the use of merchandise packaging bags and clothing washing, which are known sources of MPs. The previous literatures also reported that microplastic abundance was positively correlated with population density [29]. In Jintan District, the sampling points JS1 and JS2, which are stormwater pipes separated from a sewage pipe, exhibited the lowest microplastic concentrations at 130 and 182 items/100 g, respectively. This is likely because they primarily collect MPs from surface runoff.
The commercial area on the campus showed the highest average microplastic concentration at 498.4 items/100 g, likely due to the high population density and traffic in the area. Urban drain sediments are a significant source of MPs in rivers and lakes. During rainfall, these MPs are washed from drain sediments into natural water bodies. Zhou et al. demonstrated that sewer overflow discharges during heavy rainfall can significantly increase microplastic abundance in water bodies, reaching up to 83.1 ± 40.2 items/L. They identified sewer sediment flushing and surface runoff as the primary contamination sources, estimating an annual microplastic discharge load from the drainage system at 5.83 × 10¹⁰ items/km2, with wet weather discharge accounting for approximately 60% [30]. Thus, urban drains are a critical pathway for the migration of MPs in urban environments.

3.1.2. Characterization of Microplastics in Morphological and Polymer Types

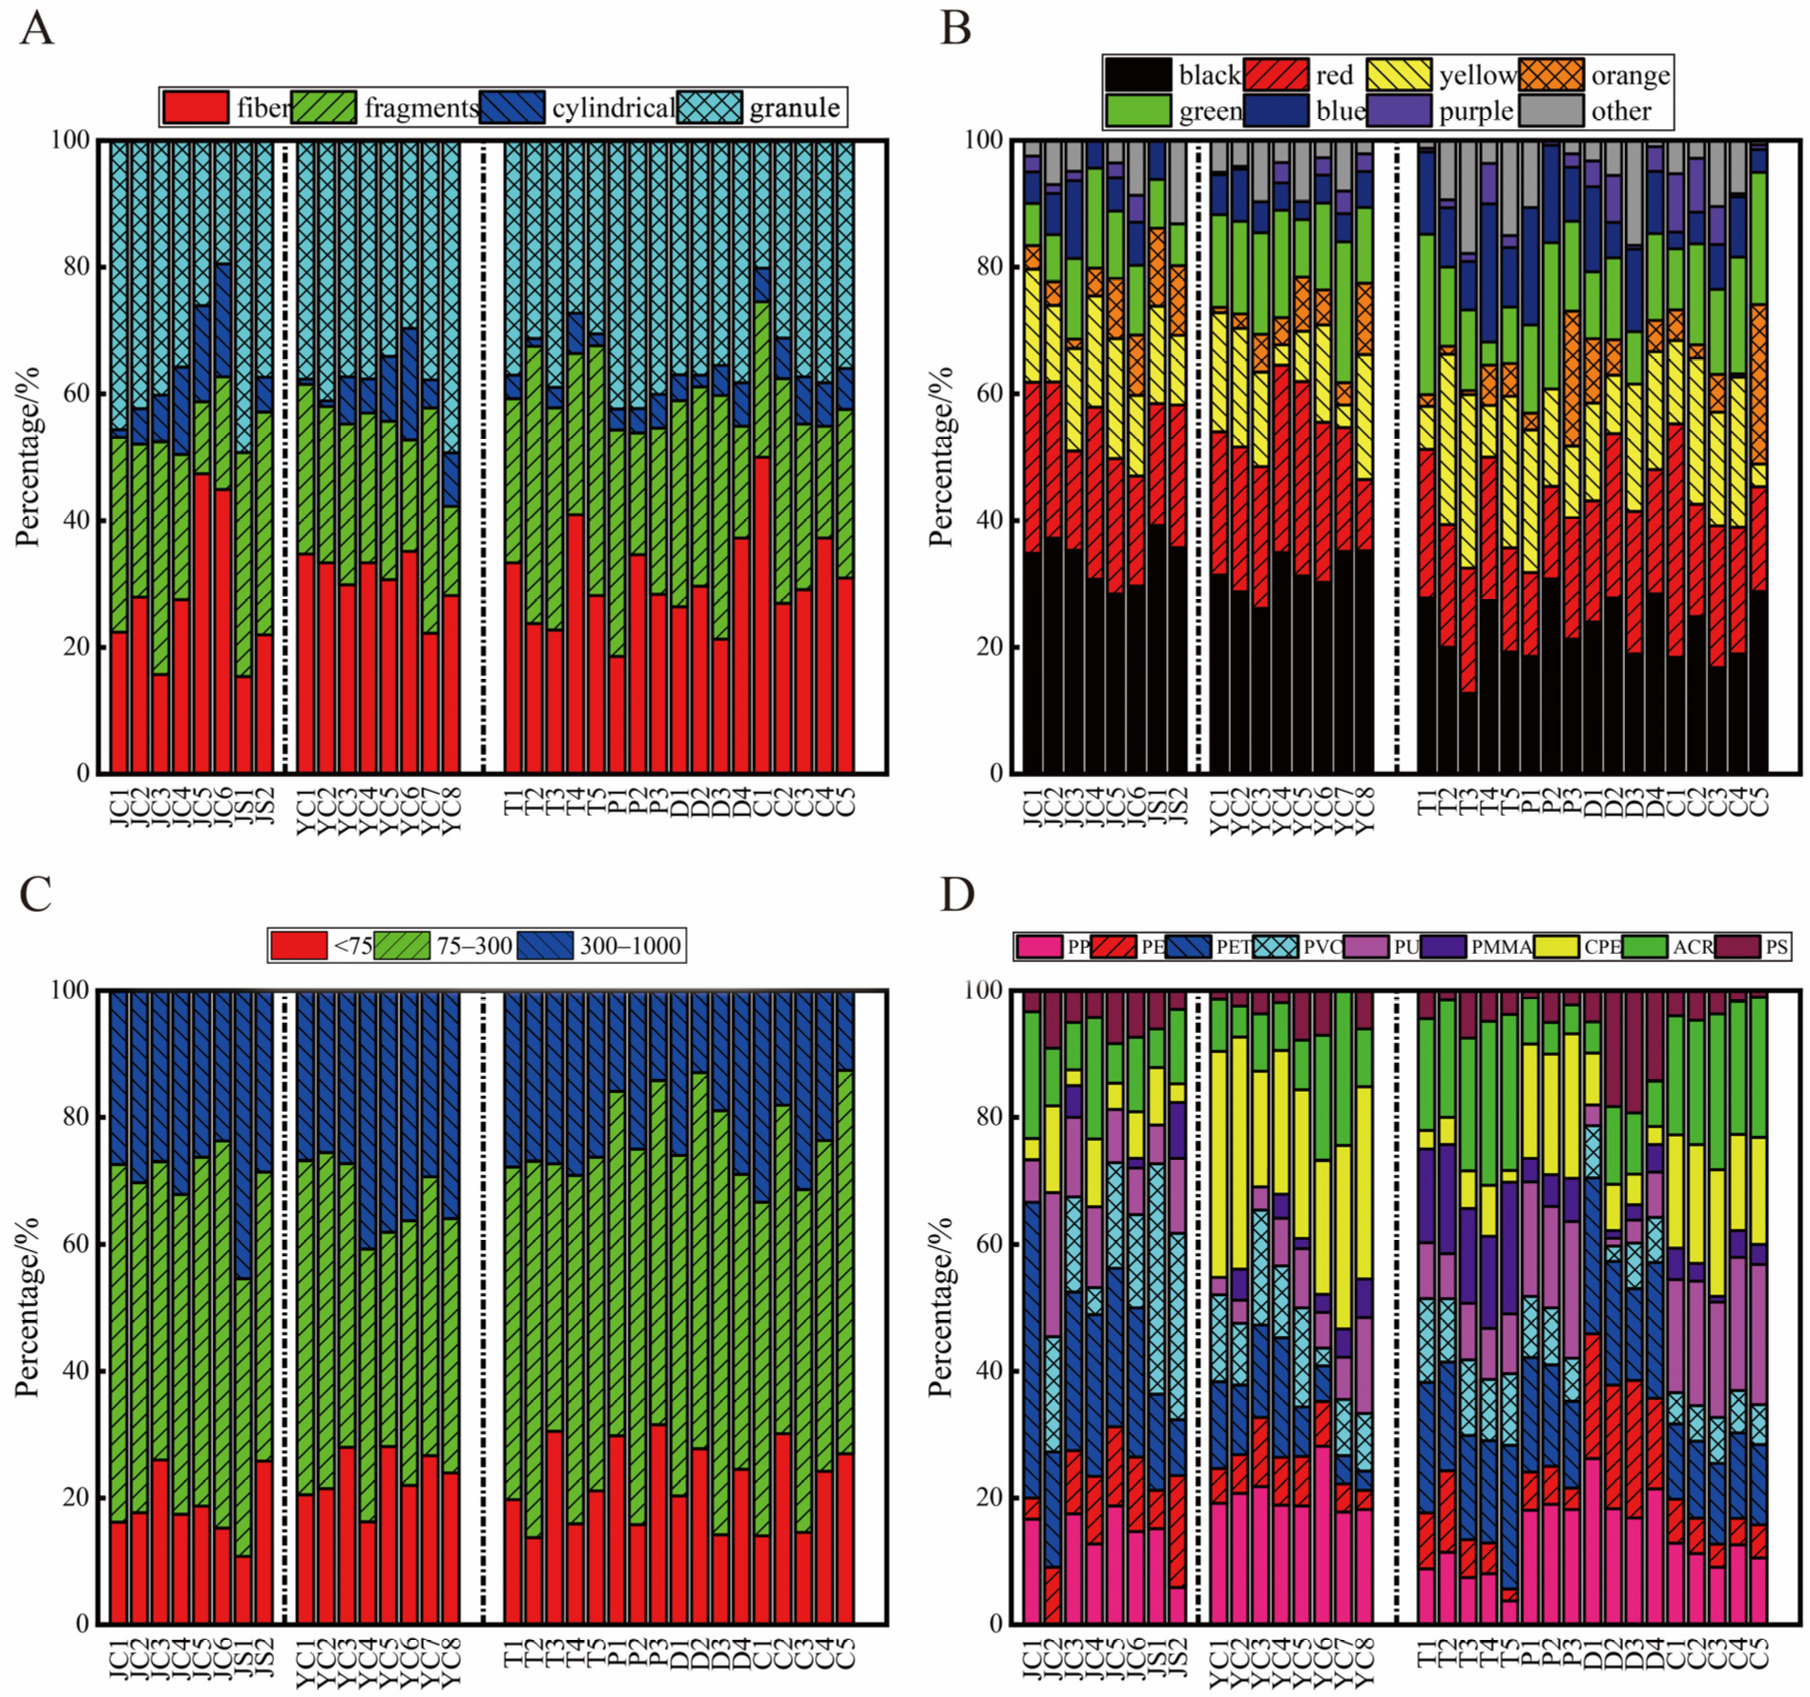
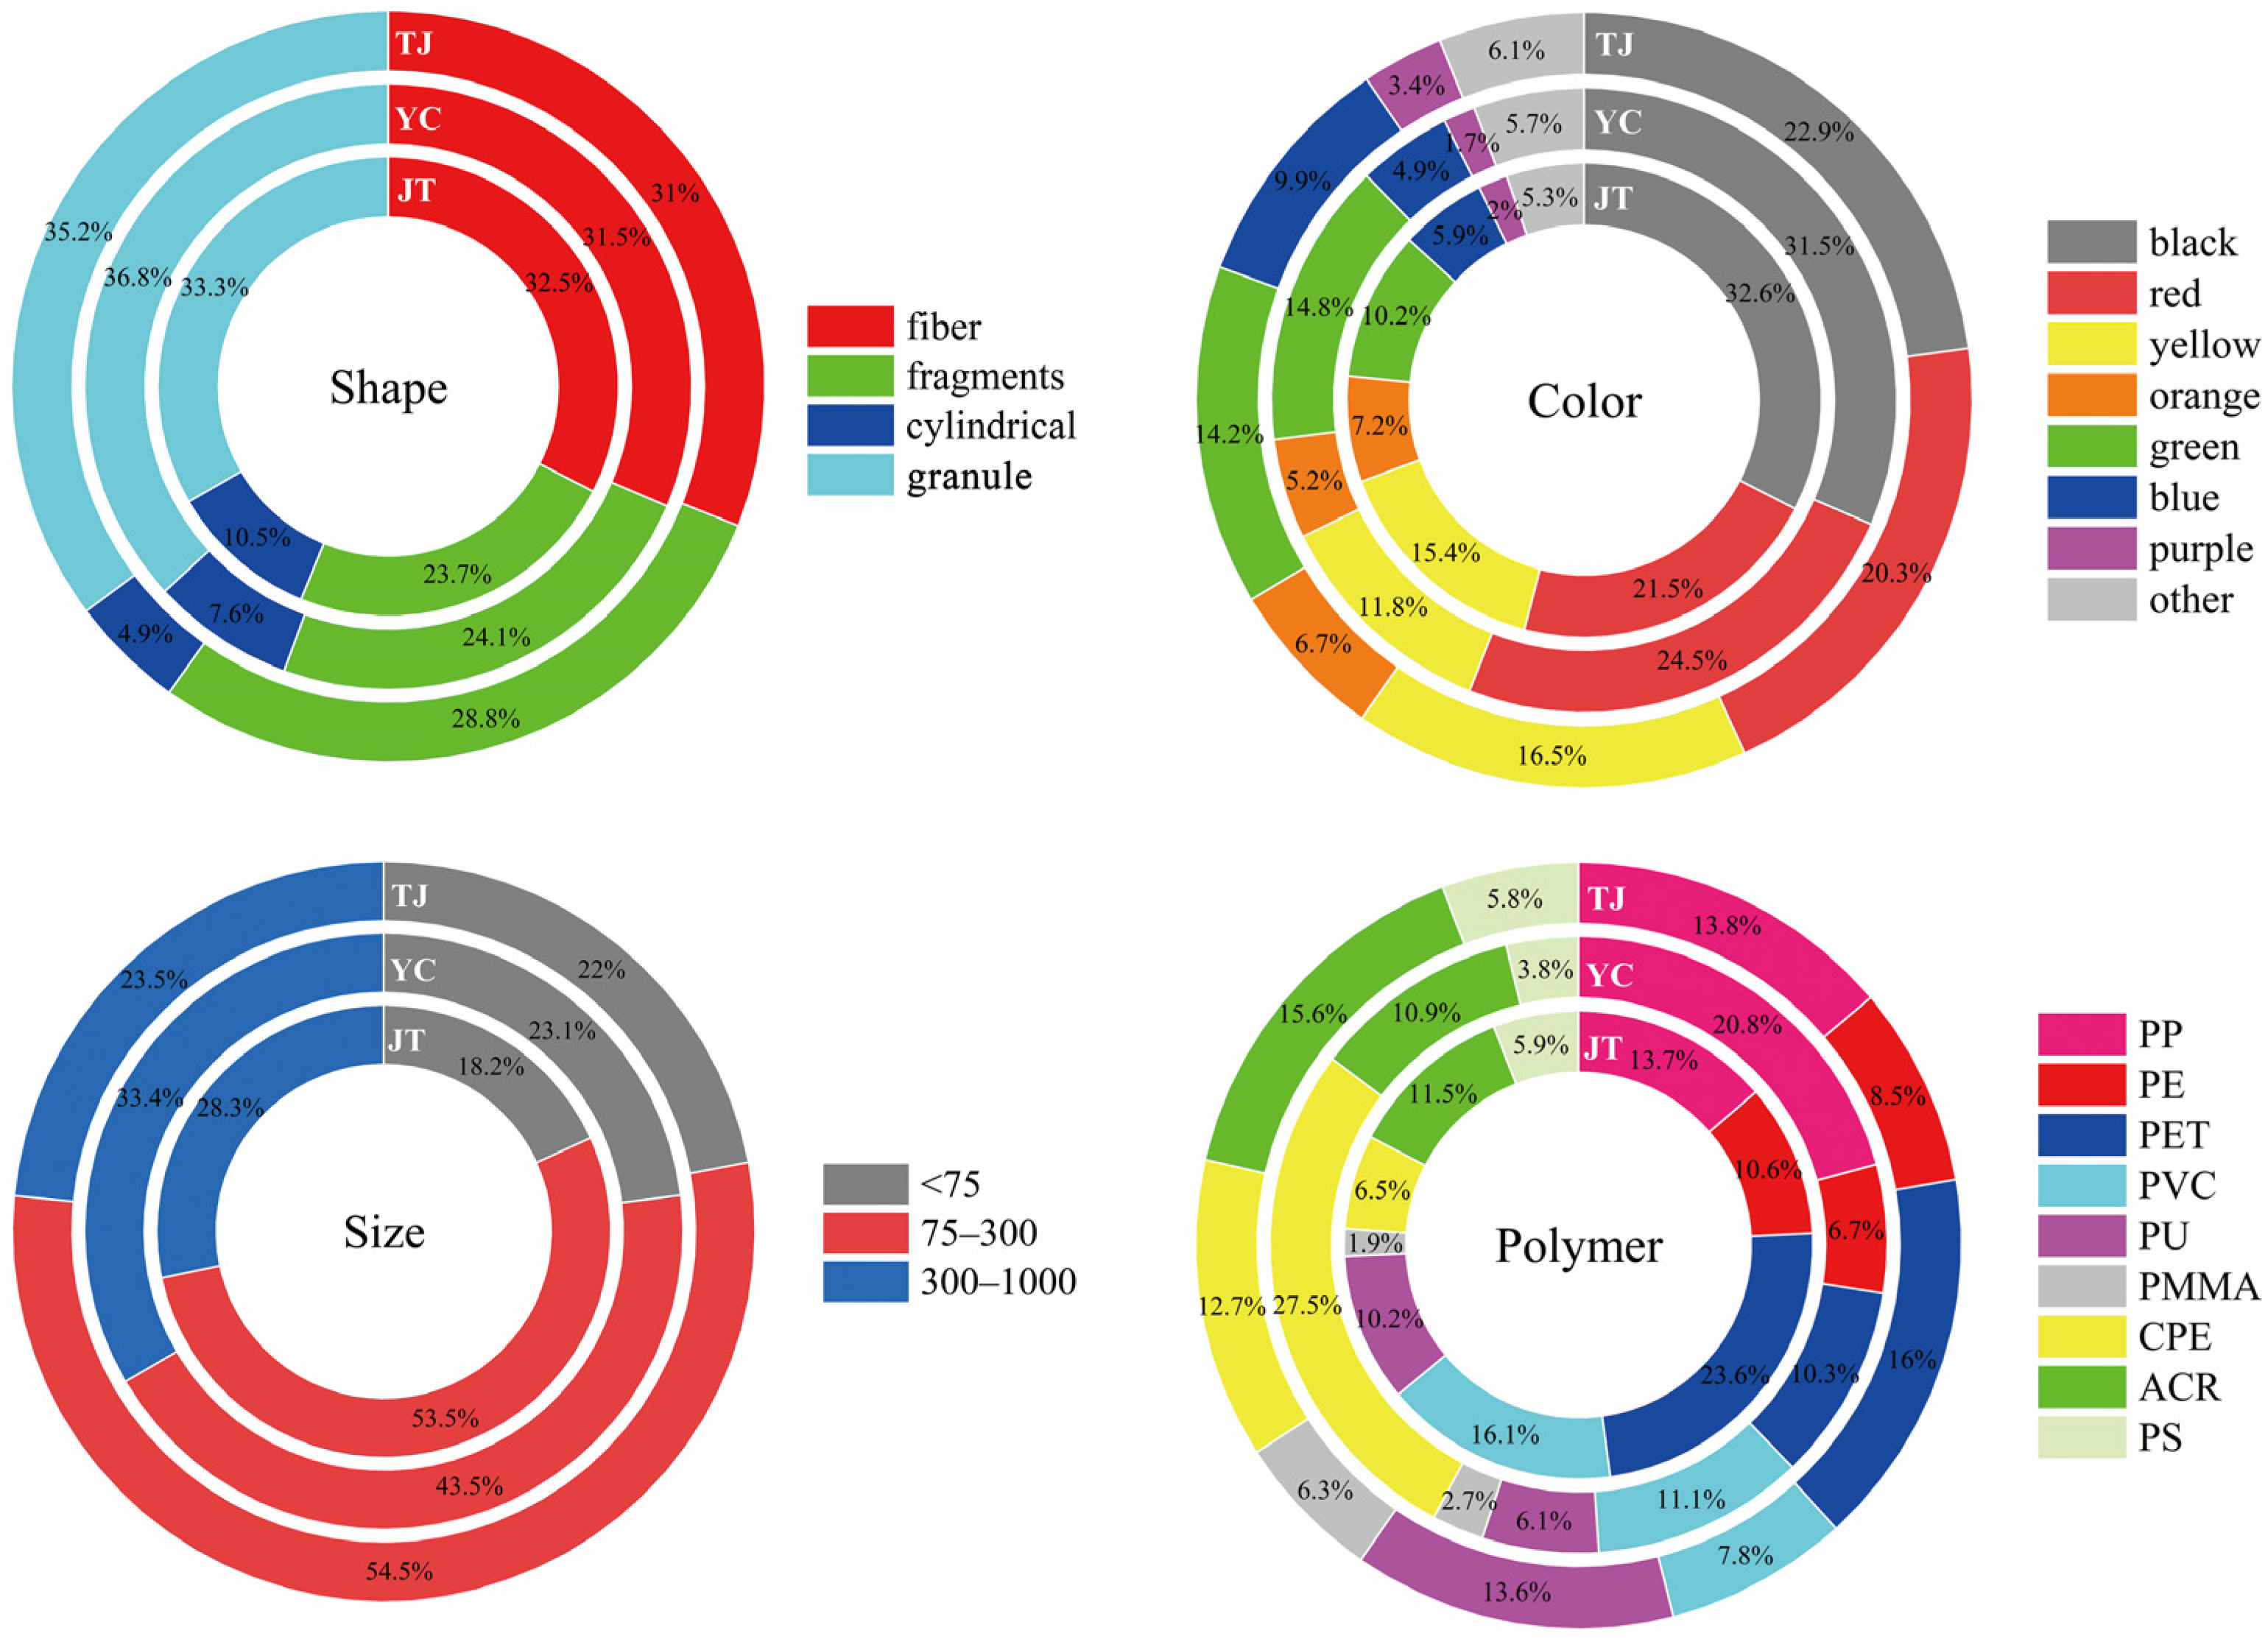
The types of MPs identified in the pipeline sediment samples are presented in Figure 2A and Figure 4. Fibers, fragments, cylindrical shapes, and particles were detected across all samples (Figures S1 and S2), with the exception of JS1, which did not yield any cylindrical MPs. Particles were the most prevalent form, with the three cities showing a decreasing order of abundance: Yongchuan District (36.8%), Tongji University (35.2%), and Jintan District (33.3%). Fibers were the second most common, with Jintan District exhibiting the highest proportion at 32.5%. Fragments were the most prevalent in the campus area, reaching 28.8%.
The shape distribution of MPs varied significantly across different areas. Particles were primarily derived from the breakdown of microbeads and rigid plastics [31], while fibers originated from various sources, including textiles and fishing nets [32]. Jintan District’s sampling site, a city street pipe network, was surrounded by stores and residential areas. Fragments were predominantly plastic bags and packaging [33]. The distribution of microplastic shapes varies in different functional zones, with higher percentages of particles and fibers type in parking and commercial zones, and more particles and fragment shapes in academic and dormitory zones.
The particle size distribution of MPs at all sampling locations is depicted in Figure 2C and Figure 4. MPs with a size range of 75–300 μm constituted the largest portion of the samples (50.09%), followed by 300–1000 μm (28.82%) and those smaller than 75 μm (21.08%). A similar trend was observed in a previous study on storm drain sediments in Wuhan city in China, where the most common MPs were 100–450 μm in size [34].
MPs measuring 75–300 μm in diameter constituted the majority (54.5%) of particles found on the Tongji campus. The preponderance of these smaller MPs is attributed to the aging and breakdown of larger fragments under physical stress such as weathering and UV radiation, which can fragmentize into smaller particles. This, in turn, elevates the abundance of smaller MPs. However, the dominance of smaller particles heightens the risk of adverse effects and biological ingestion, as they are more easily consumed by aquatic organism, which can then accumulate through the food chain and pose a threat to human health [35]. Smaller MPs possess a larger surface area, enabling them to adsorb more organic matter and release toxic substances. Their mobility makes them susceptible to dispersal across various environmental media [36]. Consequently, research efforts should be directed towards the removal of these smaller MPs.
The variety of colors observed in the collected MPs, depicted in Figure 2B and Figure 4, encompassed red, blue, clear, black, green, yellow, white, orange, and purple. Given the scarcity of white and transparent MPs, they were grouped under the “other” category. Colored MPs constituted the majority (66.54%), with red and black being the most prevalent at 32.84% and 27.92%, respectively. The lower proportion of white and transparent MPs may be attributed to the ubiquitous use of colored plastics in daily life, particularly for items such as colored beverage bottles [37]. The high percentage of black MPs could be linked to tire wear debris and the extensive production and use of black fiber filaments [38]. It has been reported that black MPs adsorb more pollutants than white MPs, which may be due to the fact that black plastics contain more additives, which increase adsorption [13].
In the current study, nine chemical types of MPs were identified using LDIR, including polypropylene (PP), polystyrene (PS), polyethylene (PE), polyethylene terephthalate (PET), polyvinyl chloride (PVC), polyurethane (PU), polymethyl methacrylate (PMMA), chlorinated polyethylene (CPE), and acrylic resin (ACR). The distribution of these polymers at each sampling site is depicted in Figure 2D and Figure 4. Figure 2C size classes represent a combination of both LDIR (20–500 μm) and manual microscopy (>500 μm) size classes and enable a full-size series of microplastics to be represented. The primary polymers identified were PET, PP, and CPE, accounting for 15.88%, 15.29%, and 14.98%, respectively. PS and PMMA were less prevalent, comprising 5.37% and 4.87%, respectively. The predominant microplastic components varied by location, with PET (23.6%) and PVC (16.1%) dominating in Jintan District, CPE (27.5%) and PP (20.80%) in Yongchuan District, and PET (16.00%) and ACR (15.6%) on the Tongji University campus. PET is mainly used in the production of water containers and bottles, but it is also used as a raw material for textiles, such as in the production of clothing and blankets [39]. PVC is mainly used in fishing hoses and in the construction industry. CPE can be used as a component of rubber products and waterproofing materials. PP is widely used in daily life, such as in plastic bottles, bags, and caps [40]. ACR is the main microplastic component in academic and commercial areas, with 21.25% and 21.81%, respectively. PP is a common component in dormitory areas, reaching 20.27%, and CPE is the main component of MPs in parking areas, with 19.93%. The ubiquity of MPs in urban drain sediments underscores the need for comprehensive strategies to mitigate their impacts on the environment.

3.2. Differential Distribution of PAHs on Microplastics and Sediments

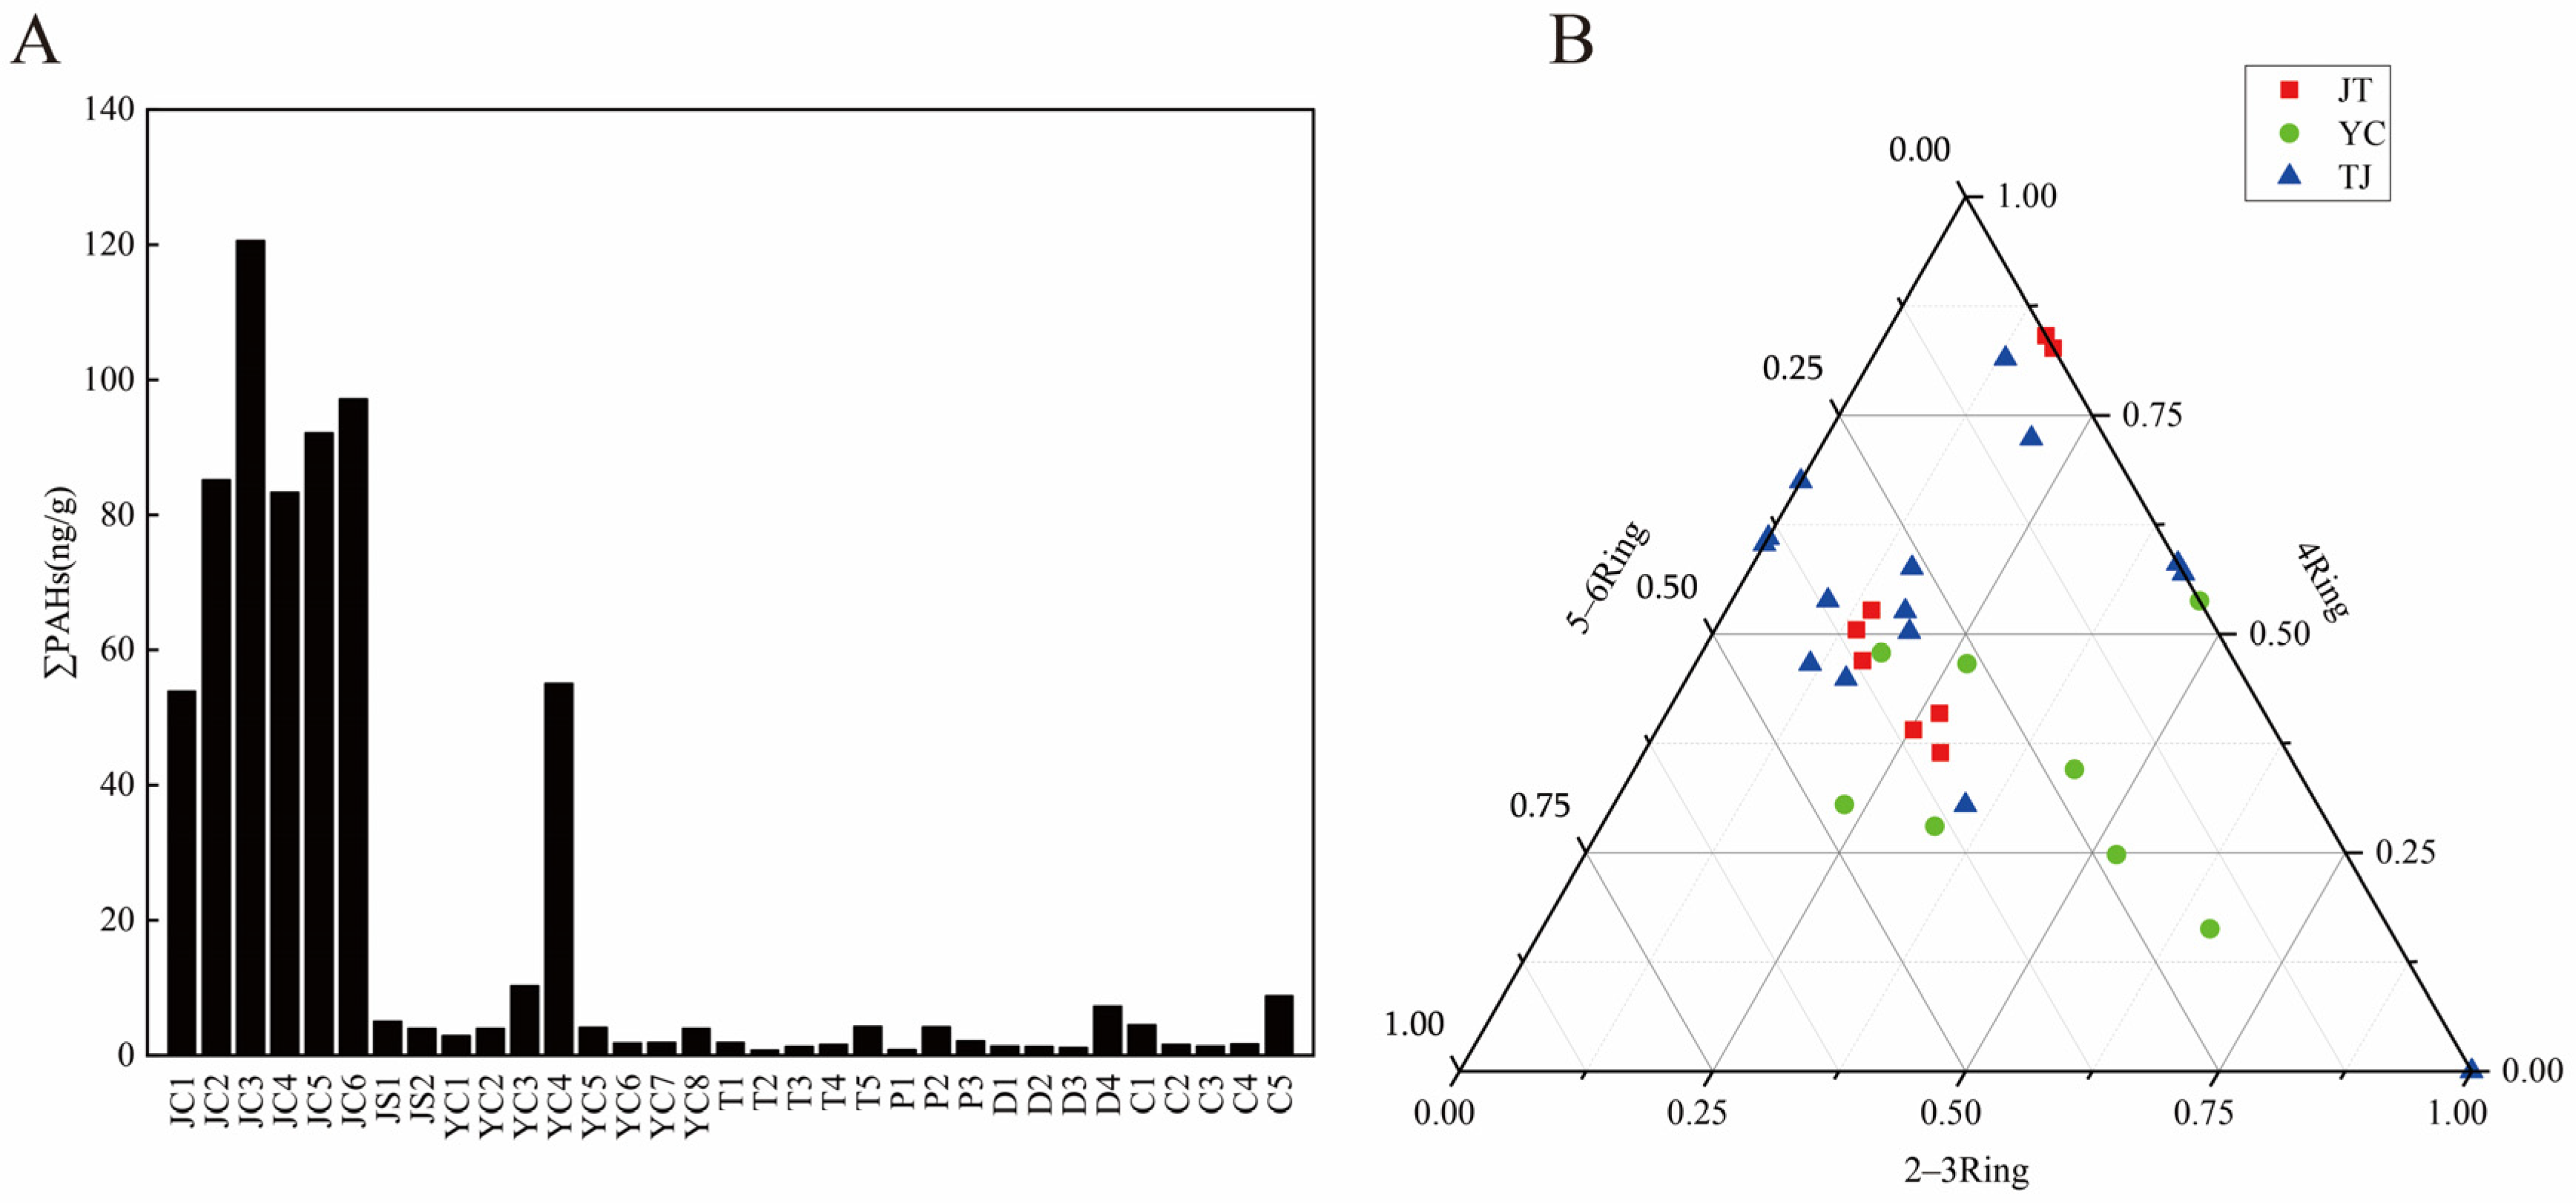
In this research, a total of 33 sediment samples were processed. First, the samples were freeze-dried and then sieved through a 5 mm mesh to visually identify MPs (<5 mm in size). Anhydrous ethanol was employed to dissolve natural organic matter on the MPs to avoid interference with the detection of PAHs. The results revealed the presence of 16 priority PAHs on the MPs in all three areas, with PAHs detected in most of the samples. The total PAH content ranged from 0.88 to 120.59 ng/g. The highest proportions of mean PAH concentration on MPs were in Jintan District (67.66 ng/g), then Yongchuan District (10.52 ng/g), and Shanghai (5.76 ng/g). The highest average PAH content was found in Jintan District. Among individual sites, the highest PAH concentration was recorded at JS3 in Jintan District (120.59 ng/g), and at YC4 in Yongchuan District (55.079 ng/g), which may be attributed to their downstream location, facilitating the transport of MPs with attached PAHs during rainfall. The PAH levels observed in the MPs were lower compared to previous studies, possibly due to the sample size available for analysis and the variation in the size of the microplastic samples collected across different sites [41]. Chen et al. reported a PAH concentration range of 1.2–194,000 ng/g in their study [42].
As depicted in Figure 5B, the PAHs detected on MPs in this experiment were primarily composed of 4-ring and 5–6-ring compounds, accounting for 44.59% and 30.99% of the total PAHs, respectively. Among these, four-ring PAHs were most abundant in Jintan District, comprising 51.29% of the total. The primary PAH types identified in Jintan and Yongchuan Districts were Phe, Flu, and Pyr, which align with previous studies, as shown in Table 2. On the school campus, the dominant PAHs were NaP, Flu, and Pyr, while high-molecular-weight PAHs such as DBA, InP, and BghiP were not detected. This finding is consistent with the results reported by Andres et al. in their analysis of PAHs on MPs from Bahia Blanca Estuary beaches [43].
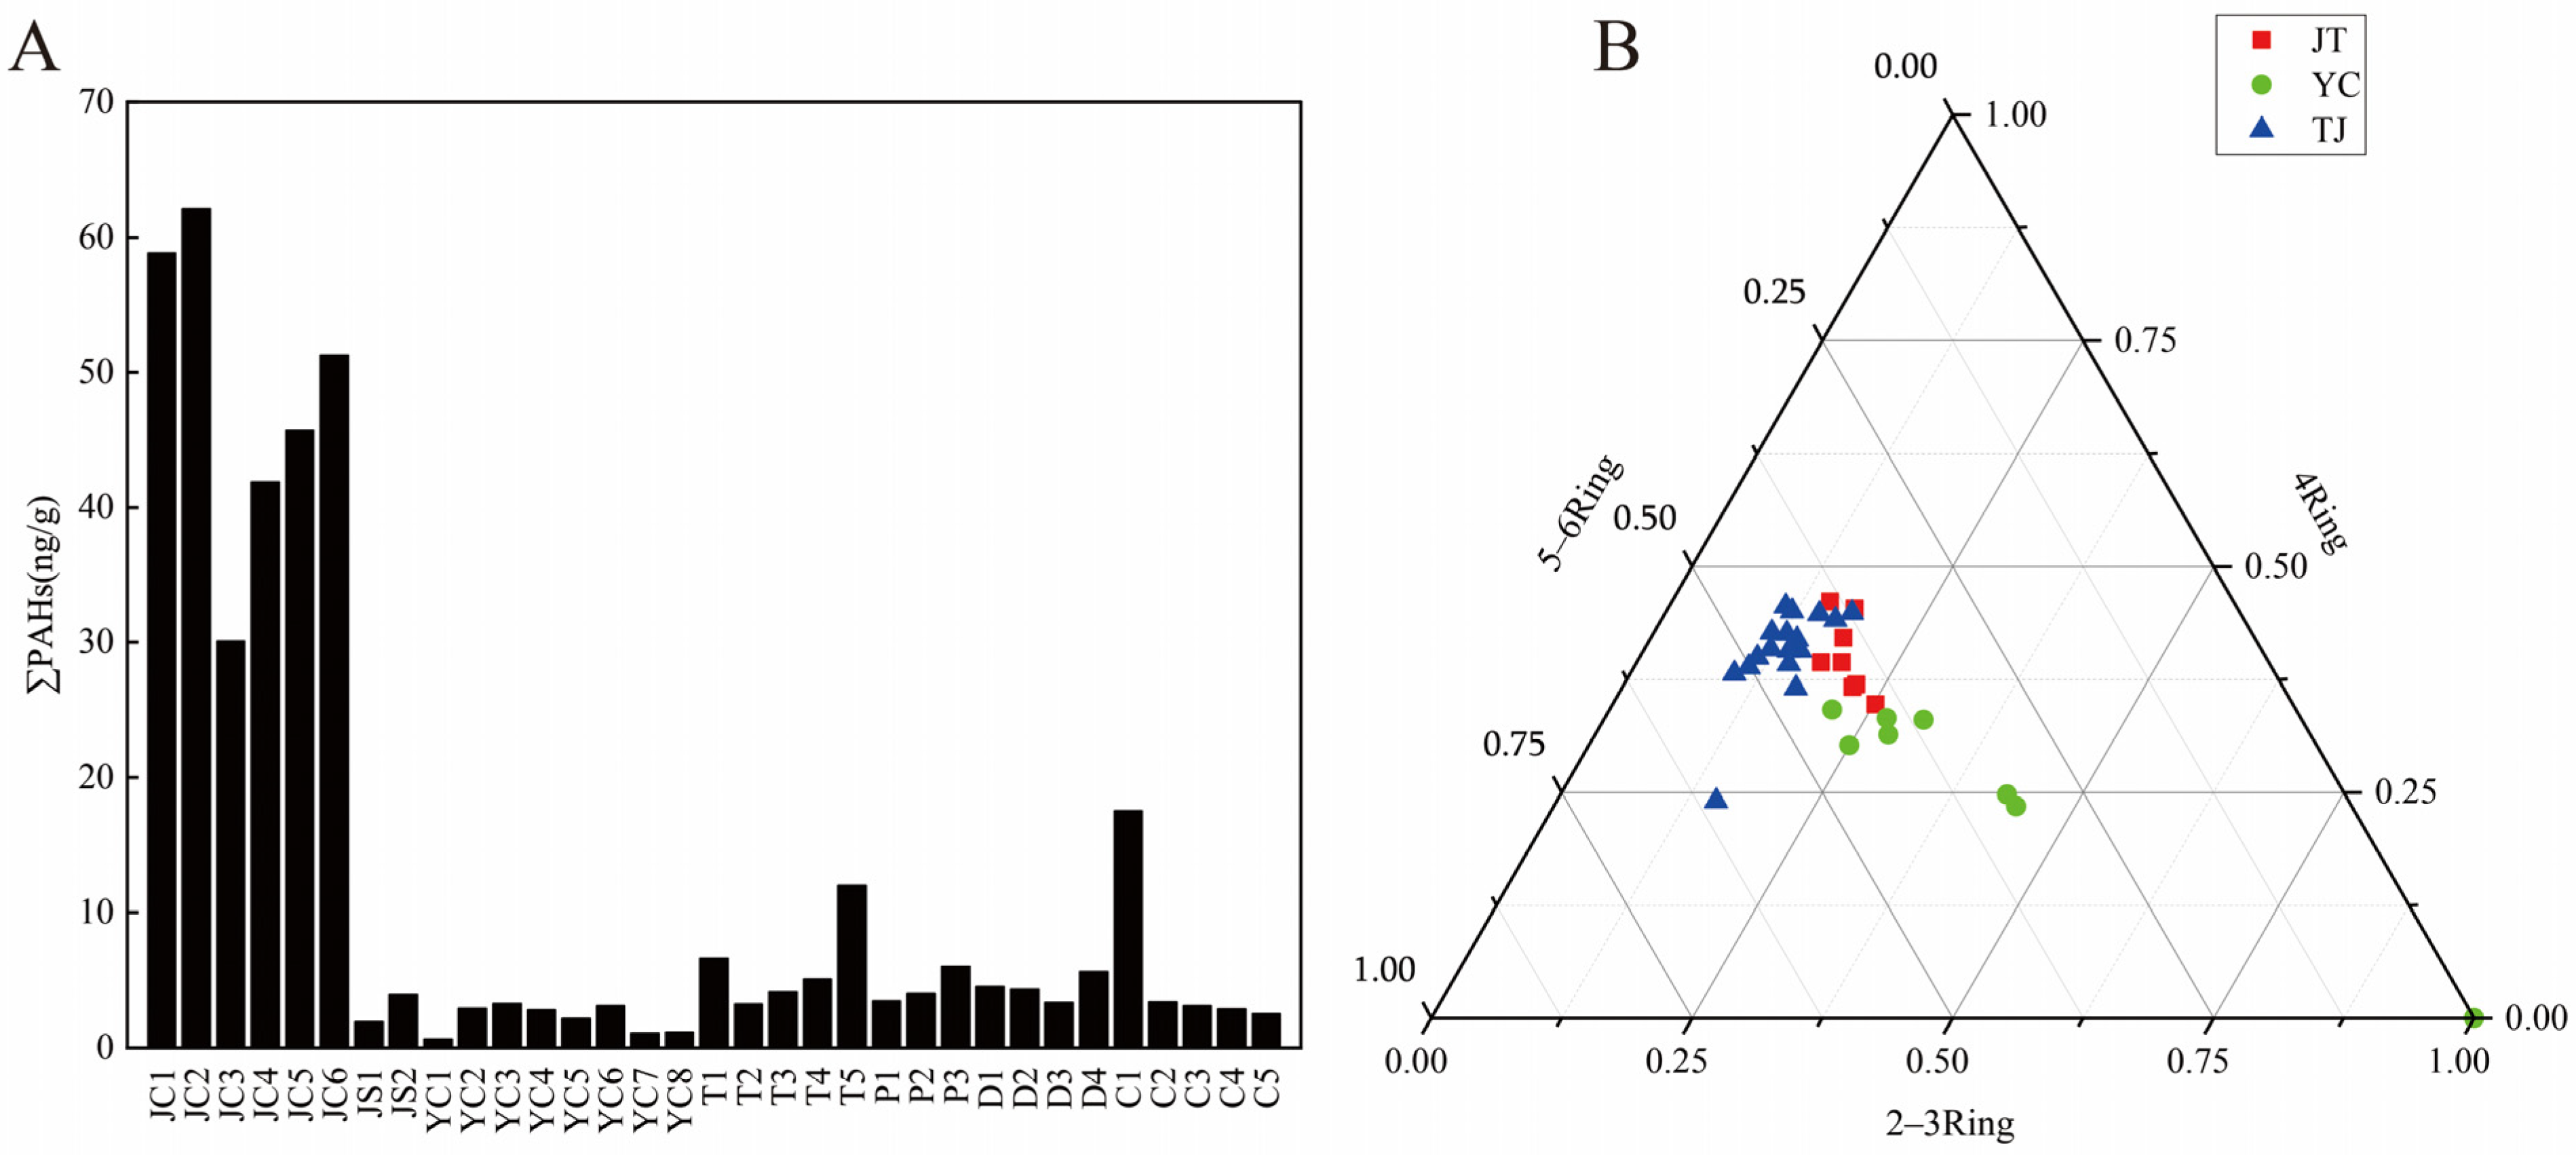
PAHs were detected in drain sediments across all three cities, as shown in Figure 6A. The total ∑16 PAH concentration ranged from 0.63 to 60.09 ng/g, with average concentrations of 36.96 ng/g in Jintan District, 2.12 ng/g in Yongchuan District, and 5.38 ng/g on Tongji University campus. The highest PAH concentration was found in the sediments at JS2 in Jintan District (62.09 ng/g). On the MPs, the highest PAH concentration was observed in C1 within the school (8.2 ng/g). As illustrated in Figure 6B, the PAHs on the sediments were dominated by 5–6-ring compounds, followed by 4-ring PAHs, which accounted for 42% and 40.27% of the total PAHs, respectively. The highest percentage of 5–6-ring PAHs was 46.36% in the school sediments.
In this research, the concentration of PAHs on MPs was found to be higher than that on sediments. This is due to the hydrophobic nature of organic compounds, which leads to their partitioning from water to the solid phase [44]. The MPs’ increased hydrophobicity enhances their affinity for organic pollutants, while their large specific surface area provides ample adsorption sites. This adsorption capacity is significantly higher than that of natural sediments, being about two orders of magnitude greater [45]. Wen Feng et al. conducted a laboratory study on the partitioning of PAHs between MPs and sediments, demonstrating that MPs exhibited a higher affinity for Phe (one of the PAHs) compared to sediments [15]. The low vapor pressure of PAHs with five or more rings results in their preferential adsorption to sediment particles [46], whereas PAHs with four or fewer rings may be found in both the dissolved and particulate phases due to their water solubility. MPs may have absorbed some of these four-ring PAHs from the aqueous phase [47]. Fung et al. studied the adsorption behavior of pyrene (four-ring PAH) in a ternary system composed of water, MPs, and sediments [48]. They found that the sediments in this system began to adsorb most of the pyrene, which was subsequently released into the aqueous phase and re-sorbed by polyethylene (PE) MPs. Consequently, understanding the interaction of PAHs with MPs in drainage systems is crucial for accurately assessing the pollution transfer potential of MPs and their potential environmental hazards to aquatic organisms.
Table 2. PAHs on MPs in previous research.
Study SiteNumber of PAH SpeciesTotal PAH ConcentrationMain Types of PAHsReference
Beaches of the Portuguese coast1675–1334.8 ng/gPhe, Pyr, Flu(Frias et al., 2010) [49]
Saigon River14432.95–3267.88 ng/gFlu, Pyr, Phe(Nguyen et al., 2022) [50]
Eastern Guangdong1611.2–7710 ng/gPhe, Fla, Chr(Shi et al., 2020) [34]
The Bahia Blanca Estuary (Argentina)29 122.79   ± 11.13 ng/gPhe, NaP, Flu, Flo, Pyr(Arias et al., 2023) [43]
Seal beach1979–656 ng/gPhe, Flu, Pyr, Chr(Hirai et al., 2011) [51]
Huanghai Sea and Bohai Sea163400–11,900 ng/gPhe, Pyr, Flu(Mai et al., 2018) [41]
Feilaixia reservoir16282.4–427.3 ng/gChr, BghiP, Phe, InP(Tan et al., 2019) [52]
Beaches in Santos Bay1273.6–5344 ng/gFlu, Pyr, Chr(Fisner et al., 2013) [53]
Hong Kong1670.8–1509 ng/gPh, Pyr, Ant(Lo et al., 2019) [54]
The differences in PAH concentrations observed between this study and previous reports are better explained by environmental and material-specific mechanisms rather than sample-size variability. PAH adsorption to MPs is strongly polymer-dependent, with polymers such as PE, PP, and CPE exhibiting higher hydrophobic affinity and sorption capacity than more crystalline or polar polymers. In addition, the age and weathering degree of MPs play a critical role, as surface oxidation, cracks, and roughness substantially enhance PAH retention. Local emission intensity is also a major factor; variations in regional traffic load, industrial discharge, and combustion activities produce distinct PAH signatures that influence contaminant availability for sorption. Finally, sediment residence time affects the exposure duration of particles to dissolved PAHs, meaning that MPs that persist for longer in drainage systems accumulate higher pollutant loads. These combined factors provide a more realistic explanation for the lower PAH levels found in this study compared with values reported elsewhere.
The GC-MS/MS method was only used to analyze the 16 EPA priority PAHs. The other forms of PAH derivatives like alkylated, nitrated, or oxygenated PAHs were not within the scope of this analysis; hence; they may be present on the microplastic surfaces, but they were not measured in this study.
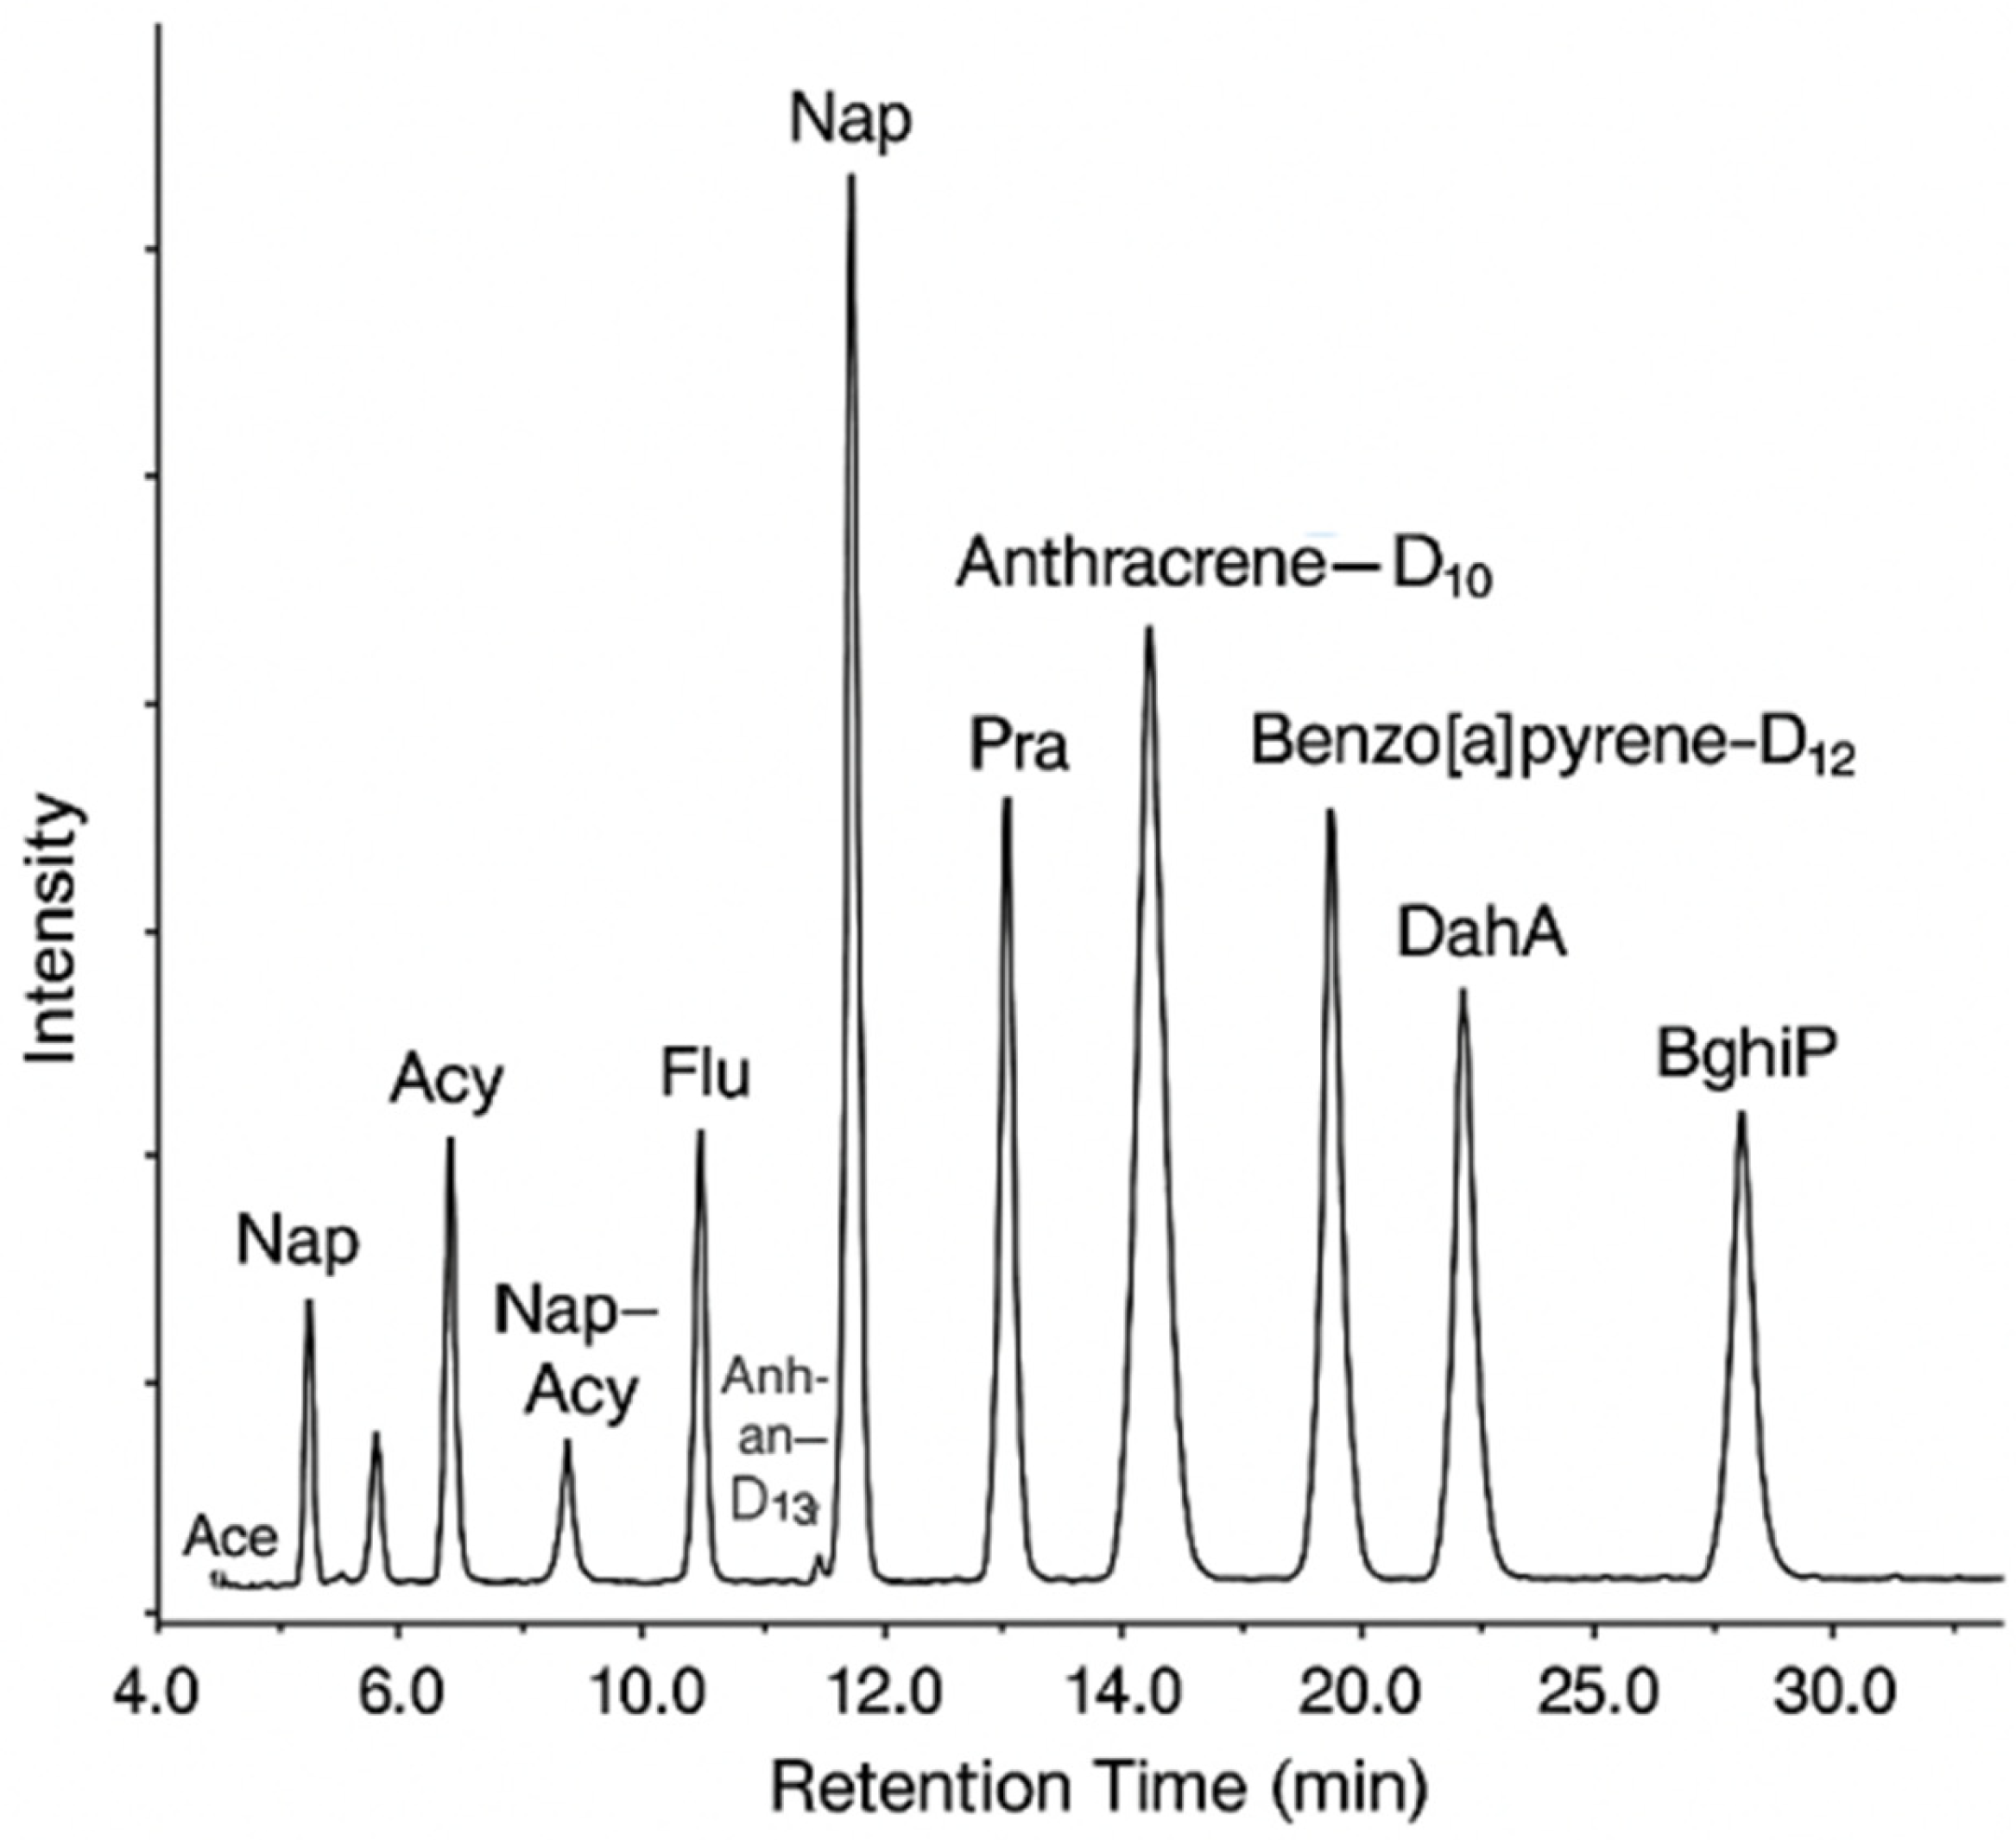
A representative GC-MS/MS chromatogram (separation of the 16 EPA priority PAHs) is given in Figure 7. The limits of detection (LOD) and limits of quantification (LOQ) of all analytes of PAH are presented in Table 1.

3.3. Correlation Analysis of Microplastics with PAHs

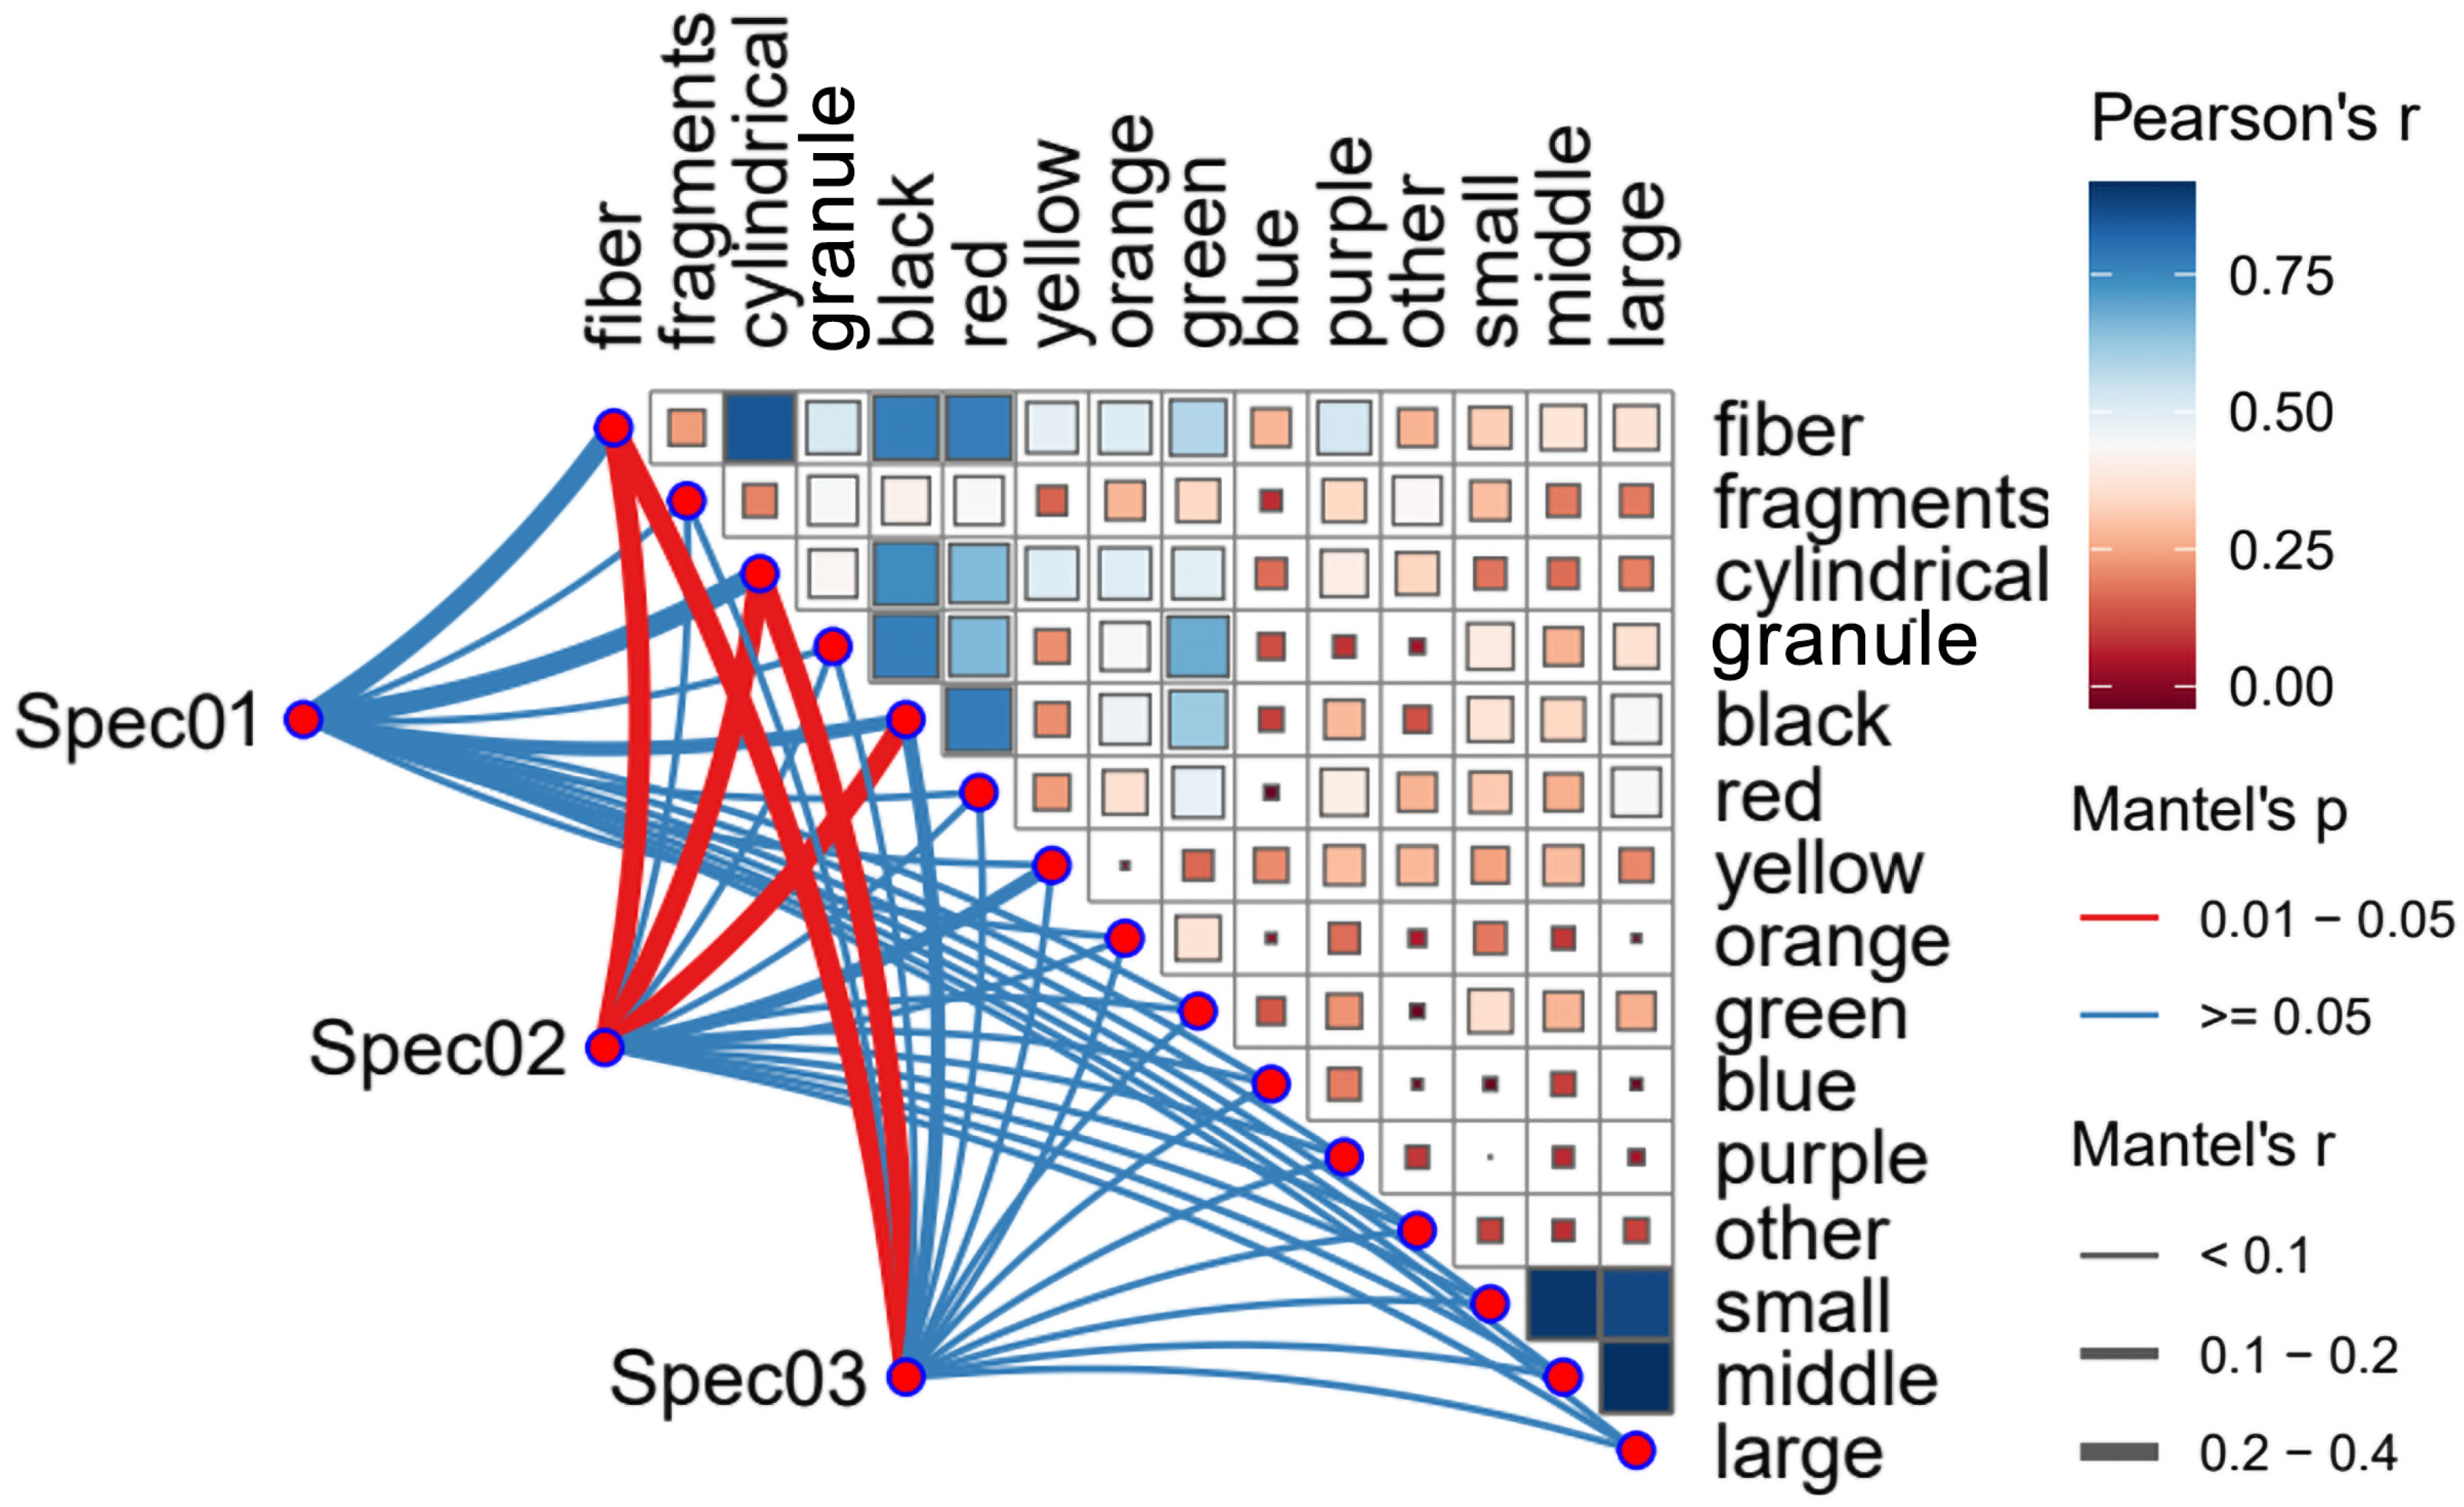
In this study, the relationship between the physical properties of MPs and PAHs was investigated using mental test correlation thermograms. These thermograms were categorized into three groups based on the PAH structural characteristics: Spec01 for 2–3-ring PAHs, Spec02 for 4-ring PAHs, and Spec03 for 5–6-ring PAHs. The MPs were further classified into three size categories: <75 μm (small), 75–300 μm (middle), and 300–1000 μm (large).
As depicted in Figure 8 and Figure S3, the correlation analysis revealed that black MPs were more likely to contain fibrous MPs (r = 0.76), indicating a higher number of fibrous MPs in black samples. The association between fibrous (r = 0.37) and granular (r = 0.36) MPs was stronger in the 300–1000 μm size range. Similarly, fibrous MPs were more prevalent in the 75–300 μm size range, while granular MPs were dominant in the <75 μm size range. The color of fibrous MPs was predominantly black (r = 0.76) and red (r = 0.76), whereas granular MPs were mainly black (r = 0.76) and green (r = 0.67).
The correlation between four-ring PAHs and fibrous MPs was significant (r = 0.33, p = 0.021), and a similar association was observed for four-ring PAHs and columnar MPs (r = 0.37, p = 0.016). Additionally, four-ring PAHs were found to be more prevalent in black MPs (r = 0.23, p = 0.04). For 5–6-ring PAHs, a stronger association was observed with fibrous (r = 0.27, p = 0.034) and columnar (r = 0.29, p = 0.044) MPs. Frias et al. reported high concentrations of PAHs in black particulate MPs, particularly pyrene, from Cresmina beach and Fonte da Telha beach [49].

3.4. Factors Influencing the Distribution of PAHs

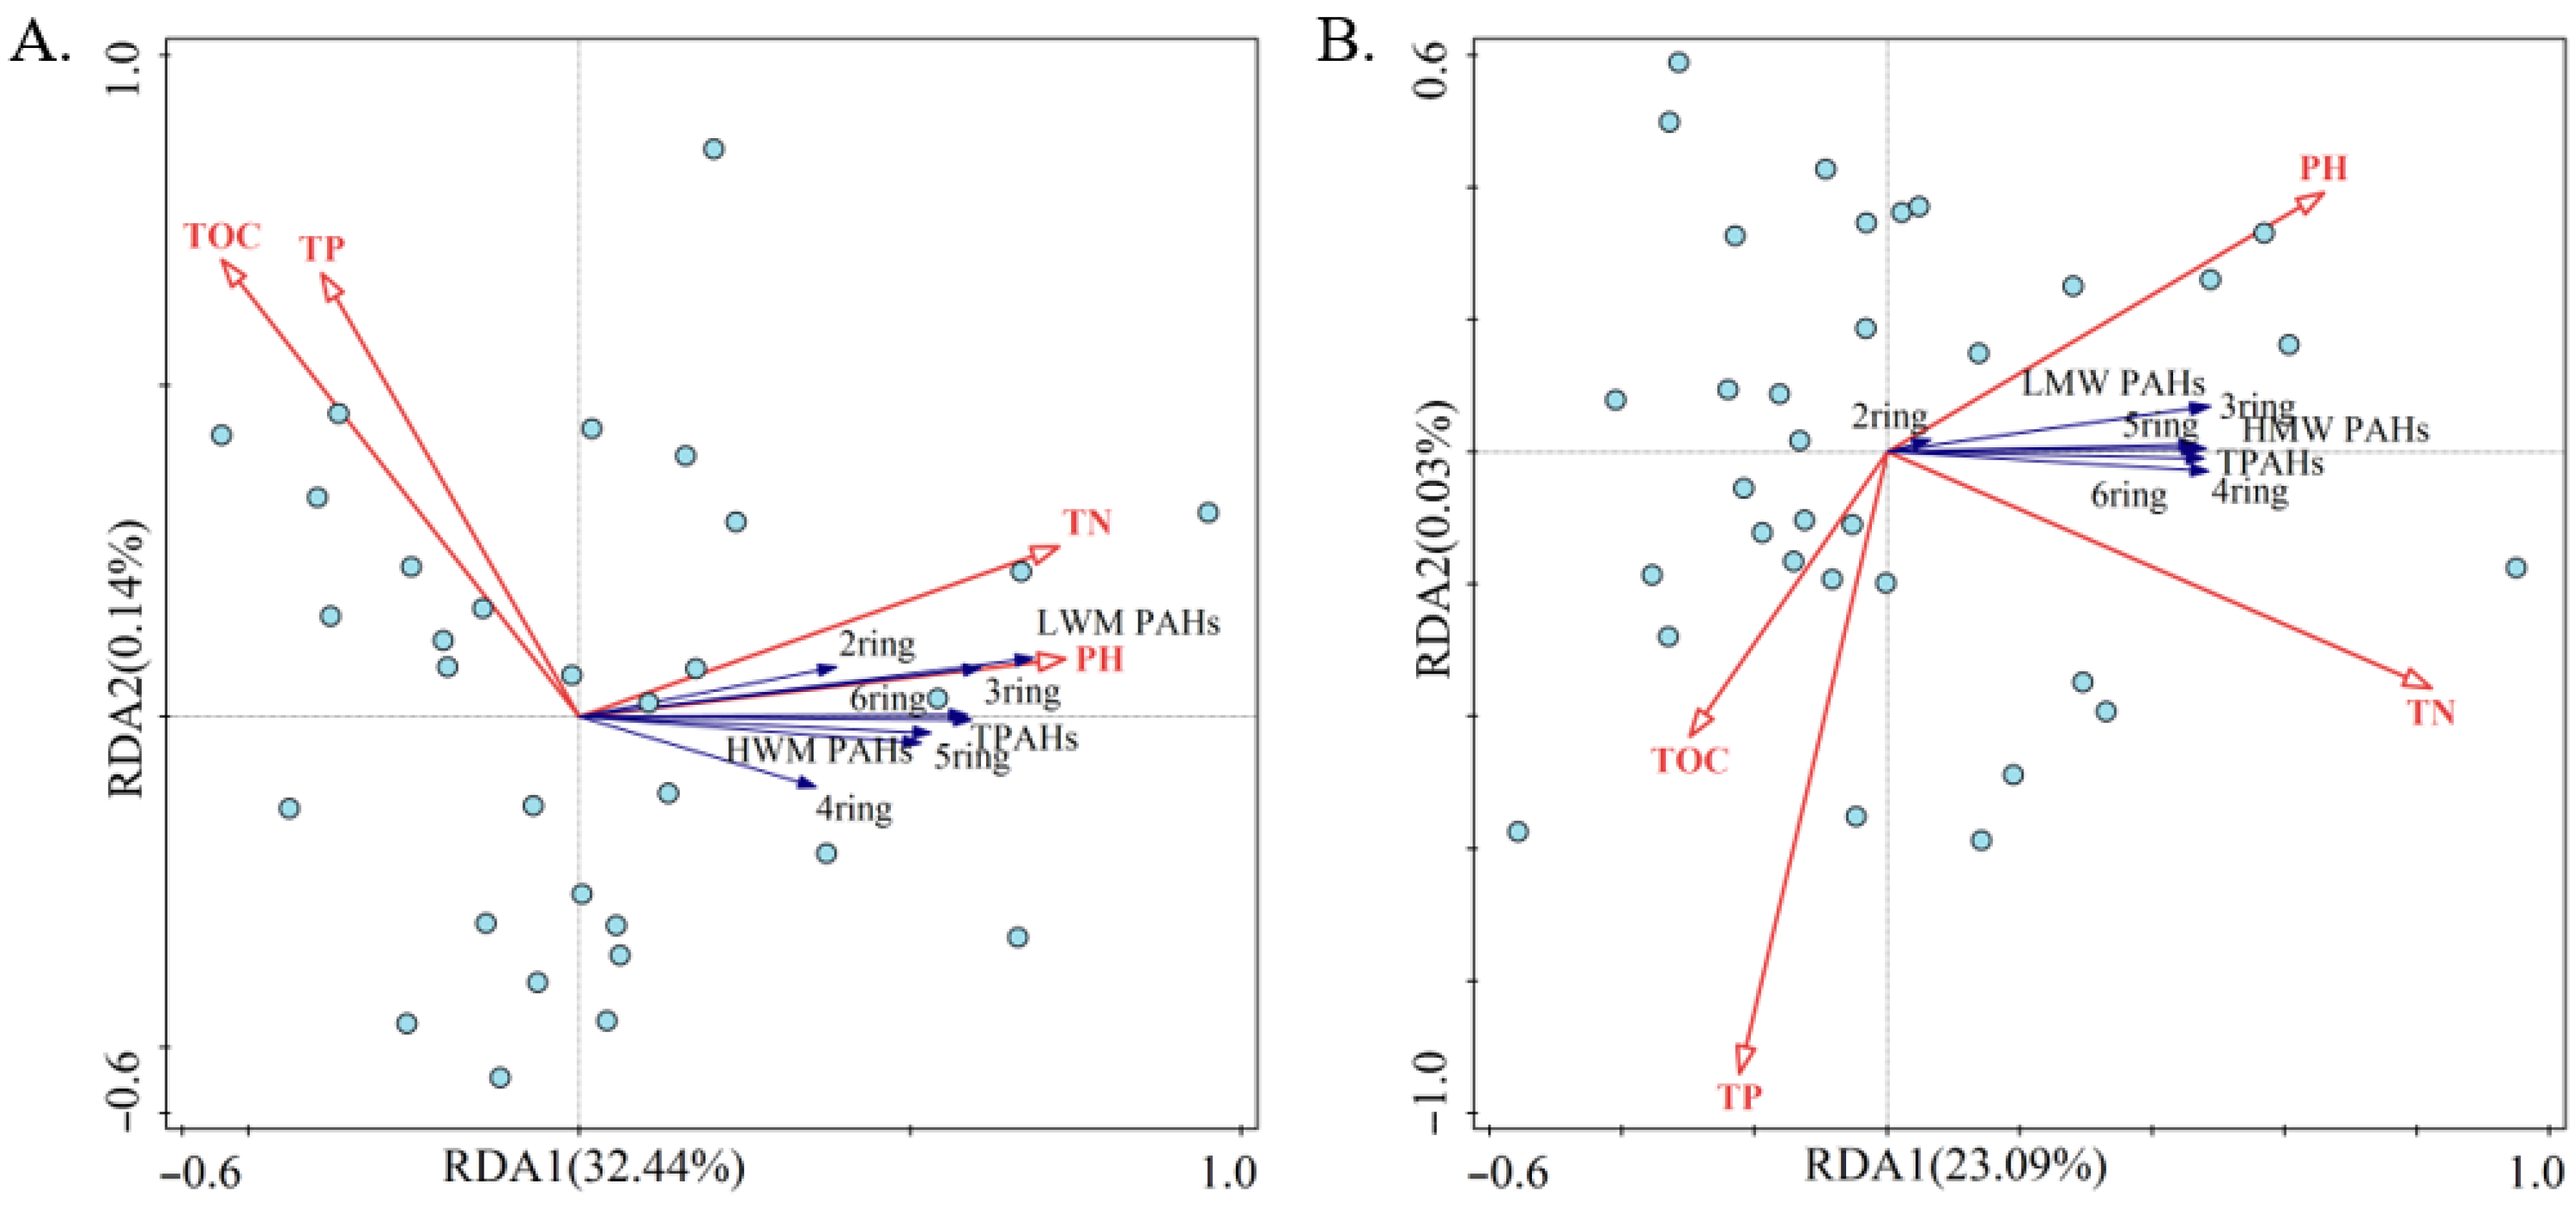
To investigate the influence of environmental factors on the distribution of PAHs on MPs and in sediments, redundancy analysis (RDA) was employed. This analysis utilized total nitrogen (TN), total phosphorus (TP), total organic carbon (TOC), and pH as environmental variables, and PAHs (two-ring, three-ring, four-ring, five-ring, and six-ring) as species variables.
The RDA results, as depicted in Figure 9A, indicate that pH and TN are positively correlated with the concentration of the 16 PAHs, with the angle between these variables and the PAHs being minimized, suggesting a strong positive association [55]. Moreover, the correlation between TN and low-molecular-weight (LWM) PAHs is notably stronger. For the sediments, as shown in Figure 9B, pH and TN also show a positive correlation with the concentration of the 16 PAHs. Specifically, TN is strongly correlated with four-ring and six-ring PAHs. Conversely, TOC and TP exhibit a negative correlation with the PAHs on the sediment surface. The study by Wang corroborated the finding that TN is significantly correlated with the 16 PAHs. However, it also revealed that there is no significant association between TOC and TP and PAHs of any molecular weight, aligning with the present experimental results. Additionally, TOC was found to be significantly correlated with the concentration of total PAHs [56]. This discrepancy may be attributed to the fact that the adsorption equilibrium between TOC and PAHs has not yet stabilized, and TP is not adsorbed by PAHs.

3.5. Risk Assessment of PAHs

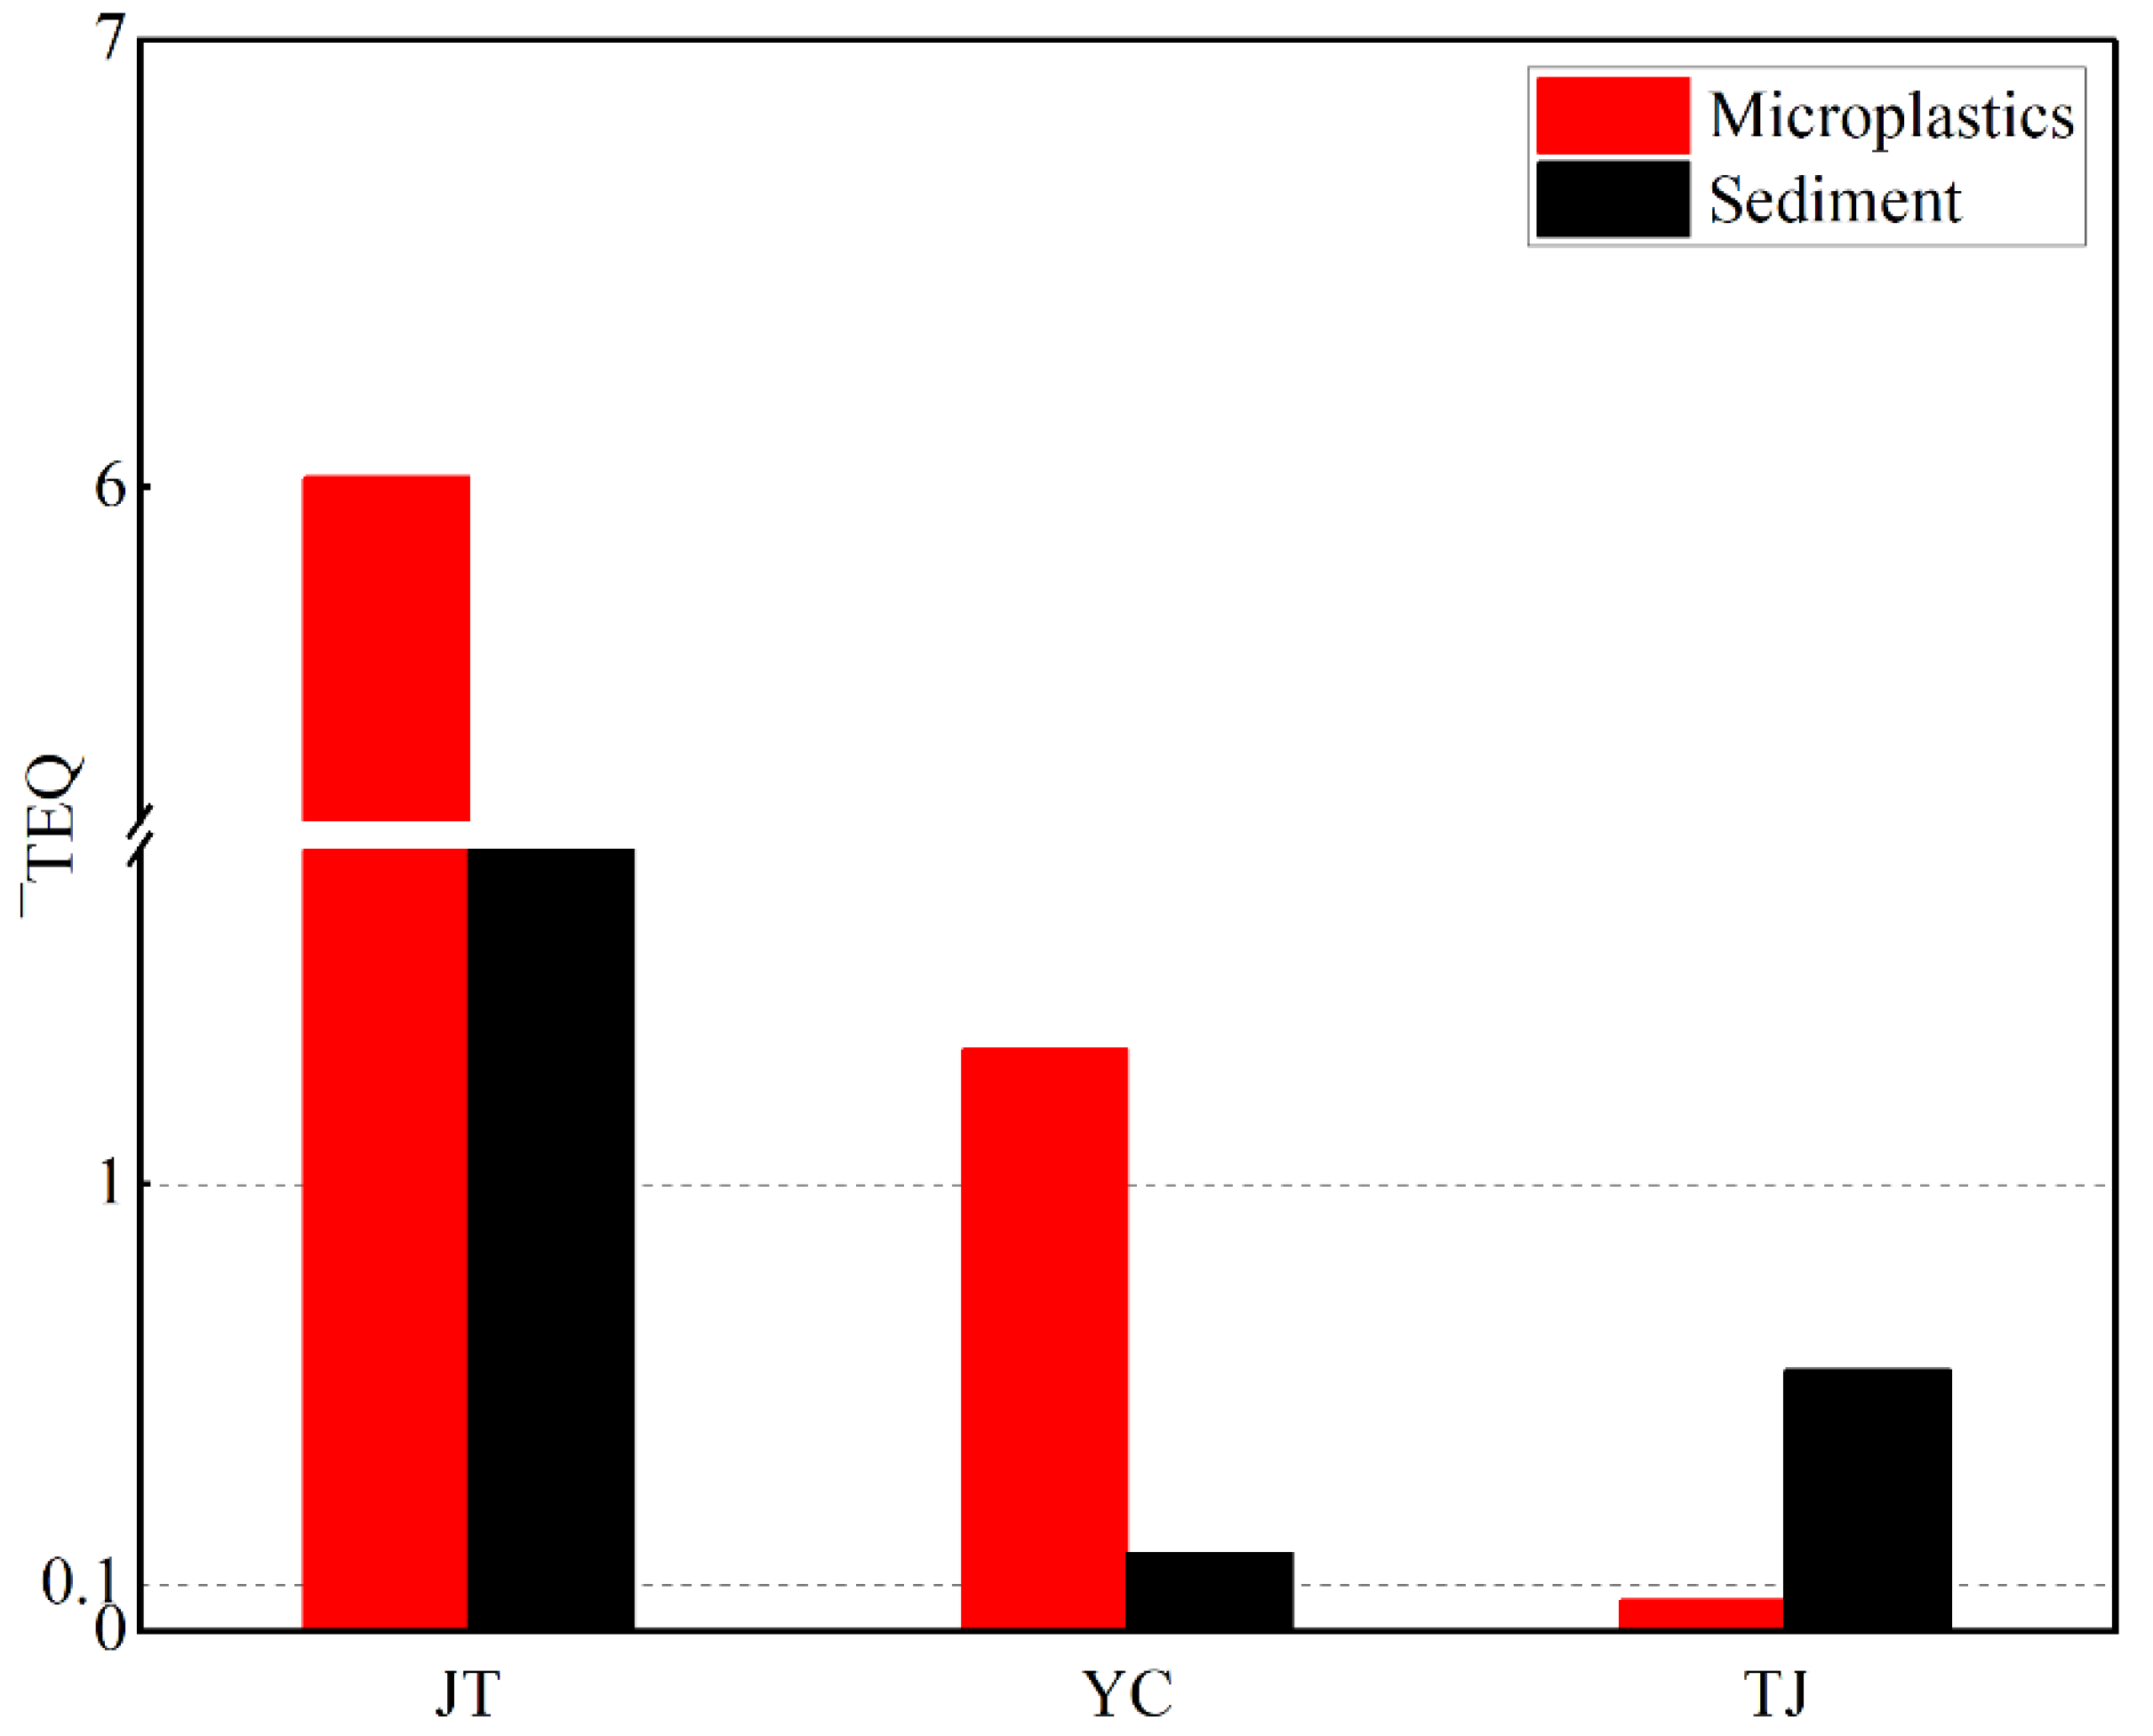
The toxicity equivalence factor (TEF) is a widely utilized method for quantifying the toxicity of PAHs. It does so by employing the most toxic compound, benzo(a)pyrene (Bap), as a reference for assessing the toxicity of other PAHs. By multiplying the concentrations of various PAHs by their respective TEFs, a comprehensive toxicity index can be generated to evaluate the potential toxicity of PAHs in the environment [57]. The toxicity risk posed by PAHs on drain MPs varies across the cities studied, as illustrated in Figure 10 and Table 3. Jintan District exhibited the highest toxic equivalence quotient (TEQ) value, reaching 48.2 ng/g, with an average of 6.02 ng/g. This indicates that the average TEQ values, in descending order, are Jintan District (6.02 ng/g), Yongchuan District (1.130 ng/g), and Shanghai (0.068 ng/g). The highest individual TEQ value was 31.86 ng/g on sediments from the middle drainage pipe in Jintan District, with an average of 3.982 ng/g. This order is Jintan District (3.982 ng/g), Shanghai (0.584 ng/g), and Yongchuan District (0.173 ng/g). The consistency between the average TEQ values and the PAH content suggests that high levels of PAHs are associated with significant ecological health risks. The mean TEQ values of PAHs on MPs and sediments in Jintan District and on MPs in Yongchuan District ranged from 1 to 10, which belongs to the medium-risk zone and may cause adverse biological effects. In contrast, the mean TEQ values of PAHs on MPs and sediments in Tongji University and sediments in Yongchuan District ranged from 0.1 to 1, which is in the low-risk zone.
The difference in the average TEQ of PAHs on MPs and sediments was significant. Among all monomer PAHs, BaP and DahA had relatively high values of toxic equivalents, and despite the predominance of four-ring PAHs on MPs, the concentrations of BaP and DahA on MPs were greater than those on sediments. This underscores the importance of considering the toxic effects of organic matter due to the high concentrations of MPs.

4. Conclusions

The distribution of MPs and PAHs in urban drainage pipe sediments was investigated and assessed for risk. MPs were ubiquitously detected in drainage sediments across all studied cities and land-use types. The highest abundances were found on campus and in commercial areas, with average abundances of 420 items/100 g and 498.4 items/100 g, respectively. MPs in the aquatic environment act as carriers of PAHs and affect the transport and migration of PAHs. In this study, the total concentrations of 16 PAHs in MPs ranged from 0.88 to 120.59 ng/g, with 4-ring PAHs dominating, while the total concentrations of 16 PAHs in sediments ranged from 0.63 to 60.09 ng/g, with 5–6-ring PAHs dominating. Correlation analysis showed that pH and TN were positively correlated with PAHs, while TOC and TP were negatively correlated with PAHs. Both sediments and MPs pose a potential carcinogenic risk to humans. Given these findings, it is crucial to monitor the levels of MPs and their associated PAHs in urban drain sediments to better understand their occurrence and environmental impact.

Supplementary Materials

The following supporting information can be downloaded at: https://www.mdpi.com/article/10.3390/su18031502/s1, Figure S1: The morphology of microplastics; Figure S2: Experimental Procedure for Detecting MPs; Figure S3: Heatmap of microplastic correlation analysis; Figure S4: Contribution to cancer risk by individual exposure route (ingestion, dermal contact, inhalation).

Author Contributions

Methodology, A.S.G.; validation, Z.Z.; formal analysis, A.S.G. and E.A.O.; investigation, X.B.; data curation, E.A.O. and Z.Z.; writing—original draft, X.B.; writing—review and editing, H.G. and H.W.; supervision, H.G., H.W. and X.D. All authors have read and agreed to the published version of the manuscript.

Funding

This work was financially supported by the National Key R&D Program of China (No. 2021YFC3201500), Institute of Carbon Neutrality of Tongji University (20230013), and the Fundamental Research Funds for the Central Universities of China.

Institutional Review Board Statement

Not applicable.

Informed Consent Statement

Not applicable.

Data Availability Statement

The original contributions presented in this study are included in the article/Supplementary Materials. Further inquiries can be directed to the corresponding authors.

Conflicts of Interest

The authors declare no conflicts of interest.

References

  1. Piringer, O.; Baner, A. Preservation of quality through packaging. In Plastic Packaging Materials for Food: Barrier Function, Mass Transport, Quality Assurance, and Legislation, 1st ed.; Wiley-VCH: Weinheim, Germany, 2000; pp. 4–8. [Google Scholar]
  2. Kale, S.K.; Deshmukh, A.G.; Dudhare, M.S.; Patil, V.B. Microbial degradation of plastic: A review. J. Biochem. Technol. 2015, 6, 952–961. [Google Scholar] [CrossRef]
  3. Thompson, R.C.; Olsen, Y.; Mitchell, R.P.; Davis, A.; Rowland, S.J.; John, A.W.; McGonigle, D.; Russell, A.E. Lost at sea: Where is all the plastic? Science 2004, 304, 838. [Google Scholar] [CrossRef] [PubMed]
  4. Idowu, G.A.; Oriji, A.Y.; Olorunfemi, K.O.; Sunday, M.O.; Sogbanmu, T.O.; Bodunwa, O.K.; Shokunbi, O.S.; Aiyesanmi, A.F. Why Nigeria should ban single-use plastics: Excessive microplastic pollution of the water, sediments and fish species in Osun River, Nigeria. J. Hazard. Mater. Adv. 2024, 13, 100409. [Google Scholar] [CrossRef]
  5. Lebreton, L.C.; Van Der Zwet, J.; Damsteeg, J.-W.; Slat, B.; Andrady, A.; Reisser, J. River plastic emissions to the world’s oceans. Nat. Commun. 2017, 8, 15611. [Google Scholar] [CrossRef] [PubMed]
  6. Meijer, L.J.J.; van Emmerik, T.; van der Ent, R.; Schmidt, C.; Lebreton, L. More than 1000 rivers account for 80% of global riverine plastic emissions into the ocean. Sci. Adv. 2021, 7, eaaz5803. [Google Scholar] [CrossRef]
  7. Müller, A.; Österlund, H.; Marsalek, J.; Viklander, M. The pollution conveyed by urban runoff: A review of sources. Sci. Total. Environ. 2020, 709, 136125. [Google Scholar] [CrossRef]
  8. Shruti, V.; Pérez-Guevara, F.; Elizalde-Martínez, I.; Kutralam-Muniasamy, G. Current trends and analytical methods for evaluation of microplastics in stormwater. Trends Environ. Anal. Chem. 2021, 30, e00123. [Google Scholar] [CrossRef]
  9. Bailey, K.; Sipps, K.; Saba, G.K.; Arbuckle-Keil, G.; Chant, R.J.; Fahrenfeld, N. Quantification and composition of microplastics in the Raritan Hudson Estuary: Comparison to pathways of entry and implications for fate. Chemosphere 2021, 272, 129886. [Google Scholar] [CrossRef]
  10. Kane, I.A.; Clare, M.A. Dispersion, accumulation, and the ultimate fate of microplastics in deep-marine environments: A review and future directions. Front. Earth Sci. 2019, 7, 80. [Google Scholar] [CrossRef]
  11. Maertens, R.M.; Yang, X.; Zhu, J.; Gagne, R.W.; Douglas, G.R.; White, P.A. Mutagenic and carcinogenic hazards of settled house dust I: Polycyclic aromatic hydrocarbon content and excess lifetime cancer risk from preschool exposure. Environ. Sci. Technol. 2008, 42, 1747–1753. [Google Scholar] [CrossRef]
  12. Byeon, E.; Jeong, H.; Lee, Y.-J.; Cho, Y.; Lee, K.-W.; Lee, E.; Jeong, C.-B.; Lee, J.-S.; Kang, H.-M. Effects of microplastics and phenanthrene on gut microbiome and metabolome alterations in the marine medaka Oryzias melastigma. J. Hazard. Mater. 2024, 461, 132620. [Google Scholar] [CrossRef]
  13. Nizzetto, L.; Binda, G.; Hurley, R.; Baann, C.; Selonen, S.; Velmala, S.; van Gestel, C.A. Comments to “Degli-Innocenti, F. The pathology of hype, hyperbole and publication bias is creating an unwarranted concern towards biodegradable mulch films” [J. Hazard. Mater. 463 (2024) 132923]. J. Hazard. Mater. 2024, 471, 133690. [Google Scholar] [CrossRef]
  14. Tang, K.H.D. Ecotoxicological impacts of micro and nanoplastics on marine fauna. Examines Mar. Biol. Oceanogr. 2020, 3, 1–5. [Google Scholar] [CrossRef]
  15. Wang, W.; Wang, J. Different partition of polycyclic aromatic hydrocarbon on environmental particulates in freshwater: Microplastics in comparison to natural sediment. Ecotoxicol. Environ. Saf. 2018, 147, 648–655. [Google Scholar] [CrossRef] [PubMed]
  16. Chen, S.-C.; Liao, C.-M. Health risk assessment on human exposed to environmental polycyclic aromatic hydrocarbons pollution sources. Sci. Total. Environ. 2006, 366, 112–123. [Google Scholar] [CrossRef] [PubMed]
  17. Mai, L.; He, H.; Bao, L.-J.; Liu, L.-Y.; Zeng, E.Y. Plastics are an insignificant carrier of riverine organic pollutants to the coastal oceans. Environ. Sci. Technol. 2020, 54, 15852–15860. [Google Scholar] [CrossRef] [PubMed]
  18. Mai, L.; You, S.-N.; He, H.; Bao, L.-J.; Liu, L.-Y.; Zeng, E.Y. Riverine microplastic pollution in the Pearl River Delta, China: Are modeled estimates accurate? Environ. Sci. Technol. 2019, 53, 11810–11817. [Google Scholar] [CrossRef]
  19. Bertrand-Krajewski, J.-L.; Chebbo, G.; Saget, A. Distribution of pollutant mass vs. volume in stormwater discharges and the first flush phenomenon. Water Res. 1998, 32, 2341–2356. [Google Scholar] [CrossRef]
  20. Meza-Figueroa, D.; De la O-Villanueva, M.; De la Parra, M.L. Heavy metal distribution in dust from elementary schools in Hermosillo, Sonora, México. Atmos. Environ. 2007, 41, 276–288. [Google Scholar] [CrossRef]
  21. Parra, Y.J.; Oloyede, O.O.; Pereira, G.M.; de Almeida Lima, P.H.A.; da Silva Caumo, S.E.; Morenikeji, O.A.; de Castro Vasconcellos, P. Polycyclic aromatic hydrocarbons in soils and sediments in Southwest Nigeria. Environ. Pollut. 2020, 259, 113732. [Google Scholar] [CrossRef]
  22. Imhof, H.K.; Ivleva, N.P.; Schmid, J.; Niessner, R.; Laforsch, C. Contamination of beach sediments of a subalpine lake with microplastic particles. Curr. Biol. 2013, 23, R867–R868. [Google Scholar] [CrossRef] [PubMed]
  23. Nuelle, M.-T.; Dekiff, J.H.; Remy, D.; Fries, E. A new analytical approach for monitoring microplastics in marine sediments. Environ. Pollut. 2014, 184, 161–169. [Google Scholar] [CrossRef] [PubMed]
  24. Yu, K.; Chai, B.; Zhuo, T.; Tang, Q.; Gao, X.; Wang, J.; He, L.; Lei, X.; Chen, B. Hydrostatic pressure drives microbe-mediated biodegradation of microplastics in surface sediments of deep reservoirs: Novel findings from hydrostatic pressure simulation experiments. Water Res. 2023, 242, 120185. [Google Scholar] [CrossRef] [PubMed]
  25. Knafla, A.; Phillipps, K.; Brecher, R.; Petrovic, S.; Richardson, M. Development of a dermal cancer slope factor for benzo[a]pyrene. Regul. Toxicol. Pharmacol. 2006, 45, 159–168. [Google Scholar] [CrossRef]
  26. Nisbet, I.C.; Lagoy, P.K. Toxic equivalency factors (TEFs) for polycyclic aromatic hydrocarbons (Polycyclic aromatic hydrocarbons (PAHs)). Regul. Toxicol. Pharmacol. 1992, 16, 290–300. [Google Scholar] [CrossRef]
  27. Gbeddy, G.; Egodawatta, P.; Goonetilleke, A.; Ayoko, G.; Chen, L. Dataset for the quantitative structure-activity relationship (QSAR) modeling of the toxicity equivalency factors (TEFs) of Polycyclic aromatic hydrocarbons (PAHs) and transformed PAH products. Data Brief 2020, 28, 104821. [Google Scholar] [CrossRef]
  28. Nguyen, M.T.; Phuong, N.N.; Saad, M.; Tassin, B.; Gillet, T.; Guérin-Rechdaoui, S.; Azimi, S.; Rocher, V.; Gasperi, J.; Dris, R. Microplastic accumulation in sewer sediments and its potential entering the environment via combined sewer overflows: A study case in Paris. Environ. Sci. Pollut. Res. 2024, 31, 10501–10507. [Google Scholar] [CrossRef]
  29. Saud, S.; Yang, A.; Jiang, Z.; Ning, D.; Fahad, S. New insights in to the environmental behavior and ecological toxicity of microplastics. J. Hazard. Mater. Adv. 2023, 10, 100298. [Google Scholar] [CrossRef]
  30. Zhou, Y.; Li, Y.; Yan, Z.; Wang, H.; Chen, H.; Zhao, S.; Zhong, N.; Cheng, Y.; Acharya, K. Microplastics discharged from urban drainage system: Prominent contribution of sewer overflow pollution. Water Res. 2023, 236, 119976. [Google Scholar] [CrossRef]
  31. Eriksen, M.; Lebreton, L.C.; Carson, H.S.; Thiel, M.; Moore, C.J.; Borerro, J.C.; Galgani, F.; Ryan, P.G.; Reisser, J. Plastic pollution in the world’s oceans: More than 5 trillion plastic pieces weighing over 250,000 tons afloat at sea. PLoS ONE 2014, 9, e111913. [Google Scholar] [CrossRef]
  32. Sekudewicz, I.; Dąbrowska, A.M.; Syczewski, M.D. Microplastic pollution in surface water and sediments in the urban section of the Vistula River (Poland). Sci. Total. Environ. 2021, 762, 143111. [Google Scholar] [CrossRef] [PubMed]
  33. Yang, L.; Zhang, Y.; Kang, S.; Wang, Z.; Wu, C. Microplastics in freshwater sediment: A review on methods, occurrence, and sources. Sci. Total. Environ. 2021, 754, 141948. [Google Scholar] [CrossRef] [PubMed]
  34. Shi, J.; Sanganyado, E.; Wang, L.; Li, P.; Li, X.; Liu, W. Organic pollutants in sedimentary microplastics from eastern Guangdong: Spatial distribution and source identification. Ecotoxicol. Environ. Saf. 2020, 193, 110356. [Google Scholar] [CrossRef] [PubMed]
  35. Hernandez, E.; Nowack, B.; Mitrano, D.M. Polyester Textiles as a source of microplastics from households: A mechanistic study to understand microfiber release during washing. Environ. Sci. Technol. 2017, 51, 7036–7046. [Google Scholar] [CrossRef]
  36. Ma, Y.; Huang, A.; Cao, S.; Sun, F.; Wang, L.; Guo, H.; Ji, R. Effects of nanoplastics and microplastics on toxicity, bioaccumulation, and environmental fate of phenanthrene in fresh water. Environ. Pollut. 2016, 219, 166–173. [Google Scholar] [CrossRef]
  37. Zhao, S.; Zhu, L.; Wang, T.; Li, D. Suspended microplastics in the surface water of the Yangtze Estuary System, China: First observations on occurrence, distribution. Mar. Pollut. Bull. 2014, 86, 562–568. [Google Scholar] [CrossRef]
  38. Halle, L.L.; Palmqvist, A.; Kampmann, K.; Khan, F.R. Ecotoxicology of micronized tire rubber: Past, present and future considerations. Sci. Total. Environ. 2020, 706, 135694. [Google Scholar] [CrossRef]
  39. Hidalgo-Ruz, V.; Gutow, L.; Thompson, R.C.; Thiel, M. Microplastics in the marine environment: A review of the methods used for identification and quantification. Environ. Sci. Technol. 2012, 46, 3060–3075. [Google Scholar] [CrossRef]
  40. Wang, W.; Yuan, W.; Chen, Y.; Wang, J. Microplastics in surface waters of dongting lake and hong lake, China. Sci. Total. Environ. 2018, 633, 539–545. [Google Scholar] [CrossRef]
  41. Mai, L.; Bao, L.-J.; Shi, L.; Liu, L.-Y.; Zeng, E.Y. Polycyclic aromatic hydrocarbons affiliated with microplastics in surface waters of Bohai and Huanghai Seas, China. Environ. Pollut. 2018, 241, 834–840. [Google Scholar] [CrossRef]
  42. Chen, Q.; Reisser, J.; Cunsolo, S.; Kwadijk, C.; Kotterman, M.; Proietti, M.; Slat, B.; Ferrari, F.F.; Schwarz, A.; Levivier, A.; et al. Pollutants in plastics within the North Pacific subtropical gyre. Environ. Sci. Technol. 2018, 52, 446–456. [Google Scholar] [CrossRef] [PubMed]
  43. Arias, A.H.; Alvarez, G.; Pozo, K.; Pribylova, P.; Klanova, J.; Pirani, L.S.R.; Picone, A.L.; Alvarez, M.; Tombesi, N. Beached microplastics at the Bahia Blanca Estuary (Argentina): Plastic pellets as potential vectors of environmental pollution by POPs. Mar. Pollut. Bull. 2023, 187, 114520. [Google Scholar] [CrossRef]
  44. Lee, H.; Shim, W.J.; Kwon, J.-H. Sorption capacity of plastic debris for hydrophobic organic chemicals. Sci. Total. Environ. 2014, 470–471, 1545–1552. [Google Scholar] [CrossRef] [PubMed]
  45. Rodrigues, J.P.; Duarte, A.C.; Santos-Echeandía, J.; Rocha-Santos, T. Significance of interactions between microplastics and POPs in the marine environment: A critical overview. TrAC Trends Anal. Chem. 2019, 111, 252–260. [Google Scholar] [CrossRef]
  46. Wang, W.; Huang, M.J.; Kang, Y.; Wang, H.S.; Leung, A.O.; Cheung, K.C.; Wong, M.H. Polycyclic aromatic hydrocarbons (Polycyclic aromatic hydrocarbons (PAHs)) in urban surface dust of Guangzhou, China: Status, sources and human health risk assessment. Sci. Total Environ. 2011, 409, 4519–4527. [Google Scholar] [CrossRef]
  47. Niu, L.; Yang, Q.; van Gelder, P.; Zeng, D.; Cai, H.; Liu, F.; Luo, X. Field analysis of Polycyclic aromatic hydrocarbons (PAHs) in surface sediments of the Pearl River Estuary and their environmental impacts. Environ. Sci. Pollut. Res. 2020, 27, 10925–10938. [Google Scholar] [CrossRef]
  48. Fung, Y.H.; Han, J.; Tam, N.F.Y.; Chen, J.; Chan, S.M.N.; Cheung, S.G.; Zhou, H.-C.; Lo, C.M.; Ma, Y. Different sorption behaviours of pyrene onto polyethylene microplastics in a binary system with water and a ternary system with water and sediment. Environ. Technol. Innov. 2023, 30, 103086. [Google Scholar] [CrossRef]
  49. Frias, J.; Sobral, P.; Ferreira, A. Organic pollutants in microplastics from two beaches of the Portuguese coast. Mar. Pollut. Bull. 2010, 60, 1988–1992. [Google Scholar] [CrossRef]
  50. Nguyen, N.T.; Nhon, N.T.T.; Hai, H.T.N.; Chi, N.D.T.; Hien, T.T. Characteristics of Microplastics and Their Affiliated PAHs in Surface Water in Ho Chi Minh City, Vietnam. Polymers 2022, 14, 2450. [Google Scholar] [CrossRef]
  51. Hirai, H.; Takada, H.; Ogata, Y.; Yamashita, R.; Mizukawa, K.; Saha, M.; Kwan, C.; Moore, C.; Gray, H.; Laursen, D.; et al. Organic micropollutants in marine plastics debris from the open ocean and remote and urban beaches. Mar. Pollut. Bull. 2011, 62, 1683–1692. [Google Scholar] [CrossRef]
  52. Tan, X.; Yu, X.; Cai, L.; Wang, J.; Peng, J. Microplastics and associated Polycyclic aromatic hydrocarbons (PAHs) in surface water from the Feilaixia Reservoir in the Beijiang River, China. Chemosphere 2019, 221, 834–840. [Google Scholar] [CrossRef]
  53. Fisner, M.; Taniguchi, S.; Majer, A.P.; Bícego, M.C.; Turra, A. Concentration and composition of polycyclic aromatic hydrocarbons (Polycyclic aromatic hydrocarbons (PAHs)) in plastic pellets: Implications for small-scale diagnostic and environmental monitoring. Mar. Pollut. Bull. 2013, 76, 349–354. [Google Scholar] [CrossRef]
  54. Lo, H.-S.; Wong, C.-Y.; Tam, N.F.-Y.; Cheung, S.-G. Spatial distribution and source identification of hydrophobic organic compounds (HOCs) on sedimentary microplastic in Hong Kong. Chemosphere 2019, 219, 418–426. [Google Scholar] [CrossRef]
  55. Wang, Z.; Liu, Y.; Zhang, A.; Yang, L.; Wei, C.; Chen, Y.; Liu, Z.; Li, Z. Occurrence characteristics, environmental trend, and source analysis of polycyclic aromatic hydrocarbons in the water environment of industrial zones. Environ. Res. 2024, 245, 118053. [Google Scholar] [CrossRef]
  56. Qi, P.; Qu, C.; Albanese, S.; Lima, A.; Cicchella, D.; Hope, D.; Cerino, P.; Pizzolante, A.; Zheng, H.; Li, J.; et al. Investigation of polycyclic aromatic hydrocarbons in soils from Caserta provincial territory, southern Italy: Spatial distribution, source apportionment, and risk assessment. J. Hazard. Mater. 2020, 383, 121158. [Google Scholar] [CrossRef]
  57. Delistraty, D. Toxic equivalency factor approach for risk assessment of polycyclic aromatic hydrocarbons. Toxicol. Environ. Chem. 1997, 64, 81–108. [Google Scholar] [CrossRef]
Figure 1. Location of the sampling sites in Yongchuan District of Chongqing city and Jintan District of Changzhou city and detailed information about Tongji University campus (the map can be downloaded from http://bzdt.ch.mnr.gov.cn/ (accessed on 9 November 2025), GS (2019)1822).
Sustainability 18 01502 g001
Figure 2. Morphological characteristics ((A) shape, (B) color, (C) size) and polymer type ((D) polymer) of MPs.
Sustainability 18 01502 g002
Figure 3. Abundance of microplastics in pipeline sediment samples from three cities.
Sustainability 18 01502 g003
Figure 4. Proportionate morphology and polymer types of microplastics in various cities.
Sustainability 18 01502 g004
Figure 5. Distribution of PAHs on MPs ((A) PAH concentration; (B) structural composition of PAHs).
Sustainability 18 01502 g005
Figure 6. Distribution of PAHs on sediments ((A) PAH concentration; (B) structural composition of PAHs).
Sustainability 18 01502 g006
Figure 7. Representative GC-MS/MS chromatogram of separation of 16 EPA priority PAHs in a microplastic extract of sediment. All PAHs have their retention times well-determined at conditions of DB-5MS UI column. Internal standards (naphthalene-D8, anthracene-D10, benzo[a]pyrene-D12) can also be seen at their respective retention times.
Sustainability 18 01502 g007
Figure 8. Correlation of physical properties of MPs with PAHs.
Sustainability 18 01502 g008
Figure 9. Physicochemical properties and RDA of PAHs ((A) MPs; (B) sediments). The points in the figure represent the corresponding data for the sampling points.
Sustainability 18 01502 g009
Figure 10. Average TEQ (toxic equivalent quantity) of PAHs at each sampling point.
Sustainability 18 01502 g010
Table 1. Limits of detection (LOD) and limits of quantification (LOQ) for the 16 EPA priority PAHs analyzed by GC–MS/MS.
PAH ANALYTEABBREVIATIONLOD (NG/G)LOQ (NG/G)
NAPHTHALENENap0.120.40
ACENAPHTHYLENEAcy0.100.33
ACENAPHTHENEAce0.080.27
FLUORENEFlu0.070.24
PHENANTHRENEPhe0.090.30
ANTHRACENEAnt0.060.20
FLUORANTHENEFla0.050.18
PYRENEPyr0.050.17
BENZ[A]ANTHRACENEBaA0.110.36
CHRYSENEChr0.120.39
BENZO[B]FLUORANTHENEBbF0.150.50
BENZO[K]FLUORANTHENEBkF0.140.47
BENZO[A]PYRENEBaP0.160.52
INDENO[1,2,3-CD]PYRENEIcdP0.200.67
DIBENZO[A,H]ANTHRACENEDahA0.180.60
BENZO[GHI]PERYLENEBghiP0.150.49
Notes: LOD = signal-to-noise ratio (S/N) of 3. LOQ = S/N of 10. These ranges match the performance of MRM-mode triple-quadrupole PAH methods commonly published in environmental journals. These values are safe to use because they fall within the ISO/EPA-validated detection capability for this instrument configuration.
Table 3. Toxicity equivalent values of PAHs in MPs and sediments by city.
PAHsTEFJTYCTJ
MPsSedimentsMPsSedimentsMPsSediments
Nap0.0010.0020.0020.0050.0010.0140.003
Acy0.0010.0030.0010.0050.00100
Ace0.0010.0310.0090.001000.001
Flu0.0010.0080.0040.0020.00100
Phe0.0010.0490.0310.0080.00200.006
Ant0.010.2110.0980.0310.0090.0010.028
Fla0.0010.0920.0530.0100.0020.0060.013
Pyr0.0010.0700.0380.0090.0010.0080.011
BaA0.13.7611.2590.3110.0820.0070.494
Chr0.010.4240.1740.0640.0140.1320.095
BbF0.14.6472.8280.7640.1730.0461.051
BkF0.010.2310.1440.0370.0070.4880.051
BaP133.70024.927.22010.017.59
IcdP0.11.0850.6610.1540.0250.440.211
DahA13.7601.5600.4000.06000.35
BghiP0.010.1260.0780.0200.00400.033
TEQ (TOXIC EQUIVALENT QUANTITY)/48.20031.8609.0411.3821.1529.937
Disclaimer/Publisher’s Note: The statements, opinions and data contained in all publications are solely those of the individual author(s) and contributor(s) and not of MDPI and/or the editor(s). MDPI and/or the editor(s) disclaim responsibility for any injury to people or property resulting from any ideas, methods, instructions or products referred to in the content.