1. Introduction
The evolution of technology has led governments worldwide to digitize their services, transitioning from traditional paper-based systems to advanced automated digital platforms. This transformation enables businesses and governments to operate more efficiently, reduce operational costs, improve citizen interaction, and provide sustainable services that are always available. This shift in government processes supports the achievement of the United Nations (UN) Sustainable Development Goals (SDGs) [
1]. The COVID-19 pandemic has significantly accelerated the digitization of government services, leading to the creation of e-government platforms [
2].
E-government platforms are designed to improve the efficiency, transparency, and accessibility of public services by replacing traditional manual services with automated systems that encourage greater citizen participation. In Saudi Arabia, key e-government platforms such as Absher and Tawakkalna have played a pivotal role in the transformation of public services. Absher, managed by the Ministry of Interior, provides services to citizens, residents, and visitors, while Tawakkalna—initially launched as a health and COVID-19 tracking app—has evolved into a super app that offers services from various ministries and government organizations.
The adoption of e-government platforms in Saudi Arabia has positively impacted the economy by reducing the time, resources, and effort required to complete processes, while digitalization has allowed for constant access to automated government services, accelerated service delivery, and minimized human errors in repetitive tasks [
3]. Furthermore, the Saudi Arabian authority is actively pursuing sustainability as a core component in Vision 2030. This transformation has improved citizen participation, strengthened transparency and accountability, reduced in-person visits, and contributed to environmental sustainability by reducing pollution, conserving resources, and improving the quality of citizen life [
4]. The Saudi Authority for Data and Artificial Intelligence (SDAIA) has launched various projects that consider digitalization and sustainability in parallel to advance environmental objectives, such as replacing paper transactions, automating services, and making them available online, which serve to reduce pollution and preserve raw materials and energy sources; in addition, they have focused on creating jobs contributing to building a digitalized society that involve women [
4].
Sustainability is measured by compliance with the Sustainable Development Goals of the United Nations, introduced in 2015 as part of the 2030 Agenda [
1]. This approach is aligned with the recommendations of Martínez-Peláez et al. [
5], who emphasized the importance of integrating data from multiple sources to ensure reliability and comprehensiveness in sustainability research. The SDGs emphasize the need to increase the availability of high-quality, timely, reliable, and disaggregated data, which can be achieved by integrating a digitalization network of information beneficial for society, government, and businesses. This study explores the inter-relationship between digitalization and sustainable development through the creation of the SDG-AMF, focusing on productivity, education, and equality in Saudi Arabia, which was selected among other developed countries due to its promotion of digital transformation for more than a decade, its drastic improvement in e-services, and its recent rise in rapid digitalization. Saudi Arabia offers a compelling case for analyzing digitalization–SDG linkages, owing to its distinctive developmental trajectory under Vision 2030, which explicitly prioritizes sustainable development through innovation, e-government, and inclusive digital services. Notably, the Kingdom advanced more than 25 positions in the United Nations E-Government Development Index (EGDI), rising from 80th in 2003 to 38th in 2020, reflecting significant strides in e-government maturity and ICT infrastructure enhancement [
6,
7]. This upward trajectory is further bolstered by strategic national initiatives led by the Saudi Data and Artificial Intelligence Authority (SDAIA) and GovTech Maturity programs [
8]. Building on this momentum, the present study examines how digital transformation can act as a driver for pragmatic sustainability, a concept denoting context-sensitive and implementable solutions that integrate national digital progress with measurable SDG outcomes [
9]. The proposed Sustainable Development Goals Achievement Measurement Framework (SDG-AMF) operationalizes digital transformation through empirically grounded proxies and delivers actionable insights based on Saudi Arabia’s longitudinal performance under Vision 2030.
This study links national digitalization indicators to SDG outcomes, thereby supporting better policymaking, reporting, and strategic planning. The research questions that guide this study are as follows: Which key digitalization indicators are statistically associated with progress toward achieving the SDGs, and how can these relationships inform the development strategies of e-government in Saudi Arabia and other countries? Sustainable e-government and its functioning require the participation of cross-sector collaboration among various governmental divisions, as well as partnerships with the business and industry sectors. Crucially, strong and effective leadership is essential for overseeing and coordinating the entire process. The main purpose of this study is to investigate the relationship between digitalization and sustainability of development by proposing and applying a novel analytical framework—the Sustainable Development Goals Achievement Measurement Framework (SDG-AMF)—that encompasses two key stages:
Data processing
- (a)
Data collection from authoritative national and international sources;
- (b)
Data preprocessing and standardization for consistency.
Data analysis
- (a)
Conceptual and empirical alignment of indicators with relevant SDGs;
- (b)
Statistical analysis, including descriptive statistics, Pearson correlation, and multiple linear regression (OLS) modeling.
The SDG-AMF transcends the limitations of conventional tools like the UN E-Government Development Index (EGDI) and the Organization for Economic Co-operation and Development (OECD) Digital Government Indicators (DGIs). By employing a dual-stage method—involving correlation and regression—the framework uncovers direct sector-specific relationships between digitalization indicators and the SDG results, allowing it to detect nuanced dynamics, including inverse associations such as EGDI vs. SDG 9 in low-RD environments, which traditional indices often overlook. Furthermore, the proxy-based operationalization proposed in this study introduces a novel analytical perspective by quantitatively linking digitalization inputs to specific SDG outcomes using empirically validated proxies, unlike the EGDI and DGIs, which evaluate digital government performance at a structural or policy level. Although the EGDI and DGIs rely on survey-based composite indices or institutional self-assessments, the SDG-AMF employs time-series and country-level numeric indicators. In addition, the framework demonstrates adaptability in the country, as applied in the context of Saudi Arabia’s digitalization within the e-government sector, where the country’s rapid digital transformation and advanced e-government services make it an ideal case study for application of this framework. This approach provides actionable insights for policymakers, enabling evidence-based decision-making and strategic planning. The main contributions to this research are as follows:
The development of a structured dataset by collecting time-series data and integrating open-access data such as those from authoritative and reputable global and national sources, including UNESCO, the United Nations SDG database, GaStat, the World Bank (WB), and the OECD;
The proposal of a novel analytical framework—named the Sustainable Development Goals Achievement Measurement Framework (SDG-AMF)—that provides a practically relevant and analytically deep approach. In addition, the systematic guidance of data collection, preprocessing, and statistical analysis (descriptive, correlation, and regression) in order to identify the most significant digitalization indicators influencing sustainable development, aligned with the SDGs. The framework is based on insights from the literature review, which identified the need for structured methodologies to align digitalization indicators with the SDGs.
The objectives of this research paper are to extract the most important indicators of digitalization that affect sustainability and to measure the degree of achievement of the Sustainable Development Goals. The remaining sections of this paper are as follows:
Section 2 explains the main background concepts and highlights the most recent and relevant literature review, which is based on a separate revision of the connection between digitalization and certain SDG elements;
Section 3 contains a description of the methodology utilized to achieve the proposed objectives;
Section 4 contains the results;
Section 5 discusses the finding of the applied method and its validation and interprets the results;
Section 6 contains the conclusions and future research in the area.
2. Literature Review
It is essential to clarify the fundamental ideas associated with digitalization in relation to sustainable development, as previous research indicates its increasing impact on areas such as education, governance, innovation, and social inclusion. However, current studies tend to be disjointed, frequently focusing on specific SDGs or isolated metrics.
2.1. Defining Digitalization in the Sustainability Context
In the context of this research, digitalization refers to the purposeful deployment of advanced information and communication technologies (ICTs) within governmental, social, and institutional frameworks to re-engineer processes, optimize data management, and transform service delivery into more efficient, inclusive, and user-centric digital ecosystems [
5]. More broadly, digital transformation is described by [
10] as follows:
The profound transformation of business and organizational activities, processes, competencies, and models in a strategic and prioritized way, with present and future changes in mind, to fully leverage the changes and opportunities of a mix of digital technologies and their increasing impact across industries.
However, this process typically involves interoperable systems, intelligent decision-making tools, workflow automation, and enhancements in user interaction, all aimed at generating new forms of public and private value [
11]. Sustainability is understood to be an expression that meets the present societal needs without reducing the capacity of future generations to meet their needs [
12], and sustainable development requires a multidimensional balance between environmental protection, social equity, and economic stability. The 2030 Agenda for Sustainable Development of the United Nations, adopted in 2015, translates this vision into 17 SDGs, which collectively address global challenges ranging from poverty and access to education to gender equality, the adoption of renewable energy, and innovation capacity [
13].
2.2. Digitalization as a Strategic Enabler of SDG Progress
The relationship between digitalization and sustainable development presents both high-value opportunities and systemic risks. Strategically implemented digital solutions can reduce resource inefficiencies, strengthen operational resilience, and accelerate climate action through technologies such as smart grids, adaptive mobility systems, and closed-loop manufacturing models [
14,
15]. In addition, these tools can promote the equitable distribution of services and targeted interventions for both social inclusion and environmental management [
16,
17]. However, the realization of these benefits is contingent upon addressing persistent challenges: uneven access to digital infrastructure, the substantial energy footprint of ICT systems, and governance concerns related to ethics, data privacy, and cybersecurity. Incorporation into long-term development frameworks, such as Saudi Arabia’s Vision 2030, exemplifies how digitalization can act as a cross-functional enabler for multiple SDGs, with SDG 4 (Quality Education), SDG 5 (Gender Equality), SDG 8 (Decent Work and Economic Growth), SDG 9 (Industry, Innovation and Infrastructure), SDG 12 (Responsible Consumption and Production), and SDG 16 (Peace, Justice and Strong Institutions) being the strongest links [
11].
2.3. Linkages Between Digitalization and Selected SDGs
Digital technologies expand educational reach by eliminating geographic and socioeconomic barriers through tools such as virtual classrooms, adaptive learning platforms, and open educational repositories [
14]. However, the impact of these systems is highly dependent on the quality, affordability, and user readiness of the infrastructure [
18,
19]. The lessons learned from the COVID-19 pandemic underscore that insufficient device access and poor connectivity can lead to significant learning failures [
20]; therefore, the International Federation of Library Associations and Institutions (IFLA) has identified digital literacy as an essential competency for equitable education and future employability [
21].
The digital domain offers opportunities to advance women’s participation in education, entrepreneurship, and healthcare, while platforms for online commerce, remote learning, and telemedicine improve access and agency [
22,
23,
24]. However, systemic barriers persist: limited Internet connectivity, lower digital skills among women and girls, and under-representation in STEM disciplines contribute to sustained inequality [
25,
26]. Safety concerns, such as cyber harassment, further hinder female participation in digital spaces [
27,
28].
Digitalization promotes job creation, productivity gains, and innovative employment models, including remote work and platform-based economies [
29,
30]. It also helps SMEs to integrate into international markets by reducing operational and transactional barriers [
31]. At the same time, disparities in digital access and the rise of insecure gig work raise concerns about equitable wages, worker protections, and job stability [
32].
Emerging technologies such as the Internet of Things (IoT), artificial intelligence (AI), and blockchain are redefining manufacturing processes, infrastructure management, and supply chain operations [
33,
34] by enabling predictive maintenance, optimizing resource allocation, and strengthening disaster resilience. However, many developing economies face ongoing infrastructure deficits, limited cybersecurity capacity, and possible automation labor displacement [
35,
36].
Digital tools enable sustainable production practices by improving transparency, allowing for real-time resource monitoring, and streamlining supply chains [
31,
37]. Predictive analytics and IoT-based tracking systems, for example, can influence consumer behaviors toward more sustainable patterns. However, the environmental impact of large-scale data centers, privacy issues, and uneven adoption rates highlight the need for green ICT investments and targeted capacity-building [
9,
38,
39,
40].
In addition, E-government platforms can improve governance through greater transparency, citizen participation, and more accountable institutions [
41]. Open data programs improve anti-corruption measures and build public trust [
42], while AI-supported analytics can facilitate more efficient judicial processes and evidence-based policymaking [
43].
2.4. E-Government Performance and Benchmarking in Saudi Arabia
Some of the leading nations in government digital transformation—such as Denmark, Estonia, Singapore, South Korea, Iceland, and Saudi Arabia—have implemented well-organized e-government platforms that offer flexible and seamless access to public services. According to the United Nations EDGI (2024), Saudi Arabia is at the advanced level of the top 10 leading countries in e-government, despite the challenges faced as a developing country. As part of Vision 2030, Saudi Arabia has placed the development of electronic government as a cornerstone of its digital transformation strategy, with the aim of improving efficiency, transparency, and civic participation [
41]. The literature identifies several performance assessment approaches.
EGDI: A UN index that combines the Online Service Index (OSI), the Telecommunication Infrastructure Index (TII), and the Human Capital Index (HCI) [
5]. Digital transformation has been a crucial component of the Kingdom of Saudi Arabia (KSA) Vision 2030. Thus, Saudi Arabia has dedicated a massive effort to overcome the challenges, invest in building necessary infrastructure such as 5G and broadband connectivity, and achieve an advanced level worldwide in digitalization. A longitudinal study by Almehmadi (2003–2020) reported that Saudi Arabia advanced 25 places in the global ranking due to targeted ICT investments and human capital improvements [
42,
43]. These gains are related to progress in infrastructure-focused SDGs [
9].
Sentiment Analysis and User Feedback: Natural language processing applied to social media, surveys, and trust metrics to evaluate citizen satisfaction [
44].
Open Government Data (OGD) Assessment: Evaluates the transparency, accessibility, and interoperability of public datasets. Although significant progress has been made since the initiative was launched in 2011, integration into policymaking remains incomplete [
45,
46].
Usability and Accessibility Testing: Examines platform design, mobile compatibility, and compliance with accessibility standards. The findings indicate a lack of inclusivity in both web and mobile services [
47,
48].
Cybersecurity and Data Privacy: The National Cybersecurity Authority (NCA) and the Digital Government Authority (DGA) are under supervision, with 2021 data protection laws that safeguard the integrity of service and user privacy [
49].
Benchmarking Against Global Standards: Comparisons with the OECD Digital Government Indicators, the World Bank’s GovTech Maturity Index (GTMI) [
50], and the Global Innovation Index (GII) [
51] allow for systematic tracking of progress, resource allocation, and accountability [
52].
2.5. Analytical Perspective
The literature review revealed several gaps in existing research, including the lack of consolidated datasets that combine digitalization indicators and the SDG outcomes [
10,
11]. Furthermore, there is insufficient empirical validation or limited focus on developing countries such as Saudi Arabia. Most current studies measure sustainability by surveying [
46,
53] or systematically collecting data from the literature [
11].
Saudi Arabia’s e-government trajectory illustrates how sustained investment in ICT, regulatory reform, and structured benchmarking can jointly advance the digitalization and alignment of the SDGs [
8,
9]. Continuous monitoring—for example, through composite indices, user sentiment analysis, open data evaluation, usability reviews, and cybersecurity audits—ensures that digital governance remains closely aligned with national development priorities and global sustainability objectives. Several recent studies, such as [
9,
54], have highlighted the role of smart governance and inclusive e-government in advancing SDGs. For instance, the work byDjatmiko et al. [
9] focuses on marginalized communities’ access to public services through digital transformation, while Alkorbi et al. [
54] examine the balance between citizen participation and administrative capacity. However, these studies remain largely qualitative or conceptual. This study contributes a novel empirical layer of the SDG–AMF, offering a time-series methodology to quantify national digitalization indicators (e.g., Internet use, EGDI, RD expenditure) in relation to selected SDGs. The framework provides a replicable and policy-relevant approach that directly reflected on the supported execution of Vision 2030 priorities and pragmatic sustainability principles.
Table 1 compares recent research with the proposed SDG-AMF, which is described in the next section. Furthermore, the proposed SDG-AMF can be positioned against two widely used international frameworks: the UN EGDI and the OECD Digital Government Indicators (DGIs). A summary of the comparative positioning of the SDG-AMF with respect to the UN EGDI and OECD Digital Government Indicators is presented in
Table 2.
The UN EGDI primarily focuses on three core dimensions: online public services, telecommunication infrastructure, and human capital. It is constructed from data provided by the UN DESA’s e-government survey, ITU statistics, and UNESCO/UN statistical sources, and is published as a biennial cross-sectional index (for example, for the years 2014, 2016, 2018, 2020, and 2022). The weighting scheme is fixed and top–down, defined by the UN methodological guidelines, and is not empirically calibrated for specific country–SDG contexts. The EGDI is therefore mainly intended for the global benchmarking and ranking of e-government maturity across countries rather than for detailed analysis of how digitalization affects particular SDG outcomes.
The OECD DGIs are structured around several governance dimensions, including “digital by design,” “data-driven public sector,” “open by default,” “user-driven services,” “government as a platform,” and “proactiveness,” relying largely on OECD country surveys and self-reported administrative data supplied by member states. Assessments are produced in irregular, wave-based editions, typically for OECD members only. Indicators are normalized and aggregated with fixed-dimension weights determined by the design of the OECD framework. The primary purpose of the DGIs is to support comparative assessment of digital government practices and reform readiness in OECD countries, rather than to provide a time-series SDG-linked analytical tool.
3. Methodology and Data Source Implementation
The Sustainable Development Goals Achievement Measurement Framework (SDG-AMF) is designed to empirically examine the relationship between digitalization and Sustainable Development Goals (SDGs) through a transparent, longitudinal, and policy-oriented analytical structure. Because direct measurements linking most digitalization indicators to specific SDG targets are not available, the framework adopts a proxy-based mapping strategy in which digital indicators are conceptually aligned with relevant SDGs and subsequently validated through statistical analysis. This mapping is explicitly constructed to be transparent, testable, and replicable, ensuring both methodological rigor and cross-national applicability. The SDG-AMF is implemented as a time-series, SDG-linked model that integrates annual digitalization indicators and sustainability outcomes for Saudi Arabia during the period 2010–2024. The framework draws on multiple authoritative sources, including the World Bank, UNESCO, the United Nations SDG Database, national statistics (GaStat), UN EGDI scores, and Vision 2030 reports. Its core dimensions consist of digitalization indicators explicitly aligned with selected SDGs—namely SDGs 4, 5, 8, 9, and 16—together with corresponding sustainability outcome measures. The proxy-based weighting and mapping scheme is empirically validated in two stages. First, indicators are linked to the SDG through conceptual and policy alignment grounded in the literature and the UN SDG metadata. Second, these links are tested using correlation and multiple regression analysis, with primary and secondary relationships determined by the strongest combined theoretical, policy, and statistical evidence. Importantly, the SDG-AMF is not intended as a generic digital maturity index. Rather, it functions as a policy-oriented analytical tool that identifies which digitalization dimensions exert the greatest influence on specific SDG domains, thereby supporting evidence-based prioritization of digital and sustainability interventions while remaining adaptable to other national contexts.
3.1. Data Sources
This study adopts a structured, quantitative time-series design to construct a longitudinal dataset of digitalization indicators for Saudi Arabia. Due to the absence of an existing dataset that integrates digitalization measures with SDG indicators over time, a comprehensive dataset was developed by systematically extracting, harmonizing, and merging data from multiple reputable national and international sources. All variables were obtained from authoritative primary providers to ensure reliability, comparability, and international consistency. The integrated dataset draws on the following sources:
WB: Internet users (percentage of population), gross domestic product (GDP) per capita (USD), tertiary education enrollment (percentage), and research and development (RD) expenditure (percentage of GDP);
GaStat: Female labor force participation rate (percentage);
Organization for OECD: EGDI scores;
UNESCO: Validation of national RD expenditure data;
United Nations SDG Database: Outcome indicators for SDG 4 (Quality Education), SDG 5 (Gender Equality), SDG 8 (Decent Work and Economic Growth), SDG 9 (Industry, Innovation and Infrastructure), and SDG 16 (Peace, Justice and Strong Institutions).
To operationalize the relationship between digitalization and SDG performance, the framework integrates conceptual alignment with empirical validation. Although prior studies (e.g., ElMassah and Mohieldin [
10]) establish a theoretical link between digitalization and sustainable development, the SDG-AMF advances this literature by formally testing these relationships using statistical methods.
3.2. SDG-AMF Implementation
The SDG-AMF adopts a quantitative and data-driven research design to examine the relationship between digitalization and sustainable development in the context of Saudi Arabia’s transformation of the electronic government. Its methodological novelty lies in its integrated structure, which combines (i) theoretical alignment, (ii) proxy-based operationalization, (iii) statistical linkage, (iv) systematic weighting and aggregation, and (v) rigorous empirical validation. Unlike many SDG dashboards and composite indices that rely on opaque weighting schemes, the SDG-AMF is explicitly designed around transparency and traceability—from digitalization inputs to proxy indicators to SDG outcomes—using open rationales, documented weights, and sensitivity analysis. The framework benchmarks national performance against relevant SDGs to identify the most influential digitalization drivers.
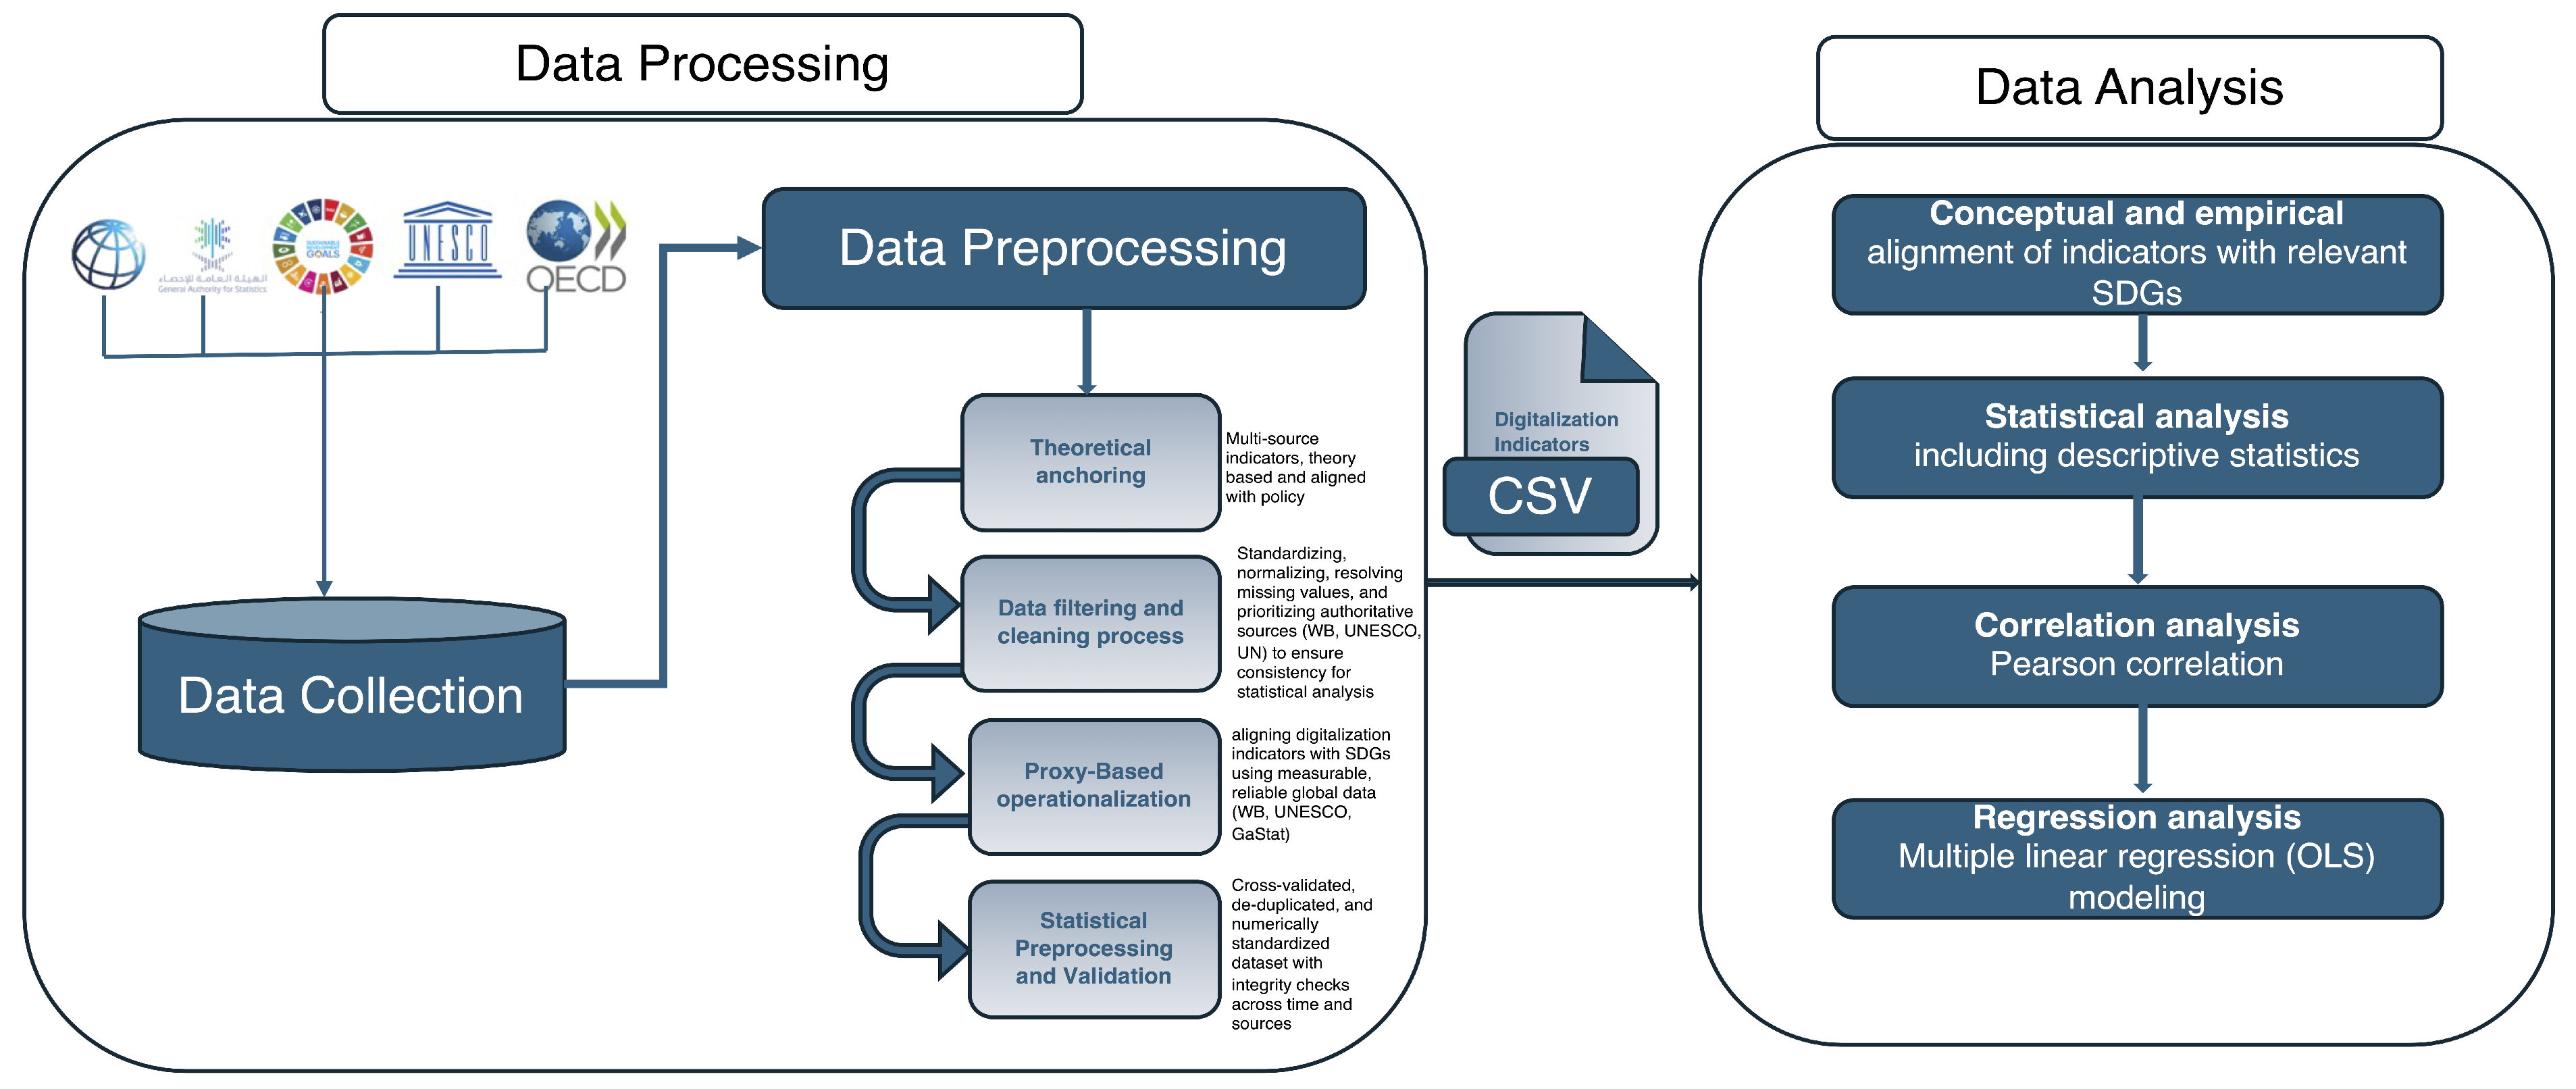
Figure 1 illustrates the overall SDG-AMF architecture, integrating data processing and analytical components.
3.2.1. Data Processing
Because there was no consolidated dataset combining digitalization and SDG indicators, a structured longitudinal time-series dataset was constructed for the period 2010–2024. To ensure international applicability, the SDG-AMF was designed to be country-agnostic by relying on globally standardized data sources such as the World Bank, UNESCO, OECD, and the UN SDG database. For this study, Saudi Arabia was selected due to its strategic emphasis on digital transformation under Vision 2030. The resulting Saudi Arabia Digitalization for Measuring the SDGs (SADM-SDG) dataset integrates independent digitalization indicators and dependent SDG outcome variables.
3.2.2. Data Collection
Data were retrieved primarily through official APIs to ensure consistency between reporting years. All variables were formatted into a uniform CSV structure, enabling reproducible statistical analysis. Digitalization indicators include Internet users, GDP per capita, tertiary education enrollment, participation in the female labor force, the EGDI, and RD expenditure. The dependent variables correspond to SDGs 4, 5, 8, 9, and 16. Although previous studies identify links between digitalization and SDG 12 [
11], this study excludes SDG 12 due to the absence of consistent time-series data, which is essential for correlation and regression analysis and for avoiding false inferences [
55].
Table 3 summarizes the dataset structure and the definitions of the variables.
3.2.3. Data Preprocessing
Data preprocessing ensured temporal and structural consistency through standardized variable naming, numeric conversion, redundancy removal, and validation across sources. Following Reynolds et al. [
19], preprocessing included theoretical anchoring, data filtering and cleaning, proxy-based operationalization, and statistical preparation. Data were retrieved through a deterministic acquisition–preprocessing pipeline designed to construct an annual panel for 2010–2024 using World Bank APIs. After normalization and transformation to a wide format, missing values were interpolated only when adjacent observations were available; otherwise, values were retained as missing to preserve transparency. Sanity checks, including winsorization of monetary outliers and bounds enforcement for percentage variables, were applied prior to exporting the final dataset. The details of these steps are presented as follows:
Theoretical anchoring:
This follows the formulation of the unique SADM-SDG dataset, which integrates multi-source data from authoritative providers and spans a 15-year period (2010–2024). The study period was selected based on the launch of Saudi Arabia’s first e-government action plan in 2006, which established the infrastructure for developing high-quality and easy-to-access government services. The e-government platforms were actually activated in 2010, and a theoretical anchor was used to identify key digitalization indicators grounded theoretically from the literature, which were then aligned with policy frameworks inspired by both the most relevant UN SDGs and Saudi Vision 2030. The key digitalization indicators’ selection criteria were measurable variables aligned with international benchmarks that represented different pillars of digitalization, such as Internet access, service quality, and innovation investment suitable for statistical modeling, which were continuously available and recorded and updated yearly from 2010 to 2024.The chosen indicators were globally comparable across countries’ benchmarking efforts, such as the EGDI rankings. All selected indicators should be directly aligned with the SDGs, as well as with Saudi Arabia’s Vision 2030 and national digitalization strategies [
61].
Data filtering and cleaning process:
At this stage, a new algorithm was introduced to retrieve data dynamically from reputable and authoritative sources, allowing for customization of the selected country by modifying the corresponding code and enabling flexibility in defining the desired time period. The Data Retrieval and Preprocessing of Digitalization Indicators Algorithm 1 was developed to clean and align data consistently over time.
The implemented dataset is based on a deterministic acquisition–preprocessing pipeline designed to construct an annual panel (2010–2024) of Saudi Arabia’s digitalization indicators using the WB APIs. After normalizing the raw feed (country, date, indicator, and value), calendar years were extracted, the data were pivoted into a wide format (one row per year), variable names were harmonized, and full coverage for 2010–2024 was enforced. Missing annual gaps were linearly interpolated only when two or more adjacent observations were available; otherwise, values were left as missing for transparency. Light sanity checks—such as winsorizing monetary outliers and clamping bounded percentage variables within the range [0, 100]—were applied before exporting the final analysis-ready CSV file. The algorithm’s design emphasizes reproducibility through explicit indicator mapping and date constraints, facilitating seamless integration with descriptive statistics, correlation analysis, and regression modeling. Moreover, since redundant entries may occur when retrieving data from multiple sources, this study prioritizes the World Bank for data on Internet usage, GDP per capita, and tertiary education enrollment; UNESCO for RD expenditure; and the United Nations EGDI for e-government performance scores.
| Algorithm 1: Data Retrieval and Preprocessing of Digitalization Indicators (Saudi Arabia) |
|
Require: Country code ; year range ; indicator map I |
| IT.NET.USER.ZS → Internet users (% of population) |
| NY.GDP.PCAP.CD → GDP per capita (current US$) |
| SE.TER.ENRR → Tertiary enrollment (% gross) |
| SL.TLF.CACT.FE.ZS → Female labor force participation (%) |
| GB.XPD.RSDV.GD.ZS → RD expenditure (% of GDP) |
|
Ensure: Preprocessed wide table D with one row per year and one column per indicator |
|
1: Import libraries: wbdata, UNESCO, UN_EGDI, datetime |
|
2: Set date bounds: 2010-01-01, 2024-01-01 |
|
3: Retrieve raw frame: |
| |
|
4: Convert R to DataFrame T; standardize column names to country, date, indicator, value |
|
5: Derive year: Year ← date.year; keep rows with Year |
|
6: Pivot to wide: |
|
7: Rename columns in W using the human-readable names in I |
|
8: Sort by Year ascending; cast Year to integer; reset index |
|
9: Handle missing values: |
| for each indicator column j in W do |
| if j has at least two observations then |
| apply annual linear interpolation within Y |
| else |
| keep as NaN (flag for data completion) |
| end if |
|
10: Enforce year coverage: ensure all Y are present; insert missing years with NaN rows if needed |
|
11: Outlier sanity checks (optional): winsorize 1% tails for monetary series; ensure bounded percentage metrics in |
|
12: Export: ; save as Saudi_Digitalization_2010_2024.csv |
|
13: return D |
Proxy-based operationalization:
Unlike existing digital government measurement frameworks such as the OECD Digital Government Indicators [
50] and the United Nations EGDI [
62], the proposed SDG-AMF explicitly operationalizes digitalization–SDG linkages through theoretically grounded and empirically validated proxy variables. This proxy-based approach is not based on subjective author judgment; rather, it responds to a well-documented limitation in the sustainability and digitalization literature; namely, the absence of direct, annual, and quantifiable indicators capable of capturing the multidimensional effects of digitalization on SDG outcomes [
14,
15].
Proxy-based operationalization is widely adopted in sustainability economics, ICT-for-development, and innovation studies when latent constructs—such as institutional digital capacity, digital inclusion, or innovation readiness—cannot be directly observed or measured [
19]. In this context, the SDG-AMF employs proxy variables to translate abstract digitalization mechanisms into measurable constructs that are theoretically interpretable, statistically tractable, and internationally comparable.
A structured proxy variable classification was therefore applied to define dependent SDG outcomes and independent digitalization driver variables after transforming all collected indicators into a harmonized numerical format. Independent variables were selected to represent three theoretically established channels through which digitalization affects sustainable development: (i) digital access and inclusion, (ii) institutional digital governance capacity, and (iii) innovation and technological capability. These channels are consistently identified in endogenous growth theory, digital divide theory, and digital government literature as primary mechanisms linking ICT and public sector digitalization to development outcomes [
63].
Accordingly, the key independent digitalization indicators include Internet users (% of population), the EGDI, and Research and Development (RD) expenditure (% of GDP). Internet usage is widely used as a proxy for digital access and inclusion in SDG-oriented ICT studies [
15,
64], reflecting the population’s ability to participate in digital education, innovation, and governance ecosystems; the EGDI is employed as a proxy for institutional digital governance maturity, as it integrates online service provision, telecommunication infrastructure, and human capital development into a single, internationally standardized composite index [
62]; RD expenditure captures innovation intensity and absorptive capacity, which endogenous growth theory identifies as a core driver of long-term economic sustainability and SDG performance [
65]. To prevent conceptual overlap, shared variance among these indicators is explicitly addressed using principal component analysis (PCA), ensuring robustness and interpretability.
The selection of proxy variables is guided by the three objective principles of availability, measurability, and reliability, rather than subjective preference: availability ensures that indicators such as Internet users from the World Bank are reported annually and consistently across countries, enabling longitudinal SDG analysis; measurability is ensured through reliance on internationally standardized definitions, such as UNESCO’s tertiary education enrollment metrics for SDG 4; reliability is guaranteed by sourcing indicators exclusively from globally recognized providers with harmonized methodologies, including the World Bank, UNESCO, OECD, and national statistical authorities GaStat. For instance, RD expenditure is compiled using UNESCO standards and cross-validated against OECD Frascati definitions [
66], ensuring cross-country consistency.
When multiple indicators map to the same SDG, the SDG-AMF applies a multi-criteria weighting strategy that integrates (i) direct textual alignment with SDG targets, (ii) expert-informed weights derived from prior literature and policy documents, and (iii) data-driven weights obtained through PCA and statistical strength. This approach prevents dominance by any single proxy and yields a balanced, SDG-aligned composite structure. For example, while Internet usage contributes to both SDG 9 and SDG 16, it is primarily assigned to SDG 9 (Target 9.c: ICT infrastructure) due to its direct definitional alignment and strong empirical correlations with innovation-related proxies such as RD and the EGDI. The EGDI, in contrast, is retained as the principal proxy for SDG 16, reflecting institutional effectiveness, transparency, and digital public service maturity.
Overall, proxy selection in the SDG-AMF is grounded in established theory, empirical precedent, and policy relevance, drawing explicitly on UN SDG metadata and Saudi Vision 2030 priorities. The selected proxies are measurable, comparable, and widely used in international indices (World Bank, ITU, OECD, UN E-Government Survey). Their representativeness is further supported by statistically significant correlations and regression results with SDG outcomes, as reported in the
Section 4.
Table 4 presents the final classification of variables included in the SDG-AMF dataset.
Statistical Preprocessing and Validation:
Empirical validation proceeds in two stages. First, Pearson correlation coefficients are used to assess the strength and direction of the associations between digitalization indicators and the SDG variables. Second, multiple linear regression using ordinary least squares (OLS) evaluates the predictive influence of digitalization on SDG results during the 2010–2024 period. Pearson correlation analysis is used to examine the strength and direction of linear associations between digitalization indicators and SDG variables. The correlation coefficient is calculated based on Equation (
1).
where
r denotes the correlation coefficient,
and
represent the observed values of the two variables, and
and
are their respective means. The resulting Pearson correlation matrix is used to assess the magnitude and direction of relationships between variable pairs. Multiple linear regression using ordinary least squares (OLS) is applied to evaluate the predictive power of digitalization indicators, addressing the need for empirical validation highlighted in previous studies (e.g., Bocean [
30]), where OLS is used to estimate the strength, direction, and statistical significance of each digitalization variable to explain the variations in SDG performance over the 15-year period from 2010 to 2024. Each SDG-aligned indicator is modeled as a dependent variable according to Equation (
2).
where
Y denotes the dependent variable (e.g., an SDG indicator),
are the independent variables (digitalization indicators),
is the intercept,
are the regression coefficients, and
is the error term. The performance of the model is evaluated using standard regression metrics, including coefficients,
p-values, and the determination coefficient (
). Each coefficient
represents the direction and magnitude of the effect of the predictor
on
Y, keeping the other variables constant. Statistical significance is assessed using
p-values, with
indicating a meaningful relationship between the predictor and the outcome. The statistic
indicates the proportion of variance in the dependent variable explained collectively by the independent variables.
The performance of the model is assessed using coefficients,
p-values, and
, ensuring statistical robustness and interpretability. Descriptive statistics confirm the completeness of the dataset and identify potential outliers (
Table 5). Correlation analysis quantifies the strength of linear relationships, while regression modeling estimates the magnitude and significance of the effect of each digitalization variable on the SDG outcomes, thus validating the conceptual assumptions of the SDG-AMF with empirical evidence.
3.2.4. Data Analysis
The purpose of this stage of the SDG-AMF is to analyze the relationship between the determined digitalization indicators, which are key predictors of digitalization, as evidence for measuring sustainability, and the aligned SDGs in Saudi Arabia from 2010 to 2024. The descriptive statistics identify the outlier by calculating the extreme min/max relative to the mean, while assessing variability using standard deviation. The conceptual alignment was determined on the basis of the UN SDGs metadata repository and the literature, while the empirical validation was performed using Pearson’s correlation coefficients (
1). Empirical validation involves quantifying the relationship between the digitalization indicators and the relevant SDG, assessing the strength of the association, and refining and confirming the logical assumptions with statistical evidence. The framework applies Pearson’s correlation to measure the strength of linear relationships between digitalization indicators and the SDG results, following the approach outlined by Carlsen and Bruggemann [
13]. Regression analysis is the second stage of the SDG-AMF analysis. It represents a set of statistical methods used to estimate the relationships between the independent and dependent variables, represented in the digitalization indicators and the SDGs, respectively, in order to understand and test the predictive influence of digital indicators on the outcomes of the SDGs. Independent variables are Internet users, gross domestic product (GDP) per capita, tertiary education enrollment, female labor participation, EGDI, and RD expenditure. The dependent variables are related SDGs (SDG 4, SDG 5, SDG 8, SDG 9, and SDG 16).
4. Results
The SADM-SDG dataset has been established as part of the research methodology results. In addition, a descriptive statistical analysis was performed as shown in
Table 5. The digitalization indicators show positive alignment with SDGs 4, 5, 8, 9, and 16, and the standard deviation values enhance the validity of the collected data by capturing progress over time. The interpretation of standard deviation values reflects the dynamics of digitalization and sustainability indicators in Saudi Arabia. The low standard deviation value points to a stable indicator, such as the RD expenditure of 0.344, while the high values (20.27 and 14.3) reflect the increase and rapid increase in digital access and employment rights and participation of the workforce, respectively. More results are presented in two stages as part of the data analysis.
4.1. First Stage: Correlation Analysis
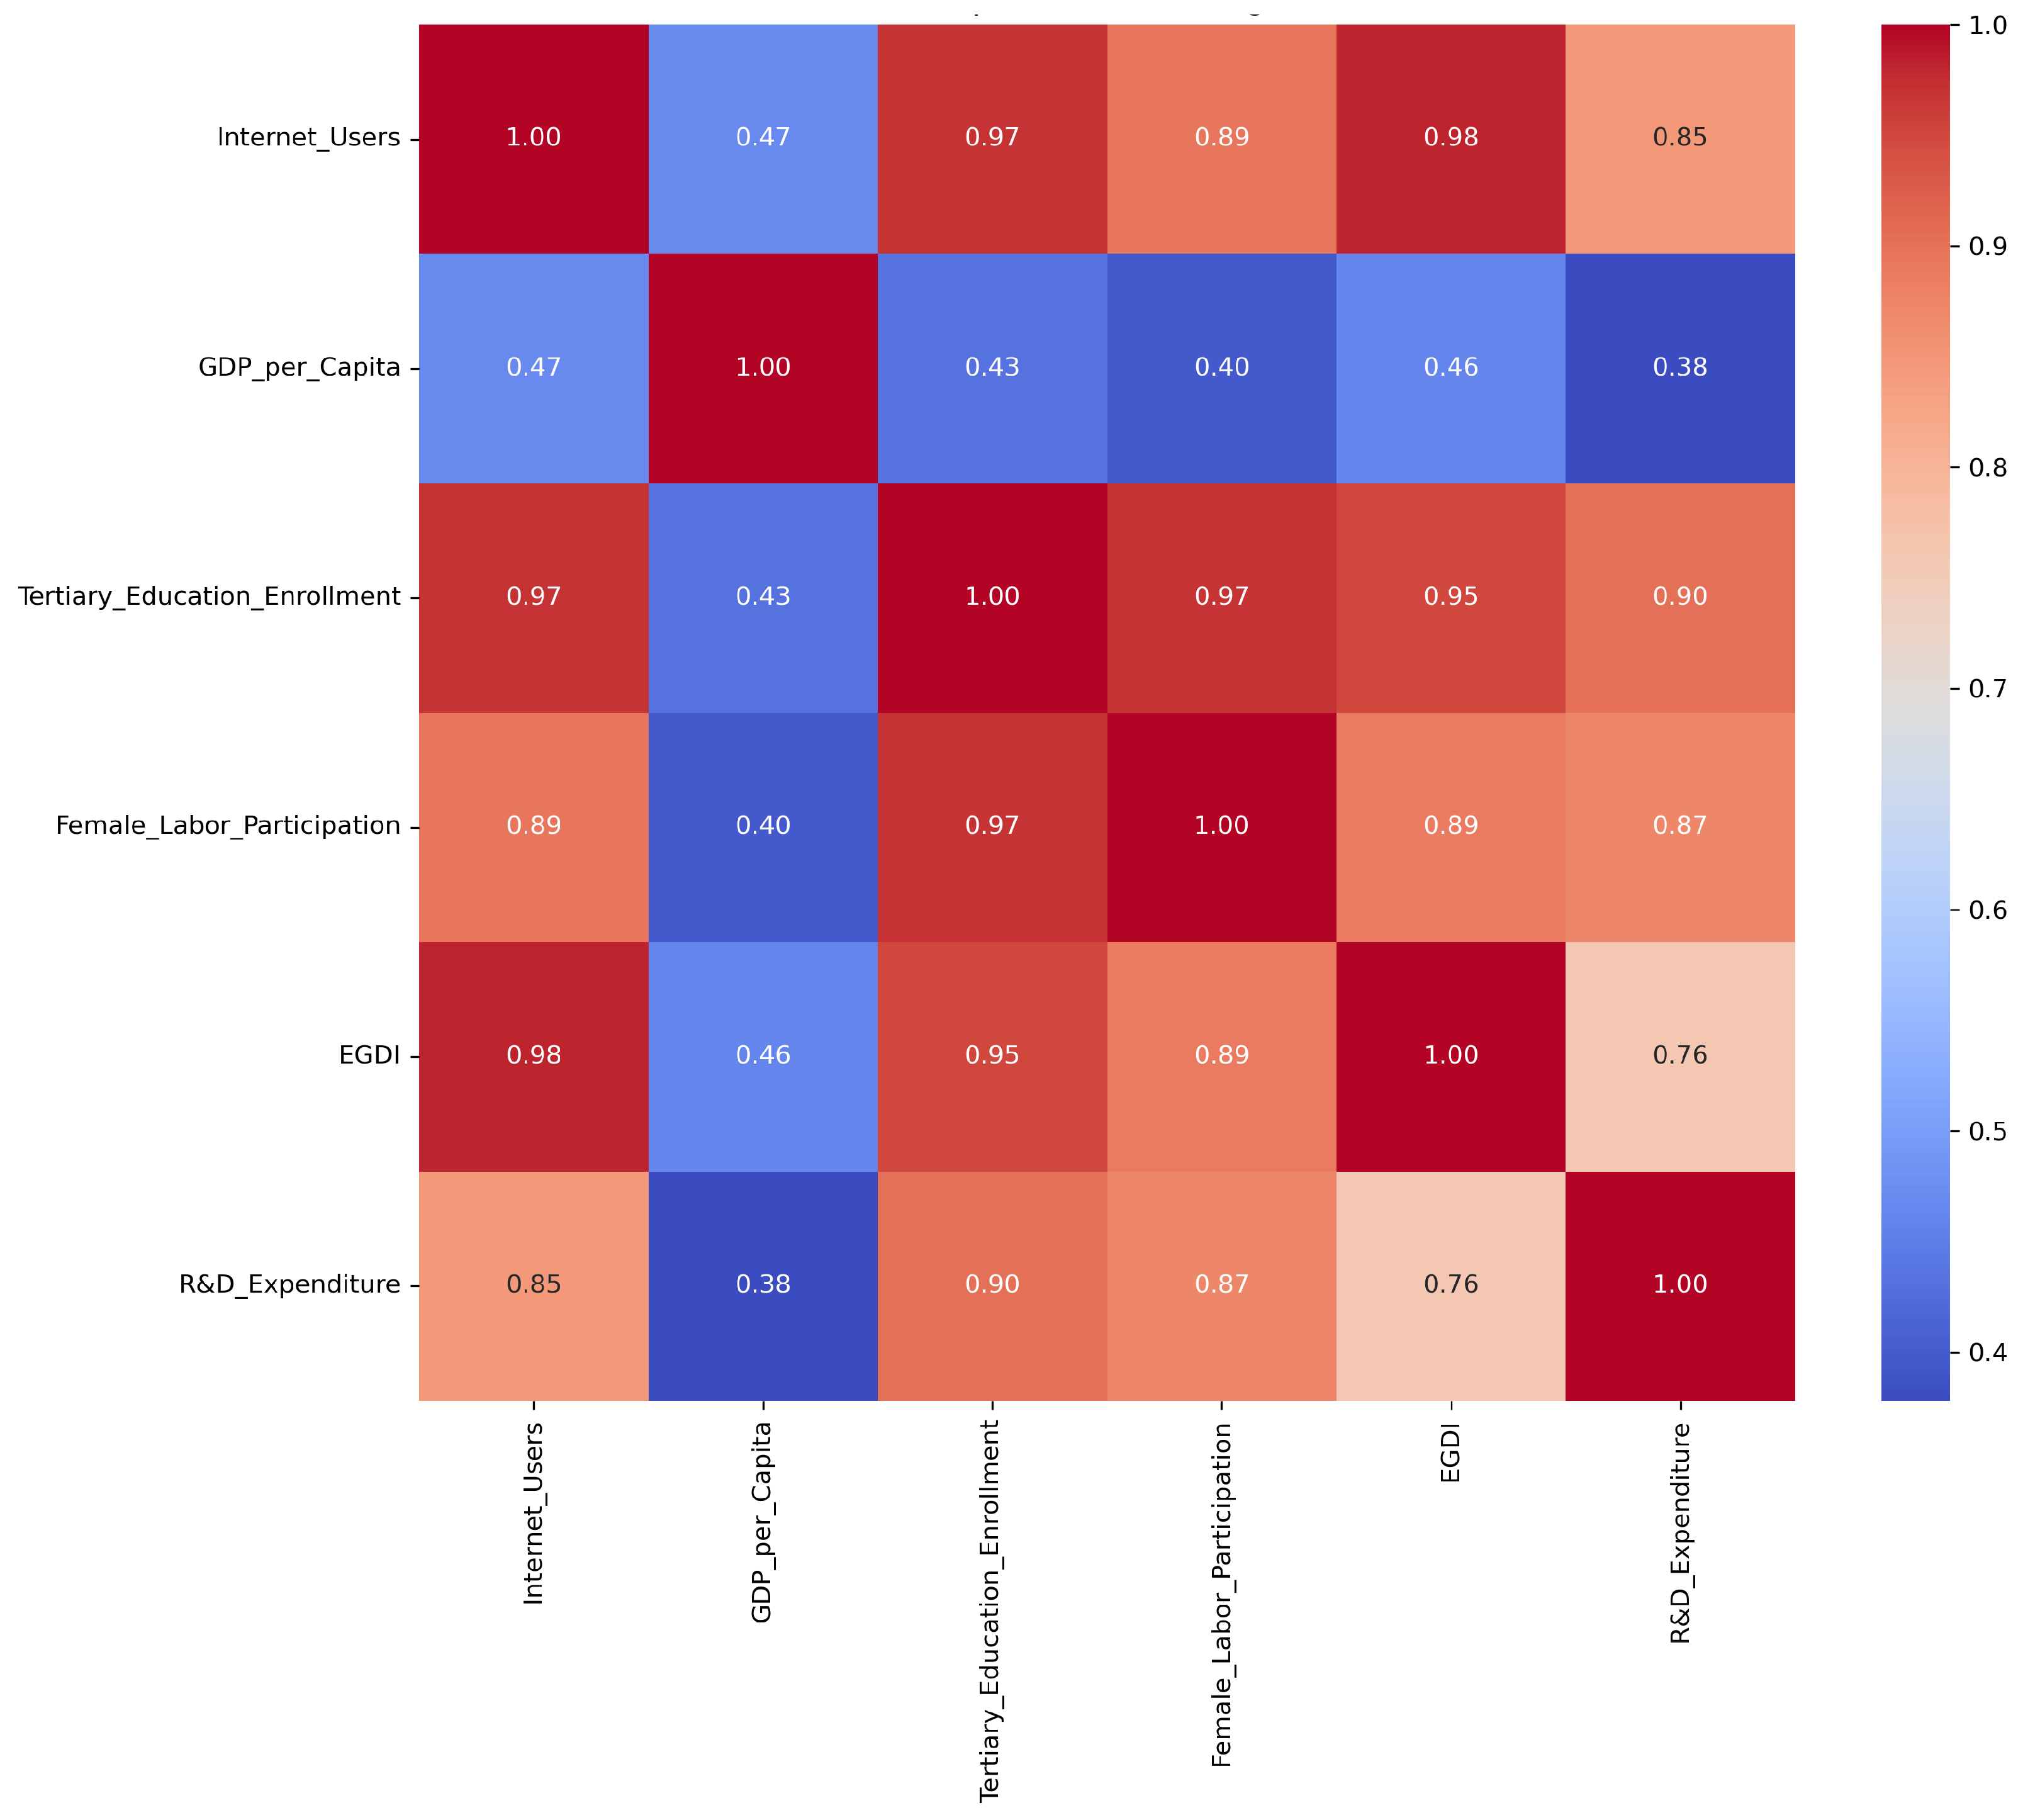
The calculation of the Pearson correlation matrix, presented in
Table 6, shows how strongly pairs of variables are linearly related between digital access, education, and gender equity. Thus, digitalization is advancing in tandem with social development (education and gender participation); however, economic growth (GDP per capita) is less closely connected with digitalization metrics.
The conceptual alignment has been used to link digitalization indicators with the UN Sustainable Development Goals to measure sustainability in Saudi Arabia’s digitalization.
Table 7 presents the results of mapping the variables of the digitalization indicator with the SDG based on conceptual alignment.
Although SDG 8 was assigned to GDP per capita as shown in
Table 4, it was assigned to RD expenditure in conceptual alignment because it contributes to economic growth by fostering innovation and creating new industries and employment opportunities. Additionally, RD expenditure is strongly associated with SDG 9, as it directly drives technological advancements, supports industrial development, and strengthens innovation ecosystems. This dual alignment reflects the multifaceted role of RD expenditure in both promoting economic productivity (SDG 8) and enabling sustainable industrial innovation (SDG 9). By investing in RD, countries can achieve long-term growth while improving infrastructure and innovation capacity, which are core components of SDG 9. Although GDP per capita is a widely used economic measure, it is not considered a direct driver of digitalization or sustainability in this study. Instead, the focus is on indicators with a clear empirical link to the SDGs, such as Internet users, RD expenditure, the EGDI, tertiary education enrollment, and participation of females in labor.
The Pearson correlation matrix heatmap presented in
Figure 2 shows that there is a very strong correlation between Internet users and enrollment in tertiary education, indicating better educational outcomes through the facilitation of digital access, which implies proven sustainability for SDG 4. Furthermore, the results in
Figure 2 show a very strong correlation between female labor participation and higher education enrollment, indicating that education directly supports the inclusion of the gender workforce, which received the sustainability approval of SDG 5. The strong relationship between secondary education enrollment and RD expenditure contributes to a thriving innovation ecosystem that is reflected in SDG 9. This is because RD investment is a direct driver of innovation, technological advancements, and industrial development, which are the core components of SDG 9. Furthermore, there is a very stable relation between the EGDI and Internet users, indicating that e-government services benefit from the increase in penetration, reflected in the stability of SDG 16.
Empirical validation showed how these correlations aligned with the SDGs based on the calculated correlation among the digitalization indicators, such as Internet users and EGDI (r = 0.98), which indicates that widespread use of the Internet facilitates transparency, citizen engagement, and access to electronic government services, consistent with SDG 16. Thus, digitalization was considered the foundation for inclusive governance. The calculated correlation between Internet users and the enrollment in tertiary education achieved r = 0.97, where their strong relationship increases the reach of higher education, as Internet access facilitates remote education and digital learning, directly impacting education quality and achieving SDG 4. Furthermore, the correlation between tertiary education enrollment and female participation in the labor force was reached (r = 0.97), which highlights the role of educational empowerment in driving gender-equitable employment outcomes, aligning with SDG 5. The calculated correlation between higher education enrollment and RD expenditure is r = 0.90, reflecting the synergy between academic advancement and national innovation ecosystems. This high correlation aligns with SDG 9, as a robust tertiary education system supports research activities, scientific output, and human capital.
4.2. Second Stage: Regression Analysis
The results of the Pearson correlation matrix showed the strength and direction of the linear relationships among the digitalization variables. However, a further analysis is needed to offer a more robust examination of the digitalization indicators regarding the achievement of the SDGs based on multiple linear regression (MLR) models. MLR models were applied to assess the predictive power of digitalization indicators in each SDG domain. Based on the strong correlation observed between Internet users and most other digitalization indicators, it is a key digitalization indicator. For example, the results of the correlation matrix revealed a very strong association between Internet users and the EGDI (r = 0.98). Therefore, it is necessary to quantify the number of users who are regularly accessing and using the Internet, which helps to determine the percentage of the Internet population. Given the high correlation observed among digitalization indicators (e.g., Internet usage and the EGDI), principal component analysis (PCA) was applied prior to regression modeling to mitigate multicollinearity and ensure orthogonal explanatory components. The regression for SDG 16 included Internet penetration, and its results reached a significant point ( = 0.0063, p = 0.002) that highlighted digital access as a critical enabler of institutional digital maturity. Although the results showed an inverse effect of the RD expenditure for SDG 16 (with = −0.1456 and p = 0.001), it may reflect early-stage digitalization versus research investment trade-offs.
More results on regression analysis using ordinary least squares (OLS) multiple linear regression for the rest of the SDGs are shown in
Table 8. Some
p-values and coefficient values included in
Table 8 are marked with “−” because they are not included as predictors in the regression model. For example, the
p-values and coefficient values for SDG 4 are marked as “–” because tertiary education enrollment was not included as a predictor in the regression model. Participation of women in labor is the most significant predictor that positively influences SDG 4 (with
= 0.7245 and
p = 0.001) and is closely aligned with the increase in participation in higher education, suggesting a strengthening loop between educational opportunities and gender inclusion. However, other variables, such as Internet users and RD expenditure, showed positive but not statistically significant effects.
The results of the multiple linear regression OLS for SDG 5 are
= 0.9956 and
p = 0.001, which reflects a strong, positive, and significant indicator, implying a very high explanatory power as shown in
Table 8. However, the results show a significant but inverse relationship for the negative predictor of Internet users (
= −0.4813,
p = 0.034) that may reflect the complexity of labor digitization and require further exploration. Furthermore, Internet users achieved a marginal predictor for SDG 9 (
= 0.0258,
p = 0.066) with borderline significance. Although the EDGI recorded a significant predictor (
= −5.0031,
p = 0.001), this implies a surprisingly negative relationship with SDG 9. Digitalization of governance alone may not directly drive RD investment unless tied to higher education and innovation policies. Thus, the model suggests that further decomposition is needed to isolate the policy effects.
Table 9 summarizes the main digitalization indicators in related SDGs. Interestingly,
Table 9 shows some strong and negative correlations that emerged, particularly between Internet users and SDG 5, the EGDI and SDG 9, and RD expenditure and SDG 16.
These strong and negative correlations mean that two variables have an inverse relationship: as one variable increases, the other decreases reliably, and vise versa. For example, while Internet penetration is high, its benefits may not translate into gender equality without targeted inclusion measures. Similarly, strong e-government maturity (EGDI) may coexist with weaker innovation outcomes if industrial digitalization lags behind administrative reforms. High RD expenditure may also fail to strengthen institutions unless directed toward civic-oriented technologies. These suggest that, despite digital advances, associated sustainability outcomes do not improve uniformly. For example, the inverse link between the EGDI and SDG 9 implies that while Saudi Arabia excels in digital government maturity, industrial digitalization, which is critical to innovation, is lagging possibly due to limited private-sector digitization or weak links between government platforms and national innovation systems. Similarly, the negative correlation between Internet penetration and SDG 5 indicates that universal access does not guarantee equitable participation, especially for women, unless supported by gender-sensitive digital literacy, employment access, and platform design. The disconnect between RD and SDG 16 further suggests that research investments may be concentrated in the commercial or defense sectors rather than technologies that improve institutional transparency, civic feedback, or justice. These findings emphasize the need for targeted policy realignment—not just technological deployment—in order to maximize digital dividends for sustainable development.
The regression analysis provides insight into the determinants of key digitalization indicators in the Saudi Arabian context, aligning with the SDG benchmarking results. All models exhibit extremely high explanatory power (R
2 > 0.93) as shown in
Table 10, indicating that the selected predictors of the SDG collectively explain the vast majority of variation in each digitalization indicator.
Exceptional Model Fit: The consistently high R2 and adjusted R2 values (>0.91) indicate that the predictor variables—drawn from indicators aligned with the SDG—are highly relevant and well defined for explaining the trends of digitalization in Saudi Arabia.
E-Government as a Central Node: The EGDI emerges as both a predictor and outcome, suggesting that it is a key driver in the digital sustainability ecosystem, influencing and being influenced by education, gender inclusion, and innovation.
Human Capital and Inclusion as Key Enablers: Education and participation of female labor repeatedly appear as significant predictors, reinforcing their role as foundational components of sustainable digitalization.
Policy Implications: Investing in digital infrastructure, strengthening education systems, promoting gender inclusion, women’s workforce participation, and RD capacity, along with e-government enhancements and linking e-government initiatives to innovation policies, could all produce mutually reinforced benefits across all dimensions of digitalization and sustainability.
4.3. Robustness Tests
To ensure the validity and stability of the estimated relationships between digitalization indicators and the SDG outcomes, several robustness tests were conducted. Multicollinearity was first assessed using the variance inflation factor (VIF) and the condition number. The calculation of the VIF is based on the determined predictors and their calculated correlation matrix and regression as follows in Equation (
3):
where
is the calculated coefficient of determination for that regression.
The results reveal extremely high VIF values (more than 100 for Internet users, the EGDI, and tertiary enrollment) and a condition number exceeding two million, confirming severe collinearity among predictors.
To address this, principal component analysis (PCA) was applied by extracting eigenvalues and eigenvectors from the standardized correlation matrix of the six digitalization indicators. The components were retained based on the cumulative explained variance and interpretability, resulting in the selection of two orthogonal components, PC1 and PC2, which together explain more than 93% of the total variance as shown in
Table 11. The resulting loading matrix, calculated based on Equation (
4), shows that PC1 is highly and positively loaded on Internet users, the EGDI, tertiary education enrollment, female labor participation, and RD expenditure, and is therefore interpreted as a composite digitalization and inclusion factor. PC2 exhibits its highest loading on GDP per capita, with comparatively minor loadings on the remaining indicators, and is interpreted as an economic capacity factor.
where
denotes the correlation matrix of the standardized indicators,
represents the eigenvalue associated with the
kth principal component (indicating the amount of variance explained), and
is the corresponding eigenvector.
Subsequently, these principal components were used as regressors instead of the original collinear indicators, and the corresponding regression results were calculated based on Equations (
5) and (
6) and are reported in
Table 11. The models indicate that PC1 is a significant predictor of SDG 4, SDG 5, and SDG 16, while PC2 shows a closer association with SDG 9, confirming that the main relationships identified in the baseline OLS models are robust to multicollinearity. Consequently, the revised discussion and policy implications interpret the findings primarily in terms of these two principal components rather than individual unstable coefficients, thereby enhancing both the statistical reliability and substantive interpretability of the results.
Equivalently, element-wise:
where
contains the eigenvectors of the retained
m components (here
),
, and
is the loading of indicator
j on component
k (reported in
Table 11).
To further verify inference reliability in time-series data, regressions were re-estimated with Newey–West HAC robust errors, which confirmed that the significance of digitalization PC1 remained stable and significant across SDG 9, with the GDP marginal. Sensitivity analyses were then performed by removing variables such as Internet users or the EGDI one at a time. Then, bivariate regressions were tested and proxies were substituted, such as the substitution of RD expenditure with the innovation index to imply cross-validation of the innovation effect, which demonstrated consistent coefficient significance. Collectively, these robustness checks confirm that the findings are credible, stable, and not artifacts of model specification, indicating that digitalization composite PC1 is the stable driver of SDG 9, education and gender proxies strongly predict SDG 4 and SDG 5, and SDG 16 is best explained by Internet users and the EGDI.
5. Discussion
This study successfully developed the Saudi Arabia Digitalization for Measuring the SDGs (SADM-SDG) dataset by integrating time-series data from authoritative international sources, including the World Bank, UNESCO, and the United Nations SDG database. The dataset combines independent digitalization indicators—such as Internet users (% of the population), the E-Government Development Index (EGDI), and RD expenditure (% of GDP)—with selected SDG outcomes. These include SDG 4 (Quality Education) as framed by Reynolds et al. [
19], SDG 5 (Gender Equality) as discussed by UNICEF and Ates et al. [
22,
25], as well as SDG 9 (Industry, Innovation, and Infrastructure) and SDG 16 (Peace, Justice, and Strong Institutions). By doing so, the SADM-SDG dataset addresses a persistent gap in the literature regarding the empirical measurement of digitalization’s contribution to sustainable development.
Consistent with prior empirical studies that examined digitalization–SDG relationships using Internet penetration or ICT indices as key explanatory variables [
15], the findings affirm that digital access and institutional digital capacity are strongly associated with improvements in education, gender inclusion, and governance outcomes. However, unlike most existing works that rely on cross-sectional designs, focus on a single SDG, or examine isolated digital indicators, the proposed Sustainable Development Goal–Achievement Measurement Framework (SDG-AMF) advances a longitudinal, multi-SDG, and mechanism-oriented methodology. This extends the analytical scope and interpretability of previous research by offering a dynamic and policy-relevant structure.
The empirical results reveal that Saudi Arabia’s digital maturity, exemplified by its rising EGDI score and near-universal internet penetration, has tangible and measurable implications for SDGs 4, 5, 9, and 16. These developments, when viewed in conjunction with the national Vision 2030 strategy, reflect a model of pragmatic sustainability—that is, context-sensitive and implementable solutions that operationalize digital progress to achieve sustainable development. By aligning localized digital transformation indicators with global sustainability objectives through statistically grounded proxies, this study complements prior qualitative research and proposes a replicable pathway for empirically tracking SDG progress within national contexts. The constructed dataset is notable for its multi-source integration and temporal consistency.
Table 12 summarizes the mechanism for mapping the digitalization indicators and the SDGs.
As summarized in
Table 2, the SDG-AMF differs from the EGDI and OECD DGIs in its dimensions, data sources, temporal granularity, and intended use. The EGDI and OECD are both effective for global benchmarking, while the SDG-AMF is explicitly tailored for country-level SDG impact analysis and policy design.
Furthermore, the dataset demonstrates strong policy relevance, offering a replicable framework for countries that pursue national digital transformation strategies similar to Saudi Vision 2030. This aligns with recent calls for robust, disaggregated, and empirically grounded frameworks capable of monitoring progress toward the 2030 Agenda of the United Nations.
5.1. Cross-Country Benchmarking and Comparative Insights
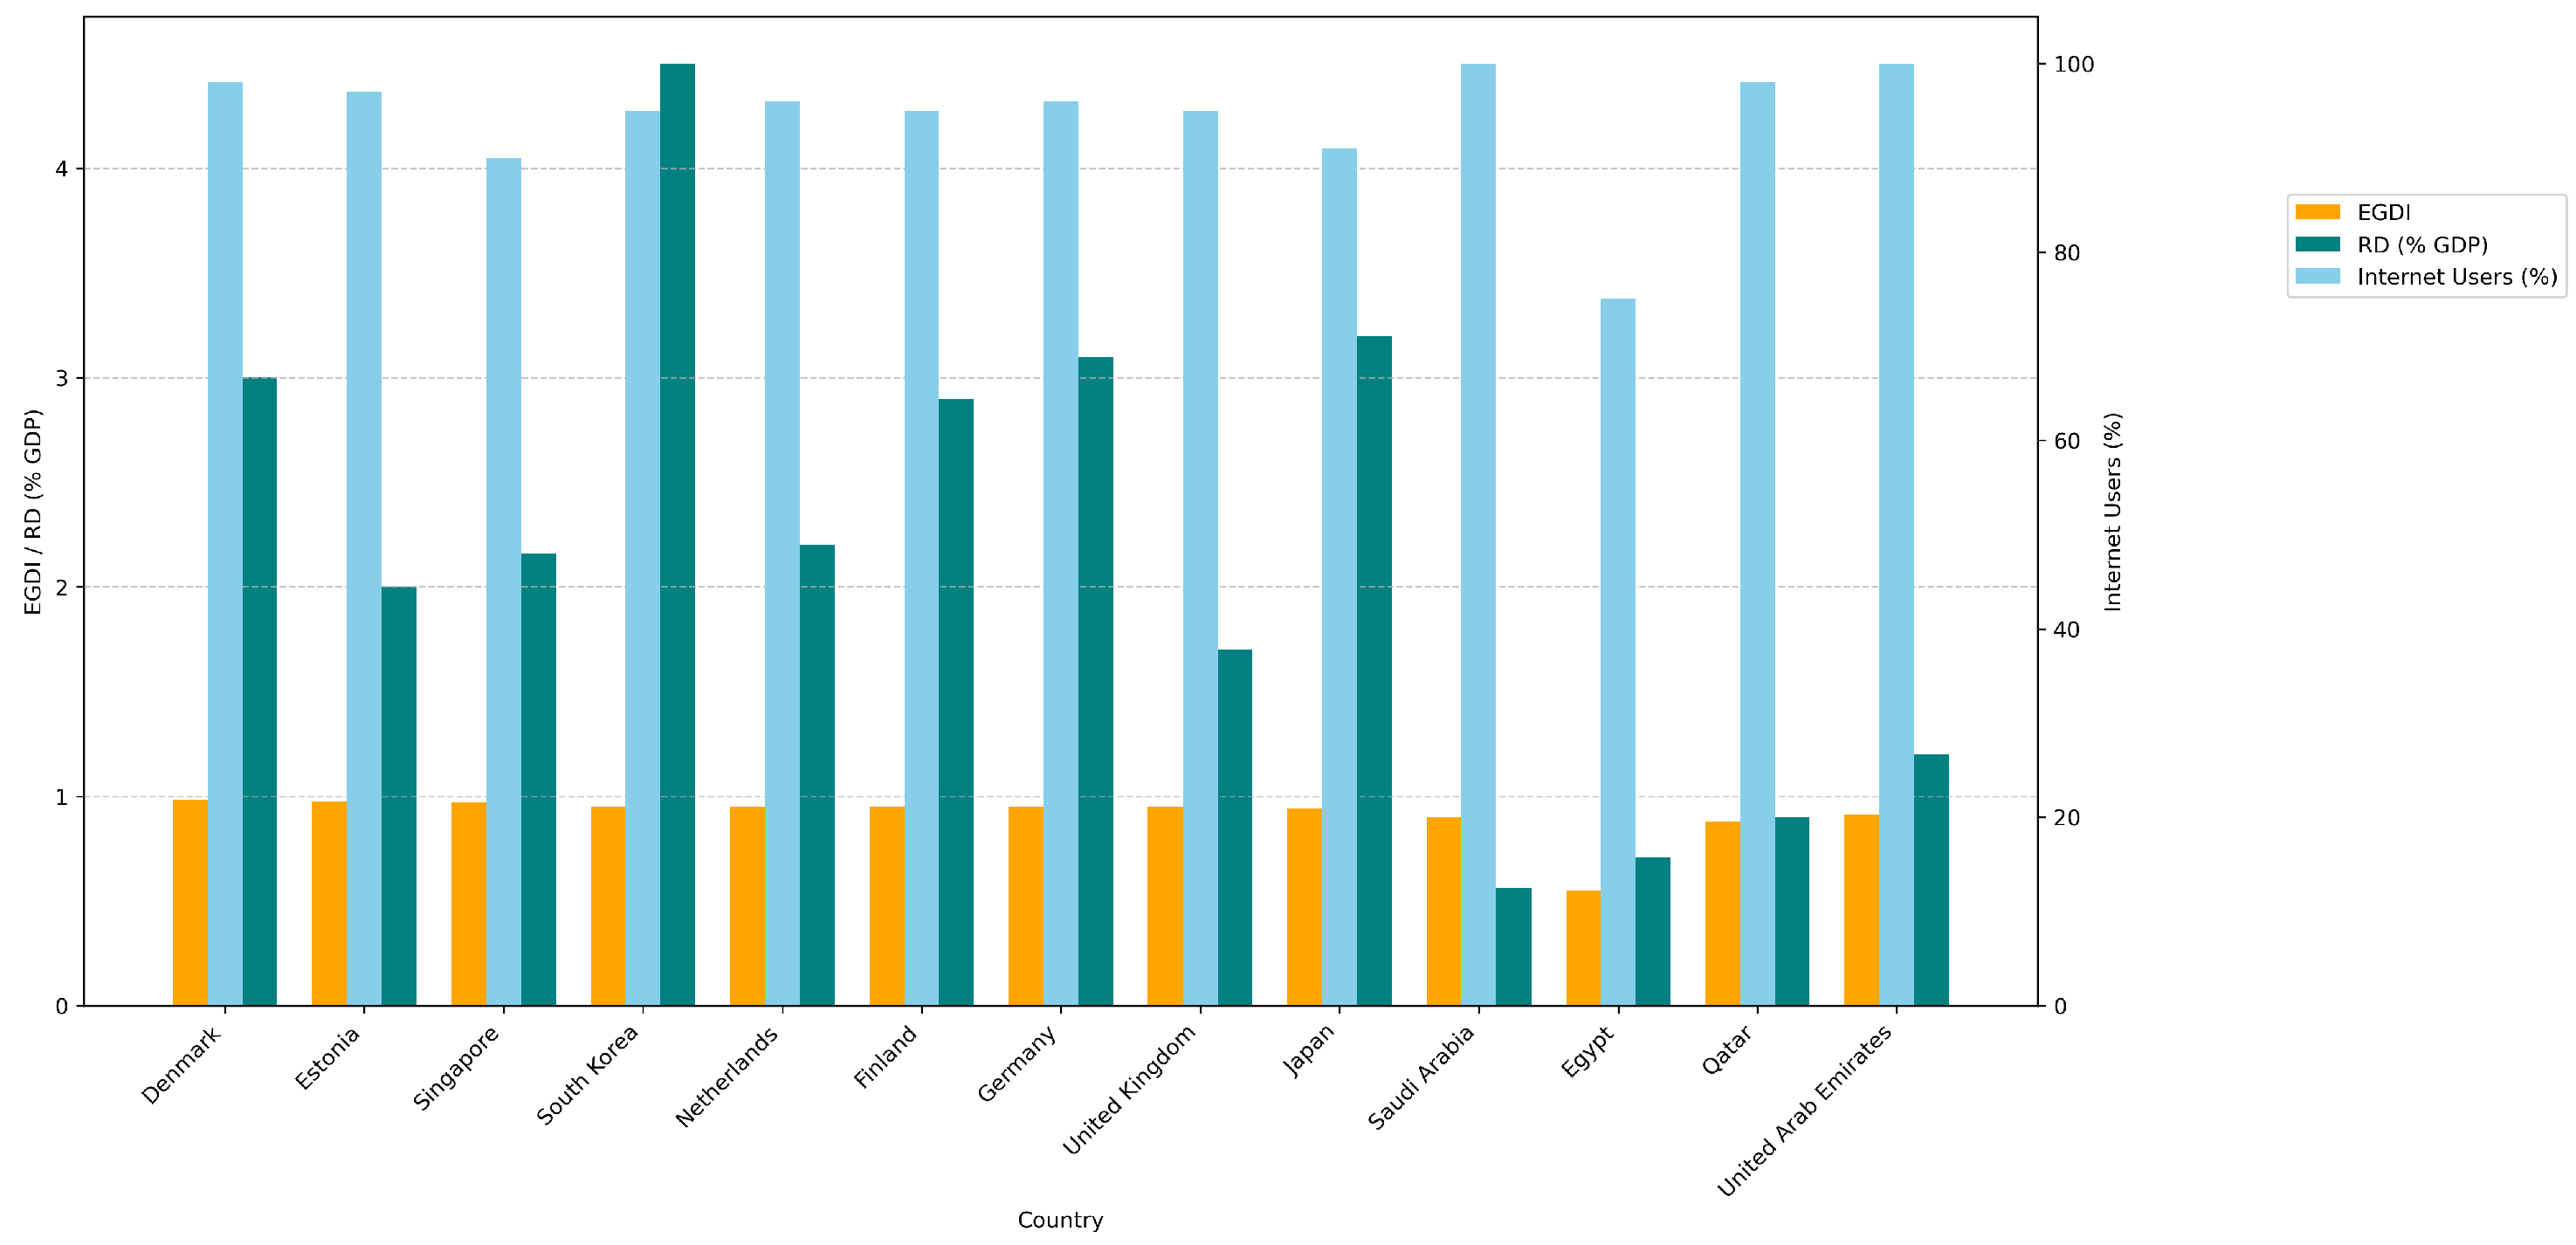
To contextualize Saudi Arabia’s performance, a comparative analysis was conducted using a set of digitally advanced economies that were randomly selected from the UN list [
62], including Denmark, South Korea, Finland, Japan, Singapore, United Kingdom, Germany, The Netherlands, Estonia, and regional peers or developing countries such as Egypt, Qatar, and UAE, as illustrated in
Figure 3. Three core indicators were benchmarked: the EGDI, Internet users (% of the population), and RD (% GDP).
The chart reveals that Saudi Arabia performs strongly in terms of Internet penetration (100%) and e-government maturity (EGDI ≈ 0.90), nearing global best practices in those areas. However, its RD spending (∼0.56% of GDP) remains significantly lower than that of innovation leaders such as South Korea (∼4.5%), Germany (∼3.1%), and Finland (∼2.9%), which supports the regression result that shows that the EGDI does not strongly predict SDG 9 (innovation outcomes) unless it is paired with high RD investment and deeper institutional links.
In contrast, developing economies such as Egypt, with a lower EGDI and Internet penetration, also struggle with limited innovation outputs, underscoring the compounded effect of underinvestment in digital infrastructure and research. The UAE and Qatar, while regional peers, outperform Saudi Arabia slightly in RD intensity, but exhibit comparable Internet access rates and EGDI levels. This highlights a critical inflection point for Saudi Arabia: moving from digital adoption to digital innovation and inclusive governance. Several new government authorities are a core part of Saudi Arabia national digitalization efforts under Vision 2030, most notably the Digital Government Authority (DGA) and SDAIA.
5.2. Correlation and Regression Findings
The correlation analysis showed strong relationships between digitalization and the outcomes of the SDG; examples are given as follows:
Internet penetration was highly correlated with enrollment in higher education (r = 0.97), supporting progress toward SDG 4 (quality education).
Female participation in labor was strongly correlated with education and inclusion indicators (r = 0.97), highlighting its critical role in achieving SDG 5 (gender equality).
A very high correlation between Internet penetration and the EGDI (r = 0.98) reinforced the idea that access is a prerequisite for the maturity of the e-government and therefore improving SDG 16 (institutions and governance).
Regression analysis further affirmed the following:
Internet penetration significantly predicts SDG 16 ( = 0.0063, p = 0.002).
Female participation in labor predicts SDG 4 ( = 0.7245, p = 0.001).
However, the inverse relationship between the EGDI and SDG 9 highlights the need for strategic alignment between digital governance and innovation policies.
5.3. Implications for Policy and Strategic Vision
The comparison of the graphs and the empirical findings point to key policy priorities for Saudi Arabia:
Increase RD investments to more than 2% of GDP to stimulate innovation ecosystems aligned with Vision 2030 and improve the achievement of the SDG 9.
Integrate civic participation platforms into e-government portals to strengthen the outcomes of SDG 16.
Encourage inclusion in digital education and ICT for women and marginalized groups to take advantage of the synergies of SDG 4 and SDG 5.
By closing the gap in RD spending and improving institutional links, Saudi Arabia can better convert its digital infrastructure into measurable sustainable development gains. The insights of this study and the comparative benchmarking presented in
Figure 3 offer a valuable roadmap for both domestic reform and international policy learning. These strategies, with evidence of their success in Saudi Arabia, can be adapted and implemented worldwide in other countries to advance their own Sustainable Development Goals.
Investments in e-government platforms: Encourage governments to prioritize the development of user-friendly and accessible e-government platforms to improve service delivery, transparency, and citizen participation. Highlight successful examples like Saudi Arabia’s Absher and Tawakkalna platforms, which have streamlined public services and enhanced efficiency.
Policies to increase female’s participation in the labor force and promote gender inclusion: Advocate for policies that empower women through digital education, remote work opportunities, and entrepreneurship programs. Showcase Saudi Arabia’s Vision 2030 initiatives that have significantly increased female labor force participation, demonstrating the potential for gender equity through targeted digital inclusion strategies.
Efforts to improve Internet penetration and digital infrastructure: Recommend investments in broadband connectivity, 5G networks, and information and communication technology (ICT) infrastructure to ensure widespread Internet access. Use Saudi Arabia’s achievement of 100% Internet penetration as a benchmark for other countries aiming to bridge the digital divide and foster innovation.
Despite the achievements and contributions of this study, it faced several challenges, especially the lack of direct, annual, and quantifiable indicators to measure the impact of digitalization on sustainability outcomes. Thus, proxies were used to overcome this obstacle. In addition, the absence of direct and time-series data related to SDG 12 may compromise the integrity of the analysis. Thus, despite its success and strong correlation-based findings, this study has several limitations. First, the absence of existing consolidated datasets that combine digitalization indicators and SDG outcomes required the construction of a new dataset SADM-SDG, which may limit comparability with other studies. Second, the study relied on proxy indicators to align digitalization metrics with the SDGs due to the lack of direct, annual, and quantifiable indicators. This approach may introduce some level of abstraction and reduce precision. Third, the framework and findings are specific to Saudi Arabia, which may limit the generalizability of the results to other countries without further adaptation. Fourth, while this study identifies robust statistical associations between digitalization indicators and SDG outcomes, it does not establish causal relationships. Future research could extend the proposed framework by incorporating causal inference techniques, such as instrumental variable approaches, difference-in-differences designs, or quasi-experimental settings where suitable data or policy shocks are available, to more rigorously assess the causal impact of digitalization on sustainable development.
6. Conclusions
This research investigated the influence of digitalization on sustainable development in the context of Saudi Arabia’s growing digitalization, aligning its findings with the United Nations SDGs by developing and applying the Sustainable Development Goals Achievement Measurement Framework (SDG-AMF). The study first focused on integrating open-access and multi-reputation data to formulate Saudi Arabia digitalization to measure the SDG dataset (SADM-SDG), and then performed a robust statistical analysis and benchmarked the digitalization indicators with key sustainability outcomes. The results show that several digitalization indicators included in the study—such as Internet penetration, e-government development, growth in ICT, and establishment in digital business—have significant correlations with the SDGs in education (SDG 4), gender equality (SDG 5), innovation and infrastructure (SDG 9), and institutional transparency (SDG 16). These findings confirm that digitalization is not only a theoretical advancement, but also a strategic enabler of sustainable development. In addition, the study highlights the importance of reliable, high-quality, and disaggregated data in tracking SDG progress. Using a comprehensive data integration and analysis framework, this research provides a replicable model for other countries seeking to align digitalization efforts with the Sustainable Development Goals. In conclusion, the digital transformation in Saudi Arabia, driven by Vision 2030, has created measurable impacts on national sustainability objectives. Policymakers, digital strategists, and development planners should continue to invest in digital infrastructure, foster data governance, and support innovation ecosystems to amplify the role of digitalization in sustainable development. Future research could explore the complexities revealed in the regression analysis, such as the inverse relationship between the EGDI and SDG 9, to refine policy recommendations. An additional effort should be made to maximize the impact of digitalization on sustainable development in terms of expanding the ICT infrastructure to promote digital literacy, empower women in ICT, develop smart cities, and enhance e-government platforms related to SDG 4, SDG 5, SDG 9, and SDG 16. Furthermore, future research may overcome the exclusion of SDG 12 and find a method to collect its necessary data. In addition, further research can expand this framework by incorporating machine learning, real-time analytics, or cross-country comparisons to further enrich the understanding of digital sustainability dynamics.