1. Introduction
In recent years, photovoltaic power generation, as a renewable energy source, has played a key role in the global energy transition due to its environmentally friendly, clean, and sustainable characteristics [
1]. With the increasing maturity and large-scale application of photovoltaic technology, its full lifecycle environmental benefits and carbon reduction potential have attracted much attention. When assessing the carbon reduction benefits of solar systems, the life cycle assessment (LCA) method is most commonly utilized. However, traditional LCA methods have certain limitations. The majority of studies focus solely on carbon emissions during the production phase or specific stages, failing to properly account for other contributing factors, such as component deterioration and recycling during the system’s entire lifecycle. [
2]. And the system boundary of traditional LCA is usually static, assuming that the annual attenuation rate of photovoltaic modules is constant, without considering the dynamic characteristics of the attenuation rate changing over time [
3]. For example, Jordan and Kurtz (2012) assumed a constant attenuation rate of 0.5% for photovoltaic modules in their study, without considering the influence of different usage environments on the attenuation rate [
4]. At the same time, the IEA PVPS Task 12 report also highlights that traditional LCA models frequently overlook the impact of attenuation effects on photovoltaic system performance during long-term operation, particularly when considering environmental impacts under various attenuation scenarios, which poses certain constraints on accurately evaluating the ecological performance of photovoltaic systems. These issues require consideration of the accuracy of LCA in the long-term evaluation of photovoltaic systems [
5].
To address these issues, some recent studies have proposed the concept of “net worth”, which reflects the net characteristics of energy consumption and carbon emissions in photovoltaic systems, including carbon emissions during the production stage, energy consumption during the use stage, and recovery benefits during the retirement stage. This net worth concept can more accurately evaluate the environmental benefits of photovoltaic systems, especially their overall performance over long periods of operation [
6]. There are two key environmental indicators, carbon payback period (CPT) and energy payback period (EPBT). The carbon payback period refers to the time it takes for a photovoltaic system to recover the carbon emissions consumed during its production process through electricity generation, while the energy payback period refers to the time it takes for a photovoltaic system to recover the energy consumed during its production and use process through electricity generation [
7,
8].
However, most existing LCA studies have not fully considered the long-term attenuation effects of photovoltaic systems, especially in different attenuation scenarios, where the complex relationship between power generation, energy recovery period, and carbon emissions has not been comprehensively analyzed [
9,
10,
11,
12,
13,
14].
Therefore, based on the traditional LCA method, this study proposes a new lifecycle assessment framework for photovoltaic systems, which comprehensively analyzes the environmental benefits of photovoltaic systems under different attenuation scenarios by introducing net-value boundaries and considering attenuation effects [
15]. The research object chose a 1MWp polycrystalline silicon grid-connected photovoltaic power station in the Xinjiang region, and built a three-dimensional dynamic coupling model that comprehensively considers the power generation, carbon emissions, energy recovery period, and carbon reduction benefits of the photovoltaic system. By simulating different attenuation scenarios (baseline, high attenuation, and low attenuation), the impact of module efficiency degradation on the long-term performance of photovoltaic systems is evaluated, providing important theoretical support for the low-carbon operation of photovoltaic systems [
16]. The innovative advantage of the three-dimensional dynamic coupling model proposed by the research institute lies in its ability to comprehensively describe the lifecycle evolution of photovoltaic systems by combining multiple factors such as attenuation effects, carbon emissions, energy recovery period, and net benefits during the recovery phase. By dynamically tracking the power generation, carbon emissions, and energy recovery of the system, more accurate predictions of carbon and energy recovery periods can be obtained, and the changes in system performance under different degradation scenarios can be analyzed in depth. This model addresses the shortcomings of standard life cycle assessment methods and introduces a new approach for evaluating the environmental benefits of photovoltaic systems, used for long-term low-carbon operation and optimized design.
2. Methodology
This study, under a new framework, analyzed the relationship between power generation and energy consumption, calculating the impact of equipment efficiency decline on power output. Throughout the study, fluctuations in power generation were mostly examined annually, and variations in carbon emissions at different stages of the life cycle were further examined using actual operating data. Subsequently, this paper constructed a three-dimensional coupled model encompassing cumulative power generation, carbon emissions, and energy payback periods, providing a comprehensive perspective on the environmental impact and benefits of photovoltaic systems over a 25-year lifecycle [
17]. This model can accurately track the dynamic changes in power generation, carbon emissions, and energy.
Photovoltaic System Lifecycle Framework
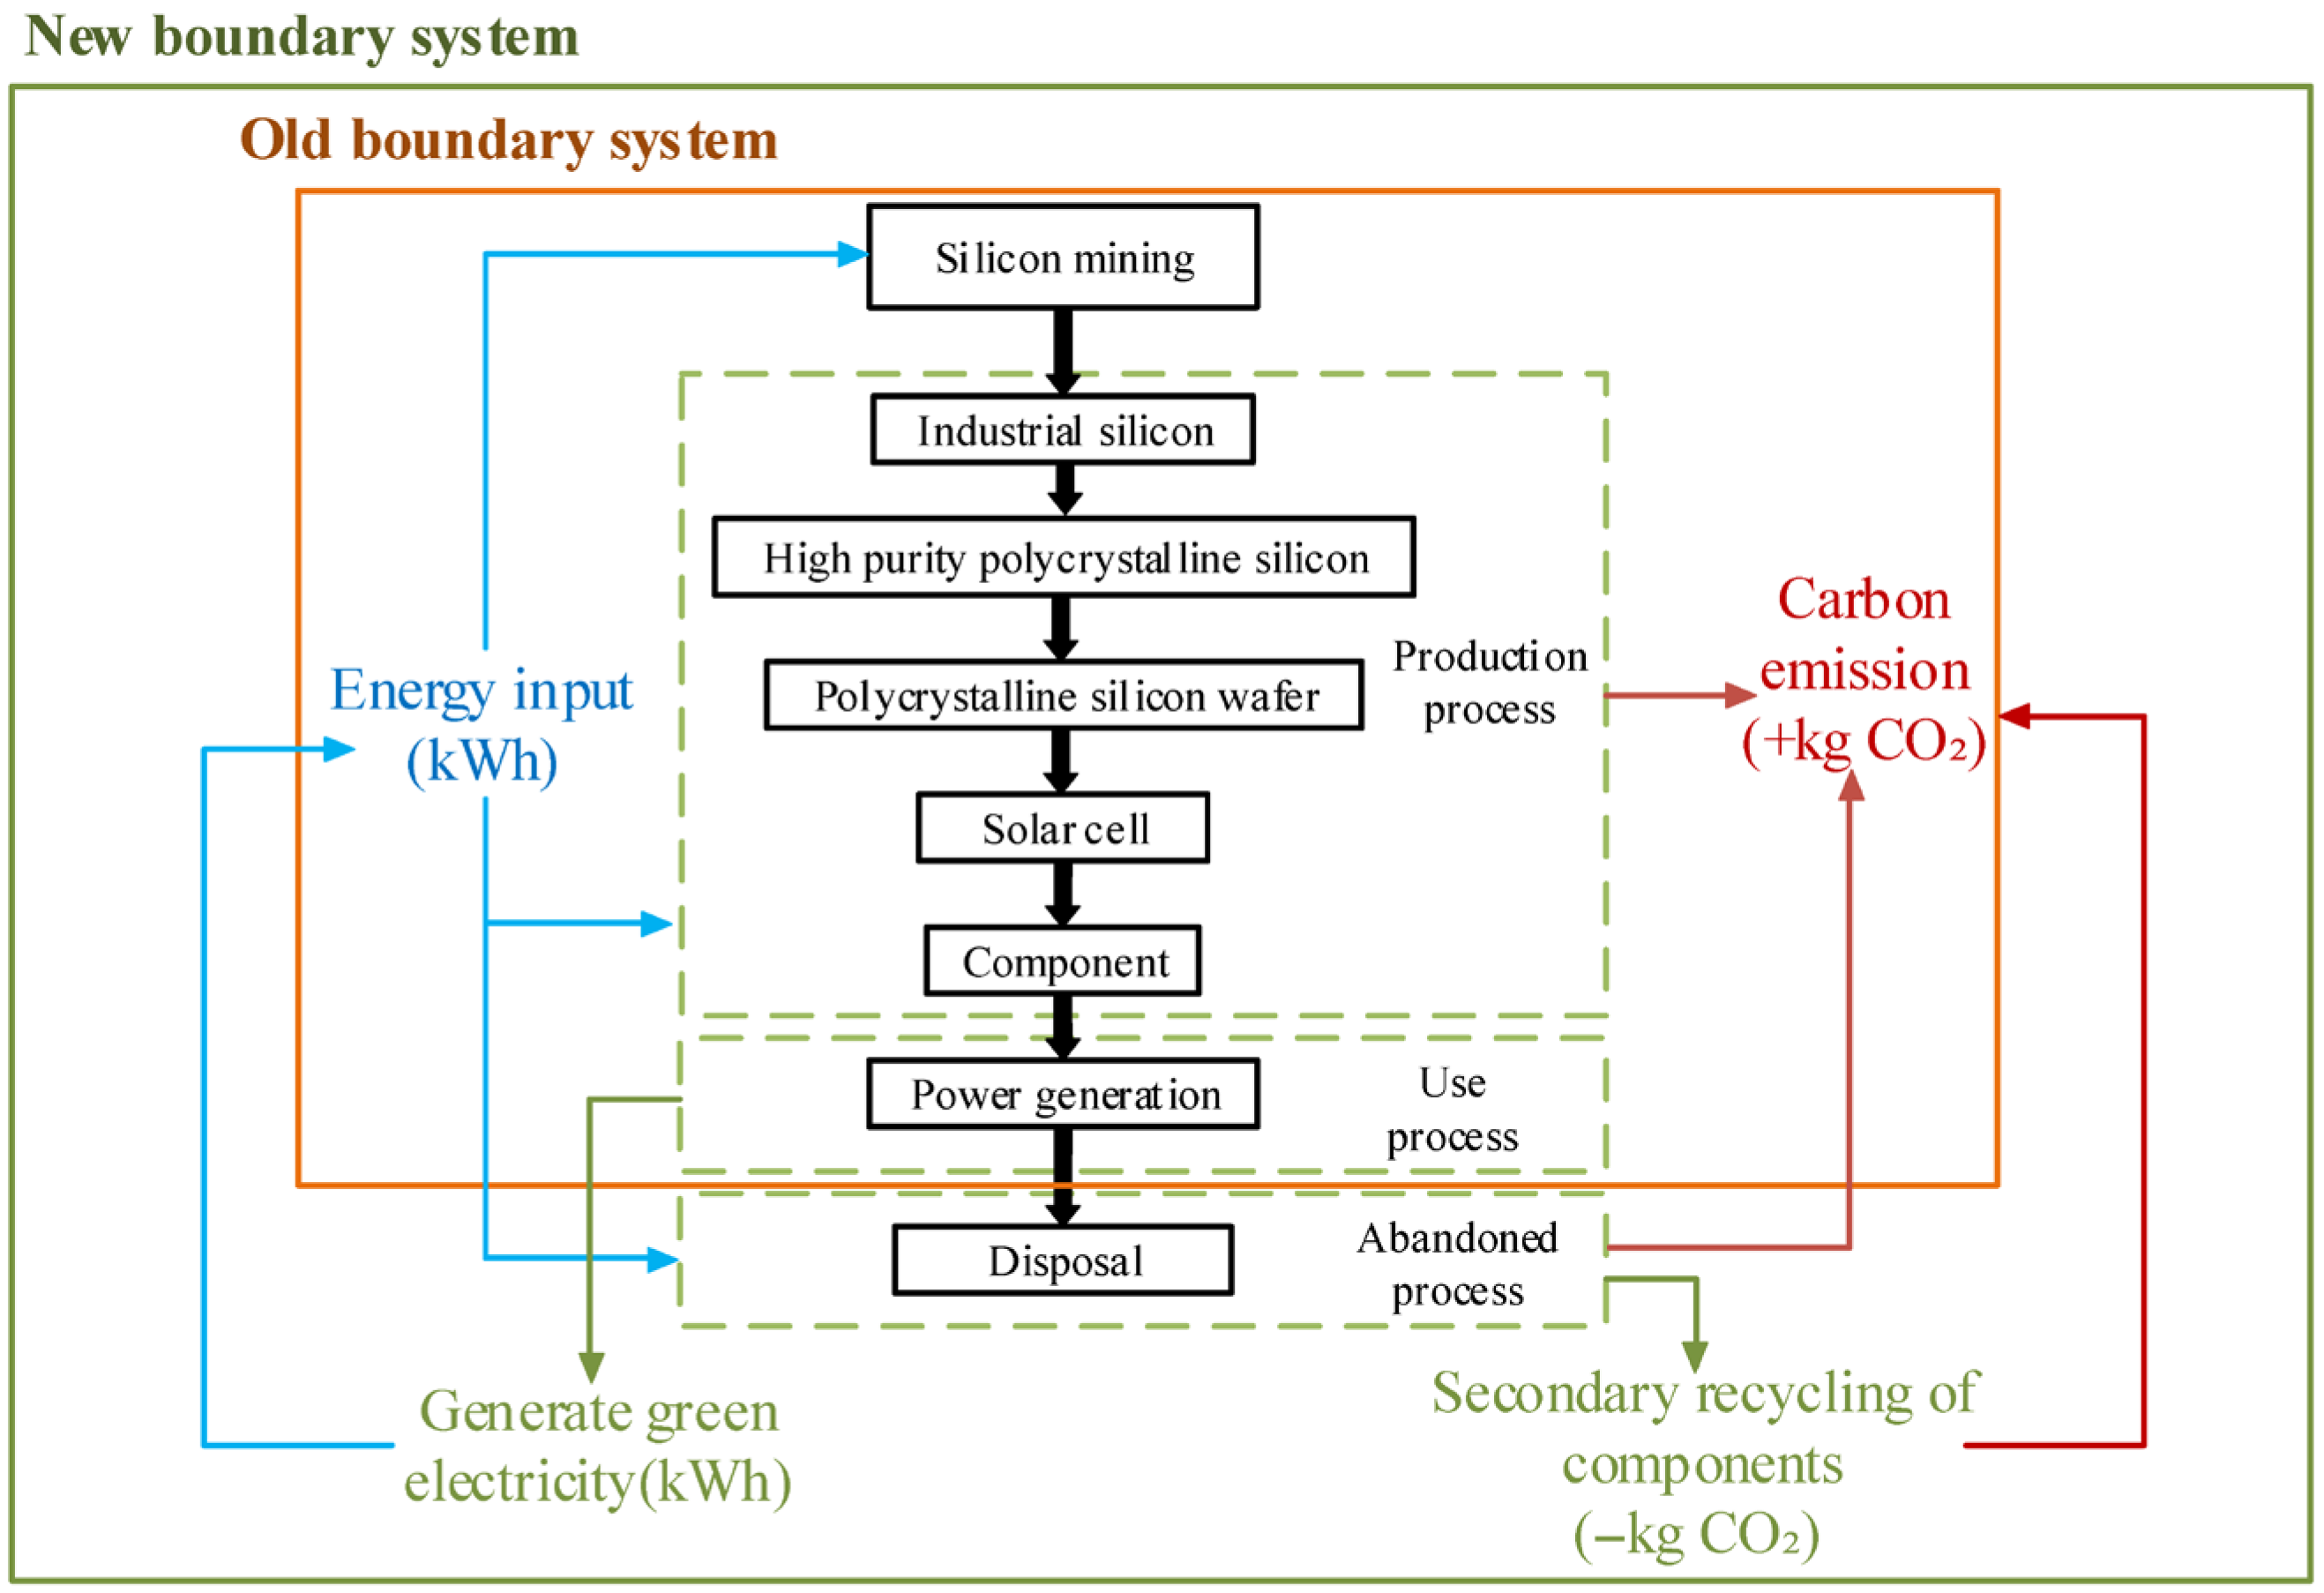
To achieve a more comprehensive evaluation of the environmental benefits of photovoltaic (PV) systems, this study introduces a novel assessment boundary within the conventional Life Cycle Assessment (LCA) framework. By incorporating the “net value” concept, the proposed framework integrates multiple factors across the system’s life cycle, including energy consumption, carbon emissions, and energy recovery. A more accurate depiction of PV systems’ net environmental performance is made possible by this improved border, which improves the accuracy of environmental benefit assessments. A comparative visualization of the traditional and proposed boundary frameworks is presented in
Figure 1.
Figure 1 illustrates the energy flow and carbon emission process of photovoltaic (PV) systems throughout their entire life cycle. In traditional life cycle assessment (LCA) models, energy consumption and carbon emissions are mainly accounted for during the production phase, reflected as inputs of energy and emissions. The model proposed in this study overcomes this limitation by also considering the energy flow during the operational phase and the recovery process at the end of the life cycle. It is particularly noteworthy that recycling PV modules during the decommissioning phase can lead to reductions in carbon emissions and benefits from energy recovery, all of which are integrated into the model analysis. This extension enables the model to more accurately quantify the net carbon reduction benefits that the system can achieve over its entire life cycle, especially after decommissioning, providing a more comprehensive and realistic assessment of its environmental performance.
3. Power Generation and Carbon Emission Model
There is a close relationship between the power generation and carbon emissions of photovoltaic systems. At different stages of the lifecycle, carbon emissions vary with changes in power generation, especially under the influence of attenuation effects [
18]. This article analyzes the dynamic relationship between power generation and carbon emissions before and after the commissioning of photovoltaic systems through formulas and calculation processes.
Before the photovoltaic system is put into operation, carbon emissions mainly come from the production stage. The manufacturing and assembly of photovoltaic modules require a large amount of electrical energy, which in turn generates carbon emissions. The carbon emissions during the production phase are set as
, which includes the energy consumption and corresponding carbon emissions of component production. Assuming the total carbon emissions during the production phase are:
In the formula, is derived from the material consumption list (unit installed capacity) in kg/kW; is the carbon emission factor () of the corresponding material or energy.
In the intermediate products of various stages of the lifecycle of photovoltaic systems, the weight of photovoltaic grid-connected systems far exceeds that of other intermediate products. Considering the trend of vertical integration in the photovoltaic industry chain, this article only calculates the transportation energy consumption and carbon footprint generated by transporting photovoltaic systems to the installation site during the transportation phase. As shown in Formula (2)
In the formula: : transportation distance (km); : Transportation quality (ton) : Diesel fuel consumption intensity (taken as 0.05 L/(t·km)); The formula for the diesel carbon emission coefficient (2.68 kg CO2/L).
The formula for the recycling stage is:
In the formula:
is Carbon emissions during the recycling stage (
);
: the carbon emissions during the dismantling phase (
);
: is the offset phase of carbon emissions (
).
In the formula:
is Carbon emissions during the dismantling stage (
);
: Quality of dismantled waste photovoltaic modules (kg);
refers to the carbon emission factor (kg) during the dismantling stage.
In the formula: : It is carbon emissions in the offset stage (); : It is the quality of discarded photovoltaic modules in the offsetting stage (kg); : It is the carbon emission factor in the offsetting stage (kg).
Following the installation of the solar system, carbon emissions are primarily composed of two components: the system’s energy consumption during operation and the reduction in power generation brought on by equipment attenuation. Set the annual electricity consumption of the system, denoted as
, and this study is based on the typical operating mode of a 1WMp photovoltaic grid-connected power station, assuming that the power consumption of the power station’s own load comes from the external power grid. Calculate the annual operating carbon emissions, denoted as
, based on the carbon emission coefficient
(unit: kg CO
2/kWh)
The formula for obtaining the variation in the entire lifecycle over time is as follows:
According to the concept of net worth, it includes the comprehensive benefits of carbon emissions and energy recovery at various stages of the lifecycle of photovoltaic systems. With this method, the net environmental benefits of the solar system throughout its lifecycle are reflected, particularly in the recycling stage, where negative emissions contribute to lowering overall carbon emissions.
4. Power Generation and Energy Recovery Period Model
After establishing a lifecycle carbon emission model, it is necessary to further describe the power generation behavior of photovoltaic systems during operation [
19]. The power generation is the core variable for calculating the cumulative power generation, carbon recovery time, and three-dimensional coupling trajectory, so it is necessary to construct a dynamic power generation model that can reflect the real characteristics of the operation process.
Photovoltaic modules will experience annual attenuation during operation, mainly due to factors such as photoinduced attenuation, material aging, thermal stress, and decreased packaging performance. Numerous studies show that both monocrystalline and polycrystalline silicon components may be explained by a set annual decay rate model, which implies that power generation drops exponentially with operation time. Therefore, the effective power generation in year
can be written as:
Among them,
reflects the local radiation conditions and system efficiency in the first year of power generation, and this article uses the hourly method to estimate the theoretical annual power generation;
is the annual attenuation rate of the component, provided by the manufacturer;
is the operating age of the system. Based on the above equation, the cumulative power generation of the photovoltaic system in the t-th year of operation can be expressed as:
After each year of operation, the power generation of the photovoltaic system will be used to meet the energy demand of the system.
The relationship between annual energy consumption and power generation is:
Energy Payback Time (EPBT) refers to the time required for a photovoltaic system to offset the energy consumed during its production and usage phases through the amount of electricity it generates. To characterize the temporal variation in the energy recovery process, this study uses a dynamic EPBT expression that reflects the net properties of the system’s energy balance. Consequently, the calculation results for system carbon emissions and energy payback time can comprehensively reflect the net benefits of the photovoltaic system’s entire life cycle under different attenuation scenarios [
20]. Based on the relationship between power generation and energy consumption mentioned above, the total energy input of the manufacturing stage is recorded as embedded energy
. The ratio of the total energy during the manufacturing phase of a photovoltaic system to the rated power of the photovoltaic system is usually expressed in units of kWh·kW
−1 [
21]. According to energy conservation, the energy recovery period can be defined as the operating time corresponding to the cumulative power generation of the system being equal to the manufacturing energy consumption. To describe the energy recovery process that varies over time, this study uses a dynamic EPBT expression:
Among them is the cumulative power generation at year t obtained from the previous section; is the total energy consumption during the manufacturing stage per unit installed capacity; represents the “remaining payback period” at the t-th year of system operation, which is how many years are still needed to offset the initial manufacturing energy consumption at the current cumulative power generation level.
5. Construction and Validation of a 3D Dynamic Coupling Model
After obtaining the life cycle cumulative carbon emission function
, cumulative power generation function
, and dynamic energy recovery period function
, it is necessary to construct a comprehensive evaluation framework that can simultaneously reflect the multidimensional changes in the “carbon emissions power generation energy recovery” process of photovoltaic systems. The three-dimensional coupling model proposed in this study aims to express the three core processes mentioned above in a unified coordinate system, thereby intuitively revealing the environmental performance evolution trajectory of photovoltaic systems throughout their entire lifecycle. Based on the above parameters, the mathematical definitions of the three types of dynamic variables are as follows:
By combining the above three core variables, we can draw a three-dimensional trajectory of the lifecycle of a photovoltaic system over time t, reflecting the interrelationships between carbon emissions, power generation, and energy recovery periods. The specific three-dimensional coupling model can be described using the following formula:
,
, and
, respectively, represent the functional relationship between carbon emissions, cumulative power generation, and energy recovery period over time. These functions form a continuous parameterized trajectory through the lifecycle time t. In the three-dimensional coordinate system, we map the cumulative carbon emissions, cumulative power generation, and energy recovery period onto the
,
, and
axes, respectively. These connections can be displayed in three dimensions using MATLABR2024a to demonstrate the dynamic evolution link between carbon emissions, power generation, and the energy recovery period of solar systems across their entire lifecycle. The constructed three-dimensional coupled model not only depicts the environmental benefits of the photovoltaic system, but also provides more accurate results based on net worth effects [
22]. Through this comprehensive evaluation method, the dynamic relationship between carbon emissions, power generation, and the energy recovery period of photovoltaic systems under different attenuation scenarios can be demonstrated.
When creating a three-dimensional linked model of a photovoltaic system, selecting the proper model parameters is critical for the precision and dependability of the outcomes [
23]. This study used the “staged accumulation” method for carbon emission accounting during the manufacture stage of solar modules based on 1MWp polycrystalline silicon photovoltaic grid-connected power generation systems in the Xinjiang region. The goal is to make the carbon emissions of each manufacturing process transparent. Several databases, including the TianGong_V0.2.0 database, Ecoinvest 3.8 database, Ecoinvest 3.9 database, and GaBi 2022 database [
24,
25], provided the essential information used in this work.
Table 1 and
Table 2 show the carbon emissions from a 1MWP polycrystalline silicon photovoltaic system in Xinjiang, both during production and during its lifetime.
In terms of carbon emissions at each stage of the entire lifecycle, the data is shown in
Table 2.
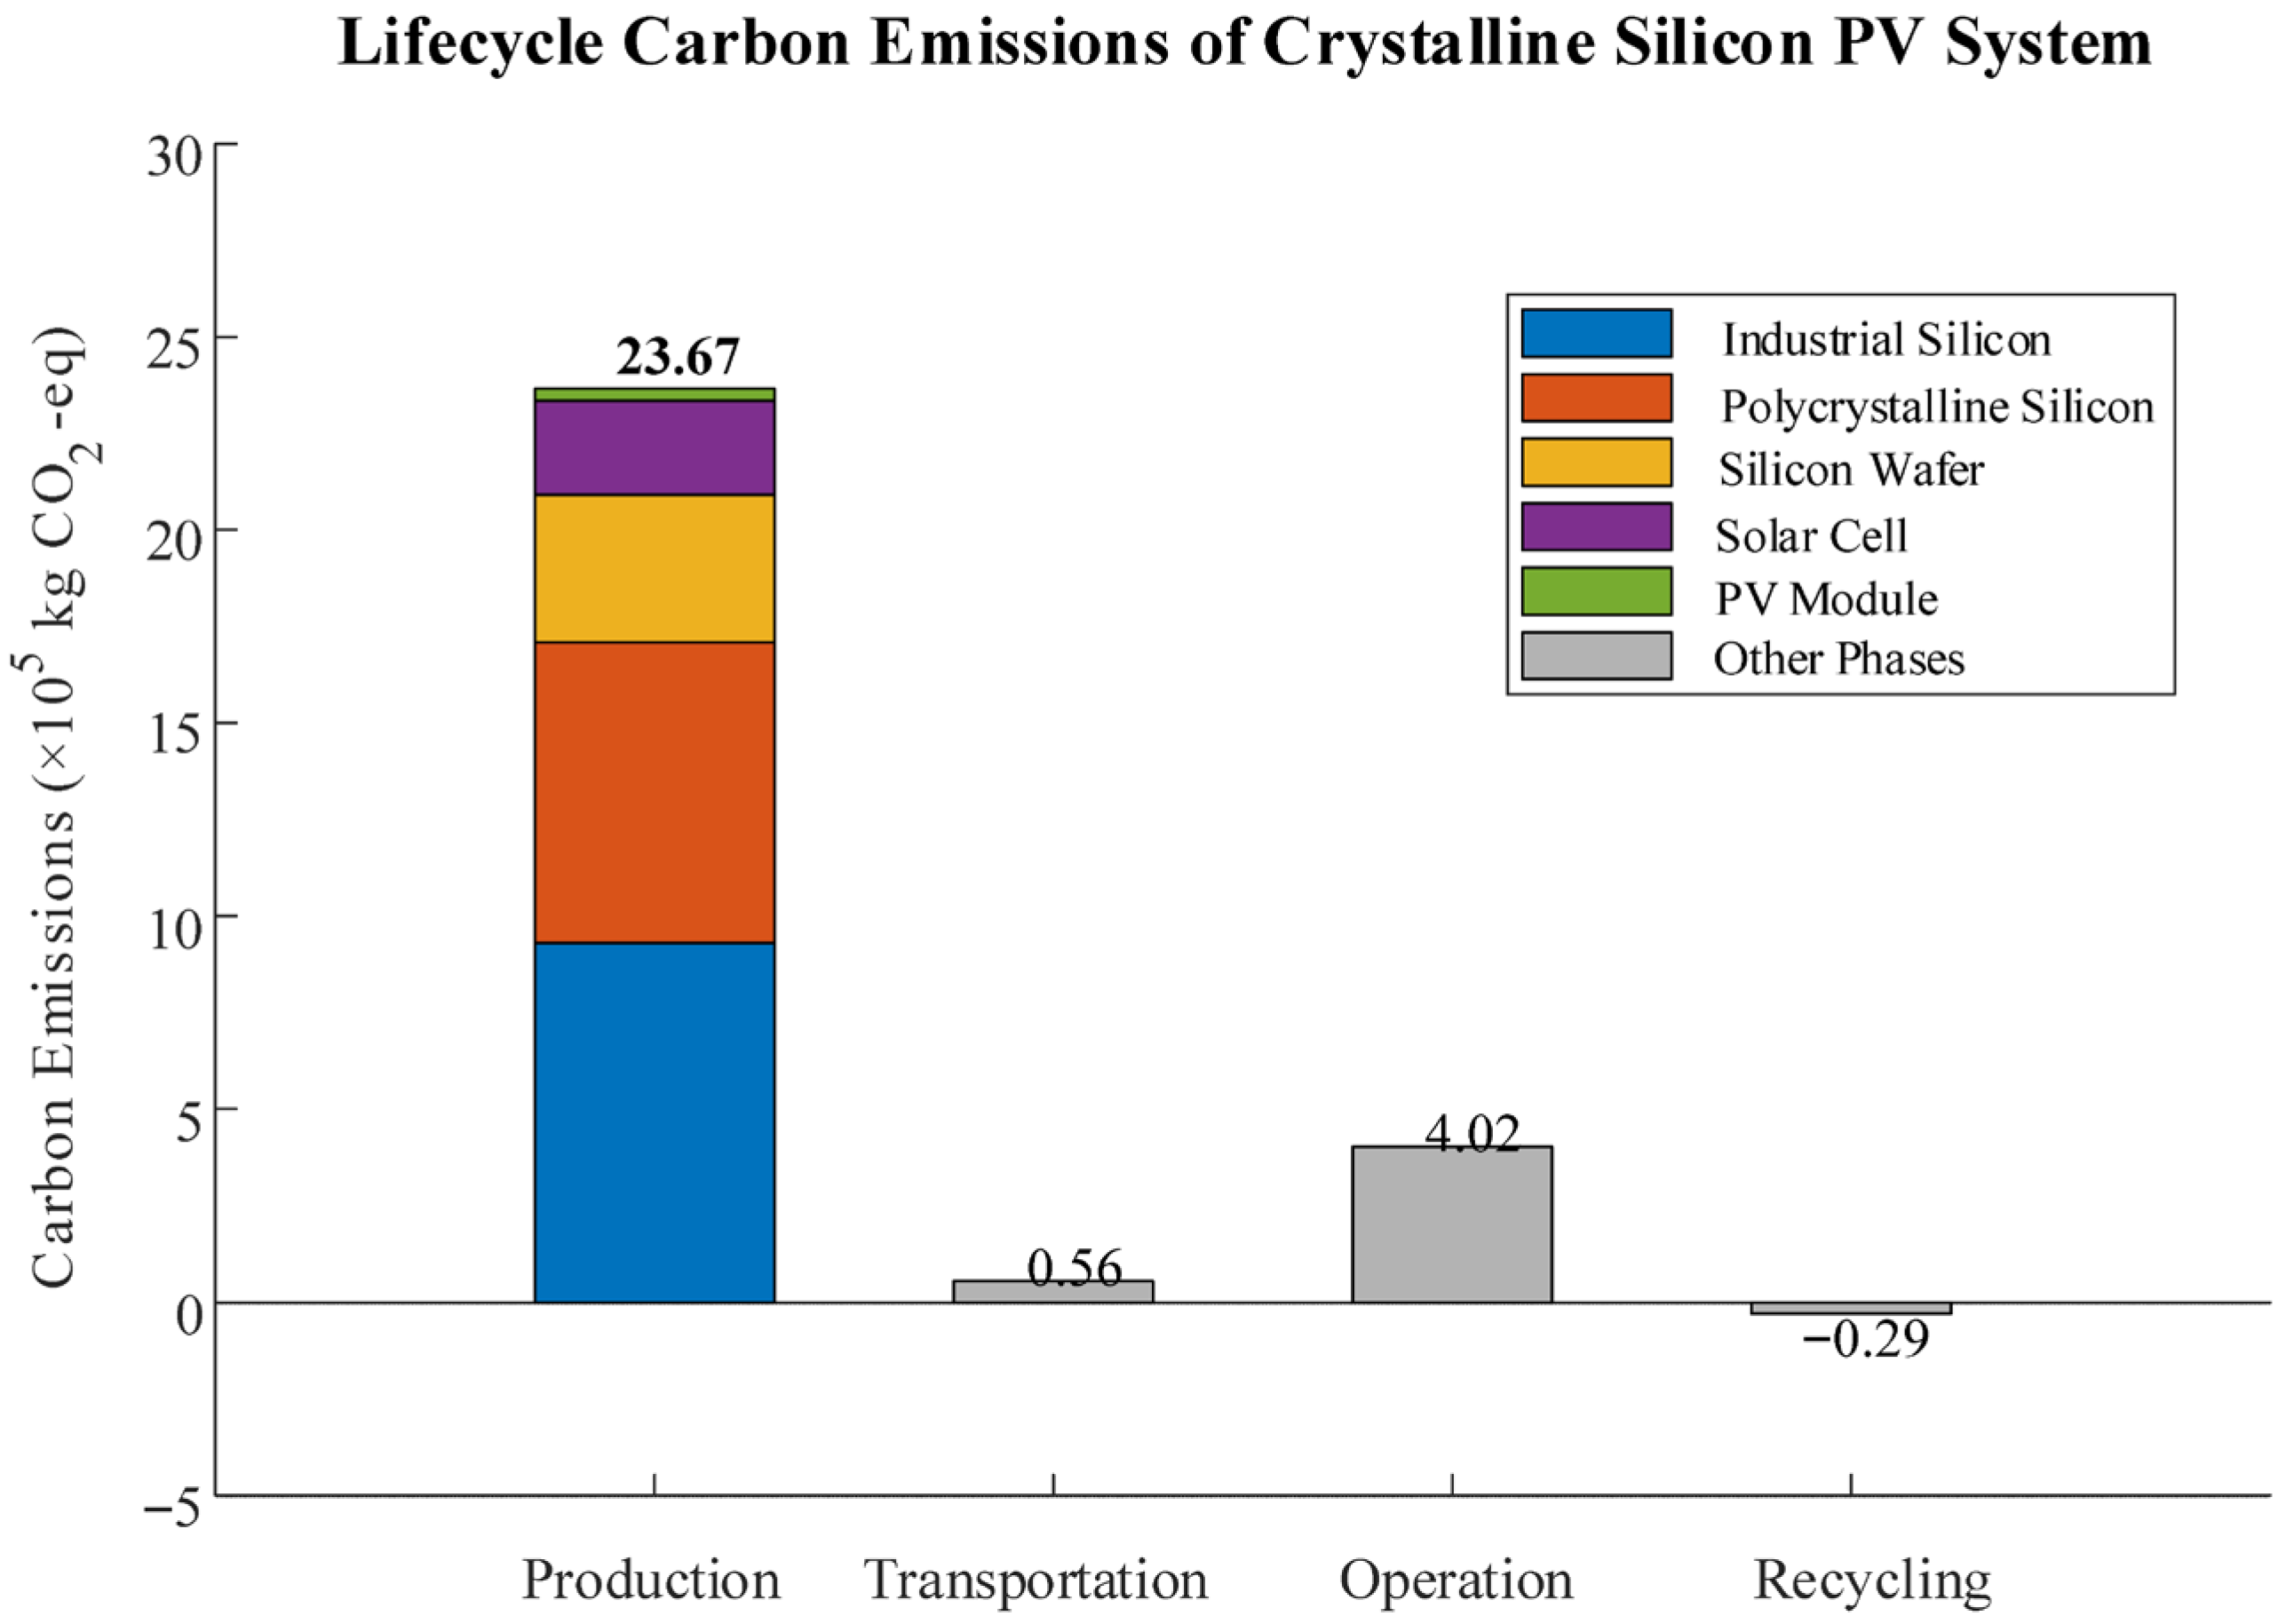
As shown in
Figure 2, the carbon emissions at different stages of the lifecycle are compared. Throughout the lifecycle, positive emissions are mostly concentrated in the production stage, whereas negative emissions are decreased in the recycling stage. As this study focuses on the potential environmental benefits and acknowledges the current economic challenges of recycling, we believe that with advances in recycling technology, the improvement of regulations, and the increasing value of raw materials, environmental benefits and economic benefits are likely to be better combined in the future.
There are other ways to calculate the theoretical annual power generation of photovoltaic power plants, but the hourly rule is frequently employed due to its straightforward computation and strong applicability. Considering the abundant sunshine resources and easy availability of data in Xinjiang, the hourly method is particularly suitable for areas like Xinjiang with abundant sunshine resources. Compared with other methods, such as the standard method and the area method, although they have higher accuracy, they usually require detailed radiation data (such as annual radiation on inclined surfaces), which is complex to obtain, and the calculation process is more cumbersome. The hourly method only requires estimating annual power generation based on the operating time and radiation level of the photovoltaic system, without the need for complex climate models or measurements of annual radiation levels on inclined surfaces. The hourly method has stronger practicality and operability in data collection. Suitable for areas with abundant light resources and convenient data acquisition, and able to provide sufficient accuracy for estimating annual power generation. Therefore, this article uses the hourly method to estimate the theoretical annual power generation, and obtains the first annual power generation as = 1.52 × 10⁶ kWh. For a 1MWp photovoltaic system, the total manufacturing energy consumption is set at 3 × 10⁶ kWh.
Important photovoltaic system properties, including the attenuation rate, power generation, and average annual power-generating hours, were changed in this study based on the data mentioned above. The attenuation rate (d) of solar systems has a considerable influence on long-term power generation [
26]. In empirical attenuation experiments aimed at different climate zones (particularly desert, high-temperature, and high-radiation places such as Xinjiang), the annual attenuation rate of modules ranged from 0.8% to more than 3%. Photovoltaic modules typically have an attenuation rate of around 3% each year.
As working duration grows, the power generation efficiency of modules decreases year after year. To examine the impact of each parameter on output results, the Saltelli extended sampling approach was used for roughly 14,000 model evaluations with a ±20% range.
Table 3 shows the sensitivity analysis results for several parameters.
Through sensitivity analysis, it can be concluded that next year’s power generation and manufacturing energy consumption parameters have a significant impact on carbon recovery time and energy recovery period, providing an important basis for subsequent system optimization and model improvement.
6. Results and Discussion
This study selects a typical 1MWp grid-connected polycrystalline silicon photovoltaic power station in Xinjiang, China, and considers the dynamic relationship between the station’s carbon emissions, power generation, and energy payback period under three different scenarios: standard attenuation, high attenuation, and low attenuation.
In this study, attenuation rates (1%, 3%, 5%) were based on common assumptions about the attenuation of photovoltaic systems in existing literature. These assumed values reflect the performance attenuation of photovoltaic systems in various usage circumstances, particularly the efficiency decline of solar modules after long-term operation. According to multiple photovoltaic life cycle assessment (LCA) studies, the annual attenuation rate of photovoltaic modules is typically between 0.5% and 1.0%, with some literature even reporting higher decay rate values. In this study, we selected 1%, 3%, and 5% as attenuation rates under different scenarios to analyze the impact of different attenuation rates on the energy recovery period and carbon recovery period (EPBT) of photovoltaic systems [
27].
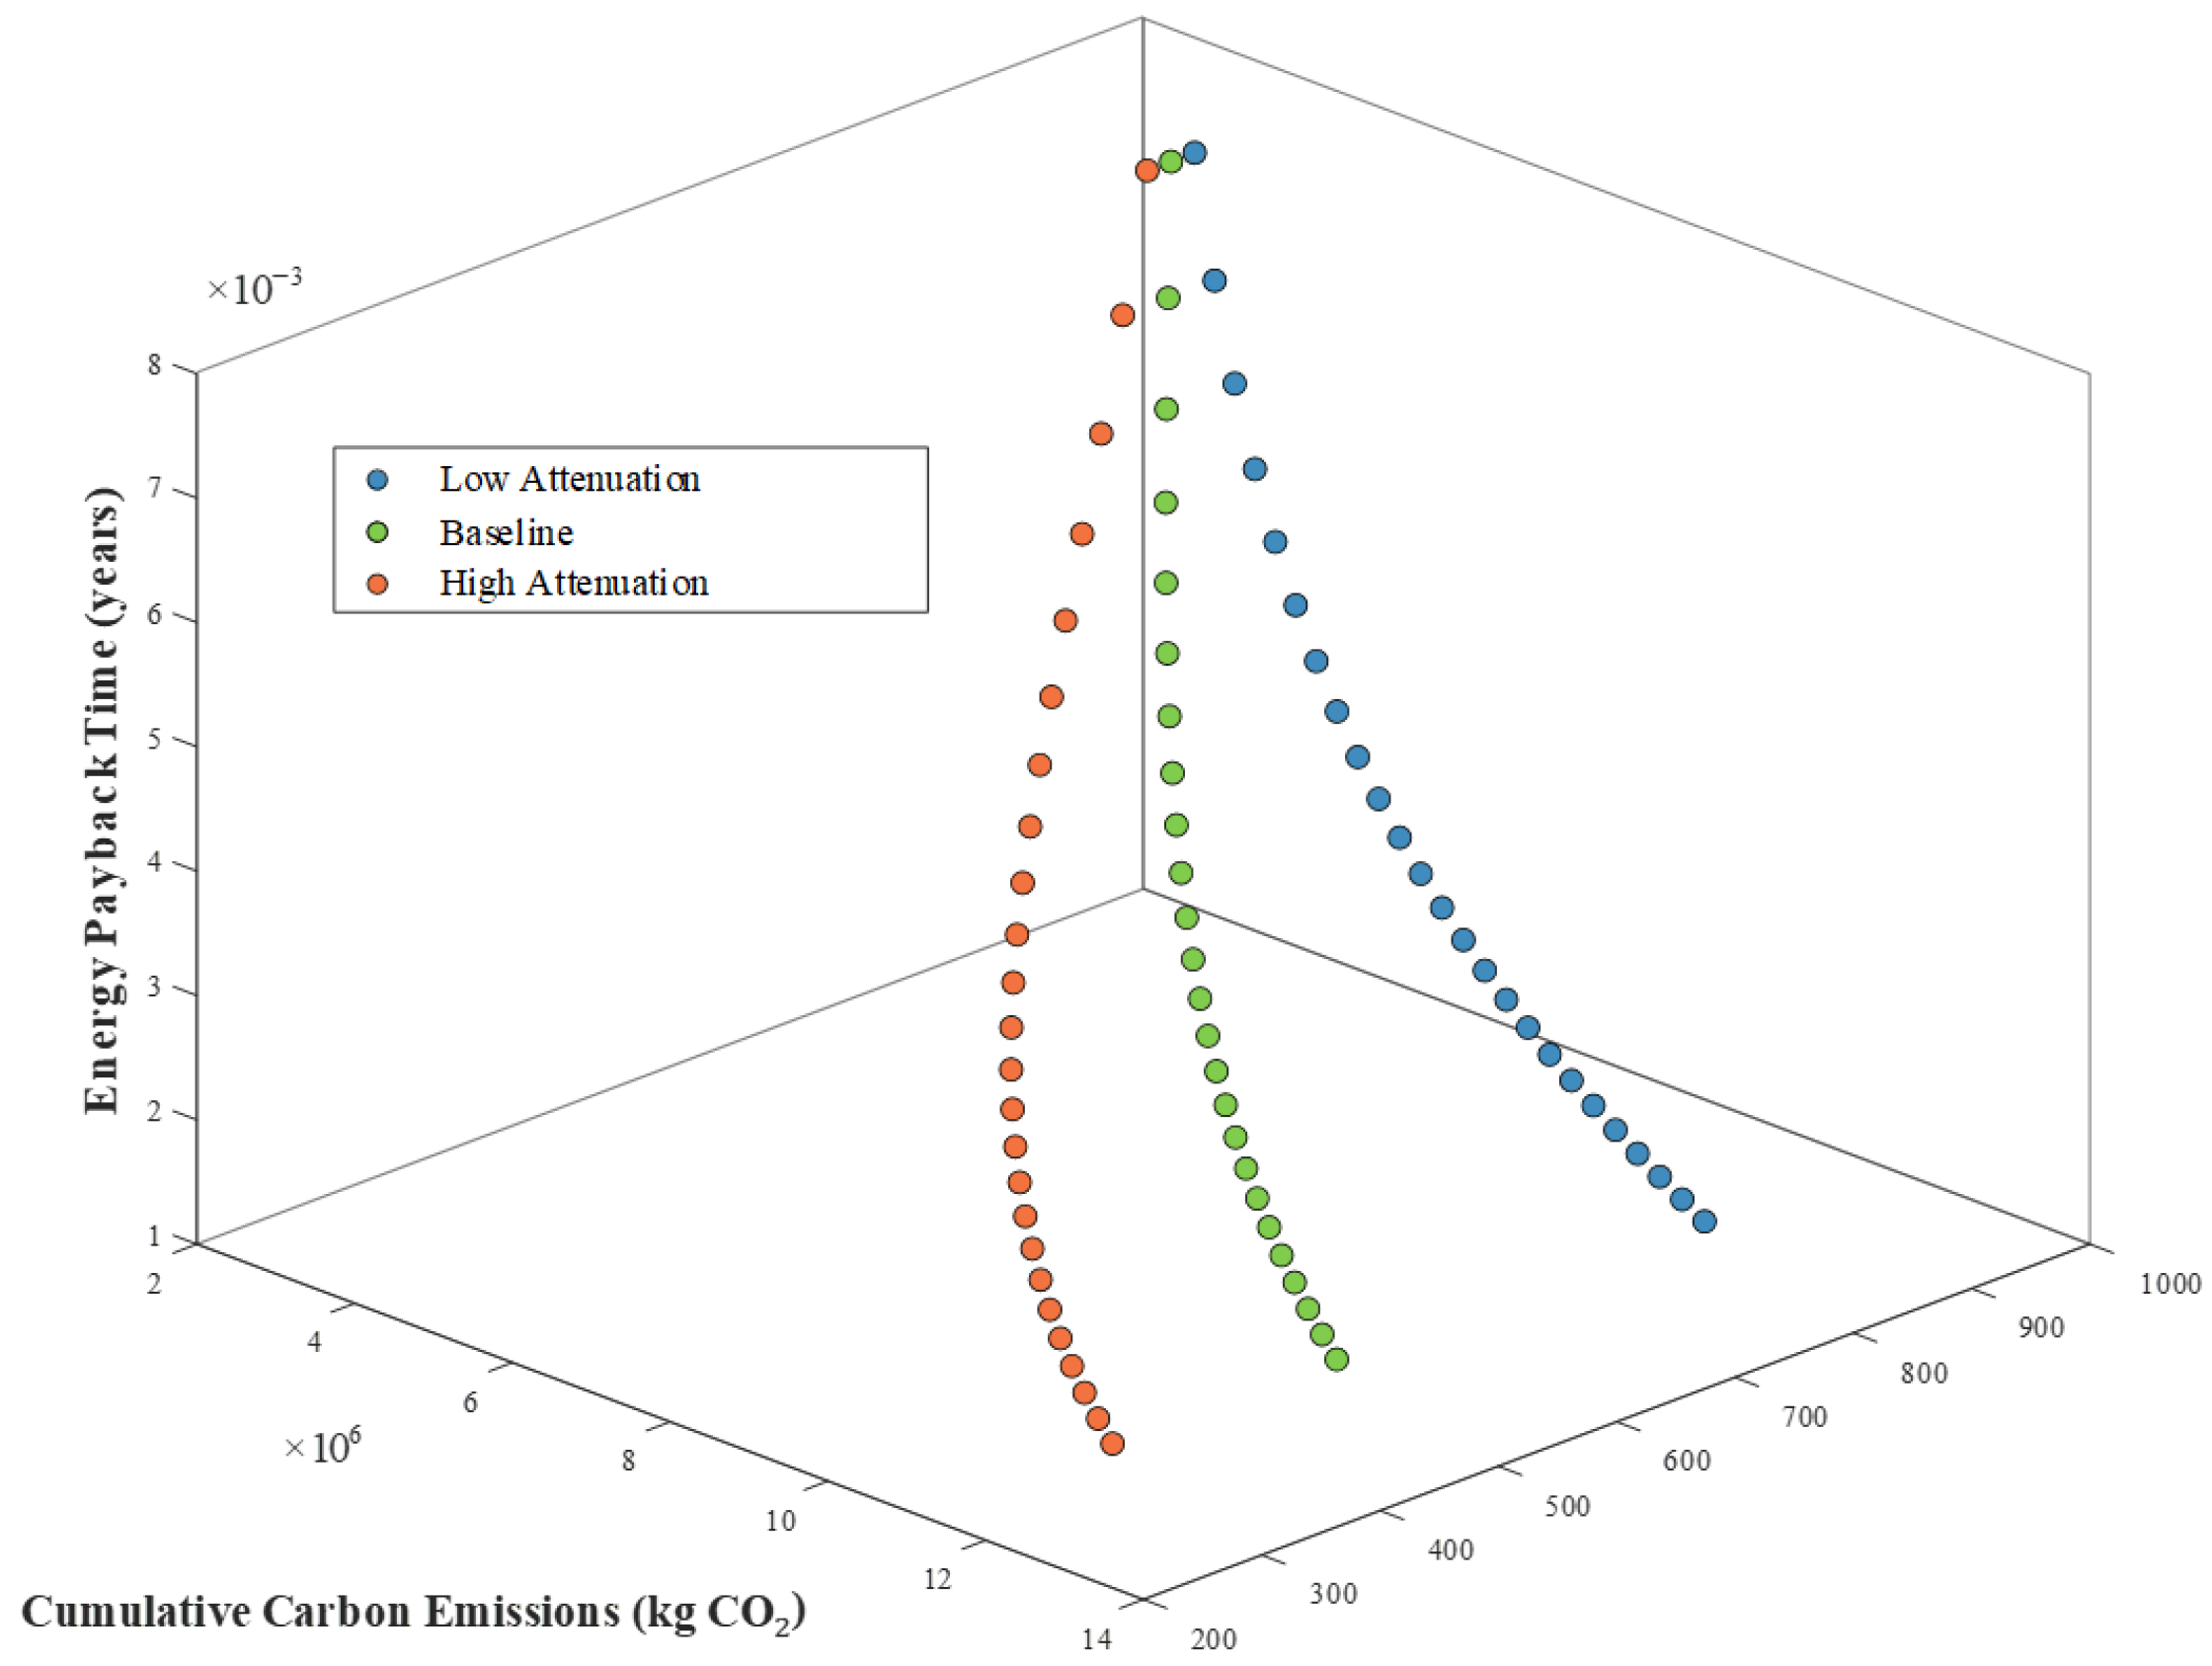
Figure 3 and
Figure 4 show the relationship between carbon emissions, power generation, and the energy payback period of photovoltaic systems under different degradation scenarios. Analysis reveals that the degradation rate has a significant impact on the performance of photovoltaic systems. In particular, under high degradation scenarios, the power generation efficiency of photovoltaic modules decreases significantly, resulting in a relatively longer energy payback period. In contrast, under low degradation scenarios, the power generation of the photovoltaic system increases rapidly, leading to a shorter energy payback period.
Figure 3 presents the three-dimensional relationship among carbon emissions, cumulative power generation, and energy payback time under different attenuation scenarios. The three scenarios are distinguished by color: the low-attenuation scenario (blue) represents the PV system under low-attenuation rates; the high-attenuation scenario (orange) illustrates system performance under accelerated attenuation; and the baseline scenario (green) corresponds to performance under baseline attenuation rates. In this figure, the X-axis denotes cumulative carbon emissions (kg CO
2), the Y-axis represents cumulative power generation (kWh), and the Z-axis indicates the energy payback time (years). The position of each data point reflects the dynamic evolution of the PV system’s performance metrics across the respective scenarios.
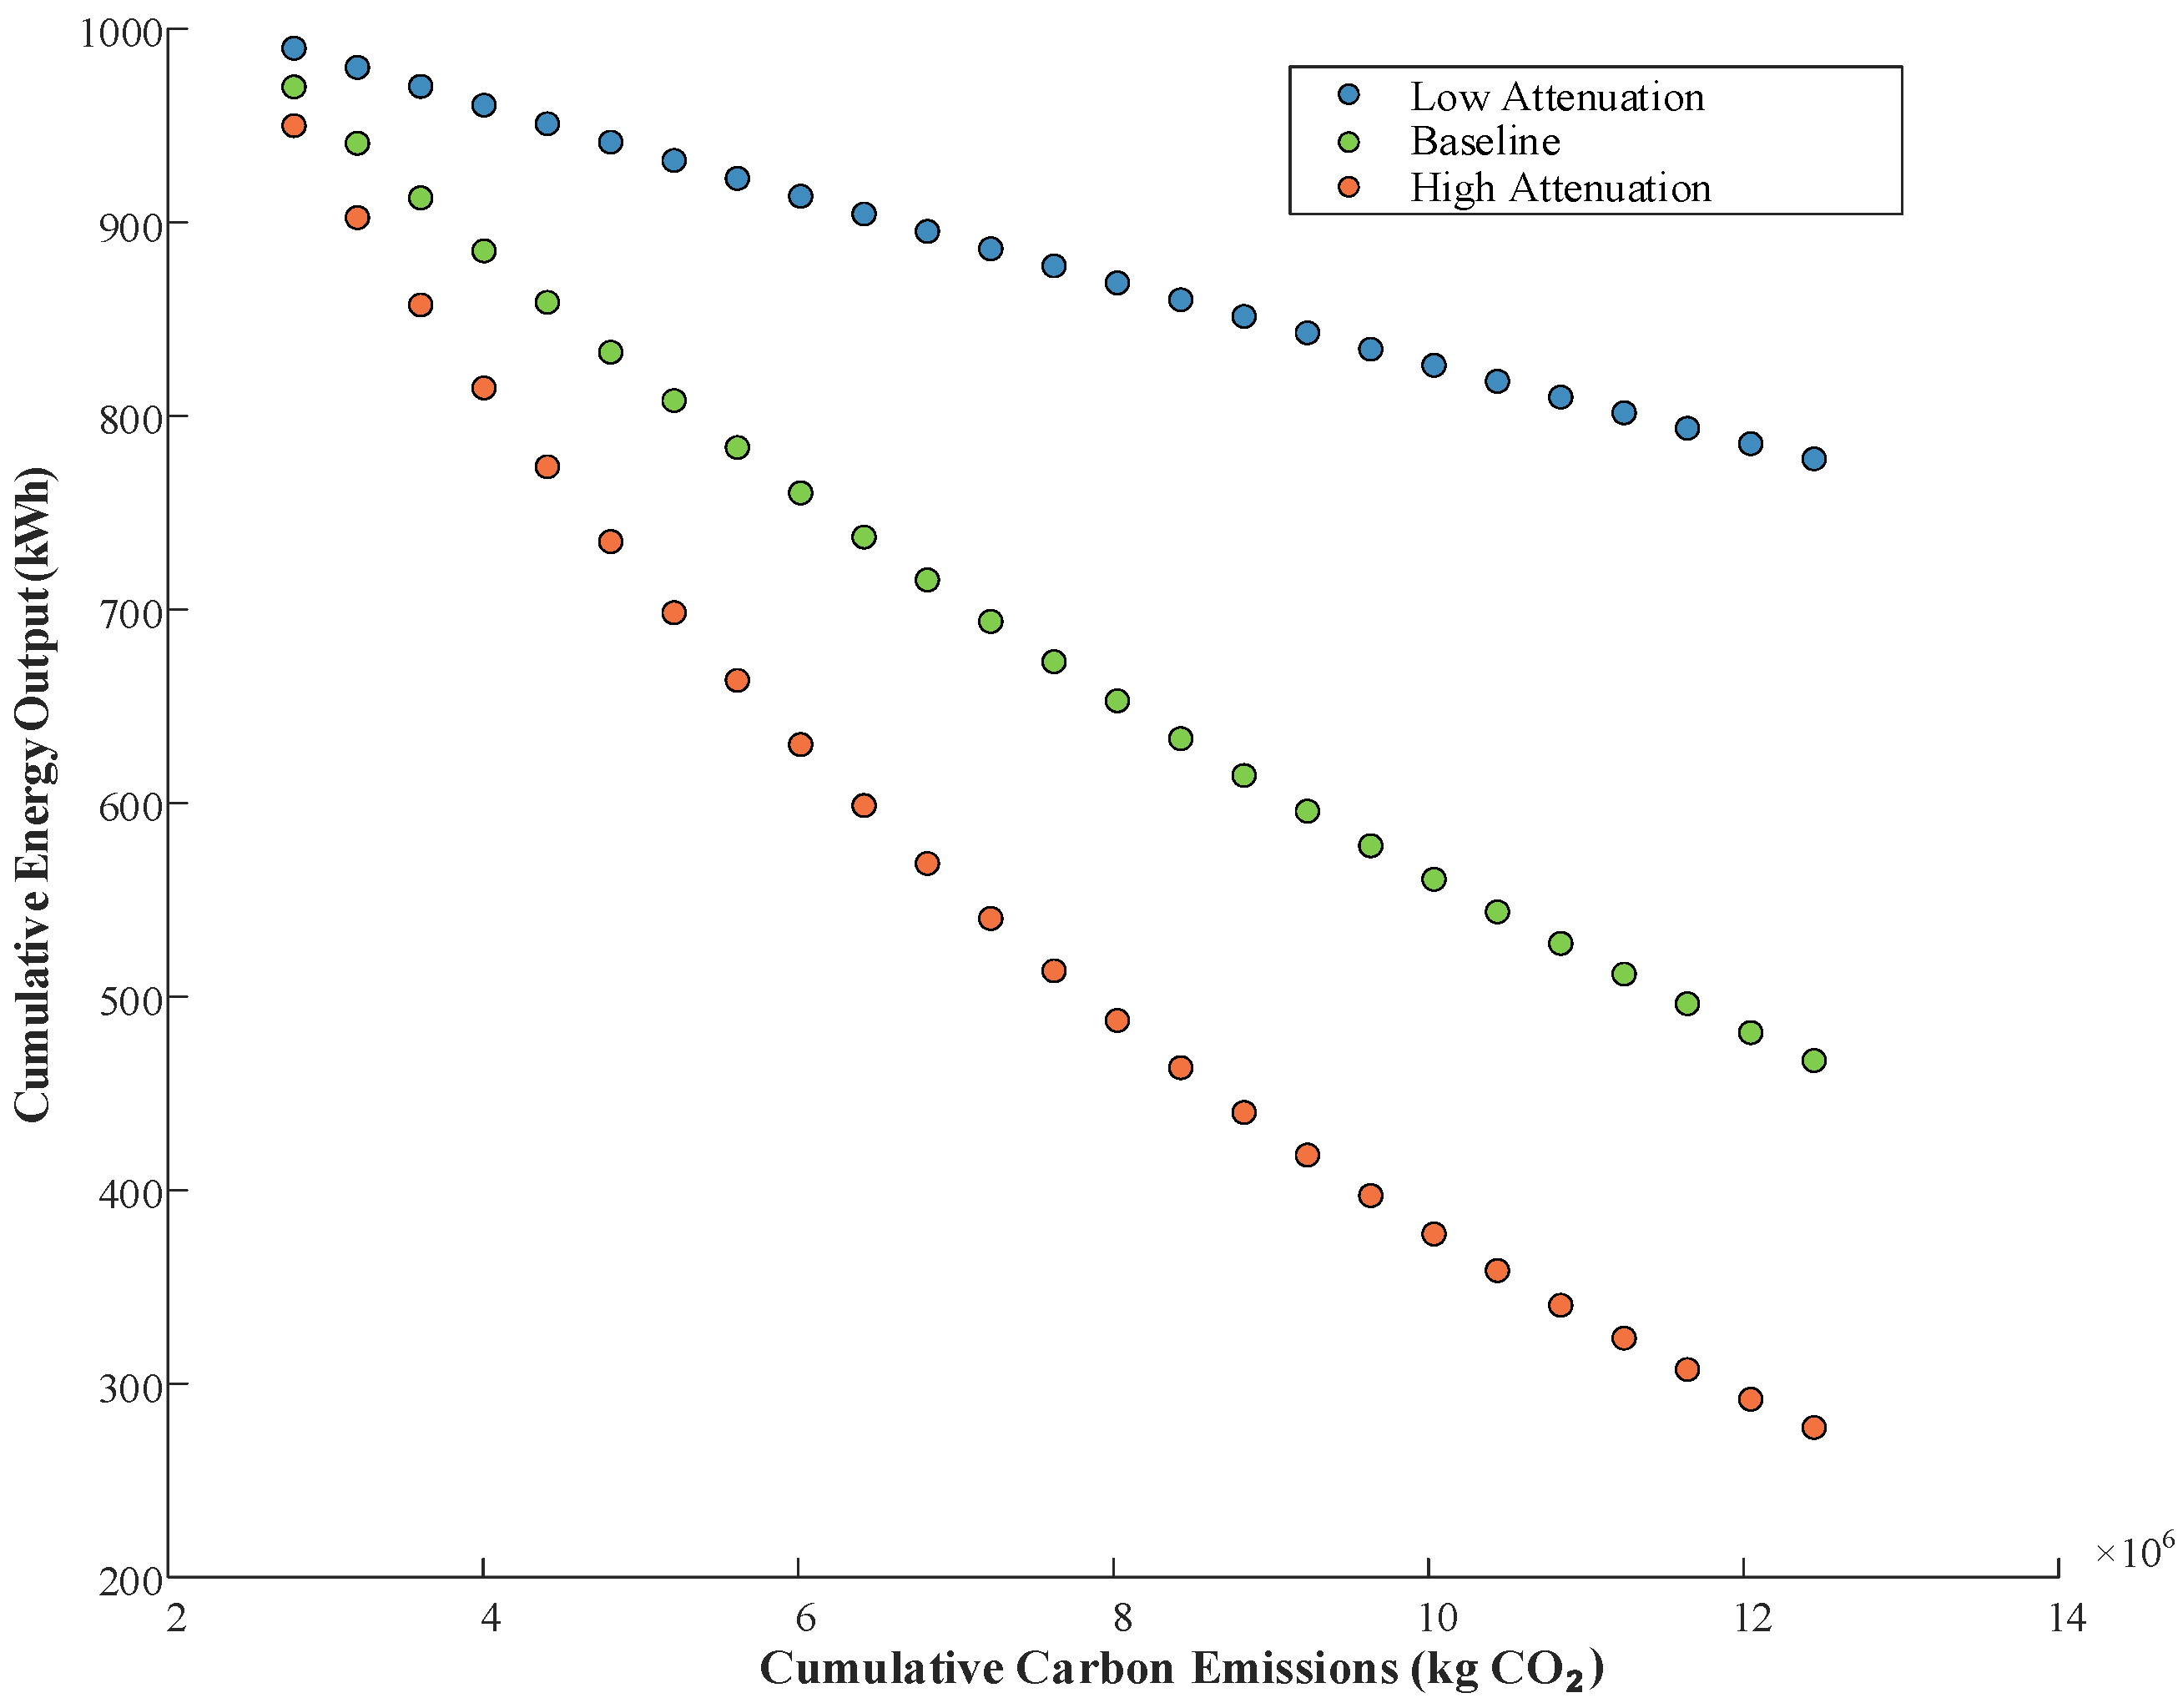
The figure above illustrates the relationship between cumulative carbon emissions and cumulative power generation of the photovoltaic (PV) system under different attenuation scenarios. In a planar view, this graphic uses the X-axis to indicate cumulative carbon emissions (kg CO2) and the Y-axis for cumulative electricity generation. (kWh). Distinct colored scatter points differentiate the attenuation scenarios, providing a direct visual comparison of the emission–generation correlation across varying degradation rates.
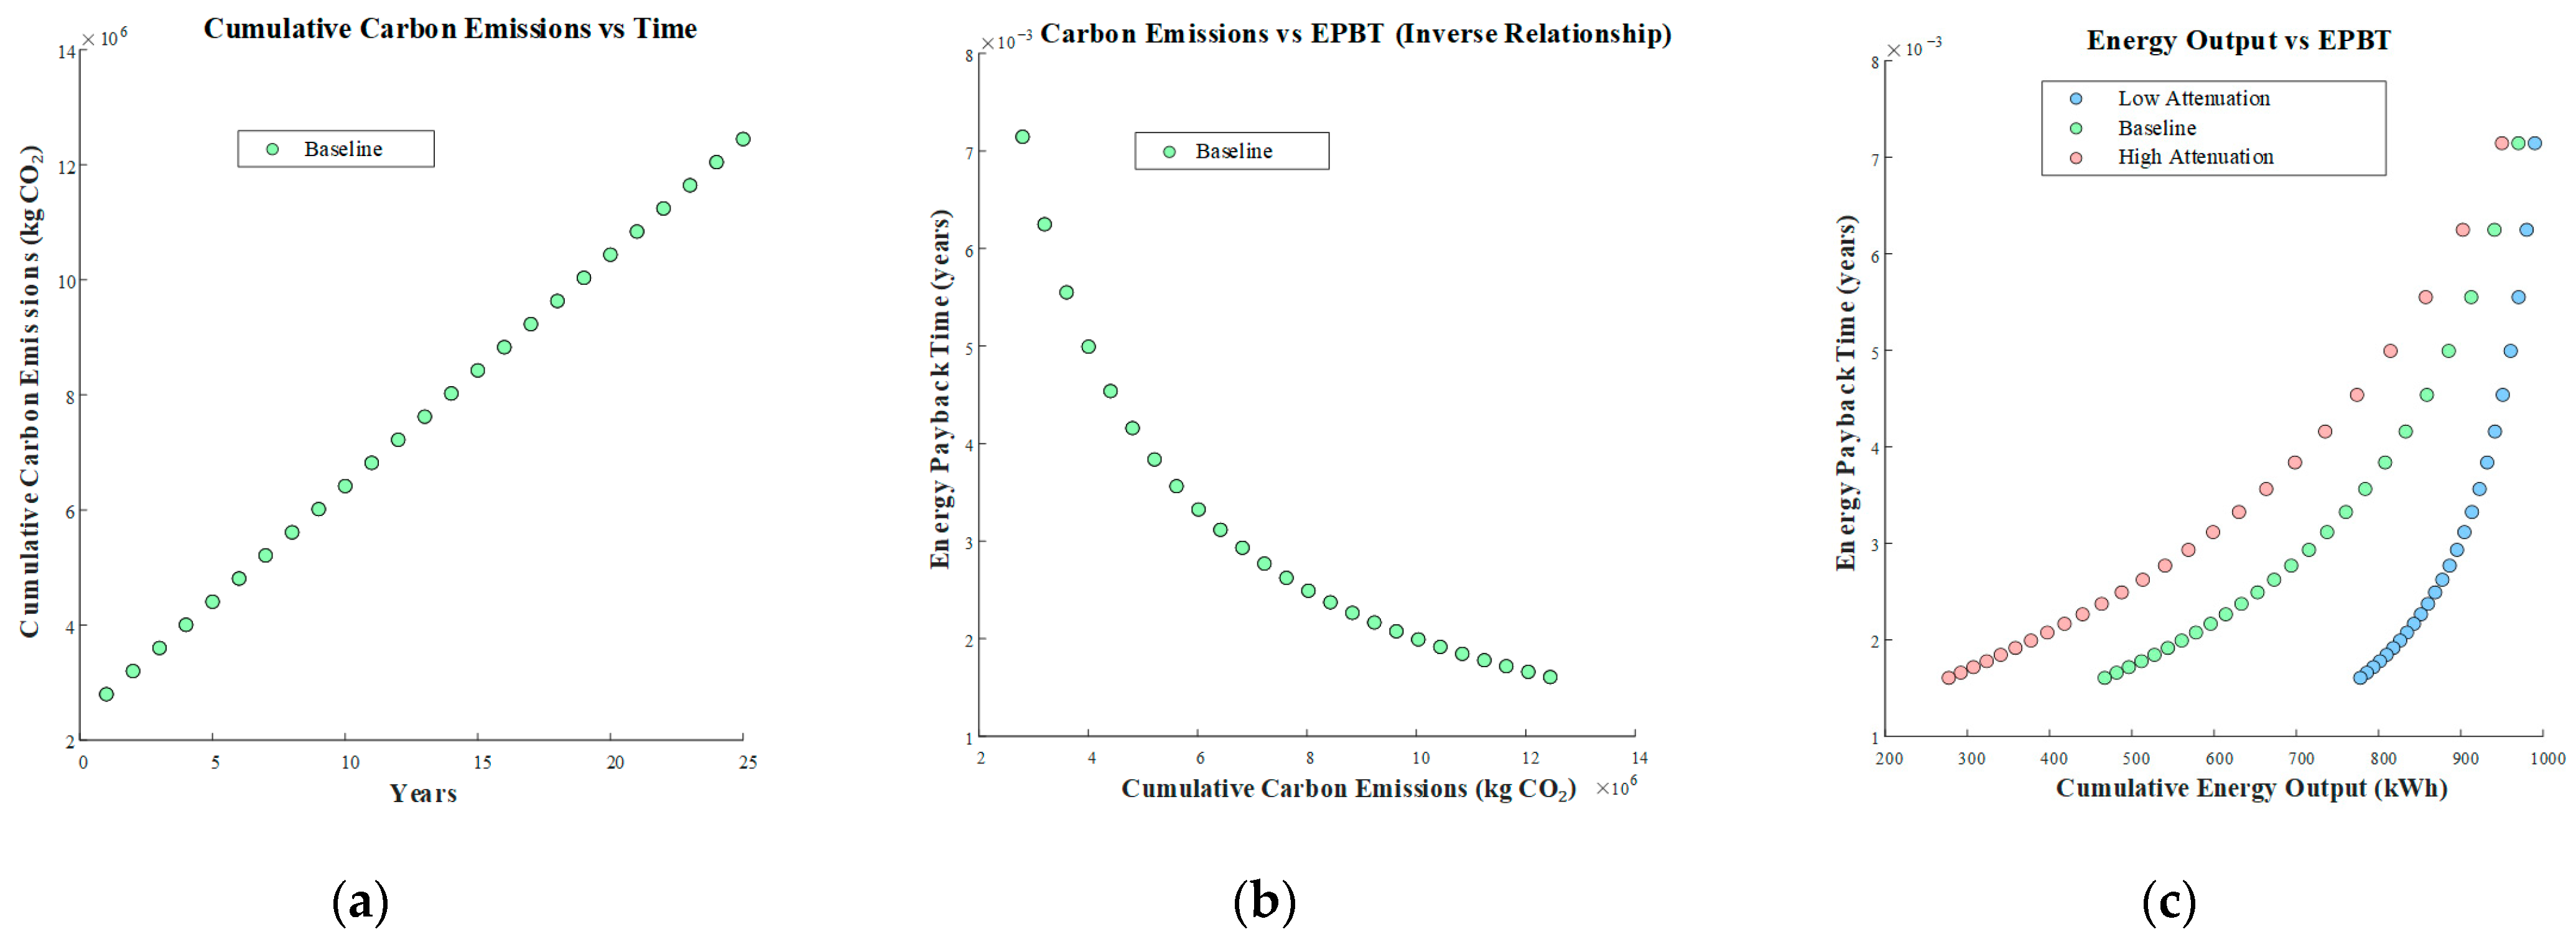
Figure 5 provides a comparative analysis of changes in carbon emissions, electricity generation, and energy payback time (EPBT) under different attenuation scenarios. The figure is divided into three panels to examine these interrelationships in detail. (a) Tracks the changes in cumulative carbon emissions over the system’s operational period, confirming a continuous annual increase. Based on this, (b) explores the impact on energy sustainability by plotting EPBT against cumulative emissions, showing a positive correlation where higher emissions correspond to longer payback periods. On the other hand, (c) examines the system’s energy output benefits, indicating an inverse relationship where higher cumulative electricity generation corresponds to shorter EPBT.
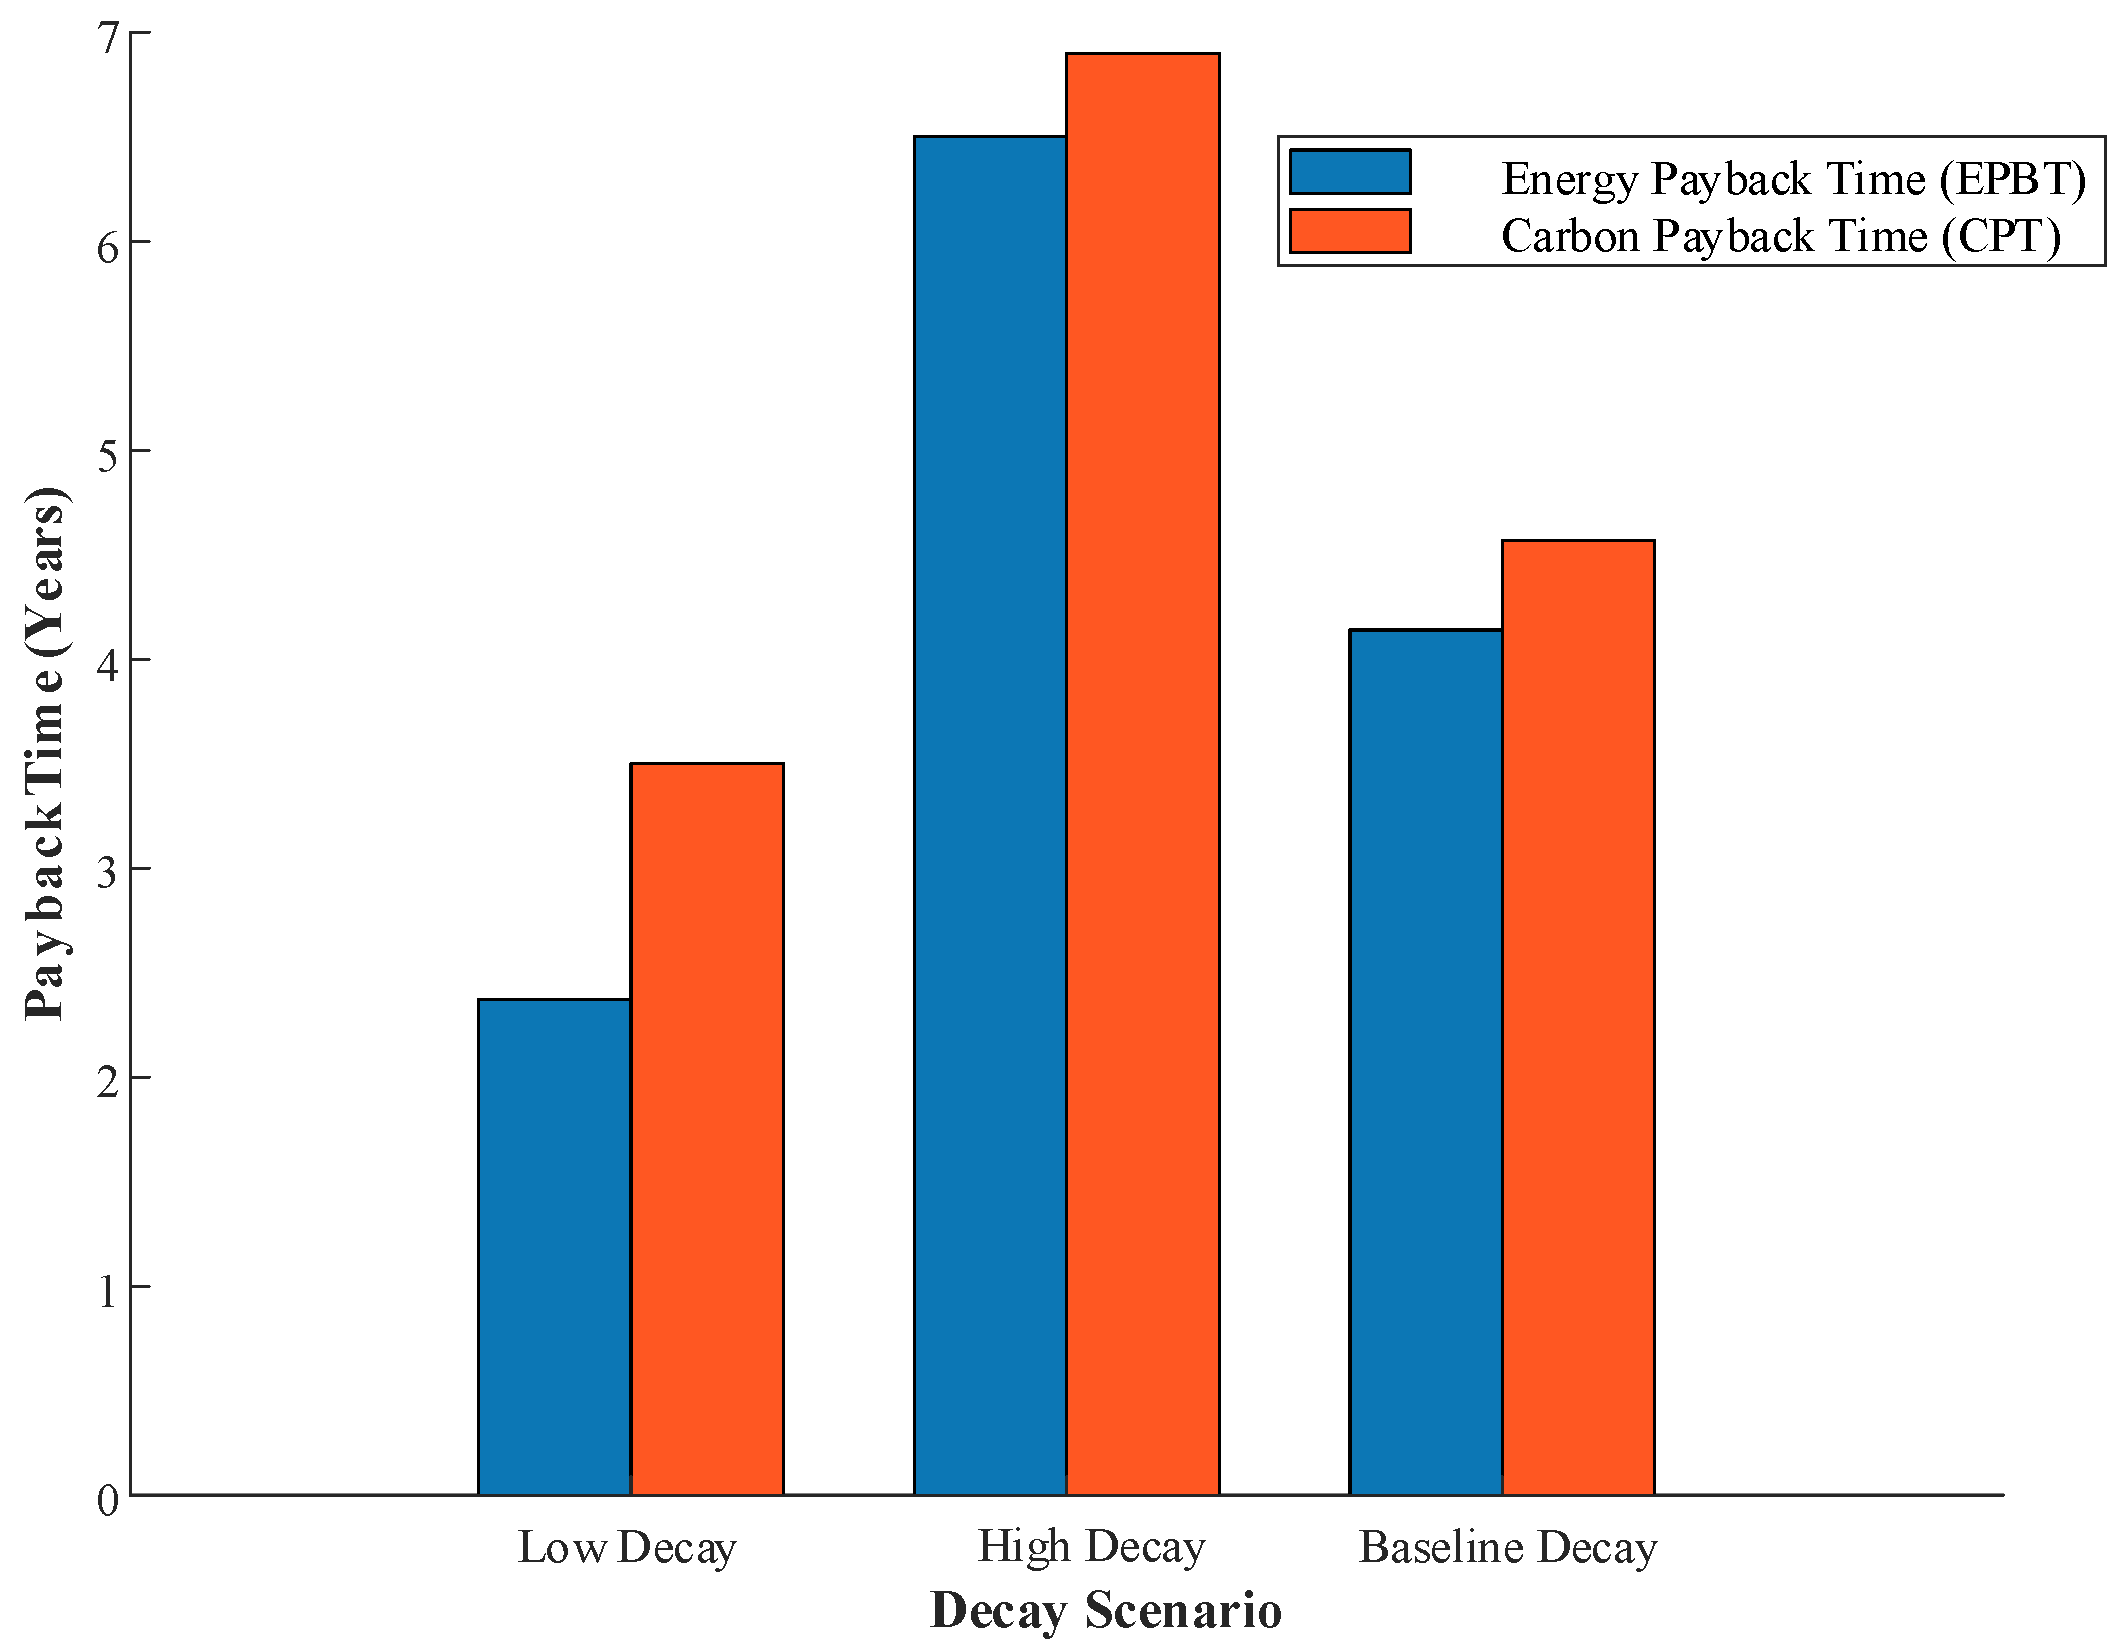
Figure 6 presents a comparative analysis of the Energy Payback Time (EPBT) and Carbon Payback Time (CPT) across different attenuation scenarios. The bar chart clearly distinguishes the EPBT (blue bars) from the CPT (orange bars), visually highlighting the variations in long-term operational performance and the environmental impact of the photovoltaic system under differing attenuation rates.
To validate the model’s accuracy, a comparative analysis was conducted with measured operational data from a 1MWp PV power plant located in Xinjiang. Under the baseline attenuation scenario, the model predicted average annual values of 4.14 years for EPBT and 4.57 years for CPT, showing minor deviations from the actual data. In the high-attenuation scenario, the predicted EPBT and CPT were 6.5 years and 6.9 years, respectively, aligning with observations of accelerated equipment performance loss. For the low-attenuation scenario, the model outputs of 2.37 years for EPBT and 3.5 years for CPT were consistent with the measured values. Furthermore, the model’s validity was corroborated through comparisons with measurement data from other PV power plant cases.
Table 4 presents a comparative analysis between the model predictions and actual measured data, with all values expressed in years. An uncertainty and error analysis was conducted using Monte Carlo simulation, which demonstrated that the model performs reliably and remains stable within a reasonable parameter range. Overall, the model demonstrates an ability to accurately forecast carbon emissions and energy payback time across various attenuation scenarios. These findings provide a robust scientific basis for evaluating the environmental performance of photovoltaic systems.
However, our main analysis focuses on grid issues in large photovoltaic power stations managed by a single operator. With the rise in distributed photovoltaic systems, especially in cases where multiple private users are connected to the grid, the complexity of grid management increases significantly. In this context, due to the involvement of multiple regulatory agencies and circuit breakers, the coordination and stability of the grid may be affected, increasing the risk of grid instability or failure. Therefore, higher requirements are proposed for the management of distributed photovoltaic systems and the optimization of stability. This study will prioritize this issue for future research to further explore how to develop effective grid management strategies in situations involving multiple users or organizations while ensuring grid stability, particularly in scenarios with high photovoltaic generation usage.
7. Conclusions
This work is based on a three-dimensional coupled model of carbon emissions, power generation, and the energy recovery period (EPBT) of the lifetime of photovoltaic systems, and it thoroughly analyzes the environmental performance of solar systems under different attenuation scenarios [
28]. By comparing systems under different attenuation-rate scenarios, we found a significant and proportional relationship between carbon emissions and power generation, and as the operating years of photovoltaic systems extend, carbon emissions increase year by year. Specifically, in low-attenuation scenarios, the power generation of photovoltaic systems increases rapidly, and although carbon emissions also increase accordingly, the increase is relatively small, indicating that the carbon emission growth of the system is relatively flat in low-attenuation scenarios.
The analysis of Energy Recovery Time (EPBT) shows that over time, the energy recovery time of the system gradually decreases, indicating that the photovoltaic system gradually recovers the energy consumed in its production process. Based on an in-depth study of performance differences under different degradation scenarios, it can be concluded that in high-degradation scenarios, photovoltaic systems have higher carbon emissions and extend the energy payback period over a longer lifecycle, whereas in low-degradation scenarios, the energy payback period of photovoltaic systems is shorter, which has certain advantages for achieving rapid energy recovery.
The dynamic coupling model proposed in this study is both related to and different from the standard LCA framework advocated by IEA PVPS Task 12 in terms of methodology. The difference lies in the dynamic- and net-value transformations of system boundaries: this model takes into account the performance degradation of photovoltaic systems and the net environmental benefits of the recovery stage, while the framework of IEA PVPS Task 12 focuses on providing a static and averaged lifecycle inventory and impact assessment factors. This study presents, for the first time, a three-dimensional dynamic coupling and visualization analysis of carbon emissions, power generation, and energy recovery period, rather than focusing on a single carbon footprint or energy recovery period indication. This “dynamic coupling” perspective effectively compensates for the shortcomings of existing standardized static evaluation methods.
The empirical analysis and specific numerical conclusions of this study are based on the parameter settings in the Xinjiang region, reflecting systematic performance under specific high-radiation and continental-climate conditions. To apply the model to different regions, it is necessary to input local climate, power grid, and supply chain data. Future studies will focus on collecting data from multiple regions, applying this framework to cross-regional comparative studies, and further validating and demonstrating the model’s applicability and robustness in various global situations. At the same time, based on this, the dynamic output results of this model will be more systematically integrated and compared with the regional benchmark data published by IEA PVPS Task 12 to further verify and enhance the universality and value of this model in practical applications, thus providing broader decision support for the global low-carbon layout of photovoltaic systems.