Article

Feature-Driven Distributionally Robust Optimization for Sustainable Emergency Response Under Uncertainty: A Relief Network Design Perspective

1
School of Management Engineering, Qingdao University of Technology, Qingdao 266520, China
2
School of Public Affairs, University of Science and Technology of China, Hefei 230026, China
*
Author to whom correspondence should be addressed.
Sustainability 2026, 18(2), 871; https://doi.org/10.3390/su18020871
Submission received: 17 December 2025 / Revised: 12 January 2026 / Accepted: 13 January 2026 / Published: 15 January 2026

Abstract

Against the backdrop of the suddenness and inherent uncertainty of emergencies, pre-disaster emergency facility location and emergency relief stockpiling are critical for improving the efficiency and sustainability of emergency response. This paper focuses on the emergency response network design problem considering uncertain transportation time and emergency demands. We cluster historical disaster events and extract cluster-specific statistical features, such as the average value, mean absolute deviation, and probabilistic statistical distance of uncertain parameters, constructing an ambiguity set based on the disaster feature and multivariate probability distribution information. Then, to minimize the total rescue cost, a feature-driven two-stage distributionally robust optimization model is formulated to determine reliable pre-disaster emergency facility locations, inventory decisions, and post-disaster resource allocation strategies. Finally, through an earthquake case in Sichuan Province of China, this work verifies that incorporating disaster clustering information enables a superior trade-off between the robustness and conservatism of emergency rescue decisions. Compared with the benchmark model, the proposed method displays better out-of-sample performance and can effectively enhance the sustainability of emergency response in uncertain environments.

1. Introduction

Recently, sudden large-scale disasters have posed a significant threat to lives and property [1]. For instance, in 2010, the 7.1-magnitude earthquake that struck Yushu County, Qinghai Province, resulted in 2698 fatalities, 270 missing persons, and over 240,000 affected individuals. The 7.0 magnitude earthquake in Ya’an in 2013 claimed 196 lives, injured over 10,000 people, affected 383,000 people, and caused economic loss estimated at 85.171 billion yuan. Therefore, critical objectives in emergency management currently include ensuring the speed of post-disaster emergency response, guaranteeing the reliability and sustainability of emergency rescue, and alleviating the suffering of disaster victims [2].
In emergency management, 80% of the work involves logistic activities [3]. An efficient emergency planning network is essential for expediting relief supply delivery and minimizing response times following a sudden-onset disaster. As a crucial link in post-disaster rescue, emergency logistic networks help ensure the safety of disaster victims and meet the demand for emergency supplies [4]. In addition, scholars have recently conducted research on the design and optimization of emergency logistic networks, focusing on the pre-disaster location problem of emergency facilities [5]. This problem was extended to the joint optimization of the stochastic casualty collection point location and resource allocation [6] and to the joint optimization of the emergency facility location and decisions on emergency resource allocation and transportation [7].
Deterministic emergency response decisions often turn inefficient or infeasible post-disaster due to inherent disaster uncertainty. Incorporating uncertainty into decision-making significantly enhances the feasibility of post-disaster strategies, thereby boosting emergency response sustainability. However, one challenge in optimizing emergency logistic networks is the uncertainty in decision-making [8]. The unpredictability of disasters and the scarcity of relevant historical data make it difficult to estimate the emergency needs of disaster victims and the required time to transport relief resources. In existing research, common approaches to handling uncertainty include stochastic optimization (SO) [9] and robust optimization (RO). Typically, SO assumes that the probability distributions of random variables are known, but this assumption is difficult to satisfy in emergency decision-making [10,11]. When formulating decisions under the worst-case condition within the established uncertainty set, RO tends to yield overly conservative decisions [12]. When information related to uncertain parameters is scarce, and their probability distributions are unknown, the distributionally robust optimization (DRO) method can formulate decisions by constructing an ambiguity set containing distributional information and considering the influence of the worst-case distribution within it. This method has been increasingly applied in emergency management in recent years [13].
The DRO method constructs ambiguity sets based on the available information to characterize the probability distribution of uncertain parameters. Standard methods include building the ambiguity set using moment information and statistical distance information [14]. Recent studies have demonstrated that incorporating multivariate probability distribution information can significantly enhance the ability of ambiguity sets to capture the probabilistic characteristics of random parameters [15]. Some scholars have constructed ambiguity sets using joint moment information, the Wasserstein distance [16], and first- and second-order moment information [17], but these approaches may increase the complexity of the DRO model.
In practice, random parameters, such as emergency demand and transportation time, are often influenced by external factors or side information, such as the disaster severity in affected areas. For instance, under more severe disaster conditions, the emergency demand and post-disaster resource transportation time increase markedly, affecting emergency response decisions. Therefore, in the design of emergency response networks, the clustering information can significantly enhance the ability of the model to characterize the uncertain demand and transportation time. Recently, scholars have begun to focus on the influence of disaster characteristics on uncertainty distributions. By employing historical data features to segment scenarios, some scholars constructed DRO models. For instance, Ref. [14] developed an ambiguity set integrating wind-speed observation data, based on wind-speed clustering information, to characterize the uncertain flight time of uncrewed aerial vehicles. Given patient characteristics, Ref. [18] constructed an ambiguity set based on clustering information and investigated the operating room scheduling problem under uncertain surgery durations. Ref. [19] developed a scenario-based uncertainty set to inform procurement decisions, given variations in the probability distributions of uncertain demand across scenarios. Ref. [20] proposed a data-driven hybrid scenario-based RO method. By clustering the locations of victims and their corresponding injury severity, the method comprehensively considers multiple uncertainties and constructs an emergency medical network design model. The ambiguity set based on clustering information is easy to handle and can mitigate the risk of overfitting to empirical distributions.
Overall, numerous scholars have investigated the optimization of emergency logistic networks, but significant room for further research remains. First, most studies in emergency management focus on addressing uncertain parameters using the SO and RO approaches, whereas studies employing DRO methods to formulate emergency response decisions under the uncertainty remain scarce. Moreover, the proposed DRO models are often constructed based on singular information sources (e.g., moment information or probabilistic statistical distance), which do not fully apply the probability distribution information in finite data. Second, given that various factors, such as the severity of disasters and the number of affected individuals, significantly influence the probability distributions of random parameters, the DRO method, which constructs ambiguity sets via disaster event clustering information, warrants further research.
In summary, this paper aims to establish a feature-driven ambiguity set and apply the DRO method to investigate the emergency logistic network design problem. First, historical disaster events are clustered to extract multivariate probability distribution information, including the first-order moment, mean absolute deviation (MAD), and Wasserstein distance for uncertain parameters. Based on this approach, an ambiguity set is established to characterize the uncertainty in transportation time and demand for emergency supplies. This work formulates a two-stage DRO model to determine the facility location, inventory prepositioning, and resource allocation decisions under uncertainty. This method can ensure the rational allocation of emergency supplies while minimizing the redundant waste of limited emergency resources, enhancing the sustainability of emergency response. This model strengthens the long-term adaptive resilience of emergency logistic networks across diverse disaster scenarios, providing robust support for the sustainable operation of emergency response systems. The primary contributions of this paper are as follows.
1.
This work develops a feature-driven DRO model for an emergency logistic network design. In contrast to the existing literature, this paper considers the characteristics of historical disaster events. Clustering these disaster events enables the extraction of distinctive information concerning uncertain parameters across disaster clusters. This approach enhances the capacity of the model to capture uncertainty features in complex disaster scenarios, improving the practical applicability and robustness of decision-making solutions.
2.
To address the deficiency of conventional methods dependent on single-type probability distributions, this paper proposes a novel ambiguity set construction strategy that integrates multivariate distributional information (mean, MAD, and probabilistic distance) within each scenario. This approach significantly improves the accuracy of characterizing random parameter distributions, which in turn facilitates more robust optimization decisions for emergency response network design and bolsters the sustainability of emergency response capabilities.
3.
This work presents a real-world case study and demonstrates the superiority of the proposed scenario-wise DRO model through comparisons with alternative models. Furthermore, this work comprehensively examines the stability and applicability of the model via a parameter sensitivity analysis. Compared to traditional methods, the introduced optimization framework more efficiently integrates data-driven decision-making with theoretical models, offering novel insight and methods for optimizing emergency logistic networks.

2. Problem Description and Research Method

2.1. Problem Description

The emergency logistics network can be abstracted as a directed graph G = ( I , J ) , where node i ∈ [ I ] represents the location of a candidate emergency facility, and node j ∈ [ J ] denotes a disaster point. Before a disaster occurs, decision-makers must ascertain whether to establish an emergency facility at location i ∈ I , incurring a fixed cost f i (e.g., when x i = 1 ), and determine the initial inventory level r i at the operational emergency facility with an associated unit procurement cost o. Given the uncertain emergency demands and transportation times from an emergency facility to various demand points, this study employs ambiguity sets that incorporate multivariate probability distributions to characterize these probabilities. The research addresses fundamental questions: (1) Which candidate emergency facilities should be opened before a disaster occurs? (2) What quantity of emergency supplies should be stored in these open emergency facilities? (3) What is the post-disaster allocation plan for distributing emergency resources from distribution centers to demand points? In light of this framework, the optimization objective of this study is to minimize the fixed costs for opening emergency facilities, the procurement costs for emergency resources, the time costs for transporting emergency supplies after the disaster, and the penalty costs for shortages of emergency supplies.
This paper considers two uncertain factors in the context of emergency response: the demand volume d ˜ j at demand point j ∈ [ J ] and the stochastic transportation time t ˜ i j from facility i ∈ [ I ] to demand point j ∈ [ J ] . Based on varying levels of disaster severity, relevant distribution-related information is extracted to establish scenario-based ambiguity sets. Uncertain transportation time is affected by road traffic conditions under various disaster scenarios; hence, its central tendency, volatility, and inter-scenario distributional difference can be characterized. In reality, the regular transportation time between nodes is supported by a relatively large number of samples, enabling this measure to reflect statistical characteristics under various disaster scenarios from multiple perspectives. Therefore, probability distribution information, such as the mean, MAD, and Wasserstein distance, of transportation times across disaster scenarios can be employed to characterize their uncertainty. The core of characterizing the demand for emergency supplies lies in the degree of supply-demand matching, where it is necessary to focus on characterizing the basic demand, degree of volatility, and value boundary. Given various factors, such as the number of affected people under different disaster scenarios, the ambiguity set can be constructed using the mean, MAD, and support set of the demand based on limited historical disaster statistical data.
Under each disaster scenario, this work characterizes the uncertainty of the transportation time and emergency demands based on the mentioned statistical information. Table 1 summarizes the notation for the model construction.

2.2. Scenario-Based DRO Model for Emergency Response

Based on the constructed ambiguity set, the two-stage scenario-based DRO model (S-DRO) for emergency logistics network design is established as follows:
m i n x , r ∑ i ∈ [ I ] f i x i + o r i + s u p P t ∈ F t , P d ∈ F d E P h x , r , t ˜ , d ˜ , s ˜
s . t . r i ⩽ c i x i , ∀ i ∈ [ I ]
x i ∈ 0 , 1 , r i ⩾ 0 , ∀ i ∈ [ I ] ,
where objective Function (1a) represents minimizing the total rescue cost, including the construction cost of emergency facilities, the procurement cost of pre-positioned emergency inventory, and the expected response cost of the second-stage under the worst-case distribution. Here, P t , P d denotes the expectations of uncertain transportation time and emergency demand under the worst-case probability distribution within ambiguity sets F t and F d , respectively. Constraint (1b) ensures that the procured inventory at any opened facility does not exceed its capacity. Constraint (1c) defines the domain of the decision variables. The second term in Function (1a) represents expectation of the second-stage relief cost under the worst-case distribution. The term h x , r , t ˜ , d ˜ , s ˜ can be represented as follows:
h x , r , t ˜ , d ˜ , s ˜ = min y , u ∑ i ∈ I ∑ j ∈ J m t ˜ i j y i j + ∑ j ∈ J b u j
s . t . ∑ i ∈ I y i j + u j ⩾ d ˜ j , ∀ j ∈ [ J ] ,
∑ j ∈ J y i j ⩽ r i , ∀ i ∈ [ I ] ,
y i j ⩾ 0 , ∀ i ∈ I , j ∈ J .
The second-stage objective Function (2a) minimizes the post-disaster emergency resource transportation cost and the shortage penalty cost. Constraint (2b) ensures flow balance at disaster point j ∈ [ J ] among the emergency demands. Constraint (2c) specifies that the total emergency resource allocated from any opened emergency facility must not exceed its prepositioned inventory level. Constraint (2d) defines the domain of the decision variables.
We cluster historical disaster events based on the degree of impact on uncertainty, dividing them into S scenarios, and estimate the probability distribution of uncertain parameters in each scenario. Let P ( s ˜ ∈ s ) = p s denote the probability that a disaster event occurs in a given scenario ( ∑ s ∈ [ S ] p s = 1 ). In each scenario s, by extracting information of the mean value μ s , the MAD value σ s , and Wasserstein distance d W from the historical data of transportation time, a feature-driven ambiguity set for post-disaster uncertain transportation time can be constructed as follows:
F t = P t ∈ P ( W s t ) E P t t ˜ s ˜ ∈ s = μ s , ∀ s ∈ S E P t z ˜ s ˜ ∈ s ⩽ σ s , ∀ s ∈ S ∑ s ∈ S p s d W P s t , P ^ s t ⩽ θ P t t ˜ , z ˜ ∈ W s t s ˜ ∈ s = 1 , ∀ s ∈ S P t s ˜ ∈ s = p s , ∀ s ∈ S .
Let d W ( P t , P ^ t ) : = i n f E Q t ˜ − ξ ˜ Π t ˜ Q = P t Π ξ ˜ Q = P ^ t denote the Wasserstein distance between the true probability distribution and the empirical distribution of transportation time, and define its upper bound θ can be adjusted by decision-makers. Here, Π t ˜ Q and Π ξ ˜ Q are the marginal distributions of the joint distribution Q with respect to t ˜ and ξ ˜ , respectively. Given | N | historical transportation time records ξ ^ n , the empirical distribution can be estimated as P t [ ξ ˜ = ξ ^ n ] = 1 N . The support set of the uncertain transportation time is defined as W s t = ( t ˜ , z ˜ ) t ˜ ∈ t ̲ , t ¯ , t ˜ − μ ⩽ z ˜ , ∀ i ∈ [ I ] , j ∈ J . The ambiguity set F t contains those distributions that satisfy additional constraints in the defined support set W s t , which makes the probability distribution P t to take values within the bounds. The support of the random variable t ˜ is scenario-dependent, varying with different disaster events. The support set can help decision-makers to eliminate the unrealistic distributions from the ambiguity set.
On the other hand, based on historical data related to post-disaster emergency resource demand, the ambiguity set for uncertain emergency demand is constructed as follows:
F d = P d ∈ P ( W s d ) E P d d ˜ s ˜ ∈ s = μ s d , ∀ s ∈ S E P d v ˜ s ˜ ∈ s ⩽ σ s d , ∀ s ∈ S P d d ˜ ∈ W s d s ˜ ∈ s = 1 , ∀ s ∈ S P d s ˜ ∈ s = p s , ∀ s ∈ S ,
where W s d = ( d ˜ , v ˜ ) d ˜ − μ d ⩽ v ˜ , ∀ j ∈ J is the support set. Parameters μ s d and σ s d denotes the mean value and the MAD value of uncertain emergency demands under each disaster scenario s ∈ S . The probability that a disaster event occurs in a given scenario as P ( s ˜ ∈ S ) = p s and ∑ s ∈ [ S ] p s = 1 .

2.3. Model Transformation

Since the max-min form of the objective function in the S-DRO model renders the problem computationally intractable, we reformulate the original model into a tractable form via the following proposition.
Proposition 1.
The objective function of the S-DRO model for the second stage can be transformed into the following equivalent form:
min λ θ + ∑ s ∈ S ∑ i ∈ I ∑ j ∈ J μ i j s α i j s + σ i j s β i j s + ∑ n ∈ N s η s n N s + ∑ j ∈ J ∑ s ∈ S b u j s s . t . ∑ j ∈ J y i j s ⩽ r i , ∀ i ∈ I , s ∈ [ S ]
η s n ⩾ p s m y i j s − α i j s + π s n T t ^ i j s n , ∀ i ∈ I , j ∈ J , s ∈ S , n ∈ N s
p s m y i j s − α i j s + π s n ⩽ λ p s , ∀ i ∈ I , j ∈ J , s ∈ [ S ] , n ∈ [ N s ]
− p s m y i j s + α i j s − π s n ⩽ λ p s , ∀ i ∈ I , j ∈ J , s ∈ [ S ] , n ∈ [ N s ]
∑ i ∈ I y i j s + u j s ⩾ d ¯ j s , ∀ j ∈ J , s ∈ [ S ]
λ , β i j s , π s n ⩾ 0 , ∀ i ∈ I , j ∈ J , s ∈ S , n ∈ N s
y i j s ⩾ 0 , ∀ i ∈ I , j ∈ J , s ∈ [ S ]
where α i j s , β i j s , η s n , π s n are the dual variables introduced during the model transformation process.
Proof. 
See Appendix A. □
By integrating the first-stage objective function and constraints of the S-DRO model, the final formulation is obtained as follows:
min ∑ i ∈ I f i x i + o r i + λ θ + ∑ s ∈ S ∑ i ∈ I ∑ j ∈ J μ i j s α i j s + σ i j s β i j s + ∑ n ∈ N s η s n N s + ∑ j ∈ J b u j s
s.t. (1b)–(1c), (5b)–(5g).
This transformed model is a linear programming problem that can be directly solved by standard optimization solvers. We will subsequently validate the effectiveness of the proposed ERN optimization method through case studies.
The reformulated model is a mixed-integer linear programming (MILP) problem; while the model involves a relatively large number of variables, modern commercial solvers (e.g., Gurobi) can efficiently solve the model by using the branch-and-bound method. At the same time, we also set the parameters such as the pre-processing intensity, threads, heuristic search ratio, and cutting plane strength to accelerate the solution process—that enable efficient solution of large-scale problems within acceptable time. In line with this, we directly solved the transformed model using a commercial solver, and we have supplemented a detailed description of the solution methodology at the beginning of the case study section to ensure the transparency and reproducibility of our computational process.

3. Numerical Experiments

3.1. Parameter Settings and Data Sources

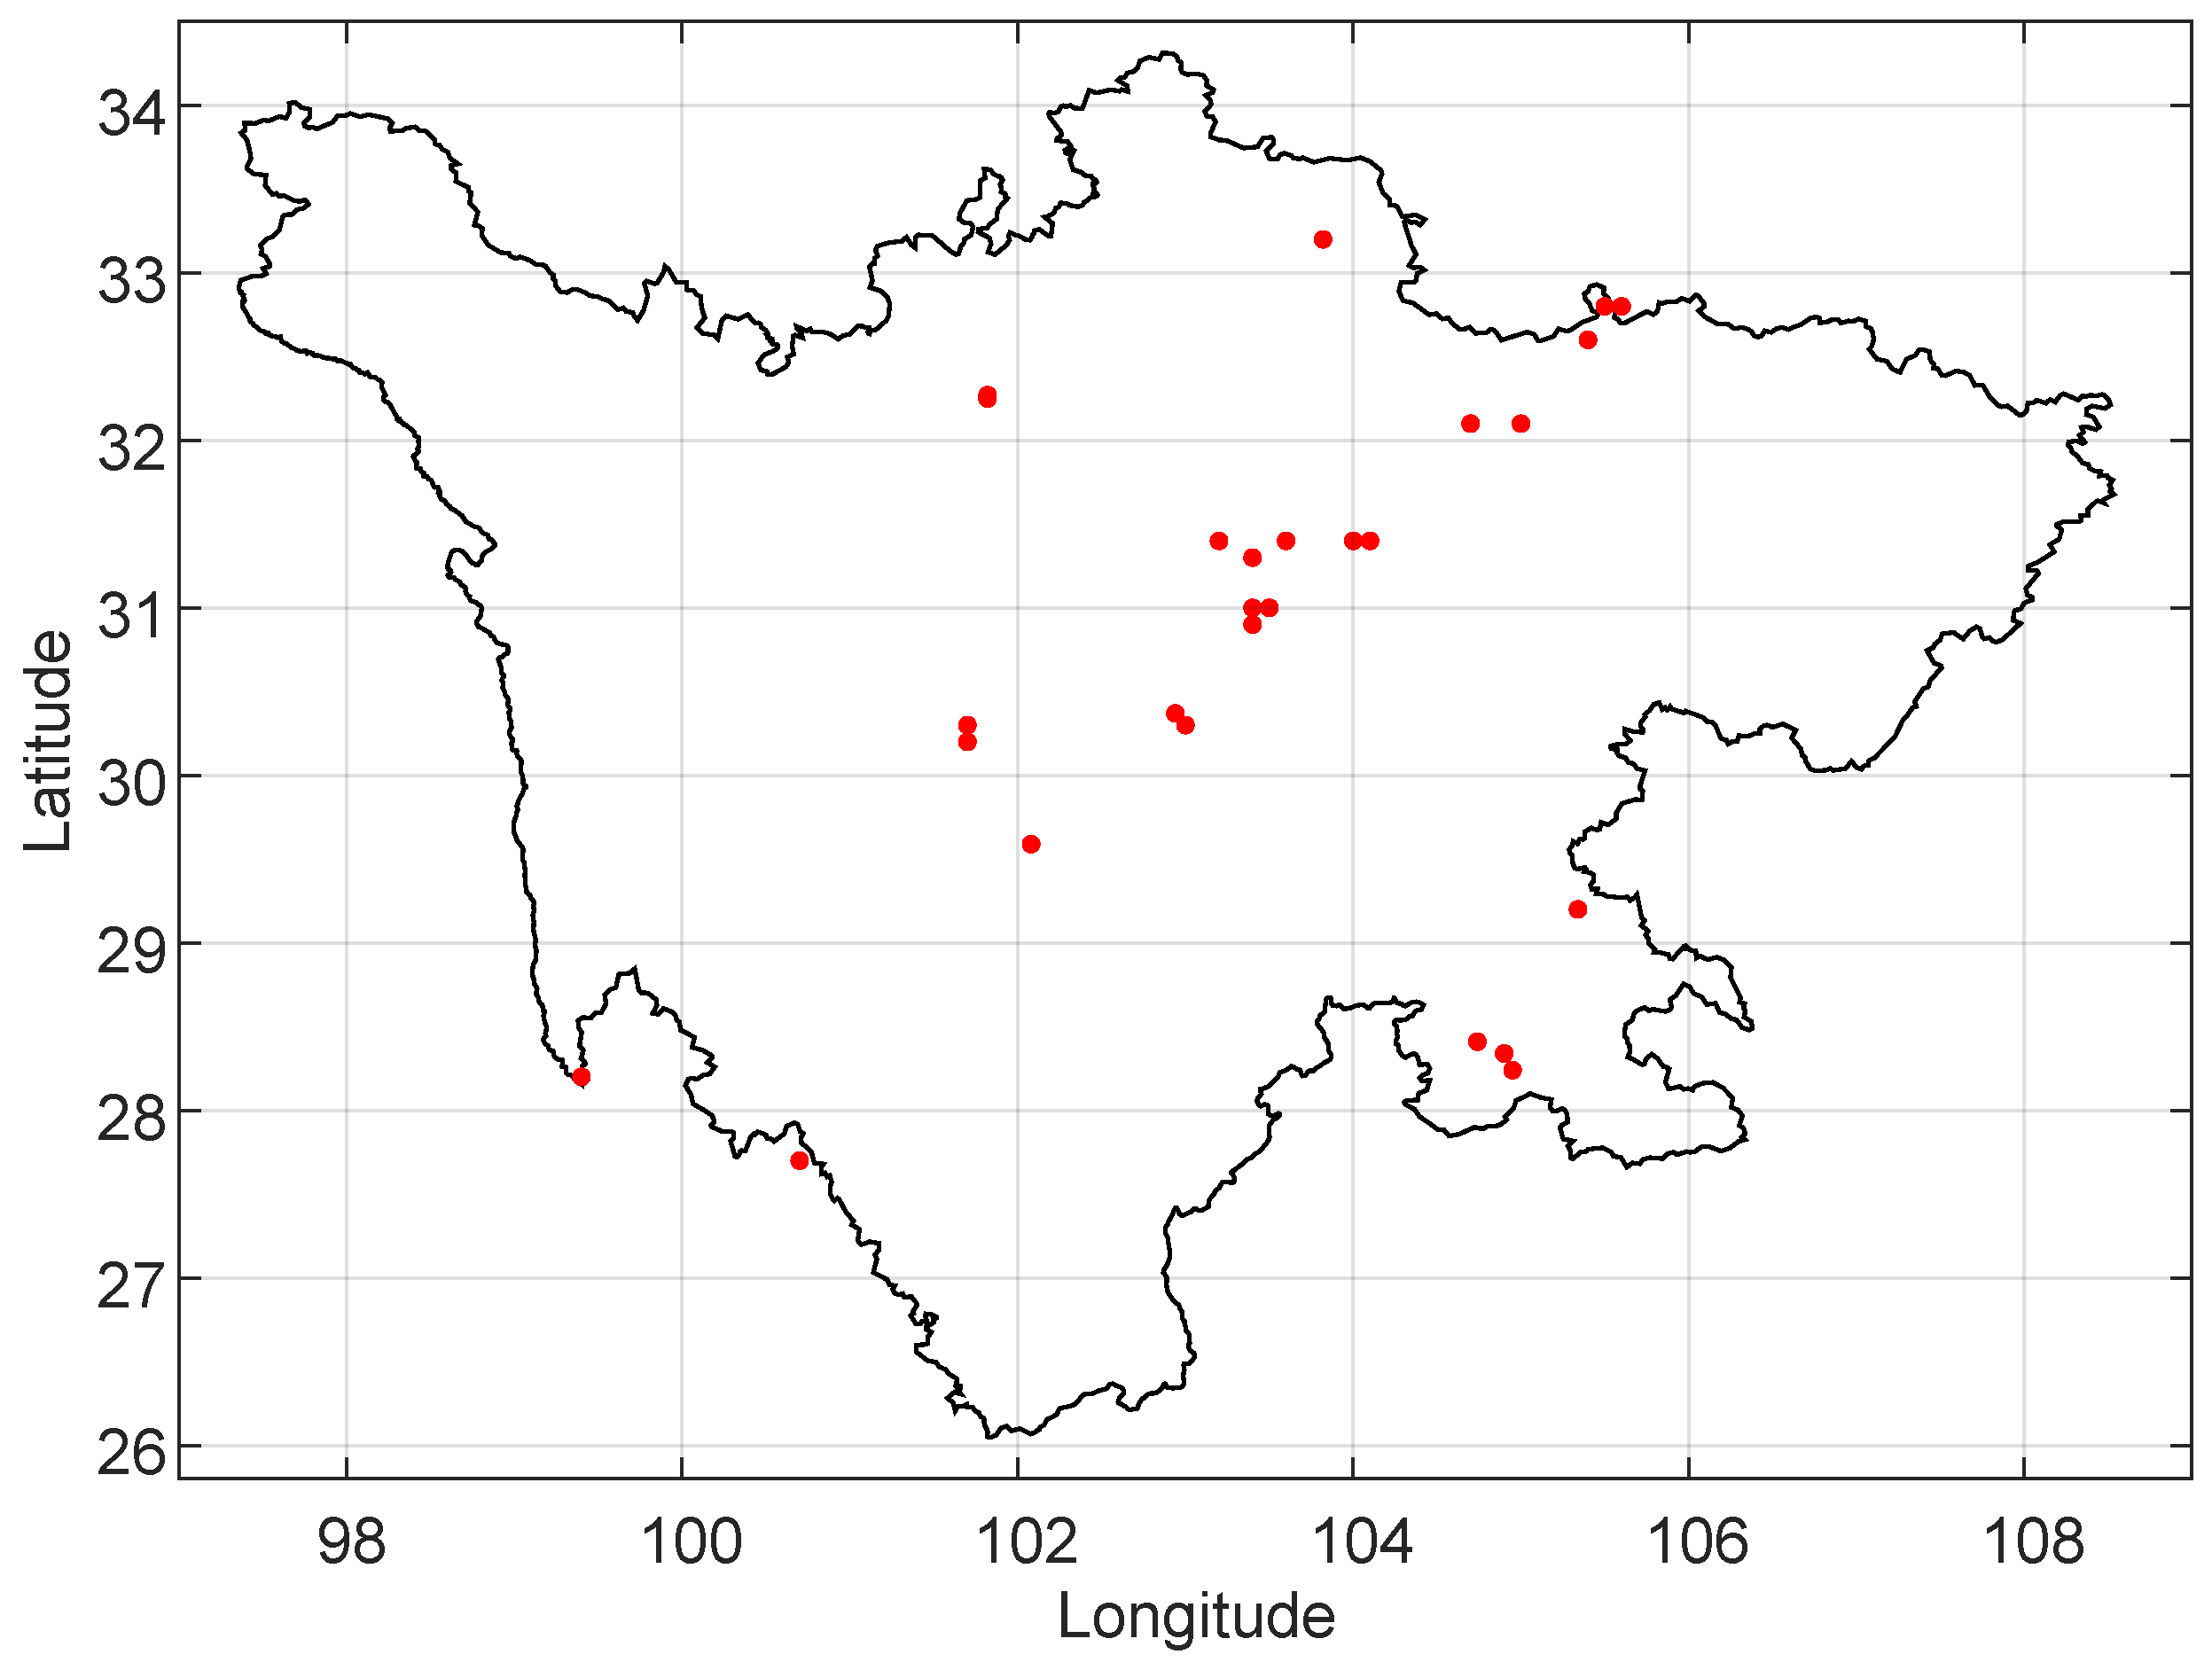
Sichuan Province of China is located in a region with relatively high frequency of seismic hazards. We obtained the historical disaster records such as the number of affected people from China Earthquake Administration (https://www.cea.gov.cn/) and the National Bureau of Statistics of China (https://www.stats.gov.cn/). Based on information such as the location of historical seismic hazard events in Sichuan Province and the number of casualties, the locations of these disaster points are shown in Figure 1.
According to the method mentioned in [10], we cluster the disaster events based on the number of affected people. Earthquakes with a magnitude below 5.0 are highly prevalent in seismically active regions such as Sichuan. In the vast majority of cases, they only induce seismic shaking or cause minor cracks in a small number of aging buildings, and generally do not trigger large-scale government emergency responses or result in systematic economic losses (Post-earthquake field works-Part 3: Code for field survey. https://openstd.samr.gov.cn/bzgk/gb/newGbInfo?hcno=B9CF76DB4D7C392F882D6EBC417284B8, accessed on 12 January 2026). Considering that earthquake events that have a significant impact on infrastructure and the social economy usually start at a magnitude of 5.0 or above [21], and based on the relevant historical disaster records and studies, this magnitude is taken as the starting point for systematic analysis.
All computations were performed using MATLAB R2019b and Gurobi on a PC with a 2.5 GHz CPU and 8GB of RAM. The numerical solution scheme for the transformed MIP model, including the decision variables and solver-specific parameters, is presented in Table A1. The relevant parameters are set as follows:
1.
Disaster feature-based clustering method: We collected over 45 pieces of historical earthquakes of magnitude 5.0 or greater ( M ≥ 5.0 ) in Sichuan province from 2008 to 2023. We first divide the disaster damage levels into 5 classes corresponding to 5 disaster scenarios according to the number of people affected by disasters (scenario 1: 10–500, scenario 2: 501–5000, scenario 3: 5001–50,000, scenario 4: 50,001–100,000, scenario 5: 100,000+). The probability of occurrence for each scenario p s is estimated based on the percentage of the number of disaster records in the scenario to the total number of disaster records. The initial number of disaster clusters is set to 5, and the impact of varying scenario quantities on decision-making performance will be analyzed in subsequent sections.
2.
Capacity and construction costs of candidate emergency facilities: Based on historical disaster locations, 50 candidate emergency facilities and 28 affected areas were selected in this study. We set the capacities of emergency facilities as varying across different locations. The resources are assumed to have a weight-to-volume ratio of 250 kg/m3 (https://www.thecalculatorsite.com/conversions/weighttovolume.php, accessed on 12 January 2026). Following [22], we set the fixed construction cost for an emergency facility at 870 yuan/m3.
3.
Transportation and procurement costs: Transportation time under disaster levels 1 to 5 were assumed to be U ( 1.0 , 1.1 ) , U ( 1.1 , 1.2 ) , U ( 1.2 , 1.4 ) , U ( 1.4 , 1.6 ) , U ( 1.6 , 2.0 ) times the normal transportation time, respectively. The unit transportation cost was set at 80 CNY per ton per hour (https://auto.hexun.com/2025-03-02/217645335.html, accessed on 12 January 2026). Each affected individual was assumed to receive one unit of emergency item, with a procurement cost of 593 CNY per unit.
4.
Parameters for the ambiguity set: Historical disaster data were obtained from the China Earthquake Administration and the National Bureau of Statistics of China. The average values and mean absolute deviations of the uncertain parameters were derived through statistical analysis. For the transportation time ambiguity set, the Wasserstein distance parameter is defined as θ = ω θ m a x , where θ m a x represents the maximum Wasserstein distance between probability distributions of transportation times: θ max = max s ∑ i , j , n 1 N s t ¯ i j − t ^ i j s n 1 . The value of θ can be adjusted using the factor ω ∈ 0 , 1 .

3.2. Comparative Analysis of Model Solution Results

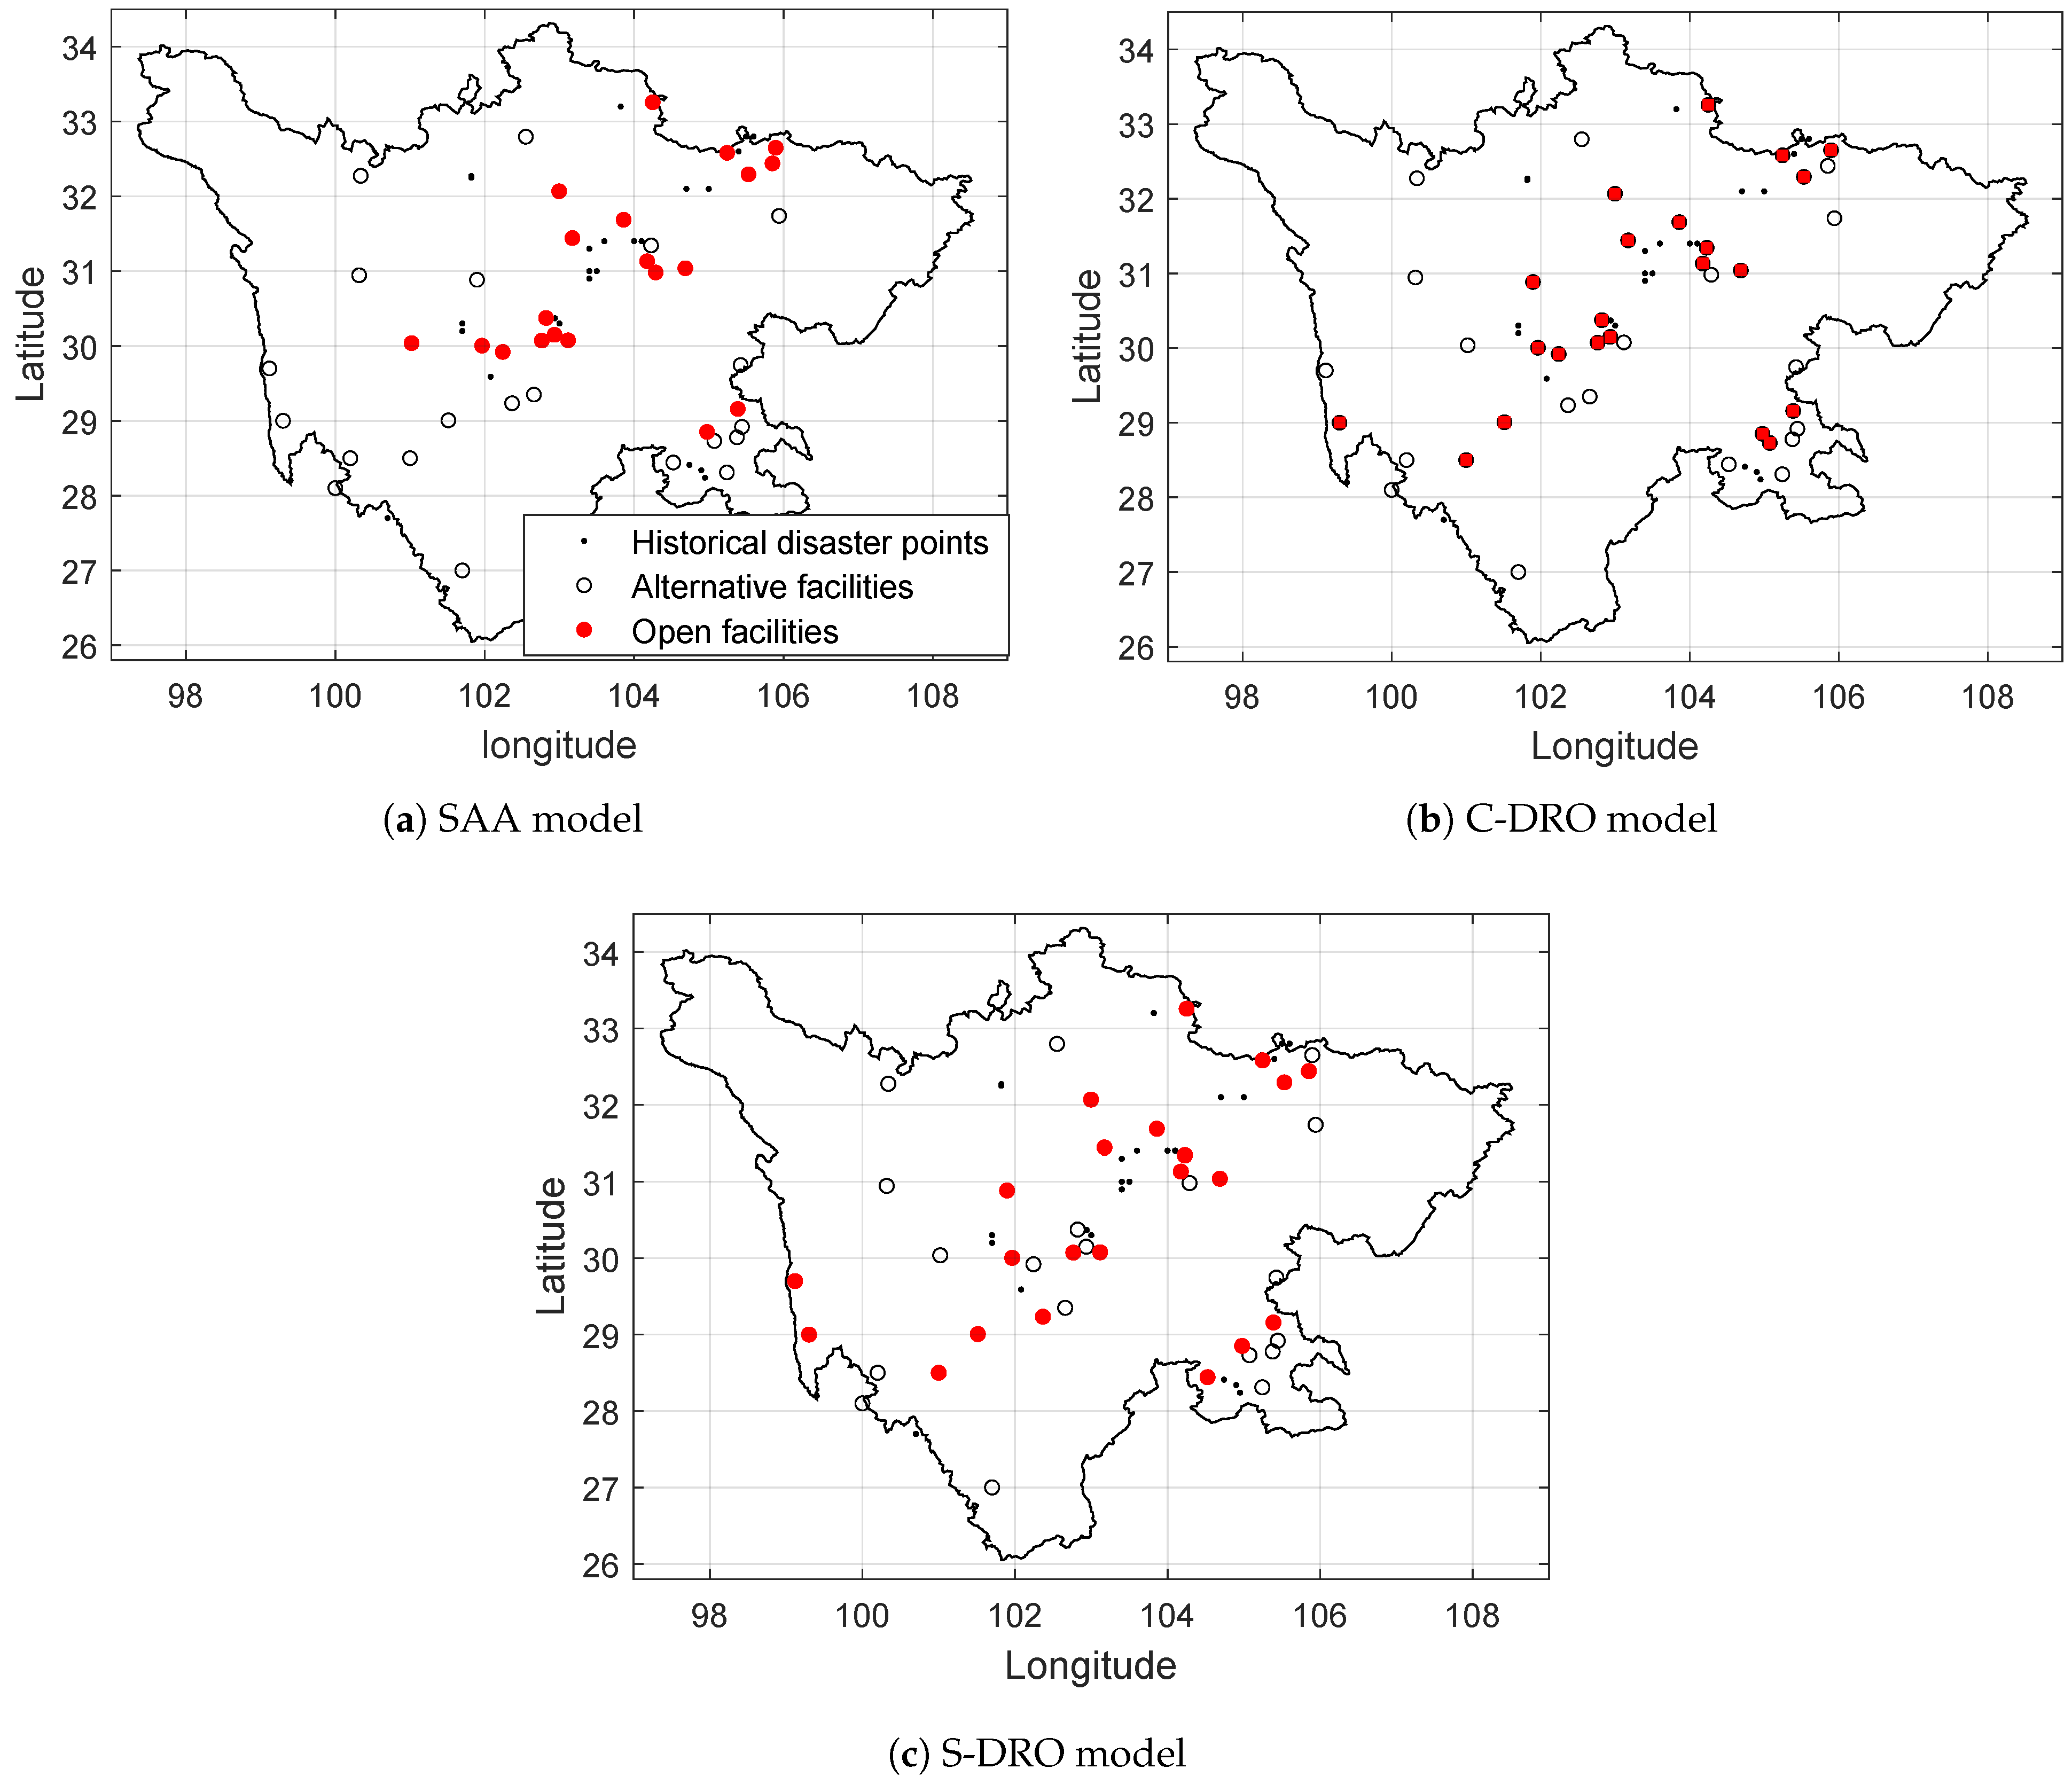
This section presents a comparison of the decisions derived from the proposed disaster-feature-based S-DRO model, the C-DRO model (which omits disaster feature information), and the sample average approximation (SAA) method. The emergency facility location decisions generated by these three models, based on historical data, are illustrated in Figure 2.
The number of open emergency facilities, inventory level and the required first-stage cost by the three models are presented in Table 2.
As shown in Table 2, the SAA model opens the fewest emergency facilities and has the smallest inventory level, leading to a relatively low pre-disaster preparedness cost. This is because the SAA model relies solely on historical data for decision-making, without accounting for uncertainties. Moreover, Figure 2a reveals that the location decisions derived from the SAA model tend to cluster around historical disaster-affected areas. It can be inferred that this approach fails to account for uncertainties associated with potential future disaster locations. Therefore, the reliability of these decisions is significantly undermined in the face of prospective disaster scenarios. The sustainability of the resulting decisions is also limited. The C-DRO model makes decisions based on the worst-case scenario of the probability distribution within the ambiguity set, considering the influence of transportation time and demand uncertainty (Figure 2b). The distribution of open emergency facilities is more widespread, although it opens more emergency facilities and requires a higher budget than the SAA model, it enhances the reliability of the emergency logistic network.
In comparison, Table 2 shows that the S-DRO model achieves robust performance with lower emergency inventory levels and pre-disaster preparation costs. By incorporating more distributional information, the S-DRO model requires fewer facilities to be opened than the C-DRO model when coping with uncertainties. Moreover, its total pre-disaster preparation cost is 1.7 × 10 6 yuan lower than that of the C-DRO model. This model incorporates the clustering characteristics of uncertain transportation times and demand, with the probability of potential disaster events varying across clusters. As demonstrated in Figure 2c, the S-DRO model prioritizes establishing facilities in regions with higher disaster severity and occurrence probability, while considering disaster-affected areas in remote regions. Thus, this method can achieve an optimal trade-off between resilience and prudence in its decision-making strategy.

3.3. Cross-Model Comparative Analysis of Out-of-Sample Performance

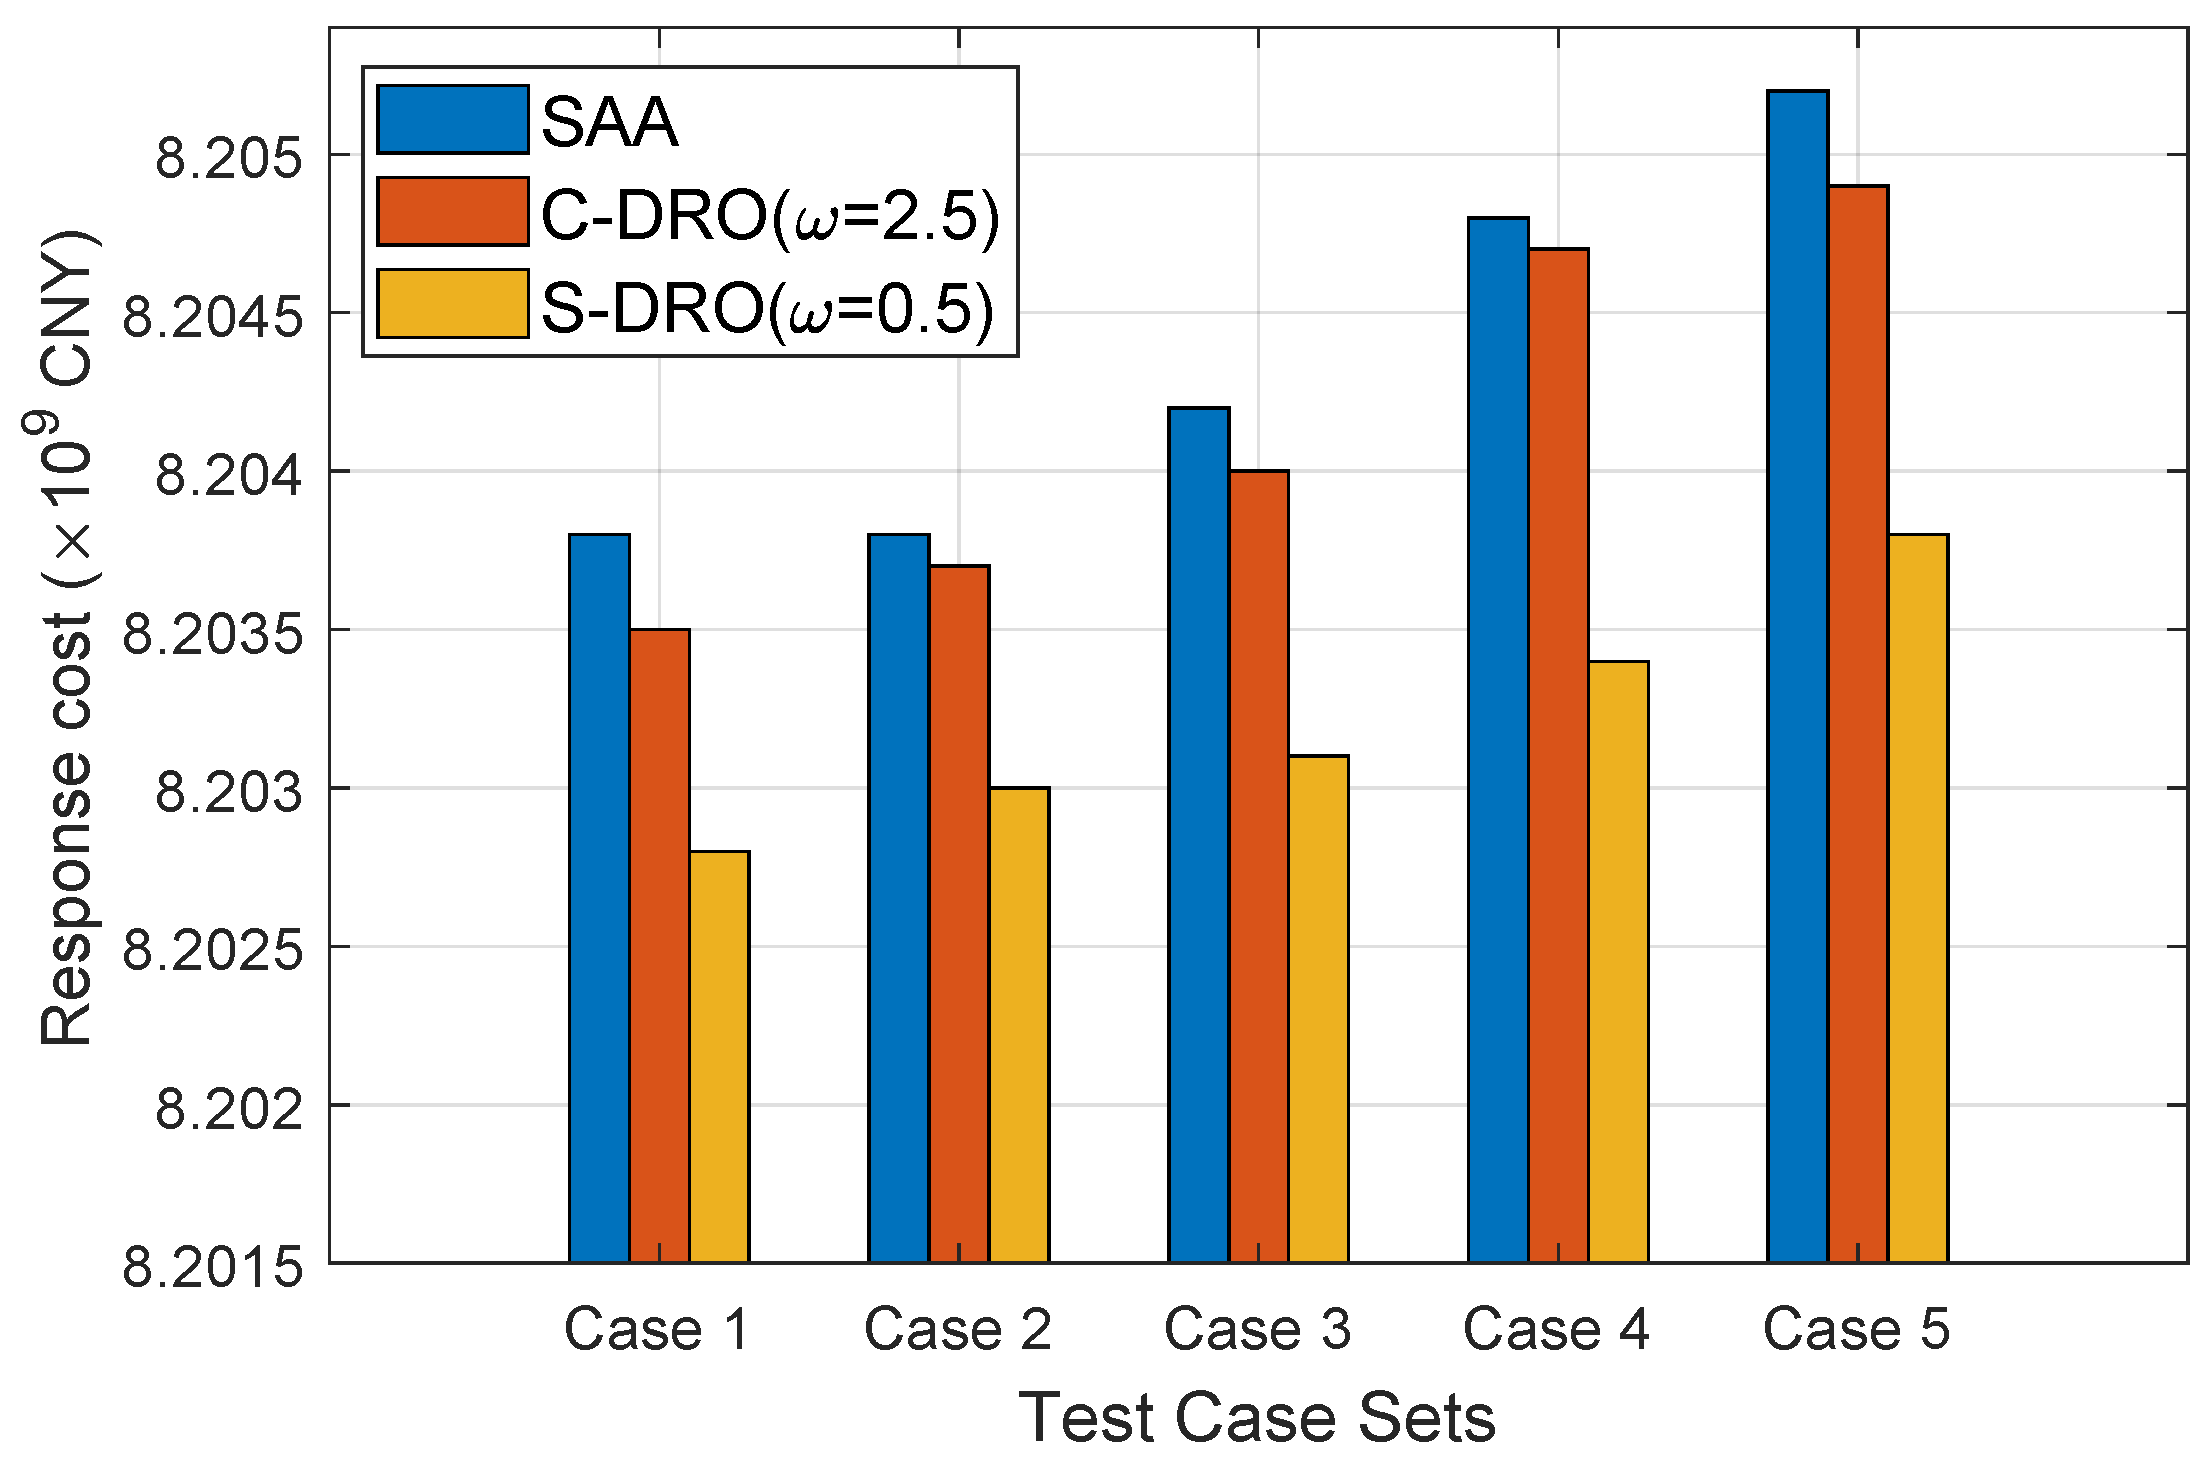
This section evaluates the decisions derived from the three optimization models using out-of-sample test cases with progressively increasing levels of disaster uncertainty. The C-DRO and S-DRO models selected the θ values with the best comprehensive performance (i.e., ω = 2.5 in the C-DRO model and ω = 0.5 in the S-DRO model). Figure 3 presents the total rescue costs for all models under the test cases, where C-DRO and S-DRO apply the ω value with the best average performance under the test case set.
Figure 3 reveals that the SAA model has the worst out-of-sample performance because it only makes decisions based on historical data without considering uncertainty, weakening the reliability and sustainability of the emergency response. In contrast, the C-DRO model considers uncertainty and optimizes the results for the worst-case distribution. However, due to the lack of disaster-specific feature information, C-DRO model tends to produce overly conservative solutions, leading to higher total relief costs. Compared with C-DRO, the proposed S-DRO model integrates clustering information extracted from historical disaster data, enabling a more accurate representation of uncertainty (e.g., the average cost of the S-DRO model is 1 × 10 6 yuan lower than that of the traditional DRO model, and 1.2 × 10 6 yuan lower than that of the SAA model). Overall, the S-DRO model demonstrates better out-of-sample robustness than the benchmark models, enhancing the sustainability of the emergency logistics network in conducting post-disaster emergency responses under uncertainty.

3.4. Influence of Ambiguity Set Parameters on S-DRO Model Performance

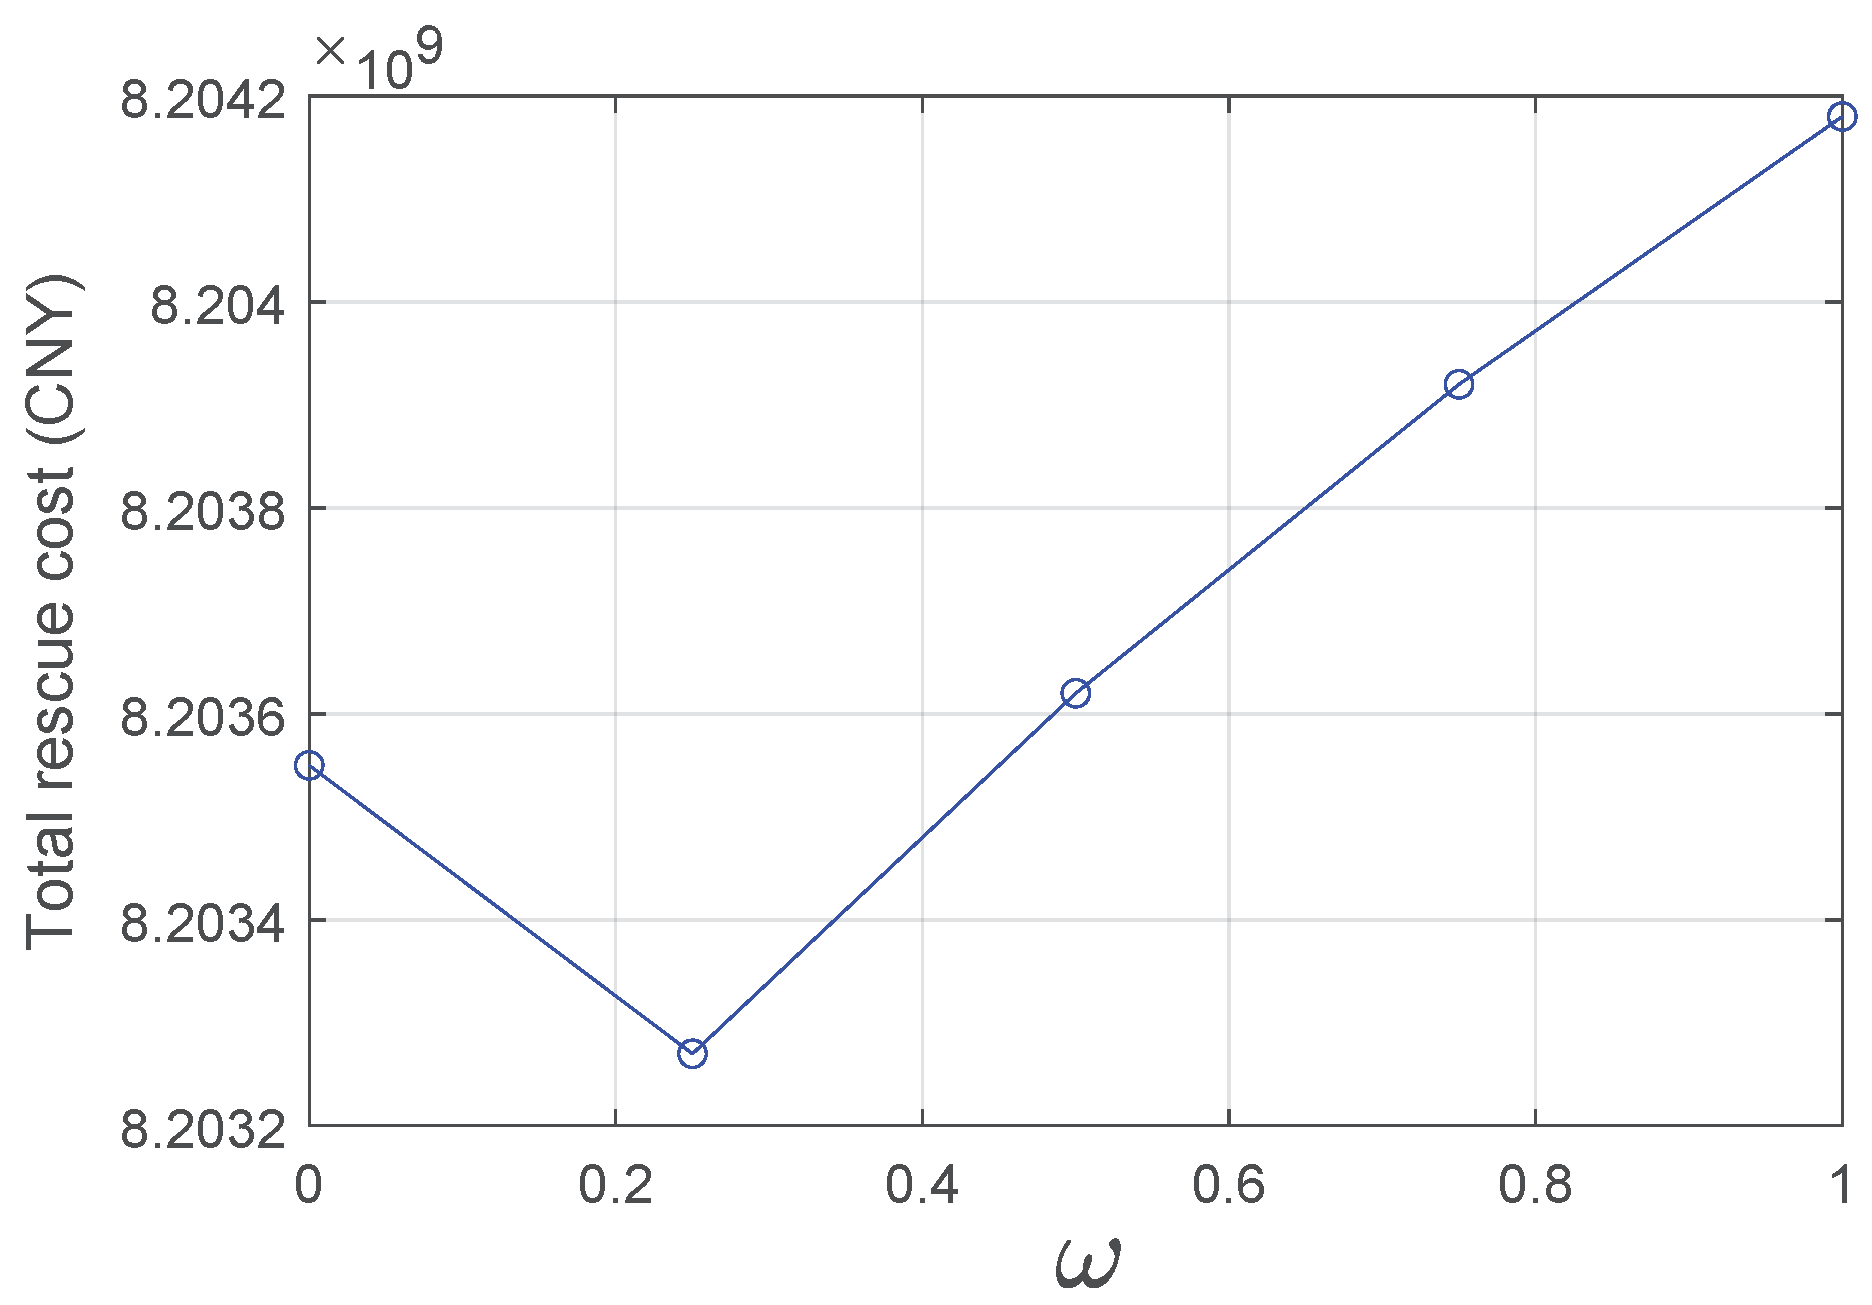
In the S-DRO model, the value of the Wasserstein radius θ influences the performance of the optimization decisions by affecting the size of the distributional ambiguity set. Figure 4 illustrates the out-of-sample performance of the S-DRO model by ω value.
As shown in Figure 4, a smaller θ value corresponds to a tighter ambiguity set, reducing its ability to characterize the probability distributions of uncertain parameters and leading to higher total relief costs. As the θ value varies, the model achieves a trade-off between resilience and prudence in its decision (e.g., when ω = 0.5 ), resulting in more balanced decisions that can better adapt to various out-of-sample cases. When θ increases further, the total rescue cost of the S-DRO model gradually rises because the excessively wide scope of the ambiguity set leads to greater conservative solutions under the worst-case probability distribution, resulting in unnecessary resource idleness. Although such conservatism can reduce the penalty costs associated with post-disaster resource shortages, when the gradually increased pre-disaster preparation budget exceeds the required rescue costs, it will instead lead to an increase in the total rescue costs.
In summary, variations in the parameter θ demonstrate the adaptability of the S-DRO model across test cases. Decision-makers should reasonably assess the degree of uncertainty of parameters that may be caused by future disasters. Then, they should set a reasonable value for θ and accordingly construct an ambiguity set to describe the probability distributions of the uncertain parameters, formulating more effective decision strategies. This process is critical for improving the performance of the S-DRO model in optimizing emergency logistic networks.

3.5. Influence of the Number of Clusters on S-DRO Model Performance

This section presents an analysis of the influence on the optimization decisions of the S-DRO model by adjusting the number of disaster scenario partitions on the optimization decisions of the S-DRO model. With θ fixed, the number of disaster scenarios is divided into 3, 4, 5, 6, and 7, Table 3 presents the performance of the decisions obtained by solving the model under various test cases.
Table 3 indicates that out-of-sample performance improves and then decreases as the number of scenarios increases. As aligned with the disaster severity classification method proposed in [4], a key rationale for the optimality of 5 scenarios lies in the distinct disparities across disaster-affected scenarios, which enables the model to precisely capture the heterogeneous characteristics of emergency resource demand and transportation time under different disaster intensities. An insufficient number of scenarios would lead to critical clustering information omission and resultant decision bias, whereas an excessive number would induce over-fitting to limited historical data, which in turn ignores the inherent uncertainties of future disaster events and undermines the model’s generalization capability. In essence, s = 5 achieves an optimal trade-off between retaining valid clustering information and mitigating over-fitting risks.
Moreover, as can be seen from the table, a larger number of scenarios will introduce more relevant variables, thus leading to a slight increase in solution time (for reference, the solution time of the C-DRO model is 182 s). However, given that the model yields better performance with a moderate number of scenarios, the difference in solution time between the S-DRO model and the C-DRO model is not significant in this study.
In summary, the number of disaster-feature-based scenarios affects the extraction of clustering information, influencing the quality of emergency decisions and the sustainability of the post-disaster emergency response. Therefore, in practical decision-making, to make full use of the limited historical data and apply the role of disaster-feature clustering information in decision-making, managers can select various methods (e.g., cross-validation) to determine an appropriate number of scenarios.
To verify the performance of the decisions derived from the distributionally robust optimization (DRO) model under special scenarios (e.g., additional emergency demand induced by aftershocks), we incorporated additional aftershock-induced emergency demand into the previous numerical examples. The additional demands are defined as percentages (1%, 5%, 10%, and 20%) of the emergency demand under the mainshock. The emergency response performance under these scenarios is presented in Table A2.

4. Discussions and Managerial Implications

4.1. Applicability and Limitation of the Proposed Method

The two-stage DRO structure is derived from the universal decision-making logic of disaster risk management—regardless of a country’s economic development level, geographical location, or disaster management system. The parameter boundaries of scenario-wise ambiguity set (e.g., Wasserstein radius, mean and MAD) can be flexibly adjusted to match the target country’s disaster records. While the framework has strong generality, it faces inherent limitations when applied to specific countries: (i) Dependence on region-specific empirical data—The calibration of both ambiguity sets relies on historical disaster data (e.g., disaster intensity, loss statistics). If a country lacks consistent and high-quality historical records, the scenario-wise ambiguity set may have overly broad parameter boundaries, and the Wasserstein radius may be miscalibrated. (ii) National disaster management systems—The obtained two-stage decision variables are designed based on the general centralized emergency management system, for countries with decentralized management systems (e.g., the United States, where state and local governments have independent disaster response powers), meaning that the decisions need to be redefined to match local institutional constraints.
In summary, our proposed two-stage DRO framework has broad applicability to other countries due to its methodological generality, flexible ambiguity set design, and customizable objectives. However, its practical application in specific countries is limited by data availability, institutional differences, and disaster type characteristics. These limitations require region-specific adaptations and data preprocessing.

4.2. Transferability and Applicability of the Method

Generic components of the framework to other disasters: The core strength of our two-stage distributionally robust optimization (DRO) framework lies in its methodological universality—the key logic, structural design, and optimization mechanisms are independent of specific disaster characteristics, making them directly transferable to diverse hazard scenarios (e.g., floods, typhoons, wildfires, landslides). The synergy between scenario-wise and Wasserstein ambiguity sets is a modular, disaster-agnostic mechanism, designed to handle uncertainty in parameter values.
Disaster-specific components: The components that are specific to our studied disaster (e.g., earthquakes) are parameter-level details rather than structural elements. These can be easily modified to match other disasters without changing the framework. These parameters may be uncertainty parameter definitions, scenario-wise ambiguity set calibration, Wasserstein radius calibration and the framework of the decision optimization model. In summary, the core value of our proposed framework lies in its separation of generic methodological logic and disaster-specific parameters. The two-stage DRO structure, dual ambiguity set mechanism, and objective/constraint framework are fully transferable to all disaster types. The only adaptations required are parameter-level adjustments (e.g., redefining uncertainty variables, recalibrating ambiguity set boundaries) based on the target disaster’s characteristics and historical data.

4.3. The Contributions to Sustainability in Emergency Response

In this paper, the robust decision-making enables precise pre-disaster preparation, enhances the efficiency of post-disaster response, and thereby mitigates the economic losses incurred by affected populations and society. The scenario-wise DRO framework ensures coverage of extreme emergency situations, reduce emergency resource shortages, and thus prevent additional disruptions to social order in the aftermath of disasters. Meanwhile, the proposed robust resource location-allocation decisions minimize excess waste (e.g., expired supplies) and transportation-related pollution, while avoiding secondary damage to the fragile post-disaster ecosystem (such as vegetation destruction from redundant transportation or soil/water contamination from discarded emergency materials). In summary, the aforementioned emergency response decision framework contributes to achieving environmental sustainability.

4.4. Managerial Implications

Based on the results, we obtain the following managerial implications in emergency response:
1.
The uncertainty inherent in the distribution of demands and transportation time exerts a significant impact on emergency response decisions, so this should be considered during the pre-disaster planning phase. Leveraging historical data through clustering techniques can enhance decision-making efficacy by extracting distribution information. Decision-makers should be aware that excessive clustering may cause the ambiguity set to overfit the historical observations, which in turn weakens the effectiveness of the model.
2.
By introducing the two-stage DRO framework, we can optimize the trade-off between pre-disaster preparation and post-disaster recourse. For managers, this translates to a balanced approach that mitigates both the cost of excessive preparedness and the risk of inadequate response, enhances the flexibility of emergency systems to adapt to unexpected changes, and ensures high-quality decisions even when the probability distribution of disaster-related uncertainties is not fully known. This decision method can improve the efficiency, resilience, and reliability of emergency response operations.
3.
The number of clusters s affects the performance of the proposed model significantly. This is because increasing the number of s will extract more distributional information regarding the uncertain parameters. However, too many clusters may focus excessively on historical data details and noise rather than the true distribution of the observations. This overfitting problem would constrict the ability of the ambiguity set to capture the true distributions of random parameters. Note that the selection of s depends on various factors, such as the volume of historical data and the spatial distribution of demand points. Therefore, decision-makers should rationally determine the optimal cluster number by integrating domain-specific empirical knowledge.

5. Conclusions

This study tackles the emergency resource network design problem by accounting for uncertainties inherent in both demand and transportation time. We get the following research conclusions: (i) The proposed two-stage scenario-based distributionally robust optimization model, which integrates pre-disaster decisions and post-disaster resource distribution, achieves a more favorable trade-off between robustness and conservatism in emergency response than the sample average approximation model and conventional DRO models. (ii) The data-driven ambiguity set constructed by fusing average value, mean absolute deviation, and Wasserstein distance effectively addresses the scarcity of uncertain parameter information, enabling comprehensive and accurate characterization of the probability distribution of demand and transportation time uncertainties. (iii) The number of disaster scenarios derived from historical data clustering exerts a significant impact on model performance; scientific determination of cluster numbers not only facilitates full utilization of disaster pattern information but also mitigates the risk of model overfitting, providing actionable guidance for emergency decision-makers.
Against the backdrop of the widespread application of big data analytics in healthcare and disaster management domains, future research will focus on the development of data-driven dynamic optimization methodologies. By incorporating real-time updated disaster-related information, the optimization model can be further refined to enable adaptive decision-making in emergency management. This adaptive framework is expected to substantially improve the efficiency of emergency response operations in dynamically evolving disaster scenarios.

Author Contributions

Conceptualization, methodology, writing, funding acquisition, and Writing—original draft preparation were carried out by Y.L. (Yuchen Li) and Y.L. (Yang Liu) Software, review, writing, and editing were carried out by X.Y. Writing—review & editing, supervision was carried out by P.W. All authors have read and agreed to the published version of the manuscript.

Funding

This work was supported by the National Natural Science Foundation of China, grant number 72504154, Shandong Provincial Natural Science Foundation, grant number ZR2024QG158, Natural Science Foundation of Anhui Province, grant number 2508085QG262 and the Qingdao Philosophy and Social Sciences Planning Project, grant number QDSKL2401142.

Institutional Review Board Statement

Not applicable.

Informed Consent Statement

Not applicable.

Data Availability Statement

The original contributions presented in this study are included in the article. Further inquiries can be directed to the corresponding author.

Conflicts of Interest

The authors declare no conflicts of interest.

Appendix A. Proof of Proposition 1

Appendix A.1. Reformulation of the Objective Function

First, we reformulate term s u p P t ∈ F t , P d ∈ F d E P h x , r , t , d in the second stage of objective function. We introduce an auxiliary decision variable y ¯ i j = m y i j and let y ¯ be the stacked vector. Because h x , r , t , d > − ∞ , according to [23], we have
s u p P t ∈ F t , P d ∈ F d min y E P h x , r , t , d = min y s u p P t ∈ F t , P d ∈ F d E P h x , r , t , d .
Based on the law of total probability, we construct the distribution P from the conditional empirical distribution P ^ s in each s ∈ [ S ] and the conditional distribution P s of t ˜ , z ˜ given s ∈ [ S ] . We focus on the uncertain transportation time in the objective function, for a given feasible second-stage decision vector y ¯ , the worst-case expectation s u p P t ∈ F t E P t min y ∑ i ∈ I ∑ j ∈ J m t ˜ i j y i j can be written as:
s u p P s t ∈ F C t ∑ s ∈ S p s E P s t f y ¯ , z , t
s . t . E P s t t ˜ i j = μ i j s , ∀ s ∈ S , i ∈ [ I ] , j ∈ [ J ]
E P s t z ˜ i j ⩽ σ i j s , ∀ s ∈ S , i ∈ [ I ] , j ∈ [ J ]
∑ s ∈ S p s E Q s d W P s t , P ^ s t ⩽ θ
Π t ˜ Q s = P s t , ∀ s ∈ S
Π t ^ Q s = P ^ s t , ∀ s ∈ S
P s t t ˜ , z ˜ ∈ W s t = 1 , ∀ s ∈ S , i ∈ [ I ] , j ∈ [ J ] .
Note that there exists a strictly feasible solution to the above problem (A1), e.g., by letting P s t = P ^ s t . Therefore, by Slater’s condition, strong duality holds. Then we can get the dual problem of model (A1) as following:
min λ θ + ∑ s ∈ S μ s T α s + σ s T β s + ∑ n ∈ N s η s n N s
s . t . η s n ⩾ max t , z ∈ W s t p s t T y ¯ − t T α s − z T β s − λ p s t − t ^ s n 1 , ∀ s ∈ S , n ∈ N s
λ , β s ⩾ 0 , ∀ s ∈ S .
Considering term max t , z ∈ W s t · in constraints (A2b), let Δ s n = t − t ^ s n , and let λ ′ and π s n be Lagrange multipliers, then we have the Lagrangian of the right hand of (A2b) for a given i ∈ [ I ] , j ∈ [ J ] , s ∈ [ S ] , n ∈ [ N s ] as follows:
g ( π s n ) = s u p t , z ∈ W s t , Δ s n p s y ¯ Δ s n + t ^ s n − α s Δ s n + t ^ s n − z T β s − λ p s Δ s n 1 + π s n Δ s n + t ^ s n − t
= s u p t , z ∈ W s t − π s n t − z T β s + s u p Δ s n p s y ¯ − α s + π s n Δ s n − λ p s Δ s n 1 + p s y ¯ − α s + π s n t ^ s n
= p s y ¯ − α s + π s n t ^ s n + λ p s s u p Δ s n p s y ¯ − α s + π s n λ p s Δ s n − Δ s n 1
= p s y ¯ − α s + π s n t ^ s n + λ p s I p s y ¯ − α s + π s n λ p s ∞ ⩽ 1 p s y ¯ − α s + π s n λ p s .
The second line s u p t , z ∈ W s t − π s n t − z T β s only makes sense when π s n ⩾ 0 ; the fourth line is transformed based on the definition of the dual norm. According to [24], for a given s ∈ [ S ] , n ∈ [ N s ] , i ∈ [ I ] , j ∈ [ J ] , the dual problem is equivalent to the following problem:
min π s n p s y ¯ − α s + π s n T t ^ s n
s . t . p s y ¯ − α s + π s n ∗ ⩽ λ p s , ∀ s ∈ [ S ] , n ∈ [ N s ]
π s n ⩾ 0 , ∀ s ∈ [ S ] , n ∈ [ N s ] .
This paper focuses on the l 1 -norm, thus the constraint in model (A4) can be transformed into the following form:
p s y ¯ − α s + π s n ⩽ λ p s , ∀ s ∈ [ S ] , n ∈ [ N s ]

Appendix A.2. Scenario-Wise Adaptation of Constraints (2b)

Based on the proposed scenario-wise ambiguity set, we use the scenario-wise adaptation policy introduced in [15,25], and add additional index s for recourse variables ( y i j s , u j s ) as mappings of each scenario. Thus, the second-stage problem is as follows:
h x , r , t ˜ , d ˜ , s ˜ = min y s , u s ∑ i ∈ I ∑ j ∈ J m t i j y i j s + ∑ j ∈ J b u j s
s . t . ∑ i ∈ [ I ] y i j s + u j s ⩾ d j s , ∀ j ∈ [ J ] , s ∈ [ S ]
∑ j ∈ J y i j s ⩽ r i , ∀ i ∈ [ I ] , s ∈ [ S ]
y i j s ⩾ 0 , ∀ i ∈ I , j ∈ J , s ∈ [ S ] .
According to Proposition 3 of [25], for a given first-stage decision x , r and scenario s ∈ [ S ] , constraints (2b) can be reformulated as:
∑ i ∈ [ I ] y i j s + u j s ⩾ d ¯ j s , ∀ j ∈ [ J ] , s ∈ [ S ]
Finally, by substituting the obtained equivalent forms into the original model, the resulting outcome is as shown in Proposition 1.

Appendix A.3. Model Information and Gurobi Solver Configuration

Table A1. Model information and Gurobi Solver Configuration.
CategoryParameterValue/Setting
ModelModel TypeMIP
Variables x , r , y , λ , α , β , η , π (to be determined)
SolverSolverGurobi 10.0
MIPGap0.05%
Time Limit360 s
Pre-processingLevel 2 (Moderate)
Threads8
Heuristics0.05
CutsLevel 2 (Moderate)

Appendix A.4. Performance of the S-DRO Model Under Aftershocks

Table A2. Performance of the S-DRO model under aftershocks.
Total Rescue Cost ( × 10 9 CNY)
Additional Demands
1%5%10%20%
Additional transport time1%8.20338.20338.20368.2045
5%8.20348.20348.21378.2647
10%8.20368.20368.22398.3159
20%8.21388.21388.23428.4294
As we can see from the table, When the additional transportation time and demand induced by aftershocks are minimal (e.g., both 1% increase), the DRO-derived facility location decisions and inventory plans result in a mere 0.08% percentage increase in total rescue costs. Owing to sufficient emergency material reserves, this increase primarily consists of the transportation costs associated with the additional emergency demands. Even with a 20% surge in demands and transportation time, the total rescue costs only rise by 2.76%. This is attributed to the fact that DRO decisions are formulated for worst-case scenarios, thus maintaining high robustness even in the presence of aftershocks.

References

  1. Eshghi, K.; Larson, R.C. Disasters: Lessons from the past 105 years. Disaster Prev. Manag. Int. J. 2008, 17, 62–82. [Google Scholar] [CrossRef] [Scilit]
  2. Zhong, S.; Wang, L. Deprivation cost theory in humanitarian relief: A literature review and prospects. Socio-Econ. Plan. Sci. 2025, 98, 102168. [Google Scholar] [CrossRef] [Scilit]
  3. Fournier, N.; Guillin, A. On the rate of convergence in Wasserstein distance of the empirical measure. Probab. Theory Relat. Fields 2015, 162, 707–738. [Google Scholar] [CrossRef] [Scilit]
  4. Li, Y.; Zhang, J.; Yu, G. A scenario-based hybrid robust and stochastic approach for joint planning of relief logistics and casualty distribution considering secondary disasters. Transp. Res. Part E Logist. Transp. Rev. 2020, 141, 102029. [Google Scholar] [CrossRef] [Scilit]
  5. Grot, M. Decision support framework for tactical emergency medical service location planning. Omega 2024, 125, 103036. [Google Scholar] [CrossRef] [Scilit]
  6. Chang, K.H.; Chen, T.L.; Yang, F.H.; Chang, T.Y. Simulation optimization for stochastic casualty collection point location and resource allocation problem in a mass casualty incident. Eur. J. Oper. Res. 2023, 309, 1237–1262. [Google Scholar] [CrossRef] [Scilit]
  7. Zhang, L.; Yuan, N.; Wang, J.; Li, J. Research on location-inventory-routing optimization of emergency logistics based on multiple reliability under uncertainty. Comput. Ind. Eng. 2025, 200, 110826. [Google Scholar] [CrossRef] [Scilit]
  8. Kchaou Boujelben, M.; Boulaksil, Y. Modeling international facility location under uncertainty: A review, analysis, and insights. IISE Trans. 2018, 50, 535–551. [Google Scholar] [CrossRef] [Scilit]
  9. Xu, Z.; Zheng, C.; Zheng, S.; Ma, G.; Chen, Z. Multimodal transportation route optimization of emergency supplies under uncertain conditions. Sustainability 2024, 16, 10905. [Google Scholar] [CrossRef] [Scilit]
  10. Li, Y.; Liu, Y. Distributionally robust optimization for collaborative emergency response network design. Transp. Res. Part E Logist. Transp. Rev. 2023, 176, 103221. [Google Scholar] [CrossRef] [Scilit]
  11. Xu, F.; Ma, Y.; Liu, C.; Ji, Y. Emergency logistics facilities location dual-objective modeling in uncertain environments. Sustainability 2024, 16, 1361. [Google Scholar] [CrossRef] [Scilit]
  12. Rahimian, H.; Bayraksan, G.; Homem-de Mello, T. Identifying effective scenarios in distributionally robust stochastic programs with total variation distance. Math. Program. 2019, 173, 393–430. [Google Scholar]
  13. Heyhat, S.; Rahmani, D.; Shahparvari, S. Data-driven distributionally robust optimization for resilient healthcare resource planning and crisis mitigation. Transp. Res. Part E Logist. Transp. Rev. 2026, 205, 104449. [Google Scholar]
  14. Zhang, G.; Jia, N.; Zhu, N.; He, L.; Adulyasak, Y. Humanitarian transportation network design via two-stage distributionally robust optimization. Transp. Res. Part B Methodol. 2023, 176, 102805. [Google Scholar] [CrossRef] [Scilit]
  15. Chen, Z.; Sim, M.; Xiong, P. Robust stochastic optimization made easy with RSOME. Manag. Sci. 2020, 66, 3329–3339. [Google Scholar] [CrossRef] [Scilit]
  16. Liu, Y.; Zhang, J.; Chan, F.T. AI-enhanced robust method for integrated healthcare resource pre-positioning and patient scheduling. Int. J. Prod. Res. 2025, 63, 729–757. [Google Scholar] [CrossRef] [Scilit]
  17. Wang, C.; Chen, S. A distributionally robust optimization for blood supply network considering disasters. Transp. Res. Part E Logist. Transp. Rev. 2020, 134, 101840. [Google Scholar] [CrossRef] [Scilit]
  18. Wang, Y.; Zhang, Y.; Zhou, M.; Tang, J. Feature-driven robust surgery scheduling. Prod. Oper. Manag. 2023, 32, 1921–1938. [Google Scholar] [CrossRef] [Scilit]
  19. Cui, Z.; Long, D.Z.; Qi, J.; Zhang, L. The inventory routing problem under uncertainty. Oper. Res. 2023, 71, 378–395. [Google Scholar] [CrossRef] [Scilit]
  20. Amani, M.A.; Sarkodie, S.A.; Sheu, J.B.; Nasiri, M.M.; Tavakkoli-Moghaddam, R. A data-driven hybrid scenario-based robust optimization method for relief logistics network design. Transp. Res. Part E Logist. Transp. Rev. 2025, 194, 103931. [Google Scholar] [CrossRef] [Scilit]
  21. Wu, W.W. Research on the coupling factors of earthquake disasters in southwest of China. Seismol. Geomagn. Obs. Res. 2014, 35, 92–96. [Google Scholar]
  22. Ni, W.; Shu, J.; Song, M. Location and emergency inventory pre-positioning for disaster response operations: Min-max robust model and a case study of Yushu earthquake. Prod. Oper. Manag. 2018, 27, 160–183. [Google Scholar] [CrossRef] [Scilit]
  23. Bertsekas, D. Convex Optimization Theory; Athena Scientific: Nashua, NH, USA, 2009; Volume 1. [Google Scholar]
  24. Zhang, Y.; Shen, Z.J.M.; Song, S. Distributionally robust optimization of two-stage lot-sizing problems. Prod. Oper. Manag. 2016, 25, 2116–2131. [Google Scholar]
  25. Cheng, C.; Yu, Q.X.; Adulyasak, Y.; Rousseau, L.-M. Distributionally robust facility location with uncertain facility capacity and customer demand. Omega 2024, 122, 102959. [Google Scholar]
Figure 1. Historical earthquake points ( M ≥ 5.0 ) during 2008–2022 in Sichuan, China.
Sustainability 18 00871 g001
Figure 2. Emergency facility location decisions among different models.
Sustainability 18 00871 g002
Figure 3. Cross-model comparison of out-of-sample performance.
Sustainability 18 00871 g003
Figure 4. Influence of the ω parameter on model performance.
Sustainability 18 00871 g004
Table 1. Notations.
Table 1. Notations.
NotationsDescription
Sets:
ISet of candidate emergency facility locations i ∈ I .
JSet of all disaster points j ∈ J .
Parameters:
p s Probability associated with disaster scenario s.
f i Fixed cost for opening an emergency facility at location i ∈ I .
oThe unit procurement cost for emergency supplies.
c i Capacity of emergency facility at location i ∈ I .
mUnit cost per transportation volume per hour.
bPenalty cost for unit unmet emergency demand.
t ˜ i j Uncertain travel time from emergency facility i ∈ I to disaster point j ∈ J .
d ˜ j Uncertain emergency demand quantity at disaster point j ∈ J .
Variables:
x i 1, if an emergency facility is opened at candidate location i ∈ I ; 0, otherwise.
r i The quantity of inventory to be stored at a candidate emergency facility i ∈ I .
y i j Quantity of emergency resources allocated from emergency facility i ∈ I to disaster point j ∈ J .
Table 2. Comparison of solutions from different models.
ModelsOpen
Facilities Count
Inventory ( × 10 6 )Preparedness Cost ( × 10 9  CNY)
SAA201.01414.6812
C-DRO221.03474.9230
S-DRO211.03454.9123
Table 3. Out-of-sample performance of S-DRO under different scenario number ( × 10 9 CNY).
Number of Scenarios
Test Case34567
18.20368.20368.20288.20328.2035
28.20378.20378.20308.20338.2036
38.20418.20418.20318.20378.2040
48.20478.20478.20338.20448.2046
58.20528.20508.20388.20478.2049
Average8.20438.20428.20328.20398.2041
Solution time194.1 s215.5 s227.3 s239.6 s268.5 s
Disclaimer/Publisher’s Note: The statements, opinions and data contained in all publications are solely those of the individual author(s) and contributor(s) and not of MDPI and/or the editor(s). MDPI and/or the editor(s) disclaim responsibility for any injury to people or property resulting from any ideas, methods, instructions or products referred to in the content.