Article

Impact of Green Finance on Urban Ecological and Environmental Resilience: Evidence from China

School of Humanities and Social Sciences, Jiangsu University of Science and Technology, Zhenjiang 212100, China
*
Author to whom correspondence should be addressed.
Sustainability 2026, 18(2), 706; https://doi.org/10.3390/su18020706
Submission received: 30 November 2025 / Revised: 3 January 2026 / Accepted: 7 January 2026 / Published: 9 January 2026
(This article belongs to the Section Economic and Business Aspects of Sustainability)

Abstract

China’s Green Finance Reform and Innovation Pilot Zones (GFRIPZ) policy has emerged as a central instrument for promoting sustainable urban development and strengthening Urban Ecological and Environmental Resilience (UEER). However, systematic evidence on its actual effectiveness remains scarce. This study applies a difference-in-differences (DID) model to panel data for 279 Chinese cities from 2011 to 2022 to identify the causal impact of the GFRIPZ policy on UEER and to examine its transmission mechanisms and heterogeneity. Specifically, we incorporate green innovation efficiency and environmental regulation intensity to test the technological and regulatory channels through which green finance operates. The empirical results show that: (1) the GFRIPZ policy significantly improves UEER, and this finding is robust across a range of alternative specifications and robustness checks. (2) Green innovation efficiency and environmental regulation intensity serve as key mechanisms through which the policy enhances UEER. (3) The policy effect is stronger in eastern cities, megacities, small cities, and non-resource-based cities, while it is relatively weaker in central and western cities, medium-sized cities, and resource-based cities. These findings provide additional empirical evidence to inform the refinement and further advancement of the GFRIPZ policy and offer evidence-based implications for urban green development strategies.

1. Introduction

In recent years, Chinese cities have come under pressure as intensive industrialization, rapid urbanization, and climate risks increasingly overlap. On the one hand, they must maintain stable economic growth and ensure the safe operation of urban systems; on the other hand, they must respect ecological boundaries and strengthen environmental resilience. In most cities, the simultaneous increase in resource-intensive development, high energy consumption, and heavy pollution emissions, together with more frequent extreme weather events, has steadily weakened the carrying capacity, buffering capacity, and resilience of urban ecosystems. UEER has become a key factor shaping the long-term sustainability of cities. Whether a city can maintain its basic ecological functions during shocks and quickly restore its ecological service levels afterward is no longer a concern only for environmental authorities. It has been explicitly incorporated into national strategic frameworks as a core governance task within the national agendas for “resilient cities” and ecological civilization development.
Green finance refers to financial activities and institutional arrangements that integrate environmental and ecological protection goals into the allocation of financial resources and investment decisions, while at the same time supporting economic and social development. It is regarded as an important driver of green transformation and high-quality economic growth and provides essential financial support for countries’ transition to low-carbon and sustainable development. Amid mounting global climate pressures, “green development” has become a key direction for national development models worldwide, and related issues are increasingly at the center of public debate. From a policy consensus perspective, green finance has gained broad recognition around the world. It has been incorporated into institutional frameworks in many countries and regions and has attracted increasing attention from governments, enterprises, and investors, thereby gradually gaining broad public support [1].
China’s green finance policy framework comprises a series of regulatory documents jointly issued by the National Development and Reform Commission, the Ministry of Finance, and the former China Banking Regulatory Commission. In 2017, the Chinese government approved the implementation of the GFRIPZ policy in selected areas of Zhejiang, Guangdong, Jiangxi, Guizhou, and Xinjiang provinces, marking the establishment of the first batch of pilot zones (Table 1). This indicates that green finance in China has entered a new stage in which top-level design and local implementation are closely integrated. These pilot zones make use of their specific regional resource endowments to build a green finance development system with Chinese characteristics and advance it through innovation in instruments, improvement of mechanisms, and exploration of development pathways. By 2019, Lanzhou New Area in Gansu Province had been designated as part of the second batch of pilot zones, and by the end of 2022, Chongqing Municipality was included in the third batch. This policy arrangement now covers the core areas of major economic zones in most eastern, central, and western regions of China and has gradually formed a multi-level spatial coordination network at the national scale.
Accordingly, the primary objective of this study is to provide systematic causal evidence on whether and to what extent the GFRIPZ policy enhances UEER, and to further clarify the underlying transmission mechanisms and heterogeneity. Specifically, this study addresses three related research questions. Specifically, this study addresses three related research questions: (1) From the perspective of the GFRIPZ policy, this paper examines its impact on UEER in order to address gaps in existing research, namely the focus on single policy instruments, the limited attention to policy coherence and evaluation, and the relatively weak focus on urban impacts from the standpoint of ecological and environmental resilience. In doing so, it complements and extends the existing literature. (2) By introducing green innovation efficiency (GIE) and environmental regulation intensity (ENV) as mechanism variables, this study examines how the GFRIPZ policy enhances UEER through these channels and deepens understanding of how the policy improves UEER. (3) This paper examines the heterogeneity of the effects of the GFRIPZ policy on UEER across three dimensions: geographic location, urban scale, and resource endowment. By assessing the heterogeneous effects of the GFRIPZ policy on UEER and exploring their underlying causes, this study provides new theoretical insights for regional policy design.
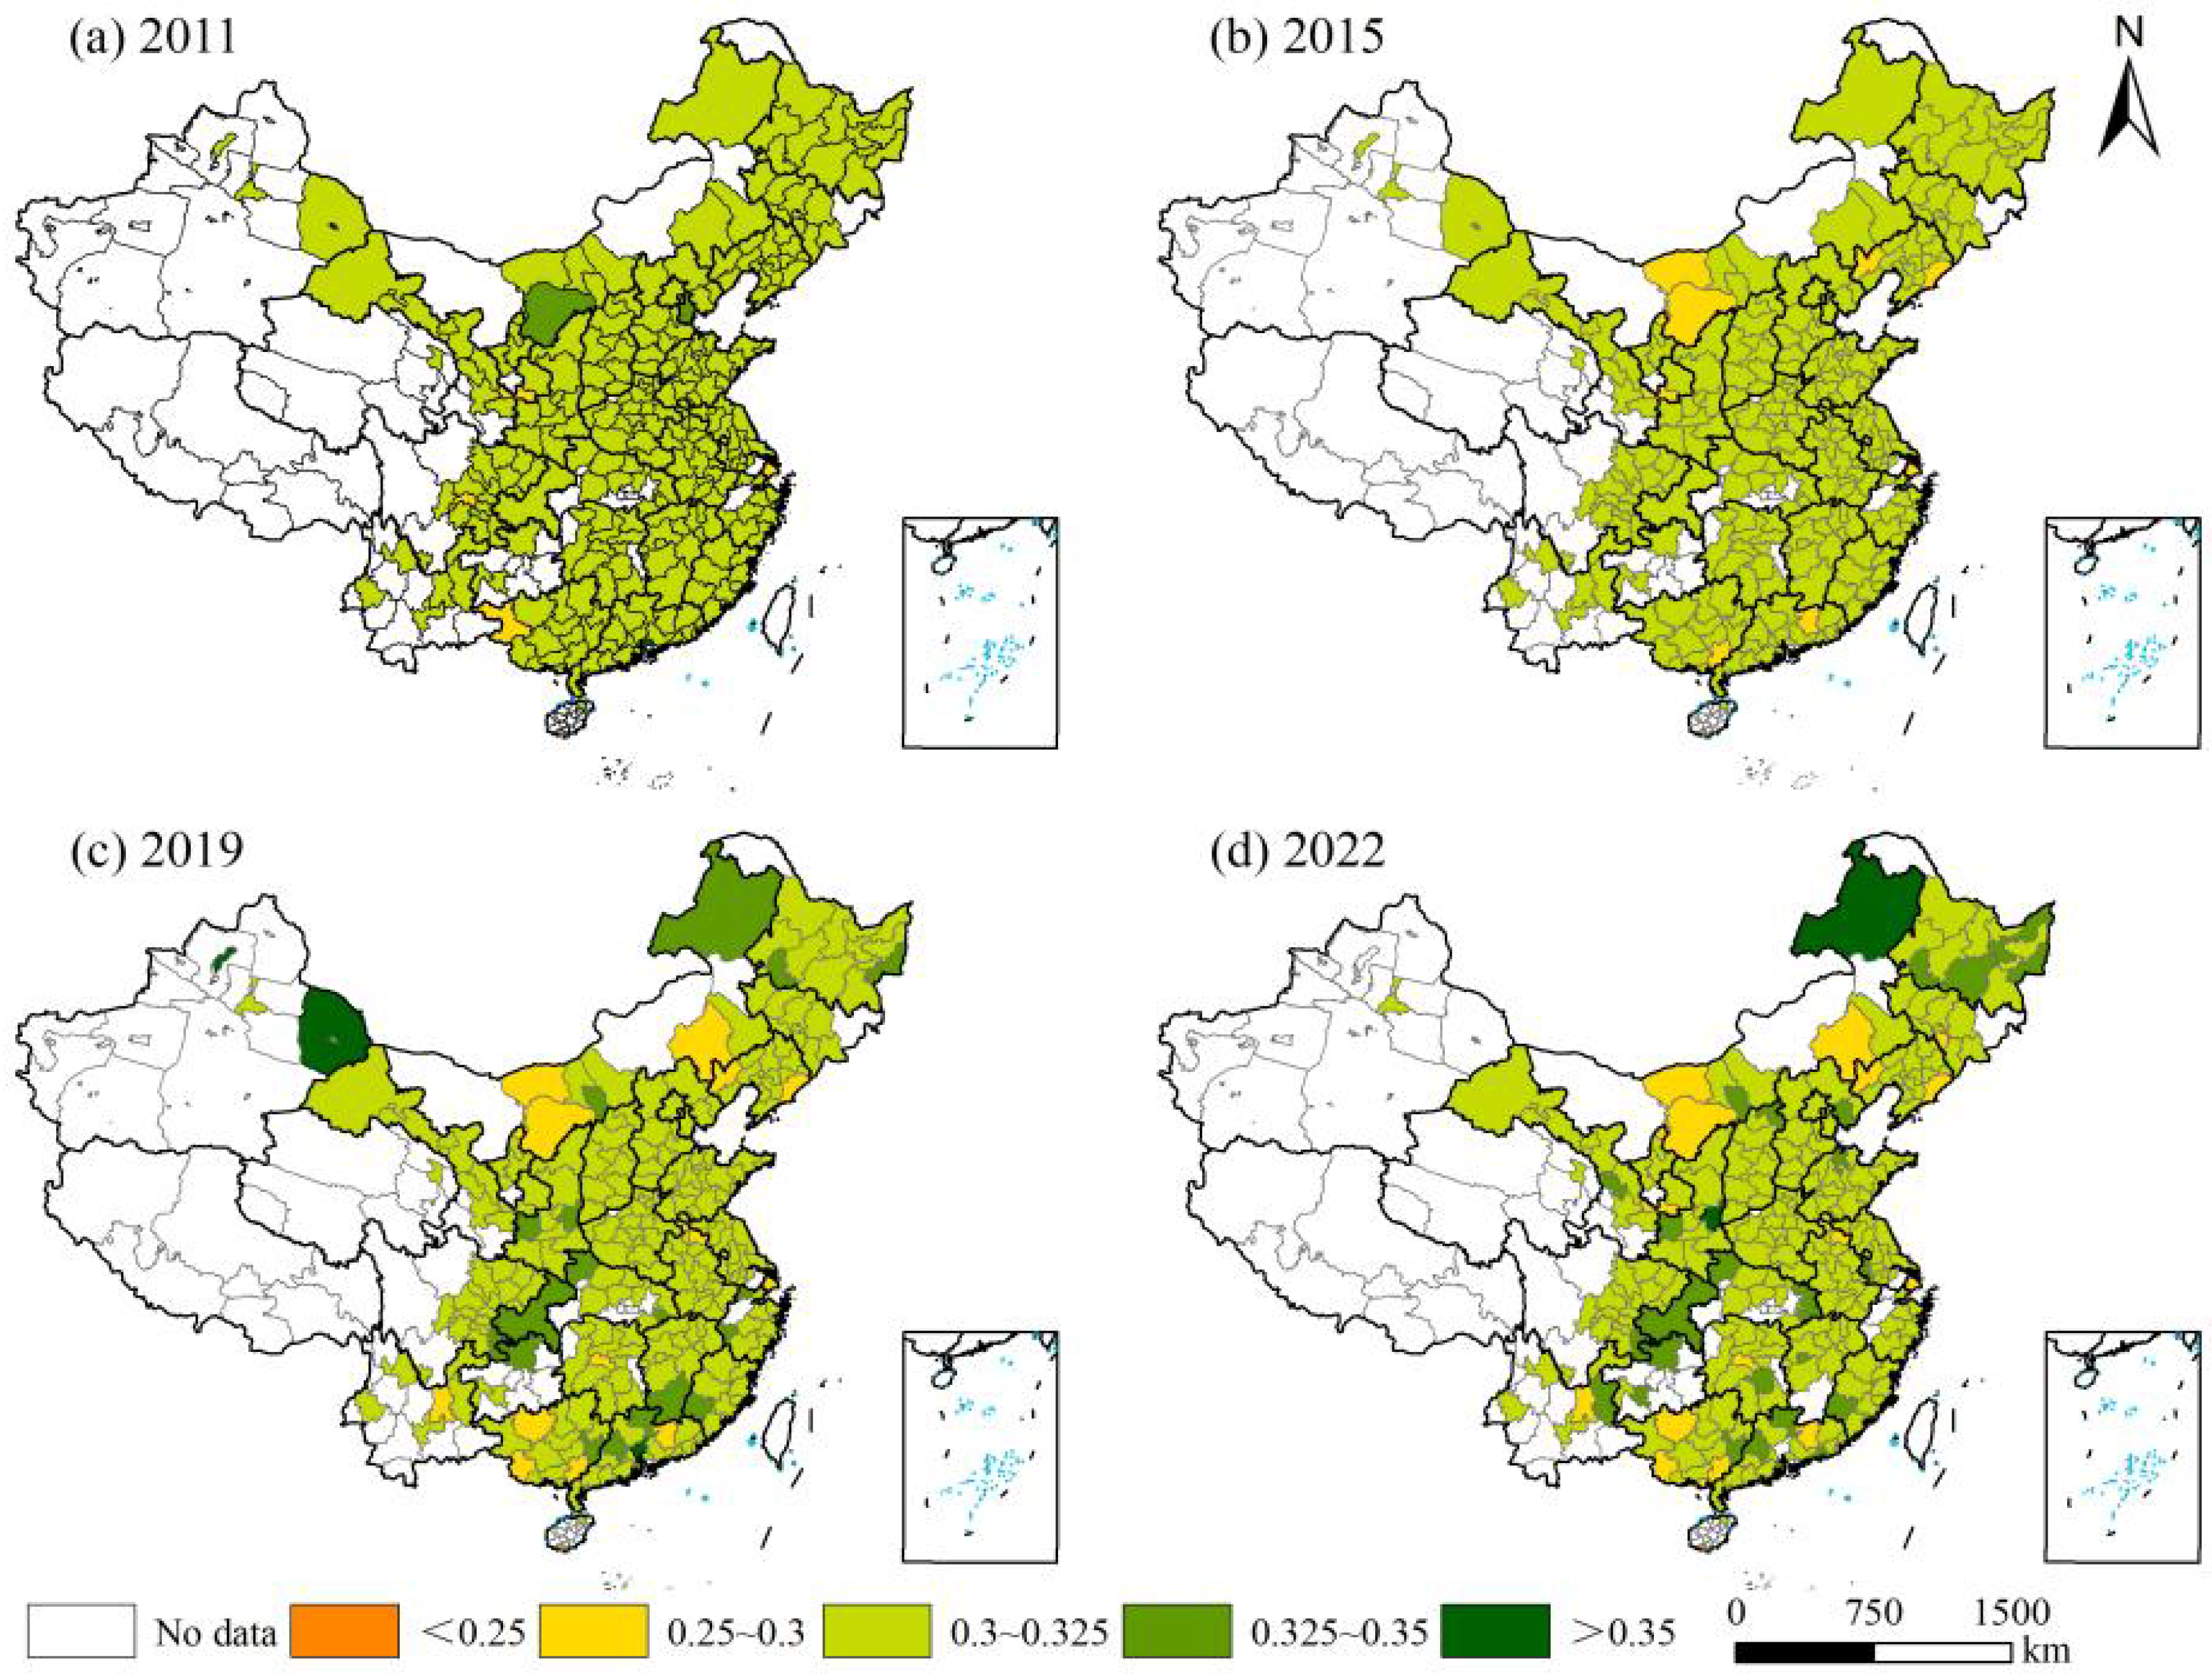
To describe the spatio-temporal pattern of UEER in China, this study applies the natural breaks classification method in ArcGIS 10.8.2 to produce spatial visualizations of the UEER index. Distribution maps for 2011, 2015, 2019 and 2022 (Figure 1) are generated to show the spatial characteristics of UEER and its evolution over time.
From a spatial perspective, UEER displays pronounced regional disparities and clear patterns of spatial agglomeration. Coastal regions and national-level urban agglomerations, such as the Beijing-Tianjin-Hebei region, the Yangtze River Delta and the Pearl River Delta, together with several provincial capitals and hub cities, constitute high-value zones that exhibit persistently high overall levels and a continuous belt-shaped spatial pattern. In central, western and less developed regions, UEER levels are relatively low, but several high-value clusters have emerged around key nodes such as the Chengdu–Chongqing region, the middle reaches of the Yangtze River and the Guanzhong area, indicating a diffusion pattern from points to belts.
From a temporal perspective, UEER in China has improved steadily over time. High-value zones are gradually extending from coastal areas to inland regions, improving the continuity and overall integrity of urban clusters. From 2011 to 2015, the main changes were reflected in structural adjustments. Between 2015 and 2019, the pace of improvement increased markedly, with high-value areas becoming more concentrated and spreading along major transport and industrial corridors. By 2022, these high-value zones had become more interconnected, and several key node cities in central and western regions had moved into higher UEER levels. This pattern indicates a continuous strengthening of systemic resilience in ecological governance, infrastructure development and governance coordination.
Overall, UEER in China exhibits an evolutionary pattern characterized by “high levels in the east, rising inland regions, strong nodes and belt-shaped spatial distribution”. While regional gradients are gradually narrowing, the driving role of key corridors and core cities is becoming more pronounced.

2. Literature Review

2.1. Research on the GFRIPZ Policy

The introduction of the GFRIPZ policy is grounded in two main realities. First, global environmental risks continue to escalate, and China has committed to the goals of carbon peaking and carbon neutrality. Second, the Chinese economy urgently needs to accelerate its green transition within the framework of high-quality development. During this process, the green finance market has expanded rapidly, putting traditional financial institutions under increasing pressure to adjust their business structures and the way they allocate financial resources. Against this background, the GFRIPZ policy was introduced and put into practice [2]. Scholars in China and abroad have examined this issue from multiple perspectives. At the urban level, the GFRIPZ policy can promote green innovation by upgrading the quality of human capital and fostering a more supportive business climate. It can also enhance the performance of the green economy by bringing in foreign capital, tightening credit to highly polluting sectors, optimizing the allocation of resources, and steering the industrial structure toward more advanced forms. Furthermore, the GFRIPZ policy is also effective in promoting energy conservation and emission reductions. By strengthening green innovation, easing financing constraints, and optimizing the industrial structure, the GFRIPZ policy contributes to a gradual decline in energy intensity [3]. Desalegn and Tang, after reviewing 146 relevant studies, conclude that the GFRIPZ policy can, to some extent, guide capital flows toward low-carbon sectors and help ease the global shortage of green investment. However, the implementation of the GFRIPZ policy also faces several practical constraints. Inadequate coordination among local regulators, weak criteria for identifying and screening urban green projects, and mismatches between risk and return have all reduced the efficiency of green capital deployment in cities [4]. Using data for 280 prefecture-level cities from 2008 to 2019, Zhou et al. find that the GFRIPZ policy can significantly improve total factor energy efficiency. This effect operates mainly by promoting industrial upgrading and encouraging green technological innovation and is more pronounced in cities with stricter environmental enforcement and stronger intellectual property protection [5]. Against the backdrop of multiple ecological challenges to urban development, enhancing the capacity for green transformation has become a key focus of governance. 2024 Chinese government work report explicitly states the need to strengthen ecological civilization, promote green and low-carbon development, and continue to move towards carbon peaking and carbon neutrality targets [6]. At the enterprise level, existing studies show that the GFRIPZ policy can promote green innovation by easing financing constraints faced by industrial firms [7] and by strengthening the environmental constraints they face [8]. Huang et al. use a panel threshold model to examine the impact of green finance on corporate green innovation and find a significant positive relationship between the two. Further analysis of the dual threshold effect shows that, as environmental regulation becomes more stringent, the positive impact of green finance on corporate green innovation gradually weakens [9]. Chang et al. employ a dynamic panel generalized method of moments (GMM) framework to investigate how the GFRIPZ policy influences firms’ R&D investment. Their findings show that firm-specific characteristics, credit conditions, and financing constraints all play a significant role in shaping the level of R&D spending [10]. Xu and Li use a fixed-effects model, verified by the Hausman test and combined with mediation analysis, to examine the impact of the GFRIPZ policy on corporate debt financing costs. The results show that green credit policies increase the debt financing costs of high-polluting firms, and this effect is heterogeneous across firms. Among firms of different sizes, this cost increase is more pronounced for large firms and relatively weaker for small firms [11]. Related studies also show that the GFRIPZ policy can promote corporate green innovation and that its mechanisms of action differ across regional contexts, providing a basis for policy optimization [12]. The rising concern of the European Union and international markets for green development of enterprises has led to higher pressure on enterprises to transform; their market competitiveness will be significantly weakened if they fail to comply with the green development trend. At the same time, green finance policies will affect enterprises in terms of both the volume and the price of financing: they will significantly affect the scale of financing and change the cost structure of financing [13].
From the perspective of the evolution of green financial instruments, Shang et al. constructed a multi-dimensional green finance index based on 2000–2022 data and compared the differences between the north and south, and found that the overall level of green finance in China is still low, with the south generally higher than the north, and although the spatial differences have converged, the regional differences are still the main source of uneven distribution, with the difference between the green funds being the key Structural Drivers. This suggests that the structure and regional allocation characteristics of green financial instruments may differentially affect local green development performance by influencing capital flows and green innovation incentives [14]. Related studies generally agree that green bonds and green loans are the two most representative types of financing vehicles in the green financial system. Green bonds, as an emerging fixed-income asset, are usually issued by governments, corporations and other institutions to support environmentally friendly and climate-friendly projects, such as renewable energy, recycling and green infrastructure, but there are differences in the definition of ‘green’ bonds among different organizations, leading to incomplete consistency in the classification [15]. Wang et al. constructed a comprehensive database based on data from multiple sources to portray the trend of rapid expansion of the green bond market since around 2013, and pointed out that some countries accounted for a higher share of the issuance scale [16]. However, accurate measurement of market size is more difficult as most regulators do not mandate disclosure of green lending information. Comparatively, China has promoted green credit policies and strengthened disclosure requirements since 2007, which has improved information transparency to a certain extent and provided a more actionable data base for assessing the capital allocation efficiency and environmental performance of green credit [17].

2.2. Research on UEER

The concept of “elasticity” originated in engineering, where it is used to describe the stress–recovery behavior of physical systems. Subsequently, Holling introduced this concept into ecology and defined resilience as the capacity of an ecosystem to regulate itself and return to a relatively stable state after disturbances [18], highlighting the interdependence between the ecological environment and human habitats [19]. Because ecological and environmental resilience is a broad and flexible concept, there is still no consensus, either internationally or in China, on the choice of indicators or on the methods used to measure it. Shi et al. develop an ecological and environmental resilience evaluation system based on sensitivity and adaptability and use multiple linear regression to examine its spatiotemporal variation in the Beijing-Tianjin-Hebei urban cluster [20]. Baho et al. decompose ecological and environmental resilience into four complementary dimensions: scale, adaptive capacity, thresholds, and alternative systems [21]. Wang et al. develop a “scale–density–form” physical coupling model and a corresponding ecological and environmental resilience indicator system to describe the coordinated relationship between regional urbanization and ecological and environmental resilience. On this basis, they propose recommendations for national spatial planning [22].
UEER is a core issue for sustainable urban development and is a multi-dimensional concept. From an economic perspective, improving UEER helps strengthen a city’s capacity to withstand and recover from extreme climatic and environmental stresses. This, in turn, mitigates the impact of disasters on infrastructure operation and residents’ well-being and reduces the associated social and economic costs [23]. From a social welfare perspective, UEER plays an important role in maintaining urban ecosystem services, including air purification, water regulation, and thermal environment control. The positive effects of UEER on residents’ quality of life and health have been widely documented [24]. From a policy perspective, UEER has become an important element of national strategies for urban planning and development. For example, the implementation of the 15th Five-Year Plan for UEER reflects the deep integration of ecological conservation, disaster prevention and control, and green development. Through policy guidance, project implementation, and institutional innovation, this policy framework encourages cities to move from “passive adaptation” to “proactive shaping” of ecological resilience and lays the groundwork for achieving the goal of a “Beautiful China” by 2035. At the practical level, Chinese cities have actively explored ways to enhance UEER. For example, urban agglomerations such as the Beijing-Tianjin-Hebei region, the Yangtze River Delta, and the Pearl River Delta have strengthened policy coordination among stakeholders by creating cross-regional ecosystem management bodies, improving joint ecological legislation, and launching pilot programs for coordinated governance. In addition, less developed regions have improved local ecological resilience and helped reduce regional disparities by developing eco-industries, setting up ecological conservation and restoration institutions, and promoting market-based trading of ecological conservation and restoration products [25]. With the deepening of related research, the academic community has gradually formed a more consistent understanding of the meaning of UEER. It encompasses both the internal coordination and organizational capacity of the urban system and its ability to resist and recover in the face of external uncertainty risks [26]. Since then, scholars around the world have carried out a large number of studies on ecological and environmental resilience, and conducted in-depth qualitative discussions on development mechanisms, evolutionary paths and influencing factors [27,28,29], and further systematically sorted out the theoretical framework of UEER [30,31], and made rich research advances in the areas of comprehensive measurements, identification of driving mechanisms and analysis of constraints [32].
While established research provides an important basis for understanding the environmental effects of green finance policies, there are still several gaps to be deepened on this topic. Firstly, the existing literature pays more attention to the impact of green finance on single outcome variables such as green innovation, pollution reduction or green total factor productivity, and pays relatively little attention to UEER, which can comprehensively reflect the ability of cities to ‘withstand-recover-adapt’ under the impact of ecological pressure. The impact of green finance on single outcome variables such as green innovation, pollution reduction or green total factor productivity. Despite a growing body of research, quantitative evidence on how and to what extent the GFRIPZ policy enhances UEER remains limited, and direct, systematic empirical identification is particularly scarce. Secondly, the discussion on the mechanism of policy action is still incomplete, especially in terms of key transmission pathways such as green innovation efficiency improvement and environmental regulation enhancement, which lack parallel tests and comparative analyses under a unified framework. Third, affected by regional development differences, urban scale differences and resource endowment differences, policy effects may show significant heterogeneity, but related research mostly stays in macro description or single-dimension grouping, and lacks multi-dimensional, explainable heterogeneity identification. In recent years, the Chinese government has introduced a series of policy instruments, including green credit, green bonds, and green stock indices, to support green technological innovation and green development through financial channels. Against this backdrop, systematic research on the relationship between the GFRIPZ policy and UEER helps to identify and evaluate the actual effects of the policy, thereby supporting high-quality and coordinated progress in China’s ecological and environmental governance. By revealing the heterogeneity of policy effects, such research also provides useful Chinese experience for the coordinated development of global green finance.

3. Research Hypotheses

3.1. The Impact of the GFRIPZ Policy on UEER

The GFRIPZ policy affects UEER through both internal and external mechanisms. At the internal level, the GFRIPZ policy seeks to ease resource depletion by promoting the substitution of renewable resources and cleaner production, guiding environmentally friendly investment, improving resource-use efficiency, and tightening environmental constraints on firms. These changes steer economic activity toward low-energy and low-emission development and help maintain the dynamic balance of ecosystems [33]. At the external level, the rapid expansion of green projects aligned with the Sustainable Development Goals (SDGs), together with the acceleration of large-scale investment in clean energy sources such as offshore wind and photovoltaics, is promoting industrial decarbonization and the reallocation of production factors. This process not only reduces resource intensity and exposure to environmental risks but also improves the stability and security of clean energy supply [34]. The associated capital reallocation process improves the energy mix and environmental carrying capacity by restricting financing to high-pollution industries, increasing credit and equity support for energy conservation, environmental protection and renewable energy, and linking credit quotas and interest rates to pollution levels. This process puts pressure on high-pollution firms to reduce emissions and upgrade technologies, while at the same time providing financial support for R&D, pollution control and capacity expansion in green sectors. Consequently, this process enhances cities’ capacity for self-regulation and resilience in the face of external shocks [35]. Furthermore, institutional arrangements that focus on information transparency and regional coordination, including stricter requirements for statistics, review and disclosure and cross-regional cooperation in policy, technology, finance and talent, strengthen the traceable and accountable link between capital allocation and environmental performance. This process supports the transfer of governance capacity from more developed regions, helps narrow ecological governance gaps between regions and, in turn, strengthens the overall ecological resilience of urban agglomerations at larger spatial scales [36]. Building on this theoretical foundation, this paper proposes the following core hypotheses:
Hypothesis 1: 
The GFRIPZ policy may improve UEER.

3.2. The Impact of the GFRIPZ Policy on UEER Through GIE

GIE refers to the ability to develop and apply green technologies and products that promote energy conservation, emission reduction and cleaner production, while at the same time limiting energy use and pollution discharge. The GFRIPZ policy promotes the green transformation and low-carbon upgrading of the economic system by directing financial resources to sectors with environmental benefits. Under this mechanism, the GFRIPZ policy restricts financing for high-pollution projects, tightens environmental performance standards and raises entry thresholds for new projects. These measures encourage firms to invest in energy conservation, emission reduction, cleaner production and low-carbon transformation, thereby promoting the adoption of more efficient green technologies and the optimization of production processes. Existing studies show that green credit policies can speed up the adoption of low-carbon technologies and the upgrading of pollution control facilities, thereby improving firms’ environmental performance [37]. Taken together, these changes have not only reduced emission intensity and resource use but also improved the regional energy mix and the quality of the ecological environment. They have enhanced cities’ capacity to maintain ecological functions and restore ecological balance under resource constraints, pollution shocks and environmental pressures, thereby strengthening UEER. On this basis, Hypothesis 2 is proposed:
Hypothesis 2: 
GIE mediates the relationship between the GFRIPZ policy and UEER.

3.3. The Impact of the GFRIPZ Policy on UEER Through ENV

ENV regulates resource use and emissions through institutional constraints and guidance, with the aim of curbing environmental degradation and promoting sustainable production and consumption. Its effectiveness depends on the design of institutional tools and their alignment with industrial conditions. From an institutional perspective, using market mechanisms and voluntary contractual tools, such as green certification, environmental disclosure, green performance evaluations, emissions trading and emission reduction incentives, can guide firms to internalize environmental performance as a source of competitive advantage and encourage active green upgrading. At the same time, in line with command-and-control regulation, strict boundaries and mandatory standards are imposed on high-pollution and energy-intensive activities to ensure a substantial reduction in pollution intensity. Consequently, firms gain momentum for process transformation, technological upgrading and equipment renewal, while at the same time reducing emissions and improving energy and resource efficiency. This process promotes industrial restructuring toward low-carbon, intensive and efficient patterns, reduces exposure to environmental risks at the regional scale and strengthens the carrying capacity and recovery ability of ecosystems, thereby improving UEER [38]. From the perspective of the regional innovation environment, stringent local environmental policies increase the spatial clustering of producer services and broaden the deployment of green infrastructure. By making use of specialized services and collaborative R&D, these policies lower the costs of green upgrading for firms and speed up the diffusion of green technologies, which in turn generates positive spillover effects for green economic activity and strengthens UEER [39,40]. From the perspective of societal capacity to absorb green development, ENV increases public acceptance of and willingness to pay for green products and consumption, stabilizes demand-side expectations and, in turn, encourages sustained firm investment in clean production and resource recycling. These changes increase overall resource-use efficiency, ease environmental pressures and strengthen UEER in the face of shocks [41,42]. On this basis, Hypothesis 3 is proposed:
Hypothesis 3: 
ENV mediates the relationship between the GFRIPZ policy and UEER.

4. Research Design

4.1. Model Specification

This study takes the implementation of the GFRIPZ policy as a quasi-natural experiment. It uses a DID model to estimate the effect of this policy on UEER. The following subsection presents the model specification and related estimation steps in detail.
U E E R i t = α + β D I D i t + δ C o n t r o l i t + η i + γ t + ε i t
Subscripts i and t denote the city and year, respectively. U E E R i t represents the dependent variable, urban ecological and environmental resilience. D I D i t is the core explanatory variable and corresponds to the policy indicator for the GFRIPZ policy. C o n t r o l i t denotes the set of control variables that may influence UEER. η i and γ t capture city fixed effects and year fixed effects, respectively. ε i t represents the error term. The empirical analysis focuses on the coefficient of the DID term β , which reflects the average change in UEER for pilot cities before and after the implementation of the GFRIPZ policy. A coefficient on term β that is statistically significant and positive indicates that the policy has a positive effect on improving UEER in pilot cities.

4.2. Variable Selection

Dependent variable. This study uses UEER as the dependent variable. The index is constructed from three second-level dimensions: state resilience (UES), stress resilience (UEP) and response resilience (UEM). These three second-level dimensions are further measured by 14 third-level indicators. The full indicator system is reported in Table 2. To ensure objectivity in the assessment and reduce subjective bias, this study uses the entropy weight method in StataMP 17 to determine the weights of each UEER sub-indicator.
The specific approach is as follows: First, standardize the data for each sub-indicator. Given indicators X 1 ,   X 2 , ,   X 14 ; X i = X 1 ,   X 2 , , X 14 , the standardized values for each indicator are Y 1 , Y 2 , Y 3 , respectively. Then,
For positive indicator:
Y i j = X i j m i n X m a x X m i n X
For negative indicator:
Y i j = m i n X X i j m a x X m i n X
Among these, X i j denotes the original value of sample i for indicator j, while maxX and minX denote the maximum and minimum values of that indicator, respectively.
The information entropy of the j indicator is
H j = k i = 1 n f i j l n ( f i j )
Here, f i j represents the proportion of the i sample in the j indicator, k = 1 l n ( n ) , and n is the number of samples.
Information utility value for the j indicator;
D j = 1 H j
Calculate the weights for each indicator;
W j = D j j = 1 m D j
In the formula: W j represents the weight for the j indicator; m denotes the total number of indicators.
Finally, calculate the composite score for all indicators in the i city in the t year, which constitutes the city’s UEER index result. The UEER index is defined as:
U E E R i t = j = 1 m W j × f i j ( i = 1,2 , , n ; j = 1 ,   2 , ,   m )
Core explanatory variable. The policy variable DID is a time-varying indicator for the implementation of the GFRIPZ policy. A value of 1 indicates that the city is included in the pilot in the year of policy implementation and in all subsequent years, whereas a value of 0 indicates that the city is not a pilot city in that year. Because Chongqing Municipality was only designated as a pilot area in 2022 and the available statistical data are incomplete, it is excluded from the sample. Similarly, Changji Prefecture is excluded from the analysis because serious data gaps make it unsuitable for statistical use. This study uses 2017 and 2020 as the main years of policy implementation. Cities designated as GFRIPZ pilot zones are assigned to the treatment group, while all other cities constitute the control group.
Control variables. To reduce potential confounding factors that may affect the research results and to keep consistency with existing studies, this study includes the following variables in the control set, based on the relationship between the GFRIPZ policy and UEER: economic development level (PG), fiscal self-sufficiency rate (FS), research investment intensity (SI), education expenditure share (EI), number of patent authorizations (PT), financial development level (FD), industrial structure characteristics (IND) and the digital financial inclusion index (DFI). Economic development level is measured by the ratio of regional GDP to the permanent resident population. The government’s fiscal self-sufficiency rate is measured by the ratio of fiscal expenditure to fiscal revenue. Research investment intensity is measured by the share of research funding in regional GDP. Educational investment is expressed as the ratio of education expenditure to regional GDP. The number of patent authorizations is used as a key indicator of regional innovation capacity. The level of financial development is represented by the ratio of deposits to loans of financial institutions. Industrial structure characteristics are represented by the ratio of the output value of the secondary industry to that of the tertiary industry. The digital financial inclusion index is measured by the 2021 Digital Inclusive Finance Index released by Peking University.
Mechanism variable. Green innovation efficiency. This study first builds an evaluation index system for GIE (Table 3). The system uses human resources, capital and energy inputs as input indicators. Green development performance is measured by expected output indicators, including green industrial value added, reductions in energy consumption per unit of GDP and the level of clean energy use. Environmental losses, such as carbon emissions and industrial wastewater discharge, are treated as non-expected output indicators. This framework allows GIE to be assessed quantitatively at the city level. To enable a rigorous comparison of efficiency levels across cities, this study uses the Super-SBM model for measurement. Compared with traditional DEA models, the Super-SBM model takes into account both expected and non-expected outputs within a slack-based framework. This approach helps to correct the bias in traditional DEA related to the choice of direction and angle, and it also allows efficient decision-making units with an efficiency value of 1 to be further distinguished and ranked. As a result, it improves the accuracy of the efficiency estimates [43,44]. Building on this foundation, this study further examines whether the GFRIPZ policy improves overall UEER by raising GIE.
m i n   θ * = 1 + 1 m i = 1 m s i x i 0 t 1 1 q + h ( r = 1 q s r + y r 0 t + k = 1 h s k b k o t )
s . t . { x i 0 t t = 1 T j = 1 , j 0 n λ j t x i j t s i , i = 1,2 , , m y r 0 t t = 1 T j = 1 , j 0 n λ j t y r j t + s r + , r = 1,2 , , q b k 0 t t = 1 T j = 1 , j 0 n λ j t b k j t s k , k = 1,2 , , h λ j t 0 ( j ) , s i 0 ( r ) , s k 0 ( k )
In the formula, θ * denotes the GIE value; λ denotes the weight of the decision-making unit; s i , s r + and s k denote the slack variables for inputs, expected outputs and non-expected outputs; x i t ,     y r t , and b k t represent the green innovation input, expected output and non-expected output of the decision-making unit in period t; n denotes the total number of decision units; m, q and h represent the numbers of input, expected-output and non-expected-output indicators, respectively; and T denotes the total number of years in the study period.
Environmental regulation intensity. Based on text analysis of provincial government work reports, environment-related terms are identified and quantified, and their frequency and share in the text are calculated as proxy variables for government attention to and policy orientation toward environmental governance. Weighted ENV indices are then constructed for prefecture-level cities by combining these proxies with the share of heavy industry in each city. The related terms include environmental protection, pollution control, pollution, energy consumption, emission reduction, wastewater discharge, ecology, green, low-carbon, air, sulfur dioxide, carbon dioxide, PM1, PM2 and other similar expressions. Building on this foundation, this study further examines whether the GFRIPZ policy can raise ENV and, in doing so, strengthen cities’ resilience and adaptive capacity under environmental governance and resource constraints, thereby improving UEER.

4.3. Sample Selection and Data Sources

Given adjustments to some prefecture-level administrative divisions and data gaps, this study excludes Hong Kong, Macao and Taiwan, as well as a small number of prefecture-level cities, and finally selects 279 prefecture-level cities as the sample. The data cover the period from 2011 to 2022 and are mainly drawn from the China Urban Statistical Yearbook, China Energy Statistical Yearbook, China Urban Construction Statistical Yearbook, China Environmental Statistical Yearbook and China Ecological Environment Status Bulletin. The dataset is supplemented by official statistical bulletins released by local governments, and a small number of missing values are filled in by interpolation. Table 4 reports the basic descriptive statistics for the core variables.

5. Empirical Results Analysis

5.1. Benchmark Regression Results

Table 5 reports the benchmark regression results. Column (1) reports the results without fixed effects. Column (2) adds both city fixed effects and year fixed effects. Column (3) further includes the full set of control variables. Column (4) uses heteroskedasticity-robust standard errors for estimation and reports the preferred specification. In the four models, the DID coefficients on the GFRIPZ policy variable are 0.050, 0.046, 0.047 and 0.047, respectively. All of these coefficients are positive and statistically significant at the 1% level, and their magnitudes change very little when fixed effects and control variables are added. This suggests that the estimated effects are robust to alternative model specifications. Overall, the implementation of the GFRIPZ policy has significantly improved UEER, providing empirical support for Hypothesis 1.

5.2. Robustness Tests

5.2.1. Parallel Trend Test

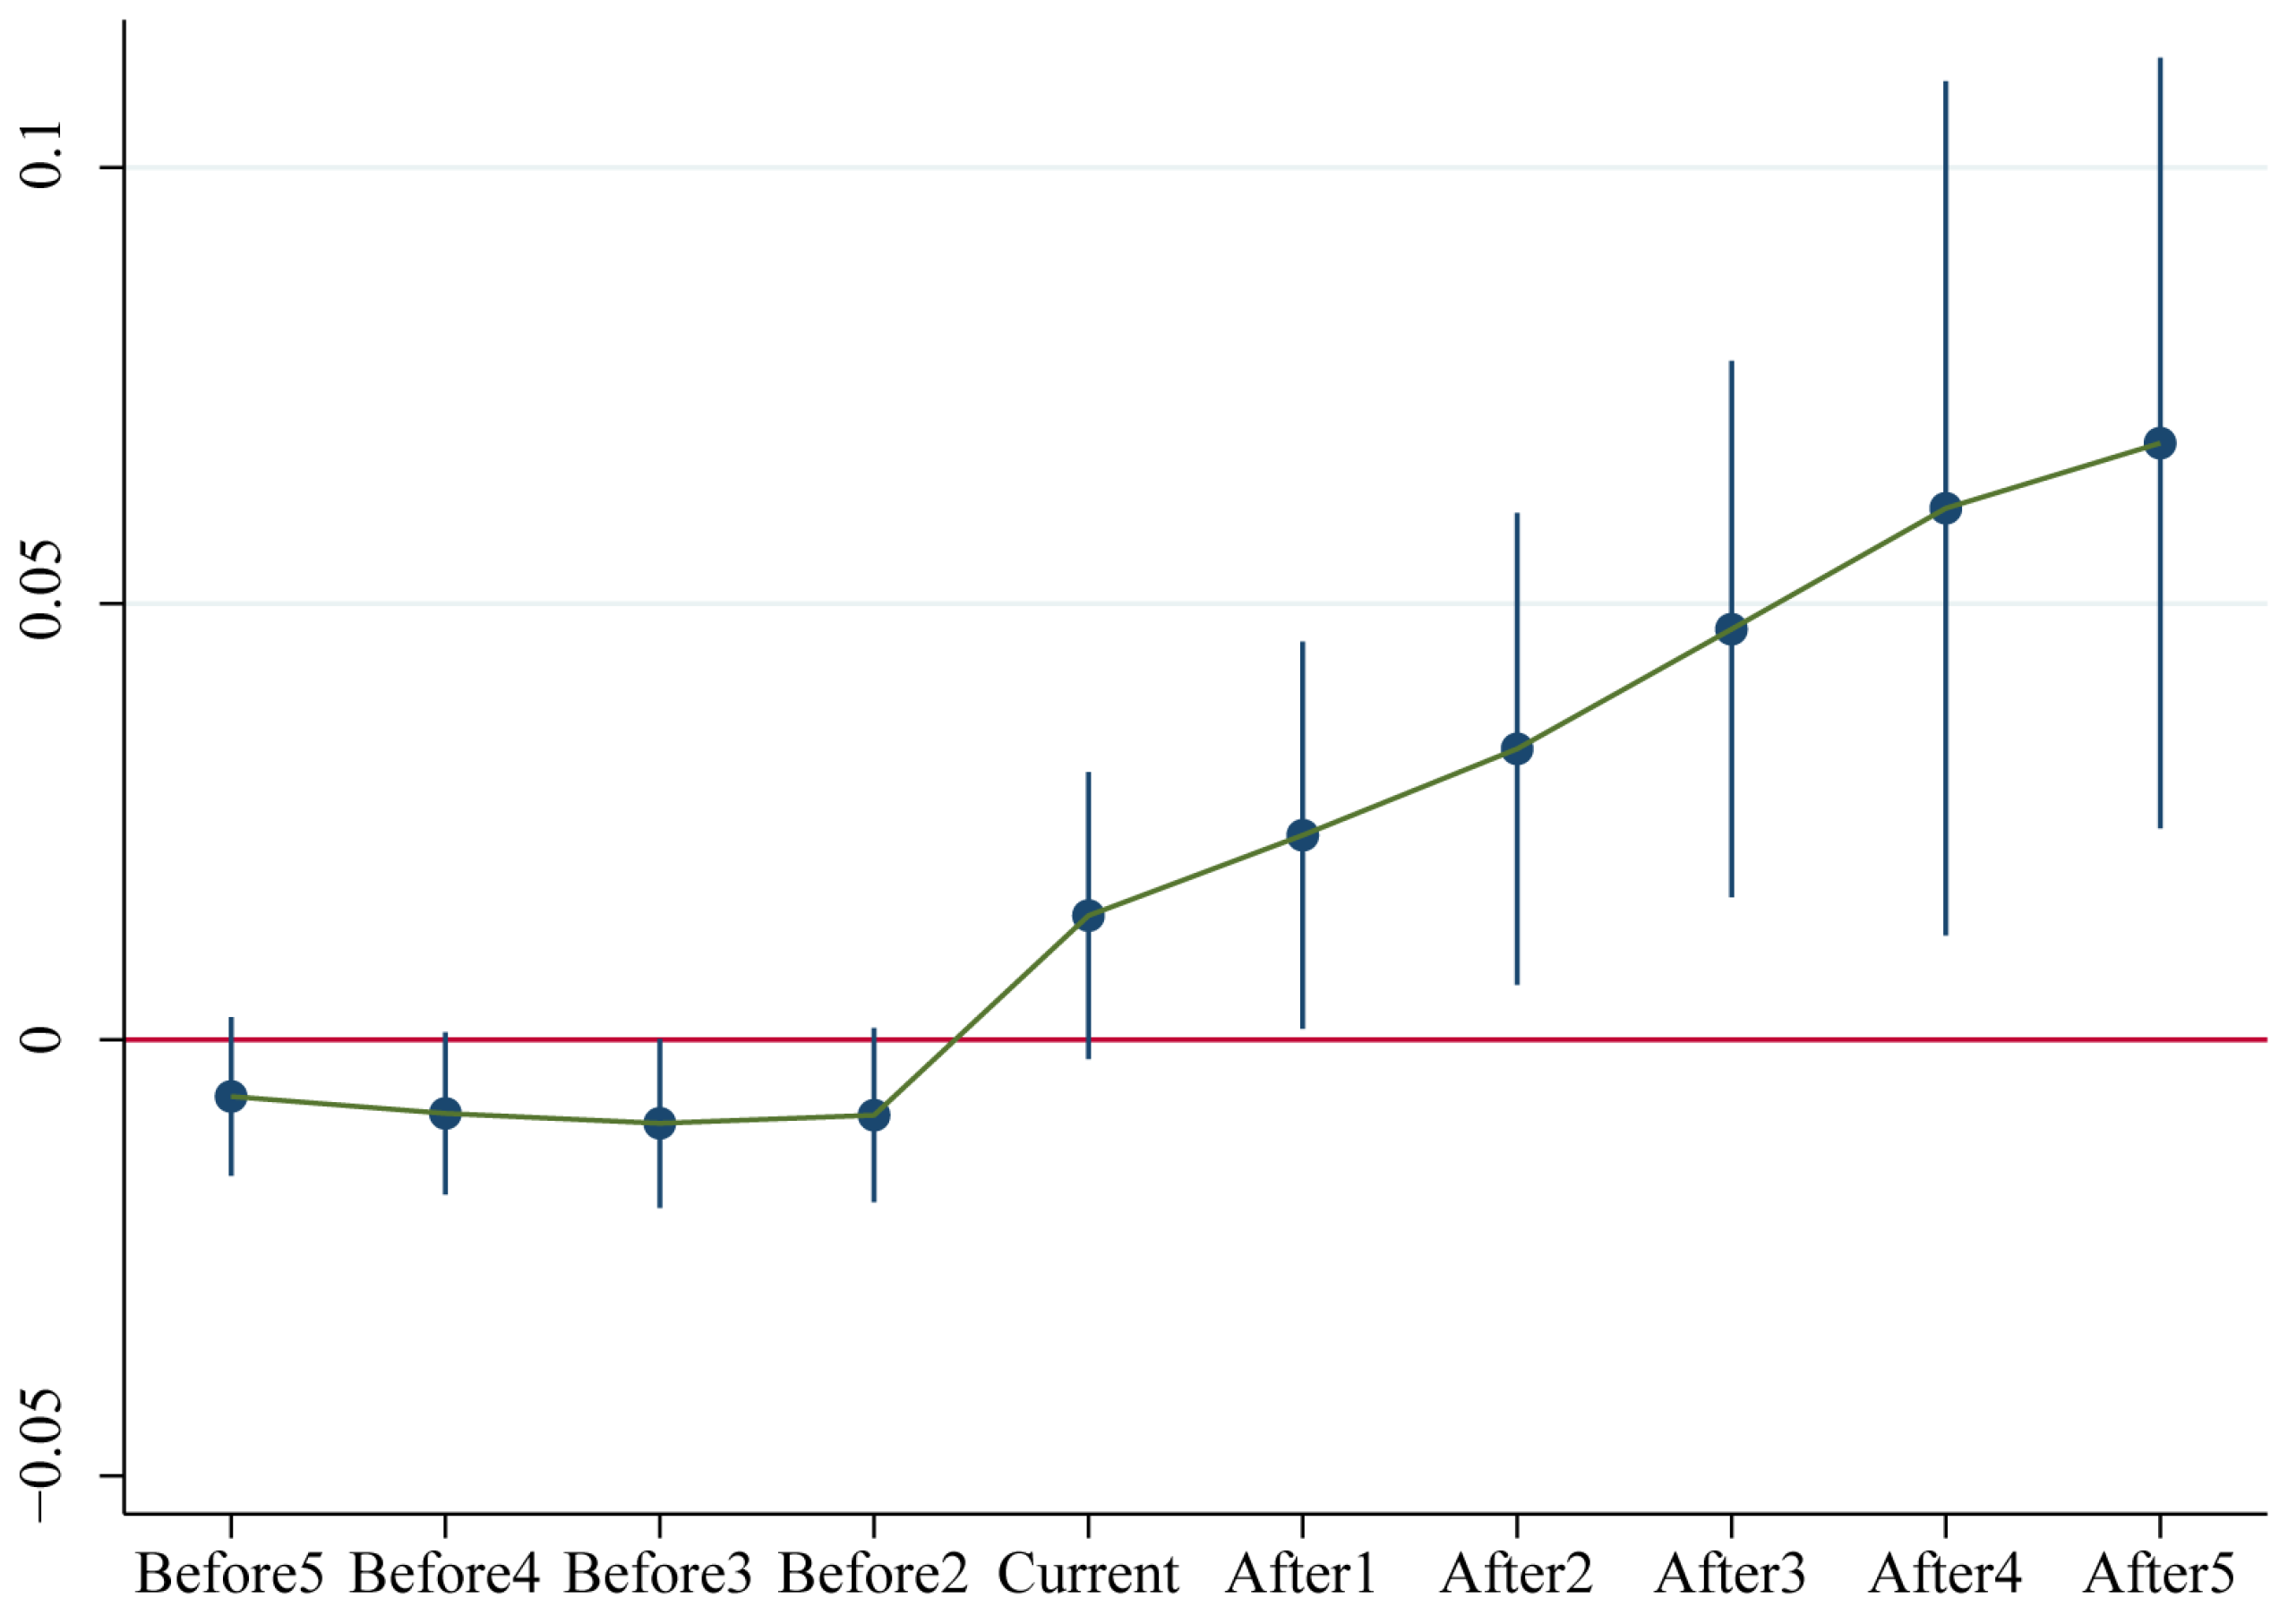
When applying the DID model to evaluate the impact of the GFRIPZ policy, it is first necessary to test whether pilot and non-pilot cities satisfy the parallel trend assumption. Specifically, before the policy intervention, changes in UEER in the two groups should follow a broadly similar trend, and only after the policy is implemented should UEER in pilot cities gradually diverge from that in the control group. To this end, this study estimates an event-study specification based on relative years around the policy implementation:
U E E R i t = α + β n 5 5 D I D i t n + δ C o n t r o l i t + η i + γ t + ε i t
The variable D I D i t n denotes the relative time dummy for year n before or after the policy implementation. For non-pilot cities, this variable always takes the value 0. The year preceding the policy implementation (n = −1) serves as the baseline period. To avoid multicollinearity with the year dummy variables, the dummy for the baseline year is not explicitly included in the equation. The definitions of the other variables are consistent with those in Equation (1).
Figure 2 reports the estimation results for each period. The horizontal axis shows the relative policy year, the points denote the coefficient estimates, and the red line indicates the corresponding confidence interval. It can be seen that the estimated coefficients for all periods before the policy implementation are not statistically significant and their values are generally close to zero. This indicates that there is no clear difference in the trend of UEER between the pilot group and the control group, thus supporting the parallel trend assumption. After the policy was implemented, most coefficients became positive and showed a gradual upward trend. This suggests that UEER in pilot cities continued to increase relative to non-pilot cities following the introduction of the GFRIPZ policy, which is consistent with the benchmark regression results.

5.2.2. Placebo Test

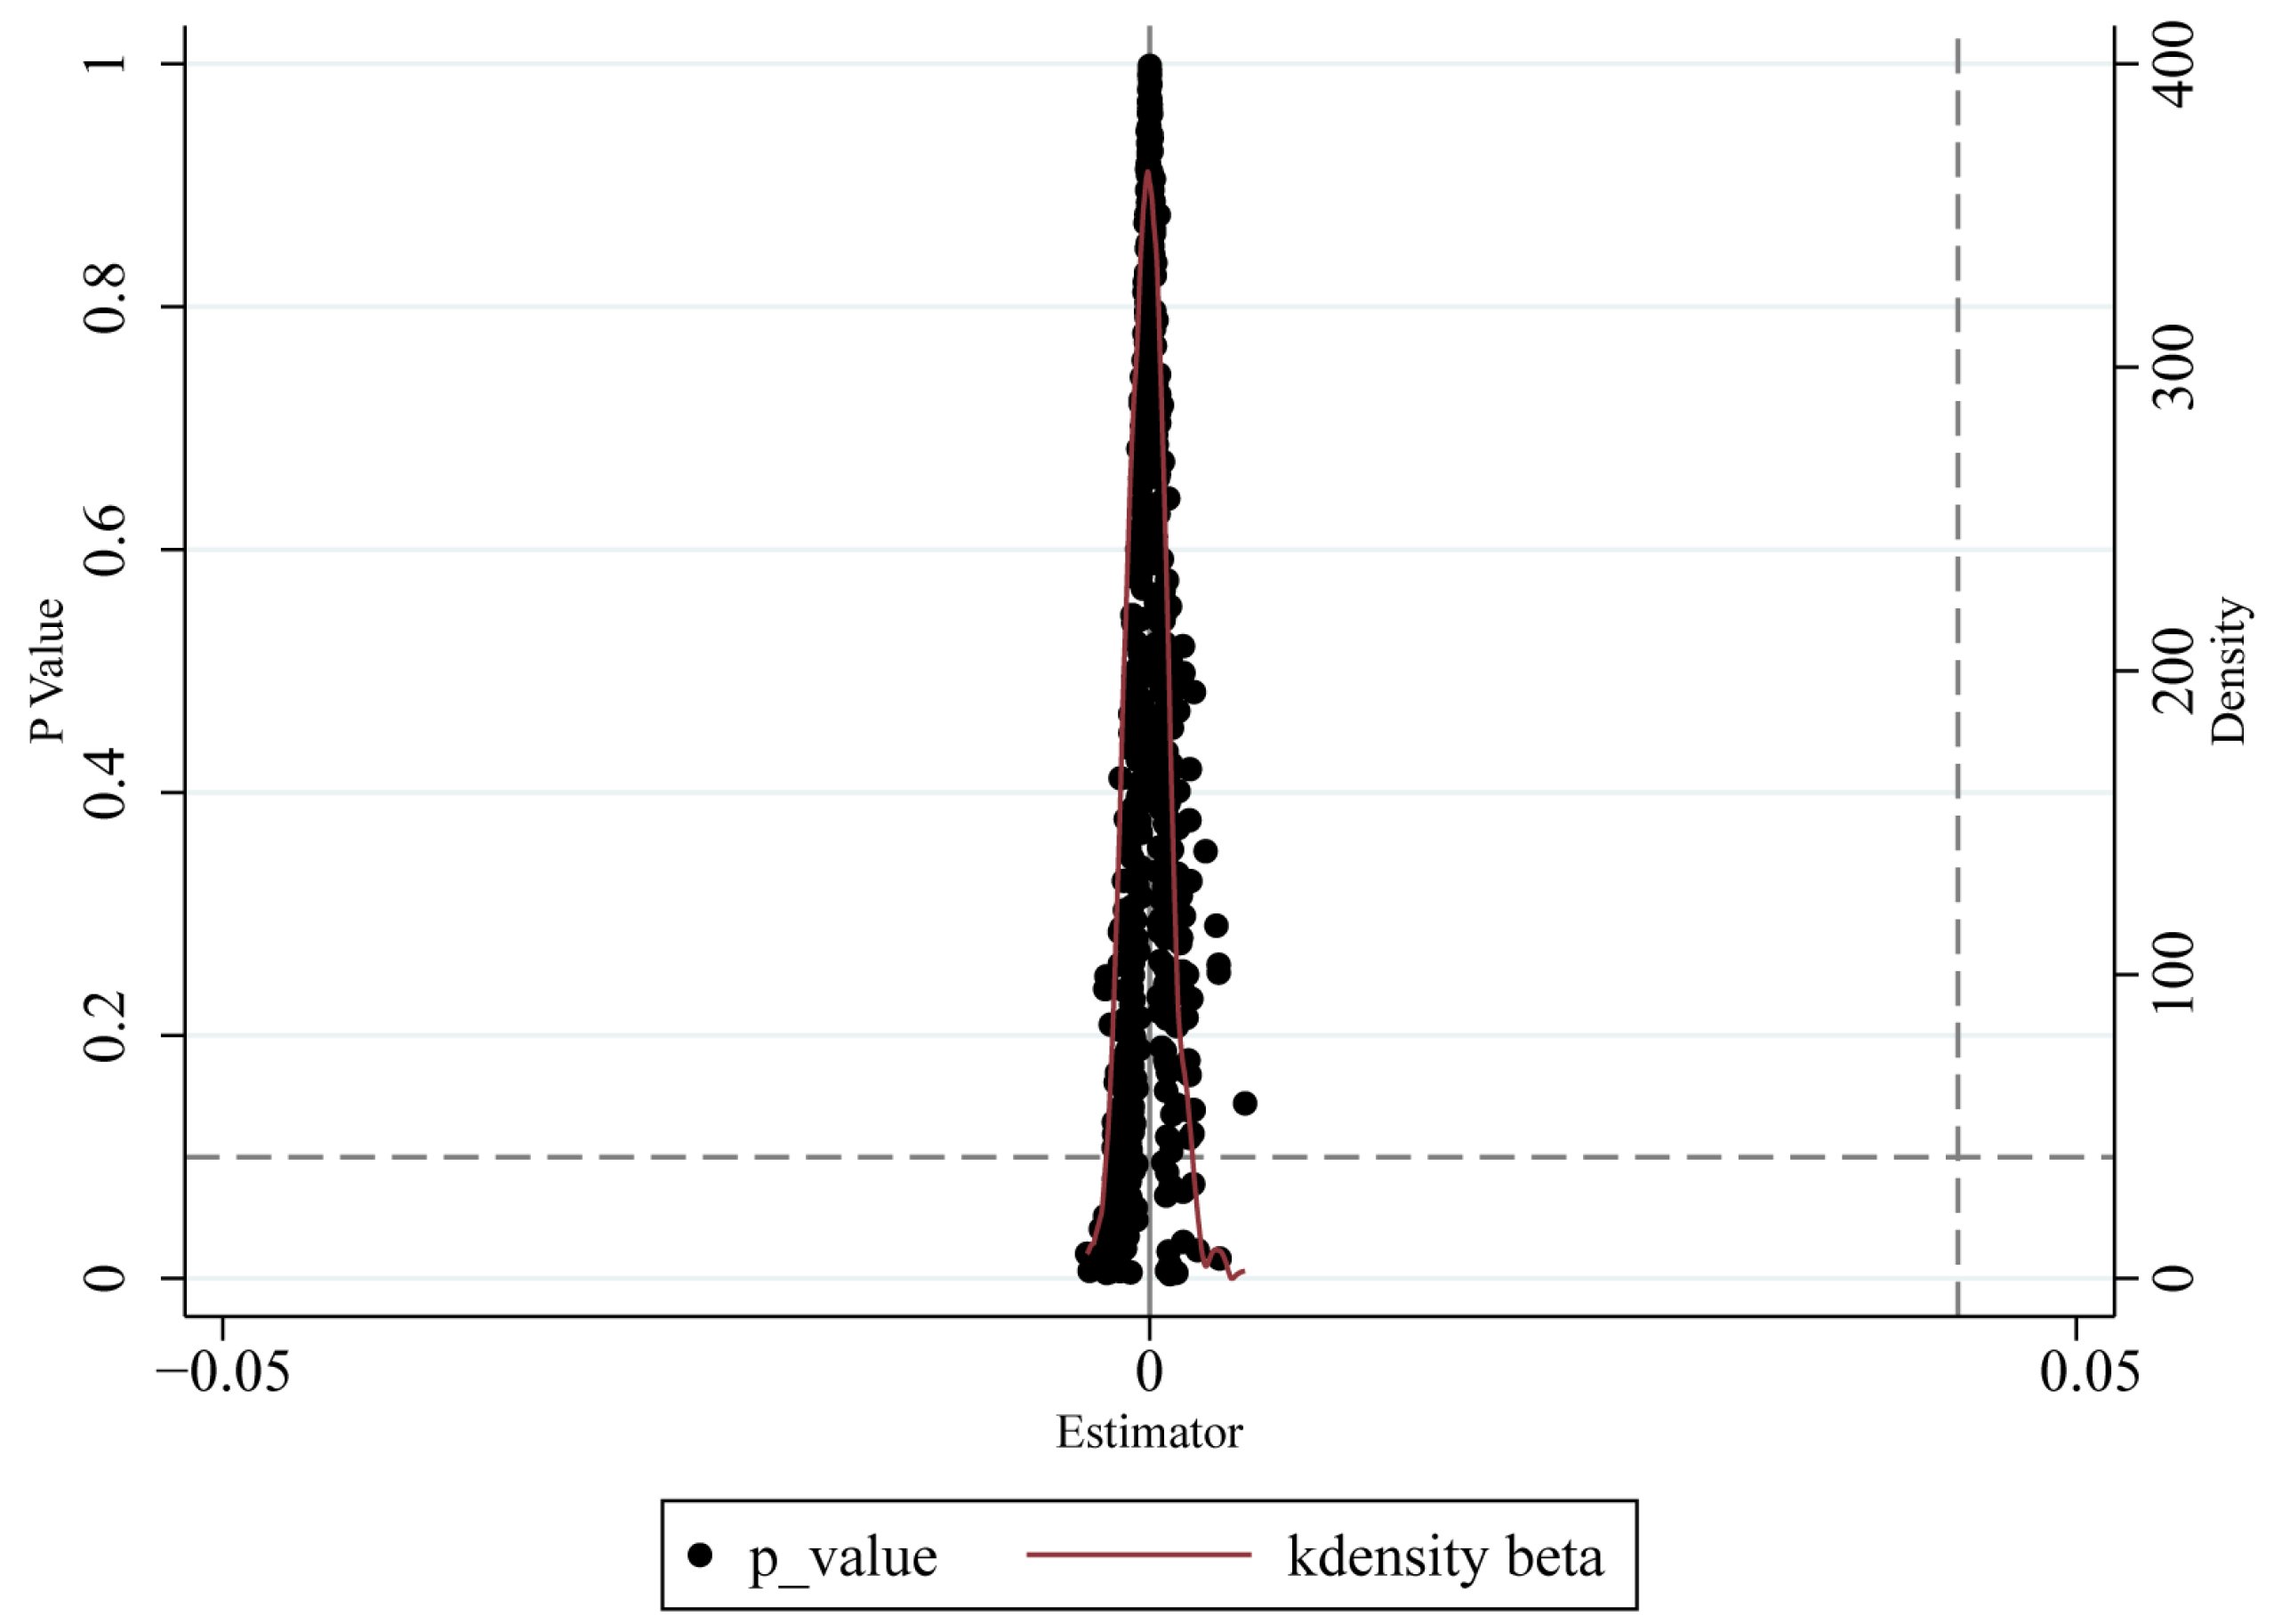
Because the formation of UEER and the implementation of the policy are jointly affected by many observable and unobservable factors, the benchmark DID model cannot fully account for all relevant variables and may still omit some important factors. To test whether the estimated policy effects arise from the actual pilot arrangements rather than from random factors, this study conducts a placebo test. Specifically, 8 cities are randomly selected from the full sample and treated as “virtual pilot”, while the original sample structure is kept unchanged. This procedure is repeated 500 times, and in each iteration a set of DID coefficients and the corresponding p-values is estimated. This generates an empirical distribution of the policy effect under random assignment. If statistically significant coefficients close to the benchmark results appear frequently even under random assignment, this suggests that the original estimates may be confounded by uncontrolled factors.
Figure 3 presents the results of the placebo test. The horizontal axis shows the estimated coefficients of the dummy policy variable, and the vertical axis shows the corresponding p-values. The solid red line depicts the kernel density of the estimated coefficients, and the dashed line marks the coefficient of the true policy effect from the baseline regression (approximately 0.04). As can be seen, the coefficients obtained under random assignment are concentrated near zero and are associated with relatively high p-values. Almost none of the simulated estimates are close to the benchmark coefficient. It can therefore be concluded that policy effects do not arise systematically under random assignment. The estimated coefficient for the actual GFRIPZ policy lies in the right tail of the simulated distribution, which provides further evidence that the GFRIPZ policy helps to improve UEER in pilot cities.

5.2.3. PSM-DID

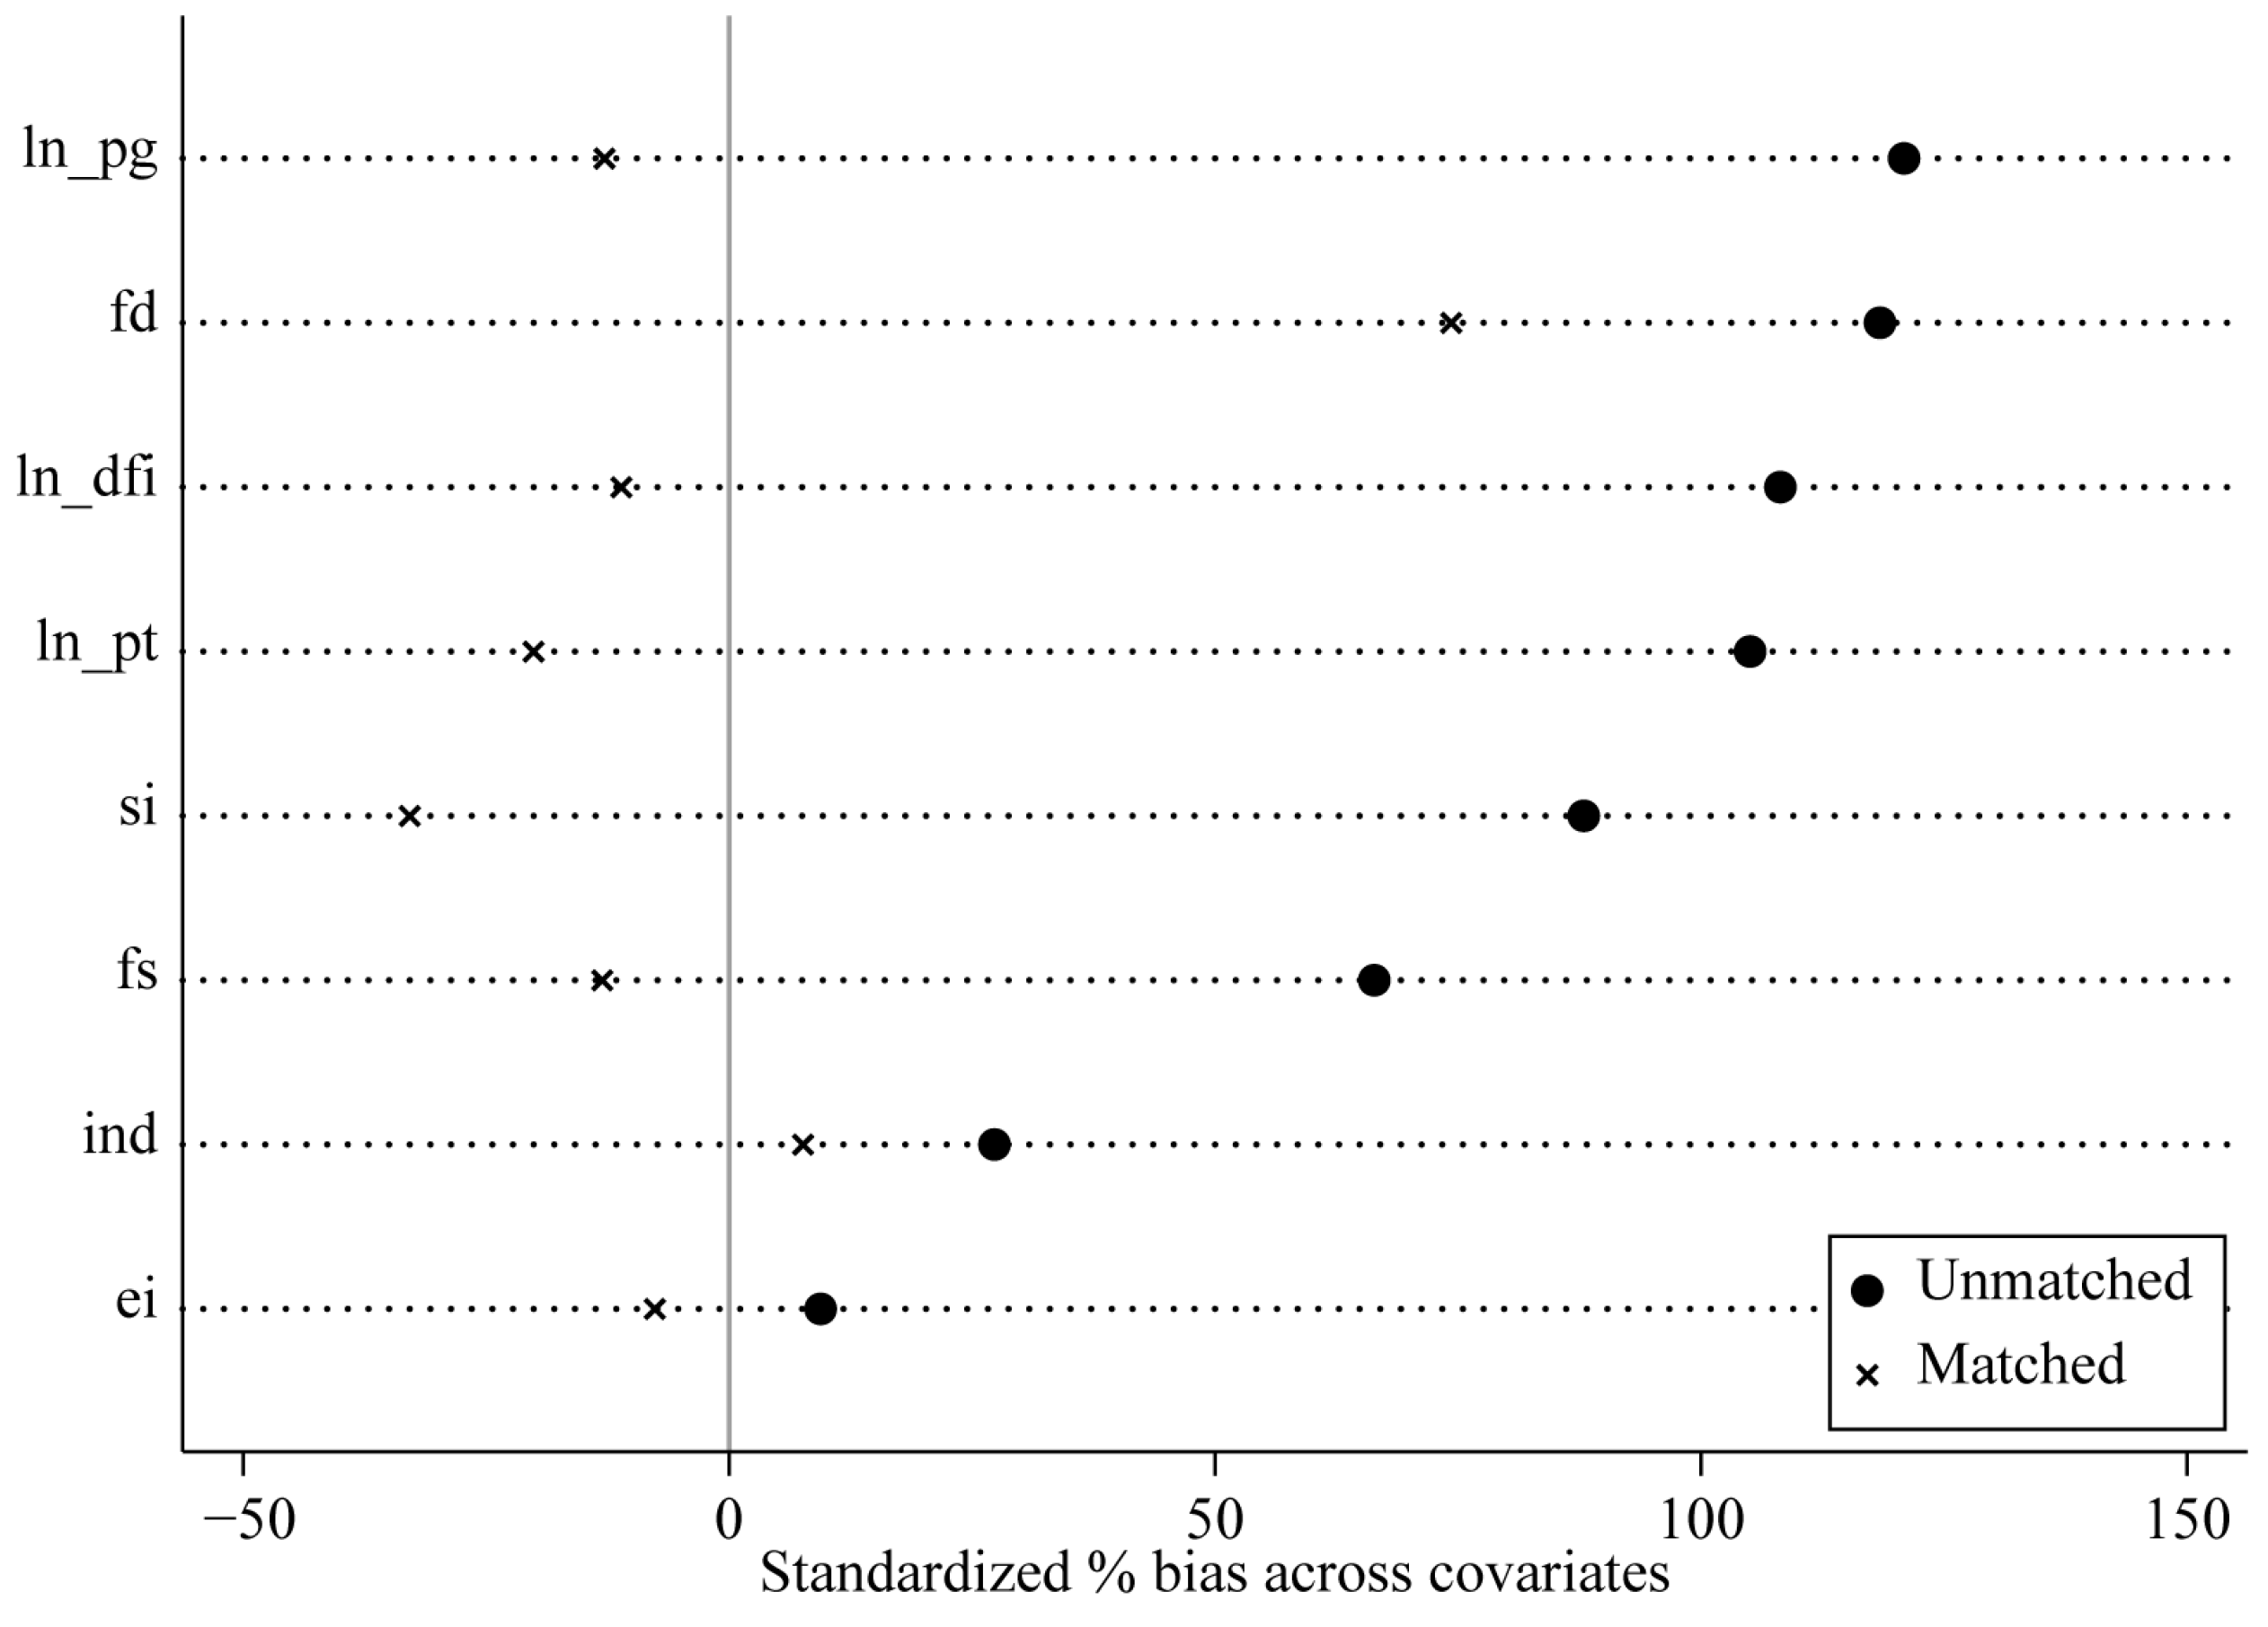
The traditional DID model may suffer from sample selection bias when systematic differences exist between the treatment and control groups. To address this issue, this study applies a PSM-DID approach built on the benchmark DID specification. A 1:1 nearest-neighbor caliper matching method is used, in which a treated city is matched to a control city only when the distance in covariates between them does not exceed a pre-set caliper. As shown by the balance test in Figure 4, the standardized differences for most covariates fall below 10% after matching, indicating that the overall matching quality is generally satisfactory. Column (1) of Table 6 reports the regression results for the matched sample. The coefficient on the policy variable remains positive and statistically significant and is consistent with the baseline regression results. These results indicate that, after controlling for observable differences in covariates, the positive effect of the GFRIPZ policy on UEER persists, which supports the robustness of the DID estimates.

5.2.4. Excluding Outliers

Municipalities directly under the central government and provincial capitals have higher administrative rank, and the implementation of the GFRIPZ policy in these cities shows distinct features in terms of green development performance. To reduce the influence of administrative rank and policy heterogeneity on the estimation results, this study excludes these cities and re-estimates the regressions. As shown in column (2) of Table 6, at the 1% significance level, the sign and statistical significance of the DID coefficients remain largely unchanged, which further supports the robustness of the model estimates.

5.2.5. Replacing the Dependent Variable

To test whether the conclusions hold across different dimensions of resilience, this study further replaces the dependent variable with urban economic resilience (RES) and urban climate resilience (UCR), respectively. These two indices are constructed from dimensions such as economic structure and innovation capacity, as well as exposure, sensitivity and adaptability, and their weights are determined using the entropy method. The regression results are reported in columns (3) and (4) of Table 6. The DID coefficients are both positive and statistically significant at the 5% level, and their signs are consistent with those in the baseline results. These findings indicate that the GFRIPZ policy exerts a consistent positive effect on different types of urban resilience.

5.2.6. Handling Extreme Values

To reduce potential bias in the regression estimates caused by a small number of extreme observations, this study applies two-sided 1% and 5% tail trimming to the main continuous variables and re-estimates the regressions on the adjusted sample. The results show that the estimated coefficients on the policy variable in columns (5) and (6) of Table 6 remain positive and statistically significant at the 1% level. This suggests that the benchmark regression results remain valid after mitigating the influence of extreme values.

5.2.7. Controlling for Other Policy Variables

To prevent other policies from confounding the identification of the effects of the GFRIPZ policy, this study adds three policy variables that are closely related to carbon emission reduction as control variables in the baseline model. Based on official policy documents and the list of pilot cities, dummy variables for these policies are constructed at the city-year level. CARBON1 denotes the carbon emission trading pilot program. It is set to 1 when a city is included in the pilot program and is in the implementation phase in year t; otherwise, it is 0. CARBON2 denotes the low-carbon city development policy. It is set to 1 when a city is designated as a national low-carbon city pilot and remains in the pilot phase in year t; otherwise, it is 0. CARBON3 denotes the Carbon Peaking Action Plan. It is set to 1 when a city has formulated and is advancing its carbon peaking action plan by year t; otherwise, it is 0. Including CARBON1, CARBON2 and CARBON3 in the model helps to control for the impact of other major carbon reduction policies on UEER, so that the DID estimates more closely reflect the net effect of the GFRIPZ policy itself.
Table 7 reports the regression results after incorporating the three policy dummy variables described above. It can be seen that, under all three specifications, the DID coefficient on the GFRIPZ policy variable remains positive and statistically significant at least at the 5% level. This indicates that, even after controlling for CARBON1, CARBON2 and CARBON3, the positive effect of the GFRIPZ policy on UEER remains robust. In contrast, the estimated coefficients for CARBON1 to CARBON3 are all statistically insignificant, which suggests that, within the sample period of this study, the marginal impact of these three types of carbon reduction policies on UEER is relatively limited. Moreover, they do not systematically amplify or weaken the estimated effect of the GFRIPZ policy. Overall, the DID coefficient on the GFRIPZ policy remains statistically significant and has the same sign after controlling for other carbon reduction policies, which further supports the reliability and robustness of the baseline results.

5.2.8. Addressing Endogeneity

The formation of UEER is influenced by many factors, including market conditions, infrastructure and governance capacity. The GFRIPZ policy may also be affected by a city’s development base and ecological governance needs, which can create potential endogeneity between the policy and UEER. To address this concern, this study constructs two types of instrumental variables and estimates the model using instrumental-variable two-stage least squares (IV-2SLS).
First, the interaction between terrain undulation and the level of economic development is used as the first instrumental variable (IV1). Terrain undulation reflects variation in surface topography within a city. More complex terrain increases differences in infrastructure construction costs and in the conditions for energy transmission and distribution, which in turn affects clean energy development, the spatial layout of green industries and the scope for applying related green financial instruments. As a result, terrain undulation is correlated with the intensity of the GFRIPZ policy. By contrast, UEER is mainly expressed through socio-economic processes such as pollution control, industrial restructuring and spatial planning. After controlling for city and year fixed effects, the direct effect of topography itself on UEER is likely to be limited, which supports the exogeneity of IV1. Because terrain data are cross-sectional, they are multiplied by the time-varying level of economic development to obtain an instrumental variable that captures both temporal variation and policy relevance. Second, the interaction between the 1984 postal and telecommunications infrastructure and the previous year’s number of internet users is used as the second instrumental variable (IV2). Historical postal and telecommunications networks shaped the spatial pattern of information dissemination and factor mobility. When combined with the contemporary scale of internet use, this interaction captures differences in cities’ digital infrastructure and information accessibility. Because instruments such as green credit and digital finance rely heavily on information and data infrastructure, this variable is plausibly correlated with the intensity of the GFRIPZ policy. By contrast, the spatial distribution of postal and telecommunication facilities in 1984 shows strong path dependence. After controlling for city fixed effects, most of its direct influence on current ecological governance performance is absorbed. In addition, interacting this historical variable with the current number of internet users introduces time variation, which helps the instrument to better satisfy the relevance and exogeneity conditions required for identification.
Table 8 presents the IV-2SLS results based on the instrumental variables described above. When IV1 is used, the first-stage coefficient on the GFRIPZ policy strength is 0.029 and is statistically significant at the 1% level. The KP-LM statistic is 12.91 (p = 0.00), and the Wald F-statistic is 30.63, indicating strong instrument relevance and good model identification. In the second stage, the coefficient on the DID term for UEER is 0.120 and remains statistically significant at the 1% level. When IV2 is used, the first-stage regression is also statistically significant. The second-stage DID coefficient is 0.033 and is statistically significant at the 1% level. Overall, the estimation results under both sets of instrumental variables show the same sign and a consistent direction. After controlling for endogeneity, the positive effect of the GFRIPZ policy on UEER persists.

5.2.9. Heterogeneity-Robust Staggered DID Estimators

The policy identification framework in this paper is essentially a staggered asymptotic double-difference design, given that the GFRIPZ is characterized by batch entry over the sample period. Under the staggered implementation scenario, if the treatment effects are heterogeneous across entry batches and exposure durations, the traditional two-way fixed-effects double differencing may result in an unexplained weighted average effect due to the participation of the treated group in constituting the control for part of the time period, which may weaken the clarity of causal identification. To further improve the robustness of the identification results under heterogeneous treatment effects, this paper conducts supplementary estimation and dynamic tests while keeping the baseline setting unchanged.
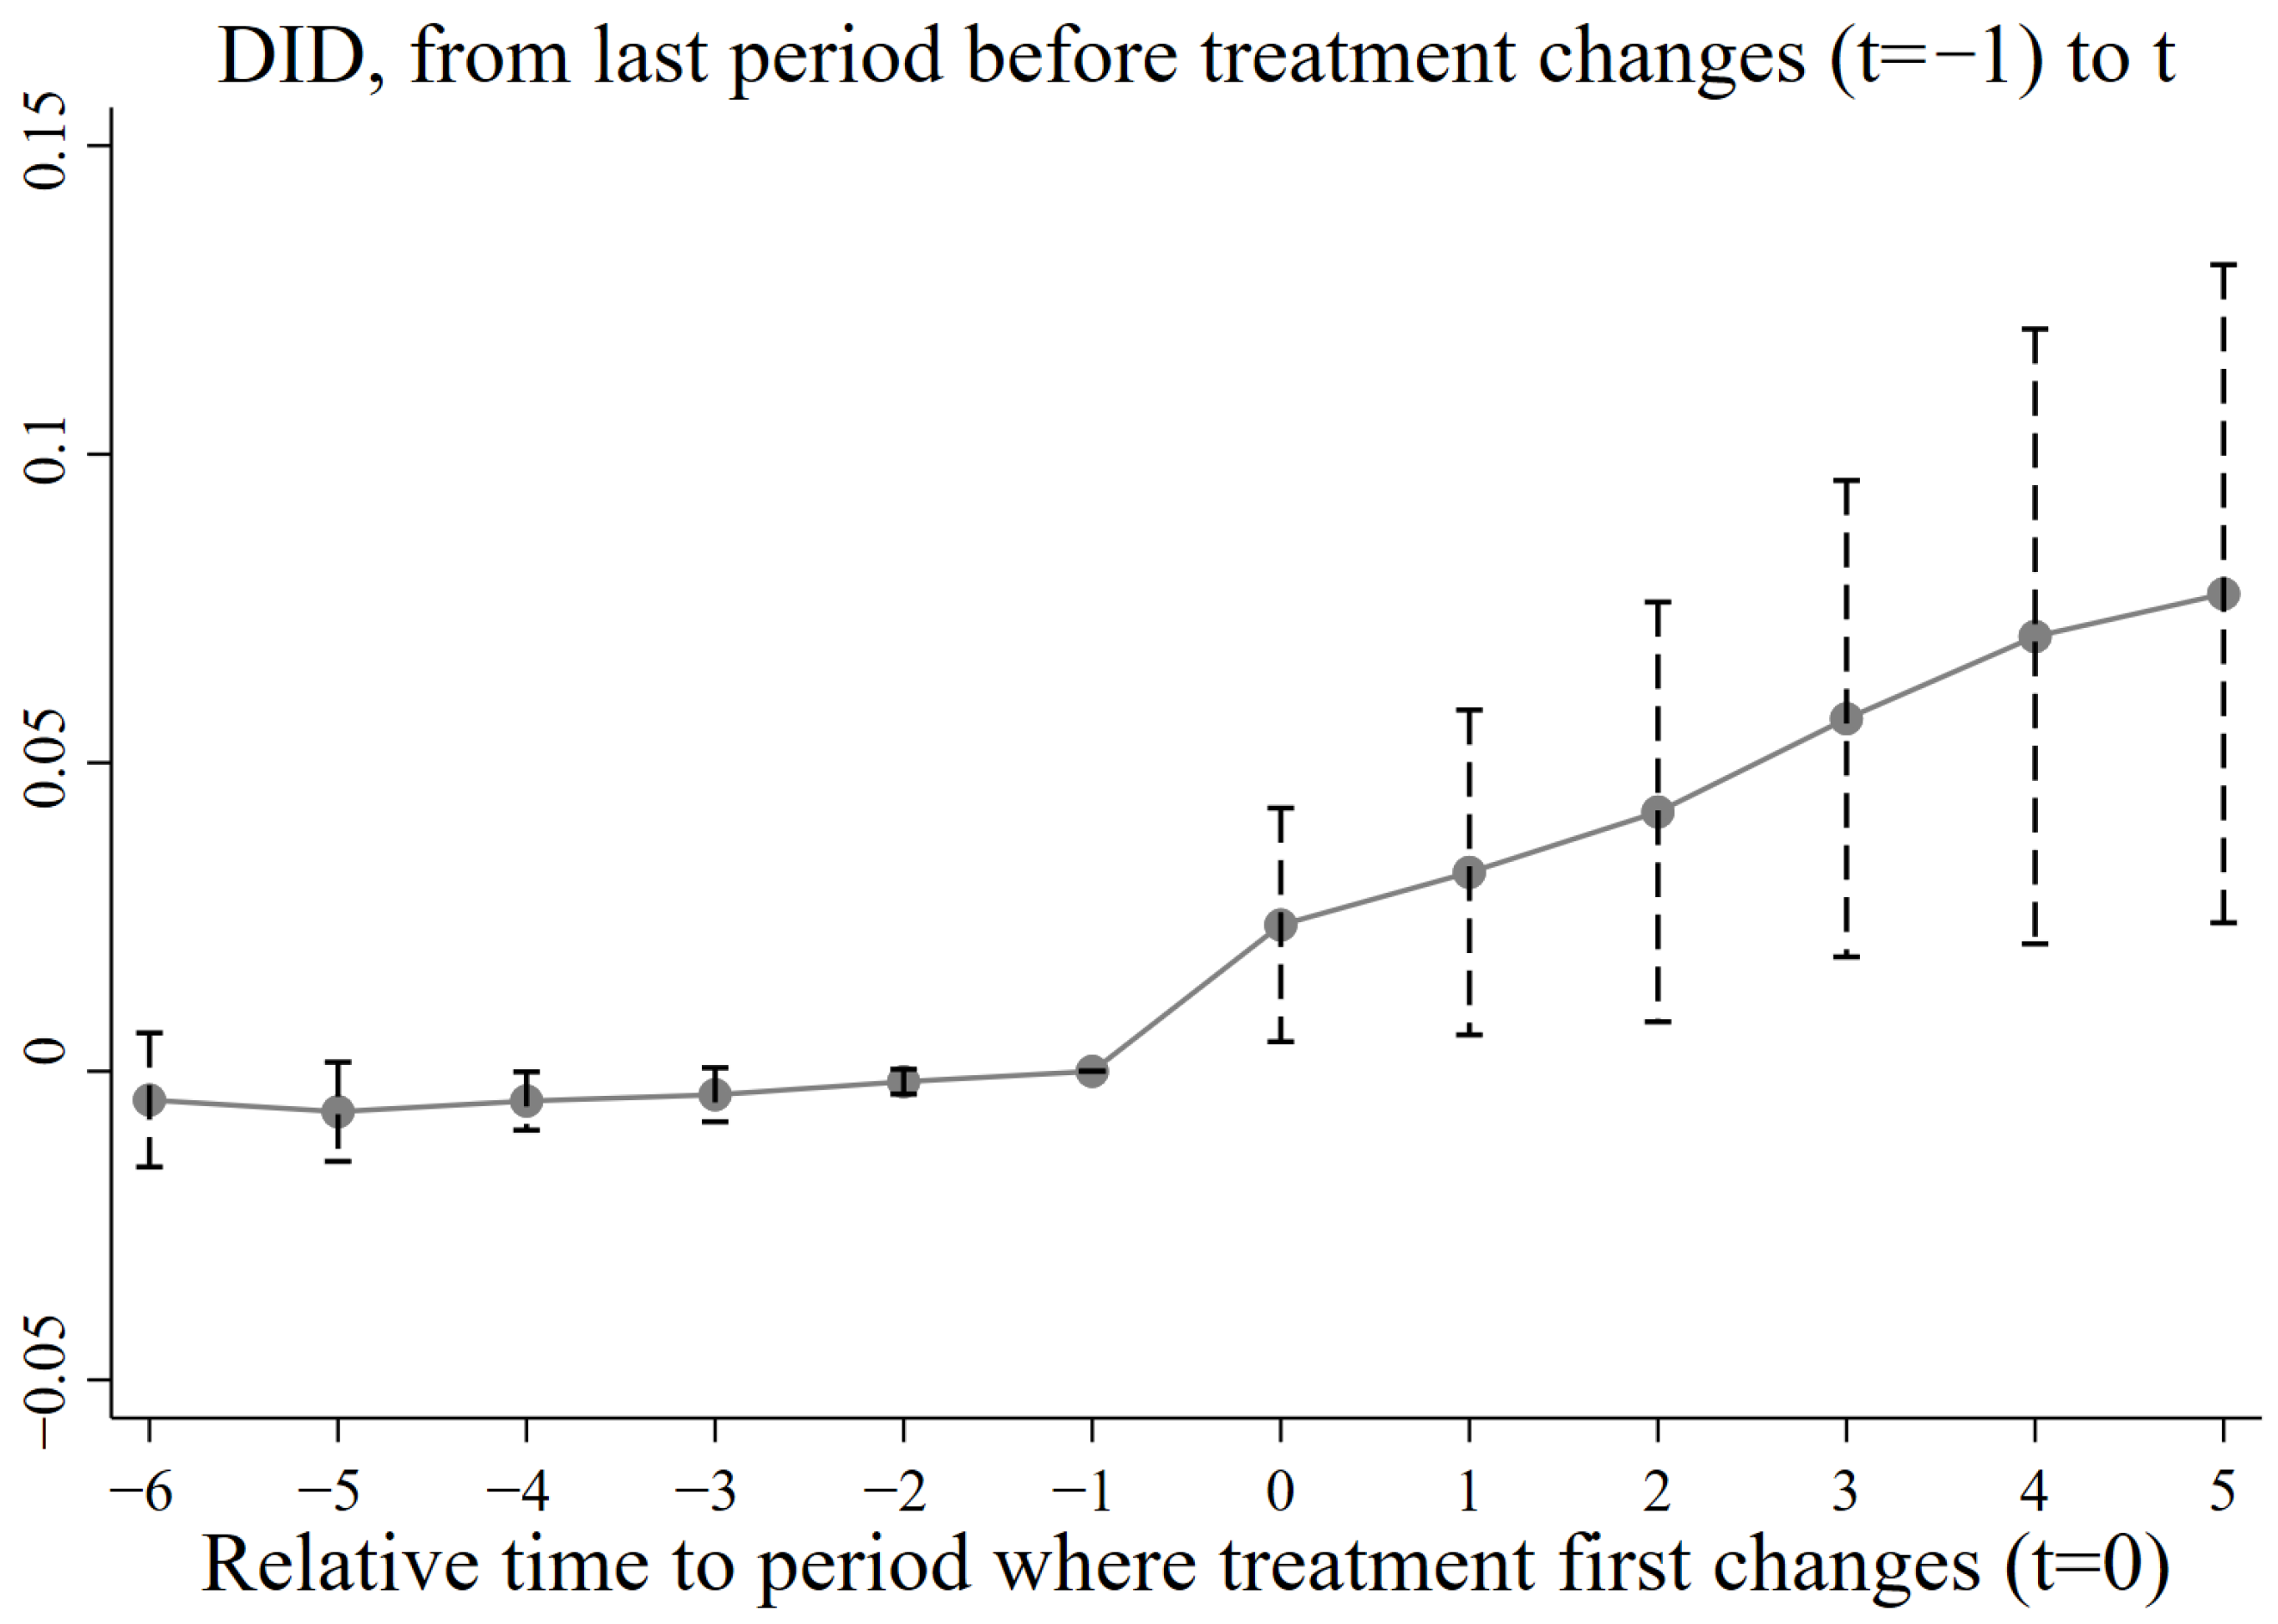
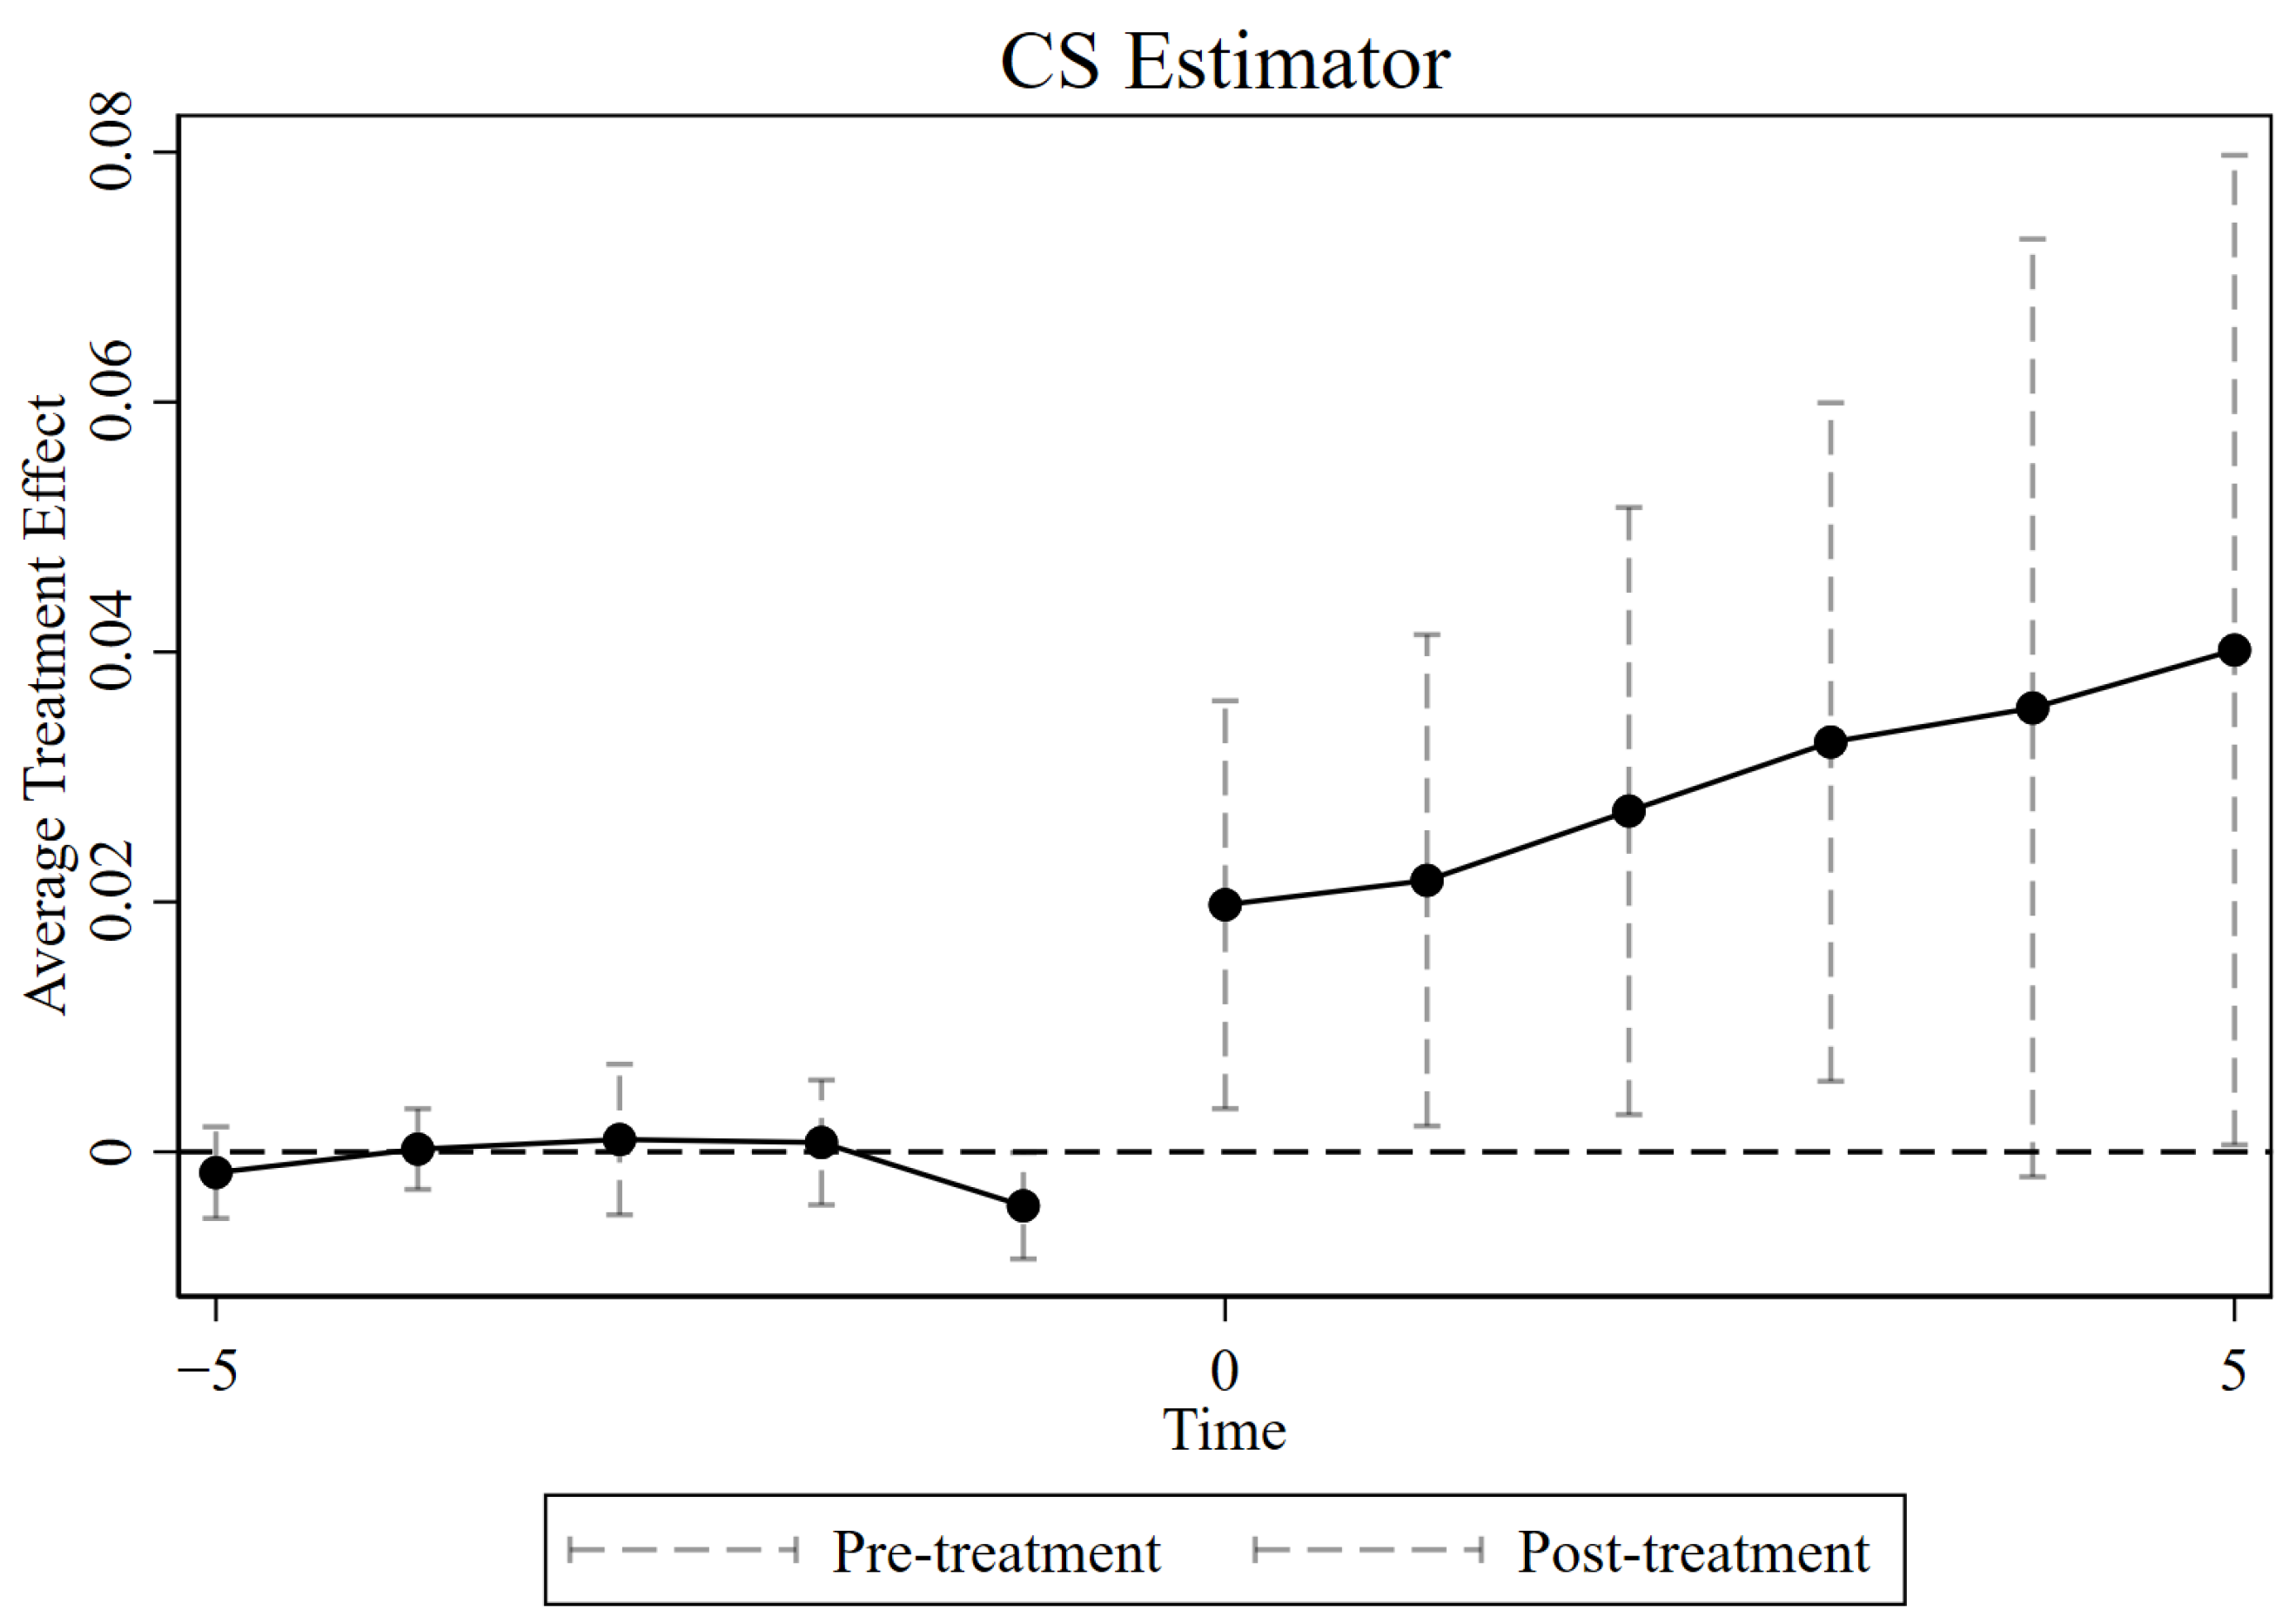
First, the CS estimator of the average treatment effect over the grouping period proposed by Callaway and Sant’Anna [45] is used. The method identifies the policy effect in the entry batch and time dimensions separately, using the untreated cities as the control group, and further weights the estimates across batches and time points to aggregate the overall impact of the policy over the sample period and its dynamic path over the length of exposure. Figure 5 shows that the estimates for the periods before the policy implementation are close to zero and do not show a systematic prior trend; after the policy implementation, the policy effect of UEER is significantly positive, and presents a dynamic feature of gradual enhancement with the prolongation of the policy exposure time.
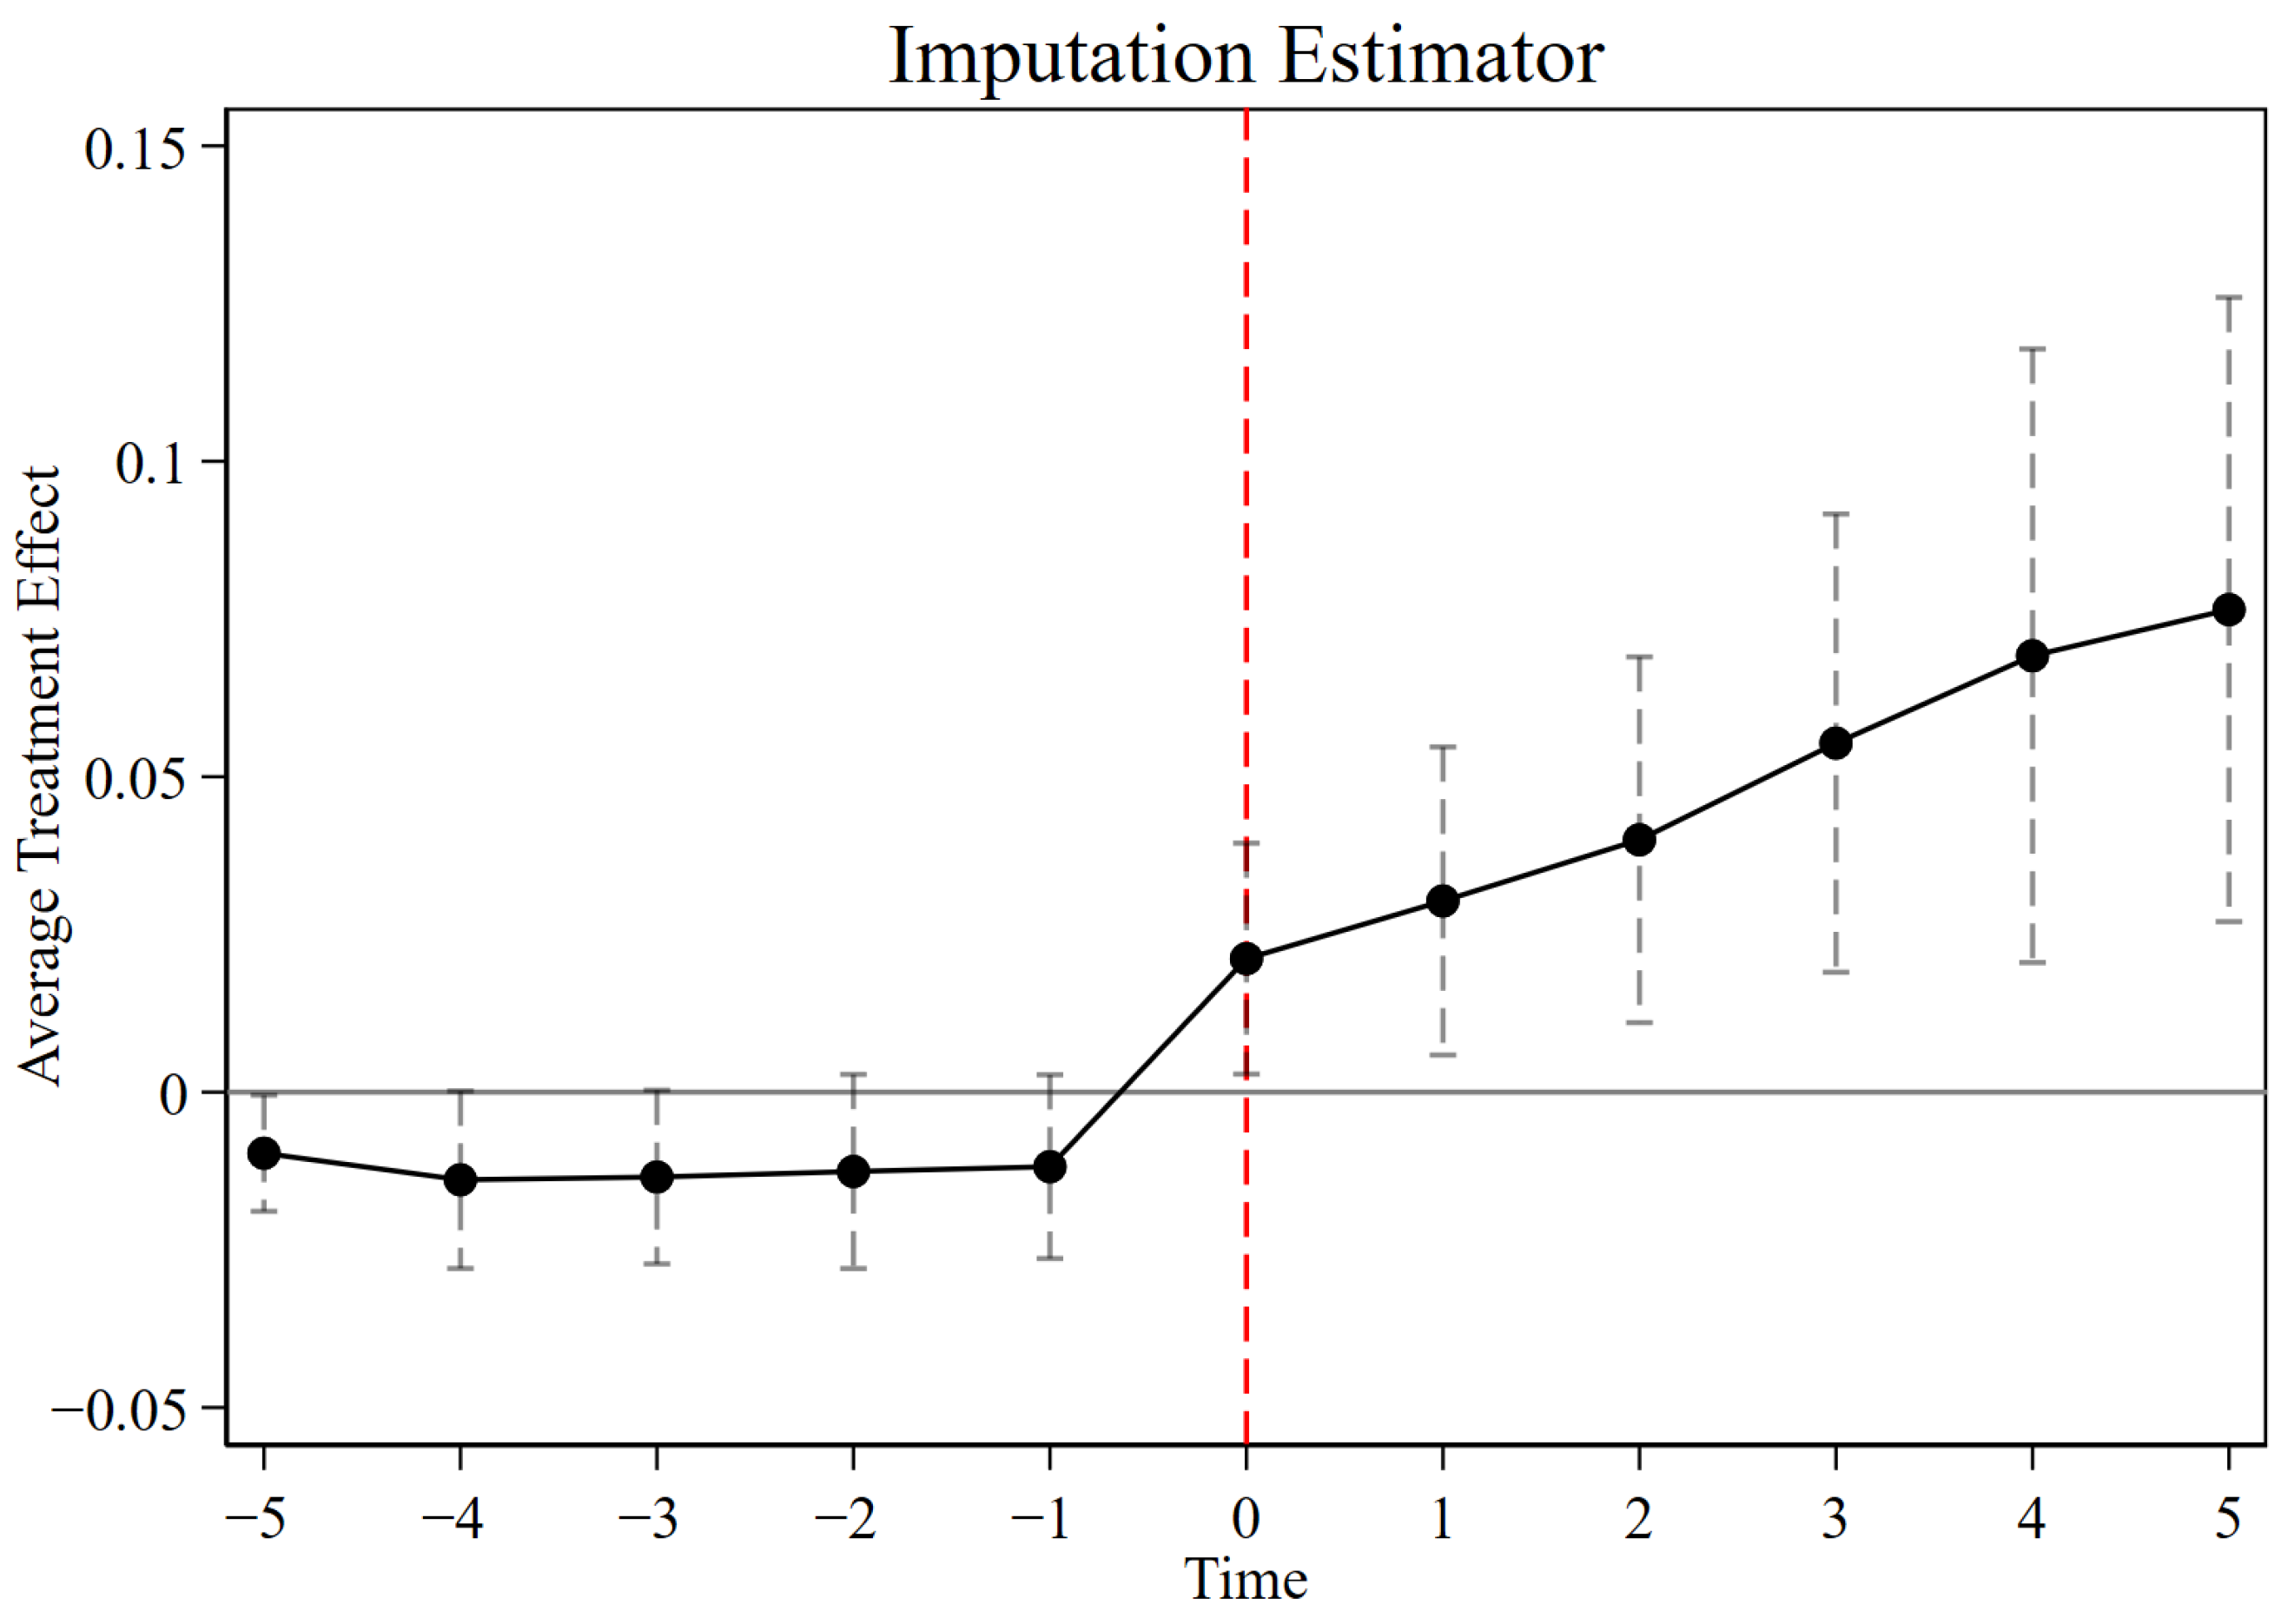
Secondly, the interpolation method of Borusyak, Jaravel and Spiess is used [46]. This method estimates the counterfactual paths on the untreated samples first and then uses the ‘actual outcome–counterfactual outcome’ to obtain the treatment effect, thus avoiding the contamination problem that may occur in TWFE under interleaved processing. The event study plot of the interpolation method (Figure 6) also shows that the pre-treatment effect is insignificant and the post-treatment effect is significantly positive and increasing period by period.
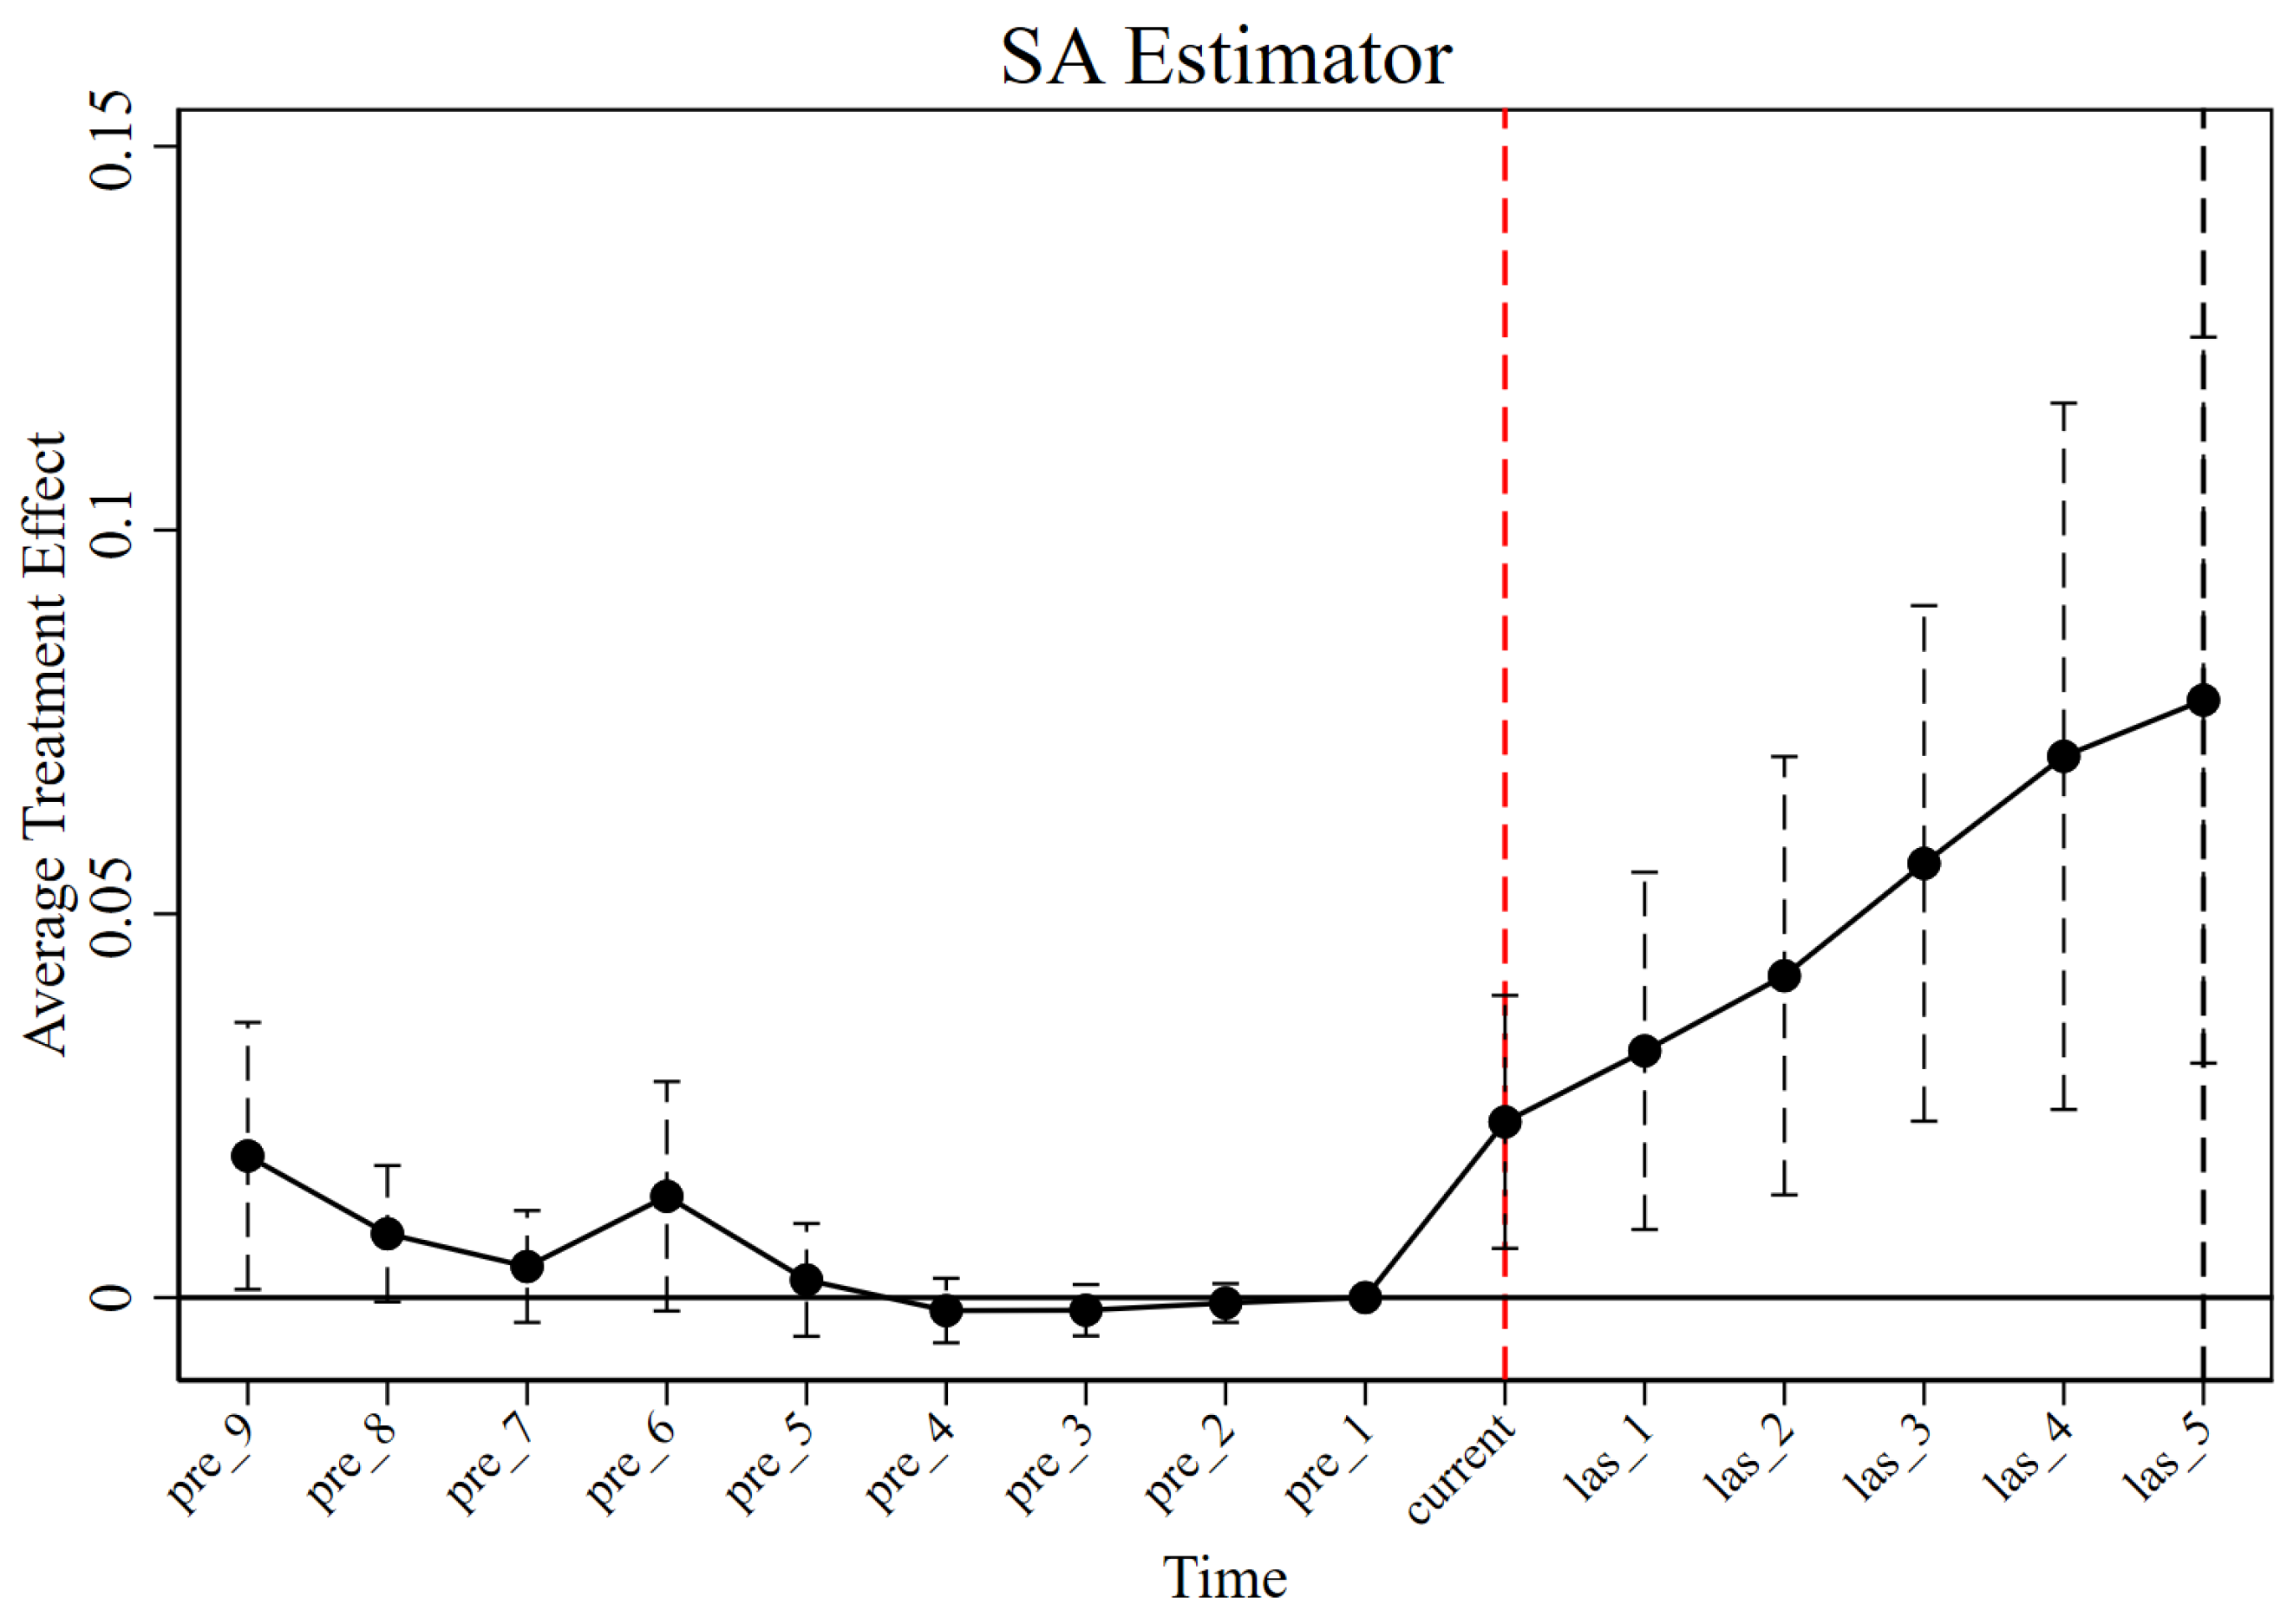
Thirdly, the SA estimator is studied using the heterogeneity robust event study proposed by Sun and Abraham [47]. The method effectively mitigates the possible cross-checking bias of TWFE dynamic regression in the case of staggered implementation and heterogeneity in treatment effects by constructing and weighting the interaction terms related to entry batches and aggregating them. The SA estimation is further validated: Figure 7 shows that the dynamic coefficients basically fluctuate around the value of zero before the implementation of the policy, and that after the implementation of the policy, the uplift effect of the UEER is significantly positive and After the policy is implemented, the enhancement effect of UEER is significantly positive and continues to expand with the increase in policy exposure time, which is a significant and time-intensive feature.
Fourth, the robust DID estimator proposed by de Chaisemartin and D’Haultfœuille [48] is used, which provides a clearer and more interpretable estimate of the policy effect even in the presence of heterogeneity in the treatment effect. Figure 8 also shows that the treatment effect is positive after the policy is implemented, and the dynamic path is highly consistent with the three types of estimates described above.
In summary, the dynamic paths and directions obtained by the four types of methods are consistent. The overall estimates of the periods before treatment are close to zero and do not show a systematic prior trend, while the policy effect of UEER is significantly positive after treatment and shows a gradual enhancement with the prolongation of the policy exposure time, which further strengthens the credibility of this paper’s causal explanation of the GFRIPZ’s enhancement of UEER at the methodological level.

6. Mechanism Analysis

The benchmark regression and robustness tests presented above indicate that the GFRIPZ policy can significantly improve UEER. A key question that follows is through which mechanisms this effect is primarily transmitted. To address this question, this study conducts mechanism tests from the perspectives of ENV and GIE and specifies the following model.
M i t = β + β 1 D I D i t + δ C o n t r o l i t + η i + γ t + ε i t
Among these, M i t denotes the mediation variables, namely ENV and GIE. The remaining model specifications are consistent with Model (1).
Column (1) of Table 9 reports the effect of the GFRIPZ policy on ENV. The DID coefficient is 0.021 and is statistically significant at the 1% level, indicating that the policy significantly improves ENV in pilot cities. Existing studies also show that ENV is an important channel through which UEER can be strengthened. Using data from 2007 to 2021, Lu et al. find that different combinations of environmental regulation policies have markedly different effects on UEER, and that some policy portfolios have a significant positive impact [49]. Shao et al. further point out that, by strengthening regulation and enforcement, improving environmental infrastructure and implementing multi-stakeholder collaborative governance, it is possible to curb pollution while at the same time enhancing resource-use efficiency and system resilience, thereby improving UEER [50]. Based on Table 9 and the related literature, ENV can be regarded as a key transmission channel through which the GFRIPZ policy enhances UEER, providing empirical support for Hypothesis 3.
Column (2) of Table 9 reports the effect of the GFRIPZ policy on GIE. The DID coefficient is 0.011 and is statistically significant at the 5% level, indicating that the policy helps to improve GIE in pilot cities. Previous studies show that improving GIE enhances cities’ performance in pollution control and resource use, thereby strengthening UEER. Wang et al. show that green innovation can lower pollution intensity by improving production processes and upgrading technology, increase the efficiency of energy and resource use, promote cleaner production and energy substitution, and thereby strengthen ecosystem resilience [51]. At the same time, easing financing constraints for green R&D and improving the arrival rate and utilization efficiency of funds help to promote collaborative innovation and technology transfer between universities and enterprises. This allows green funds to be more concentrated on projects with clear emission reduction outcomes, thereby lowering the cost per unit of emission reduction. Based on the regression results in Table 9, the GFRIPZ policy can also be regarded as improving UEER by enhancing GIE, which provides empirical support for Hypothesis 2. In summary, the GFRIPZ policy affects UEER through two channels, strengthening ENV and enhancing GIE, thereby strengthening UEER. This provides empirical support for Hypotheses 2 and 3.

7. Further Analysis

7.1. Geographic Heterogeneity

Chinese cities exhibit significant disparities in economic development, climatic conditions and geographical patterns, and these regional characteristics in turn influence the effectiveness of the GFRIPZ policy. Table 10 divides the sample into three major regions (eastern, central and western) according to geographic location and estimates separate regressions for each group. The results show that the DID coefficient for eastern cities is 0.048, while the coefficients for central and western cities are 0.044 and 0.043, respectively. All three coefficients are positive and statistically significant at the 1% level, and the estimate for eastern cities is slightly larger. This suggests that the GFRIPZ policy has a stronger positive effect on UEER in eastern cities.
This is because eastern cities have higher levels of financial development and stronger governance capacity, which makes instruments such as green loans and green bonds more readily available. Information disclosure and environmental enforcement are also relatively well regulated, which allows capital constraints to more effectively influence firms’ decisions on emission reduction investment and risk management. Meanwhile, eastern cities have a more robust industrial structure and a stronger innovation base, with a higher share of advanced manufacturing and modern service industries. They also have greater capacity in scientific research and technology transfer, together with relatively strong infrastructure and public services, which creates favorable conditions for the diffusion and combined application of green technologies. Taken together, these factors make the GFRIPZ policy more likely to translate into higher resource allocation efficiency and lower pollution and carbon intensity in eastern cities, thereby generating a larger marginal improvement in UEER.

7.2. Heterogeneity in Urban Scale

The effect of the GFRIPZ policy on UEER varies significantly across different city sizes. According to the Notice on Adjusting Urban Size Classification Standards and taking into account the characteristics of the sample, this study classifies cities into three types, namely megacities, medium-sized cities and small cities. Separate regressions are estimated for each category, and the results are reported in Table 11. The DID coefficient for megacities is 0.069, while the coefficients for small and medium-sized cities are 0.048 and 0.029, respectively. All three coefficients are positive and statistically significant at the 1% level, and they show a clear gradient pattern: the effect is strongest in megacities, followed by small cities, while medium-sized cities display a relatively weaker effect. This suggests that the marginal effect of the GFRIPZ policy varies across cities of different sizes.
This disparity is related to the financial, innovation and governance foundations of cities of different sizes. Megacities have clear advantages in financial resources, innovation capacity and public governance. With a high density of financial institutions, ample supplies of green loans and green bonds, close cooperation between research institutes and leading enterprises, and relatively standardized environmental information disclosure and enforcement, these cities are better able to translate policy signals into technological upgrading and cleaner production, thereby raising the efficiency of capital use. Small cities may have relatively limited financial and innovation resources, but shorter decision making chains and fewer implementation steps allow projects to move forward more quickly. Limited green funds can be concentrated on key areas and weak links, which makes it easier to generate marginal improvements in governance outcomes. In contrast, medium-sized cities are in a transitional stage of industrial upgrading and factor reallocation. On the one hand, they face pressure to transform existing manufacturing industries, and on the other hand their capacity to support high end services and high tech industries is still developing. Their financial and innovation conditions lie between the two extremes, so green capital is more likely to be dispersed across different sectors, which weakens the effectiveness of the policy.

7.3. Heterogeneity of Resource Endowments

According to the classification criteria in the National Sustainable Development Plan for Resource Based Cities and taking into account the characteristics of the sample, this study classifies cities into resource-based and non-resource-based types. Separate regressions are estimated for each category, and the results are reported in Table 12. The DID coefficient for resource-based cities is 0.041, while the coefficient for non-resource-based cities is 0.049. Both coefficients are positive and statistically significant at the 1% level, indicating that the GFRIPZ policy improves UEER in both types of cities, with non-resource-based cities showing a stronger marginal effect.
This difference can be understood from three perspectives. First, in terms of industrial structure, resource-based cities rely mainly on mining and raw material processing. Capital and employment are locked into energy intensive production processes, and most green funds are used to retrofit existing facilities. As a result, the shift toward green technology and the reallocation of production factors proceeds at a relatively slow pace. In non-resource-based cities, the service sector and high tech manufacturing account for a larger share of the economy, so green investment is more easily translated into emission reductions and efficiency gains. Second, in terms of financial conditions and governance, non-resource-based cities have a denser distribution of financial institutions, better access to green credit and green bonds, relatively stronger information disclosure and enforcement mechanisms, and higher implementation rates for project screening and performance constraints. Resource-based cities face the dual challenges of high corporate leverage and environmental risk premia, which leads to relatively constrained financing options. Third, in terms of emission reduction costs and technology diffusion, resource-based industries are capital intensive and have highly rigid production processes, which leads to relatively high marginal costs of emission reduction in the short term. The adoption of new technologies requires a longer period of adjustment. Non-resource-based cities have a stronger foundation of innovation networks and industrial collaboration, which makes it easier for new technologies to be adopted and diffused. Therefore, non-resource-based cities are better able to translate green financial investment into adjustments in the energy structure and reductions in pollution intensity, thereby generating a relatively larger marginal improvement in UEER.

8. Discussion

8.1. Validation of Hypotheses

The empirical results of this paper generally support the research hypothesis. First, the baseline DID estimates are consistent with a variety of robustness tests showing that the GFRIPZ policy significantly raises UEER in the pilot cities, which provides direct evidence for the aggregate effect hypothesis. Second, the mechanism test shows that GIE enhancement and ENV enhancement are mediating paths for the important transmission of policy effects, suggesting that the impact of green finance reform on UEER does not come from financial expansion alone, but rather through the improvement of innovation efficiency and the strengthening of governance constraints. Finally, the heterogeneity test further suggests that policy effects differ significantly across regions and city types. Taken as a whole, the above evidence collectively constitutes a systematic validation of the research hypotheses and lays the groundwork for a subsequent discussion against the established research.

8.2. Comparison with Existing Studies

The conclusions of this paper are generally consistent with established green finance policy research that green finance reforms can contribute to green development performance. Unlike existing studies that focus on a single indicator, such as green innovation, industrial upgrading, or pollution reduction, this paper further extends the assessment results to UEER, providing causal evidence that green finance reforms enhance the capacity of cities to ‘withstand–recover–adapt’. This paper further extends the results to UEER, providing causal evidence that green finance reforms enhance the ability of cities to ‘endure, recover and adapt’. The results of the mechanism show that policies mainly play a mediating role by enhancing the efficiency of green innovation and strengthening the intensity of environmental regulation, confirming the logic of innovation-driven and regulation-constrained impacts. The heterogeneity finding further suggests that policy effects are constrained by the industrial base, governance capacity and factor mobility conditions, and thus are more likely to translate into improved resilience in regions with greater absorptive capacity.

8.3. Limitations and Future Research

Although this paper adopts the DID identification strategy and conducts mechanism and robustness tests, several limitations remain. First, UEER is a comprehensive indicator, and its results may be affected by the selection of indicators, weight setting and aggregation methods, which can be cross-validated in the future by combining multiple sources of data under different toughness frameworks to enhance measurement robustness. Second, there are differences in the implementation intensity, project selection criteria and regulatory enforcement capacity of the pilot policy in different regions, and subsequent studies could introduce more granular information on policy intensity or financial scale to further characterize the dynamics of the policy effects and possible non-linear features. Third, there may still be common shocks or policy overlapping factors that are difficult to fully observe at the city level, which can be combined with analysis of spatial spillover effects, identification of policy portfolios, or data at the enterprise and project levels to reveal more deeply the long-term mechanisms and cross-regional externalities of the resilience to the impacts of green finance reforms. Fourth, the validity of ENV measurement has not been sufficiently examined; future work could incorporate partial behavioral validation or auxiliary robustness checks based on alternative proxies and external data to strengthen the credibility of the environmental regulation indicator.

9. Conclusions and Recommendations

This study uses a DID approach and panel data for 279 Chinese cities from 2011 to 2022 to evaluate the effect of the GFRIPZ policy on UEER. The results show that the policy significantly improves UEER in the pilot cities. This finding remains robust after the parallel trends test and a series of additional robustness checks. At the mechanism level, the GFRIPZ policy advances UEER by reinforcing environmental regulation and promoting efficiency gains driven by innovation. In terms of heterogeneity, the GFRIPZ policy appears more effective in eastern cities, megacities and small cities, and in non-resource-based cities. This pattern can be attributed to stronger capacity for industrial restructuring, smoother collaborative innovation and factor mobility, and deeper integration of green finance in these cities. In central and western cities, as well as in medium-sized and resource-based cities, it is more difficult for green funds to be translated into stronger governance capacity and higher resilience because of constraints such as industrial inertia, transition frictions and insufficient supporting infrastructure. Consequently, the impact of the GFRIPZ policy remains relatively limited in these cities.
The above findings further suggest that using UEER as the outcome variable can more comprehensively reflect the long-term impact of green finance reforms on urban ecological and environmental governance capacity, rather than being limited to short-term changes in a single pollution or economic indicator. The results of the mechanism show that the policy plays a mediating role mainly through strengthening the ENV and enhancing the GIE, which implies that the formation of the policy effect relies on the synergy between the allocation of financial resources, innovation incentives and regulatory enforcement. On the one hand, green capital promotes green technology progress and efficiency through improved financing conditions and resource allocation efficiency; on the other hand, the strengthening of environmental regulations provides external constraints and incentives for enterprises to invest in emission reductions and green transformation, thus jointly promoting the improvement of urban resilience. The heterogeneity results suggest that differences across regions and city types in industrial foundations, governance capacity, and factor mobility can substantially shape how effectively green capital is translated into stronger governance and greater resilience. This implies that, as the policy is scaled up and refined, a more differentiated rollout with supporting capacity building is needed to avoid a one size fits all approach that could weaken marginal effects.
Based on these findings, the following policy recommendations are proposed:
(1)
Giving full play to the government’s leading role in developing green finance. The GFRIPZ policy has been shown to be effective in improving UEER, and the government’s co-ordination capacity needs to be further strengthened in the next stage. The government should improve the legal framework for green finance, clarify the legal status of instruments such as green funds and green insurance, align relevant rules with international standards where appropriate, and establish necessary dynamic adjustment mechanisms so that the environmental integrity of policies is maintained. Building on this foundation, the scope of green financial products and markets should be steadily expanded, trading arrangements for environmental rights such as water use rights, energy use rights, carbon emission rights and pollution discharge rights should be improved, and a richer and more standardized set of application scenarios should be provided for green financial innovation. The above suggestions imply that the enhancement of UEER by green finance reforms does not only come from an increase in the supply of funds but also relies on the enhancement of resource allocation efficiency brought about by the clarity of institutional rules and the government’s ability to co-ordinate. When the legal boundaries, taxonomy standards, and supervisory rules for green finance instruments become more transparent and consistent, green capital is more likely to flow into genuinely low-carbon projects, thereby strengthening the policy’s environmental integrity and reducing the risks of idle capital circulation or greenwashing. In other words, the government’s role in system supply and collaborative governance directly affects whether green finance can form stable expectations and effective incentives, which in turn affects the sustainability of UEER improvement.
(2)
Optimizing the transmission channels through which green finance supports UEER. Existing evidence shows that the GFRIPZ policy mainly improves UEER by enhancing GIE and strengthening ENV. It is recommended that green credit, green bonds and other green finance instruments be more closely linked to research outcomes at the stage of fund use. This would encourage universities and enterprises to carry out joint research and technology transfer, thereby shortening the cycle from technological development to actual emission reduction. At the same time, the intensity of ENV should be moderately increased so that enforcement efforts and financial constraints are more closely aligned with actual environmental performance. This would allow financial and environmental signals to work together and gradually strengthen UEER. The effect of green finance is more like the result of innovation incentives and governance constraints together, the funds can really drive the progress of green technology, enhance the efficiency of green innovation, while environmental regulations are in place, the resilience of the city to enhance the more obvious. If financial support and regulatory requirements pull in different directions, capital may be deployed without being translated into real outcomes, emissions reductions and risk-governance capacity may fail to improve, and gains in UEER will be muted. Overall, rather than going large, it is more critical to align funding performance, innovation outputs and environmental performance.
(3)
Implementing targeted measures to improve regional ecological and environmental transition efficiency. Based on the heterogeneity tests, policy design should follow the principle of “strengthening the strong, addressing weaknesses in the weaker and advancing through differentiated approaches”. It is recommended that eastern cities, megacities and non-resource-based cities make fuller use of their existing financial and technological foundations and focus on refining and upgrading existing green projects. By contrast, central and western cities, medium-sized cities and resource-based cities should first address weaknesses in governance and financing and then gradually expand the coverage of green projects. At the same time, the government should mitigate new regional imbalances arising from differences in enforcement capacity through appropriate cross-regional ecological compensation and cooperative development arrangements. Overall, green finance reforms tend to amplify established strengths. Cities with better foundations and smoother synergies are more likely to translate green funds into improved governance capacity and resilience; while regions with strong industrial inertia and insufficient supporting facilities are more likely to be blocked in the transformation chain, and the marginal effect of the policy is relatively limited.

Author Contributions

S.W.: Writing—original draft, Writing—review and editing. B.G.: Data curation. All authors have read and agreed to the published version of the manuscript.

Funding

This work was supported by the National Social Science Fund Project of China (No. 25BJY112).

Institutional Review Board Statement

Not applicable.

Informed Consent Statement

Not applicable.

Data Availability Statement

The raw data supporting the conclusions of this article will be made available by the authors upon request.

Conflicts of Interest

The authors declare that they have no known competing financial interests or personal relationships that could have appeared to influence the work reported in this paper.

References

  1. Li, J.; Zhang, B.; Dai, X.; Qi, M.; Liu, B. Knowledge Ecology and Policy Governance of Green Finance in China—Evidence from 2469 Studies. Int. J. Environ. Res. Public Health 2023, 20, 202. [Google Scholar] [CrossRef] [Scilit] [PubMed]
  2. Chen, S.; Gao, D.; Tan, L. Green Finance Reform: How to Drive a Leap in the Quality of Green Innovation in Enterprises? Sustainability 2025, 17, 7085. [Google Scholar] [CrossRef] [Scilit]
  3. Li, Z.; Wang, L.; Li, G.; Li, K. Has Green Finance Reform and Innovation Pilot Zone Policy Improved New Quality Productive Forces? Quasi-Natural Experiment Based on Green Finance Reform and the Innovation Pilot Zone. Sustainability 2025, 17, 3271. [Google Scholar] [CrossRef] [Scilit]
  4. Desalegn, G.; Tangl, A. Enhancing Green Finance for Inclusive Green Growth: A Systematic Approach. Sustainability 2022, 14, 7416. [Google Scholar] [CrossRef] [Scilit]
  5. Zhou, C.; Qi, S.; Li, Y. China’s green finance and total factor energy efficiency. Front. Energy Res. 2023, 10, 1076050. [Google Scholar] [CrossRef] [Scilit]
  6. Guo, B.; Qian, Y.; Guo, X.; Zhang, H. Impact of Zero-Waste City Pilot Policies on Urban Energy Consumption Intensity: Causal Inference Based on Double Machine Learning. Sustainability 2025, 17, 5039. [Google Scholar] [CrossRef] [Scilit]
  7. Zhuge, R.; Cai, W. Research on the Impact of Green Finance on Green Innovation of Industrial Enterprises: A Quasi-Natural Experiment Based on the Green Finance Reform and Innovation Pilot Zone. Financ. Theory Pract. 2022, 11, 49–61. (In Chinese) [Google Scholar]
  8. Deng, J.; Wang, Y. Will Green Finance Promote Green Technology Innovation in Enterprises?—Evidence From Green Finance Pilot Zones in China. J. Harbin Univ. Commer. (Soc. Sci. Ed.) 2023, 3, 19–34. (In Chinese) [Google Scholar]
  9. Huang, Y.; Chen, C.; Lei, L.; Zhang, Y. Impacts of green finance on green innovation: A spatial and nonlinear perspective. J. Clean. Prod. 2022, 365, 132548. [Google Scholar] [CrossRef] [Scilit]
  10. Chang, K.; Zeng, Y.; Wang, W.; Wu, X. The effects of credit policy and financial constraints on tangible and research & development investment: Firm-level evidence from China’s renewable energy industry. Energy Policy 2019, 130, 438–447. [Google Scholar] [CrossRef] [Scilit]
  11. Xu, X.; Li, J. Asymmetric impacts of the policy and development of green credit on the debt financing cost and maturity of different types of enterprises in China. J. Clean. Prod. 2020, 264, 121574. [Google Scholar] [CrossRef] [Scilit]
  12. Wang, H. How Green Finance Reform Narrows the Urban-Rural Income Gap: Evidence from China. Sustainability 2025, 17, 8344. [Google Scholar] [CrossRef] [Scilit]
  13. Lv, L.; Guo, B. Do Pilot Zones for Green Finance Reform and Innovation Policy Enhance China’s Energy Resilience? Sustainability 2025, 17, 5757. [Google Scholar] [CrossRef] [Scilit]
  14. Shang, H.Y.; Wang, S.S.; Chen, S.W.; Tansuchat, R.; Liu, J.X.; Popescu, C.R.G. North-South Differences and Formation Mechanisms of Green Finance in Chinese Cities. Sustainability 2023, 15, 14498. [Google Scholar] [CrossRef] [Scilit]
  15. Gilchrist, D.; Yu, J.; Zhong, R. The Limits of Green Finance: A Survey of Literature in the Context of Green Bonds and Green Loans. Sustainability 2021, 13, 478. [Google Scholar] [CrossRef] [Scilit]
  16. Wang, J.; Chen, X.; Li, X.; Yu, J.; Zhong, R. The market reaction to green bond issuance: Evidence from China. Pac. Basin Financ. J. 2020, 60, 101294. [Google Scholar] [CrossRef] [Scilit]
  17. Zhou, X.; Tang, X.; Zhang, R. Impact of green finance on economic development and environmental quality: A study based on provincial panel data from China. Environ. Sci. Pollut. Res. 2020, 27, 19915–19932. [Google Scholar] [CrossRef] [Scilit]
  18. C. S. Holling (1973). In Foundations of Socio-Environmental Research: Legacy Readings with Commentaries; Burnside, W.R., Pulver, S., Fiorella, K.J., Avolio, M.L., Alexander, S.M., Eds.; Cambridge University Press: Cambridge, UK, 2022; pp. 460–482. [Google Scholar]
  19. Huang, C.; Zhou, Z.; Peng, C.; Teng, M.; Wang, P. How is biodiversity changing in response to ecological restoration in terrestrial ecosystems? A meta-analysis in China. Sci. Total Environ. 2019, 650, 1–9. [Google Scholar] [CrossRef] [Scilit]
  20. Shi, C.; Zhu, X.; Wu, H.; Li, Z. Assessment of Urban Ecological Resilience and Its Influencing Factors: A Case Study of the Beijing-Tianjin-Hebei Urban Agglomeration of China. Land 2022, 11, 921. [Google Scholar] [CrossRef] [Scilit]
  21. Baho, D.L.; Allen, C.R.; Garmestani, A.; Fried-Petersen, H.; Renes, S.E.; Gunderson, L.; Angeler, D.G. A quantitative framework for assessing ecological resilience. Ecol. Soc. 2017, 22, 1. [Google Scholar] [CrossRef] [Scilit]
  22. Wang, C. How does manufacturing agglomeration affect urban ecological resilience? evidence from the Yangtze river delta region of China. Front. Environ. Sci. 2024, 12, 1492866. [Google Scholar] [CrossRef] [Scilit]
  23. Meerow, S.; Newell, J.P.; Stults, M. Defining urban resilience: A review. Landsc. Urban Plan. 2016, 147, 38–49. [Google Scholar] [CrossRef] [Scilit]
  24. Wang, Y.; Yan, W.; Ma, D.; Zhang, C. Carbon emissions and optimal scale of China’s manufacturing agglomeration under heterogeneous environmental regulation. J. Clean. Prod. 2018, 176, 140–150. [Google Scholar] [CrossRef] [Scilit]
  25. Wang, Z.; Cao, X.; Ren, X.; Gozgor, G. Digital finance and the energy transition: Evidence from Chinese prefecture-level cities. Glob. Financ. J. 2024, 61, 100987. [Google Scholar] [CrossRef] [Scilit]
  26. Adger, W.N. Social and ecological resilience: Are they related? Prog. Hum. Geogr. 2000, 24, 347–364. [Google Scholar] [CrossRef] [Scilit]
  27. Li, G.; Wang, L. Study of regional variations and convergence in ecological resilience of Chinese cities. Ecol. Indic. 2023, 154, 110667. [Google Scholar] [CrossRef] [Scilit]
  28. Fu, S.; Liu, J.; Wang, J.; Tian, J.; Li, X. Enhancing urban ecological resilience through integrated green technology progress: Evidence from Chinese cities. Environ. Sci. Pollut. Res. 2024, 31, 36349–36366. [Google Scholar] [CrossRef] [Scilit] [PubMed]
  29. Wang, S.; Cui, Z.; Lin, J.; Xie, J.; Su, K. The coupling relationship between urbanization and ecological resilience in the Pearl River Delta. J. Geogr. Sci. 2022, 32, 44–64. [Google Scholar] [CrossRef] [Scilit]
  30. Lu, T.; Luo, P. Rare disaster, economic growth, and disaster risk management with preferences for liquidity. Int. Rev. Financ. 2024, 24, 195–212. [Google Scholar] [CrossRef] [Scilit]
  31. Gómez-Baggethun, E.; Gren, Å.; Barton, D.; Langemeyer, J.; McPhearson, T.; O’Farrell, P. Urbanization, Biodiversity and Ecosystem Services: Challenges and Opportunities: A Global Assessment; Springer Nature: Berlin/Heidelberg, Germany, 2013. [Google Scholar]
  32. Ge, T.; Hao, Z.; Chen, Y. How environmental policy synergy can enhance urban ecological resilience: Insights from text mining analysis in China. Humanit. Soc. Sci. Commun. 2025, 12, 656. [Google Scholar] [CrossRef] [Scilit]
  33. Nabi, A.A.; Ahmed, F.; Tunio, F.H.; Hafeez, M.; Haluza, D. Assessing the Impact of Green Environmental Policy Stringency on Eco-Innovation and Green Finance in Pakistan: A Quantile Autoregressive Distributed Lag (QARDL) Analysis for Sustainability. Sustainability 2025, 17, 1021. [Google Scholar] [CrossRef] [Scilit]
  34. Rafique, M.Z.; Nadeem, A.M.; Xia, W.; Ikram, M.; Shoaib, H.M.; Shahzad, U. Does economic complexity matter for environmental sustainability? Using ecological footprint as an indicator. Environ. Dev. Sustain. 2022, 24, 4623–4640. [Google Scholar] [CrossRef] [Scilit] [PubMed]
  35. Wang, Z.; Teng, Y.-P.; Wu, S.; Chen, H. Does Green Finance Expand China’s Green Development Space? Evidence from the Ecological Environment Improvement Perspective. Systems 2023, 11, 369. [Google Scholar] [CrossRef] [Scilit]
  36. Tang, M.; Ding, J.; Kong, H.; Bethel, B.J.; Tang, D. Influence of Green Finance on Ecological Environment Quality in Yangtze River Delta. Int. J. Environ. Res. Public Health 2022, 19, 10692. [Google Scholar] [CrossRef] [Scilit] [PubMed]
  37. Zhu, Y.; Zhang, M.; Chen, H.; Ma, J. The Green Finance Pilot Policy Suppresses Green Innovation Efficiency: Evidence from Chinese Cities. Sustainability 2025, 17, 6136. [Google Scholar] [CrossRef] [Scilit]
  38. Zhao, K.; Wu, C.; Liu, J.; Liu, Y. Green Finance, Green Technology Innovation and the Upgrading of China’s Industrial Structure: A Study from the Perspective of Heterogeneous Environmental Regulation. Sustainability 2024, 16, 4330. [Google Scholar] [CrossRef] [Scilit]
  39. Du, K.; Cheng, Y.; Yao, X. Environmental regulation, green technology innovation, and industrial structure upgrading: The road to the green transformation of Chinese cities. Energy Econ. 2021, 98, 105247. [Google Scholar] [CrossRef] [Scilit]
  40. Zhang, J.; Ouyang, Y.; Ballesteros-Perez, P.; Li, H.; Philbin, S.P.; Li, Z.; Skitmore, M. Understanding the impact of environmental regulations on green technology innovation efficiency in the construction industry. Sustain. Cities Soc. 2021, 65, 102647. [Google Scholar] [CrossRef] [Scilit]
  41. Ambec, S.; De Donder, P. Environmental policy with green consumerism. J. Environ. Econ. Manag. 2022, 111, 102584. [Google Scholar] [CrossRef] [Scilit]
  42. Ye, Z.; Liu, Y.; Rong, Y. How Environmental Regulations Affect Green Total Factor Productivity—Evidence from Chinese Cities. Sustainability 2024, 16, 3010. [Google Scholar] [CrossRef] [Scilit]
  43. Tone, K. A slacks-based measure of super-efficiency in data envelopment analysis. Eur. J. Oper. Res. 2002, 143, 32–41. [Google Scholar] [CrossRef] [Scilit]
  44. Bao, H.; Teng, T.; Hu, S.; Ding, J. Spatial differentiation and influencing factors of urban green innovation efficiency in Yangtze River Delta. J. Resour. Environ. Yangtze Basin 2022, 31, 273–284. (In Chinese) [Google Scholar]
  45. Callaway, B.; Sant’Anna, P.H.C. Difference-in-Differences with multiple time periods. J. Econom. 2021, 225, 200–230. [Google Scholar] [CrossRef] [Scilit]
  46. Borusyak, K.; Jaravel, X.; Spiess, J. Revisiting Event-Study Designs: Robust and Efficient Estimation. Rev. Econ. Stud. 2024, 91, 3253–3285. [Google Scholar] [CrossRef] [Scilit]
  47. Sun, L.Y.; Abraham, S. Estimating dynamic treatment effects in event studies with heterogeneous treatment effects. J. Econom. 2021, 225, 175–199. [Google Scholar] [CrossRef] [Scilit]
  48. De Chaisemartin, C.; D’Haultfoeuille, X. Two-Way Fixed Effects Estimators with Heterogeneous Treatment Effects. Am. Econ. Rev. 2020, 110, 2964–2996. [Google Scholar] [CrossRef] [Scilit]
  49. Lu, W.; Qin, Z.; Yang, S. Heterogeneity effects of environmental regulation policy synergy on ecological resilience: Considering the moderating role of industrial structure. Environ. Sci. Pollut. Res. 2024, 31, 8566–8584. [Google Scholar] [CrossRef] [Scilit] [PubMed]
  50. Shao, H.; Peng, Q.; Zhou, F.; Wider, W. Environmental regulation, industrial transformation, and green economy development. Front. Environ. Sci. 2024, 12, 1442072. [Google Scholar] [CrossRef] [Scilit]
  51. Wang, B.; Zhu, J.; Ma, Y.; Tao, X.; Li, X. The coupling coordination and spatial effect of eco-environmental governance efficiency and green innovation in China. Technol. Anal. Strateg. Manag. 2025, 37, 356–368. [Google Scholar] [CrossRef] [Scilit]
Figure 1. Spatial distribution and dynamic evolution of the UEER index in China. (a) 2011; (b) 2015; (c) 2019; (d) 2022.
Sustainability 18 00706 g001
Figure 2. Parallel trend test.
Sustainability 18 00706 g002
Figure 3. Placebo test.
Sustainability 18 00706 g003
Figure 4. Balance test.
Sustainability 18 00706 g004
Figure 5. CS estimator.
Sustainability 18 00706 g005
Figure 6. Imputation estimator.
Sustainability 18 00706 g006
Figure 7. SA estimator.
Sustainability 18 00706 g007
Figure 8. Dynamic processing effects in de Chaisemartin-D’Haultfœuille estimation.
Sustainability 18 00706 g008
Table 1. Cities and establishment dates covered By the GFRIPZ policy.
Date of EstablishmentGFRIPZCity
June 2017Huzhou City, Quzhou City, Guangzhou City, Ganzhou New Area, Gui’an New Area, Hami City, Changji Hui Autonomous Prefecture, Karamay CityHuzhou City, Quzhou City, Guangzhou City, Ganzhou City, Guiyang City and Anshun City, Hami City, Changji Hui Autonomous Prefecture, Karamay City
November 2019Lanzhou New AreaLanzhou City
August 2022Chongqing MunicipalityChongqing Municipality
Table 2. Indicator system for UEER.
Primary IndicatorSecondary IndicatorTertiary IndicatorUnitDirection
UEERUESTotal water resources/populationm3/person+
Green coverage ratio of built-up area%+
Park green space area/populationhectares/10,000 persons+
Built-up area/populationkm2/10,000 persons+
UEPIndustrial wastewater discharge/populationtons/person
Industrial SO2 emissions/populationtons/person
Industrial soot & dust emissions/populationtons/person
Industrial NOx emissions/populationtons/person
Annual mean PM2.5 concentrationµg/m3
UEMSO2 removed from industrytons+
Soot & dust removed from industrytons+
Harmless treatment rate of municipal solid waste%+
Centralized wastewater treatment rate%+
Comprehensive utilization rate of industrial solid waste%+
Table 3. Urban GIE indicators.
Primary IndicatorSecondary IndicatorTertiary IndicatorUnit
Input indicatorsCapital investmentTotal Capital Investment10,000 yuan
Labor inputNumber of R&D Personnelpersons
Energy inputEnergy consumption108 kWh
Output IndicatorsExpected OutputGreen Industry Value Added100 million yuan
Per-unit GDP energy consumption reduction rate%
Share of clean energy use%
Non-expected outputcarbon emissions104 t CO2-eq
Industrial wastewater discharge volume104 t
Table 4. Descriptive statistics of core variables.
VARIABLESObsMeanSDMedianMinMax
UEER33000.3160.0110.3160.2330.460
Ln PG330010.7850.55310.7718.84212.579
Ln PT33007.5001.7077.4710.00012.220
FS33000.4490.2120.4200.0701.120
SI33000.0160.0170.0100.0000.210
EI33000.1760.0390.1800.0400.360
FD33001.4940.7061.3600.37020.100
IND33001.0650.6050.9300.1105.650
Ln DFI33005.1610.5155.3363.0225.865
GIE29940.0180.0650.0070.0001.000
ENV29520.5070.0140.5090.3020.533
Table 5. Benchmark regression.
VARIABLES(1)(2)(3)(4)
UEERUEERUEERUEER
DID0.050 ***0.046 ***0.047 ***0.047 ***
(34.63)(38.44)(38.49)(11.07)
Ln PG −0.000−0.000
(−0.39)(−0.31)
Ln PT −0.001 ***−0.001 ***
(−3.15)(−2.86)
FS −0.004 **−0.004 *
(−1.99)(−1.94)
SI 0.021 *0.021
(1.79)(1.62)
EI −0.005−0.005
(−0.84)(−0.84)
FD −0.000−0.000
(−1.18)(−1.04)
IND −0.000−0.000
(−0.62)(−0.65)
Ln DFI 0.007 ***0.007 **
(4.70)(2.33)
Constant0.315 ***0.315 ***0.289 ***0.289 ***
(660.62)(4178.95)(26.60)(19.73)
Observations3300330033003300
R-squared0.2670.7650.7680.768
Id FENYYY
Year FENYYY
Note: T-statistics in parentheses, *** p < 0.01, ** p < 0.05, * p < 0.1.
Table 6. Robustness test (1).
VARIABLES(1)(2)(3)(4)(5)(6)
PSM-DIDExcluding OutliersRESUCR1%5%
DID0.045 ***0.043 ***0.044 **0.021 **0.026 ***0.007 ***
(6.88)(8.50)(2.59)(2.43)(31.62)(12.70)
Ln PG−0.0040.0000.012 **0.0020.0010.001 ***
(−1.13)(0.04)(2.38)(0.34)(1.63)(3.28)
Ln PT−0.000−0.001−0.0010.156 ***−0.001 ***0.000
(−0.39)(−1.18)(−0.84)(11.45)(−3.52)(0.52)
FS−0.012 **−0.001−0.0070.477 ***−0.002−0.002 ***
(−2.26)(−0.39)(−0.82)(4.19)(−1.40)(−2.71)
SI0.0040.0150.324 ***0.226 ***0.0100.003
(0.18)(0.76)(3.22)(4.65)(1.29)(0.63)
EI0.017−0.0140.103 ***−0.002−0.010 **−0.005 *
(0.95)(−1.53)(3.11)(−1.53)(−2.53)(−1.75)
FD−0.001−0.000−0.002−0.002−0.000−0.000
(−0.36)(−0.90)(−1.14)(−0.69)(−1.07)(−0.61)
IND−0.002−0.0000.0020.006 *0.0000.001 ***
(−1.24)(−0.73)(0.51)(1.93)(0.50)(3.10)
Ln DFI0.0230.008 *−0.058 ***−0.043 ***0.005 ***0.004 ***
(0.67)(1.67)(−4.99)(−4.23)(4.43)(5.43)
Constant0.2440.281 ***0.237 ***0.237 **0.288 ***0.283 ***
(1.42)(11.67)(4.08)(2.58)(38.71)(55.87)
Observations145629163300324033003300
R-squared0.8590.7520.9350.9500.7950.782
Id FEYESYESYESYESYESYES
Year FEYESYESYESYESYESYES
Note: T-statistics in parentheses, *** p < 0.01, ** p < 0.05, * p < 0.1.
Table 7. Robustness test (2).
VARIABLES(1)(2)(3)
UEERUEERUEER
DID0.044 ***0.043 **0.044 **
(2.61)(2.54)(2.58)
CARBON10.011
(1.58)
CARBON2 0.004
(1.08)
CARBON3 0.000
(0.00)
Ln PG0.013 **0.013 **0.013 **
(2.40)(2.28)(2.40)
Ln PT−0.007−0.007−0.008
(−0.77)(−0.71)(−0.84)
FS0.319 ***0.318 ***0.323 ***
(3.18)(3.21)(3.21)
SI0.102 ***0.100 ***0.103 ***
(3.10)(3.01)(3.09)
EI−0.001−0.001−0.001
(−0.86)(−0.75)(−0.78)
FD−0.001−0.001−0.001
(−1.11)(−1.10)(−1.11)
IND0.0020.0020.002
(0.51)(0.48)(0.52)
Ln DFI−0.057 ***−0.057 ***−0.059 ***
(−5.15)(−4.90)(−5.00)
Constant0.153 ***0.152 ***0.157 ***
(2.72)(2.73)(2.76)
Observations330033003300
R-squared0.9350.9350.935
Id FEYESYESYES
Year FEYESYESYES
Note: T-statistics in parentheses, *** p < 0.01, ** p < 0.05.
Table 8. Robustness test (3).
VARIABLES(1)(2)(3)(4)
First-StageSecond-StageFirst-StageSecond-Stage
DIDUEERDIDUEER
IV10.029 ***
(3.44)
DID 0.120 *** 0.033 ***
(3.65) (3.82)
IV2 0.000 ***
(5.53)
ControlsYESYESYESYES
Id FEYESYESYESYES
Year FEYESYESYESYES
KP-LM12.9127.56
KP-LM-P0.000.00
Wald F30.638.4011.823.86
Observations2593259332413241
Note: T-statistics in parentheses, *** p < 0.01.
Table 9. Mechanism verification.
VARIABLES(1)(2)
ENVGIE
DID0.021 ***0.011 **
(6.15)(2.28)
ENV
GIE
ControlsYESYES
Id FEYESYES
Year FEYESYES
Constant0.936 ***−0.035
(9.78)(−0.46)
Observations29522994
R-squared0.0110.006
Note: T-statistics in parentheses, *** p < 0.01, ** p < 0.05.
Table 10. Geographic location heterogeneity.
VARIABLESGeographical Location
EasternCentralWestern
DID0.048 ***0.044 ***0.043 ***
(3.59)(41.90)(5.34)
Ln PG−0.002−0.0010.005
(−1.01)(−0.51)(1.16)
Ln PT−0.000−0.000−0.001
(−0.63)(−0.41)(−1.28)
FS−0.006−0.004−0.004
(−1.06)(−1.58)(−0.53)
SI0.074−0.026−0.005
(1.62)(−1.31)(−0.15)
EI−0.0150.0010.016
(−0.71)(0.06)(0.87)
FD−0.000−0.004 *0.003
(−0.85)(−1.76)(0.90)
IND−0.0000.001−0.001
(−0.31)(0.97)(−1.36)
Ln DFI0.0050.0030.007
(0.58)(0.95)(1.54)
Constant0.323 ***0.322 ***0.231 ***
(8.75)(11.01)(4.44)
Observations1392912960
R-squared0.7780.7350.740
Id FEYESYESYES
Year FEYESYESYES
Note: T-statistics in parentheses, *** p < 0.01, * p < 0.1.
Table 11. Heterogeneity in urban size.
VARIABLESUrban Scale
MegacityMedium-SizedSmall
DID0.069 ***0.029 ***0.048 ***
(8.64)(4.47)(10.98)
Ln PG−0.0080.0000.002
(−1.16)(0.22)(0.98)
Ln PT−0.001−0.001−0.001
(−0.30)(−0.60)(−0.90)
FS−0.047−0.0030.001
(−1.50)(−0.77)(0.15)
SI0.149−0.0020.002
(1.01)(−0.06)(0.15)
EI0.128−0.007−0.012
(1.52)(−0.37)(−1.14)
FD0.007 *−0.000−0.000
(1.74)(−0.20)(−0.67)
IND0.002−0.0010.000
(0.46)(−1.22)(0.35)
Ln DFI0.0670.0020.006 **
(0.85)(0.43)(2.06)
Constant0.0580.311 ***0.270 ***
(0.14)(7.50)(10.47)
Observations2169362112
R-squared0.7120.6450.819
Id FEYESYESYES
Year FEYESYESYES
Note: T-statistics in parentheses, *** p < 0.01, ** p < 0.05, * p < 0.1.
Table 12. Heterogeneity in resource endowments.
VARIABLESResource Endowment
Resource-BasedNon-Resource-Based
DID0.041 ***0.049 ***
(4.93)(4.79)
Ln PG0.001−0.000
(0.20)(−0.11)
Ln PT−0.002 **0.000
(−2.17)(0.14)
FS−0.004−0.005
(−0.98)(−1.21)
SI0.0040.056 *
(0.18)(1.80)
EI−0.004−0.005
(−0.28)(−0.30)
FD−0.001−0.000
(−0.68)(−0.38)
IND0.000−0.000
(0.21)(−0.67)
Ln DFI0.0020.008
(0.41)(1.52)
Constant0.316 ***0.278 ***
(7.43)(10.34)
Observations13321932
R-squared0.7380.775
Id FEYESYES
Year FEYESYES
Note: T-statistics in parentheses, *** p < 0.01, ** p < 0.05, * p < 0.1.
Disclaimer/Publisher’s Note: The statements, opinions and data contained in all publications are solely those of the individual author(s) and contributor(s) and not of MDPI and/or the editor(s). MDPI and/or the editor(s) disclaim responsibility for any injury to people or property resulting from any ideas, methods, instructions or products referred to in the content.