Article

Spatiotemporal Synergy and Dual-Dimensional Correlation of Xinjiang’s Tourism Industry Clusters

1
College of Geographic Science and Tourism, Xinjiang Normal University, Urumqi 830017, China
2
Xinjiang Tourism Development Research Center, Urumqi 830017, China
3
Department of Culture and Tourism of Xinjiang Uygur Autonomous Region, Urumqi 830002, China
*
Author to whom correspondence should be addressed.
Sustainability 2026, 18(2), 705; https://doi.org/10.3390/su18020705
Submission received: 28 November 2025 / Revised: 30 December 2025 / Accepted: 6 January 2026 / Published: 9 January 2026

Abstract

As a core sector of the Belt and Road Initiative (BRI) and dual-circulation pattern, Xinjiang’s cultural tourism industry—its ninth-largest industrial cluster—plays a key role in enhancing industrial competitiveness and regional coordinated development. To fill the research gap of insufficient analysis on China’s western frontier regions in existing tourism cluster studies, this research focuses on 14 prefecture-level cities in Xinjiang (2009–2023) and innovatively adopts a spatiotemporal synergy and dual-dimensional correlation framework, addressing the limitations of previous single-dimensional research. Tourism Location Quotient (TLQ) quantified specialized agglomeration, Local Moran’s I identified spatial correlation patterns, gravity models analyzed horizontal inter-cluster interactions, and Gray Relational Model (GRM) measured vertical driving relationships between cluster development and related dimensions. This approach facilitates an in-depth analysis of the spatiotemporal evolution trajectory of Xinjiang’s tourism clusters and their horizontal-vertical linkage mechanisms. Findings show: (1) Xinjiang’s tourism clusters present a spatial pattern of “Northern Xinjiang as the core, Eastern Xinjiang with differentiated development, and Southern Xinjiang as lagging.” With narrowing regional gaps, their evolution transitions from a “fixed gradient” to “co-evolution.” (2) Agglomeration effects are significant: Urumqi propels Northern Xinjiang to form a “high-high agglomeration zone,” while Southern Xinjiang remains a “low-low agglomeration zone” led by Kashgar. (3) Horizontal linkages evolve from a Urumqi-centered single-core structure to a multi-axis cluster network, and vertical linkages are mainly driven by destination attractiveness and economic support capacity. This study clarifies the spatiotemporal evolution logic and associated driving mechanisms of tourism clusters in arid, multi-ethnic frontier regions, providing a scientific basis for optimizing regional tourism layouts and promoting high-quality development.

1. Introduction

As a comprehensive industry with both economic and social value, Clustered development has become a key path for tourism to optimize the regional industrial structure and enhancing international competitiveness against the strategic backdrop of the Belt and Road Initiative (BRI) and the in-depth advancement of the new “dual circulation” development pattern. Tourism industry clusters endow regional tourism with significant competitiveness and sustainable development capacity, which are industrial systems created by the tourist industry’s high levels of agglomeration and collaboration within a particular geographical area [1]. The cultural tourism industry has achieved a leapfrog upgrade in the industry’s position in Xinjiang’s economic and social development, ranking as the ninth largest industrial cluster in the province [2]. Based on resource endowments and the necessity for industrial upgrading, the Party Committee of the autonomous area likewise made this strategic deployment. Although Xinjiang boasts abundant and diverse tourism resources, it still faces challenges such as a weak industrial linkages, unequal regional growth, and poor industrial agglomeration. In light of this, it is useful and significant to investigate the temporal and spatial evolution of Xinjiang’s tourism industry clusters and to elucidate the strength of linkage effects between various regional clusters and between related links within clusters in Xinjiang.
Michael Porter’s industrial cluster theory gave rise to the concept of tourism industry clusters. The academic community has reached a certain consensus on the definition of tourism industry clusters, which encompasses the spatial agglomeration of tourism factors, the cooperative-competitive network connections among tourism institutions and organizations, and the role of economies of scale in industrial chains and experiential value chains in driving service innovation within tourism industry clusters [3]. The International Cluster Association conducts research on tourism industry clusters using regional clusters as the foundational framework, and most scholars have validated the effectiveness of this approach [4,5,6]. Scholars have conducted extensive explorations on the measurement methods and spatial pattern characteristics of tourism industry clusters. In terms of measurement indicators, the Location Entropy is widely used to evaluate the degree of specialized agglomeration of regional tourism industries [7,8], kernel density estimation is commonly employed to analyze the spatial differentiation characteristics of clusters [9,10]. In terms of spatial pattern research, spatial econometric models have become mainstream tools for analyzing the spatial effects of tourism clusters [6,11]. In terms of economic effects, existing research confirms that tourism cluster development can stimulate regional economic growth [12,13], enhance total factor productivity (TFP) [14,15,16] and mitigate the urban-rural income gap [17]. From the perspective of research regions, existing studies on tourism industry clusters are mainly concentrated in the central and eastern regions of China [4,12,18] and other countries [6,13,19]. Among the limited existing studies on Xinjiang, Chen et al. [20] measured the agglomeration level of Xinjiang’s tourism industry and identified its driving factors; Cao and Long [21] analyzed the evolution of tourism industry agglomeration in Xinjiang’s counties and cities and its influencing factors; Shi and Yang [22] measured the high-quality development level of Xinjiang’s tourism economy and its influencing factors; Wang et al. [23] analyzed the spatiotemporal evolution of Xinjiang’s tourism economic network based on a modified gravity model.
In conclusion, significant progress has been made in domestic and international research on tourism industry clusters. However, three critical research gaps remain: Insufficient spatiotemporal integration, most studies on the spatial effects of clusters focus solely on spatial agglomeration, lacking systematic analysis that combines temporal evolution and spatial distribution; Weak quantitative research on linkage effects, quantitative exploration of the cluster linkage mechanisms is relatively inadequate; Neglect of western border regions, the majority of studies concentrate on China’ s central and eastern regions, with little attention paid to western border areas like Xinjiang. To address these gaps, this study takes the spatiotemporal evolution and linkage impacts of Xinjiang’ s tourism clusters as its core focus. The research motivation lies in the inherent mutually reinforcing relationship between the two: spatiotemporal evolution provides dynamic temporal processes and spatial distributions for linkage effects, while correlation effects drive the diffusion and upgrading of clusters across time and space. Accordingly, the primary research objective is to thoroughly clarify the internal logic of the dynamic development of Xinjiang’ s tourism clusters—specifically, to reveal how their spatiotemporal patterns evolve and how linkage effects operate in this border region.
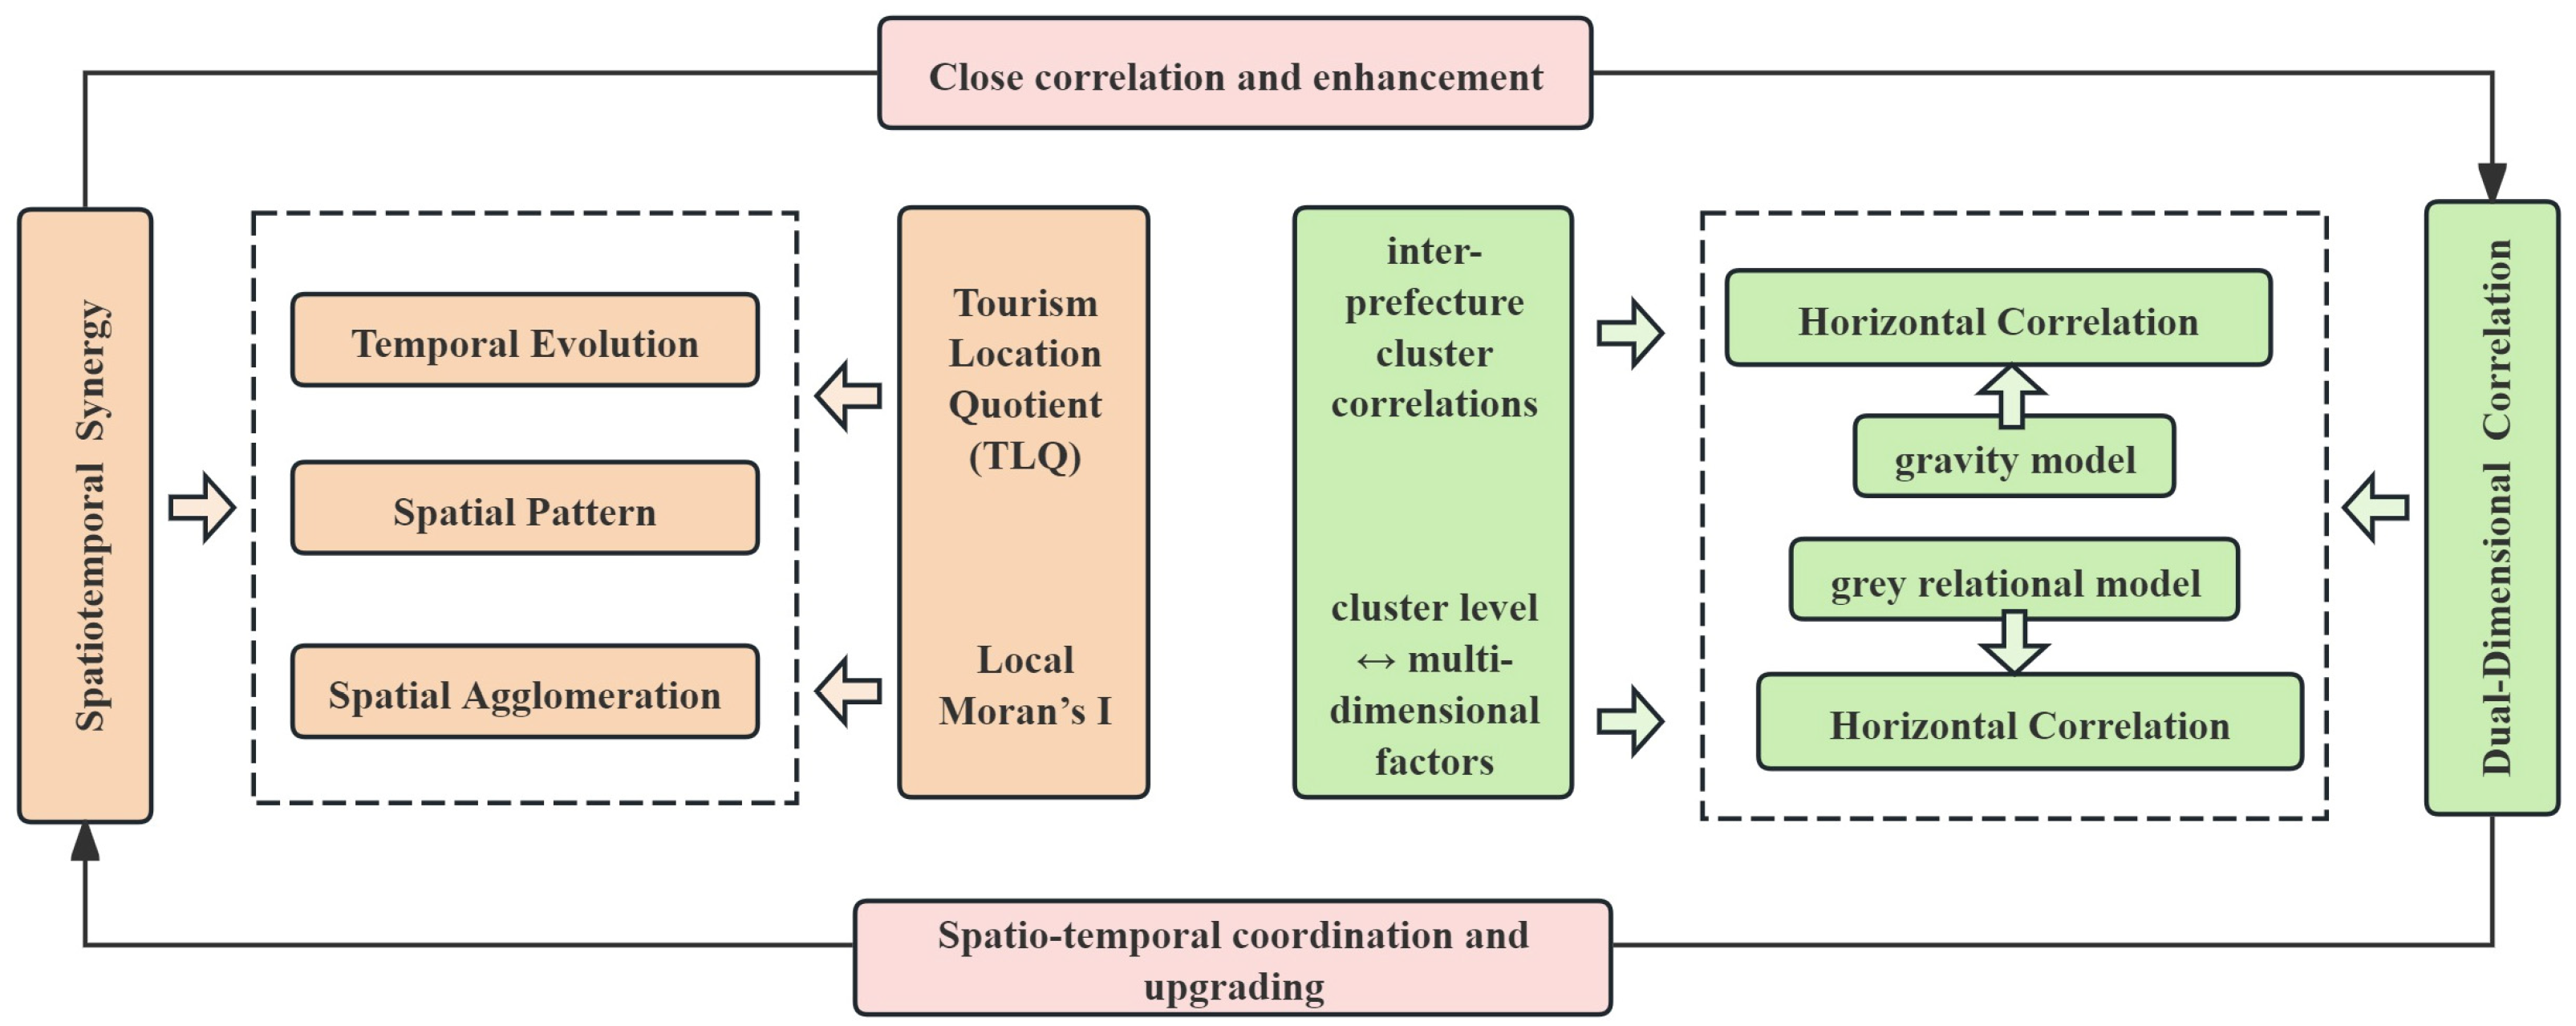
Therefore, this study takes the 14 prefectures/cities of Xinjiang as the research units. Utilizing GIS spatial analysis technology, it examines the spatiotemporal evolution patterns and synergistic mechanisms of Xinjiang’s tourism industry cluster from a “spatiotemporal synergy” perspective. Simultaneously, it employs the gravity model and the gray correlation model to explore its “dual-dimensional correlation,” explaining both the “horizontal” linkage effects of spatial interaction and coordination among industrial clusters, and the “vertical” linkage effects of driving relationships and dependencies among related segments within the clusters (Figure 1). To unpack the aforementioned dynamics, three interrelated research questions are explicitly formulated to guide this inquiry: the first aims to delineate the spatiotemporal evolution characteristics and dynamic gradient patterns of Xinjiang’s tourism industry clusters during 2009–2023, with specific emphasis on the evolutionary trajectories of cluster development levels and spatial agglomeration traits across Northern, Southern, and Eastern Xinjiang; the second seeks to explore the evolutionary trends and interregional interaction mechanisms of horizontal linkage patterns among these clusters, as well as the transformation of the interregional network structure from a single-core to a multi-axis configuration; the third intends to elucidate the vertical correlation mechanisms between core influencing factors and cluster development, identify the dominant driving factors in cluster growth, and quantify their correlation intensities. Using the two-dimensional design concept of “one horizontal and one vertical,” this study builds a three-dimensional analytical framework of industrial driving and spatial coordination with the goal of offering insights for enhancing the coordination and quality of Xinjiang’s tourism industry clusters.

2. Data and Methods

2.1. Study Area Overview

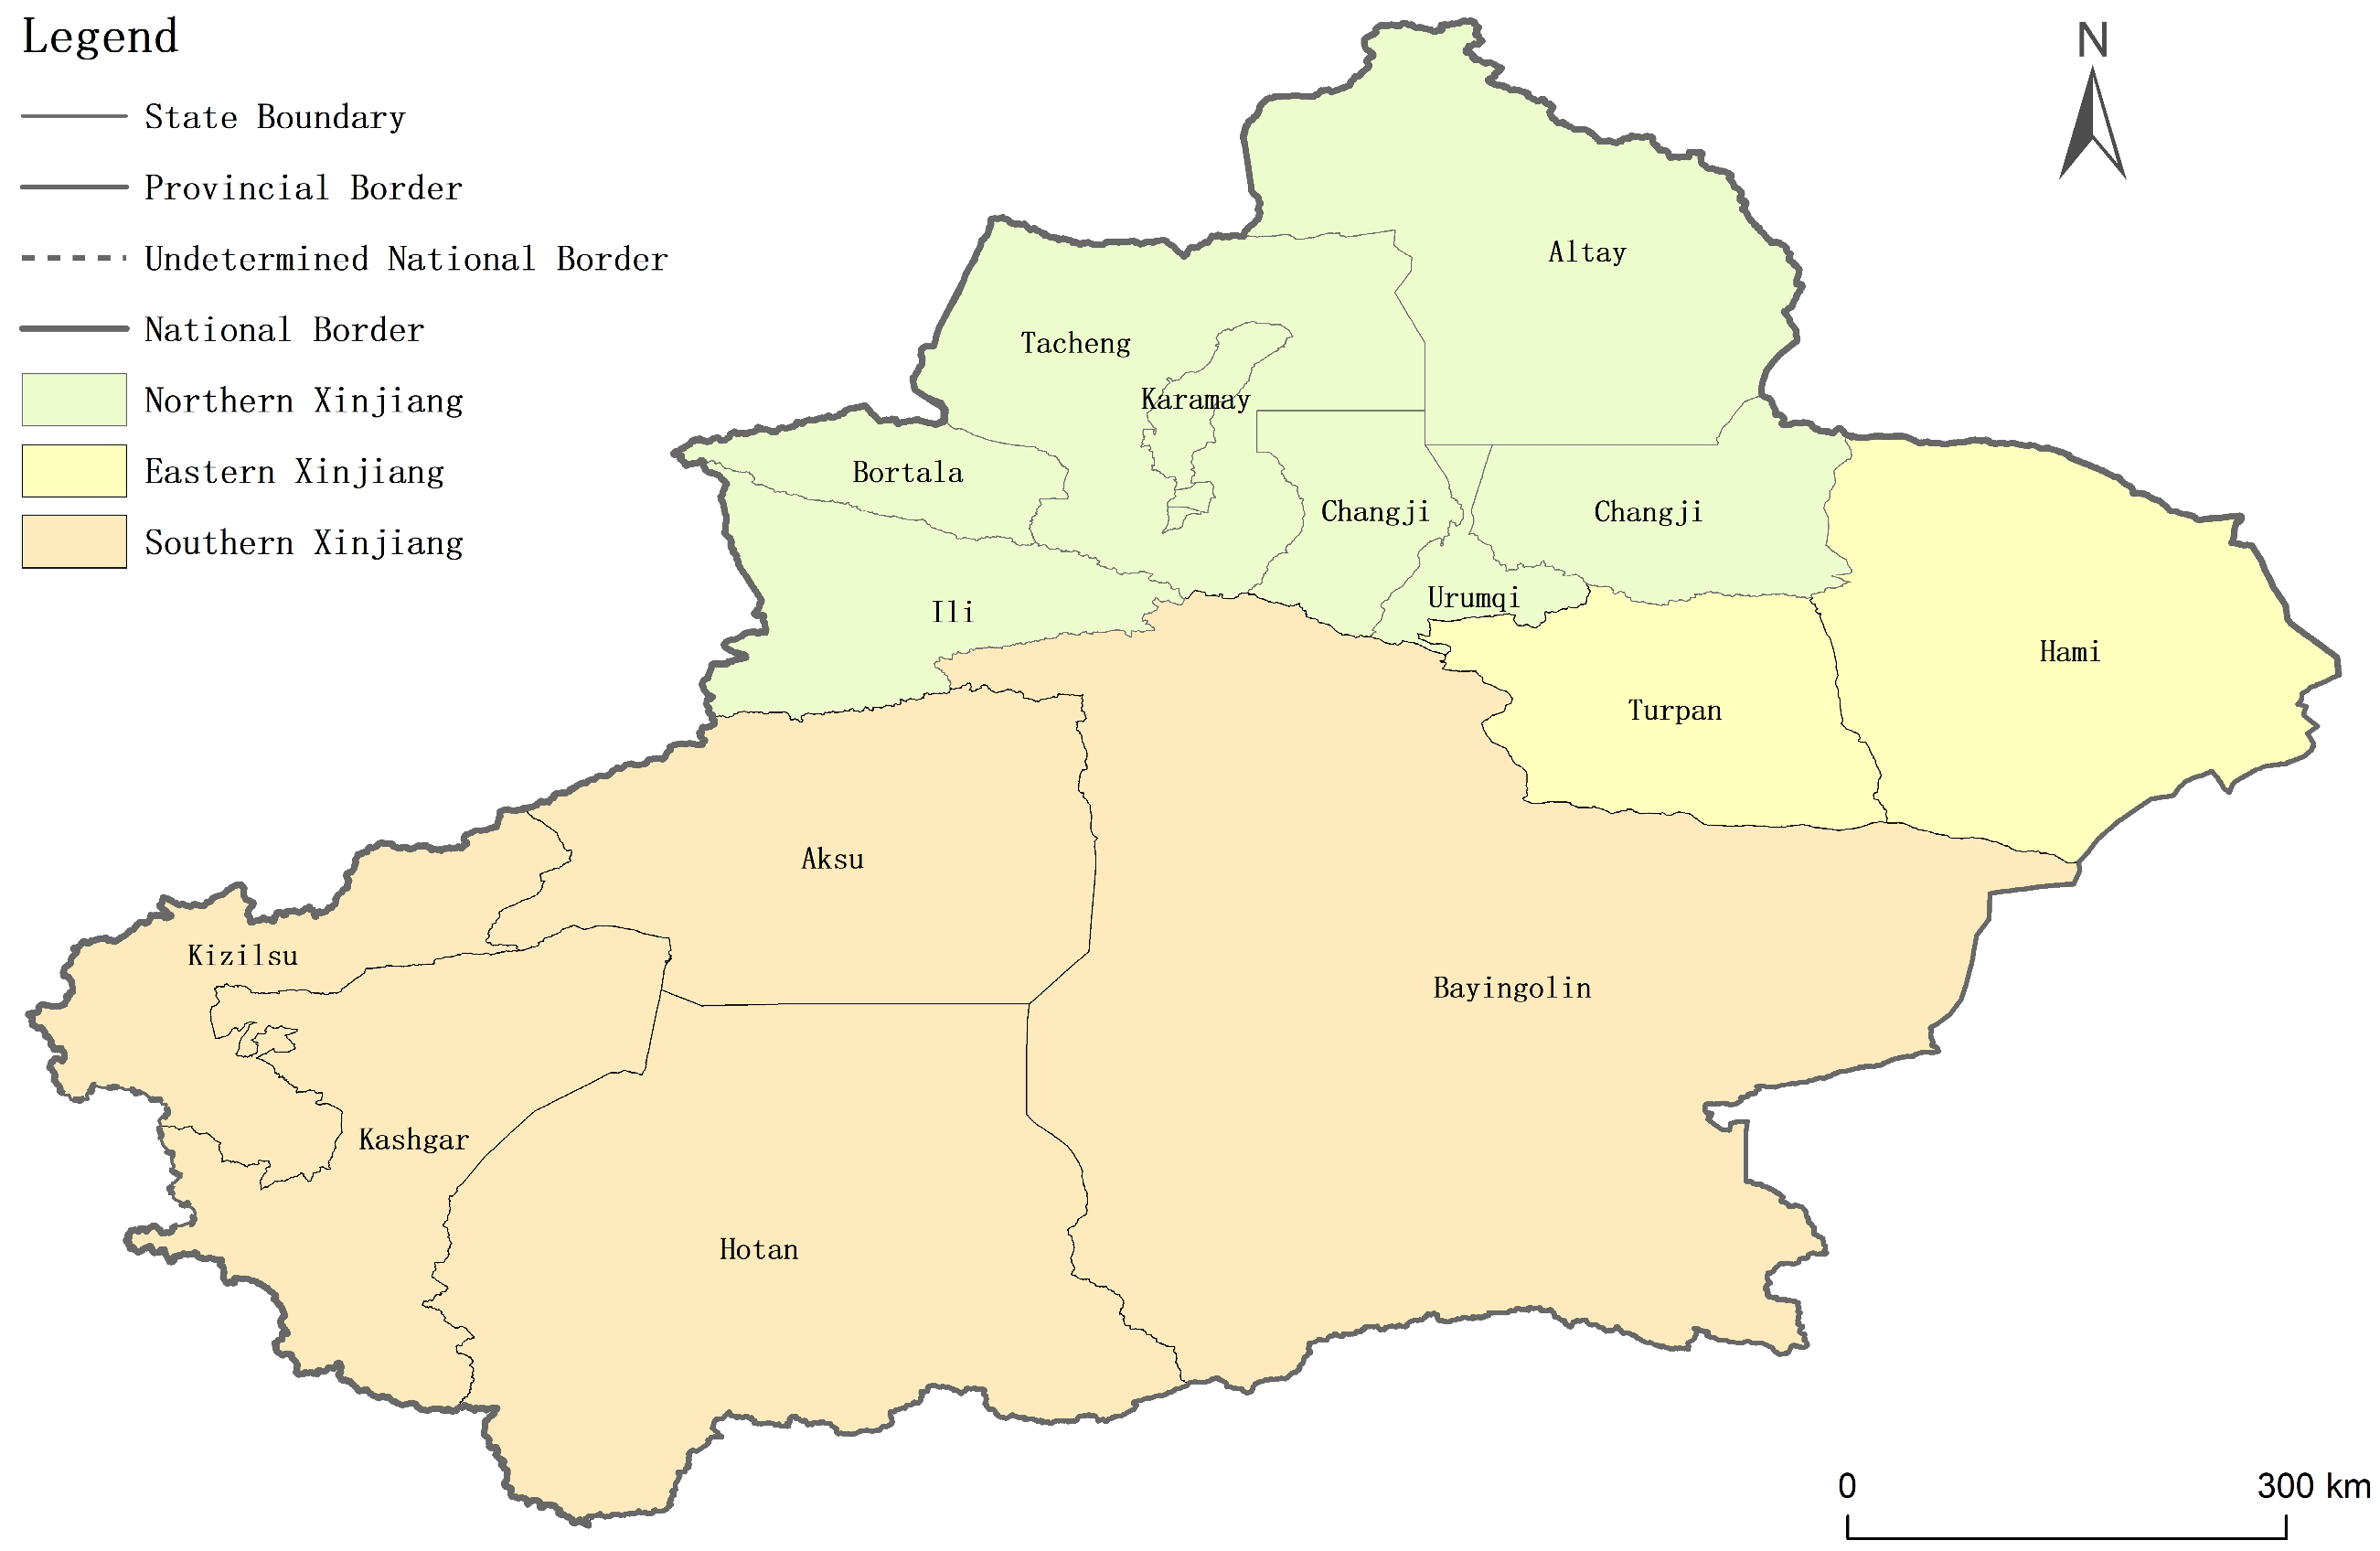
The Xinjiang Uygur Autonomous Region is borders eight countries on China’s northwest frontier. With its central location inside the “Silk Road Economic Belt,” it enjoys the geographical benefits of “connecting internally and linking externally.” The “Three Mountains Flanking Two Basins” feature, which has produced a variety of natural sceneries, such as snow-capped glaciers, grassland wetlands, the Gobi Desert, lakes, and rivers, is what defines its terrain. Thirteen ethnic minorities have created a culturally integrated system with a variety of characteristics in this multiethnic settlement area, which has produced a wealth of natural and cultural tourism resources. The Tianshan Mountains divide Xinjiang into Northern and Southern Xinjiang, while Eastern Xinjiang (Hami and Turpan) is an independent region in the eastern part of Xinjiang, south of the eastern section of the Tianshan Mountains, which is made up of 14 prefectures and cities (Figure 2). Northern Xinjiang, situated north of the Tianshan Mountains, includes the following: Urumqi City, Karamay City, Changji Hui Autonomous Prefecture (Changji), directly administered counties and cities of Ili Kazakh Autonomous Prefecture (Ili), Bortala Mongol Autonomous Prefecture (Bortala), Tacheng Prefecture, and Altay Prefecture. South of the Tianshan Mountains, southern Xinjiang is made up of the areas of Kashgar Prefecture, Hotan Prefecture, Aksu Prefecture, Kizilsu Kirghiz Autonomous Prefecture (Kizilsu), and Bayingolin Mongol Autonomous Prefecture (Bayingolin). Eastern Xinjiang, which includes Hami City and Turpan City, is situated in the easternmost region of Xinjiang, south of the eastern portion of the Tianshan Mountains. With its distinct natural and cultural resources serving as the cornerstone, Xinjiang’s tourism industry clusters have grown into a three-dimensional structure consisting of “one core, three belts, four hubs, and multiple nodes” that is fueled by policies and is speeding up its development into an industrial cluster with a trillion-yuan scale.

2.2. Data Sources

The core data for this study (2009–2023) were obtained from authoritative official statistical sources, including the China Statistical Yearbook (2010–2024), the Xinjiang Statistical Yearbook (2010–2024), annual statistical bulletins, local yearbooks, and publicly available government work reports from the 14 prefectures of Xinjiang. Supplementary transportation-related data were sourced from reports issued by the Xinjiang Department of Transportation to ensure reliability and comparability. Key indicators such as total tourism revenue and tourist arrivals were complete and consistent throughout the study period. A limited number of missing values in auxiliary indicators were addressed using linear interpolation. It should be noted that official tourism statistics have certain limitations: statistical criteria may have changed due to policy adjustments, and reporting practices could vary across different prefectures.

2.3. Research Methods

2.3.1. Tourism Location Quotient (TLQ)

The tourist location quotient has emerged as a key technique for assessing the degree of clustering in the regional tourist industry and is frequently used to precisely measure the degree of specialized agglomeration of the industry [7]. The following is the calculation formula:
T L Q i t = T R i t / G i t T R t / G t
In the formula,  T L Q i t  is the region I tourism location quotient at time t,  T R i t  is the region i total tourism revenue at time t,  G i t  is the region I gross regional product (GRP) at time t,  T R t  is the total tourism revenue of Xinjiang at time t, and  G t  is the GDP of Xinjiang as a whole at time t. The tourism industry in this region has specialized agglomeration if  T L Q i t  > 1. The greater the    T L Q i t  value, the higher the tourism industry’s clustering level.

2.3.2. Local Moran’s I

The local Moran’s I index characterizes the spatial correlation between a geographic entity and its surrounding areas [24]. The following is the calculation formula:
I i = x i x ¯ σ 2 j = 1 N W i j ( x j x ¯ )
For objects i and j within the study area,  x i  and  x j  represent the observed values of the same geographical attribute, with  x ¯  denoting the mean and  σ 2  the variance of  x . The element  W i j  of the spatial weight matrix is constructed based on “queen contiguity” and is row-standardized to eliminate the influence of varying numbers of neighboring units across regions. None of the 14 prefectures/cities in Xinjiang are geographically isolated “islands”, each region has at least one adjacent administrative unit. An empirical distribution of Ii was generated using 999 random permutations to avoid reliance on the normality assumption of the original data. A significance level of p = 0.05 was adopted, regions with p < 0.05 were considered statistically significant spatial clusters, while those with p ≥ 0.05 were regarded as not significant. False discovery rate (FDR) correction was applied to control for Type I error resulting from multiple hypothesis testing across the 14 regions. Local spatial autocorrelation exhibits four types of spatial association patterns: “high-high,” “low-low,” “high-low,” and “low-high” clustering. The first two represent positive local spatial autocorrelation with  I i  > 0, whereas the latter two indicate negative local spatial autocorrelation with  I i  < 0.

2.3.3. Gravity Model

Clusters of the tourist industry are groups of tourism-related organizations that are functionally related and geographically concentrated. One technique for measuring this interrelated relationship is the gravity model, which is used to objectively examine how closely two or more “spatial entities” correlate [25]. By examining the value that interconnectedness brings, it shows the correlation impacts of clusters. In essence, tourism industry clusters are collaborative closed loops including resource integration, visitor flow agglomeration, and consumer conversion, as per the “collaborative logic” of industrial cluster theory. Thus, taking visitor arrivals and tourism income as variables, the size of their correlation effects may be calculated using the following formula [26]:
R i j = P i G i P j G j D i j 2
P i  and  P j , respectively, represent the tourist arrivals of regions I and J, whereas  G i  and  G j , respectively, represent the tourism revenue of regions i and j. The gravity constant is set to 1.  R i j  is the tourism-related gravitational value between regions i and j in the formula. The spatial separation between the two regions is indicated by  D i j . Given that highways serve as the main mode of transportation in each of Xinjiang’s prefectures and that the dominance of highway travel has grown as the percentage of self-driving tours rises,  D i j  in this study uses the shortest highway mileage between the two regions as shown on electronic maps [23], the data is obtained through the Amap Maps API (2023 version).

2.3.4. Gray Relational Model

An essential analytical tool in gray system theory, the gray relational model is primarily used to examine how strongly reference and comparison sequences in a gray system correlate with one another [27].
(1)
Reference sequence (X0): The core reference sequence is defined as the annual average tourism industry cluster level of Xinjiang’s 14 prefectures/cities. The sequence is expressed as:
X 0 = [ X 0 ( 1 ) , X 0 ( 2 ) , . . . , X 0 ( t ) ]
t = 15 (corresponding to the study period 2009–2023); X0(t) denotes the average TLQ of 14 prefectures/cities in year t.
(2)
Comparison sequences (Xi): Twenty indicators related to the Xinjiang tourism industry cluster. Each comparison sequence is expressed as:
X i = [ X i ( 1 ) , X i ( 2 ) , . . . , X i ( t ) ] ( i = 1, 2 , . . . , 20 )
Xi(t) denotes the value of the i-th indicator in year t.
(3)
Normalization procedure: To eliminate the interference of dimensional differences and enhance the comparability of indicators, the mean normalization method is adopted for time-series standardization. The specific formula is:
X i ( t ) = X i ( t ) X i ¯
X′i(t) is the normalized value of the i-th indicator in year t;  X ¯ i = 1 t k = 1 t X i ( k )  is the average value of the i-th indicator over the study period (2009–2023).
(4)
Resolution coefficient (ξ): Following the standard practice in gray relational analysis [22], the resolution coefficient is set to  ξ  = 0.5. This value balances the sensitivity and stability of the correlation coefficient, avoiding excessive concentration or dispersion of results.
(5)
Gray relational coefficient: For each year t, the relational coefficient between the reference sequence X0 and comparison sequence Xi is calculated as:
γ X 0 t , X i t = m i n i m i n t | X 0 t X i t | + ξ m a x i m a x t | X 0 t X i t | | X 0 t X i t | + ξ m a x i m a x t | X 0 t X i t |
m i n i m i n t | X 0 t X i t |  is the minimum difference between all normalized reference and comparison sequence values, and  m a x i m a x t | X 0 t X i t |  is the maximum difference.
(6)
Gray relational degree:
r o i = 1 t k = 1 t γ [ X 0 ( k ) , X i ( k ) ]
The value of ranges from 0 to 1, with values closer to 1 indicating a stronger correlation.

3. Results and Analysis

3.1. Spatiotemporal Synergy Analysis

3.1.1. Temporal Evolution Characteristics

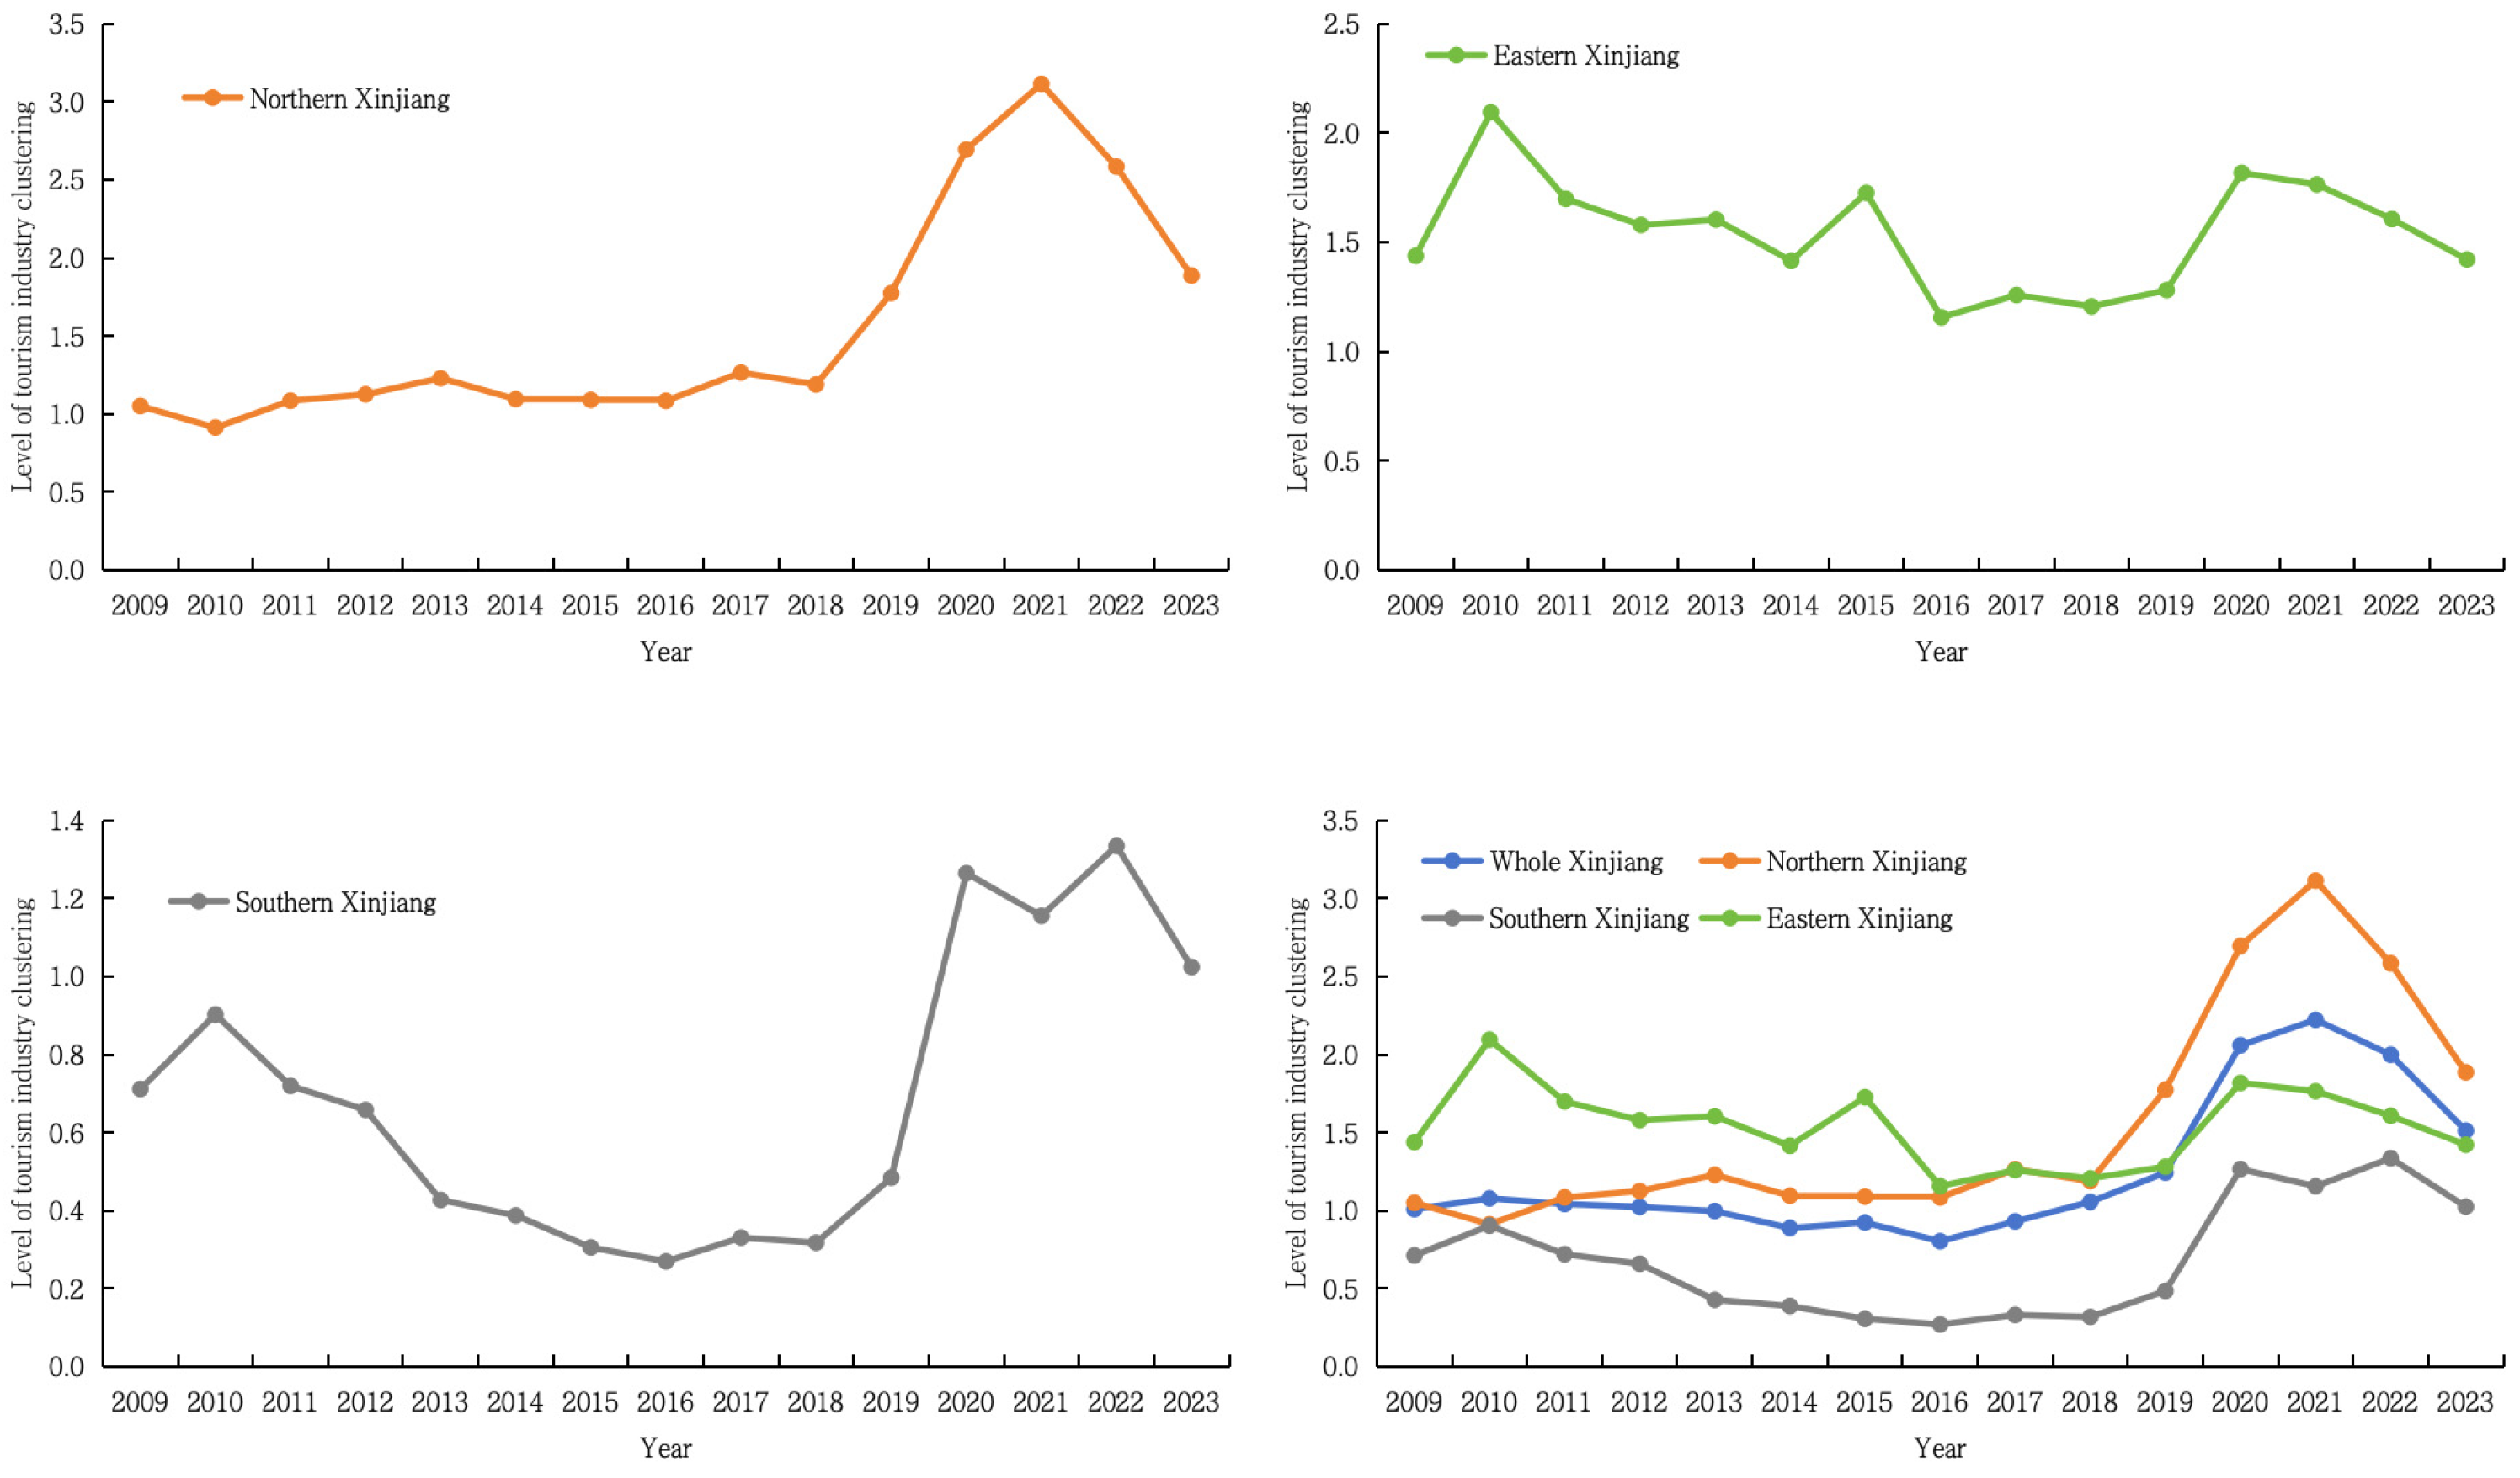
The cluster level of the tourist industry in 14 Xinjiang prefectures and cities was ascertained using the tourism location quotient formula. Figure 3 presents the average TLQ values for the three macro-regions of Northern, Southern, and Eastern Xinjiang. Calculating regional averages serves primarily to capture the macro-level spatiotemporal evolution trends of tourism agglomeration across these major areas. This approach effectively synthesizes overall regional development patterns from the more complex prefecture-level data, clearly delineates inter-regional disparities, and lays the groundwork for subsequent analysis of gradient differences between regions.
From 2009 to 2018, the Tourism Location Quotient (TLQ) remained stable around 1, with a compound annual growth rate (CAGR) of 0.54%, indicating that Xinjiang’ s tourism clusters were in a region-wide incubation phase. Between 2019 and 2021, the TLQ surged to above 2.0, accompanied by a CAGR of 33.79%. During this period, enhanced resource integration between northern and southern Xinjiang drove rapid cluster expansion, marking a vigorous development stage. From 2022 to 2023, the TLQ declined to the range of 1.5–1.8, with a CAGR of −28.1%. In the post-pandemic period, tourism demand shifted toward short-trip in-depth experiences, prompting Xinjiang’ s tourism clusters to transition from “scale expansion” to “quality enhancement.”
Prior to 2018, the northern Xinjiang cluster developed in tandem with the rest of Xinjiang. It entered a phase of rapid ascension after 2018 as a result of policy support and resource integration. Its dominant position was emphasized by a peak in 2021, when its growth trajectory significantly outpaced the average for Xinjiang, solidifying its status as the main driver of regional clustering development. Prior to 2019, the tourism location quotient in southern Xinjiang remained consistently low, indicating a lack of specialized agglomeration and little clustering effects. It rose to 1.0–1.5 after 2019. It showed promise for clustering development, although at a modest level. Before falling to 1.5–2.0, Eastern Xinjiang’s location quotient peaked at 2.0 between 2009 and 2010. It established an early basis for tourism clustering by serving as a transit center for travelers between northern and southern Xinjiang, relying on the Silk Road culture of Turpan and Hami. Its clustering level has been stable at about 1.5 since 2019, offering useful assistance for the cluster growth of Xinjiang as a whole.

3.1.2. Spatial Pattern Characteristics

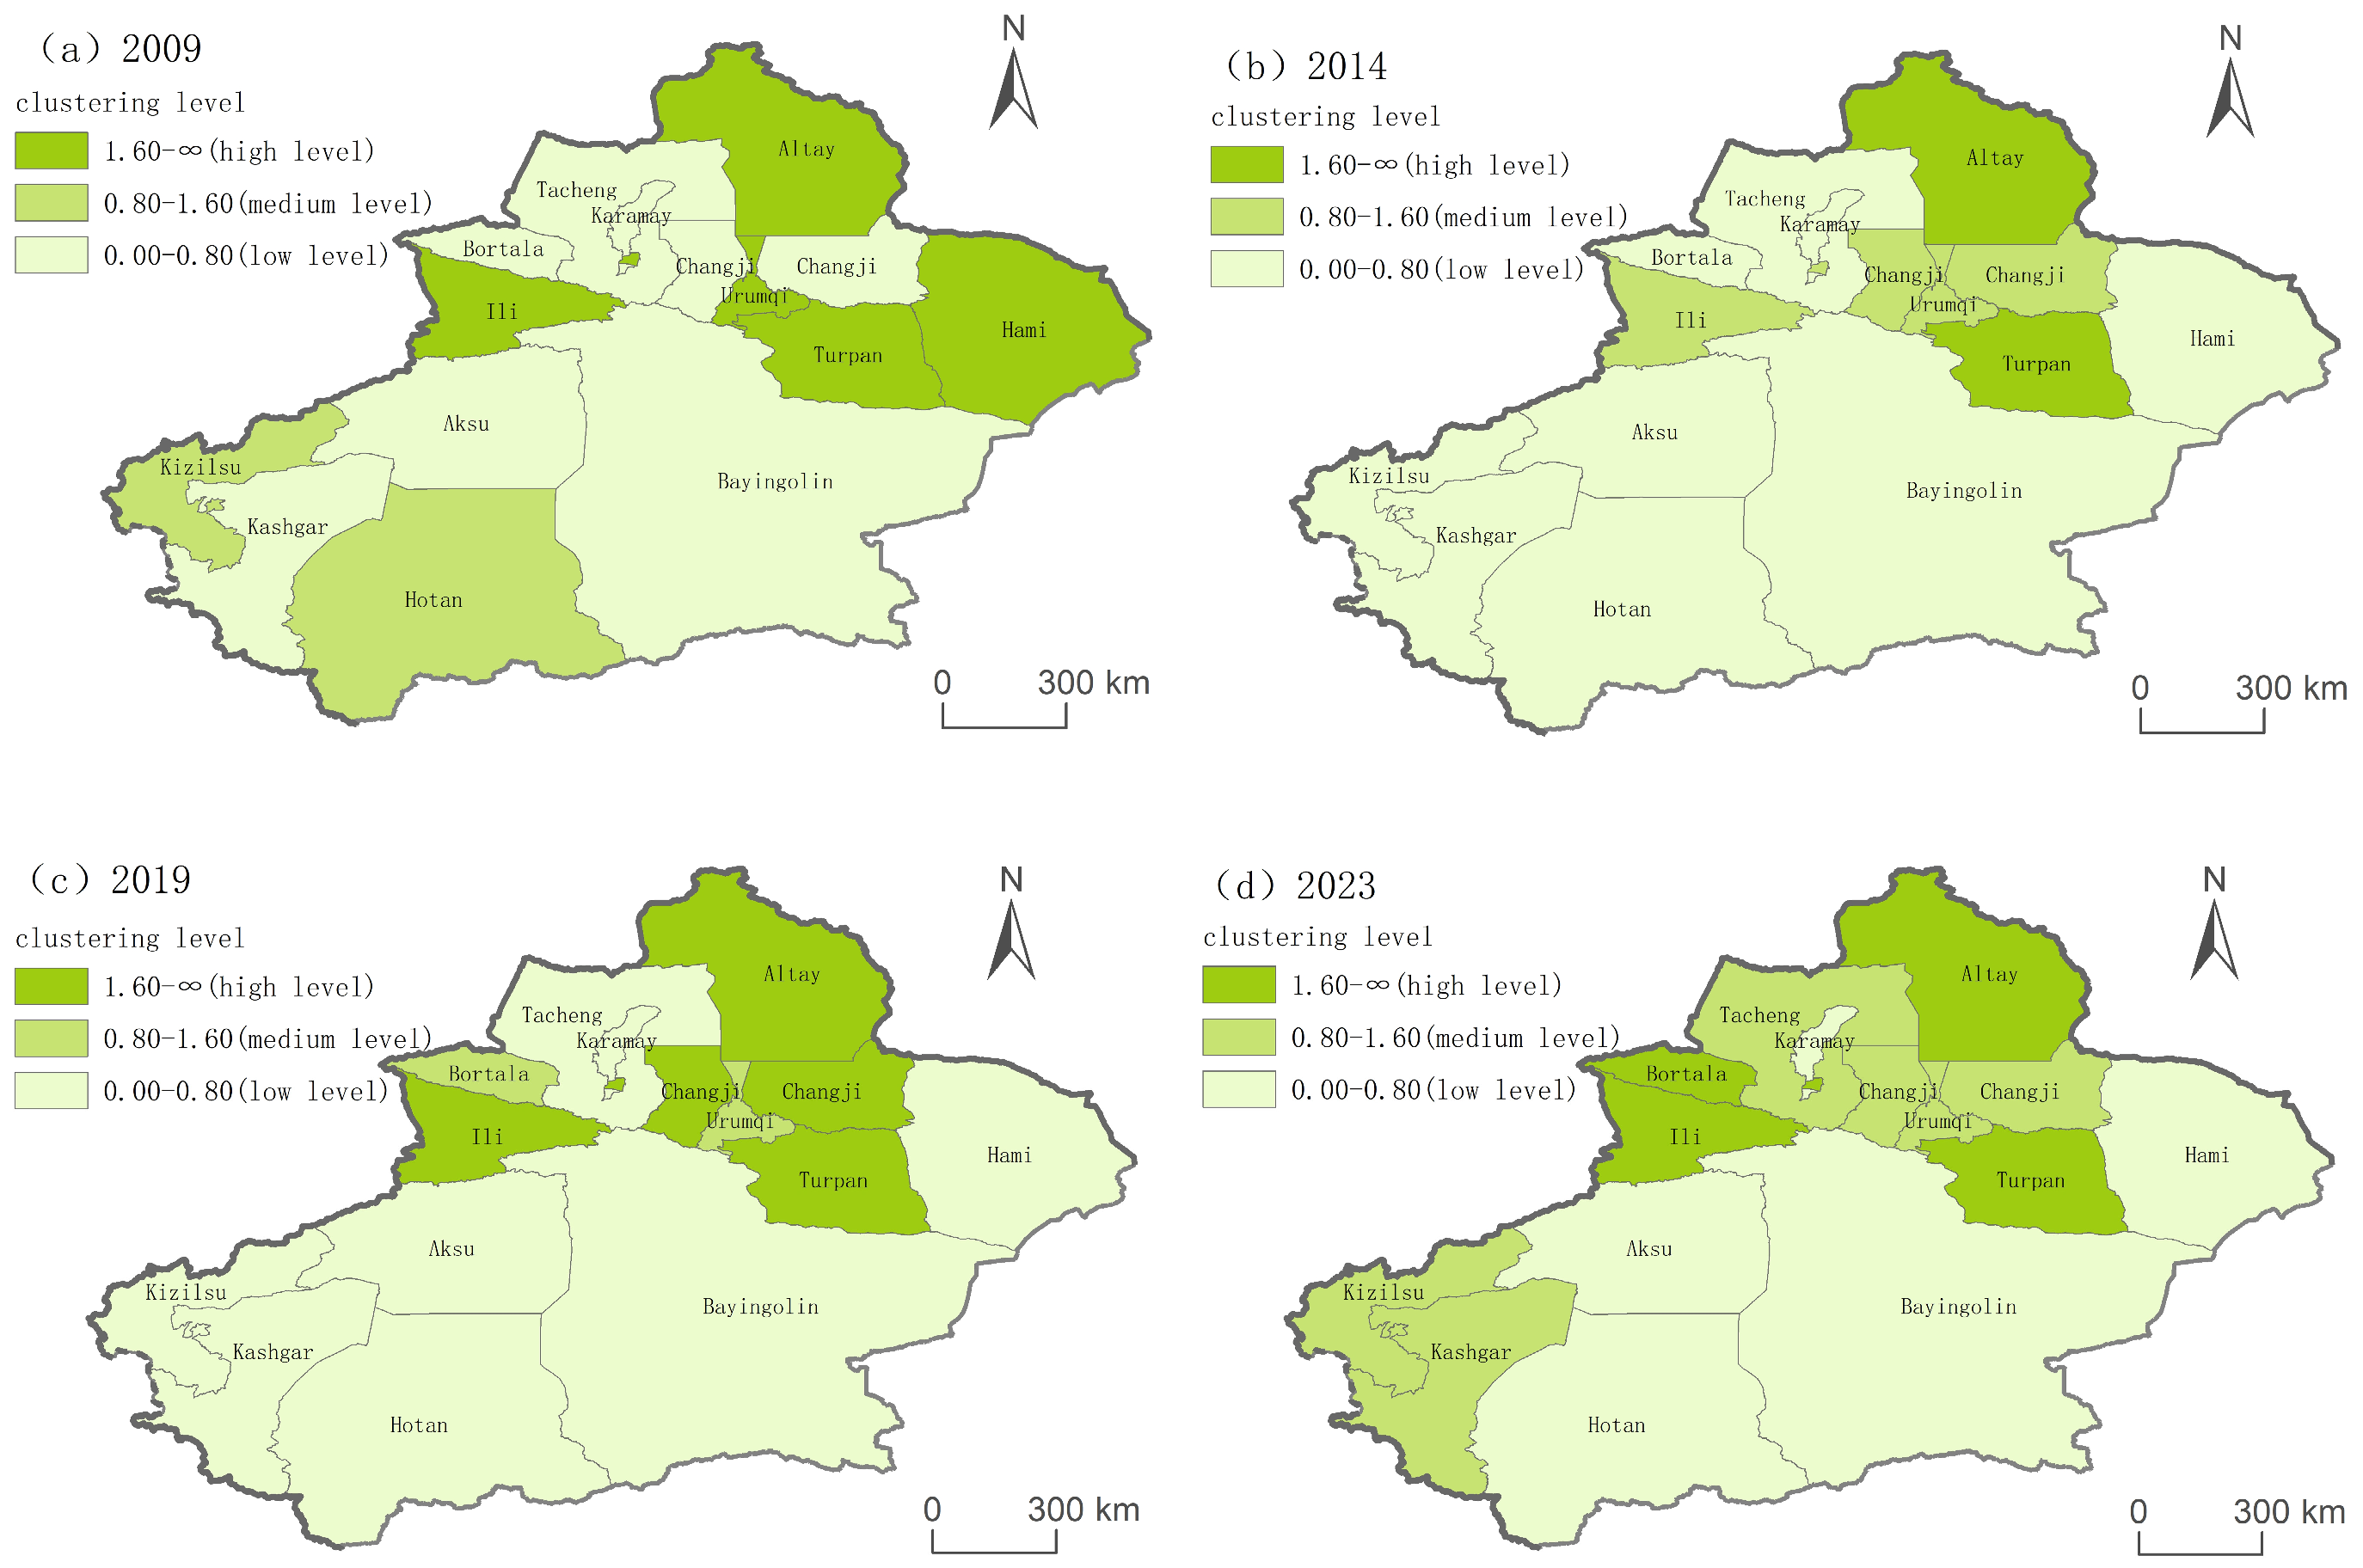
The clustering level of the tourist industry throughout the prefectures and cities of Xinjiang is separated into three categories based on the intrinsic characteristics of the dataset [21]: low level (0, 0.8], medium level (0.8, 1.6], and high level (1.6, ∞). Subsequently, ArcGIS 10.8 software was employed to directly visualize the individual agglomeration levels of all 14 prefectures/cities for four distinct time points: 2009, 2014, 2019, and 2023. The corresponding results are displayed in Figure 4.
Northern Xinjiang was not statically positioned as the traditional core area of clusters. Owing to factors such as competitive diversion, Urumqi (1.9713 → 1.5909), previously maintaining a high-level clustering development relying on its capital status, gradually experienced a decline. Together with the directly administered counties of Ili Prefecture and Altay Prefecture, Bortala Prefecture (0.5564 → 2.8271) and Tacheng Prefecture (0.3462 → 1.0417), on the other hand, have achieved a leap from low to high levels, creating a new “multi-polar support” clustering development pattern in Northern Xinjiang. There has been a two-way differentiation in Eastern Xinjiang: Hami City (1.4121 → 0.6195) fell from medium to low level, becoming a “developmental depression” within Eastern Xinjiang’s clusters, while Turpan City (1.4637 → 2.2226) has steadily enhanced its tourism brand influence, moving from medium to high clustering level. While Southern Xinjiang stayed in “low-level clustering” for a long time, Kashgar Prefecture (0.7702 → 1.1695) and Kizilsu Kirghiz Autonomous Prefecture (0.9398 → 0.8668) made significant strides based on their geographical advantages; the former went from low to medium level, while the latter maintained the bottom line of medium level despite fluctuations, giving Southern Xinjiang’s clustering development a boost.
Turpan City, the Tacheng area, and other prefecture-level cities have made cross-level breakthroughs and are now the driving force behind cluster upgrading; Karamay City, Bazhou, etc., have been stuck in low-level development for a long time, revealing the weakness of insufficient cluster momentum; and the Alatai region continues to maintain a high level of cluster development, demonstrating sustained competitiveness. The ‘U-shaped’ recovery of lli Prefecture and Kizilsu Kirghiz Autonomous Prefecture, the ‘cyclical fluctuations’ of Changji Prefecture…” the weakening of Urumqi’s core position, and the lagging decline of Hami City all illustrate the stage characteristics and resilience variations in Xinjiang’s tourism industry cluster development.
Overall, between 2009 and 2023, the tourism industry clusters in Xinjiang showed a spatial gradient differentiation pattern that was defined by “Southern Xinjiang Lag, Eastern Xinjiang Differentiation, and Northern Xinjiang Core Agglomeration.” However, driven by the dynamic interaction between changes in cluster core areas and peripheral innovations, the north–south TLQ ratio initially surged to a peak of 4.02 before falling back to 1.84, spatial pattern transitioned from a “fixed gradient” to “collaborative evolution”.

3.1.3. Spatial Agglomeration Characteristics

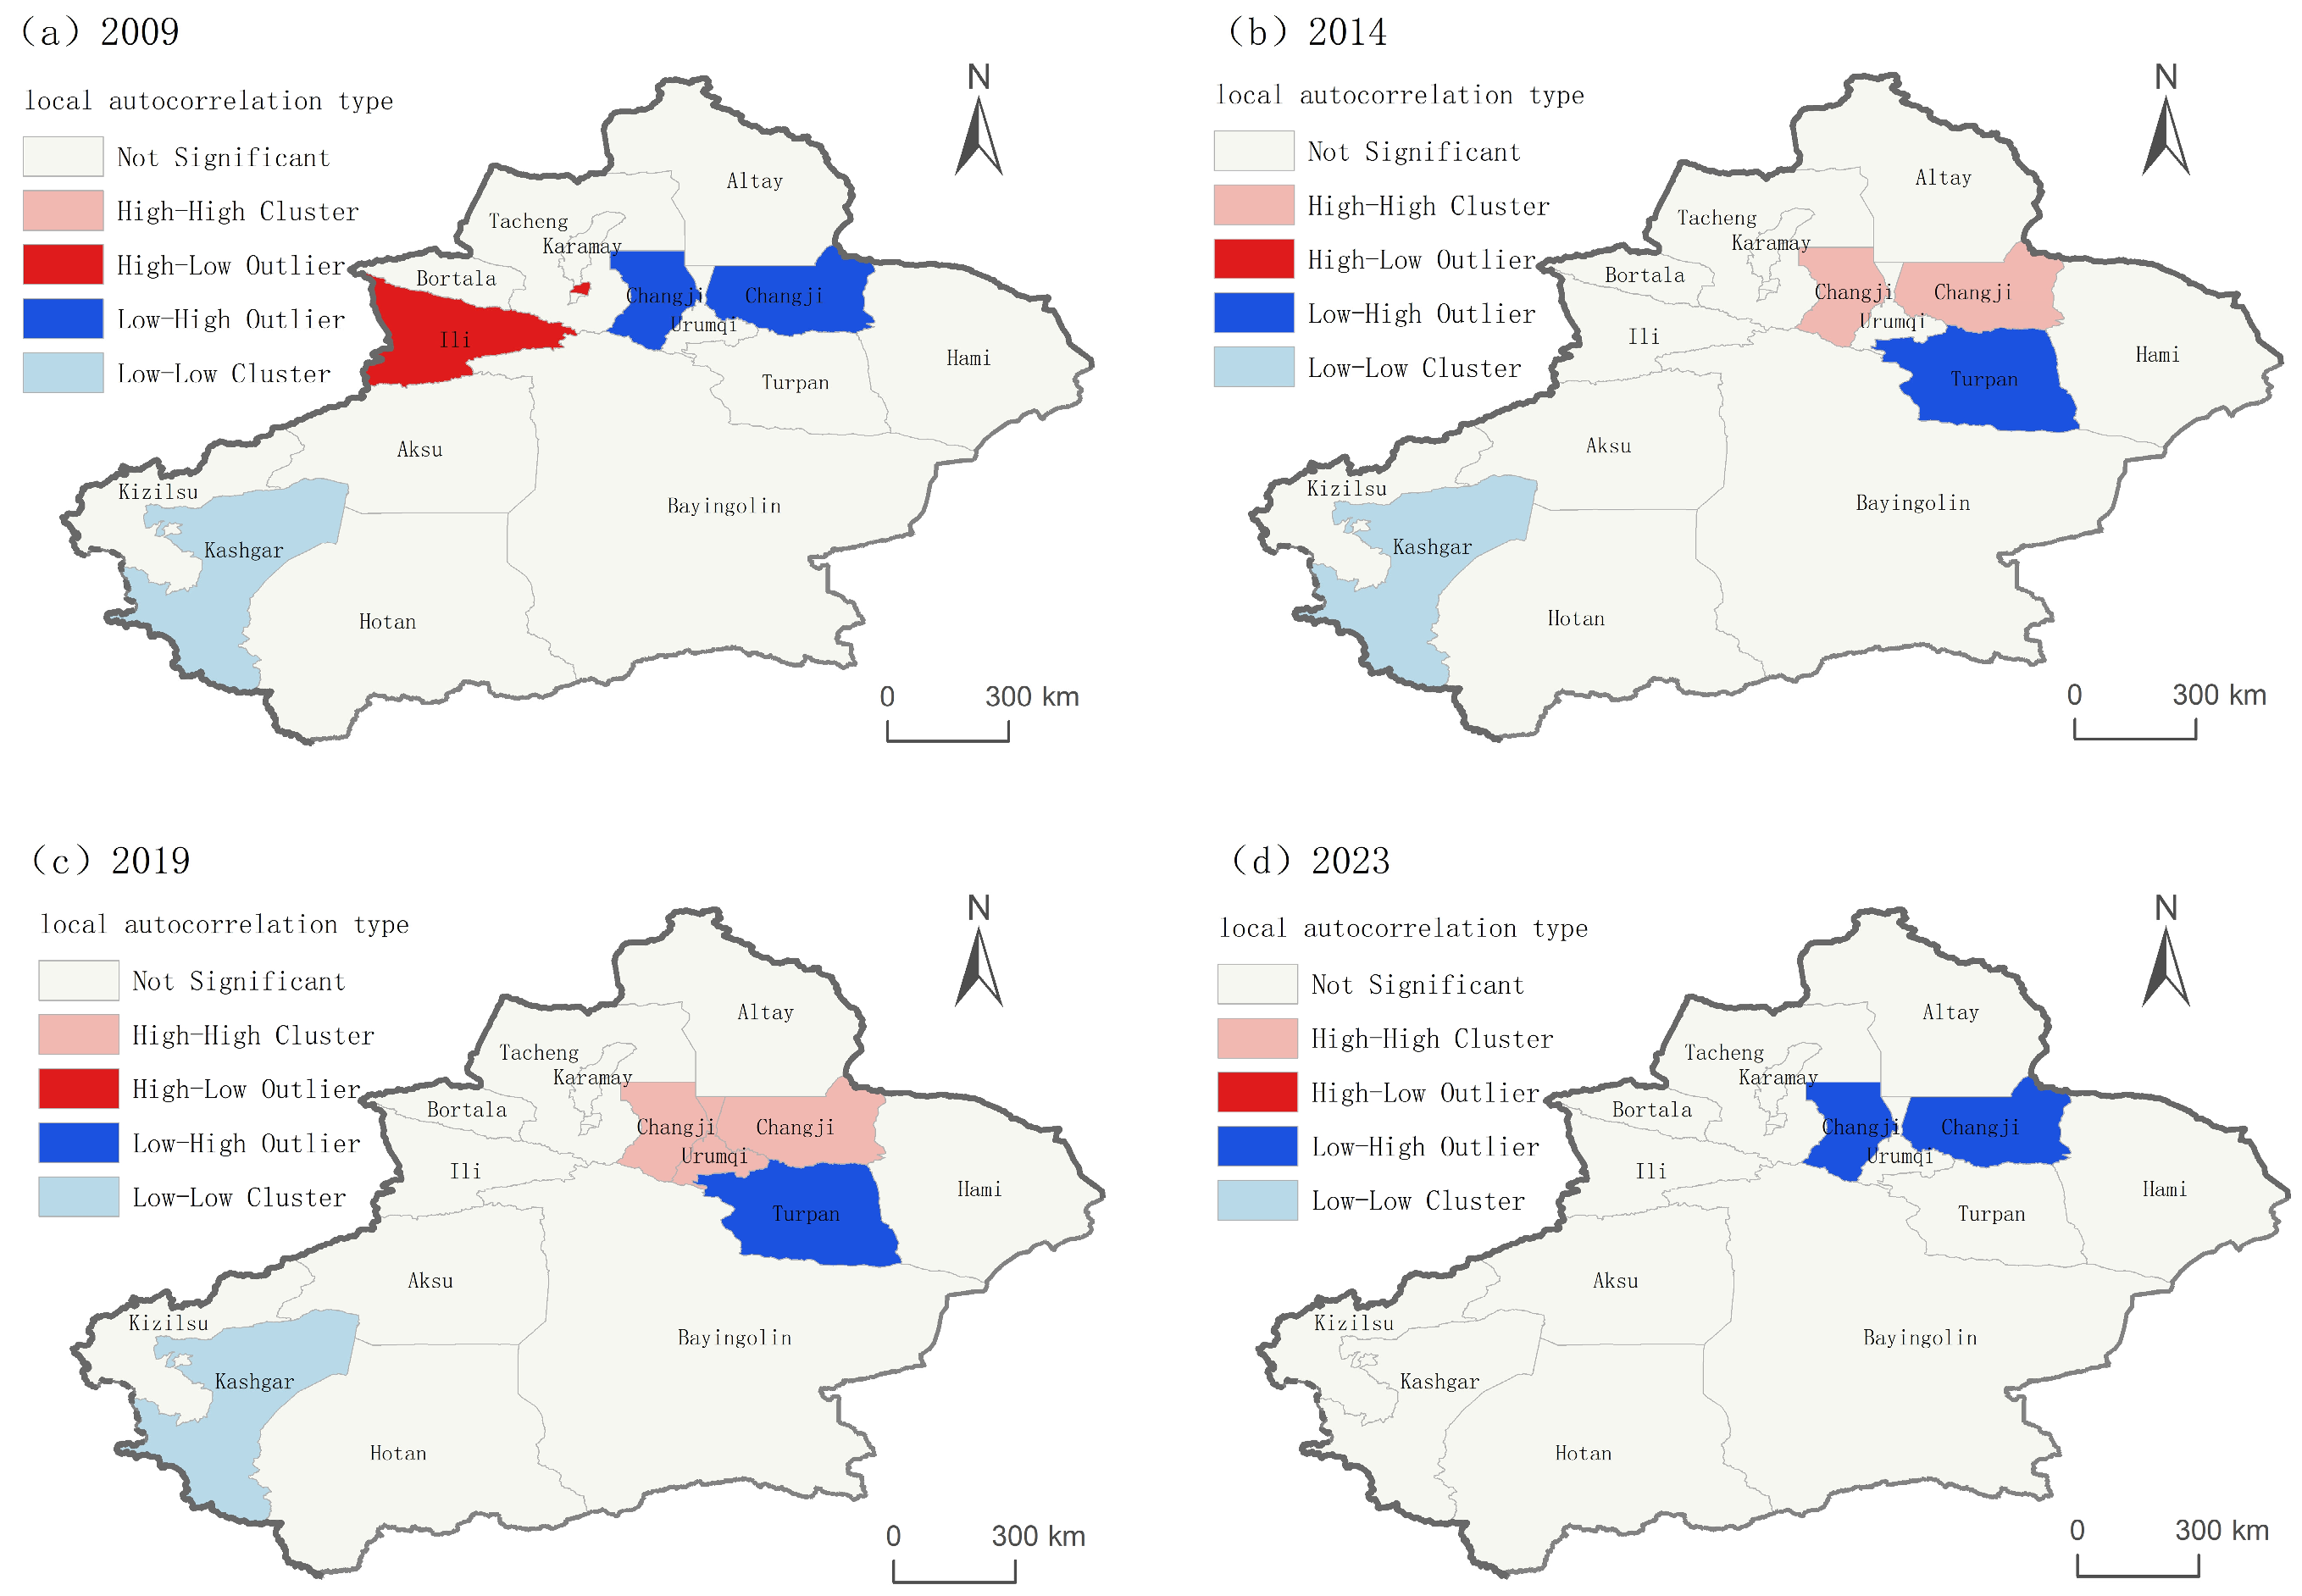
A local clustering map (Figure 5) was created using ArcGIS software after the local Moran index of the clustering level of the tourism industry in 14 Xinjiang prefectures and cities was calculated at four different time points. It was revealed that high-high clustering regions were mostly located in northern Xinjiang, and low-low clustering areas were found in southern Xinjiang. This implies that “high clustering in the north” and “low clustering in the south” are spatial clustering distribution traits present in the tourism industry cluster of Xinjiang.
Of these, the Changji region was at the forefront of the spatiotemporal evolution of high-high agglomeration in 2014, and it expanded to Urumqi in 2019. This suggests that the core cluster in northern Xinjiang had an early positive geographical spillover impact. However, because of the heightened competition of core prefecture-level cities in tourism-related elements and the varied degrees of deterioration in the growth potential of peripheral prefecture-level city clusters, Changji Prefecture will reverted to a low-high agglomeration state in 2023. In 2009, the Ili Prefecture experienced high-low agglomeration because of its cluster advantage of giving priority to the development of tourism resources; however, the cluster transmission effect was impeded by factors like resource heterogeneity and lagging transportation networks in neighboring prefectures. In 2014 and 2019, Turpan City saw a concentration of low-high clustering. Turpan passively absorbed tourist spillover from the core region because of its physical proximity to Urumqi, but it stayed in a low-level dependent condition for a long time because of limitations like product homogeneity. Kashgar Prefecture was traditionally the hub of low-low clustering, which indicated a low-level lock-in of the Southern Xinjiang tourism industry agglomeration. However, Kashgar left low-low clustering in 2023, indicating that the gradient gap between the cluster development of Northern and Southern Xinjiang had partially narrowed, the local vitality of the tourism industry cluster had been unleashed, and the low-level clustering status in parts of Southern Xinjiang had been broken.

3.2. Correlation Impact Analysis

3.2.1. Horizontal Correlation Effect Analysis

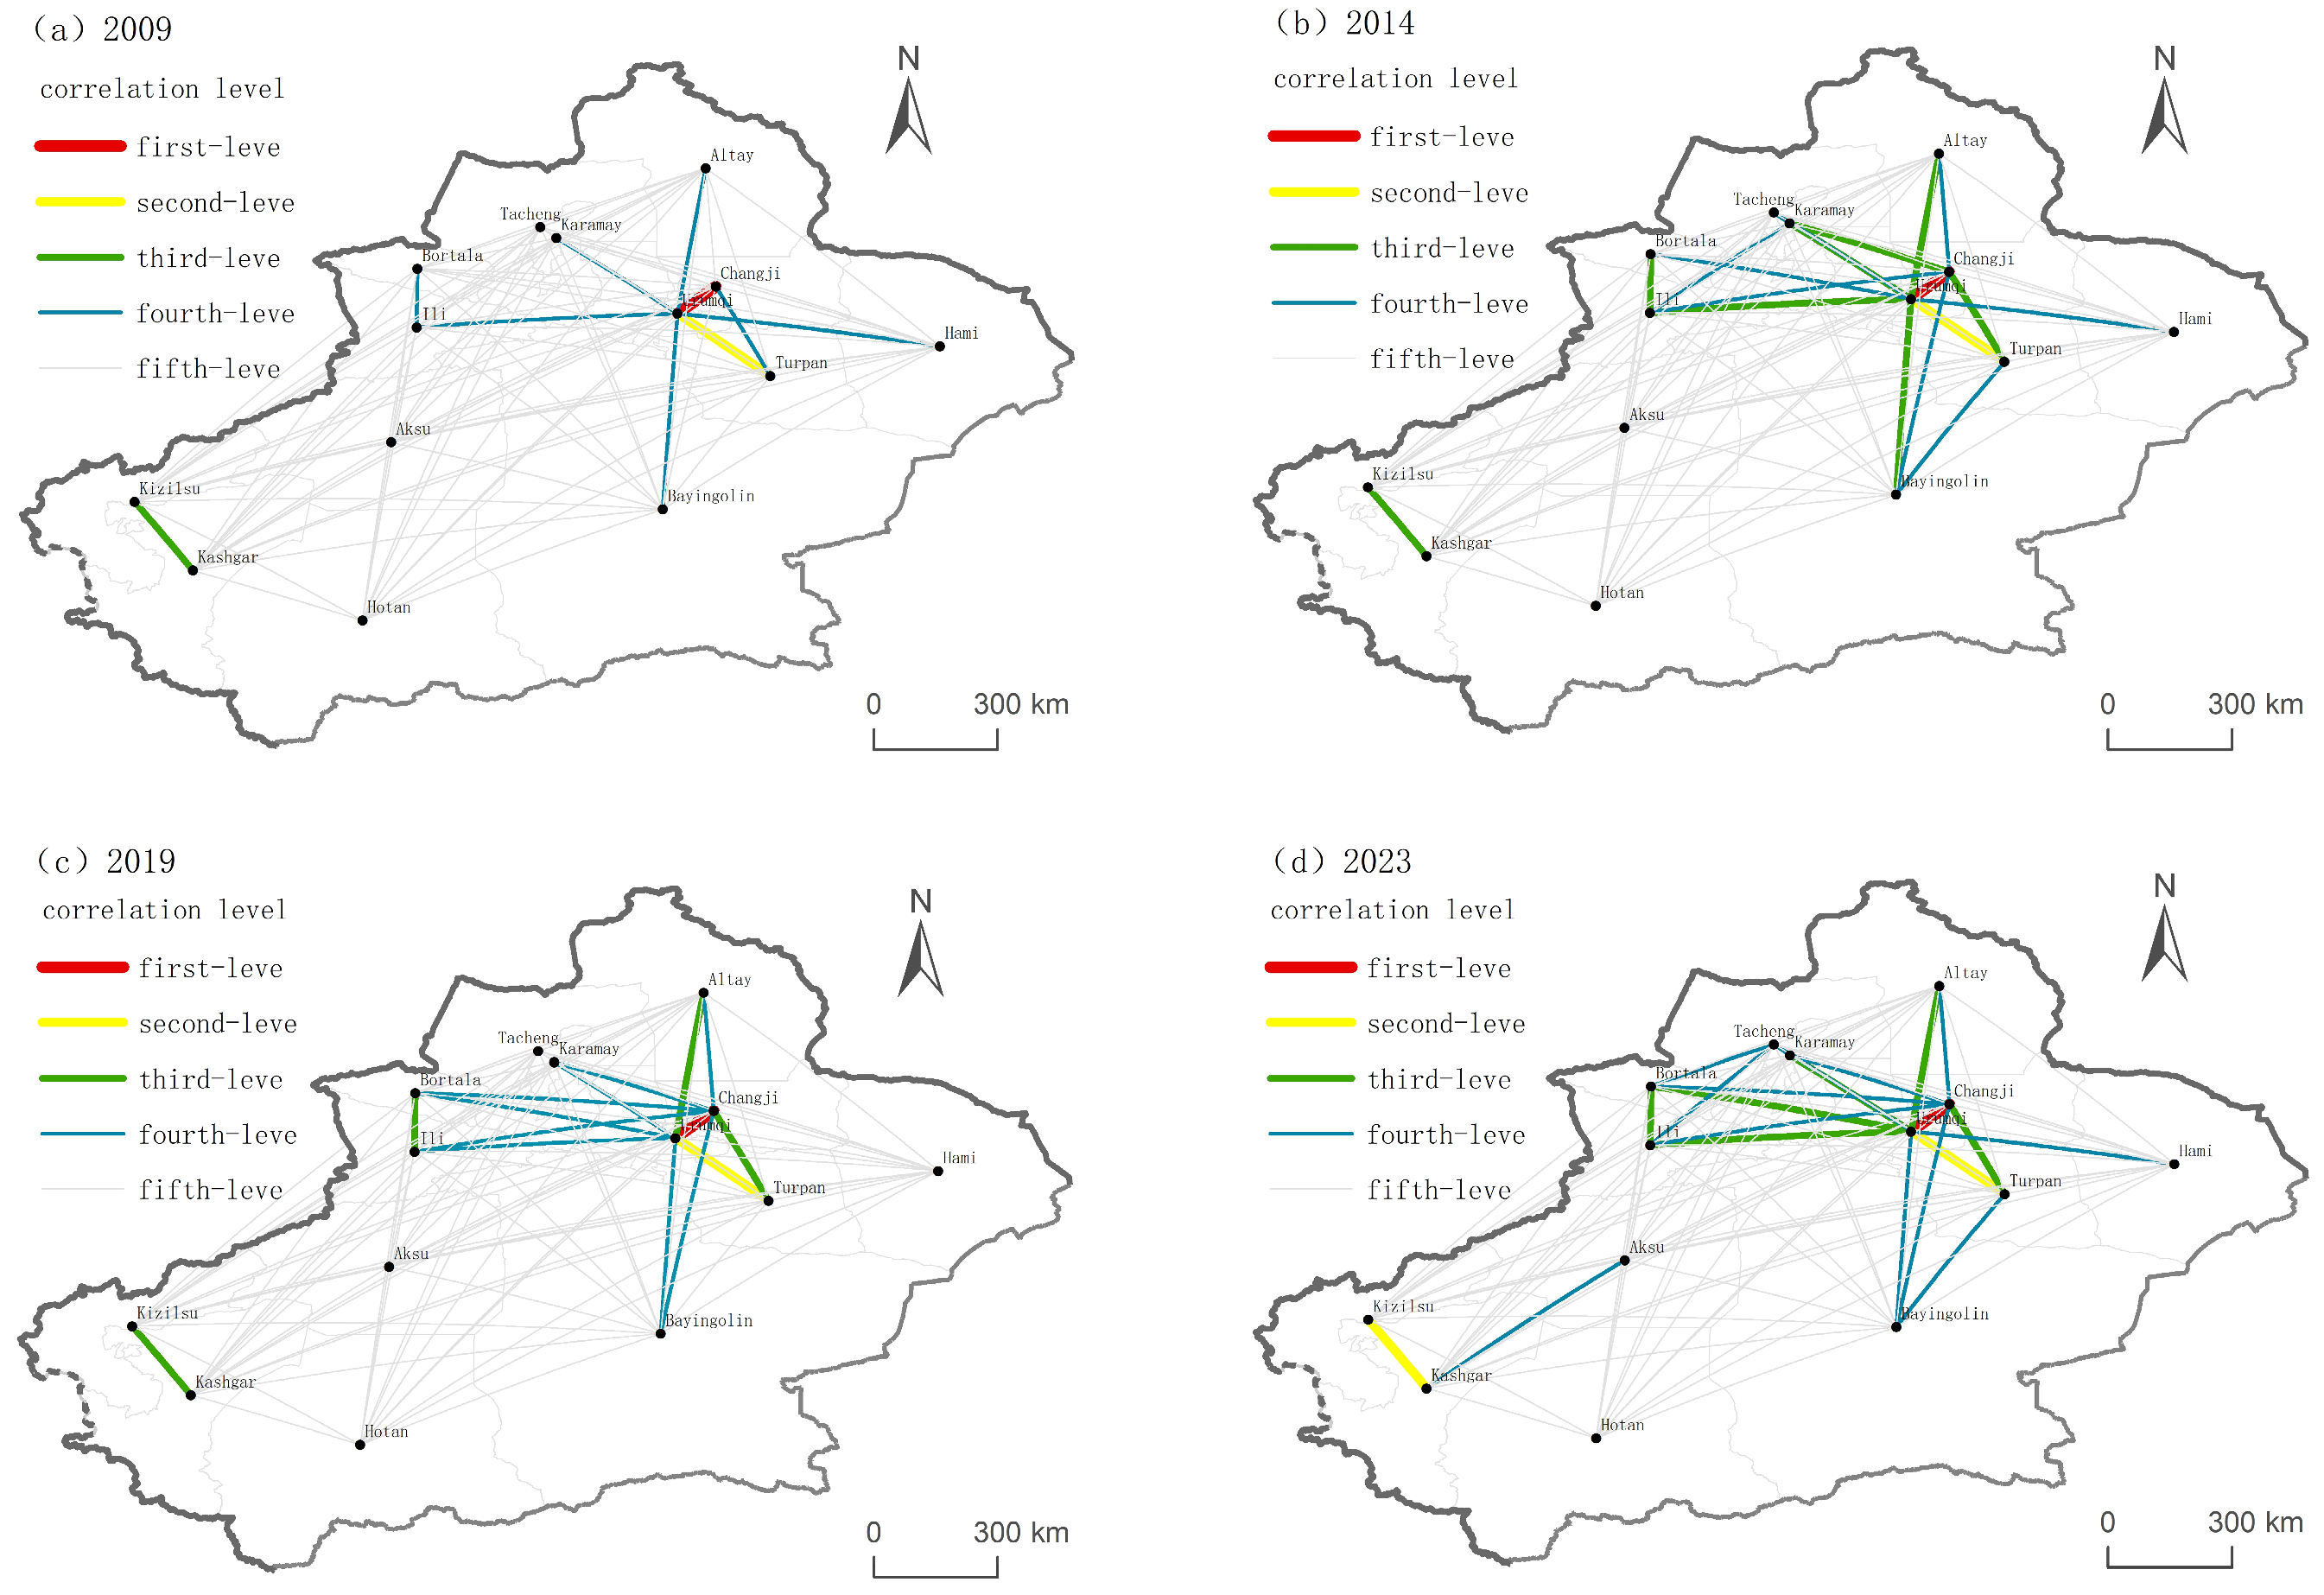
Tourism cluster correlation gravitational values in various Xinjiang areas were computed using the Gravity Model formula. Figure 6 shows the results of the classification of these values into Level 1 to Level 5 correlations by breakpoints using ArcGIS software. The correlations between each pair of regional clusters were then used to further form the regional correlation network of Xinjiang’s tourism industry clusters.
Temporally speaking, the southern Xinjiang clusters primarily had weak five-level links, but the northern Xinjiang clusters formed a single core radiation with Urumqi city in 2009. High-level correlations among northern Xinjiang clusters were confined to adjacent regions. When the counties and cities directly under Yili Prefecture were first connected to the core network in 2014, the correlation effect among Changji Prefecture, Turpan City, and Urumqi City increased significantly, exposing the early stages of a multi-node cluster network in northern Xinjiang. The multi-axis cluster network known as “Urumqi Changji Prefecture Turpan Ili Prefecture Direct” was established in 2019, and the Southern Xinjiang clusters remains on the periphery. In 2023, the South Xinjiang cluster starts to make significant strides, while the North Xinjiang cluster network’s complexity keeps improving. There is now a four-level relationship between Kashgar and Aksu, and the level of association between Kashgar and Kizilsu has increased. The North and South clusters’ gradient differences are starting to close.
Because of its close proximity and easy access to transportation, the northern Xinjiang cluster has developed a notable high-level correlation effect from the standpoint of spatial differentiation. Although the southern Xinjiang cluster has long been dominated by five-level weak correlation effects, the upgrading of linkage between Kashgar and Kizilsu reflects the potential for resource synergy and channel construction. Yili Prefecture has emerged as the growth pole of the western cluster with its characteristic resources, Changji Prefecture and Turpan City have become functional extension poles with their proximity advantages, and Urumqi has always been the core hub.
All things considered, Xinjiang’s tourist industry cluster has developed from a single core radiation to a multi-axis network, and the correlation effect is still getting stronger. The progressive integration tendency of Xinjiang’s tourist industry cluster in gradient differentiation is demonstrated by the new “north-south linkage” opportunities brought about by the local innovations in the southern Xinjiang cluster.

3.2.2. Analysis of Vertical Correlation Effect

Based on gray correlation theory, the reference sequence (X0) is the clustering level of Xinjiang’s tourism industry from 2009 to 2023. Drawing on previous research findings [20], six core factors directly associated with tourism industry cluster growth-economic support, tourism transportation, residents’ living standards, environmental quality, tourism services, and tourism destination attractiveness-were first identified as the comparison sequence.
Human resources and information resources are then incorporated, along with the objectives and specifications of the guiding document “Development Plan for Cultural and Tourism Industry Clusters in Xinjiang Uygur Autonomous Region (2025–2030).” The “Plan” bases each cluster correlation deployment on the idea that “information resources can be shared and human resources can flow.” In light of the available indicator data, this article chooses the following eight core indicators and then breaks them down into 20 subsidiary indicators (Table 1).
The gray correlation model was used to calculate the gray correlation values between each correlation component and the tourist industry’s clustering level in Xinjiang (Table 2). Tourism destination attractiveness (0.7486), economic support (0.7303), residents’ living standards (0.7029), human resources (0.6928), environmental quality (0.6814), tourism transportation (0.6793), information resources (0.6775), and tourism services (0.6739) are the eight primary indicators that exhibit a strong correlation effect with the Xinjiang tourism industry cluster (X0). The growth of the Xinjiang tourist industry cluster is the outcome of the synergistic influence of multidimensional correlation variables, as confirmed by the correlation values of the 20 secondary indicators, all of which surpass 0.6. The gradient disparities between these correlation effects indicate the possible breakthrough route for development of the Xinjiang tourist industry cluster, in addition to reflecting the magnitude of each dimension’s influence.
The quantity of domestic travelers and added value of the tertiary industry are the two most important criteria from the standpoint of secondary indicator stratification, with a correlation value greater than 0.75, the domestic tourist volume serves as a key driving factor, which is in line with findings from studies on other regions [28,29], reflecting the heavy reliance of Xinjiang’ s tourism cluster on the domestic market. The growth of the tertiary industry supports the development of tourism clusters, while mature tourism clusters also stimulate local consumption, increase employment, and further drive the expansion of the tertiary sector. It is important to emphasize that gray relational analysis captures correlations, and the observed associations indicate a bidirectional interactive relationship between each relevant factor and the formation of the tourism industry cluster. Six indicators make up the core support system, such as GRP and The quantity of foreign visitors, which have correlation values between 0.7 and 0.75. The other factors, on the other hand, have weak correlation effects and fall between 0.6 and 0.7, but because they cover the whole tourism ecological chain, they have emerged as potential areas for optimization.
Tourism destination attractiveness (0.7486) has the strongest correlation with Xinjiang’s tourism industry cluster, with the number of domestic and foreign tourists (0.7751 and 0.7220, respectively) as the core supporting secondary indicators. Together, they form the main force behind the effective growth of Xinjiang’s tourism industry cluster. The complete dominance of domestic travel sources emphasizes Xinjiang’s appeal in the domestic travel market, while the high ranking of foreign visitors also reflects the accumulation of their foreign reputation. Added value of the tertiary industry (0.7503) stands out among the economic support variables (0.7303). Added value of the tertiary industry, a crucial part of the tertiary industry, emphasizes the correlation effect between the tertiary industry and Xinjiang’s tourism industry cluster. The GRP (0.7287) and per capita GDP (0.7120) show that the economic foundation supports the growth of Xinjiang’s tourism industry cluster from both the macroeconomic and per capita levels.
The transfer of consumption is the primary focus of the secondary indicators under the Residents’ living standards factor (0.7029). Total consumer goods retail sales (0.7026), urban residents’ per capita disposable income (0.7065), and per capita consumption expenditure of urban residents (0.6995) all amply illustrate the “income growth-demand release-consumption upgrade” pathway, reaffirming the close relationship between the quality of life of the local population and the tourism industry cluster in Xinjiang. Although transportation and service factors may appear intuitively important, their correlation values are relatively low. This is due to Xinjiang’s vast geography, where improvements in transport infrastructure have not kept pace with the spatial expansion of tourism clusters, and the homogenization of tourism services has failed to create differentiated competitive advantages. The development of Xinjiang’s tourism industry cluster is based on the foundational framework of other primary indicators, such as human resources and environmental quality, which have lower correlation values than the top three categories. These indicators cover supporting elements such as talent reserves, ecological safeguards, transportation accessibility, information convenience, and service quality.

4. Conclusions and Discussion

4.1. Conclusions

Tourism Location Quotient (TLQ) and Local Moran’s I were used to analyze the spatiotemporal evolution of Xinjiang’s tourism industry clusters, while the Gravity Model and Gray Relational Model (GRM) were applied to explore their correlation effects. The following are the findings of the study:
(1)
Over the study period, Xinjiang’s tourism industry clusters exhibited a sequential evolution pattern characterized by “Southern Xinjiang gradually catching up, Eastern Xinjiang initially flourishing then weakening, and Northern Xinjiang taking the lead in breakthroughs.” Although intra-regional differences progressively decreased, the cluster showed a gradient differentiation pattern with “Northern Xinjiang as the core, Eastern Xinjiang diverging, and Southern Xinjiang lagging” in terms of geography. A “fixed gradient” gave way to “cooperative evolution” in the spatial pattern. The traditional core cluster region in Northern Xinjiang is not fixed. While Southern Xinjiang has long been in a “low-level” range, Eastern Xinjiang is polarized. But with their unique physical features, the Kashgar area and Kizilsu Kirghiz Autonomous Prefecture have made strides that have energized Southern Xinjiang’s cluster-based growth.
(2)
Although there is dynamic evolution within these clusters, the Xinjiang tourist industry clusters show spatial distribution patterns that are defined by “high concentration in the north” and “low concentration in the south.” During the early stage of cluster growth in the central area of Northern Xinjiang, Changji Prefecture led the way in the construction of a high-high cluster, which subsequently spread into Urumqi City, illustrating the beneficial geographical spillover effects. Turpan City, which is geographically close to Urumqi but has long maintained a low-level dependent state because of limitations such as product homogeneity, is the center of low-high clustering. Kashgar Prefecture has long been the core of low-low agglomeration, resulting in low-level lock-in of tourism industry clusters in Southern Xinjiang. However, Kashgar later broke free from low-low agglomeration, narrowing the gradient gap between tourism industry clusters in Northern and Southern Xinjiang and ending the low-level classification in several areas of the province.
(3)
From a single-core network structure based on Urumqi to a multi-axis cluster network anchored by “Urumqi-Changji Prefecture-Turpan City-Ili Prefecture,” the horizontal linkage effects within Xinjiang’s tourist industry cluster have changed. Although overall strength is still lower than in northern Xinjiang, clusters throughout southern Xinjiang show a tendency toward upgrading from single-node to regionally coordinated links. Economic support factors and tourism destination attractiveness are core drivers of the vertical linkage effects of Xinjiang’s tourist industry clusters. Among them, added value of the tertiary industry and the quantity of domestic travelers are important factors. While the lonkage potential of tourism transportation and services remains untapped, factors like residents’ living standards and human resources show minor linkage impacts.

4.2. Policy Implications

Therefore, based on empirical mechanisms, this study proposes the following optimization directions:
(1)
Optimize regional layout: Northern Xinjiang avoids homogenization with differentiated resources and adheres to ecological red lines; Southern Xinjiang improves transportation with Kashgar as the core to drive ethnic groups into cultural tourism for income; Eastern Xinjiang strengthens multi-ethnic characteristic products, links North–South Xinjiang, and narrows Hami’ s gap through cultural tourism employment, laying a foundation for sustainable development.
(2)
Enhance regional coordination: Upgrade transportation networks ecologically, activate Southern Xinjiang’ s cultural-tourism alliances to integrate multi-ethnic resources and promote collaborative employment; build digital platforms to train remote ethnic groups in green operations, sharing cluster dividends sustainably.
(3)
Improve cluster quality: Enrich domestic tourist experiences with immersive ethnic activities, integrate with the tertiary sector to boost ethnic employment; increase residents’ income in ethnic areas and cultivate cultural-literate talents; standardize services with ethnic and environmental requirements, realizing economic, cultural and ecological synergy for sustainable development.

4.3. Discussion

The core contribution of this study lies in integrating the spatiotemporal evolution and linkage effects of tourism industry clusters in Xinjiang into a unified analytical framework. Research on tourism clusters has long been a key focus in international tourism studies [30,31], with spatial patterns and interregional linkages emerging as frontier topics examined across various countries and regions [32,33,34]. These international works, concentrating on cluster evolution, synergy mechanisms, and regional development, resonate with and validate the generalizability of our findings. Our comprehensive analysis reveals that tourism industry clusters in Xinjiang exhibit notable spatiotemporal disparities and follow multiple driving logics. Their developmental pattern unfolds within a framework characterized by “Northern Xinjiang dominance, core radiation, and a north–south divide,” which aligns with existing research on the region [35,36,37]. On one hand, building upon prior cluster measurements at the prefectural level in Xinjiang, this study provides a more refined analysis of cluster evolution across both temporal and spatial dimensions, while also incorporating the development dynamics of Eastern Xinjiang—a gap previously overlooked [38]. On the other hand, the analysis of cluster linkage effects indicates that tourism clusters in Xinjiang not only demonstrate network connections between core and peripheral areas within the region [39], but are also deeply embedded within a tourism–economy–ecology coupled system [40]. Although the enhancement of cluster development exerts significant spillover effects on regional economic growth, it remains constrained by factors such as environmental quality, underscoring the necessity of seeking balance in the development process.
In order to examine the spatiotemporal evolution of the tourist industry clusters in Xinjiang, this study integrates temporal and geographical dimensions and builds on previous theoretical methods. It exposes patterns and features that offer theoretical underpinnings for the effective development of Xinjiang’s tourist industry clusters by analyzing their associated impacts across two dimensions: horizontal and vertical. Furthermore, this integrated methodological framework exhibits strong universality and transferability, owing to its effectiveness in capturing the spatio-temporal evolution and associative effects of tourism industry clusters. By tailoring its core components—including the spatial weight matrix, indicator system, and spatio-temporal scale—to the specific geographical, economic, and institutional contexts of a region, researchers can effectively uncover the spatio-temporal dynamics and linkage mechanisms underlying various tourism clusters. But there are restrictions: First, a more detailed examination of the internal cluster components (such as “food, lodging, transportation, sightseeing, shopping, and entertainment”) could not be conducted due to data acquisition limitations, which limited the measurement of tourism industry clusters to the macro level in order to evaluate their relative status. Furthermore, although the study found that economic support and destination appeal were key correlation variables for the tourist industry clusters in Xinjiang, it was unable to differentiate between the various correlation mechanisms in northern, southern, and eastern Xinjiang. Nonlinear correlation effects were not adequately captured either. Therefore, subsequent research should focus on enhancing analytical precision, integrating spatial models, and obtaining more granular cluster measurement data. By utilizing micro-firm data and tourism flow big data, integrating spatial econometric models with non-linear panel methods, researchers can strengthen the analysis of dynamic correlation effects and refine the spatial correlation logic tailored to the distinct regional characteristics of northern, southern, and eastern Xinjiang.

Author Contributions

J.J.: Topic conception, research design, data collection and organization, data analysis and interpretation, paper writing, literature review, formatting standards. J.H.: Determine research direction, review and refine research approaches, guide method selection and result validation, resolve academic challenges, and revise and finalize the thesis. S.C.: Assisted in data collection, provided suggestions on research methods, proofread the manuscript, and organized figures and tables. B.C.: Provided primary research data and offered revisions to the manuscript based on industry practice perspectives. All authors have read and agreed to the published version of the manuscript.

Funding

This research was supported by the National Natural Science Foundation of China (42261062), the Xinjiang Social Science Foundation (2023BYJ030), and the think tank project of the Autonomous Region Philosophy and Social Sciences Innovation Platform “Xinjiang Normal University Cultural Enrichment Research Institute” (ZK2024W08).

Institutional Review Board Statement

Not applicable.

Informed Consent Statement

Not applicable.

Data Availability Statement

The original contributions presented in this study are included in the article. Further inquiries can be directed to the corresponding authors.

Acknowledgments

Thank you to everyone who contributed to this study.

Conflicts of Interest

The authors declare no conflicts of interest.

References

  1. Wang, Y.N.; Liu, S.H. A Review of the Development of Tourism Industry Agglomeration at Home and Abroad. Resour. Dev. Mark. 2016, 32, 103–107. [Google Scholar]
  2. Wang, S.C. How to Achieve the New Goals of Cultural and Tourism Development in Xinjiang. China Cult. Dly. 2025, 12, 008. [Google Scholar]
  3. Yu, Z.Y.; Song, Z.G.; He, Q.S. Tourism Industry Clusters: A Research Review and Prospect. Resour. Dev. Mark. 2024, 40, 1058–1066. [Google Scholar]
  4. Cárdenas-García, P.J.; Brida, J.G.; Segarra, V. Modeling the link between tourism and economic development: Evidence from homogeneous panels of countries. Humanit. Soc. Sci. Commun. 2024, 11, 308. [Google Scholar] [CrossRef] [Scilit]
  5. Kuchumov, A.V.; Zigern-Korn, N.V. Development Trends of the Tourism Clusters in the Russian Federation. IOP Conf. Ser. Earth Environ. Sci. 2018, 204, 012021. [Google Scholar] [CrossRef] [Scilit]
  6. Kim, Y.R.; Williams, A.M.; Park, S.; Chen, J.L. Spatial Spillovers of Agglomeration Economies and Productivity in the Tourism Industry: The Case of the UK. Tour. Manag. 2021, 82, 104201. [Google Scholar] [CrossRef] [Scilit]
  7. Liu, Y.H. Study on the agglomeration degree of rural tourism in Shaanxi Province based on Location Entropy Theory. Chin. J. Agric. Resour. Reg. Plan. 2020, 41, 203–208. [Google Scholar]
  8. Yan, H.; Dong, R.; He, Y.; Qi, J.; Li, L. Spatial Agglomeration Differences of Amenities and Causes in Traditional Villages from the Perspective of Tourist Perception. Sustainability 2025, 17, 4475. [Google Scholar] [CrossRef] [Scilit]
  9. Zhang, K.; Xie, C.W. Spatial correlation pattern of “distance-agglomeration” of urban tourism industry factors. J. Chin. Ecotour. 2024, 14, 621–635. [Google Scholar] [CrossRef]
  10. Wang, W.; Yang, Q.; Gan, X.; Zhao, X.; Zhang, J.; Yang, H. Spatial Distribution Pattern and Influencing Factors of Homestays in Chongqing, China. Appl. Sci. 2022, 12, 8832. [Google Scholar] [CrossRef] [Scilit]
  11. Shi, Z.; Xu, D.; Xu, L. Spatiotemporal characteristics and impact mechanism of high-quality development of cultural tourism in the yangtze river delta urban agglomeration. PLoS ONE 2021, 16, e0252842. [Google Scholar] [CrossRef] [Scilit]
  12. Huang, X.; Liu, J. Beyond Skyline and Borders: Unraveling the Evolution and Drivers of Tourism Green Development Efficiency in the Beijing–Tianjin–Hebei Urban Agglomeration, China. J. Geogr. Sci. 2024, 34, 1761–1796. [Google Scholar] [CrossRef] [Scilit]
  13. Croes, R.; Ridderstaat, J.; Bąk, M.; Zientara, P. Tourism Specialization, Economic Growth, Human Development and Transition Economies: The Case of Poland. Tour. Manag. 2021, 82, 104181. [Google Scholar] [CrossRef] [Scilit]
  14. Wang, Q.; Wei, M.; Wang, N.; Chen, Q. The Impact of Human Capital and Tourism Industry Agglomeration on China’s Tourism Eco-Efficiency: An Analysis Based on the Undesirable Super-SBM-ML Model. Sustainability 2024, 16, 6918. [Google Scholar] [CrossRef] [Scilit]
  15. Jia, G.; Shi, D.; Zhang, B.; Huang, Z.; Zhang, L.; Zhang, A. Can Green Total Factor Productivity in Tourism Promote the Enhancement of Tourism Industry Resilience? J. Resour. Ecol. 2025, 16, 1064–1078. [Google Scholar] [CrossRef] [Scilit]
  16. Wang, J.; Ma, J. Has Tourism Industry Agglomeration Improved the Total Factor Productivity of Chinese Urban Agglomerations?—The Moderating Effect of Public Epidemic. Front. Public Health 2022, 10, 854681. [Google Scholar] [CrossRef] [Scilit] [PubMed]
  17. Zhang, J.K.; Zhang, Y. Tourism Specialization, Rural-Urban Integration and Rural Revitalization: Evidence from China’s Cities. Tour. Manag. 2026, 114, 105359. [Google Scholar] [CrossRef] [Scilit]
  18. Liu, L.; Luo, J. Spatio-Temporal Evolution and Influencing Factors of the Coupling Coordination Degree Between Tourism Supply and Demand in the Yangtze River Economic Belt. Comput. Urban Sci. 2024, 4, 42. [Google Scholar] [CrossRef] [Scilit]
  19. Nwani, C.; Otta, N.N.; Ngene, A.I.; Echem, S.O. Tourism-Linked Clusters in Coastal Economies: Tracing the Footprint of Arts, Entertainment, and Hospitality on Fishing Grounds in Nigeria. Tour. Econ. 2025. [Google Scholar] [CrossRef] [Scilit]
  20. Chen, J.; Lyu, Y.Q.; Pan, Y.F. Research on measurement and driving factors of tourism industry cluster in Xinjiang. Areal Res. Dev. 2021, 40, 107–112. [Google Scholar]
  21. Cao, K.J.; Long, S.F. Evolution of tourism industry agglomeration and its influencing factors in counties and cities of Xinjiang. Econ. Geogr. 2022, 42, 205–213. [Google Scholar] [CrossRef]
  22. Shi, Z.D.; Yang, H.W. Measurement and influencing factors of high-quality development of tourism economy: A case of Xinjiang. Arid Land Geogr. 2025, 48, 1233–1242. [Google Scholar]
  23. Wang, S.M.; Xu, X.G.; Ma, J.T.; Wang, Y.W. Spatial and temporal evolution of the tourism economy network in Xinjiang: Based on modified gravity model and social network analysis. Arid Land Geogr. 2020, 43, 458–465. [Google Scholar]
  24. Liang, W.; Mohidin, B.H.H. Study on the Relationship Between Street Organization and Spatial Distribution of Tourism-Related Elements in Central Urban Areas in Chengdu, China. Int. J. Environ. Res. 2025, 19, 156. [Google Scholar] [CrossRef] [Scilit]
  25. Goswami, G.G.; Chowdhury, M.H.; Rahman, M.; Atique, M.A. Australian Tourist Flow: A Gravity Model Approach. Sustainability 2024, 16, 5740. [Google Scholar] [CrossRef] [Scilit]
  26. Zhang, Y.X. Study on Tourism Development Based on Location Entropy and Gravity Model—A Case Study of the Southern Shandong Economic Circle. J. Entrep. Sci. Technol. 2023, 36, 94–96. [Google Scholar]
  27. Sun, X.; Su, L.; Zhou, B.; Bu, T.; Zhang, Y. Systematic Evaluation of Integration Between China’s Digital Economy and Sports Industry: Two-Stage Grey Relational Analysis and Vector Autoregressive Model. PLoS ONE 2024, 19, e0303572. [Google Scholar] [CrossRef] [Scilit]
  28. Dong, L.M.; Wu, Y. Research on the Influencing Factors of Tourism Economic Development Based on Grey Relational Analysis—A Case Study of Jilin Province. West. Travel 2024, 7–9. Available online: https://kns.cnki.net/kcms2/article/abstract?v=YQFK0XGjx415dAqWFda4aYIFRopJMTM80kSl0PlFjKS55HRFAtekNhDxoSZqxmVegkr9qksR8xFFXO0Sm7gpyTjGYM5GatHHjKQKzcWkTAx8Ft5eNbE0NK5_nPbjllp1OWFHsXcheuUvdQgpUxtblVr6d3n88sh6sYDGhAxwty9Nt5gKUbnZhw==&uniplatform=NZKPT&language=CHS (accessed on 5 November 2025).
  29. Zhang, Y.N.; Hu, D.H. Research on the Influencing Factors of Tourism Economic Development in Shanxi Province Based on Grey Relational Analysis. J. Hunan Univ. Technol. 2023, 37, 78–85. [Google Scholar]
  30. Pardo Martínez, C.I.; Cotte Poveda, A. Efficiency and sustainability of the tourism industry in Latin America. Reg. Sustain. 2024, 5, 100178. [Google Scholar] [CrossRef] [Scilit]
  31. Mejjad, N.; Rossi, A.; Pavel, A.B. The coastal tourism industry in the Mediterranean: A critical review of the socio-economic and environmental pressures & impacts. Tour. Manag. Perspect. 2022, 44, 101007. [Google Scholar] [CrossRef] [Scilit]
  32. Cheng, J.; Xu, Y.; Jian, I.Y.; Ren, M.; Park, S. Spatial Concentration of Intra-Urban Tourist Activities and Inter-Group Differences Between Asian, European and North American Travelers in Korean Cities. Tour. Manag. 2025, 107, 105064. [Google Scholar] [CrossRef] [Scilit]
  33. Macdonald, C.; Turffs, D.; McEntee, K.; Elliot, J.; Wester, J. The Relationship Between Tourism and the Environment in Florida, USA: A Media Content Analysis. Ann. Tour. Res. Empir. Insights 2023, 4, 100092. [Google Scholar] [CrossRef] [Scilit]
  34. Nită, A.; Drăguleasa, I.-A. Choreme-Based Spatial Analysis and Tourism Assessment in the Oltenia de sub Munte Geopark, Romania. ISPRS Int. J. Geo-Inf. 2025, 14, 444. [Google Scholar] [CrossRef] [Scilit]
  35. Zhang, Y.; Sun, Y.; Zhu, J. Evaluation Study on the Integrated and Coordinated Development of Regional Highway Transportation and Tourism Industry: A Case Study of Xinjiang, China. Environ. Dev. Sustain. 2025, 1–25. [Google Scholar] [CrossRef] [Scilit]
  36. Song, X.; Liu, A.; Liu, W.; Lei, J.; Wen, B.; Guo, H.; Yang, Z. Driving factors and configuration research on the evolution of tourism economic network in Xinjiang, China. Areal Res. Dev. 2024, 43, 110–115+122. [Google Scholar]
  37. Wang, T.; Yang, Z.; Zheng, X. Spatiotemporal Evolution and Obstacles of Tourism Socioecological System Sustainability from Pressure and Resilience Perspective in Arid Regions. Sci. Rep. 2025, 15, 41679. [Google Scholar] [CrossRef] [Scilit] [PubMed]
  38. Wang, T.; Yang, Z.P.; Han, F.; Yu, J.B.; Ma, X.K.; Han, J.L. Assessment of tourism socio-ecological system resilience in arid areas: A case study of Xinjiang, China. Ecol. Indic. 2024, 159, 111748. [Google Scholar] [CrossRef] [Scilit]
  39. Peng, Y.; Liu, W.; Xiong, C. Spatio-Temporal Divergence and Influencing Factors of Agritourism Integration Development in Xinjiang, China. Sci. Rep. 2023, 13, 19361. [Google Scholar] [CrossRef] [Scilit]
  40. Jiang, B.; Zhang, C.X.; Liu, Z.N.; Wen, J.D.; Zhu, J.L.; Xu, L.P.; Wang, F.T. Tailoring an economic-ecological-tourism coupling framework for arid-region ski resorts: A PSR model-based case study of Xinjiang, China. Ecol. Indic. 2025, 178, 113881. [Google Scholar] [CrossRef] [Scilit]
Figure 1. Conceptual framework.
Sustainability 18 00705 g001
Figure 2. Study Region. Note: This map is created based on the standard map from the Standard Map Service Website of the Ministry of Natural Resources, with the map review number GS (2024) 0650; the boundary of the base map remains unmodified.
Sustainability 18 00705 g002
Figure 3. Levels of tourism industry clustering in Northern, Eastern, Southern, and All of Xinjiang (2009–2023).
Sustainability 18 00705 g003
Figure 4. Spatial pattern of tourism industry clusterings in Xinjiang’s 14 prefectures/cities (2009, 2014, 2019, 2023). Note: This map is created based on the standard map from the Standard Map Service Website of the Ministry of Natural Resources, with the map review number GS (2024) 0650; the boundary of the base map remains unmodified.
Sustainability 18 00705 g004
Figure 5. Spatial agglomeration for tourism Industry in Xinjiang’s 14 prefectures/cities (2009, 2014, 2019, 2023). Note: This map is created based on the standard map from the Standard Map Service Website of the Ministry of Natural Resources, with the map review number GS (2024) 0650; the boundary of the base map remains unmodified.
Sustainability 18 00705 g005
Figure 6. Regional correlation network of tourism industry clusters in Xinjiang (2009, 2014, 2019, 2023). Note: This map is created based on the standard map from the Standard Map Service Website of the Ministry of Natural Resources, with the map review number GS (2024) 0650; the boundary of the base map remains unmodified.
Sustainability 18 00705 g006
Table 1. Correlation factor indicator system.
First-Level IndicatorSecond-Level IndicatorUnitParameter
Economic Support FactorGross Regional Product (GRP)100 million yuanX1
Gross Regional Product Per CapitayuanX2
Added Value of the Tertiary Industry100 million yuanX3
Tourism Transportation FactorTotal Length of Paved Highways10,000 kmX4
Passenger Volume10,000 personsX5
Passenger Turnover Volumemillionperson-kmX6
Residents’ Living Standards FactorUrban Residents’ Per Capita Disposable IncomeyuanX7
Per Capita Consumption Expenditure of Urban ResidentsyuanX8
Total Consumer Goods Retail Sales100 million yuanX9
Environmental Quality FactorPer Capita Urban Green Space Parkssquare metersX10
Domestic Waste Collected and Transported10,000 tonsX11
Tourism Service FactorThe Quantity of Travel AgenciesunitX12
Number of Hotels with Star Ratings TotalunitX13
Human Resource FactorWorkers in the Tertiary Industry10,000 personsX14
Number of Enrolled Students in Regular Higher Education InstitutionspersonX15
Information Resource FactorNumber of Internet Broadband Access Users10,000 householdsX16
Population Coverage Rate of Radio and Television%X17
Total Post and Telecommunication Business Volume100 million yuanX18
Tourism Destination Attractiveness FactorThe Quantity of Domestic Travelers10,000 person-timesX19
The Quantity of Foreign Visitors10,000 person-timesX20
Table 2. Correlation Value Ranking.
Second-Level IndicatorCorrelation ValueRankingFirst-Level IndicatorCorrelation ValueRanking
X10.72874Economic Support Factor0.73032
X20.71206
X30.75032
X40.685013Tourism Transportation Factor0.67936
X50.672417
X60.680314
X70.70657Residents’ Living Standards Factor0.70293
X80.69959
X90.70268
X100.685312Environmental Quality Factor0.68145
X110.677415
X120.677116Tourism Service Factor0.67398
X130.670718
X140.698710Human Resource Factor0.69284
X150.686911
X160.74843Information Resource Factor0.67757
X170.637420
X180.646719
X190.77511Tourism Destination Attractiveness Factor0.74861
X200.72205
Note: Correlation rankings range 0.6374–0.7751 (all > 0.6); top two first-level drivers are tourism destination attractiveness (0.7486) and economic support (0.7303), with secondary indicators X19 (domestic travelers, 0.7751) and X3 (tertiary industry added value, 0.7503) ranking highest.
Disclaimer/Publisher’s Note: The statements, opinions and data contained in all publications are solely those of the individual author(s) and contributor(s) and not of MDPI and/or the editor(s). MDPI and/or the editor(s) disclaim responsibility for any injury to people or property resulting from any ideas, methods, instructions or products referred to in the content.