Article

Psychographic Typology of the Phygital Consumer Based on Emotions Towards Tools and Solutions Used in Retail and Services

by
Kajetan Klaczek-Suchecki
,
Barbara Kucharska
,
Przemysław Luberda
* and
Mirosława Malinowska
Department of Market and Consumption, Faculty of Economics, University of Economics in Katowice, 40-287 Katowice, Poland
*
Author to whom correspondence should be addressed.
Sustainability 2026, 18(2), 666; https://doi.org/10.3390/su18020666
Submission received: 28 November 2025 / Revised: 20 December 2025 / Accepted: 22 December 2025 / Published: 8 January 2026
(This article belongs to the Special Issue Sustainable Marketing and Consumption in the Digital Age)

Abstract

The aim of this paper is to identify and psychographically characterize consumers operating in the phygital environment based on their emotional responses to tools used in commerce and services. The theoretical section involves a bibliometric analysis (Web of Science and Scopus papers from 2015 to 2024) using Bibliometrix and Biblioshiny in RStudio. The empirical study was conducted using the Internet survey technique in February 2025 on a nationwide random-quota sample of 2160 adult internet users. Based on cluster analysis, three types of consumers were identified: solution skeptics (48.1%), cautious explorers (20.1%), and tool enthusiasts (31.9%). The results indicate that emotions play a key role in the perception of phygital experiences. The article provides practical guidance for companies, including approaches for designing more inclusive and accessible shopping environments. A positive attitude toward these tools can foster more efficient use of services, reducing overconsumption and improving quality of life. In the context of sustainable development, these results point to the need for further research into the real impact of phygital solutions on consumer wellbeing—social, economic, and environmental.

1. Introduction

Recent years have seen significant shifts in how consumers shop and use services [1,2]. These shifts have been driven by digital transformation and the increased adoption of information and communication technologies (ICTs) by companies to boost the value of their offerings [3]. Many technologies, such as artificial intelligence (AI), the Internet of Things (IoT), and augmented reality (AR), have emerged, offering companies advanced digital tools that enable the integration of physical and digital worlds [4,5]. This combination of physical and digital experiences, designed to create engaging, unique, and interactive experiences for consumers, is known as phygital [6,7,8].
Retailers are increasingly blending physical and virtual spaces by utilizing a variety of new tools, such as virtual mirrors, information touchscreens, chatbots, and QR codes, leading to a blurring of the lines between the real and digital worlds [9,10]. In turn, consumers who have access to new technology—in the form of devices or programs designed to create unique experiences—may feel a range of positive emotions toward these tools, like excitement or usefulness, but also negative feelings, such as difficulty in use or perceived uselessness [11].
Previous research clearly indicates that emotions play a significant role in the purchasing process [12,13,14,15]. The pursuit of emotional experiences is a natural phenomenon for consumers [16], as it can enhance their shopping experiences, but also significantly diminish them. It should be noted, however, that, when using specific tools or solutions, each consumer may experience different emotions; this serves as the basis for developing a psychographic typology of phygital consumers, grounded in their emotional reactions to these tools and solutions. In some cases, it is difficult to distinguish between tools and solutions because they can interpenetrate and complement each other in the phygital dimension, which is why they often appear together in the text.
In the literature, numerous attempts have been made to create consumer typologies based, among other factors, on the quality of electronic services and e-satisfaction [17], decision-making behaviors during online shopping [18], emotions [19], phygital behaviors [20], or awareness of sustainable development, independent of product categories [21]. However, existing studies have typically examined emotions influencing consumer behavior, rather than as a basis for systematically classifying consumers according to their emotional responses toward specific retail tools and solutions. In particular, the emotional dimension of consumer interactions with phygital solutions in retail and services has received limited attention within the framework of consumer typology. Addressing this gap, the present study proposes a psychographic typology of phygital consumers that incorporates emotions toward phygital solutions in retail and services. By focusing on emotions this study extends existing research and contributes to a better understanding of the emerging phygital consumer, who simultaneously combines physical and digital shopping environments.
The use of these tools is also related to the broader context of sustainable development. Integrating digital solutions and physical spaces can contribute to, among other things, reducing resource waste (e.g., connected with promotional materials or the need for product transport in the case of digital fitting room services) or optimizing purchasing processes and reducing unnecessary shopping and returns. As Maciejewski et al. [22] have shown, sustainable consumption means consuming in a more efficient way to ensure quality of life. Digital solutions and tools can contribute to the social dimension—one of the key aspects of sustainable development [23], to increasing the accessibility of retail services by supporting older people and people with disabilities (e.g., through chatbots, virtual assistants [24]), which will enable them to participate in the purchasing process more comfortably and independently [25].
Despite the growing number of studies on phygital consumer behavior, the literature provides limited information on specific emotional reactions to the tools and solutions used in retailing and services, and their influence on phygital consumers’ acceptance. Therefore, the aim of this article is to thoroughly investigate and psychographically characterize the types of consumers functioning in the phygital environment, based on their varied emotional reactions.
This study used an online survey technique and then employed the cluster analysis method, which ensures stratification into groups, i.e., maximizes the heterogeneity between groups as well as the homogeneity of each of them [26], making it possible to group similar types of consumers and compare divergent ones using a statistical approach.
This research introduces new phygital consumer types based on their emotional relationship with tools and solutions used in commerce and services, while also expanding knowledge about consumer attitudes in the phygital environment. The article may also be valuable for businesses, offering them in-depth insights into the emotional responses of various consumer types to phygital tools and solutions. Based on this, companies can more effectively validate and optimize solutions to create coherent and engaging phygital consumer experiences.

2. Literature Review

2.1. The Phygital Consumer Relating to the Experiences and Emotions

Phygitality (the term first used by Chris Weil in 2007) as an inseparable blend of physical and digital spaces [27], creates new opportunities for influencing consumer behavior. Phygitality extracts and combines the best features of the virtual environment (immediacy, immersion, speed) and the physical environment (including direct contact with staff, product interaction) to create a more comprehensive and satisfying phygital consumer experience than what can be achieved in either space alone. Within this framework of the new “hybrid consumption experience,” which merges online and offline interactions and incorporates elements of both digital and physical experiences [9,28,29], the concept of the phygital consumer is developed. A phygital consumer is someone whose behavior is shaped by an integrated physical–digital environment that considers context, emotions, and social connections. The phygital consumer makes purchasing decisions not only based on traditional in-store solutions but also guided by digital technologies offering personalized content, convenience, and immediate access to information [30]. The phygital consumer in their behavior seamlessly combines solutions available in both the physical (offline) and digital (online) space, and their activity is based on the integration of physical and digital experiences into a coherent and dynamic path (customer journey) made possible by the consumer’s movement between the online and offline worlds [20].
The holistic concept of phygital customer experience focuses on “the customer’s cognitive, emotional, behavioral, sensory, and social responses to a company’s offerings throughout the entire purchase journey” [11,31]. These specific customer responses stem from their access to technological, interactive, and entertaining touchpoints [32], which are advanced versions of physical places that deliver integrated and seamless experiences [33,34].
The phygital consumer can enjoy the advantages of combining physical and digital solutions. Technology- enhanced physical experiences (including AI, AR, IoT, and VR) [35] aim to reduce or remove barriers between the real and digital worlds, reaching consumers more effectively to deliver greater value (increased benefits and lower costs [6]) and to strengthen their connection with the brand [5]. Replacing staff with digital touchpoints (e.g., ATMs, self-checkout machines, kiosks) allows the speed, accuracy, and efficiency of routine transactions to be boosted while increasing product and service availability. However, interactions with staff can still be crucial when the human aspect of the experience co-creates the product and service (e.g., hotel services, medical services) [36]—where “high touch” is supported by “high tech”. Properly implemented human elements can also facilitate the transition for consumers moving between physical and digital environments [37,38].
The importance of emotions and experiences provided to consumers by new solutions is particularly emphasized relating to the experience economy [39]. Previous research indicates a wide range of emotions that can influence consumer decisions at various touchpoints [8,11,40]. Consumer emotions regarding the same solution are considered at each stage of the experience (before, during, and after using the solution), indicating that the emotions of the same consumer may vary at each stage of the experience [31,41]. Positive emotions (e.g., joy, excitement) can increase the perceived value of the experience and thus strengthen bonds with the company. Negative emotions (e.g., dissatisfaction) can, in turn, reduce the quality of customer service and limit the ability to build loyalty [40].
The literature increasingly addresses the special connection between consumer emotions and consumer satisfaction and loyalty, as well as the importance of emotions in building brand-consumer relationships. A relatively new area of research on emotions includes research conducted in the context of the phygital world, the metaverse, and the digitalization of consumer experience. The goals of existing retail research include answering questions such as whether, in a phygital service environment, consumer emotions play a role in shaping their experiences; how this differs from a human-driven service environment; how consumers respond to service robots; and how consumer emotions are managed during these interactions. In these studies, consumer emotions were most often identified as positive or negative [13]. However, there is a lack of a systematic psychographic approach to phygital consumers, classifying them into types based on their emotions toward tools and solutions used in commerce and services. As a result, it remains unclear which consumer segments are characterized by specific emotional responses to various phygital technologies and solutions. This is a significant research gap that, from a practical perspective, also hinders the design of personalized experiences and marketing strategies.
Consumer emotions within the shopping experience encompass cognitive, affective, social, and physical dimensions [42] and for phygital consumers, these emotions correspond to the following aspects [43]:
-
Functional—related to purchasing efficiency (e.g., satisfaction, relief, sense of control vs. frustration, confusion);
-
Sensory—arising from the fusion of physical and digital stimuli (e.g., pleasure, curiosity vs. disappointment, indifference);
-
Symbolic—reflecting perceived brand exclusivity and personal connection (e.g., pride, engagement, uniqueness vs. exclusion);
-
Social—stemming from interactions across online and offline settings (e.g., belonging vs. isolation).
For the purposes of this article, the emotions towards phygital solutions used in previous studies were adopted, i.e., positive emotions such as pleasant, exciting, amazing, useful, easy to use, speed, privileged, sophisticated and negative ones like annoying, alienating, worrisome, creepy, supervised, useless, uneasy to use, slow [11].
Solutions for creating phygital experiences are particularly applicable in areas of consumer activity, including fashion and retail, tourism and cultural heritage, education and learning, gaming and entertainment, as well as urban spaces and healthcare [27], i.e., in sectors with increasing virtualization of consumer behavior [44]. Depending on the location, they can help better understand the consumer’s needs and context, accelerate the service process, personalize the offer, or increase consumer engagement.

2.2. Phygital in Retailing

Phygital retailing represents the next stage in retail development, aiming to integrate offline and online channels. The brick-and-mortar store plays a vital role as an innovative space fostering customer interactions. Phygital retailing is connected with the transformation of physical stores in the digital era, aimed at creating new customer experiences by leveraging digital tools to support sales [45,46]. In the case of phygital retailing, consumers can benefit from a space that integrates physical and digital tools and solutions, enabling a new way of utilizing commercial and service offerings.
The phygital retailing space is dedicated to creating immersive experiences, which often place less emphasis on generating sales and more on creating a holistic customer experience [47]. The role of brick-and-mortar stores in phygital retailing is seen through their ability to deliver a seamless and connected experience for consumers who navigate the shopping journey using both online and offline touchpoints [11,48]. Phygitality creates “new virtual and physical territories that blend, collide, morph, merge, and evolve, enhanced and enabled by retail technology” [47,49].
Phygital retailing is viewed as a comprehensive and integrated multidimensional ecosystem where the consumer serves as the initial point for integrating and combining physical, human, digital, media elements, platforms, technologies, and augmented realities, ensuring consistent value delivery from digital to physical (physicalization) and from physical to digital (digitalization). The co-created phygital experience is achieved by aligning the retailer’s resources with those of its customers [50]. Phygitality in retail is considered a customer-focused approach that extends beyond the purchase and channel [28,51], emphasizing the continuous natural convergence between physical and digital environments. The integration of physical, behavioral, sensory, and social aspects of customer experiences in retail can occur through technologies that enable extensions—such as extended self, socialization, environment, and sensory—facilitating the delivery of customer value across physical and digital realms [7,52,53].
Phygital retailing enables consumers to be present in both the physical and digital spaces of a retail outlet simultaneously, providing an extraordinary shopping experience [54]. Digital technologies enable immersive experiences with a higher level of entertainment and interactivity in the shopping environment than before—encompassing emotions, impressions, and shopping memories [51,55]. Customers of phygital retail outlets may prioritize the hedonic aspects of these experiences when the necessary level of functionality is met [46,56].
The use of technology to expand physical space (e.g., digital sensor technology to automate personal processes) can contribute to increasing transaction fluidity (e.g., by automatically collecting payments from the customer’s digital wallet; face pay, unmanned stores, self-service checkouts, finding a product in the store via an app), providing contextual recommendations (e.g., virtual fitting room), fostering engagement (e.g., interactive shopping kiosks), or enriching digital product and offer discovery (e.g., QR code, in-store app mode) [36]. Phygital innovations involving the use of augmented and virtual reality technologies to “import” digital artifacts into the physical world can also allow consumers to interact with them and evaluate products before purchase (simulated personal experiences) in their own space (e.g., AR and VR technologies, e.g., at home) [6].
Shaping touchpoints in retailing through the continuous and balanced integration of physical and digital solutions can be crucial for customer satisfaction and loyalty [57]. They should enable the creation of frictionless shopping experiences [58]. The effectiveness of actions taken in this area will depend, among other things, on customer response and, in particular, acceptance.

2.3. Phygital in Retailing and Sustainable Consumption—Necessity of Research

Based on integrated interactions, phygitality aims to create a unique experience for utilizing retail offers, thereby increasing consumer satisfaction, comfort, and wellbeing [29]. Implementing solutions that enable phygitality can contribute to the development of sustainable consumption by reducing undesirable phenomena related to consumers’ transition to the digital environment (e.g., high returns) [59] or those that intensify in the physical environment (e.g., impulsive, excessive purchases), which lead to resource waste and excessive environmental burdens (such as high water consumption, CO2 emissions, transport emissions, and packaging waste). Phygitality creates the opportunity to rationalize consumer choices by integrating diverse information sources and enabling the seamless use of this information, tailored to needs and circumstances. The ability to personalize offers at an even higher level than what is currently possible—given the disconnect between physical and digital solutions [60]—also contributes to rational consumer behavior, which in turn reduces resource waste and product returns (reduction). Phygital consumer experiences, with their hedonistic aspect being vital) [46] can also help decrease excessive shopping and overconsumption. Utilizing selected phygital solutions can be purely entertaining and does not necessarily require completing a transaction, especially for products not currently needed. Retail consumers often expect more than just the ability to buy products or use services (functional needs). They want to express their personality or aspirations. While they consider the functional value of purchases and the ability of products or services to satisfy needs, as well as prices, promotions, and discounts, they are also seeking something more—experiencing sensory pleasure and stimulation to learn (cognitive needs), the opportunity for self-fulfillment and building self-esteem (symbolic needs), and connection with others, bonds, and participation (social needs) [61,62].
The concept of the “phygital consumer” itself receives little attention in the scientific literature, despite the growing importance of solutions designed to create phygital consumer experiences [20]. The emergence of a new type of consumer operating at the intersection of the physical and digital worlds, experiencing a physical–digital space of decisions and choices related to satisfying diverse needs, necessitates research to identify their characteristics and behaviors. Previously used criteria (including demographic and lifestyle characteristics, purchasing reasons, and factors in choosing a place to shop) are becoming less useful for describing consumers in phygital retailing (integrated and intertwined physical and digital solutions). These criteria must be modified to identify phygital customers and distinguish them among groups [63]. The frequency of use of phygital solutions, consumers’ perceived benefits and limitations associated with using phygital solutions, and their opinions on retailers’ actions in this area can become the basis for developing a typology of the phygital consumer.
Literature increasingly explores the relationship between the typology of phygital consumers (e-commerce customers) and their attitudes toward sustainable consumption. Previous research indicates a diversity of digital [64] and analog consumer groups, also based on their level of environmental awareness and willingness to engage in activities that support sustainable development. Identifying these phygital consumer types can contribute to understanding their impact on achieving sustainable development goals and identifying potential threats related to their behavior. It can also provide a basis for developing appropriate educational and behavioral strategies that would shape positive attitudes among various phygital consumer groups toward sustainable development initiatives and technological solutions (including those of a phygital nature) that support responsible behavior in retailing [20].

3. Bibliometric Analysis

In order to prepare an analysis of appropriate quality, it was decided to use Preferred Reporting Items for Systematic Reviews and Meta-Analyses PRISMA statement [65]. The PRISMA flow diagram (Figure 1) illustrates the stepwise selection process and the application of exclusion criteria at each stage.
This method ensures that all existing literature in a given database is recorded and analyzed. It ensures transparency and traceability of literature searches [66]. To conduct the bibliometric analysis, two leading databases of scientific articles were selected: Web of Science and Scopus. These are databases that contain the most influential and high-quality peer-reviewed scientific publications [67]. As a rule, these databases contain articles written in English, which makes it impossible to analyze works published in other languages. This review was carried out in April 2025. As a criterion for selecting articles, it was decided to use word search engines in abstracts using special commands (operators). To identify articles relevant to the overall topic of this research, the authors searched abstracts and titles for syntactic relationships between search terms. To search for matching publications, the search terms: <<“phygital” AND (“consumer*” OR “customer*”)>> were entered. These search terms enabled a broad search for matching works. A total of 92 matching searches were found in the Web of Science database, and 111 were identified in the Scopus database.
These databases were extracted as BibTeX files (for Scopus) and PlainTeX files (for Web of Science). These files were converted to an xlsx (Excel) file in the R environment to enable their merging. These files were merged in the R environment using the Bibliometrix (5.0 version) extension [68,69,70,71]. The Biblioshiny (4.1.3 version) graphical overlay was also employed to present the obtained results graphically. This tool allows for the generation of graphical visualizations of bibliometric analyses. However, these cannot be customized to the researcher’s needs. The databases were merged, which resulted in 141 documents by 196 authors from 2015 to 2025. This number is smaller than the sum of works from both databases because some articles are available in both databases.
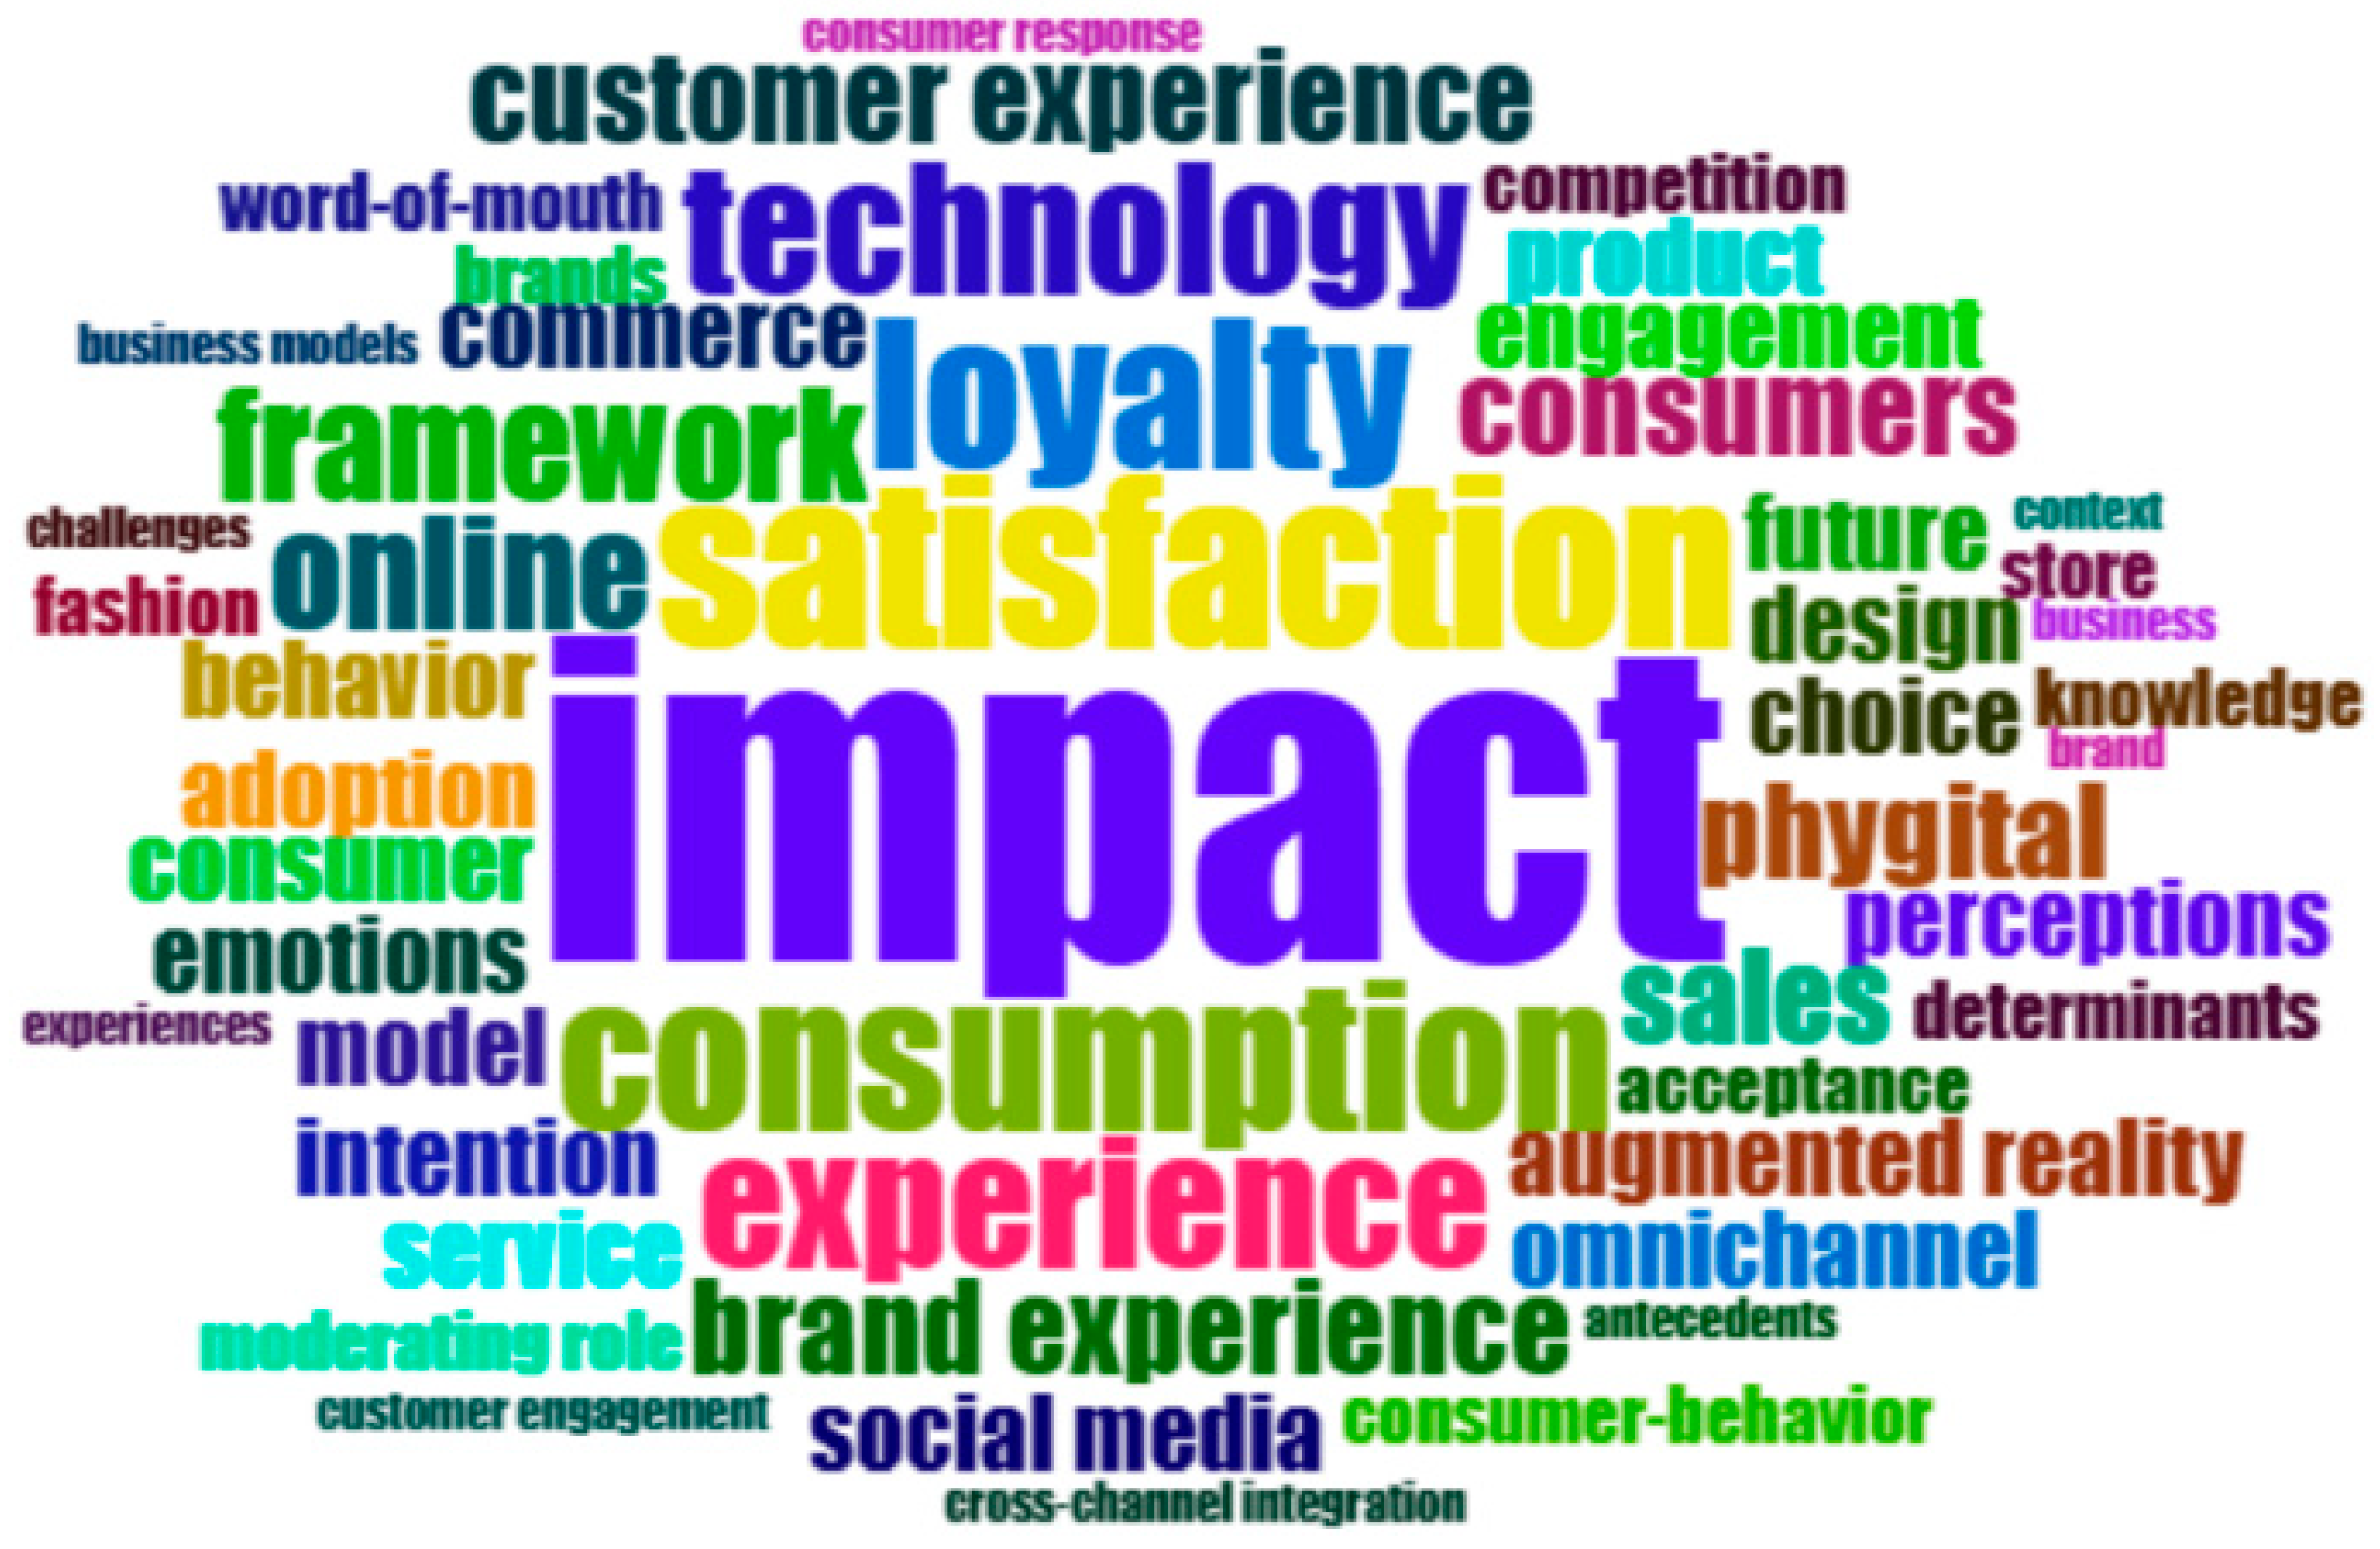
Based on analyses employing the Biblioshiny add-on, a map of the most frequently used words in article abstracts was drawn (Figure 2).
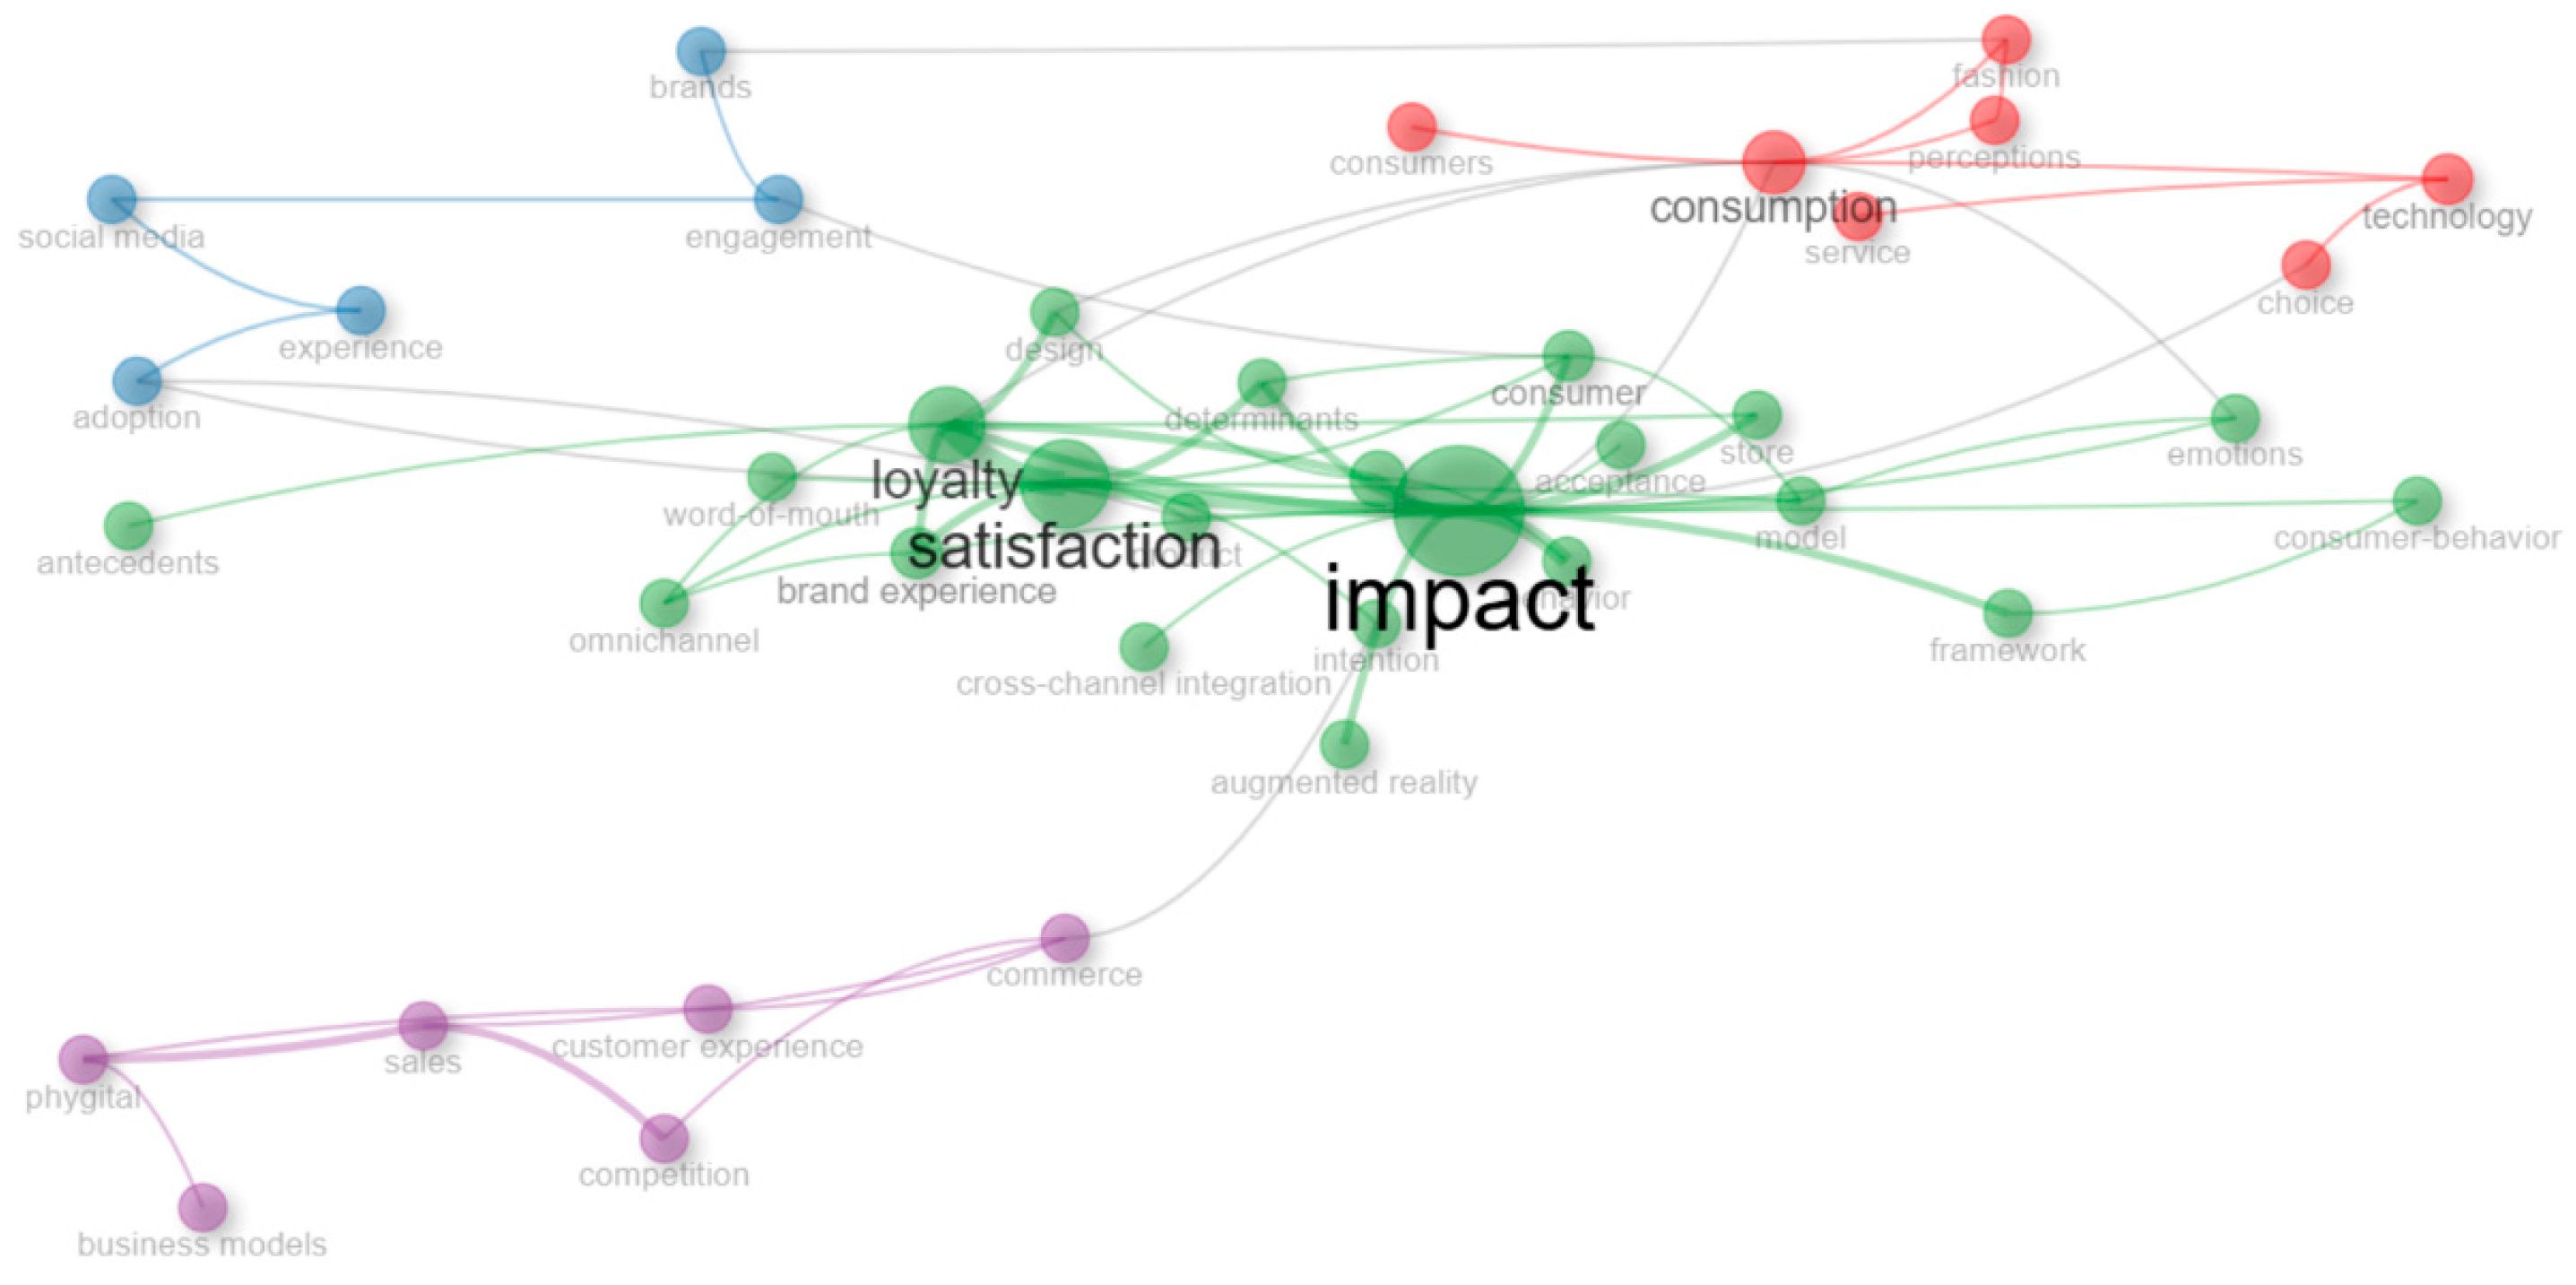
The most common words in the abstracts of articles about the phygital consumer are: “impact,” “satisfaction,” “consumption,” “experience,” “loyalty,” “technology,” and “framework.” It can therefore be concluded that the authors of the texts are particularly trying to investigate the impact of phygitality on consumer behavior and their satisfaction, which can also be understood as the level of satisfaction of needs. These phrases are also related to each other, as shown in Figure 3.
Several underlying relationships can be observed, primarily centered around the phrases “impact,” “satisfaction,” “loyalty,” and “consumption.” This confirms the conclusions presented in the previous analysis—the authors of the texts focus on the impact of phygitality on satisfaction, but also on consumer loyalty. It can be assumed that this is towards the company, brand, or product.
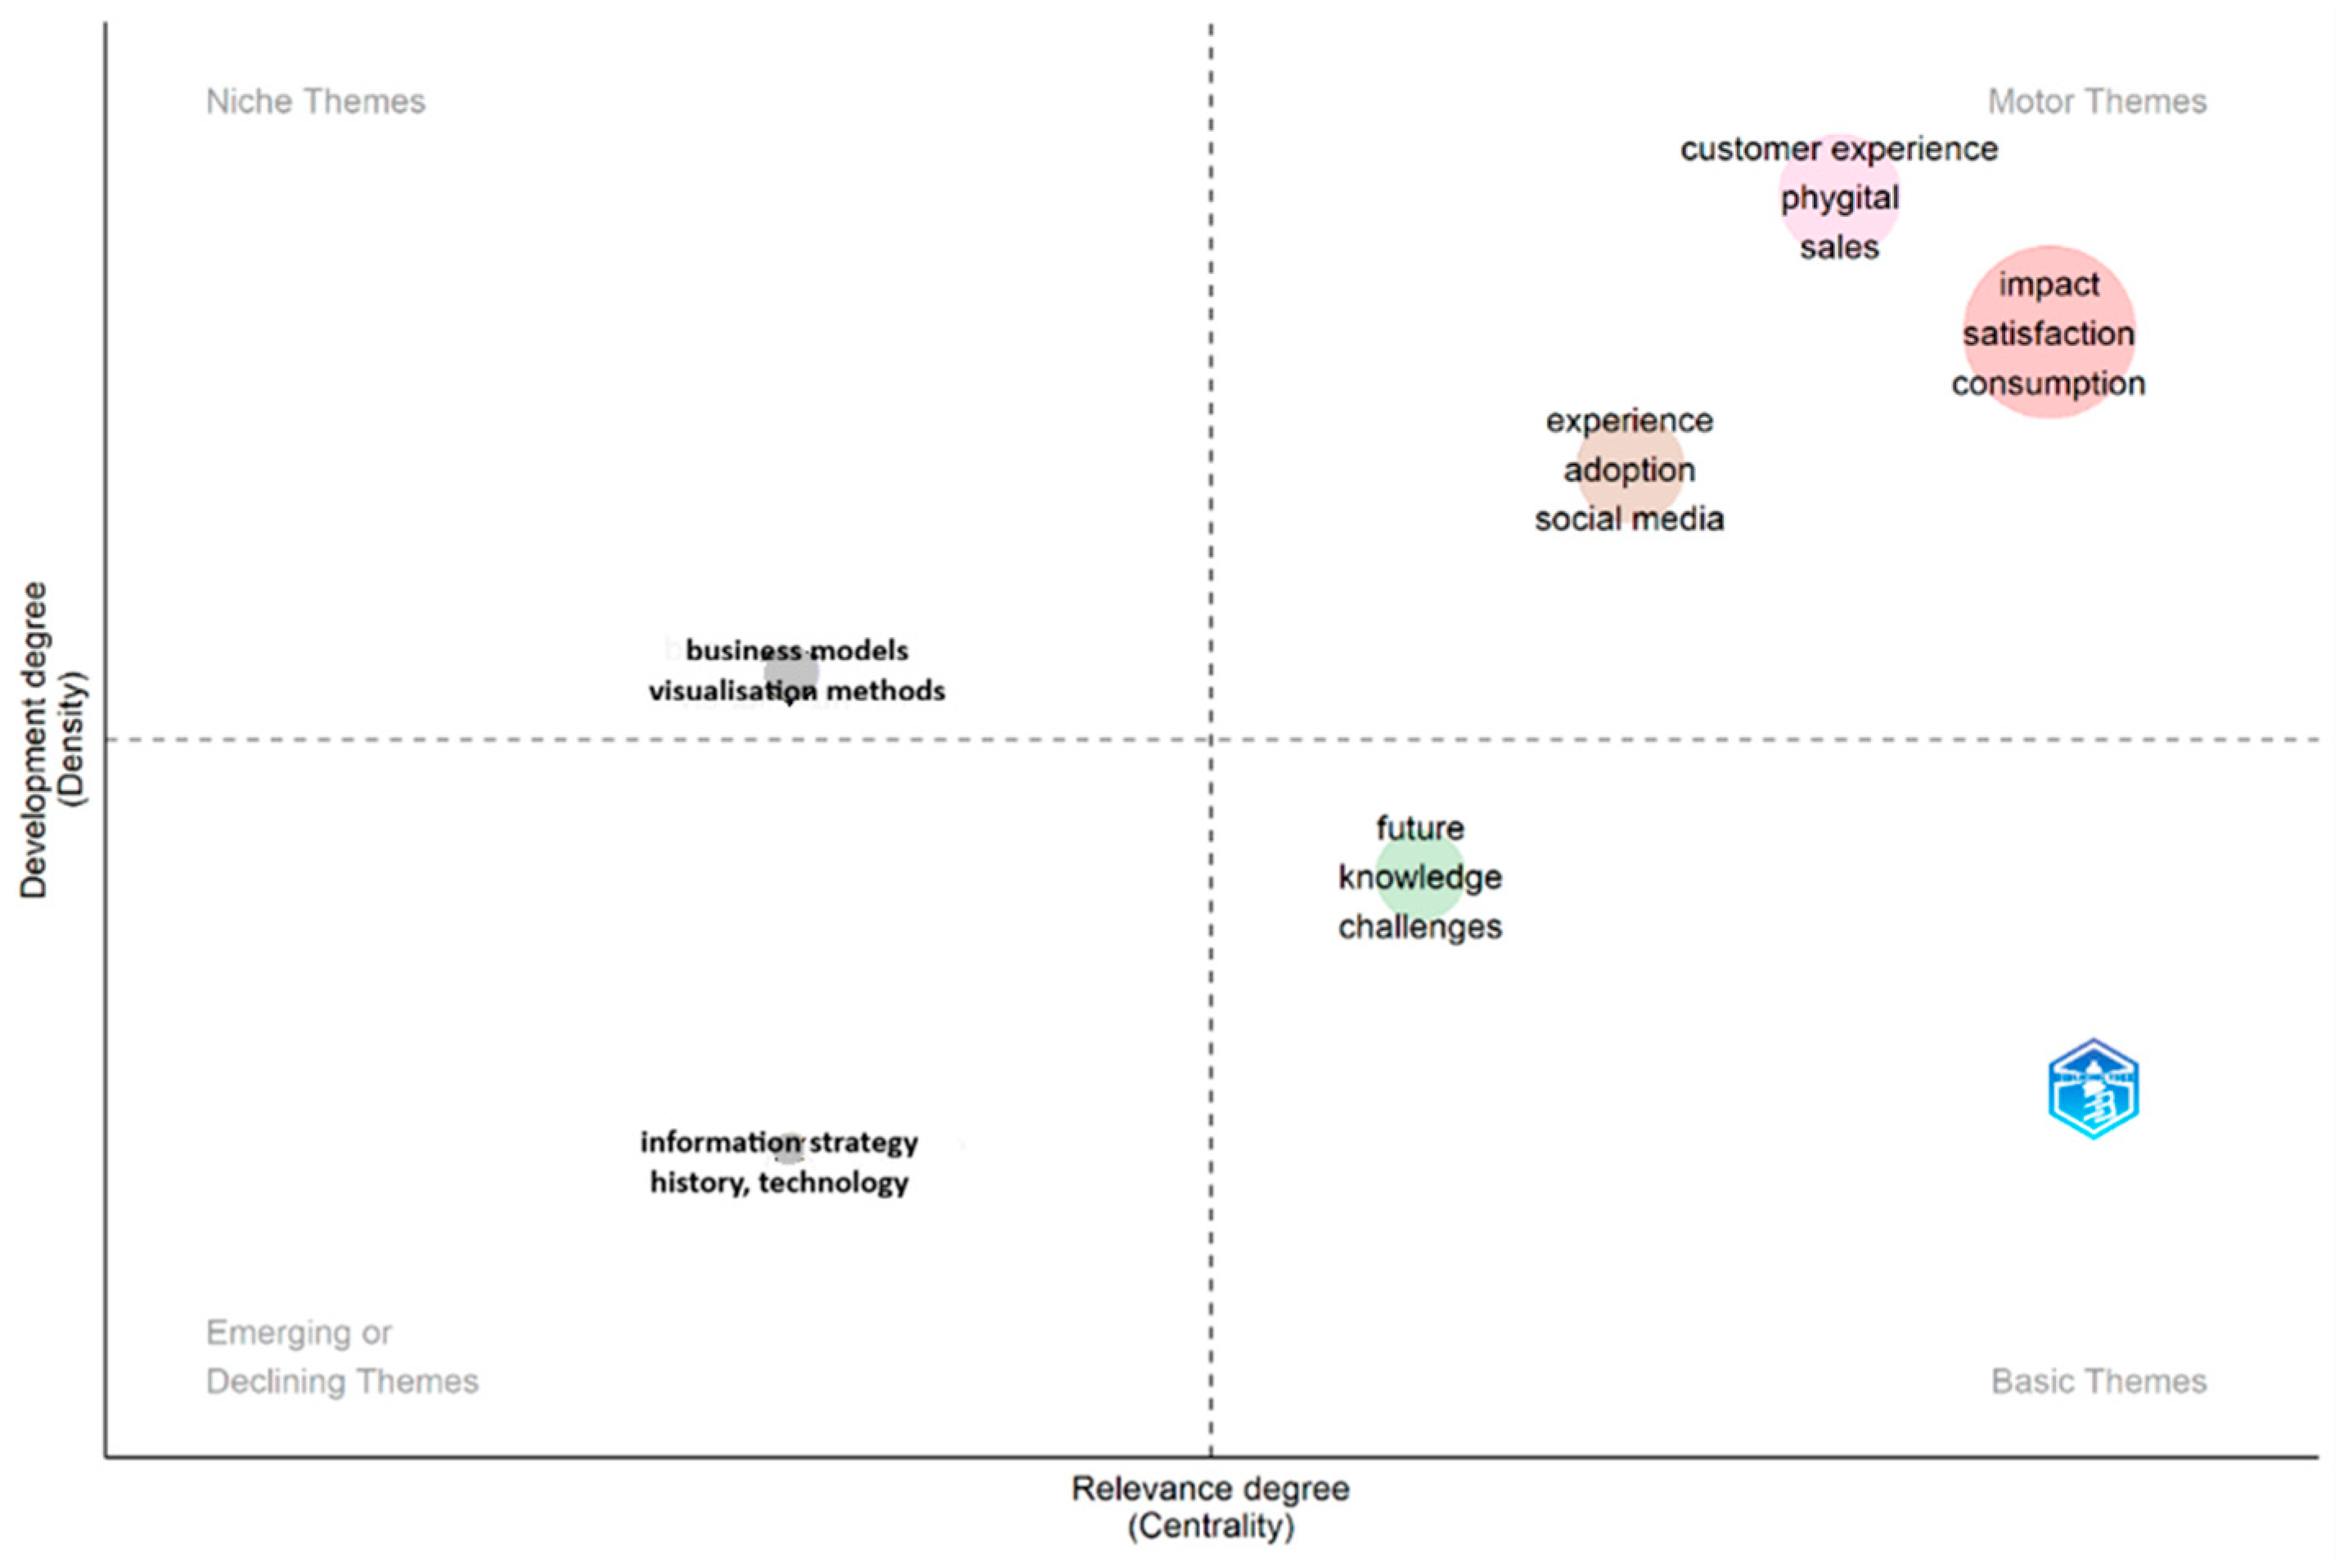
This analysis also enabled us to identify clusters of specific phrases and position them in various locations within the matrix, taking into account their meaning and the potential for developing the topic (Figure 4).
The driving topics for the phygital consumer are consumer experience, the impact of phygital on satisfaction and consumption, as well as the intersection of expertise and social media. A thematic niche was also identified: “context” and “visual methods.”
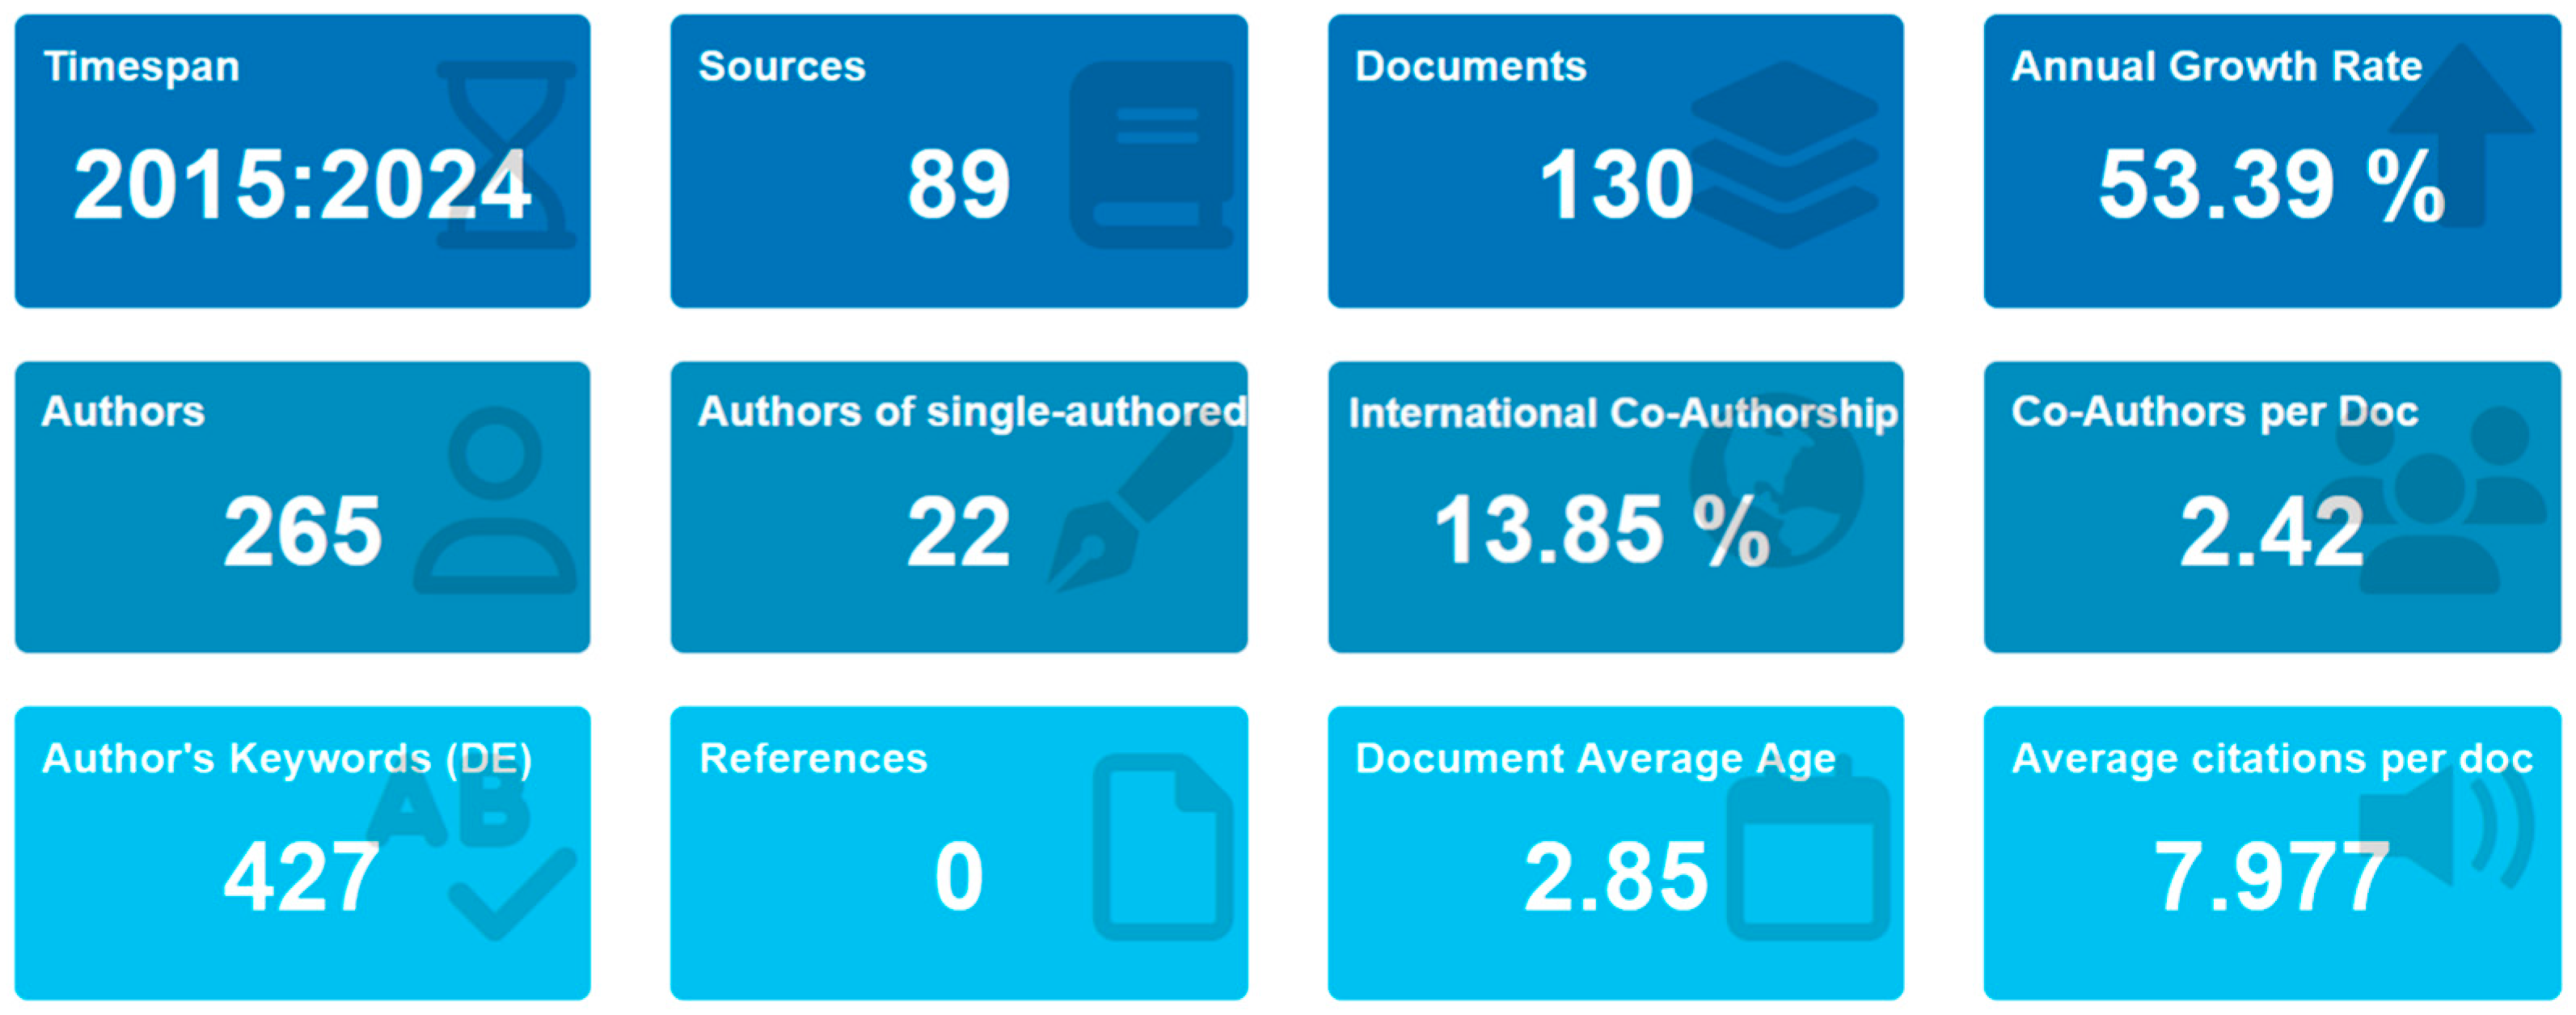
Due to the incomplete year 2025, only works from 2015 to 2024 were used for statistical analyses. Therefore, the elimination of an incomplete year should be considered an exclusion criterion. These statistics are presented in Figure 5.
Over the past 10 years, 130 papers on the “phygital consumer” have been published in the analyzed databases across 89 journals, authored by 265 scientists. The annual increase in the number of papers exceeded 53%, indicating that the subject is developing. Most of them were multi-authored papers—only 22 articles had a single author. Most of them are authors representing research centers from one country (less than 14% are international collaborations). On average, each article was cited eight times. These are relatively new articles, on average, published within the last three years.

4. Materials and Methods

The primary data for this article come from quantitative research conducted as part of the research project titled “Phygital consumer: a consumer at the interface of the physical and digital worlds.” This project is being carried out at the Department of Market and Consumption at the University of Economics in Katowice from 2024 to 2026. It is funded by the Ministry of Science and Higher Education under the “Regional Excellence Initiative” Programme, specifically the “UEKAT Programme of Scientific-Research and Educational Excellence—Regional Excellence Initiative.” (Grant Number: 6_1_GZ_2024). This project also received a positive opinion from the Human Subject Ethics Committee at the University of Economics in Katowice (No. 008/09/2024).
The primary research was conducted using an online survey method through the Ariadna Nationwide Research Panel (https://panelariadna.pl/, accessed on 24 May 2025). According to information provided by the research company, the socio-demographic profile of those registered in the panel matches the profile of Poles who use the Internet [72]. However, some researchers question the activity of certain members of various research panels and thus refer to the phenomenon of “quiet resignation” from community participation, despite not deleting their accounts [73]. At the same time, this method is associated with limited control options for researchers over respondents. Nevertheless, the sense of anonymity is increased [74]. The research tool used was a survey questionnaire consisting of 27 questions, including 19 substantive questions and eight metric questions. The substantive questions were designed as ordinal, bipolar, five- and seven-point scales, as well as nominal scales and cafeteria-style closed-ended questions. The questionnaire was based on previously validated items from the study “Phygital Luxury Experiences: A Correspondence Analysis on Retail Technologies” conducted by Guzzetti et al. [11]. These items were carefully adapted to the context of the examined phygital tools, social conditions, and the Polish language. Only a subset of the original questions relevant to our research objectives was used, and they were grouped into constructs representing key dimensions of consumer emotions and perceptions. Each construct was measured by aggregating responses to multiple related items. By grounding our survey in established scales while adapting them to the specific research context, we ensured that the measurement of constructs was both valid and contextually appropriate.
The substantive questions were carefully aligned with the study objectives and aimed to identify the attitudes and behaviors of phygital consumers. The metric questions helped us describe the individuals in the sample based on their demographic, economic, and social traits.
The research was conducted in February 2025. Before the actual research, pilot studies were conducted to eliminate potential errors in the research tool.
A total of 39,997 people were invited to participate in the study, of whom 4004 responded to the invitation and started filling out the questionnaire (a response rate of 10.01%). A total of 356 people did not complete the questionnaire, and 1342 were excluded from the study because they met their demographic quotas. Additionally, 2306 people completed the study, but 146 individuals were excluded from further analysis due to the control set because they finished the questionnaire too quickly (less than 50% of the allocated time). The final sample consists of 2160 adult consumers (n = 2160). The study was conducted on a nationwide random quota sample of people aged 18 and over, with quotas set based on the population distribution for gender (two categories), age (five categories), and size of place of residence (five categories), totaling 50 strata. This means that participants were selected randomly while maintaining control over the sample structure. The quotas were chosen to accurately reflect the representation of the adult Polish population, taking into account gender, age, and the size of the place of residence. Structure of responses to the question published by the Polish Central Statistical Office.
The completed research sample yielded results with a measurement error of no more than 2%, at a 95% confidence level (α = 0.95). The structure of the own study sample is presented in Table 1 and Table 2.
The distribution of respondents by gender and specific generations reflects the demographic situation. Therefore, Generation Z accounts for only 10.6% of the participants—this generation is experiencing a demographic decline, and some members were not yet 18 years old, as the study only included adults (born 2001–2007). The largest group of respondents was from Generation X (36.7%). The majority of participants were women (53.2%).
City residents comprised 62% of the respondents, with fewer than 30% residing in large and major cities (those with over 100,000 inhabitants). Every third respondent was from a small or medium-sized town. The largest group was rural residents (38%).
Most respondents (over 87%) had at least a secondary education, and 61% were professionally employed. One in ten people rated their financial situation as “bad” or “very bad,” 21.5% as “average,” and more than half as “good” or “very good.”
In this study, a typology of consumers was created based on respondents’ attitudes toward analogue, digital, and phygital solutions and tools, which serve as a psychographic criterion. This attitude was assessed with three questions related to solutions with analogue, digital, and phygital tools (these were questions numbered 10 to 12 in the research tool). For each question, respondents indicated their feelings toward these solutions/tools by selecting either “yes” or “no” as their answer. These statements were developed by Guzzetti, Crespi, and Belvedere [11] in a study on technologies used in retail and were adapted for this study.
The types obtained were described using questions about the frequency of using phygital solutions when purchasing different kinds of products, benefits, and limitations related to their use, and opinions on enterprises’ attitudes toward phygital solutions. In these questions, a 7-point scale from −3 to +3 was used. Reliability tests for individual scales (separate test for each) involved two indicators: the commonly used Cronbach’s alpha and McDonald’s omega, which is often considered a better alternative due to some disadvantages of Cronbach’s alpha. McDonald’s Omega is indicated as a better alternative, especially for large research trials as noted by authors like Ciżkowicz [75] and Kalkbrenner [76]. Both indicators are based on the internal consistency method [77]. Cronbach’s alpha coefficients ranged from 0.882 to 0.931, while McDonald’s omega coefficients ranged from 0.877 to 0.927. Coefficients above 0.7 were considered to indicate reliable scales [78], though they were below 0.95, which some researchers also suggest as a threshold [79].
Due to the qualitative nature of the indicators, the study used two-stage clustering (two-stage cluster analysis). It is an exploration tool used to reveal the presence of natural groupings (or clusters) in a data set that are not otherwise visible. The types of phygital consumers were distinguished using two algorithms. First, the Ward method (hierarchical algorithm) was used with the square of the Euclidean distance, then the k-means method (which is a non-hierarchical algorithm, based on partitioning) was used.
The analysis, conducted using the likelihood logarithm, indicated three clusters. The largest one consisted of 1038 individuals (48.1% of the study participants), while the smallest one consisted of 434 people (20.1%). The third group comprised 688 individuals (31.9% of the study participants).
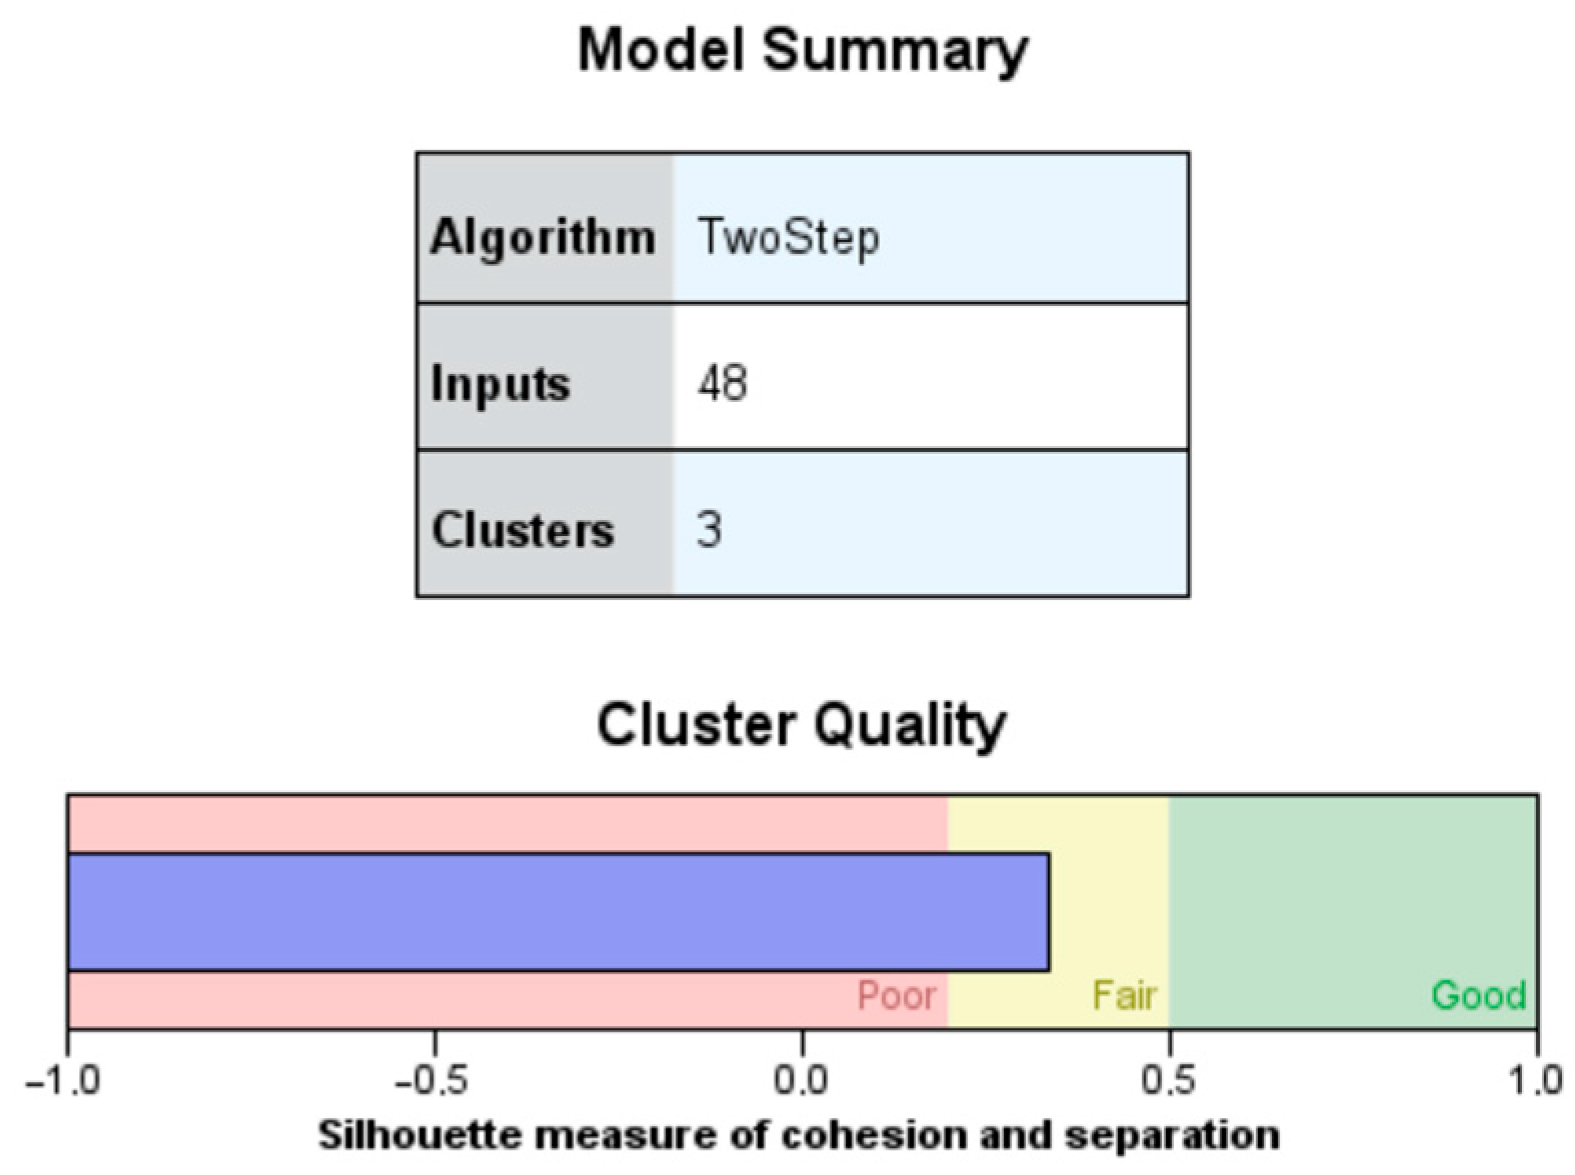
The quality of classification, assessed by the silhouette index, is acceptable—the Silhouette measure is at an acceptable level, between 0.25 and 0.5, and is 0.34 [80,81]. The selection of a three-cluster solution was guided not only by the silhouette index but also by the interpretability and conceptual coherence of the clusters. Although other solutions were possible, the three clusters provided a meaningful and distinct typology of phygital consumers that aligned with the study objectives. The quality of the clustering is sufficient, as shown in Figure 6.

5. Analysis of the Results

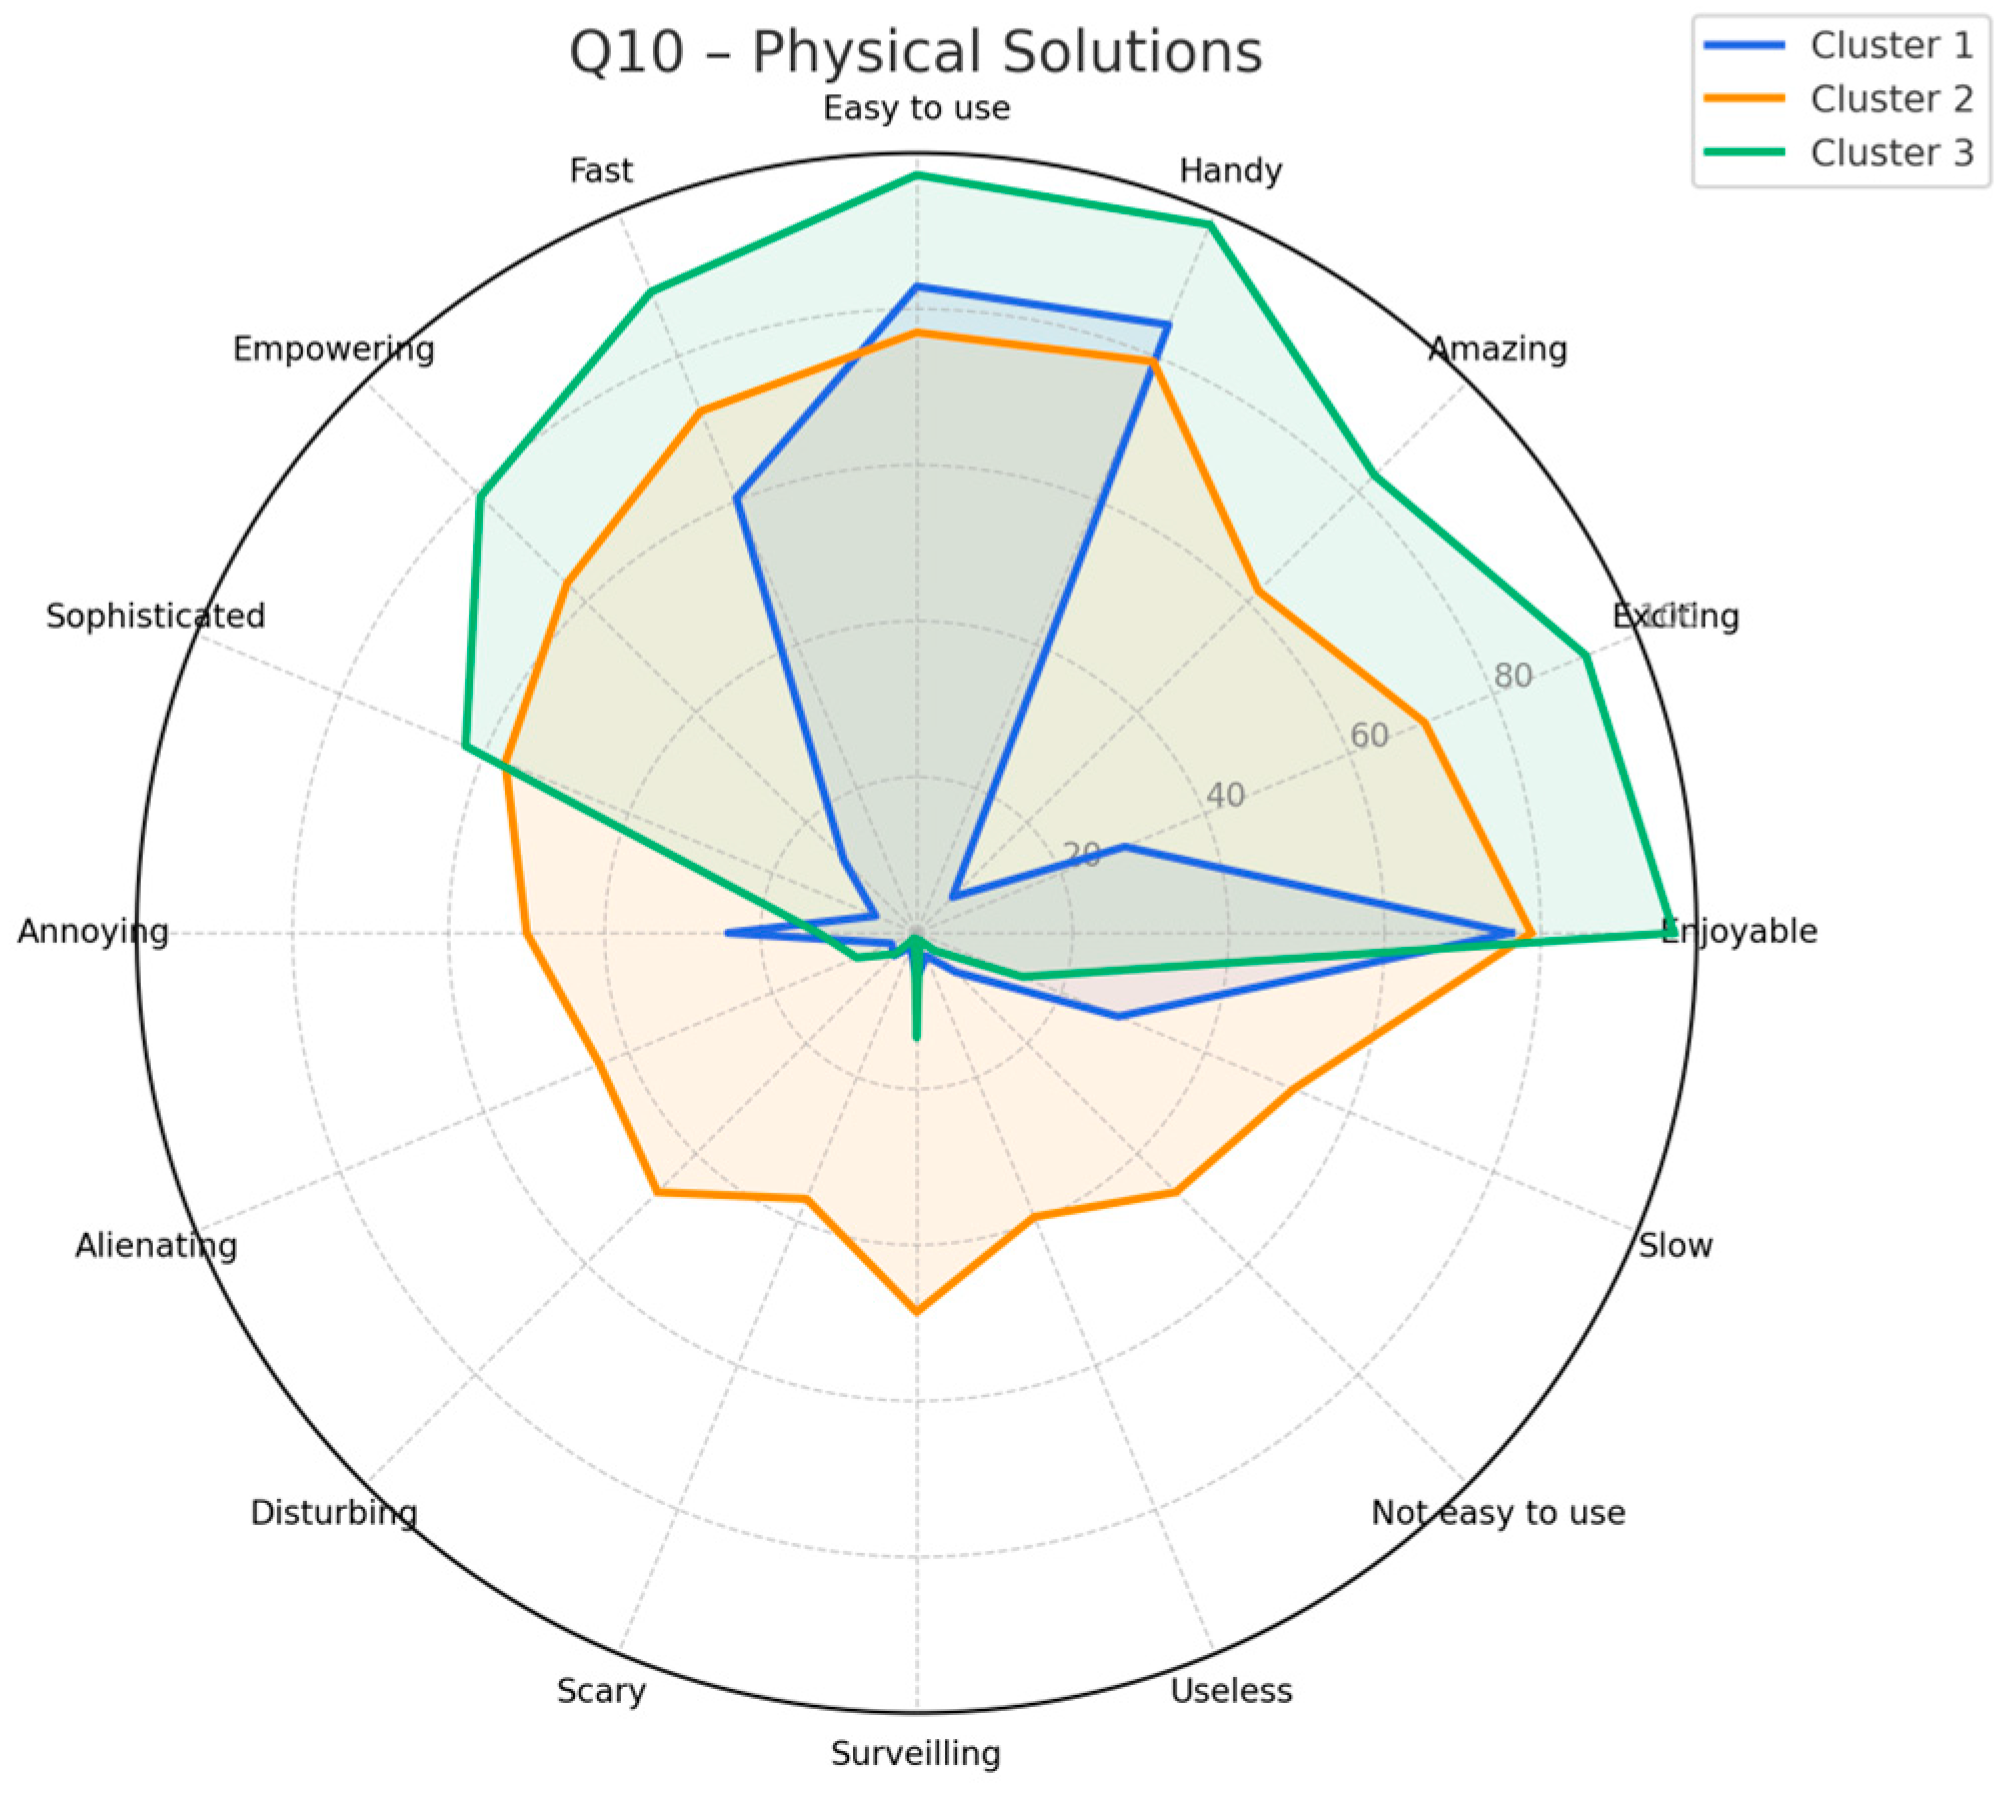
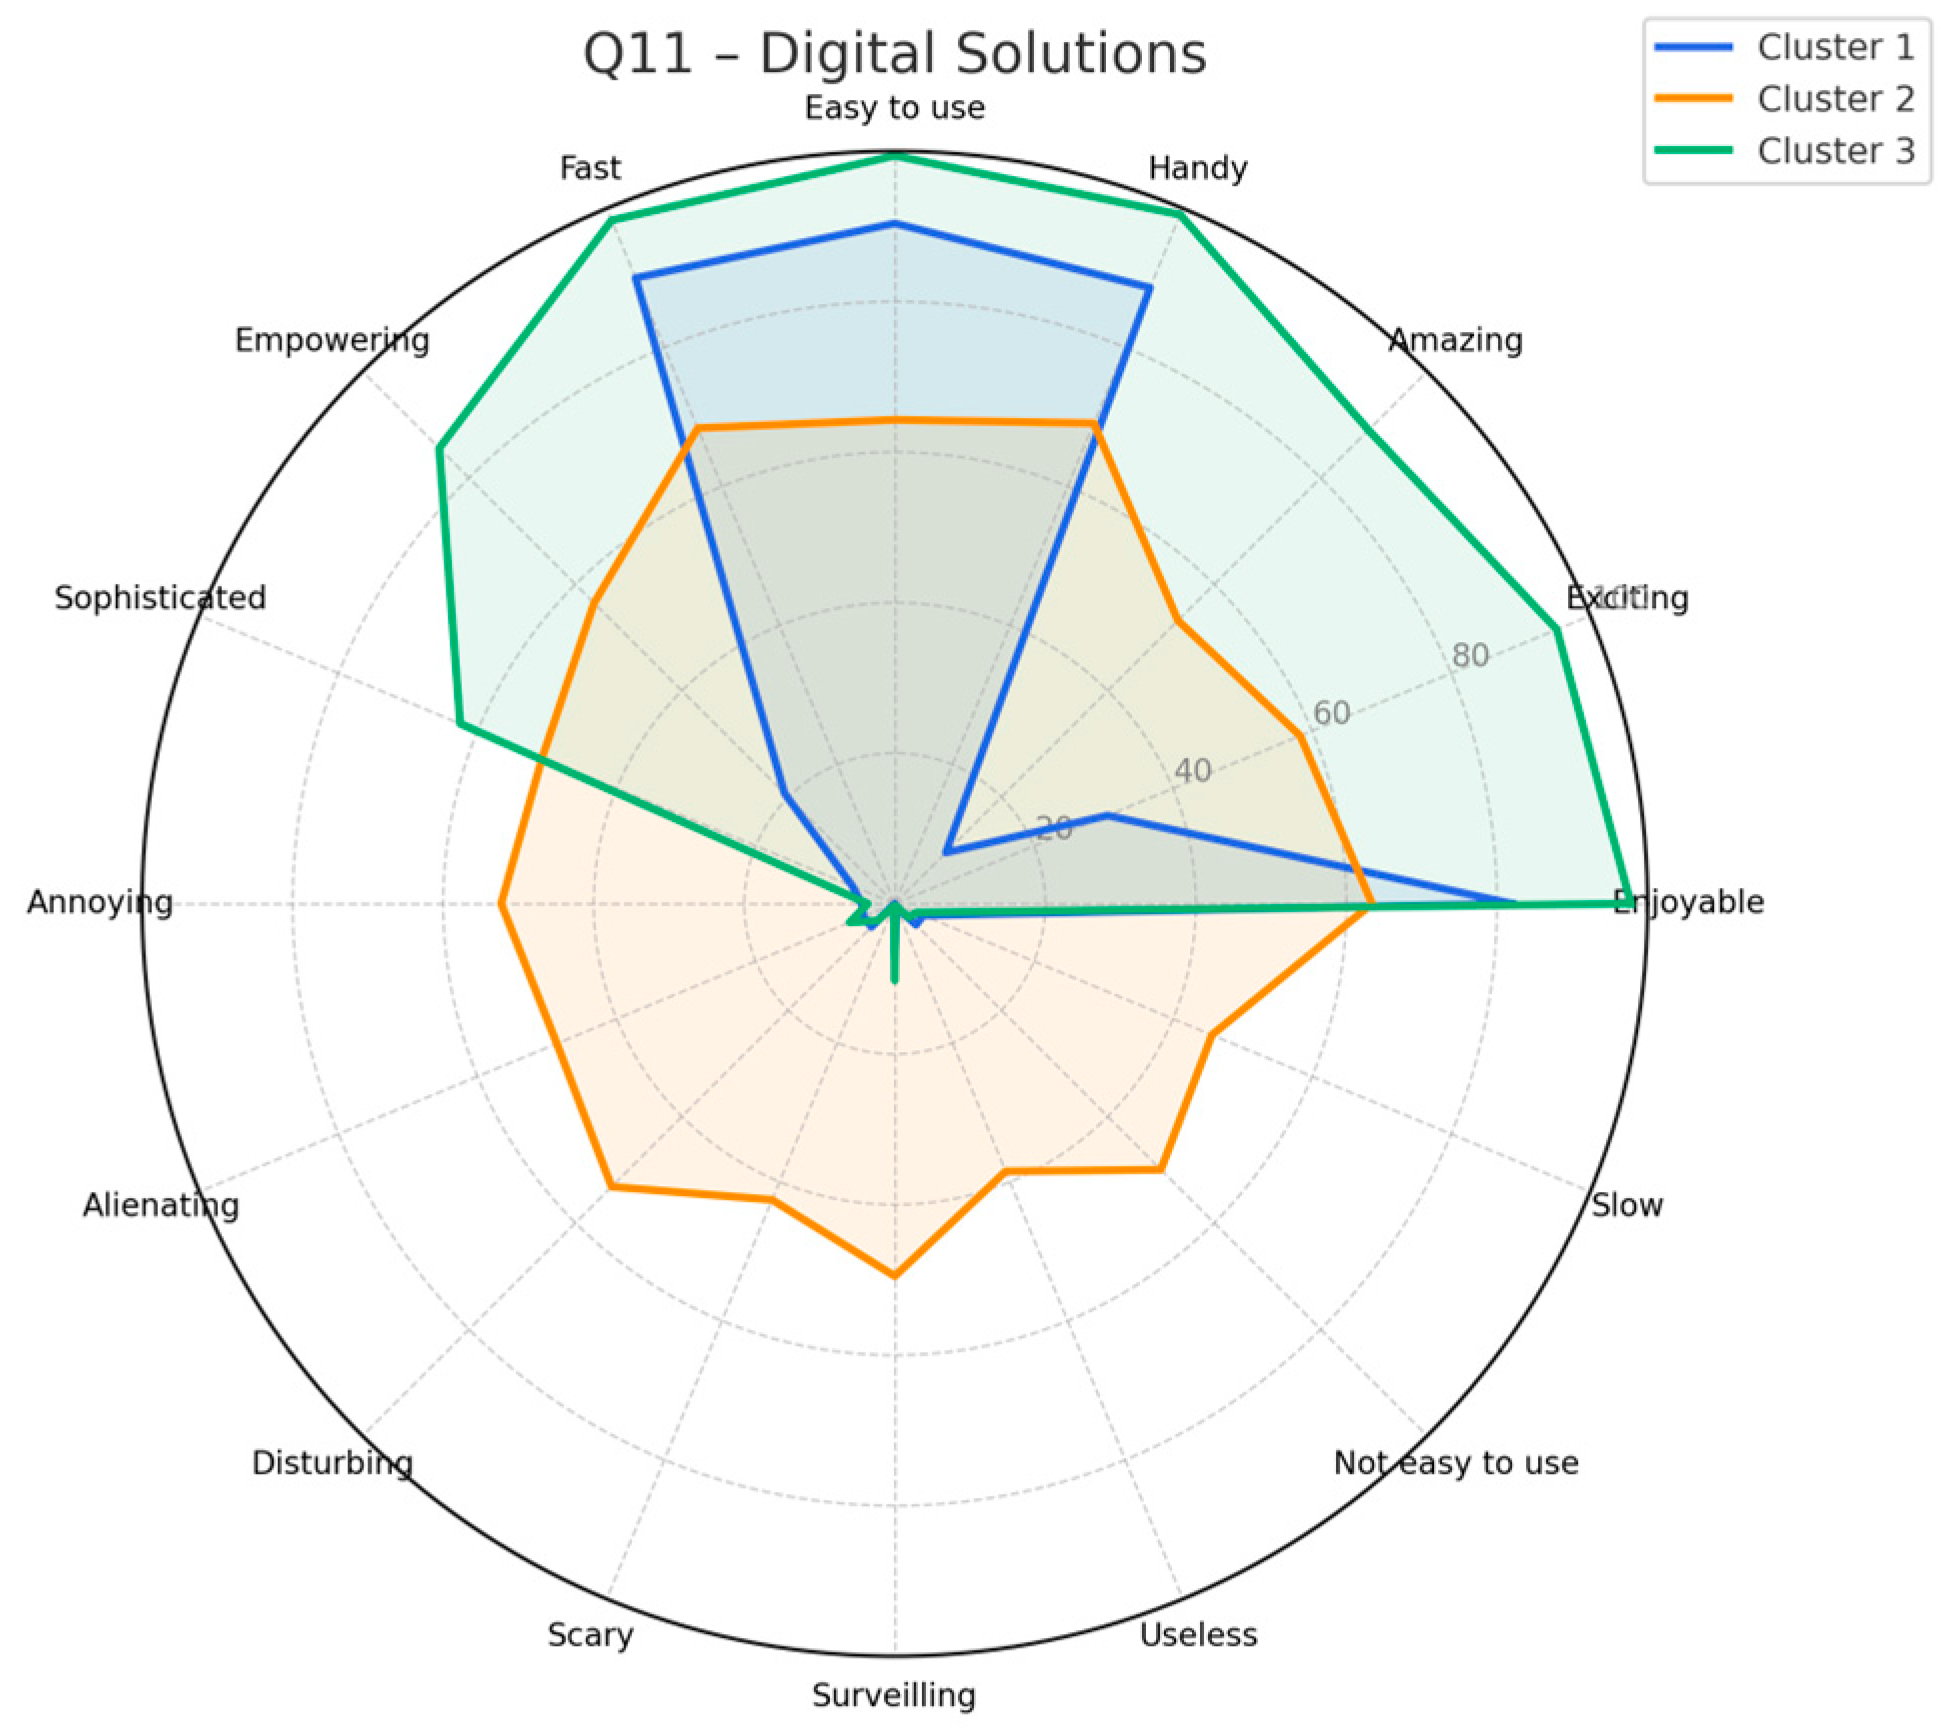
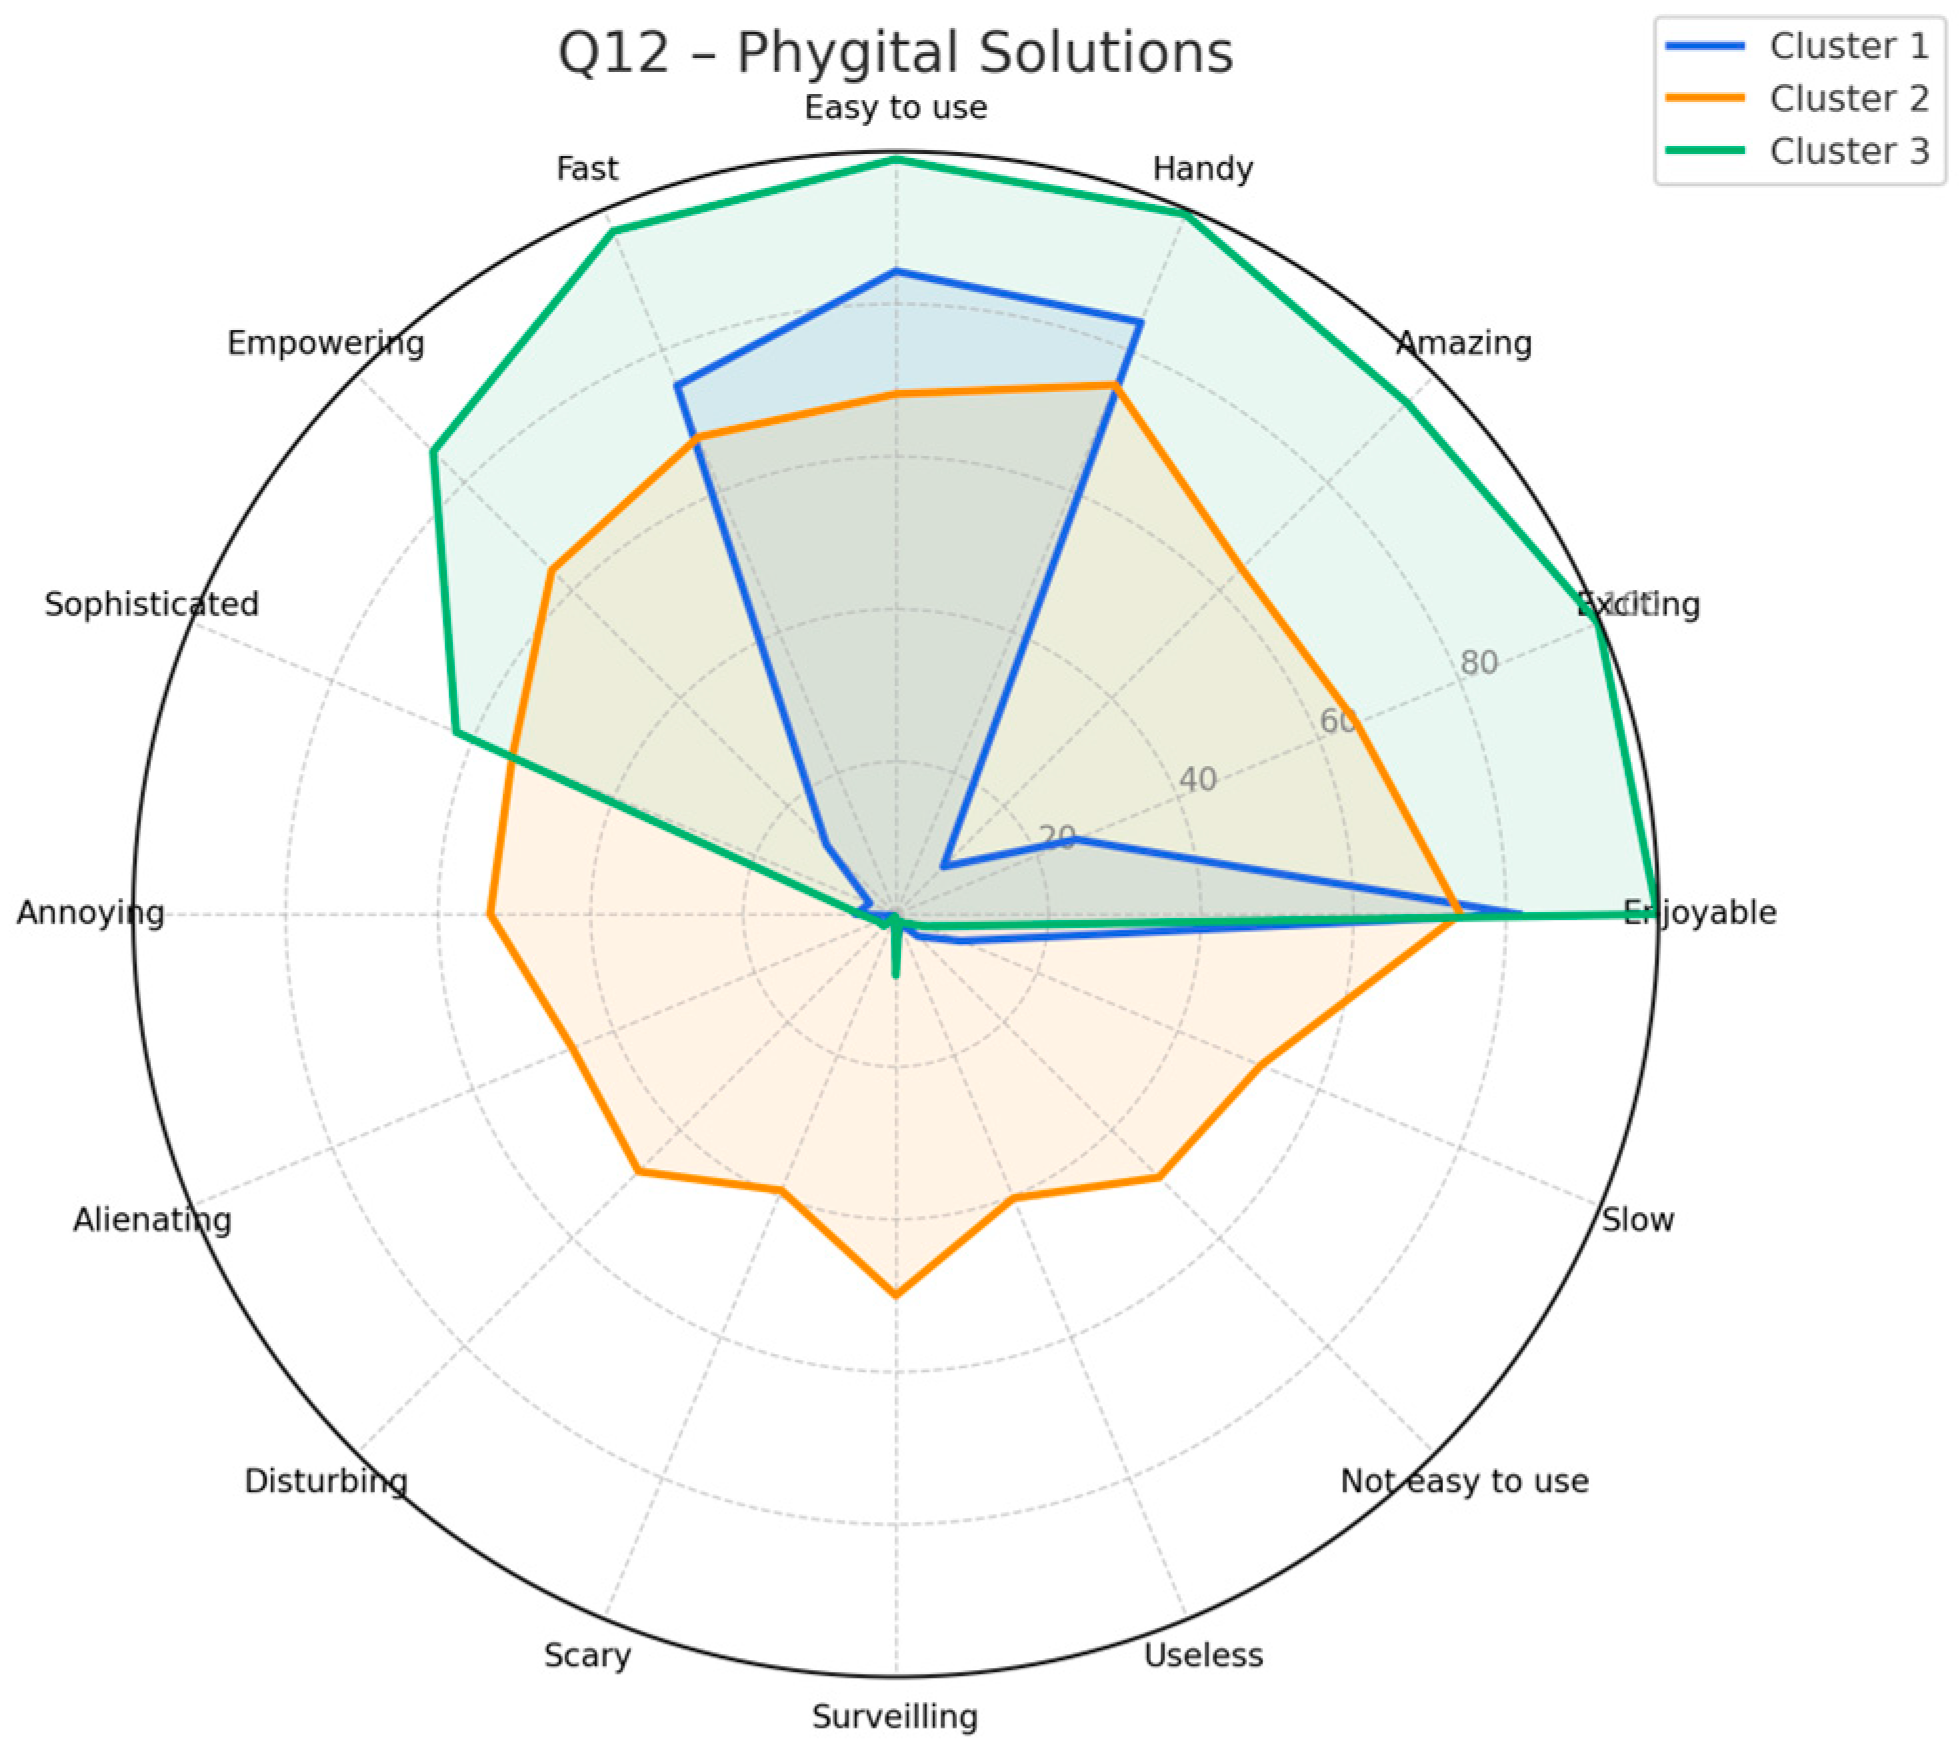
Comparing the clusters based on the variables used for classification, the distributions presented in Table 3 were derived. For easier understanding of the data obtained, they are also presented in radar charts—Figure 7, Figure 8 and Figure 9. The presented coding indicates the question number (from 10 to 12) and the number of emotions indicated by the respondents in the questionnaire. The key predictors—customer segmentation factors—are:
  • 12_r3
  • 11_r3 (87% validity of the first variable)
  • 10_r3 (83%)
  • 12_r7 (77%)
  • 12_r2 (73%)
  • 12_r8 (63%)
  • 12_r11 (61%)
  • 10_r7 (61%)
  • 11_r12 (60%)
  • 11_r7 (59%)
In describing the resulting clusters, we decided to use the original emotion terms, and in the case of negative responses, we used the prefix “not” or the term “definitely” to indicate a significant number of responses. These statements also provided the basis for creating “names” for the resulting types/clusters.
The first and largest identified group, making up 48.1% of respondents, included individuals who believed that (1) physical solutions were quite enjoyable, unexciting, convenient, easy to use, not very fast, not surveillant, and handy and easy to use. The phygital solutions did not empower, annoy, alienate, disturb, or scare users. They were seen to be relatively slow and definitely not impressive. (2) Digital solutions, according to them, were enjoyable, unexciting, handy, easy to use, fast, and practical. They did not empower them, were not sophisticated at all, and were not annoying, alienating, or disturbing. They were seen to be neither scary nor surveillant. They were seen to be neither slow nor impressive. (3) Phygital solutions, from the consumers’ perspective, were enjoyable, unexciting, handy, usually easy to operate, relatively fast, did not empower at all, and were not sophisticated, annoying, alienating, or disturbing. They were not seen to be scary, surveillant, useless, or slow. They were definitely not seen to be impressive. Based on this, the first type of phygital consumer was designated as a solution skeptic.
The second group identified is the smallest, comprising every fifth respondent (20.1%). These individuals believe that (1) physical solutions are enjoyable, exciting, quite impressive, handy, easy to use, fast, and empowering. Sometimes, they are also seen to be sophisticated, annoying, alienating, disturbing, and even frightening. They can be seen to be surveillant and pointless. Sometimes, they are seen to be not easy to use and are slow. According to these consumers, (2) digital solutions are enjoyable, reasonably easy to use, and generally handy. Sometimes, they are seen to be also exciting, impressive, empowering, and sophisticated. However, they can be seen to be annoying, alienating, disturbing, and frightening, as well as surveillant. Sometimes, they are seen to be useless, difficult to use, and slow to operate. On the other hand, (3) phygital solutions are seen to be enjoyable, exciting, impressive, handy, easy to use, relatively fast, and empowering and sophisticated. However, they can be seen to be annoying, alienating, disturbing, frightening, surveillant, pointless, challenging to use, and slow. Based on this, this group has been defined as cautious explorers.
The third group includes nearly one-third of respondents, accounting for 31.9% of the total. These respondents believe that (1) physical solutions are definitely enjoyable, exciting, amazing, handy, easy to use, fast, and clearly empowering. They are seen to be quite sophisticated and user-friendly, and they work quickly. They are not seen to be annoying, alienating, disturbing, or scary. They are not seen to be surveillant or useless. (2) Digital solutions, according to consumers in this group, are perceived as enjoyable, exciting, amazing, handy, easy to use, fast, empowering, and quite sophisticated. They are not seen to be annoying or alienating at all. They are seen to be neither disturbing nor scary, surveillant, slow, or useless. However, they are seen to be easy to operate. Similar responses were given for phygital solutions (3). This group can therefore be described as the tool enthusiasts.

6. Discussion

From the point of view of consumer research, the use of cluster analysis to prepare a consumer typology requires the preparation of a description of the distinguished types of consumers, which should be the final effect of the statistical analyses carried out and should be useful for researchers as well as for business practitioners in the studied markets [82].
The characteristics of the distinguished consumer types are presented in Table 4.
Analyses of phygital consumers’ emotions toward digital solutions in retailing and services are increasingly being published in recent scientific literature. Although phygitality is a relatively new phenomenon, research from various regions worldwide indicates that phygital consumers are classified, among other things, based on psychographic criteria, considering their emotions toward technologies that bridge the digital and physical worlds. Previous research typically focuses on specific solutions and adopts a generalized approach, without distinguishing particular elements.
Our study is comprehensive—it defines types of phygital customers by examining their emotions toward different physical and digital solutions used in retailing and services (without focusing on specific elements). Thus, it contributes to the growing body of research on the phygital customer, phygital experience, and phygital solutions. The study was inspired by the article “Phygital Luxury Experiences: A Correspondence Analysis on Retail Technologies” [11], which discusses the phygital phenomenon in luxury retail. It explores how consumers perceive specific retail solutions (virtual fitting rooms, holograms, self-checkout, etc.) based on the emotions these evoke. Correspondence analysis was used to create perception maps that illustrate the relationships between technologies and respondents’ emotions. The results show that perceptions of phygital solutions are generally positive—most respondents described them as “enjoyable,” “handy,” and “fast.” In this research, no consumer typology based on emotions toward digital solutions was developed. The overlap with our research lies in the analysis of emotions toward these solutions, but the findings are not comparable due to differences in scope and level of detail. Our research does not refer to specific, particular digital solutions.
Maciejewski and Wróblewski [20] developed a typology of consumers based on their use of solutions that combine physical and digital environments. They identified three types: phygital integrators, digital frequenters, and phygital reality anchors. This typology was based on a Likert scale measuring attitudes toward 20 specific solutions used in retailing and services. The typology was based not on emotions toward phygital solutions but on attitudes toward them. Therefore, these findings cannot be directly compared with our studies. Strengths include a large sample, but it is limited to internet users in a single country (Poland) and the findings rely on self-reports and attitudes rather than observed behavior.
Wróblewski [83] analyzed how audiences for culture blend physical and digital channels, as well as the emotions associated with these behaviors. Through their research, they identified five segments of audiences for culture: Fundamental Traditionalists (the most conservative, primarily using offline channels), Predominantly Physical with Digital Elements, Phygital Integrators (moderately conservative, combining online and offline channels and benefiting from both), Predominantly Digital, and Digital Specialists. The findings consistently link channel preferences to demographics: younger, more educated and urban respondents favor digital and hybrid options, while older, rural, and less educated groups prefer physical channels. The study focused on a typology of culture’s consumers, so its scope is much narrower than our research, making it difficult to compare the results.
In other studies, researchers discuss specific solutions that improve the phygital customer experience. Romano et al. [84] surveyed attitudes toward augmented reality (AR). Respondents evaluated whether they found AR easy, useful, and enjoyable or had the opposite experience. From their direct research, they identified four consumer segments: AR Enthusiasts, AR Open, AR Hesitant, and AR Averse. It shows that segment membership is shaped by perceived ease of use, perceived usefulness, and psychographic traits (e.g., innovativeness, time pressure, shopping enjoyment), and that attitudes hinge on trade-offs among decision confidence, information overload, and experiential value. The authors argue that retailers can tailor communications to these value dimensions and that consumer attitudes toward AR can be improved through education. Critically, because the evidence comes from a single cross-sectional online sample of U.S. shoppers, the study itself does not establish generalizability or causality beyond this context. This study concerns only AR—and it was conducted in the United States—so it cannot be compared with our research.
Park and Stangl [85] also studied augmented reality in relation to personality traits, such as sensation-seeking, and how consumers in the tourism sector perceive AR applications. Their research revealed four groups: High-Sensation Seekers (who tend to try new technologies and rate AR the highest spontaneously), Moderate-Sensation Seekers (who appreciate AR moderately, without strong emotions or clear benefits), Ambivalent-Sensation Seekers (who are open to new experiences), and Low-Sensation Seekers (who rated AR the lowest, prefer simple applications, and are easily discouraged). Sensation seeking is a useful lens for differentiating user experiences, with two components—experience seeking and boredom susceptibility—emerging as key factors for classifying traveler groups in the AR context. In this case as well, it is difficult to compare the study’s findings with our own because it focuses on only a single phygital solution.
Nöijd et al. [86] conducted interesting research on how value is created in physical store spaces and the effect of digital technology on customer experience. They identified three types of customer attitudes toward technology: Digital Keenness (a positive attitude and skill in using technology), Digital Averseness (an unfavorable attitude toward technology), and Digital Satisfaction (the overall level of satisfaction with using technology).
Huang and Nustrat [87] analyzed two checkout systems—self-checkout and traditional cashier-assisted checkout—to assess their effect on customer loyalty to the store. Their findings revealed that customers who view self-service as a reward and a means of developing a sense of autonomy create stronger bonds with the store, while those who see cashier-assisted checkout as an entitlement tend to have a negative view of self-service. Due to the fact that these studies focused on the specific solution (self-checkout) and they did not perform a typology of consumers based on emotions towards phygital solutions, the results of these studies cannot be compared with our research.
Holthöwer and van Doorn [88] examined emotions toward front-office robots, concluding that this type of solution can help reduce customer discomfort related to the fear of human evaluation in traditional service settings. Their research indicated that in situations of high discomfort—when consumers feel anxious about being judged by humans—people are more likely to choose a robot, especially one that does not resemble a human. Robots with a more machine-like appearance are most effective at easing customer discomfort during sensitive purchases, such as buying specific medications. The study concentrates on one specific phygital solution and there is no typology of customers, which makes it difficult to compare the results with our research.
Gary’s study [89] examined how push notifications affect consumer emotions (pleasure versus irritation) and whether they impact purchasing behavior. The analysis revealed two main points: when notifications are concise, clear, and useful, consumers experience pleasure and are more likely to make a purchase. When notifications are too frequent and intrusive, they cause irritation, which hinders purchases. The author highlighted that pleasure is more effective than irritation. Emotions play a key mediating role in the relationship between push messages and purchase outcome so e-commerce platforms should strategically manage the content, form and timing of messages to maximize enjoyment and minimize irritation of customers. As the study focused on e-commerce and there is no typology of customers based on emotions toward phygital solutions, it is hard to compare the results with our findings.
Yoganathan et al. [90] conducted international research across 19 countries from 2012 to 2024, identifying four social attitudes toward service robots. “Positive (adore)” is adopted by those eager to try new devices, viewing them as a convenience in daily life. These individuals are more likely to be young. “Negative (abhor)” is common among skeptics of such solutions, those with limited digital capital, and older demographics. “Indifferent (ignore)” reflects a passive attitude, while “Ambivalent (unsure)” describes a stance that balances curiosity and fear, recognizing the benefits of service robots but lacking personal experience with them. As the study concentrated on one phygital solution, which was investigated in many countries, it is difficult to relate our research results to these findings.
Our investigation results cannot be directly applied to the mentioned studies due to their differing research approaches, methodologies, and levels of detail and scope. The typology of the phygital consumer we presented may be helpful for future research on consumer emotions toward solutions in retailing and services. It would also be interesting to explore in more depth why specific solutions trigger positive or negative feelings.
In the context of sustainable development, phygital consumer research can serve as the foundation for designing retail and service solutions that enhance customer experience while lowering the environmental impact of purchases [91]. Phygital solutions certainly make shopping more convenient and can become a source of satisfaction. They can yield positive effects, such as reducing waste and saving materials. However, the ease, speed, and enjoyment associated with shopping can also lead to overconsumption, which conflicts with sustainable development goals [92]. Additionally, digitalization requires substantial energy to support, analyze, and utilize vast amounts of data [93]. Therefore, it is crucial to educate consumers about the role of their purchasing behaviors in sustainable development, and for retail and service companies to adopt sustainable digital solutions that responsibly incorporate new technologies—considering their effects on the environment, society, and the economy—such as energy efficiency, minimizing carbon footprints, and optimizing logistics and packaging [94]. It is also essential to recognize that phygital solutions may exclude individuals with lower digital literacy. The social aspects of sustainable development should also not be forgotten. The heterogeneity of phygital consumer types suggests diverse adaptive skills. These should be taken into account in policies aimed at socio-digital inclusion, which is becoming an increasingly challenging challenge in today’s societies. Involving all segments of society in its development is not only necessary from the perspective of sustainable development but also from the perspective of economic interest, as it can help more fully utilize the skills and competencies latent in community members [95,96,97,98].

7. Conclusions

The research findings and conclusions contribute to the discussion on the characteristics, diversity, and behavior of a new type of consumer: the phygital consumer.
From a useful perspective, the identified typology of phygital consumers provides practical insights for policymakers, marketers, and retail technology designers. Understanding the emotional differences between consumer types can support digital inclusion strategies aimed at reducing exclusion among digitally hesitant users. For marketers, this typology enables more precise personalization strategies by matching communication styles and interaction intensity to consumers’ emotional profiles. For retail and service designers, the results underscore the importance of flexible phygital solutions that address varying levels of digital readiness and emotional engagement.
Although the typology was developed in the context of a single country, its conceptual framework can be applied to other markets with varying levels of digital maturity. Cultural norms, commercial traditions, and technological infrastructure may, however, influence the prevalence and characteristics of specific types of phygital consumers. Therefore, cross-cultural replication studies are necessary to assess the robustness and adaptability of the proposed typology.
It is important to note the limitations of the conducted research. First, the study was based on an online survey, which limits access to consumers who do not use the internet. Therefore, the results can be considered representative of a specific group—adult internet users in Poland. However, a lack of internet use does not necessarily exclude individuals from being phygital consumers, as digitality is not 100% synonymous with the internet (some phygital tools operate offline).
Second, the declarative and self-declarative nature of the data, particularly regarding emotions, may be subject to response bias. Future research should incorporate more direct and mixed research methods, including observational or projective techniques, to reduce reliance on self-reported measures.
Third, the geographic scope of the study was limited to a single country. Cross-cultural research using the same or comparable research instruments could help determine whether the identified typology of phygital consumers is culturally specific or more universal.
From a methodological perspective, the study focused primarily on assessing reliability. Comprehensive validation of the measurement tool, including tests for common method bias and discriminant validity, was not conducted, and this should be addressed in future research to enhance construct robustness.
Another limitation concerns the clustering procedure. Although hierarchical clustering and k-means clustering were used, there was no systematic comparison of multiple clustering techniques, nor was kappa analysis used to assess agreement between solutions. Future research should explore alternative clustering approaches that do not require a priori determination of the number of clusters and incorporate agreement measures to enhance the stability and reliability of phygital consumer typologies.
Finally, certain technological limitations related to bibliometric analysis should be noted. Although the Biblioshiny (ver. 4.1.3) add-on (by Bibliometrix 5.0) in the RStudio (ver. 4.4.2) environment allows for the generation of comprehensive data, it offers limited control over graphical output, which may impact interpretability. Alternative tools could be considered in future research.
The characteristics of phygital consumer types discussed in this article can help businesses take actions to enhance the shopping experience for individual phygital consumers, including adjusting staff involvement levels. This approach can reduce the exclusion of consumers who lack digital skills or are hesitant to use phygital solutions. Gaining a better understanding of consumers can lead to more effective strategies for fostering positive attitudes toward phygital solutions.
The research results specifically focus on consumer emotions toward solutions and tools in commerce and services, which led to the identification of three types of phygital consumers. Generally, consumers see these tools and solutions as enjoyable, convenient, and relatively easy to use. In the context of sustainable development, this positive perception can promote more efficient use of products and services, ultimately improving quality of life. Nonetheless, from a Sustainable Development Goals perspective, future studies should also examine the real-world effects of these solutions, especially regarding their impact on consumer wellbeing across social, economic, psychological, and ecological dimensions. Combining an emotional perspective with an assessment of the actual usefulness of these solutions can deepen our understanding of how technology influences progress toward the Sustainable Development Goals.

Author Contributions

Conceptualization, B.K. and K.K.-S.; Data curation, K.K.-S.; Formal analysis, P.L.; Funding acquisition, K.K.-S., B.K., M.M. and P.L.; Investigation, K.K.-S., B.K., M.M. and P.L.; Methodology, K.K.-S. and B.K.; Project administration, K.K.-S.; Resources, K.K.-S., B.K., M.M. and P.L.; Software, K.K.-S.; Supervision, K.K.-S.; Validation, K.K.-S. and B.K.; Visualization, K.K.-S.; Writing—original draft, K.K.-S., B.K., M.M. and P.L.; Writing—review and editing, K.K.-S., B.K., M.M. and P.L. All authors have read and agreed to the published version of the manuscript.

Funding

This work was co-financed by the Polish Minister of Science under the “Regional Initiative of Excellence” programme. Task No. 6_1_GZ_2024—“The phygital consumer: the consumer at the interface of the physical and digital world”, carried out under the “UEKAT Programme of Scientific-Research and Educational Excellence—Regional Excellence Initiative”.

Institutional Review Board Statement

The study was conducted in accordance with the Declaration of Helsinki, and approved by the Human Subject Research Ethics Committee at the University of Economics in Katowice (Opinion No. 008/09/2024, date of approval 19 September 2024).

Informed Consent Statement

Informed consent was obtained from all subjects involved in the study.

Data Availability Statement

The data presented in this study are available on request from the corresponding author.

Conflicts of Interest

The authors declare no conflicts of interest.

References

  1. Valaskova, K.; Durana, P.; Adamko, P. Changes in Consumers’ Purchase Patterns as a Consequence of the COVID-19 Pandemic. Mathematics 2021, 9, 1788. [Google Scholar] [CrossRef] [Scilit]
  2. Antosova, I.; Psurny, M.; Stavkova, J. Changes in Consumer Purchasing Decisions: Traditional and Emerging Factos in The Dynamic Marketing Landscape over 15 years. Mark. Manag. Innov. 2023, 14, 85–96. [Google Scholar] [CrossRef] [Scilit]
  3. Dornberger, R.; Inglese, T.; Korkut, S.; Zhong, V.J. Digitalization: Yesterday, Today and Tommorow. In Business Information Systems and Technology 4.0. New Trends in the Age of Digital Change; Dornberger, R., Ed.; Springer International Publishing: Cham, Switzerland, 2018; Volume 141, pp. 1–11. [Google Scholar] [CrossRef] [Scilit]
  4. Mishra, A.; Shukla, A.; Rana, N.P.; Dwivedi, Y.K. From “touch” to a “multisensory” experience: The impact of technology interface and product type on consumer responses. Psychol. Mark. 2020, 38, 385–396. [Google Scholar] [CrossRef] [Scilit]
  5. Bartoli, C.; Nosi, C.; Mattiacci, A.; Bertuccioli, F. Consumer-brand relationship in the phygital age: A study of luxury fashion. Ital. J. Mark. 2023, 4, 429–450. [Google Scholar] [CrossRef] [Scilit]
  6. Johnson, M.; Barlow, R. Defining the Phygital Marketing Advantage. J. Theor. Appl. Electron. Commer. Res. 2021, 16, 2365–2385. [Google Scholar] [CrossRef] [Scilit]
  7. Batat, W. Phygital customer experience in the metaverse: A study of consumer sensory perception of sight, touch, sound, scent, and taste. J. Retail. Consum. Serv. 2024, 78, 103786. [Google Scholar] [CrossRef] [Scilit]
  8. Mele, C.; Di Bernardo, I.; Ranieri, A.; Spena, T.R. Phygital customer journey: A practice-based approach. Qual. Mark. Res. 2024, 27, 388–412. [Google Scholar] [CrossRef] [Scilit]
  9. Klaus, P. Viewpoint: Phygital—The emperor’s new clothes? J. Strateg. Mark. 2021, 32, 1172–1179. [Google Scholar] [CrossRef] [Scilit]
  10. Testa, D.S.; Slaton, K. The future is phygital: Integrated content analysis of current retail strategies and future priorities across digital, physical, and phygital modalities. J. Retail. 2025. [Google Scholar] [CrossRef] [Scilit]
  11. Guzzetti, A.; Crespi, R.; Belvedere, V. Phygital luxury experiences. A correspondence analysis on retail technologies. Int. J. Consum. Stud. 2024, 48, e13008. [Google Scholar] [CrossRef] [Scilit]
  12. Khatoon, S.; Rehman, V. Negative emotions in consumer brand relationship: A review and future research agenda. Int. J. Consum. Stud. 2021, 45, 719–749. [Google Scholar] [CrossRef] [Scilit]
  13. Sharma, K.; Trott, S.; Sahadev, S.; Singh, R. Emotions and consumer behaviour: A review and research agenda. Int. J. Consum. Stud. 2023, 47, 2396–2416. [Google Scholar] [CrossRef] [Scilit]
  14. Sharma, R.; Mohan, M.; Gupta, S.K. Emotions in retail setting: A systematic literature review based on current research. Int. J. Exp. Res. Rev. 2023, 30, 416–432. [Google Scholar] [CrossRef] [Scilit]
  15. Han, D. Clustering and Measuring Consumption Emotions: Scale Development Through Text Mining and a Quesionnaire Survey. J. Consum. Behav. 2025, 24, 1877–1893. [Google Scholar] [CrossRef] [Scilit]
  16. Gueznai, M.A.; Elboussadi, A. Exploratory Analysis of the Impact of Phygital on the Customer Experience. In AI and Data Engineering Solutions for Effective Marketing; Alla, L., Hmioui, A., Bentalha, B., Eds.; IGI Global: Hershey, PA, USA, 2024; pp. 364–387. [Google Scholar] [CrossRef] [Scilit]
  17. Bressolles, G.; Durrieu, F.; Senecal, S. A consumer typology based on e-service quality and e-satisfaction. J. Retail. Consum. Serv. 2014, 21, 889–896. [Google Scholar] [CrossRef] [Scilit]
  18. Karimi, S.; Papamichail, K.N.; Holland, C.P. The effect of prior knowledge and decision-making style on the online purchase decision-making process: A typology of consumer shopping behaviour. Decis. Support Syst. 2015, 77, 137–147. [Google Scholar] [CrossRef] [Scilit]
  19. Calvo-Porral, C.; Lévy-Mangin, J.-P.; Ruiz-Vega, A. An emotion-based typology of wine consumers. Food Qual. Prefer. 2020, 79, 103777. [Google Scholar] [CrossRef] [Scilit]
  20. Maciejewski, G.; Wróblewski, Ł. A Typology of Consumers Based on Their Phygital Behaviors. Sustainability 2025, 17, 6363. [Google Scholar] [CrossRef] [Scilit]
  21. Balderjahn, I.; Peyer, M.; Seegebarth, B.; Wiedmann, K.-P.; Weber, A. The many faces of sustainability-conscious consumers: A category-independent typology. J. Bus. Res. 2018, 91, 83–93. [Google Scholar] [CrossRef] [Scilit]
  22. Maciejewski, G.; Malinowska, M.; Kucharska, B.; Kucia, M.; Kolny, B. Sustainable Development as a Factor Differentiating Consumer Behavior: The Case of Poland. Eur. Res. Stud. J. 2021, XXIV, 934–948. [Google Scholar] [CrossRef] [Scilit]
  23. Rutkowska, M.; Tutaj, J.; Jezierski, J.; Kamińska, A. Consumer Behaviour in The Aspect of Sustainable Development. In Proceedings of the 5th International Scientific Conference on Modern Economics, Vigo, Spain, 14–16 May 2018. [Google Scholar]
  24. Raji, M.A.; Olodo, H.B.; Oke, T.T.; Addy, W.A.; Ofodile, O.C.; Oyewole, A.T. E-commerce and consumer behavior: A review of AI-powered personalization and market trends. GSC Adv. Res. Rev. 2024, 18, 066–077. [Google Scholar] [CrossRef] [Scilit]
  25. Gabhane, D.; Varalaxmi, P.; Rathod, U.; Hamida, A.G.B.; Anand, B. Digital Marketing Trends: Analyzing the Evolution of Consumer Behavior in The Online Space. Bol. De Lit. Oral Lit. J. 2023, 10, 462–473. [Google Scholar]
  26. Scott, A.J.; Knott, M.A. Cluster Analysis Method for Grouping Means in the Analysis of Variance. Biometrics 1974, 30, 507–512. [Google Scholar] [CrossRef] [Scilit]
  27. Del Vecchio, P.; Secundo, G.; Garzoni, A. Phygital technologies and environments for breakthrough innovation in customers’ and citizens’ journey. A critical literature review and future agenda. Technol. Forecast. Soc. Change 2023, 189, 122342. [Google Scholar] [CrossRef] [Scilit]
  28. Batat, W. Strategies for the Digital Customer Experience: Connecting Customers with Brands in the Phygital Age; Edward Elgar Publishing: Cheltenham, UK, 2022. [Google Scholar]
  29. Lee, D.J.; Yu, G.B.; Sirgy, M.J. Reflections on phygital experiences: Conceptual boundaries, wellbeing benefits and methodological suggestions. Qual. Mark. Res. Int. J. 2024, 27, 515–522. [Google Scholar] [CrossRef] [Scilit]
  30. Yao, A.; Chan, N.; Yao, N. Understanding consumer behavior in phygital environments: An interpretivist methodological framework. Qual. Mark. Res. Int. J. 2024, 27, 449–470. [Google Scholar] [CrossRef] [Scilit]
  31. Lemon, K.N.; Verhoef, P.C. Understanding customer experience throughout the customer journey. J. Mark. 2016, 80, 69–96. [Google Scholar] [CrossRef] [Scilit]
  32. Pantano, E.; Viassone, M. Demand pull and technology push perspective in technology-based innovations for the points of sale: The retailers evaluation. J. Retail. Consum. Serv. 2014, 21, 43–47. [Google Scholar] [CrossRef] [Scilit]
  33. Bustamante, J.C.; Rubio, N. Measuring customer experience in physical retail environments. J. Serv. Manag. 2017, 28, 884–913. [Google Scholar] [CrossRef] [Scilit]
  34. Bonfanti, A.; Yfantidou, G. Designing a memorable in-store customer shopping experience: Practical evidence from sports equipment retailers. Int. J. Retail Distrib. Manag. 2021, 49, 1295–1311. [Google Scholar] [CrossRef] [Scilit]
  35. Sukheeja, N.; Shekhawat, P. The Rise of Phygital Marketing: How Brands Are Merging Physical and Digital Experiences for Customer Engagement. Int. J. Innov. Res. Anal. 2025, 05, 167–171. [Google Scholar] [CrossRef] [Scilit]
  36. Kotler, P.; Kartajaya, H.; Setiawan, I. Marketing 6.0. Przyszłość Jest Immersyjna; MT Biznes: Warszawa, Poland, 2024. [Google Scholar]
  37. Wirtz, J.; Patterson, P.G.; Kunz, W.H.; Gruber, T.; Lu, V.N.; Paluch, S.; Martins, A. Brave new world: Service robots in the frontline. J. Serv. Manag. 2018, 29, 907–931. [Google Scholar] [CrossRef] [Scilit]
  38. Pangarkar, A.; Arora, V.; Shukla, Y. Exploring phygital omnichannel luxury retailing for immersive customer experience: The role of rapport and social engagement. J. Retail. Consum. Serv. 2022, 68, 103001. [Google Scholar] [CrossRef] [Scilit]
  39. Berbeka, J. Wirtualna i rozszerzona rzeczywistość a zachowania konsumentów. Stud. Ekon. 2016, 303, 84–101. [Google Scholar]
  40. Mele, C.; Spena, T.R.; Marzullo, M.; Di Bernardo, I. The phygital transformation: A systematic review and a research agenda. Ital. J. Mark. 2023, 3, 323–349. [Google Scholar] [CrossRef] [Scilit]
  41. Lubowiecki-Vikuk, A. Emocje w zarządzaniu doświadczeniami klientów—Perspektywa organizacji doświadczeniocentrycznej. In Zachowania Podmiotów Rynkowych w Warunkach Niepewności. Teoria i Praktyka—Wybrane Zagadnienia; Plichta, J., Brańka, S., Orzeł, K., Eds.; Instytut Nauk Ekonomicznych Polskiej Akademii Nauk: Warszawa, Poland, 2023; pp. 55–66. [Google Scholar]
  42. Verhoef, P.C.; Lemon, K.N.; Parasuraman, A.; Roggeveen, A.; Tsiros, M.; Schlesinger, L.A. Customer Experience Creation: Determinants, Dynamics and Management Strategies. J. Retail. 2009, 85, 31–41. [Google Scholar] [CrossRef] [Scilit]
  43. Liu, L.; Lee, S.H. Do People Really Care if it’s Phygital Retail? Exploring the Relationship Between Customer Experiences and Customer Behaviors. Asia Mark. J. 2024, 26, 186–200. [Google Scholar] [CrossRef] [Scilit]
  44. Kucharska, B.; Malinowska, M. Virtualization of service consumer behavior in Poland—A post-pandemic perspective. Mark. Instytucji Nauk. Badaw. 2024, 53, 98–118. [Google Scholar] [CrossRef] [Scilit]
  45. Batat, W. Digital Luxury: Transforming Brands and Consumer Experiences; Sage Publications Ltd.: Thousand Oaks, CA, USA, 2019. [Google Scholar] [CrossRef] [Scilit]
  46. Banik, S.; Gao, Y. Exploring the hedonic factors affecting customer experiences in phygital retailing. J. Retail. Consum. Serv. 2023, 70, 103147. [Google Scholar] [CrossRef] [Scilit]
  47. Alexander, B.; Cano, M.B. Store of the future: Towards a (re) invention and (re) imagination of physical store space in an omnichannel context. J. Retail. Consum. Serv. 2020, 55, 101913. [Google Scholar] [CrossRef] [Scilit]
  48. Fu, X.; Ren, X. Order effect of multi-touchpoints on generation Z consumers. Int. J. Consum. Stud. 2023, 47, 1516–1532. [Google Scholar] [CrossRef] [Scilit]
  49. Alexander, B.; Varley, R. Retail futures: Customer experience, phygital retailing, and the Experiential Retail Territories perspective. J. Retail. Consum. Serv. 2025, 82, 104108. [Google Scholar] [CrossRef] [Scilit]
  50. Jacob, F.; Pez, V.; Volle, P. Shifting to phygital experience management with design science: A six-step method to manage customer journeys. J. Strateg. Mark. 2023, 31, 961–982. [Google Scholar] [CrossRef] [Scilit]
  51. Bonfanti, A.; Vigolo, V.; Vannucci, V.; Brunetti, F. Creating memorable shopping experiences to meet phygital customers’ needs: Evidence from sporting goods stores. Int. J. Retail Distrib. Manag. 2023, 51, 81–100. [Google Scholar] [CrossRef] [Scilit]
  52. Alberti, F.G.; Belfanti, F. Trend-driven Innovation in Manufacturing. In Proceedings of the World Manufacturing Forum, Como, Italy, 20–21 October 2021. [Google Scholar]
  53. Batat, W.; Hammedi, W. The extended reality technology (ERT) framework for designing customer and service experiences in phygital settings: A service research agenda. J. Serv. Manag. 2022, 34, 10–33. [Google Scholar] [CrossRef] [Scilit]
  54. Banik, S. Exploring the involvement-patronage link in the phygital retail experiences. J. Retail. Consum. Serv. 2021, 63, 102739. [Google Scholar] [CrossRef] [Scilit]
  55. Foster, J.; McLelland, M.A. Retail atmospherics: The impact of a brand dictated theme. J. Retail. Consum. Serv. 2015, 22, 195–205. [Google Scholar] [CrossRef] [Scilit]
  56. Chitturi, R.; Raghunathan, R.; Mahajan, V. Delight by design: The role of hedonic versus utilitarian benefits. J. Mark. 2008, 72, 48–63. [Google Scholar] [CrossRef] [Scilit]
  57. Pusceddu, G.; Moi, L.; Cabiddu, F. Do they see eye to eye? Managing customer experience in phygital high-tech retail. Manag. Decis. 2025, 63, 2008–2037. [Google Scholar] [CrossRef] [Scilit]
  58. Kotler, P.; Stigliano, G. Retail 4.0. 10 Zasad Handlu Detalicznego w Erze Cyfrowej; PWE: Warsaw, Poland, 2022. [Google Scholar]
  59. Kumar, J.; Rani, V.; Rani, M.; Rani, G. Generational differences towards phygital services: Insight from the retail banking industry. Int. J. Retail. Distrib. Manag. 2025, 53, 537–555. [Google Scholar] [CrossRef] [Scilit]
  60. Hjort, K.; Lantz, B.; Ericsson, D.; Gattorna, J. Customer segmentation based on buying and returning behaviour. Int. J. Phys. Distrib. Logist. Manag. 2013, 43, 852–865. [Google Scholar] [CrossRef] [Scilit]
  61. Uncles, M.D. Understanding retail customers. In Retailing in the 21st Century: Current and Future Trends, 2nd ed.; Krafft, M., Mantrala, M.K., Eds.; Springer: Berlin/Heidelberg, Germany, 2009. [Google Scholar]
  62. Kucharska, B. Innowacje w Handlu Detalicznym w Kreowaniu Wartości Dla Klienta; Uniwersytet Ekonomiczny w Katowicach: Katowice, Poland, 2014. [Google Scholar]
  63. Ozimek, I.; Maciejewski, G.; Kita, P.; Szlachciuk, J. A typology of consumers by their nutritional behaviors and selected lifestyle elements. J. Econ. Manag. 2023, 45, 68–101. [Google Scholar] [CrossRef] [Scilit]
  64. Hyun, H.; Park, J.; Hawkins, M.A.; Kim, D. How luxury brands build customer-based brand equity through phygital experience. J. Strateg. Mark. 2024, 32, 1195–1219. [Google Scholar] [CrossRef] [Scilit]
  65. Page, M.J.; McKenzie, J.E.; Bossuyt, P.M.; Boutron, I.; Hoffmann, T.C.; Mulrow, C.D.; Shamseer, L.; Tetzlaff, J.M.; Akl, E.A.; Brennan, S.E.; et al. The PRISMA 2020 statement: An updated guideline for reporting systematic reviews. BMJ 2021, 372, n71. [Google Scholar] [CrossRef] [Scilit] [PubMed]
  66. Valle-Cruz, D.; Gil-Garcia, J.R.; Sandoval-Almazan, R. Chapter 1: Arificial intelligence algorithms and applications in the public sector: A systematic literature review based on the PRISMA approach. In Research Handbook on Public Management and Artifical Intelligence; Charalabidis, Y., Medaglia, R., van Noordt, C., Eds.; Edward Elgar Publishing: Cheltenham, UK, 2024; pp. 8–26. [Google Scholar] [CrossRef] [Scilit]
  67. Hadasik, B.; Ryczko, A.; Burgiel-Szewc, A. User Acceptance of Leisure and Hobby Subscription Services—A Systematic Literature Review. In Proceedings of the 32nd International Conference on Information Systems Development, Gdańsk, Poland, 26–28 August 2024. [Google Scholar]
  68. Arruda, H.; Silva, E.R.; Lessa, M.; Proenca, D., Jr.; Bartholo, R. VOSviewer and Bibliometrix. J. Med. Libr. Assoc. 2022, 110, 392–395. [Google Scholar] [CrossRef] [Scilit]
  69. Aria, M.; Cuccurullo, C. Bibliometrix: An R-tool for comprehensive science mapping analysis. J. Informetr. 2017, 11, 959–975. [Google Scholar] [CrossRef] [Scilit]
  70. Ciavolino, E.; Aria, M.; Cheah, J.-H.; Roldán, J.L. A tale of PLS Structural Equation Modelling: Episode I—A Bibliometrix Citation Analysis. Soc. Indic. Res. 2022, 164, 1323–1348. [Google Scholar] [CrossRef] [Scilit]
  71. Abbas, A.F.; Jusoh, A.; Mas’od, A.; Alsharif, A.H.; Ali, J. Bibliometrix analysis of information sharing in social media. Cogent Bus. Manag. 2022, 9, 2016556. [Google Scholar] [CrossRef] [Scilit]
  72. Regulamin Uczestnictwa w Programie Badawczym “Ariadna”. Available online: https://panelariadna.pl/regulamin.pdf?v=10052024 (accessed on 24 May 2025).
  73. Siuda, P. Ankieta internetowa: Zalety i wady—Rekapitulacja. In Metody Badań Online; Siuda, P., Ed.; Naukowe Katedra: Warsaw, Poland, 2016; pp. 28–81. [Google Scholar]
  74. Kaczmarczyk, S. Zalety i wady metod zbierania danych przez Internet w badaniach marketingowych. Zesz. Nauk. Politech. Śląskie Ser. Organ. I Zarządzanie 2018, 129, 187–200. [Google Scholar]
  75. Ciżkowicz, B. Omega McDonalda jako alternatywa dla alfa Cronbacha w szacowaniu rzetelności testu. Pol. Forum Psychol. 2018, 23, 311–329. [Google Scholar] [CrossRef]
  76. Kalkbrenner, M.T. Choosing Between Cronbach’s Coefficient Alpha, McDonald’s Coefficient Omega, and Coefficient H: Confidence Intervals and the Advantages and Drawbacks of Interpretive Guidelines. Meas. Eval. Couns. Dev. 2024, 57, 93–105. [Google Scholar] [CrossRef] [Scilit]
  77. Graham, J. Congeneric and (Essentially) Tau-Equivalent Estimates of score reliability What they are and how to use them. Educ. Psychol. Meas. 2006, 66, 930–944. [Google Scholar] [CrossRef] [Scilit]
  78. Aron, A.; Aron, E.N.; Coups, E. Statistics for Psychology; Pearson Education Ltd.: London, UK, 2013. [Google Scholar]
  79. Moumni, M.; Van Eck, M.; Wendt, K.; Reininga, I.; Mokkink, L. Structural validity of the dutch version of the Patient-Rated Wrist Evaluation (PRWE-NL) in patients with hand and wrist injuries. Phys. Ther. 2016, 96, 908–916. [Google Scholar] [CrossRef] [Scilit]
  80. Řezanková, H. Different Approaches To The Silhouette Coefficient Calculation In Cluster Evaluation. In Proceedings of the 21st International Scientific Conference AMSE, Kutná Hora, Czech Republic, 29 August–2 September 2018. [Google Scholar]
  81. Bagirov, A.M.; Aliguliyev, R.M.; Sultanova, N. Finding compact and well-separated clusters: Clustering using silhouette coefficients. Pattern Recognit. 2023, 135, 109144. [Google Scholar] [CrossRef] [Scilit]
  82. Maciejewski, G. Zastosowanie analizy skupień w badaniach konsumentów. In Konsument i Rynek—Badania Marketingowe—Strategie i Działania Marketingowe. Księga Jubileuszowa z Okazji 50-Lecia Pracy Twórczej Prof. zw. dr Hab. Krystyny Mazurek-Łopacińskiej; Sobocińska, M., Ed.; Wydawnictwo Uniwersytetu Ekonomicznego we Wrocławiu: Wrocław, Poland, 2023; pp. 329–339. [Google Scholar]
  83. Wróblewski, Ł. Phygital consumption of cultural services: Segmenting consumers by purchase channel preferences. Cult. Manag. Sci. Educ. 2025, 9, 31–48. [Google Scholar] [CrossRef] [Scilit]
  84. Romano, B.; Sands, S.; Pallant, J. Virtual shopping: Segmenting consumer attitudes towards augmented reality as a shopping tool. Int. J. Retail Distrib. Manag. 2022, 50, 1221–1237. [Google Scholar] [CrossRef] [Scilit]
  85. Park, S.; Stangl, B. Augmented reality experiences and sensation seeking. Tour. Manag. 2020, 77, 104023. [Google Scholar] [CrossRef] [Scilit]
  86. Nöijd, S.; Westman Trischler, J.; Otterbring, T.; Andersson, P.K.; Wästlund, E. Bridging the valuescape with digital technology: A mixed methods study on customers’ value creation process in the physical retail space. J. Retail. Consum. Serv. 2020, 56, 102161. [Google Scholar] [CrossRef] [Scilit]
  87. Huang, Y.; Nusrat, F. Feeling rewarded and entitled to be served: Understanding the influence of self- versus regular checkout on customer loyalty. J. Bus. Res. 2024, 170, 114293. [Google Scholar] [CrossRef] [Scilit]
  88. Holthöwer, J.; van Doorn, J. Robots do not judge: Service robots can alleviate embarrassment in service encounters. J. Acad. Mark. Sci. 2023, 51, 767–784. [Google Scholar] [CrossRef] [Scilit]
  89. Gary, J. Examining the interplay of information, emotions, and behavior: PLS-ANN analysis. Front. Commun. 2024, 9, 1411870. [Google Scholar] [CrossRef] [Scilit]
  90. Yoganathan, V.; Osburg, V.S.; Fronzetti Colladon, A.; Charles, V.; Toporowski, W. Societal attitudes toward service robots: Adore, abhor, ignore, or unsure? J. Serv. Res. 2025, 28, 93–111. [Google Scholar] [CrossRef] [Scilit]
  91. Piscicelli, L. The sustainability impact of a digital circular economy. Curr. Opin. Environ. Sustain. 2023, 61, 101251. [Google Scholar] [CrossRef] [Scilit]
  92. Pettifor, H.; Agnew, M.; Wilson, C.; Niamir, L. Disentangling the carbon emissions impact of digital consumer innovations. J. Clean. Prod. 2024, 485, 14441. [Google Scholar] [CrossRef] [Scilit]
  93. Murino, T.; Monaco, R.; Nielsen, P.S.; Liu, X.; Esposito, G.; Scognamiglio, C. Sustainable energy data centres: A holistic conceptual framework for design and operations. Energies 2023, 16, 5764. [Google Scholar] [CrossRef] [Scilit]
  94. Florek-Paszkowska, A.; Ujwary-Gil, A. The Digital-Sustainability Ecosystem. A conceptual framework for digital transformation and sustainable innovation. J. Enterpreneurship Manag. Innov. 2025, 21, 116–137. [Google Scholar] [CrossRef] [Scilit]
  95. Ghouse, G.; Aslam, A.; Bhatti, M.I. The Impact of the Environment, Digital-Social Inclusion, and Institutions on Inclusive Growth: A Conceptual and Empirical Analysis. Energies 2022, 15, 7098. [Google Scholar] [CrossRef] [Scilit]
  96. von Schönfeld, K.C.; Ferreira, A. Urban Planning and European Innovation Policy: Achieving Sustainability, Social Inclusion, and Economic Growth? Sustainability 2021, 13, 1337. [Google Scholar] [CrossRef] [Scilit]
  97. Mohan, R.; Saleem, F.; Voderhobli, K.; Sheikh-Akbari, A. Ensuring Sustainable Digital Inclusion among the Elderly: A Comprehensive Analysis. Sustainability 2024, 16, 7485. [Google Scholar] [CrossRef] [Scilit]
  98. Alhassan, M.D.; Adam, I.O. Digital inclusion and sustainable development goals. J. Sci. Technol. Policy Manag. 2024. [Google Scholar] [CrossRef] [Scilit]
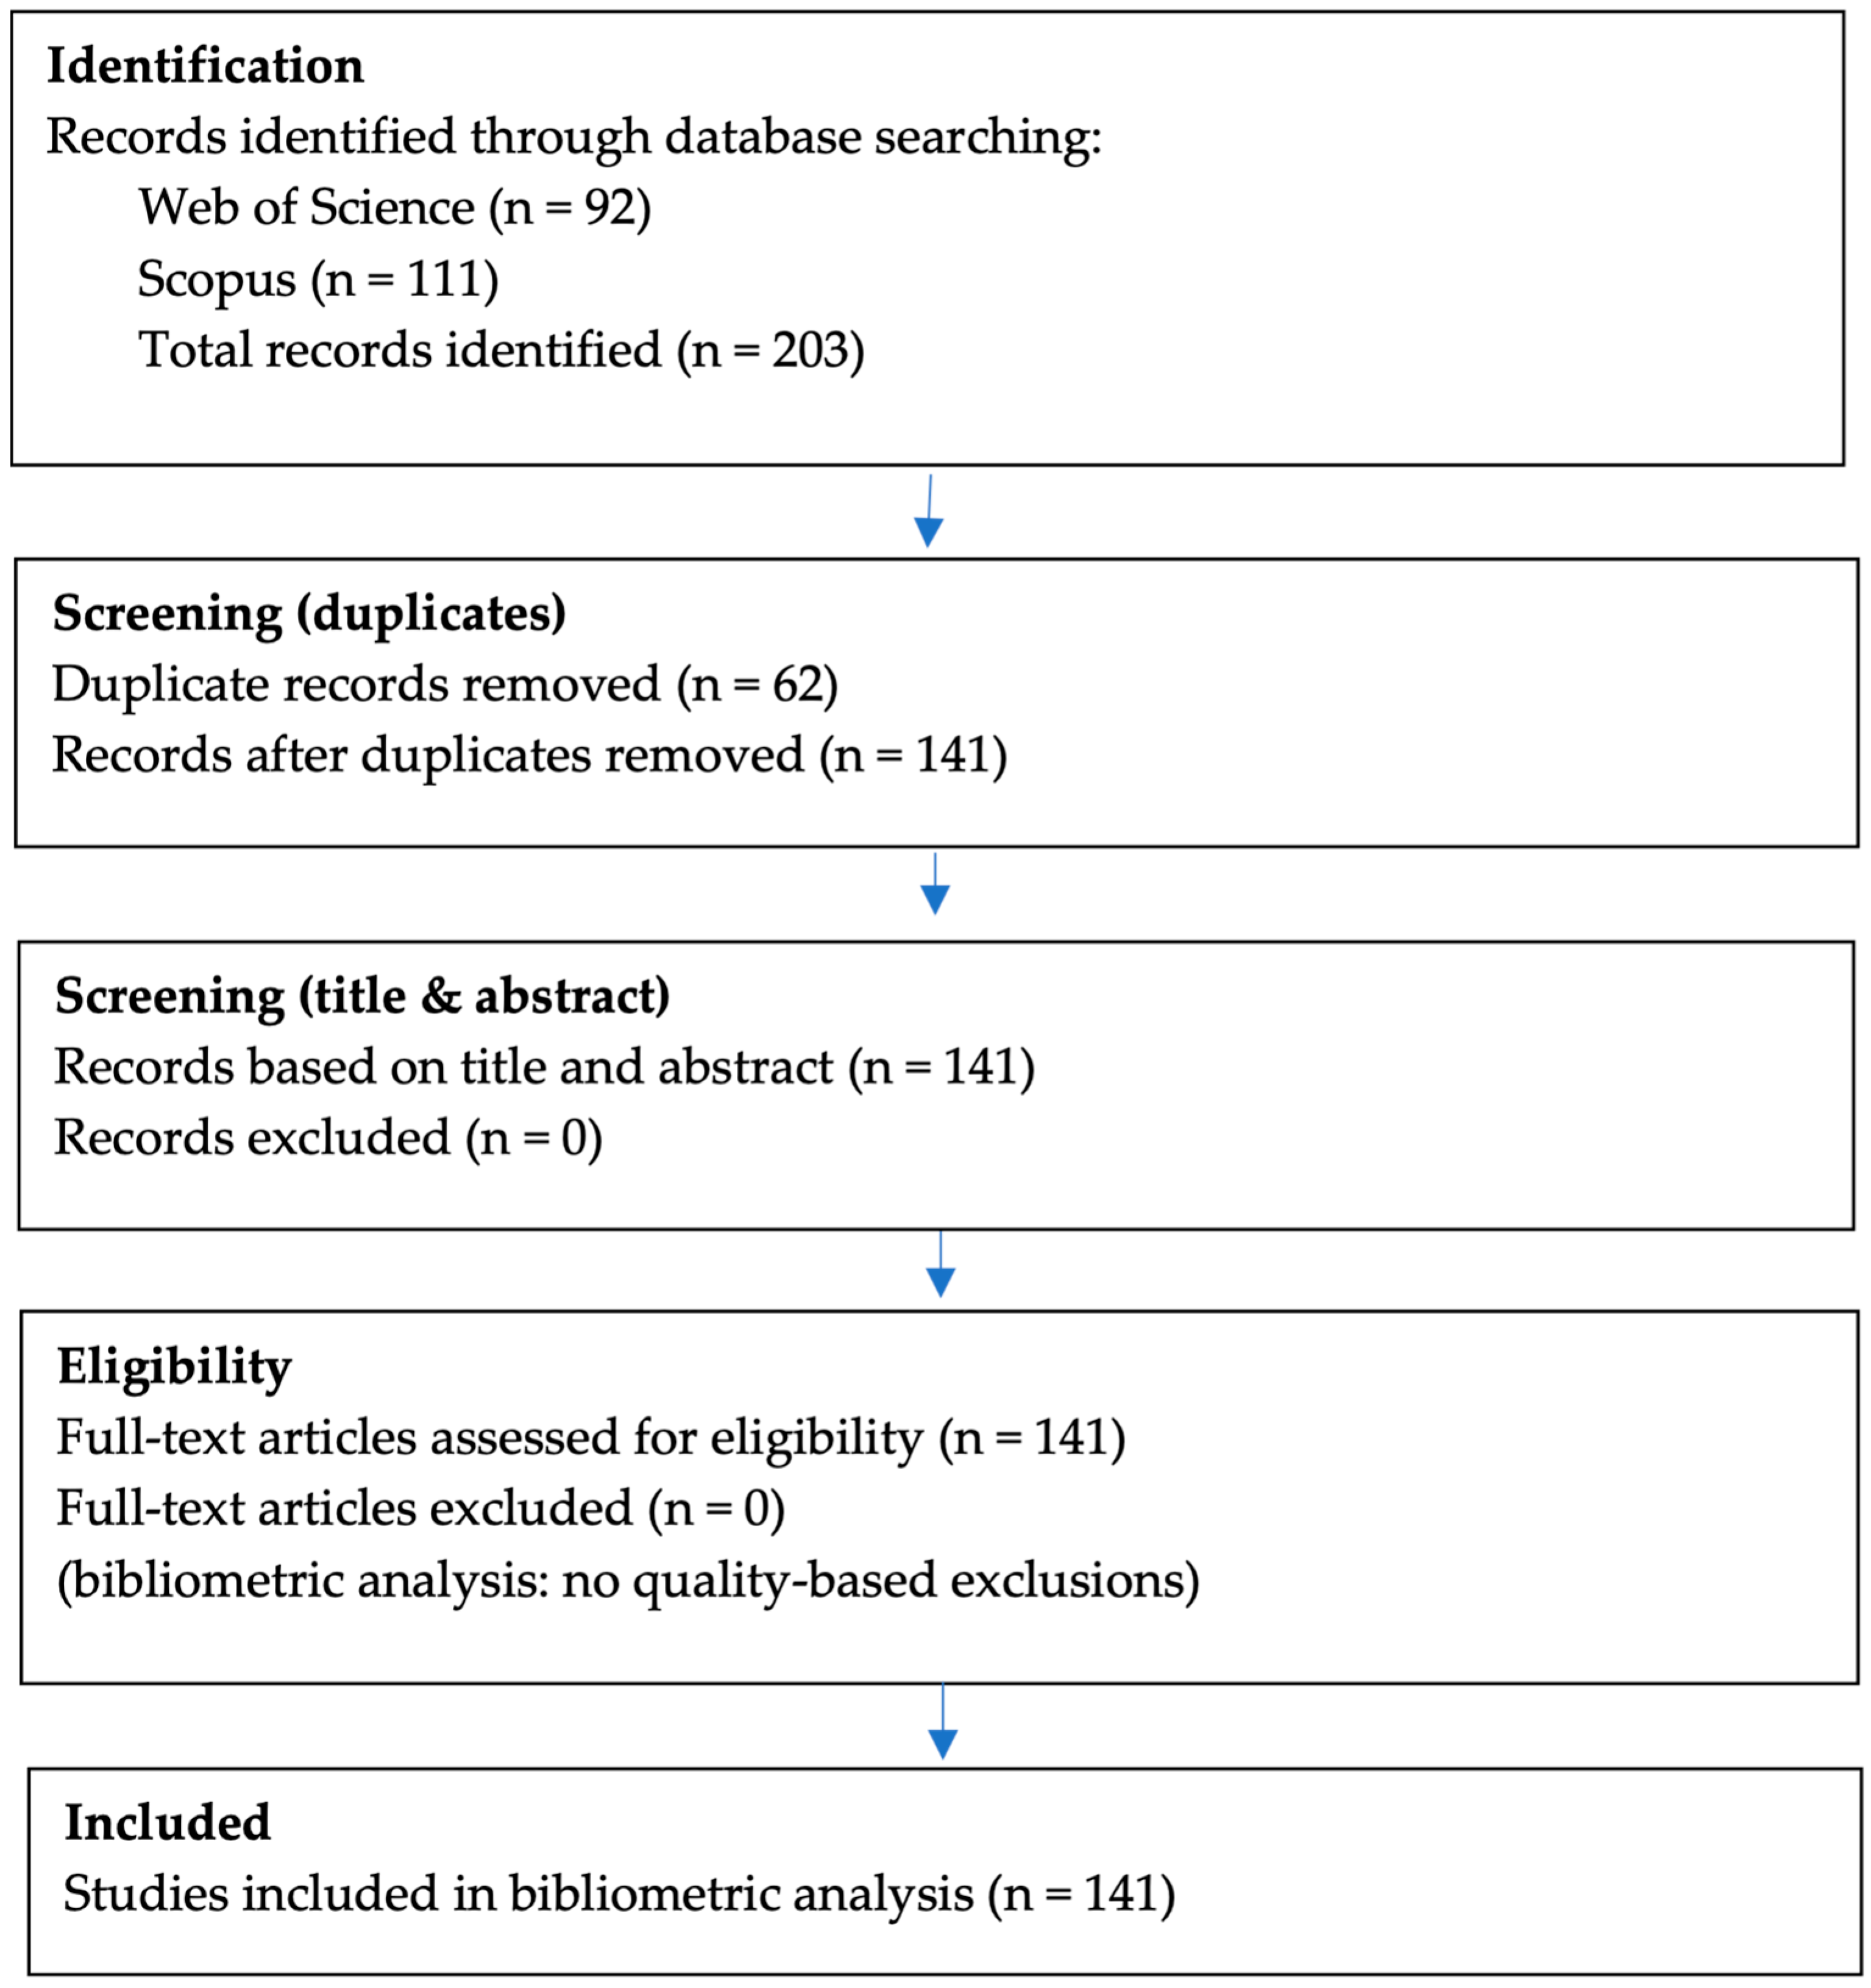
Figure 1. PRISMA Flow Diagram.
Sustainability 18 00666 g001
Figure 2. Map of words used in abstracts from Scopus and Web of Science databases. Authors’ elaboration using the WoS and Scopus databases and the Bibliometrix program.
Sustainability 18 00666 g002
Figure 3. Relationships between phrases in the article abstracts examined in the WoS and Scopus databases. Authors’ elaboration using the WoS and Scopus databases and the Bibliometrix program.
Sustainability 18 00666 g003
Figure 4. Clusters of phrases used in article abstracts examined in the WoS and Scopus databases. Authors’ elaboration using the WoS and Scopus databases and the Bibliometrix program.
Sustainability 18 00666 g004
Figure 5. Statistics on articles for “phygital consumers” in WoS and Scopus databases in 2015–2024. Authors’ elaboration using the WoS and Scopus databases and the Bibliometrix program.
Sustainability 18 00666 g005
Figure 6. Summary of model and cluster quality in the two-step cluster.
Sustainability 18 00666 g006
Figure 7. Clusters’ description regarding positive and negative emotions caused by physical tools.
Sustainability 18 00666 g007
Figure 8. Clusters’ description regarding positive and negative emotions caused by digital tools.
Sustainability 18 00666 g008
Figure 9. Clusters’ description regarding positive and negative emotions caused by phygital tools.
Sustainability 18 00666 g009
Table 1. The research sample characteristics by age and gender (in %, n = 2160).
SpecificationGeneration
Z
(2001–2007)
Y
(1986–2000)
X
(1966–1985)
BB+
(1965 and Older)
Total
Females6.313.318.515.153.2
Males4.310.718.113.746.8
Total10.624.036.728.7100.0
Table 2. The research sample characteristics by respondents’ place of residence and level of education (in %, n = 2160).
Specification%
Please of residenceRural38.0
Small-sized city (up to 20 K)12.8
Medium-sized city (20–99 K)20.6
Large—sized city (100–500 K)16.3
Major city (over 500 K)12.3
EducationPrimary and basic vocational12.7
Secondary42.5
Higher44.8
Subjective assessment of the financial situation of one’s householdVery difficult2.0
Difficult8.8
Average36.4
Good39.1
Very good13.7
Number of persons in the household1 person14.5
2 persons36.3
3 persons21.5
4 persons18.3
5 or more persons9.4
Economic activitySecular work60.9
No secular work39.1
Table 3. Clusters’ description regarding positive and negative emotions caused by physical, digital and phygital tools.
TotalClusterCluster
123123
nnnn1038434688
Question 10. How would you describe situations when you rely solely on physical solutions when making a purchase or using services? Please assess whether it is:
r.1. Enjoyable180179134266876.2%78.8%97.1%
r.2. Exciting124530030663928.9%70.5%92.9%
r.3. Amazing907672695716.5%62.0%83.0%
r.4. Handy189687634467684.4%79.3%98.3%
r.5. Easy to use186386033466982.9%77.0%97.2%
r.6. Fast155362731461260.4%72.4%89.0%
r.7. Empowering95613727554413.2%63.4%79.1%
r.8. Sophisticated738592484315.7%57.1%62.6%
r.9. Annoying5552512178724.2%50.0%12.6%
r.10. Alienating28436191573.5%44.0%8.3%
r.11. Disturbing27343204264.1%47.0%3.8%
r.12. Scary1862116052.0%36.9%0.7%
r.13. Surveilling36461211925.9%48.6%13.4%
r.14. Useless2113317173.2%39.4%1.0%
r.15. Not easy to use30074204227.1%47.0%3.2%
r.16. Slow61929122710128.0%52.3%14.7%
Question 11. How would you describe situations when you rely solely on digital solutions when making a purchase or using services? Please assess whether it is:
r.1. Enjoyable179985127567382.0%63.4%97.8%
r.2. Exciting122631825365530.6%58.3%95.2%
r.3. Amazing9431002316129.6%53.2%89.0%
r.4. Handy190292030068288.6%69.1%99.1%
r.5. Easy to use190193827968490.4%64.3%99.4%
r.6. Fast190793429767690.0%68.4%98.3%
r.7. Empowering104921524558920.7%56.5%85.6%
r.8. Sophisticated713632204306.1%50.7%62.5%
r.9. Annoying29846227254.4%52.3%3.6%
r.10. Alienating30347211454.5%48.6%6.5%
r.11. Disturbing29946231224.4%53.2%3.2%
r.12. Scary187018520.0%42.6%0.3%
r.13. Surveillant35368215706.6%49.5%10.2%
r.14. Useless174516720.5%38.5%0.3%
r.15. Not easy to use27742217184.0%50.0%2.6%
r.16. Slow26243198214.1%45.6%3.1%
Question 12. How would you describe situations when you rely simultaneously on digital and physical solutions when making a purchase or using services? Please assess whether it is:
r.1. Enjoyable185584732168781.6%74.0%99,9%
r.2. Exciting123626628468625.6%65.4%99.7%
r.3. Amazing1021912786528.8%64.1%94.8%
r.4. Handy188187232668384.0%75.1%99.3%
r.5. Easy to use185287529668184.3%68.2%99.0%
r.6. Fast173977829466775.0%67.7%96.9%
r.7. Empowering100113427759012.9%63.8%85.8%
r.8. Sophisticated703382364293.7%54.4%62.4%
r.9. Annoying31855231325.3%53.2%4.7%
r.10. Alienating2215199170.5%45.9%2.5%
r.11. Disturbing23917207151.6%47.7%2.2%
r.12. Scary176417020.4%39.2%0.3%
r.13. Surveillant33361217555.9%50.0%8.0%
r.14. Useless1951317571.3%40.3%1.0%
r.15. Not easy to use26743212124.1%48.8%1.7%
r.16. Slow34995225299.2%51.8%4.2%
Table 4. Characteristics of the phygital consumer types by the psychographic criterion, as emotions revealed to analog, digital, and phygital solutions.
TypeDescriptionPurchase CategoriesBenefits and Drawbacks of Phygital SolutionsOpinions on Enterprises’ Attitudes
Solution
skeptic
They are slightly more often women (51.6%); representatives of older generations (X and BB); more often residents of larger cities than in other types; have a higher education level, less frequently secondary; and are more professionally active than other types.They are reluctant to adopt phygital solutions in the cases of food, household chemicals, medicines, and services, including catering, medical, educational, and those related to physical activity. Rarely is this also the case with transportation and cultural services.They rarely mention the advantages of making the purchase more appealing, increasing customer involvement in the shopping process, or reducing the need for staff contact. Instead, they highlight that phygital solutions simplify the purchase process, reduce the time spent in-store, make payments easier, and offer opportunities to customize offers and information better to meet customers’ needs. They are less likely than others to acknowledge the limitations of phygital solutions, which include concerns about payment security, overreach in data collection, and privacy fears.Businesses are implementing these solutions to speed up the purchasing process. They also want to gain more information about customers and provide them with as much information about the product as possible.
Cautious
explorer
There are both women and men, who are younger than other groups, residents of small cities, less educated, and more often professionally inactive.They are moderately willing to use phygital solutions. They mostly rely on these solutions when purchasing RTV and household appliances, as well as tourist, cultural, and cosmetic services, clothing, and footwear.They point to a reduction in the time spent in a retail outlet, a more straightforward purchasing process, or a better alignment of the offer and information with customers’ needs, less often than others. They are moderately optimistic about the benefits these solutions offer. They are concerned that in certain situations, these solutions might lead to an increase in the time spent in a retail outlet and will require specialized skills. They see the increased distance between the seller and the customer as a limitation. Although they recognize a threat to payment security as a limitation, they do so less frequently than with other types of limitations. Another limitation is the small number of phygital solutions.They are less likely than others to indicate that phygital solutions are introduced to facilitate and speed up the purchasing process. They are aware that phygital tools help companies obtain information about customers. However, this is less of a problem for them than for other types of consumers.
Tool
enthusiast
They are more often women (57.3%); most often Millennials and Generation X; residents of small and medium-sized cities; usually have a secondary education; and are professionally active.They are keen to use phygital solutions when buying consumer electronics, household appliances, clothing and footwear, cosmetics, tourist services, household chemicals, and transport and cultural services. They are most keen on phygital solutions.They frequently recognize most of the benefits of phygital tools compared to other types of tools. They especially emphasize the simplification of the purchase process, including payment, along with enhanced personalization, reduced time spent in retail stores, and faster access to other customers’ opinions. However, they often cite limitations such as concerns about transaction risks or the need for a smartphone. This makes them the most aware type of phygital consumer.It definitely speeds up and streamlines the purchasing process, providing customers with valuable information. Companies view phygital solutions as both a form of entertainment and a means to engage customers and involve them in co-creating the offer, thereby enhancing consumer satisfaction.
Disclaimer/Publisher’s Note: The statements, opinions and data contained in all publications are solely those of the individual author(s) and contributor(s) and not of MDPI and/or the editor(s). MDPI and/or the editor(s) disclaim responsibility for any injury to people or property resulting from any ideas, methods, instructions or products referred to in the content.