A Study on the Impact of Dual Pilot Smart Cities and Innovative Cities on City Resilience


Abstract
1. Introduction
2. Policy Context and Theoretical Assumptions
2.1. Policy Context
2.2. The Direct Impact of “Dual Pilot” Cities on City Resilience
2.3. The Indirect Impact of “Dual Pilot” Construction on City Resilience
2.4. The Spatial Spillover Effect of “Double Pilot” Construction on City Resilience
3. Research Design
3.1. Methods
Difference-in-Differences (DID) Model
3.2. Variable Description
3.2.1. Dependent Variable: City Resilience
3.2.2. Core Explanatory Variable
3.2.3. Control Variables
3.2.4. Mechanism Variables
3.3. Data Sources
4. Results and Analysis
4.1. Baseline Regression
4.2. Robustness Test
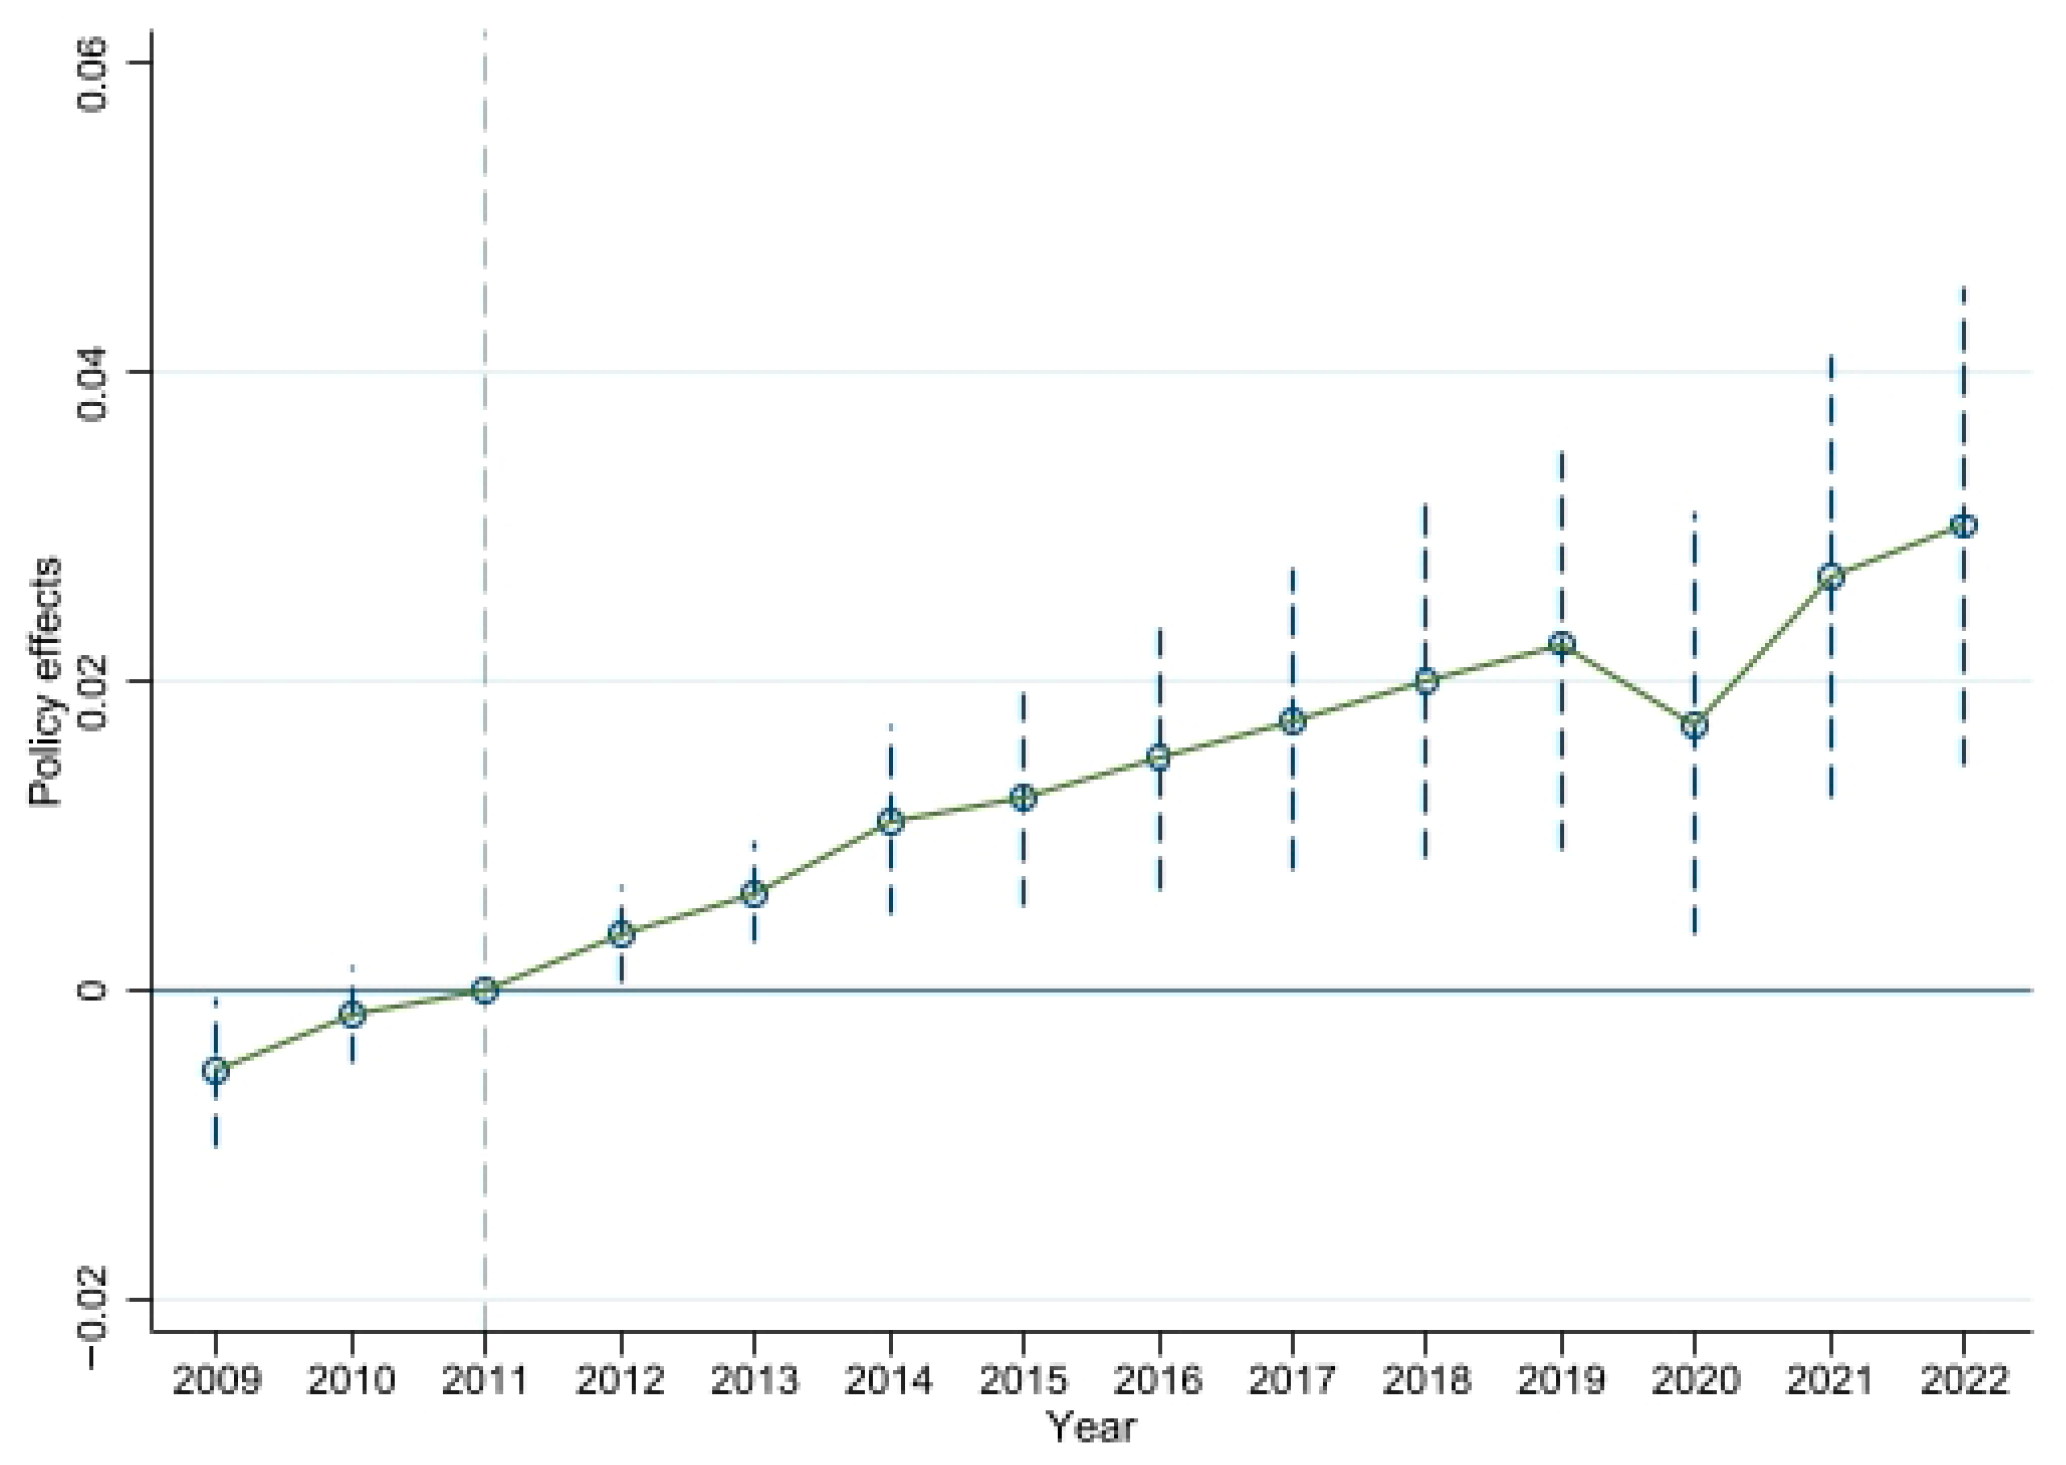
4.2.1. Parallel Trend Test
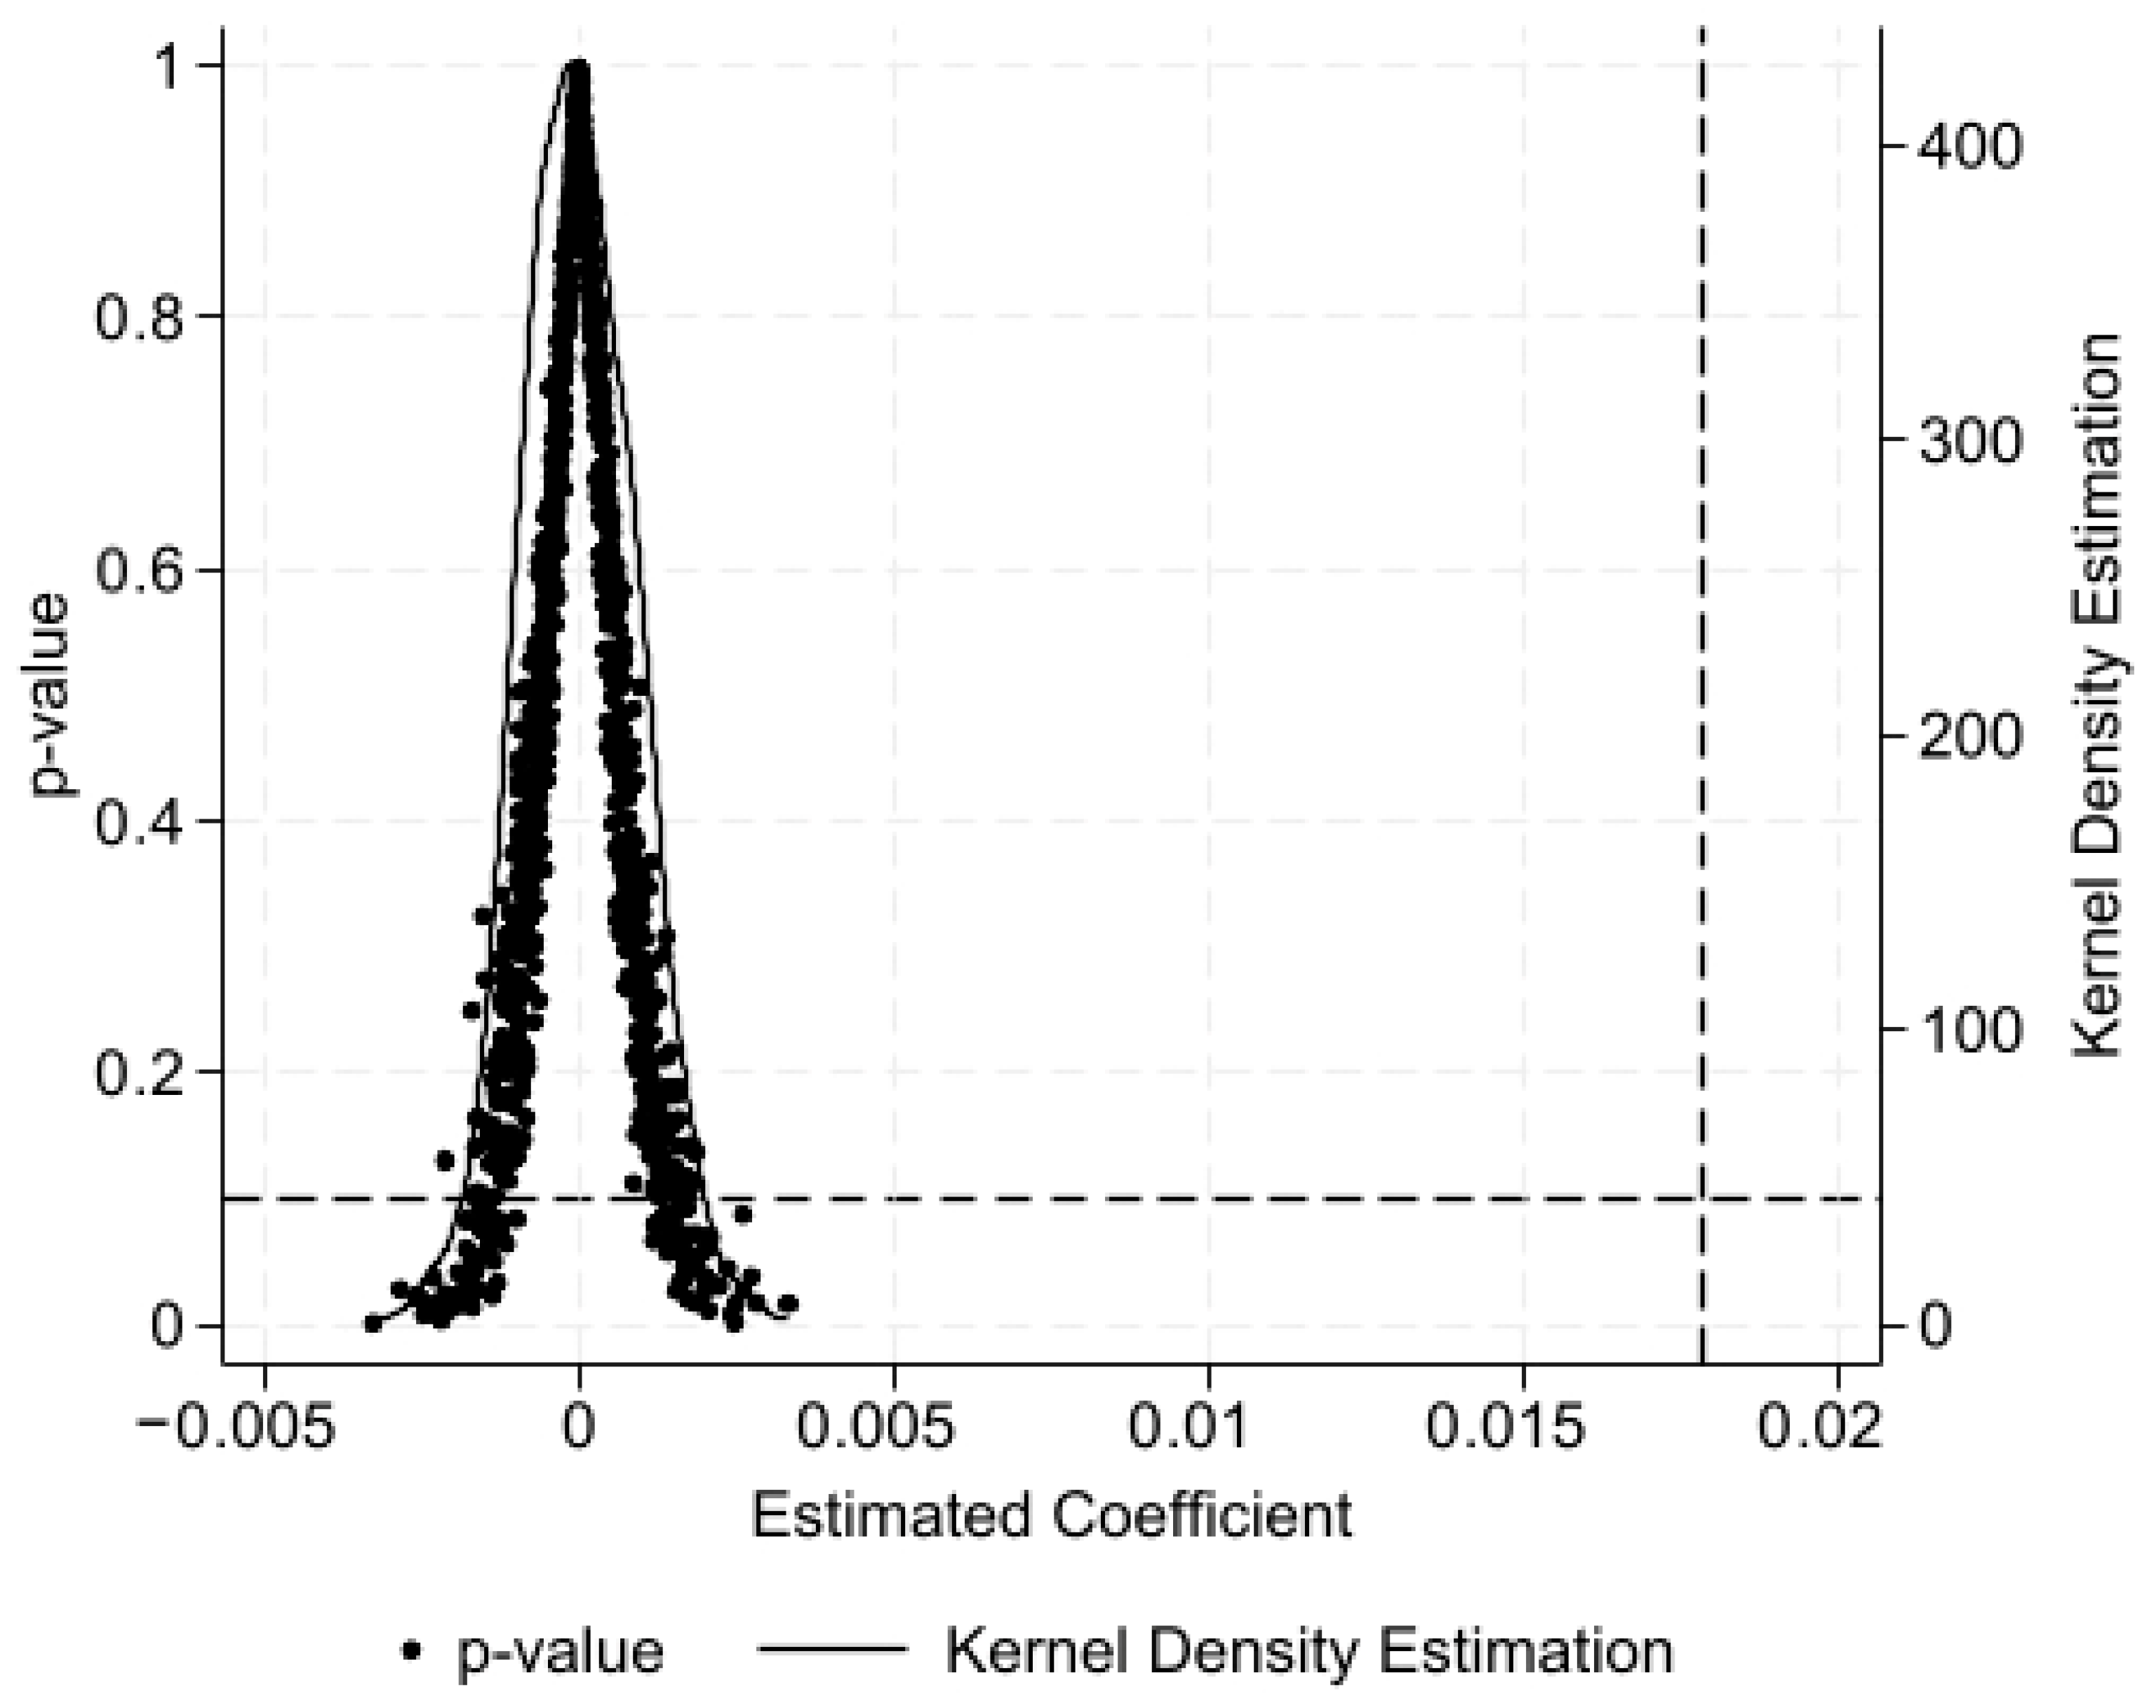
4.2.2. City Placebo Test
4.2.3. Time Placebo Test
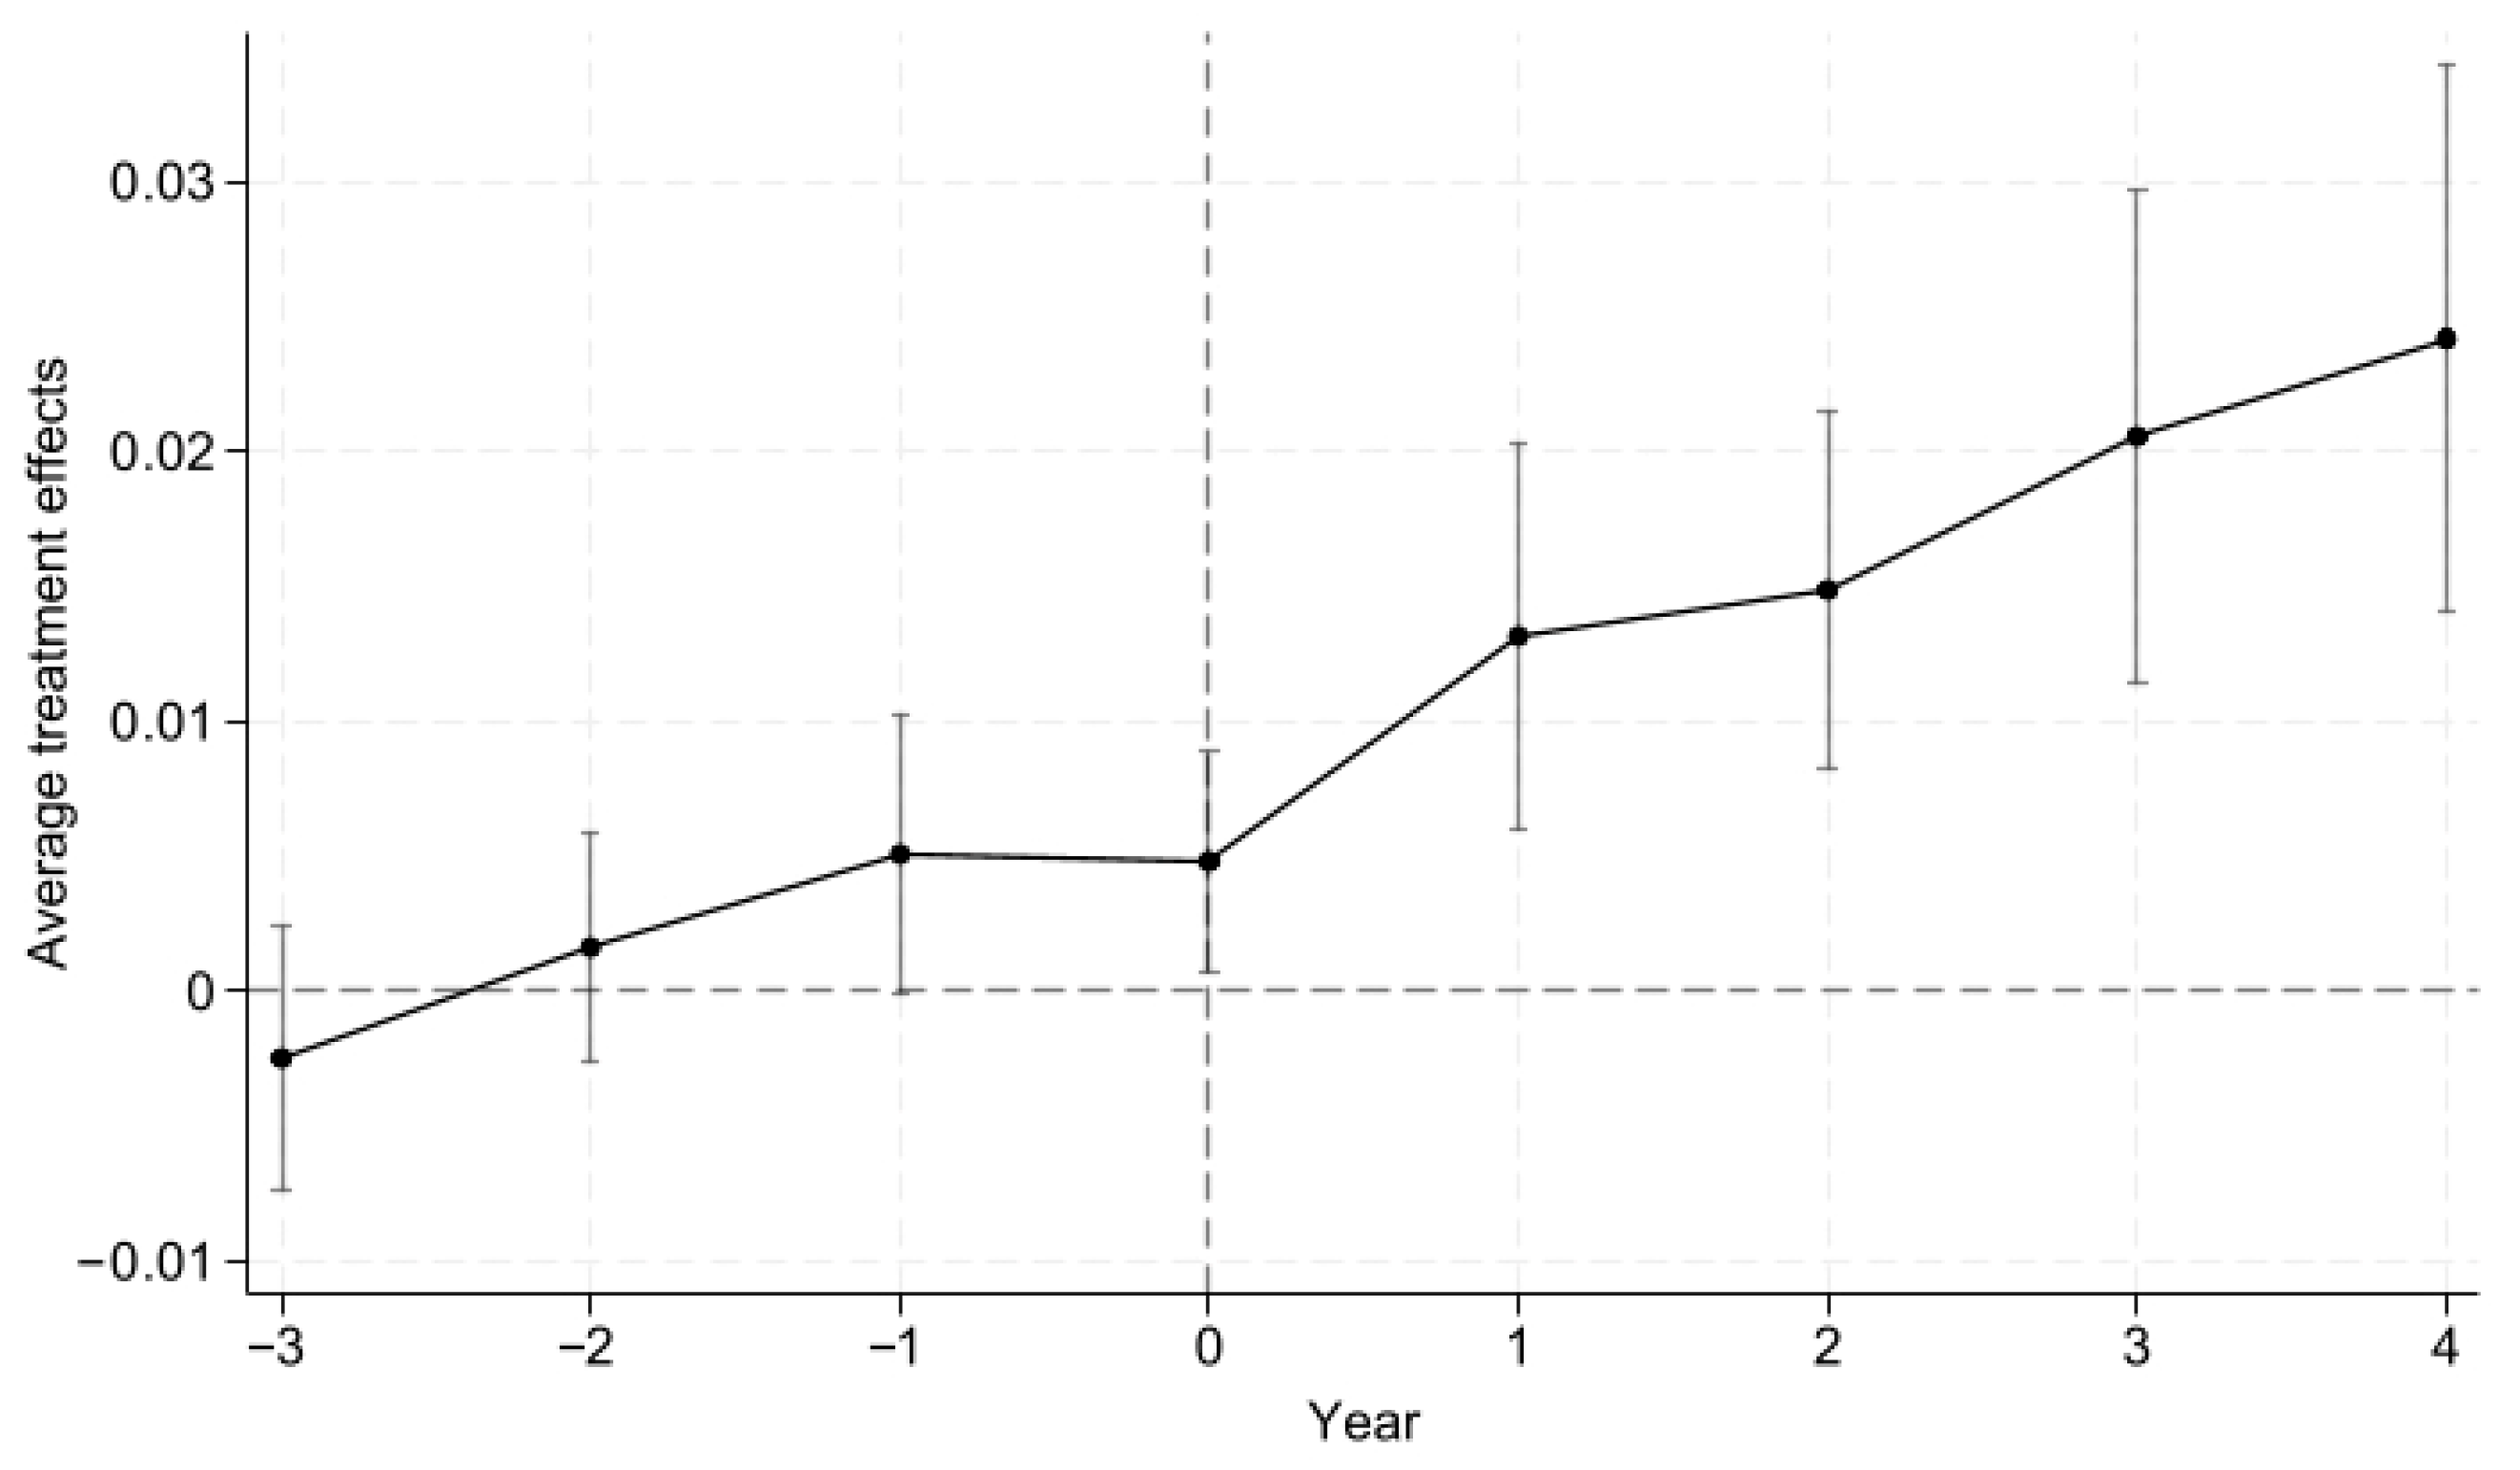
4.2.4. Staggered DID
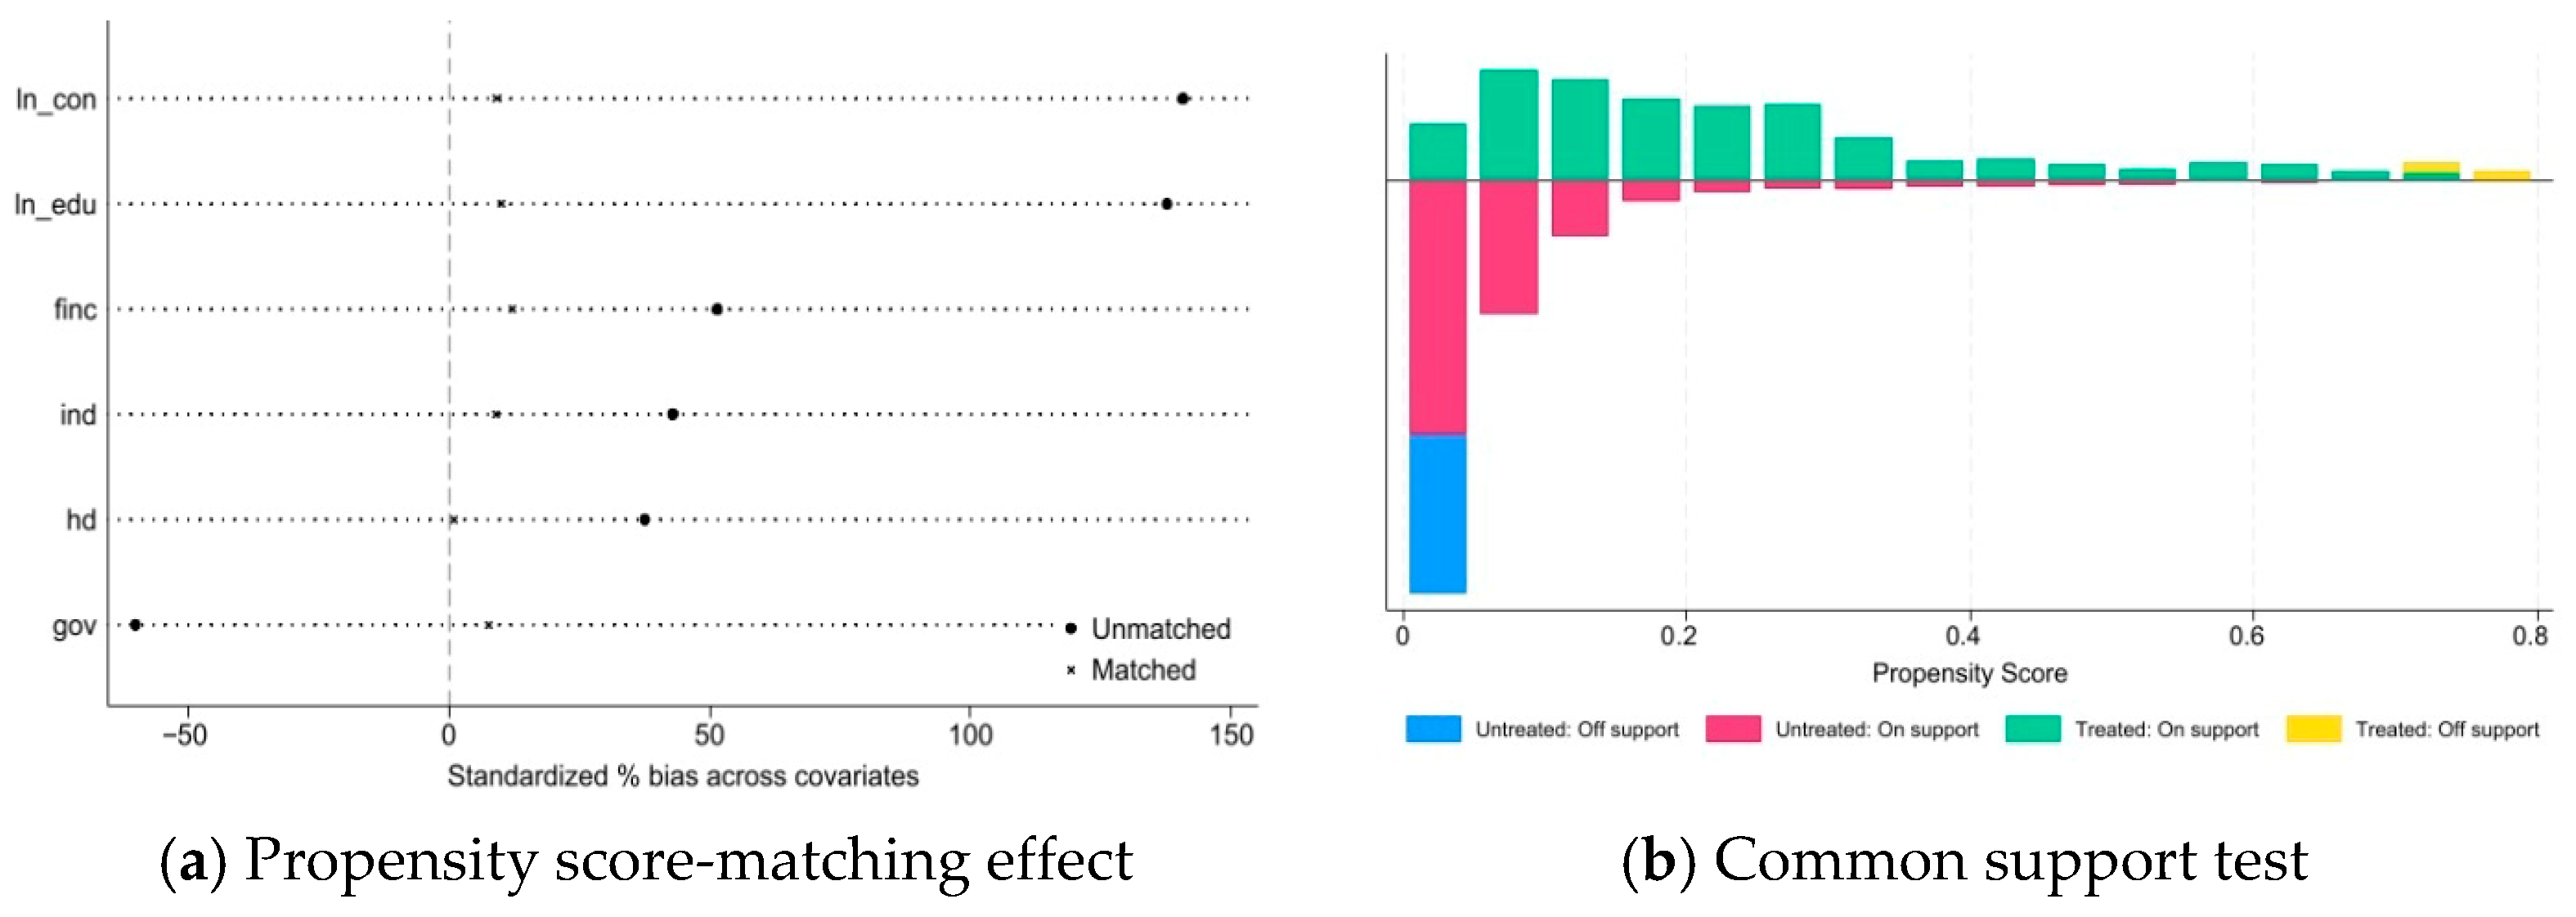
4.2.5. PSM-DID
4.2.6. Tailing Processing
4.2.7. The Replacement of the Explained Variable
4.2.8. Eliminate Other Policy Interferences
4.2.9. Endogenous Test: Instrumental Variable Method
4.3. Further Discussion
5. Impact Mechanism and Heterogeneity Test
5.1. Impact Mechanism Analysis
5.2. Heterogeneity Test
5.2.1. Urban Grade Heterogeneity
5.2.2. Geographical Regional Heterogeneity
5.2.3. Resource Endowment Heterogeneity
6. Spatial Spillover Effect
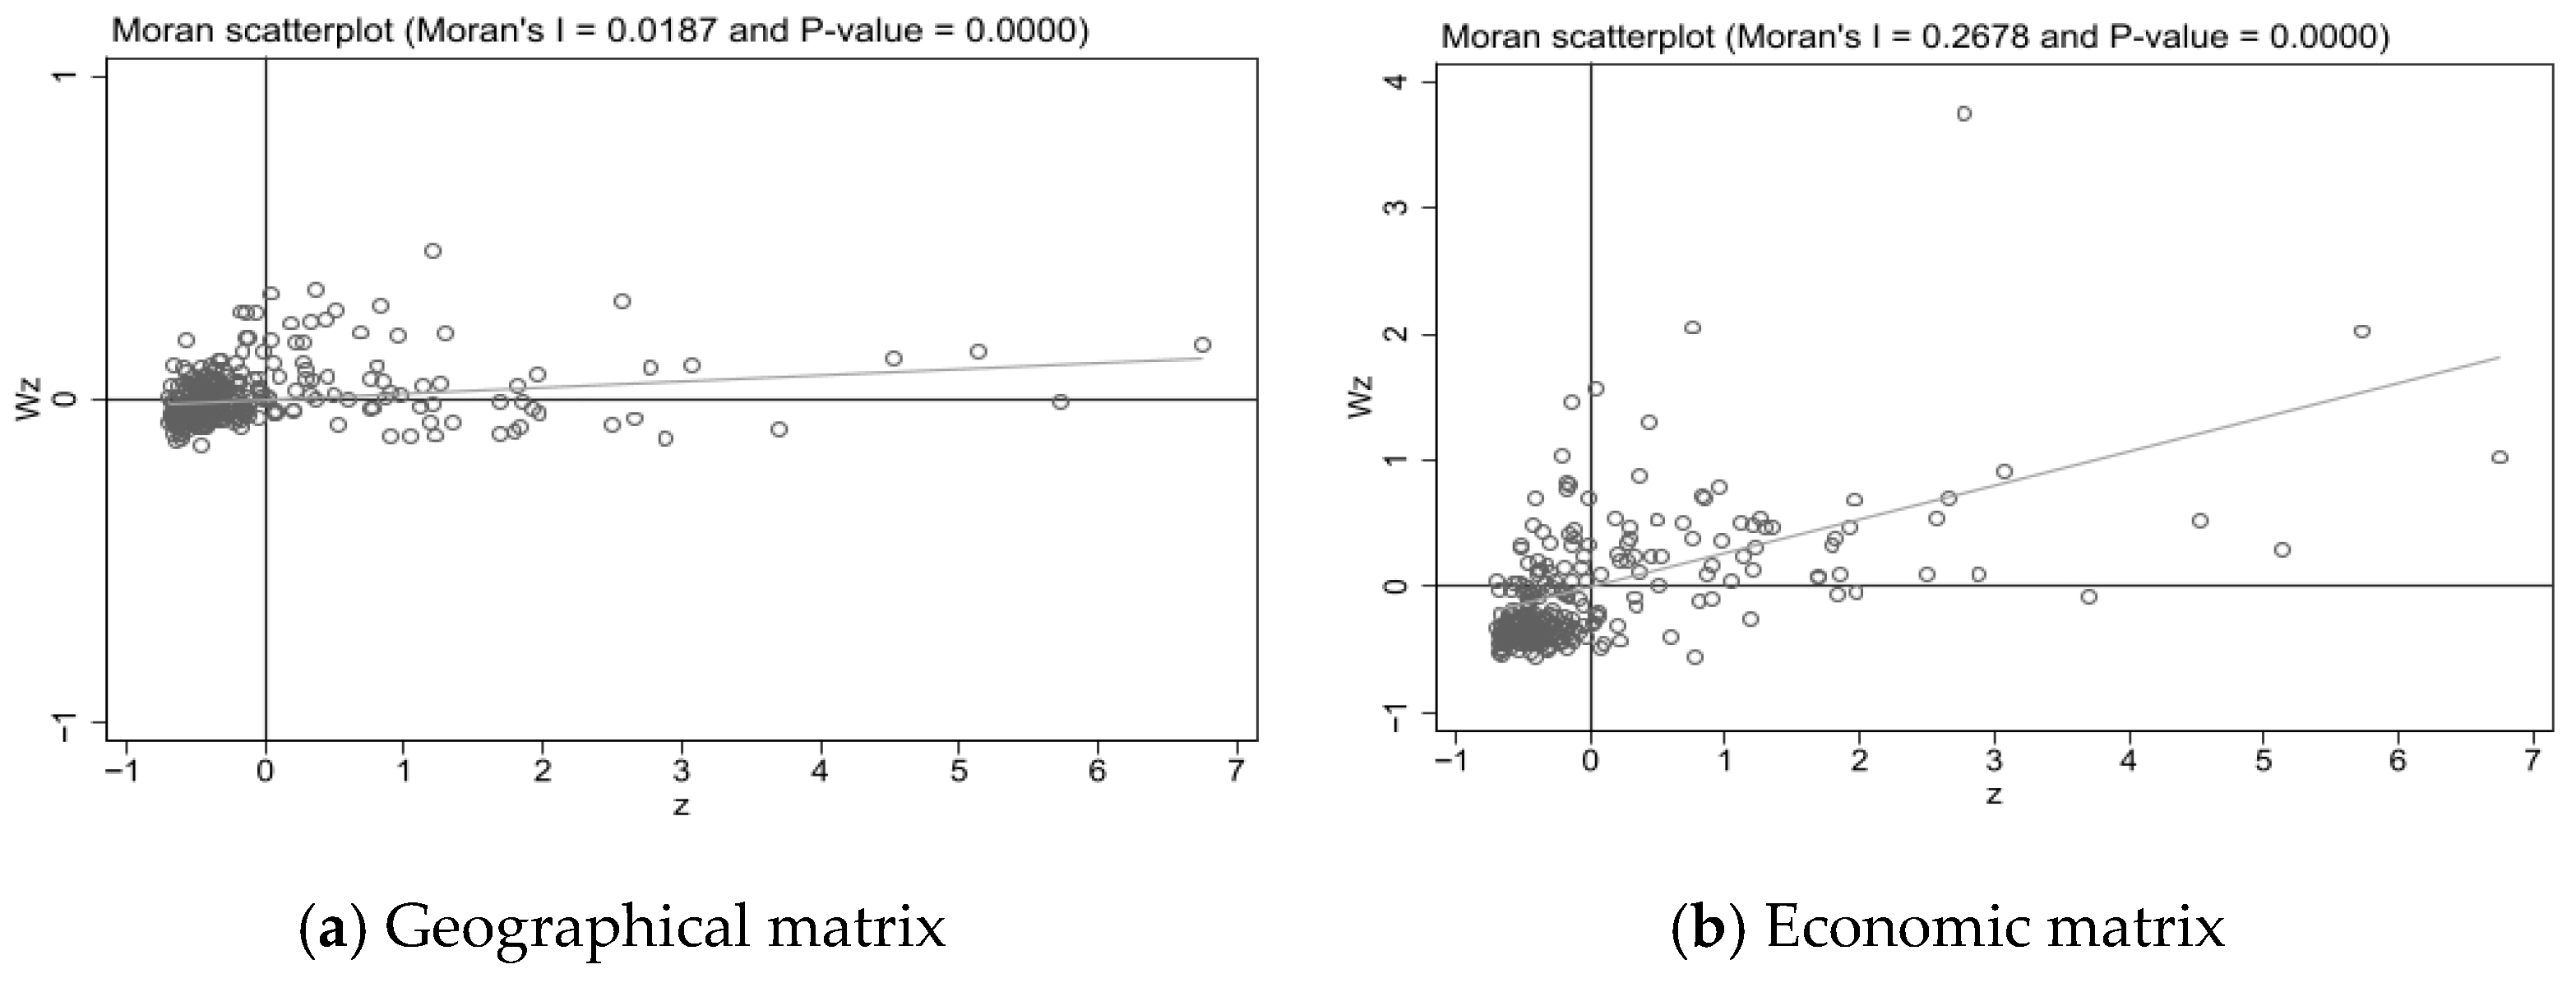
6.1. Global Moran’s Index
6.2. Model Selection
6.3. Spatial Spillover Analysis
7. Conclusions and Policy Recommendations
7.1. Conclusions
- (1)
- “Dual pilot” cities can promote the rapid improvement of city resilience. These findings are still valid after various robustness tests (parallel trend test, placebo test, staggered DID, PSM-DID, Winsorization, replacement of explained variables, exclusion of other policy interferences).
- (2)
- “Dual pilot” cities have a synergistic effect on city resilience, and the policy effect of the “dual pilot” is significantly better than that of the “single pilot”. In addition, the policy effect of “dual pilot” cities is affected by the order of the policy implementation. Specifically, establishing smart cities before innovative cities is more conducive to improving city resilience.
- (3)
- Through the mediating effect test, it is found that the “dual pilot” cities enhance city resilience by improving innovation and development levels and industrial structure upgrading.
- (4)
- A heterogeneity analysis found that the policy effect of “dual pilot” cities is better in general, non-resource-dependent, eastern, central, and western cities. The “dual pilot” cities have positive spatial spillover effects on city resilience.
7.2. Policy Recommendations and Limitations
- (1)
- We must accelerate digital infrastructure development in the “dual pilot” cities and achieve the greatest complementary advantages through the coordinated development of digital policies and innovation policies. First, we should focus on the policy linkage effect between digital infrastructure construction and “dual pilot” cities and explore the synergistic effect between different policies to realize the synergistic development of China’s city resilience on the basis of digital integration and innovation. Second, the implementation plan and sequence of the “dual pilot” policy should be rationally planned to fully contribute to the synergistically empowering effects of multiple policies. And we should fully consider the relevance and coordination of various policies to avoid policy conflicts and resource waste, thereby optimizing policy performance as much as possible.
- (2)
- We should emphasize the role of the “dual pilot” city in boosting innovative development and industrial structure upgrading. For one thing, the local government fully considers the driving force created by the integration of the digital and physical. We should also empower the real economy through digital technology to break the traditional market boundaries, to expand the market size, to stimulate new economic developments, to promote market prosperity, and to lay a solid economic foundation for improving city resilience. In addition, we should focus on enhancing the independent innovation capability of enterprises and guide innovative elements such as talent, capital, and technology in high-tech industries, so as to realize the optimal allocation of talents. It isa also necessary to fully integrate the industrial chain and external innovation elements, increase the basic research on digital technology, and use digital technology to crack the innovation bottleneck in the industrial chain, comprehensively enhancing the support capacity of science and technology innovation for resilient cities.
- (3)
- We should promote smart cities and innovative cities according to local conditions and needs. First, the implementation of the “Northeast Revitalization” strategy should be further pursued to promote the modernization and transformation of traditional industries in the northeast and continuously improve the level of their infrastructure, thereby creating a favorable environment. Secondly, the “late development advantages” of the central and western regions and general cities still need to be explored, so pilot policies can focus on selecting cities with characteristic industries or comparative advantages to promote coordinated development between regions in the future. Finally, the innovation environment and digital construction of non-resource-dependent cities should be further optimized to strengthen the diversified development of their industries. Meanwhile, we should accelerate transformation, actively cultivate new industries, and gradually change resource-dependent development paths in resource-dependent cities.
- (4)
- We should maximize the effects of pilot cities and boost the coordinated regional development of “dual pilot” construction. Taking city clusters and metropolitan areas as units, we should accelerate the exploration and formation of inter-city consultative mechanisms to enhance city resilience, encourage the exchange of experience and technology transfer between cities, and popularize the successful experiences of advanced cities to enhance the level of city resilience in the entire region.
Author Contributions
Funding
Institutional Review Board Statement
Informed Consent Statement
Data Availability Statement
Conflicts of Interest
References
- Martin, R.; Sunley, P.; Gardiner, B.; Tyler, P. How Regions React to Recessions: Resilience and the Role of Economic Structure. Reg. Stud. 2016, 50, 561–585. [Google Scholar] [CrossRef] [Scilit]
- Pelling, M.; Chow, W.T.L.; Chu, E.; Dawson, R.; Dodman, D.; Fraser, A.; Hayward, B.; Khirfan, L.; McPhearson, T.; Prakash, A.; et al. A climate resilience research renewal agenda: Learning lessons from the COVID-19 pandemic for urban climate resilience. Clim. Dev. 2022, 14, 617–624. [Google Scholar] [CrossRef] [Scilit]
- Joerin, J.; Shaw, R.; Takeuchi, Y.; Krishnamurthy, R. Action-oriented resilience assessment of communities in Chennai, India. Environ. Hazards 2012, 11, 226–241. [Google Scholar] [CrossRef] [Scilit]
- Jabareen, Y. Planning the resilient city: Concepts and strategies for coping with climate change and environmental risk. Cities 2013, 31, 220–229. [Google Scholar] [CrossRef] [Scilit]
- Datola, G. Implementing urban resilience in urban planning: A comprehensive framework for urban resilience evaluation. Sustain. Cities Soc. 2023, 98, 104821. [Google Scholar] [CrossRef] [Scilit]
- Klein, R.J.T.; Nicholls, R.J.; Thomalla, F. Resilience to natural hazards: How useful is this concept? Glob. Environ. Change Part B Environ. Hazards 2003, 5, 35–45. [Google Scholar] [CrossRef]
- Yang, Q.; Yang, D.; Li, P.; Liang, S.; Zhang, Z. Resilient city: A Bibliometric analysis and visualization. Discret. Dyn. Nat. Soc. 2021, 2021, 5558497. [Google Scholar] [CrossRef] [Scilit]
- Holling, C.S. Resilience and stability of ecological systems. Annu. Rev. Ecol. Syst. 1973, 4, 1–23. [Google Scholar] [CrossRef] [Scilit]
- Song, Q.; Zhong, S.; Chen, J.; Yang, C.; Zhu, Y. Spatio-Temporal Evolution of City Resilience in the Yangtze River Delta, China, from the Perspective of Statistics. Sustainability 2023, 15, 1538. [Google Scholar] [CrossRef] [Scilit]
- Ma, F.; Wang, Z.; Sun, Q.; Yuen, K.F.; Zhang, Y.; Xue, H. Spatial–Temporal evolution of urban resilience and its influencing factors: Evidence from the Guanzhong Plain Urban Agglomeration. Sustainability 2020, 12, 2593. [Google Scholar] [CrossRef] [Scilit]
- Fastenrath, S.; Coenen, L. Future-proof cities through governance experiments? Insights from the Resilient Melbourne Strategy (RMS). Reg. Stud. 2021, 55, 138–149. [Google Scholar] [CrossRef] [Scilit]
- Cho, M.R. Urban resilience through progressive governance: The case of the’One Less Nuclear Power Plant’ policy, Seoul, Korea. Urban Stud. 2020, 57, 1434–1451. [Google Scholar] [CrossRef] [Scilit]
- Gornitz, V.; Oppenheimer, M.; Kopp, R.; Horton, R.; Orton, P.; Rosenzweig, C.; Solecki, W.; Patrick, L. Enhancing New York City’s resilience to sea level rise and increased coastal flooding. Urban Clim. 2020, 33, 100654. [Google Scholar] [CrossRef] [Scilit]
- Fu, L.; Han, X.; Peng, J. The impact of innovation-driven policies on urban resilience. Humanit. Soc. Sci. Commun. 2025, 12, 484. [Google Scholar] [CrossRef] [Scilit]
- Yang, J.; Xiong, G.; Shi, D. Innovation and sustainable: Can innovative city improve energy efficiency? Sustain. Cities Soc. 2022, 80, 103761. [Google Scholar] [CrossRef] [Scilit]
- Jiang, L.; Ye, X.; Zhang, K. Dynamic interaction and evolution analysis of the resource-environment-economy-society complex system in China under the advancement of smart cities. Renew. Energy 2025, 244, 122704. [Google Scholar] [CrossRef] [Scilit]
- Gong, D.; Shan, X. How Does Smart City Construction Affect Urban–Rural Collaborative Development? A Quasi-Natural Experiment from Chinese Cities. Land 2023, 12, 1571. [Google Scholar] [CrossRef] [Scilit]
- Ji, X.; Chen, J.; Zhang, H. Smart city construction empowers tourism: Mechanism analysis and spatial spillover effects. Humanit. Soc. Sci. Commun. 2024, 11, 1210. [Google Scholar] [CrossRef] [Scilit]
- Cai, M.; Decaminada, T.; Li, Y.; Durst, J.N.; Kassens, E.; Wilson, M. Linking smart cities and SDGs through descriptive analysis of US municipalities. Nat. Cities 2025, 2, 144–148. [Google Scholar] [CrossRef] [Scilit]
- Zhou, F.; Deng, N.; Wu, D. Does money buy innovation? The effect of the “Innovative City” pilot on firm innovation in China. Financ. Res. Lett. 2024, 70, 106327. [Google Scholar]
- Xu, H.; Li, Z.; Guo, L.; Liu, Y. The Impact of Innovative City Pilot Policy on Urban Land Green Use Efficiency: A Quasi-Natural Experiment from China. Land 2025, 14, 168. [Google Scholar] [CrossRef] [Scilit]
- Yang, S.; Atif, J.; Hossain, M.R.; Wang, Y.; Balsalobre-Lorente, D. Enhancing export product quality through innovative cities: A firm-level quasi-natural experiment in China. Econ. Anal. Policy 2023, 79, 462–478. [Google Scholar] [CrossRef] [Scilit]
- Liu, B.; Li, Y.; Liu, J.; Hou, Y. Does urban innovation policy accelerate the digital transformation of enterprises? Evidence based on the innovative City pilot policy. China Econ. Rev. 2024, 85, 102167. [Google Scholar] [CrossRef] [Scilit]
- Li, Y.; Zhang, J. Research on the Carbon Emission Reduction Effect of the Dual Pilot Policy of Low-Carbon Cities and New Energy Demonstration Cities. Sustainability 2024, 16, 9572. [Google Scholar] [CrossRef] [Scilit]
- Liu, Y.; Deng, W.; Wen, H.; Li, S. Promoting green technology innovation through policy synergy: Evidence from the dual pilot policy of low-carbon city and innovative city. Econ. Anal. Policy 2024, 84, 957–977. [Google Scholar] [CrossRef] [Scilit]
- Wang, W.; She, Y.; Peng, Y.; Liu, Y. Unleashing green technology innovation in agribusiness: Traditional environmental regulations, carbon trading, or synergies? Humanit Soc. Sci. Commun. 2025, 12, 116. [Google Scholar] [CrossRef] [Scilit]
- Jong, D.M.; Joss, S.; Schraven, D.; Zhan, C.; Weijnen, M. Sustainable–smart–resilient–low carbon–eco–knowledge cities; making sense of a multitude of concepts promoting sustainable urbanization. J. Clean. Prod. 2015, 109, 25–38. [Google Scholar] [CrossRef] [Scilit]
- Li, B.; Hu, R.; Yang, J. Does smart city construction affect urban renewal? Evidence from China. J. Clean. Prod. 2025, 496, 145110. [Google Scholar] [CrossRef] [Scilit]
- Wang, X.; Li, J.; Wang, X. Does the Pilot of Innovative Cities Effectively Improved the Urban Economic Resilience? Rev. Investig. Stud. 2022, 41, 120–143. [Google Scholar]
- Li, Y.; Zhang, J.; Yang, X.; Wang, W.; Wu, H. The impact of innovative city construction on ecological efficiency: A quasi-natural experiment from China. Sustain. Prod. Consum. 2021, 28, 1724–1735. [Google Scholar] [CrossRef] [Scilit]
- Zameer, H.; Wang, Y.; Vasbieva, G.D.; Abbas, Q. Exploring a pathway to carbon neutrality via reinforcing environmental performance through green process innovation, environmental orientation and green competitive advantage. J. Environ. Manag. 2021, 296, 113383. [Google Scholar] [CrossRef] [Scilit]
- Bristow, G.; Healy, A. Innovation and regional economic resilience: An exploratory analysis. Ann. Reg. Sci. 2018, 60, 265–284. [Google Scholar] [CrossRef] [Scilit]
- Yu, T.; Mao, S. Does the establishment of China’s national innovation demonstration zone for sustainable development enhance urban sustainable competitiveness?-Policy effects assessment based on multi-period difference-in-differences models. J. Environ. Manag. 2024, 372, 123439. [Google Scholar] [CrossRef] [Scilit]
- Kaneko, Y.; Nakagawa, T.; Phun, K.V.; Kato, H. Impacts of Urban Railway Investment on Regional Economies: Evidence from Tokyo using Spatial Difference-in-Differences Analysis. Transp. Res. Rec. 2019, 2673, 129–140. [Google Scholar] [CrossRef] [Scilit]
- Yang, X.; Wang, W.; Wu, H.; Wang, J.; Ran, Q. The impact of the new energy demonstration city policy on the green total factor productivity of resource-based cities: Empirical evidence from a quasi-natural experiment in China. J. Environ. Plan. Manag. 2022, 66, 293–326. [Google Scholar] [CrossRef] [Scilit]
- Beck, T.; Levine, R.; Levkov, A. Big Bad Banks? The Winners and Losers from Bank Deregulation in the United States. J. Financ. 2010, 65, 1637–1667. [Google Scholar] [CrossRef] [Scilit]
- Zhang, W.; Liu, X.; Zhao, S.; Tang, T. Does green finance agglomeration improve carbon emission performance in China? A perspective of spatial spillover. Appl. Energy 2024, 358, 122561. [Google Scholar] [CrossRef] [Scilit]
- Sharma, M.; Sharma, B.; Nand, K.; Kumar, A. Establishing Conceptual Components for Urban Resilience: Taking Clues from Urbanization through a Planner’s Lens. Nat. Hazards Rev. 2023, 24, 1523. [Google Scholar] [CrossRef] [Scilit]
- Li, H.; Wang, Y.; Zhang, H.; Yin, R.; Liu, C.; Wang, Z.; Fu, F.; Zhao, J. The spatial-temporal evolution and driving mechanism of Urban resilience in the Yellow River Basin cities. J. Clean. Prod. 2024, 447, 141614. [Google Scholar] [CrossRef] [Scilit]
- Cutter, S.L.; Ash, K.D.; Emrich, C.T. The geographies of community disaster resilience. Glob. Environ. Change 2014, 29, 65–77. [Google Scholar] [CrossRef] [Scilit]
- Réka, S.; Tóth, C. Revision of Sustainable Road Rating Systems: Selection of the Best Suited System for Hungarian Road Construction Using TOPSIS Method. Sustainability 2020, 12, 8884. [Google Scholar] [CrossRef] [Scilit]
- Liu, N.; Wang, S.; Su, F.; Ye, J. Research on Coupling Coordination of China’s New-Type Urbanization and Urban Resilience—Taking Yangtze River Economic Belt as an Example. Sustainability 2022, 15, 456. [Google Scholar] [CrossRef] [Scilit]
- Zhao, R.; Fang, C.; Liu, J.; Zhang, L. The evaluation and obstacle analysis of urban resilience from the multidimensional perspective in Chinese cities. Sustain. Cities Soc. 2022, 86, 104160. [Google Scholar] [CrossRef] [Scilit]
- Wang, P.; Mao, X.; Huang, X.; Qi, X. The Evolution Characteristics of Urban Resilience in China Based on Panel Vector Autoregressive Model. Mod. Urban Res. 2023, 92–100. [Google Scholar] [CrossRef]
- Tang, D.; Li, J.; Zhao, Z.; Boamah, V.; Lansana, D.D. The influence of industrial structure transformation on urban resilience based on 110 prefecture-level cities in the Yangtze River. Sustain. Cities Soc. 2023, 96, 104621. [Google Scholar] [CrossRef] [Scilit]
- Liu, L.; Lei, Y.; Fath, B.D.; Hubacek, K.; Yao, H.; Liu, W. The spatio-temporal dynamics of urban resilience in China’s capital cities. J. Clean. Prod. 2022, 379, 134400. [Google Scholar] [CrossRef] [Scilit]
- Zheng, B.; Zhao, Y.; Lv, K. The Impact of Digital Economy on Urban Innovation and Its Mechanism—An Empirical Analysis Based on “Broadband China” and “Smart City”. Inq. Econ. Issues 2023, 11, 20–36. [Google Scholar]
- Chang, Z.; Han, F.; Zhong, L. Does the National Innovative City Pilot Policy Increase Economic Resilience—Evidence from the Quasi-natural Experiment. Econ. Probl. 2023, 4, 105–112. [Google Scholar]
- Wang, L.; Li, G. The impact of sustainable development planning on urban ecological resilience in resource-based cities: Evidence from China. Environ. Sci. Pollut. Res. 2024, 31, 12245–12256. [Google Scholar] [CrossRef] [Scilit]
- Liu, C.; Sha, X.; Zhang, Y. Staggered Difference-in- differences Method: Heterogeneous Treatment Effects and Choices of Estimation. J. Quant. Technol. Econ. 2022, 39, 177–204. [Google Scholar]
- Borusyak, K.; Jaravel, X.; Spiess, J. Revisiting Event-Study Designs: Robust and Efficient Estimation. Rev. Econ. Stud. 2024, 91, 3253–3285. [Google Scholar] [CrossRef] [Scilit]
- Wen, H.; Liu, Y.; Zhou, F. New-type infrastructure and urban economic resilience: Evidence from China. Int. Rev. Econ. Financ. 2024, 96, 103560. [Google Scholar] [CrossRef] [Scilit]
- Su, T.; Yu, Y.; Pan, J. Carbon Emission Reduction Effect of Low-carbon Cities and Innovative Cities: Based on the Synergic Perspective of Green Innovation and Industrial Upgrading. Sci. Sci. Manag. S. T. 2023, 43, 21–37. [Google Scholar]
- Lian, Y.; Wang, W.; Ye, R. Monte Carlo simulation analysis of the validity of Hausman test statistics. J. Appl. Stat. Manag. 2014, 33, 830–841. [Google Scholar]
- Arellano, M. On the testing of correlates effects with panel data. J. Econom. 1993, 59, 87–97. [Google Scholar] [CrossRef] [Scilit]



| Innovative Cities | Smart Cities | Daul Polit Cities | |
|---|---|---|---|
| 2010 | Beijing, Tianjin, Shijiazhuang, Tangshan, Qinhuangdao, Taiyuan, Shanghai, Wuxi, Changzhou, Ningbo, Wuhan, Yantai, Nanning, Chongqing, Baoji, Lanzhou, Yinchuan, Guiyang | ||
| 2011 | Hohhot, Zhenjiang | ||
| 2012 | Nantong, Zhengzhou, Ürümqi | Beijing, Tianjin, Shijiazhuang, Qinhuangdao, Handan, Taiyuan, Changzhi, Shanghai, Wuxi, Changzhou, Zhenjiang, Wenzhou, Jinhua, Wuhu, Tongling, Pingxiang, Dongying, Weihai, Dezhou, Zhengzhou, Wuhan, Zhuzhou, Chongqing, Taizhou | Beijing, Tianjin, Shijiazhuang, Qinhuangdao, Taiyuan, Shanghai, Wuxi, Changzhou, Zhenjiang, Dongying, Zhengzhou, Wuhan, Chongqing |
| 2013 | Taizhou, Piangxiang, Nanyang, Yichang, Xiangyang, Zunyi | Yingkou, Nantong, Ningbo, Xinyu, Yantai, Yichang, Xiangyang, Nanning, Liuzhou, Mianyang, Guiyang, Zunyi, Baoji Lanzhou, Yinchuan, Ürümqi | Nantong, Ningbo, Pingxiang, Xiangyang, Yantai, Xiangyang, Nanning, Guiyang, Zunyi, Baoji, Lanzhou, Yinchuan, Ürümqi, Yichang, Taizhou |
| 2014 | Tangshan, Hohhot Xuzhou, Chuzhou, Quanzhou, Nanyang, Yuxi, Hanzhong | Tangshan, Hohhot, Nanyang, | |
| 2018 | Xuzhou, Jinhua, Wuhu, Quanzhou, Dongying, Zhuzhou, Yuxi, Hanzhong | Xuzhou, Quanzhou, Zhuzhou, Yuxi, Hanzhong, Jinhua, Wuhu, Dongying | |
| 2022 | Handan, Changzhi, Yingkou, Wenzhou, Tongling, Chuzhou, Xinyu, Weihai, Dezhou, Liuzhou, Mianyang | Handan, Changzhi, Wenzhou, Tongling, Chuzhou, Xinyu, Weihai, Dezhou, Liuzhou, Mianyang |
| Primary Indicators | Secondary Indicators (Unit) | Attributes | Weight |
|---|---|---|---|
| Economic resilience | Total retail sales of consumer goods (104 CNY) [42] | + | 0.1021 |
| The ratio of tertiary industry value to GDP (%) [42] | + | 0.0086 | |
| GDP per capita (CNY) [42] | + | 0.0304 | |
| Local general public budget expenditure (104 CNY) [43] | + | 0.0857 | |
| Year-end deposit and loan balances across financial institutions (109 CNY) [44] | + | 0.1656 | |
| Social resilience | Count of students enrolled in general universities per 10,000 population (104 people) [42] | + | 0.0860 |
| Total collection of books in public libraries (pieces) [45] | + | 0.1410 | |
| Number of hospital beds per 10,000 population (pieces/people) [45] | + | 0.0166 | |
| Population density (people/km2) [43] | − | 0.0008 | |
| Average wage of employed workers (CNY) [44] | + | 0.0167 | |
| Ecological resilience | Greening coverage in built-up areas (%) [42] | + | 0.0050 |
| Rate of wastewater undergoing centralized treatment in sewage treatment plants (%) [43] | + | 0.0037 | |
| Percentage of household waste undergoing non-toxic processing (%) [43] | + | 0.0039 | |
| Industrial sulfur dioxide emissions (104 tons) [43] | − | 0.0013 | |
| Infrastructure resilience | Road area per capita (km2/person) [45] | + | 0.0288 |
| Number of public automobiles (trams) per 10,000 people (vehicles/104 people) [42] | + | 0.0399 | |
| Road freight volume (104 tons) [46] | + | 0.0659 | |
| Number of Internet broadband user accesses (104 households) [42] | + | 0.0848 | |
| Count of end-of-year mobile phone users (104 households) [46] | + | 0.0638 | |
| Drainage pipe density in built-up area (km/km2) [45] | + | 0.0495 |
| Variable Name | Variable Symbol | Variable Definition | Excepted Sign |
|---|---|---|---|
| Degree of Government Intervention | Gov | Ratio of local government fiscal expenditure to regional GDP | Negative |
| Consumption Level | Con | Logarithm of retail sales of consumer goods | Positive |
| Industrial Structure Sophistication | Ind | Ratio of tertiary industry value-added to secondary industry value-added | Positive |
| Urban Education Level | Edu | Logarithm of full-time faculty members in regular higher education institutions | Positive |
| Financial Development Scale | Finc | Ratio of year-end deposits and loans of financial institutions to regional GDP | Positive |
| Human Capital Level | Hd | Ratio of enrolled students in regular higher education institutions to regional GDP (person/CNY) | Negative |
| Symbol | Obs | Mean | Std.dev | Min | Max |
|---|---|---|---|---|---|
| UR | 3990 | 0.0674 | 0.0674 | 0.0134 | 0.6623 |
| Policy | 3990 | 0.0877 | 0.2829 | 0 | 1 |
| Gov | 3990 | 0.1979 | 0.1038 | 0.0439 | 1.4852 |
| Edu | 3990 | 7.6720 | 1.3097 | 4.2485 | 11.2900 |
| Con | 3990 | 15.5427 | 1.0784 | 12.1556 | 19.0140 |
| Ind | 3990 | 1.0408 | 0.5935 | 0.1087 | 5.7848 |
| Finc | 3990 | 2.4688 | 1.2432 | 0.5879 | 21.3018 |
| Hd | 3990 | 35.1196 | 32.3939 | 0.3300 | 282.7800 |
| Inn | 3990 | 0.1705 | 0.3569 | 0.0006 | 5.0842 |
| Struc | 3990 | 0.7905 | 0.4248 | 0.1082 | 5.1996 |
| Variables | (1) | (2) | (3) | (4) | (5) |
|---|---|---|---|---|---|
| L0. | L0. | L1. | L2. | L3. | |
| Policy | 0.0181 *** (3.7073) | 0.0178 *** (3.7180) | 0.0188 *** (3.7753) | 0.0168 ** (3.2322) | 0.0154 ** (3.3986) |
| _cons | 0.0658 *** (153.5928) | −0.0866 ** (−2.1300) | −0.0545 (−1.5204) | −0.0156 (−0.4622) | 0.0326 (1.0334) |
| Controls | N | Y | Y | Y | Y |
| Year and City | Y | Y | Y | Y | Y |
| Obs | 3990 | 3990 | 3705 | 3420 | 3135 |
| Adj. R2 | 0.9453 | 0.9466 | 0.9536 | 0.9579 | 0.9616 |
| Variable Symbol | Year | Estimated Coefficient | t-Value |
|---|---|---|---|
| Pre_3 | 2009 | −0.0052 | −2.14 |
| Pre_2 | 2010 | −0.0016 | −1.00 |
| current | 2012 | 0.0036 ** | 2.24 |
| Post_1 | 2013 | 0.0063 *** | 3.82 |
| Post_2 | 2014 | 0.0110 *** | 3.52 |
| Post_3 | 2015 | 0.0125 *** | 3.46 |
| Post_4 | 2016 | 0.0150 *** | 3.50 |
| Post_5 | 2017 | 0.0176 *** | 3.58 |
| Post_6 | 2018 | 0.0200 *** | 3.44 |
| Post_7 | 2019 | 0.0225 *** | 3.28 |
| Post_8 | 2020 | 0.0172 ** | 2.48 |
| Post_9 | 2021 | 0.0269 *** | 3.71 |
| Post_10 | 2022 | 0.0201 *** | 3.81 |
| Controls | Y | ||
| Year and City | Y | ||
| Obs | 3990 | ||
| Adj. R2 | 0.9479 | ||
| Variables | Time Placebo Test | PSM-DID (Kernel Matching) | Tailing Processing | Replace the Explained Variable | ||||
|---|---|---|---|---|---|---|---|---|
| One Phase | Two Phase | Three Phase | Four Phase | 1~99% | 5~95% | |||
| Policy | 0.0143 *** (3.6218) | 0.0096 *** (3.0496) | 0.0012 (0.9138) | −0.0019 (−0.5396) | 0.0159 *** (3.5209) | 0.0126 *** (3.8634) | 0.0102 *** (4.5481) | 0.1159 ** (2.0230) |
| _cons | −0.0821 ** (−1.9947) | −0.0799 * (−1.9163) | −0.0797 * (−1.8970) | −0.0796 * (−1.8931) | −0.0573 (−1.3151) | −0.0668 ** (−2.5261) | −0.0675 * (−1.9476) | −4.6667 *** (−6.8157) |
| Controls | Y | Y | Y | Y | Y | Y | Y | Y |
| Year and City | Y | Y | Y | Y | Y | Y | Y | Y |
| Obs | 3990 | 3990 | 3990 | 3990 | 3630 | 3990 | 3990 | 3990 |
| Adj. R2 | 0.9358 | 0.9451 | 0.9447 | 0.9447 | 0.9483 | 0.9591 | 0.9528 | 0.9543 |
| Variables | Unmatched or Matched | Mean | Standard Deviation | t-Test | |||
|---|---|---|---|---|---|---|---|
| Experimental Group | Control Group | Percentage | Reduce the Scale | t-Value | p-Value | ||
| gov | U | 0.1523 | 0.2023 | −60.0 | −8.67 | 0.000 | |
| M | 0.1507 | 0.1434 | 8.7 | 85.6 | 1.86 | 0.064 | |
| ln_con | U | 16.7680 | 15.4250 | 140.7 | 23.78 | 0.000 | |
| M | 16.708 | 16.6380 | 7.3 | 94.8 | 1.10 | 0.273 | |
| ind | U | 1.2988 | 1.0160 | 42.9 | 8.59 | 0.000 | |
| M | 1.2240 | 1.1668 | 8.7 | 79.8 | 1.31 | 0.190 | |
| finc | U | 3.1024 | 2.4079 | 51.5 | 10.11 | 0.000 | |
| M | 3.0029 | 2.8473 | 11.5 | 77.6 | 1.55 | 0.121 | |
| hd | U | 47.8220 | 33.8980 | 37.6 | 7.74 | 0.000 | |
| M | 48.7680 | 48.6680 | 0.3 | 99.3 | 0.10 | 0.975 | |
| Ln_edu | U | 9.1431 | 7.5303 | 137.7 | 23.47 | 0.000 | |
| M | 9.0879 | 8.9906 | 8.3 | 94.0 | 1.11 | 0.266 | |
| Variables | (1) | (2) | (3) | (4) |
|---|---|---|---|---|
| Broadband China | Climate-Resilient Cities | National Independent Innovation Demonstration Zones | All | |
| Policy | 0.0153 *** (3.3277) | 0.0178 *** (3.6871) | 0.0158 *** (3.3567) | 0.0141 *** (3.1074) |
| Broadband China | 0.0115 *** (4.0959) | 0.0086 *** (3.7383) | ||
| Climate-resilient cities | 0.0006 (0.1002) | 0.0001 (0.0230) | ||
| National independent innovation demonstration zones | 0.0225 *** (4.5385) | 0.0206 *** (4.4142) | ||
| Controls | Y | Y | Y | Y |
| Year and City | Y | Y | Y | Y |
| Obs | 3990 | 3990 | 3990 | 3990 |
| Adj. R2 | 0.9453 | 0.9466 | 0.8740 | 0.9558 |
| Variables | IV1 | IV2 | ||
|---|---|---|---|---|
| First | Second | First | Second | |
| Policy | 0.0266 *** (3.83) | 0.0300 *** (3.72) | ||
| IV1 | 0.7447 *** (57.43) | |||
| IV2 | 0.9491 *** (75.66) | |||
| Controls | Y | Y | Y | Y |
| Year and City | Y | Y | Y | Y |
| Kleibergen–Paap rkLMstatistic | 44.459 *** | 27.453 *** | ||
| Cragg–Donald Wald Fstatistic | 4382.47 | 4462.42 | ||
| Kleibergen–Paap rk Wald Fstatistic | 3298.47 | 5724.39 | ||
| Obs | 3705 | 3990 | ||
| R2 | 0.4146 | 0.4437 | ||
| Variables | Smart City | Innovative City | Total Effect | ||
|---|---|---|---|---|---|
| (1) | (2) | (3) | (4) | (5) | |
| Only | 0.0016 (1.4448) | 0.0108 *** (4.4286) | |||
| Dual | 0.0187 *** (4.7876) | 0.0029 (0.6178) | 0.0123 *** (2.6334) | ||
| Sample | Single polit | Dual polit | Single polit | Dual polit | - |
| Controls | Y | Y | Y | Y | Y |
| Year and City | Y | Y | Y | Y | Y |
| 95% CI | [−0.0006, 0.0038] | [0.0109, 0.0264] | [0.0059, 0.0156] | [−0.0065, 0.0123] | [0.0031, 0.0215] |
| Obs | 2590 | 1456 | 2562 | 1386 | 2184 |
| Adj. R2 | 0.8632 | 0.9559 | 0.9372 | 0.9480 | 0.9476 |
| Variables | Smart Cities Before Innovative Cities | Innovative Cities Before Smart Cities |
|---|---|---|
| Policy | 0.0068 * (1.8257) | 0.0122 (1.5860) |
| Controls | Y | Y |
| Year and City | Y | Y |
| 95% CI | [−0.0006, 0.0141] | [−0.0031, 0.0274] |
| Obs | 1078 | 1036 |
| Adj. R2 | 0.9036 | 0.9500 |
| Variables | (1) | (2) | (3) |
|---|---|---|---|
| Ur | Inn | Struc | |
| Policy | 0.0178 *** (3.7180) | 0.0696 ** (2.4315) | 0.0495 ** (2.5317) |
| Controls | Y | Y | Y |
| Year and City | Y | Y | Y |
| Obs | 3990 | 3990 | 3990 |
| Adj. R2 | 0.9466 | 0.8218 | 0.9628 |
| Variable | Urban Hierarchy | Geographic Regions | Resource Endowment | |||||
|---|---|---|---|---|---|---|---|---|
| Core Cities | General Cities | Eastern Zone | Central Zone | Western Zone | Northeast Zone | Resource- Dependent City | Non- Resource-Dependent City | |
| (1) | (2) | (3) | (4) | (5) | (6) | (7) | (8) | |
| Policy | 0.0085 (0.7167) | 0.0080 *** (3.4035) | 0.0187 ** (2.4589) | 0.0101 ** (2.0593) | 0.0148 * (1.7702) | −0.0007 (−0.2421) | 0.0055 (1.2279) | 0.0181 *** (3.1499) |
| Controls | Y | Y | Y | Y | Y | Y | Y | Y |
| Year and City | Y | Y | Y | Y | Y | Y | Y | Y |
| Obs | 490 | 3500 | 1204 | 1120 | 1190 | 476 | 1596 | 2394 |
| Adj. R2 | 0.9432 | 0.8912 | 0.9533 | 0.9556 | 0.9224 | 0.9593 | 0.8232 | 0.9499 |
| Year | Geographical Matrix | Economic Matrix | ||
|---|---|---|---|---|
| Moran’s I | z-Value | Moran’s I | z-Value | |
| 2009 | 0.0148 *** | 3.6832 | 0.3306 *** | 11.2171 |
| 2010 | 0.0157 *** | 3.8890 | 0.3216 *** | 11.0203 |
| 2011 | 0.0144 *** | 3.6084 | 0.3352 *** | 11.3916 |
| 2012 | 0.0133 *** | 3.3834 | 0.3090 *** | 10.5017 |
| 2013 | 0.0151 *** | 3.7322 | 0.3259 *** | 11.0707 |
| 2014 | 0.0123 *** | 3.1808 | 0.3135 *** | 10.6605 |
| 2015 | 0.0138 *** | 3.4825 | 0.3018 *** | 10.2866 |
| 2016 | 0.0134 *** | 3.4049 | 0.3137 *** | 10.6833 |
| 2017 | 0.0163 *** | 3.9961 | 0.2974 *** | 10.1625 |
| 2018 | 0.0166 *** | 4.0688 | 0.2935 *** | 10.0395 |
| 2019 | 0.0157 *** | 3.8905 | 0.2873 *** | 9.8247 |
| 2020 | 0.0152 *** | 3.8149 | 0.2616 *** | 9.0327 |
| 2021 | 0.0189 *** | 4.5091 | 0.2795 *** | 9.5327 |
| 2022 | 0.0187 *** | 4.4724 | 0.2678 *** | 9.1154 |
| Test | Primary Hypothesis | Statistics | Results | |
|---|---|---|---|---|
| Geographical Matrix | Economic Matrix | |||
| LM test | LM (error) test | 336.565 *** | 275.051 *** | SDM model |
| Robust LM (error) test | 445.741 *** | 27.634 *** | ||
| LM (lag) test | 103.124 *** | 379.102 *** | ||
| Robust LM (lag) test | 212.300 *** | 131.685 *** | ||
| Wald test | SDM can be degraded to SEM | 38.020 *** | 269.790 *** | Rejecting degradation |
| SDM can be degraded to SAR | 33.040 *** | 100.950 *** | ||
| Hausman test | Random effect model | −405.770 | −4452.010 | Fixed effect model |
| LR test | Fixed individual is better than two-way fixed | 101.140 *** | 66.840 *** | Two-way fixed effect of individual and time |
| Fixed time is better than two-way fixed | 7637.680 *** | 7308.900 *** | ||
| Geographical Matrix | Economic Matrix | |
|---|---|---|
| Policy | 0.0171 *** (11.62) | 0.0126 *** (8.64) |
| W [Policy] | 0.1074 *** (4.53) | 0.0219 *** (6.23) |
| Direct effect | 0.1760 *** (11.70) | 0.0137 *** (9.21) |
| Indirect effect | 0.1966 *** (3.71) | 0.0314 *** (7.77) |
| Total effect | 0.2142 *** (4.04) | 0.0451 *** (10.51) |
| Spatial-rho | 0.4137 *** (3.69) | 0.2370 *** (8.18) |
| Sigma2_e | 0.0002 *** (44.62) | 0.0002 *** (44.40) |
| Controls | Y | Y |
| Year and city | Y | Y |
| Obs | 3990 | 3990 |
| R2 | 0.2515 | 0.3404 |
Disclaimer/Publisher’s Note: The statements, opinions and data contained in all publications are solely those of the individual author(s) and contributor(s) and not of MDPI and/or the editor(s). MDPI and/or the editor(s) disclaim responsibility for any injury to people or property resulting from any ideas, methods, instructions or products referred to in the content. |
© 2026 by the authors. Licensee MDPI, Basel, Switzerland. This article is an open access article distributed under the terms and conditions of the Creative Commons Attribution (CC BY) license.
Share and Cite
Deng, G.; Shen, Y. A Study on the Impact of Dual Pilot Smart Cities and Innovative Cities on City Resilience. Sustainability 2026, 18, 646. https://doi.org/10.3390/su18020646
Deng G, Shen Y. A Study on the Impact of Dual Pilot Smart Cities and Innovative Cities on City Resilience. Sustainability. 2026; 18(2):646. https://doi.org/10.3390/su18020646
Chicago/Turabian StyleDeng, Guangyao, and Yingchen Shen. 2026. "A Study on the Impact of Dual Pilot Smart Cities and Innovative Cities on City Resilience" Sustainability 18, no. 2: 646. https://doi.org/10.3390/su18020646
APA StyleDeng, G., & Shen, Y. (2026). A Study on the Impact of Dual Pilot Smart Cities and Innovative Cities on City Resilience. Sustainability, 18(2), 646. https://doi.org/10.3390/su18020646