Article

Network-Based Coupling Analysis Between Human Activity Intensity and Ecosystem Services: Evidence from the Pinglu Canal Economic Belt, China

1
Key Laboratory of Environment Change and Resources Use in Beibu Gulf, Ministry of Education, Nanning Normal University, Nanning 530001, China
2
Guangxi Key Laboratory of Earth Surface Processes and Intelligent Simulation, Nanning Normal University, Nanning 530001, China
3
School of Natural Resources and Surveying and Mapping, Nanning Normal University, Nanning 530100, China
*
Author to whom correspondence should be addressed.
Sustainability 2026, 18(2), 596; https://doi.org/10.3390/su18020596
Submission received: 1 December 2025 / Revised: 1 January 2026 / Accepted: 4 January 2026 / Published: 7 January 2026
(This article belongs to the Section Environmental Sustainability and Applications)

Abstract

As a strategic core of the Western Land–Sea New Corridor, the Pinglu Canal Economic Belt (PCEB) is undergoing unprecedented landscape restructuring due to canal construction. This mega-project serves as a critical case for understanding how intense human intervention reshapes regional ecosystem service (ES) patterns. Integrating complex network analysis with Generalized Additive Models (GAMs), this study examines the spatiotemporal evolution of human activity intensity (HAI) and ES networks (2000–2020) and their nonlinear responses. Research findings: the PCEB’s ES network evolution reflects a “policy–terrain coupling” mechanism. While HQ remains the structural anchor for regulating services, FP drives key trade-offs. The network has transitioned from coexisting trade-offs and synergies to synergy dominance, driven by ecological engineering and spatial zoning. We identified HAI 0.10–0.15 as a critical threshold where moderate disturbance promotes service integration. However, excessive intensification leads to functional simplification. Future governance should move beyond rigid zoning, employing dynamic spatial policies and adaptive agroforestry to mitigate FP’s pressure and activate the ecological potential of transition zones. This study provides a framework for understanding nonlinear socio-ecological responses to human–policy–terrain feedback. This study provides a scientific basis for optimizing land-use management and enhancing ecosystem sustainability in the PCEB.

1. Introduction

Ecosystem services (ESs) refer to the benefits derived from the structures, functions, and processes of ecosystems that support human production and daily well-being [1,2]. These services include food production (FP), soil conservation (SC), carbon sequestration (CS), water yield (WY), water purification (WP), and habitat quality (HQ). As they correspond to both provisioning and regulating functions, these ESs collectively reflect the capacities for material provisioning and ecological regulation within regional ecosystems [3]. Following the Millennium Ecosystem Assessment (MA), the advancement of 3S technologies and data modeling has enabled the quantitative assessment and spatial visualization of ecosystem services, shifting research focus from single-service evaluations to analyses of inter-service relationships. This progress has revealed widespread trade-offs and synergies among ecosystem services [4,5]. However, with the acceleration of social progress, the transformation of land-use types across regions, and a series of other high-intensity human activities, such disturbances have severely affected the multiple functions and services provided by ecosystems [6,7]. Previous studies indicate that complex and nonlinear interactions exist between ES and human activity intensity (HAI) [8,9]. Guided by the concept of “harmonious coexistence between humans and nature,” gaining a thorough understanding of the coupling relationship between ES and HAI is of great scientific and practical significance for elucidating the response mechanisms of ecosystems under human disturbance and thereby promoting the coordinated governance and sustainable development of regional ecosystems [10].
Existing studies have produced systematic findings in regional ES assessment using value-based methods and ecological process models (e.g., InVEST) [11,12,13]. Building on this foundation, studies have begun to emphasize the interrelationships among different ESs, mainly using correlation analyses and regression models to reveal their synergistic and trade-off relationships [14]. While statistical approaches—such as correlation analysis and principal component analysis—have effectively identified spatial trade-offs and ES bundles [15,16,17], these methods predominantly rely on linear assumptions. Consequently, they often fail to capture the holistic interaction structure among multiple services and are limited in revealing the complex, nonlinear responses of ecosystems to varying intensities of human disturbance [18]. ESs are the link between ecological and social systems, forming the functional backbone of coupled Social–Ecological Systems [19]. Within this framework, ESs are not isolated components but are organized into complex networks where topological structure determines system functionality. Just as landscape fragmentation can impair system resilience by loosening network connectivity [20], HAI acts as a profound stressor that fundamentally reorganizes these interaction patterns. However, unlike linear degradation, the response of ES to HAI often exhibits nonlinear structural regime shifts—transitions where the network configuration abruptly reorganizes once specific thresholds are crossed. Therefore, to understand the stability and resilience of regional ecosystems, it is critical to move beyond static assessments and capture how the network architecture itself evolves nonlinearly along anthropogenic gradients.
On one hand, to quantify these structural regime shifts, network analysis has emerged as a critical methodological frontier. By abstracting individual ESs as nodes and representing their interactions as edge weights based on correlation strength, this approach characterizes both node-level properties—such as degree centrality—and network-level features, including connectivity, density, and complexity [21,22]. Network analysis has thus emerged as a new research frontier, providing an intuitive visualization of relationships and interaction strengths among services. Moreover, by quantifying node and structural metrics, it enables the identification of key services and their functional roles, enabling the explicit characterization of nonlinear, evolving, and feedback-rich relationships [23], thereby offering a more integrated and comprehensive understanding of the interaction mechanisms within ES systems [24]. On the other hand, the relationships and network structures among ESs are dynamic rather than static, jointly shaped by the natural ecological background and socioeconomic activities [25,26]. Particularly in the context of the Anthropocene, human activities driven by land-use change have become a key force reshaping ES relationships and altering the interactions within social–ecological systems [27,28]. Therefore, research has increasingly focused on the nonlinear responses of system structures to key drivers such as human activities, which traditional correlation or regression models—based on linear assumptions—cannot adequately address [29]. For example, when human disturbance is minimal, various ES tend to develop synergistically [30]; when the city reaches an advanced stage of development, industrial transformation and the expansion of green spaces may instead lead to the restoration of certain degraded services, often exhibiting complex U-shaped or inverted U-shaped relationships [31]. Although many studies have examined differences in ES relationships and structures across time periods or under varying levels of HAI, these analyses still struggle to capture the intricate fluctuations and critical thresholds that occur along continuous gradients [29]. To overcome this limitation, the study integrates generalized additive models (GAMs) with network analysis to construct a series of ES networks along the continuous gradient of the key driver. Examining variations in network metrics—such as connectivity and modularity—revealed the dynamic responses of relationships between ecological structure and function [32]. The broader significance of this approach lies in its capacity to elucidate the complex mechanisms through which human activities influence ecosystem interactions. Clarifying how HAI affects these interrelationships is crucial for targeted conservation and restoration efforts. This is particularly significant in the context of major infrastructure projects like the PCEB, where such understanding plays a key role in balancing regional development with ecological conservation. By translating complex interactions into intuitive structural metrics, our framework not only visualizes these relationships but also enables a systemic-level analysis of how human activities reshape ecosystem structure and stability.
The PCEB serves as the strategic core of the Western Land–Sea New Corridor. Since the implementation of the “Development Plan for the Guangxi Beibu Gulf Economic Zone” in 2008, the region has undergone a rapid transition toward port-oriented industrialization and urbanization. Currently, while the ongoing canal construction provides a robust engine for regional economic growth, it inevitably exerts unprecedented anthropogenic pressure on the fragile ecosystems along the route and its periphery [33]. Despite these pressing challenges, while numerous studies have examined the spatial patterns and influencing factors of individual ES, systematic research on the dynamic evolution of trade-off and synergy relationships within ES networks remains limited. In particular, how HAI drives the structural reorganization of these networks and shapes their nonlinear responses and threshold characteristics is still poorly understood. Therefore, this study aims to address the following questions: (1) What complex coupling relationships exist among the different ESs? (2) How do the trade-off and synergy relationships among ESs dynamically evolve in response to varying HAI? (3) Given the anticipated intensification of HAI resulting from future canal development, what strategies can be formulated to maintain stable and coordinated development among multiple services? To answer these questions, this study quantifies HAI and six major ESs—carbon storage, habitat quality, food production, soil conservation, water yield, and water purification. Holistic, trade-off, and synergistic ES networks are constructed and integrated with GAMs to explore how inter-service relationships dynamically respond to changes in HAI. The findings reveal the nonlinear response mechanisms of ES networks to variations in HAI, providing scientific insights to support sustainable land-use zoning and ecological risk management in the Pinglu Canal Economic Belt.

2. Materials and Methods

2.1. Study Area

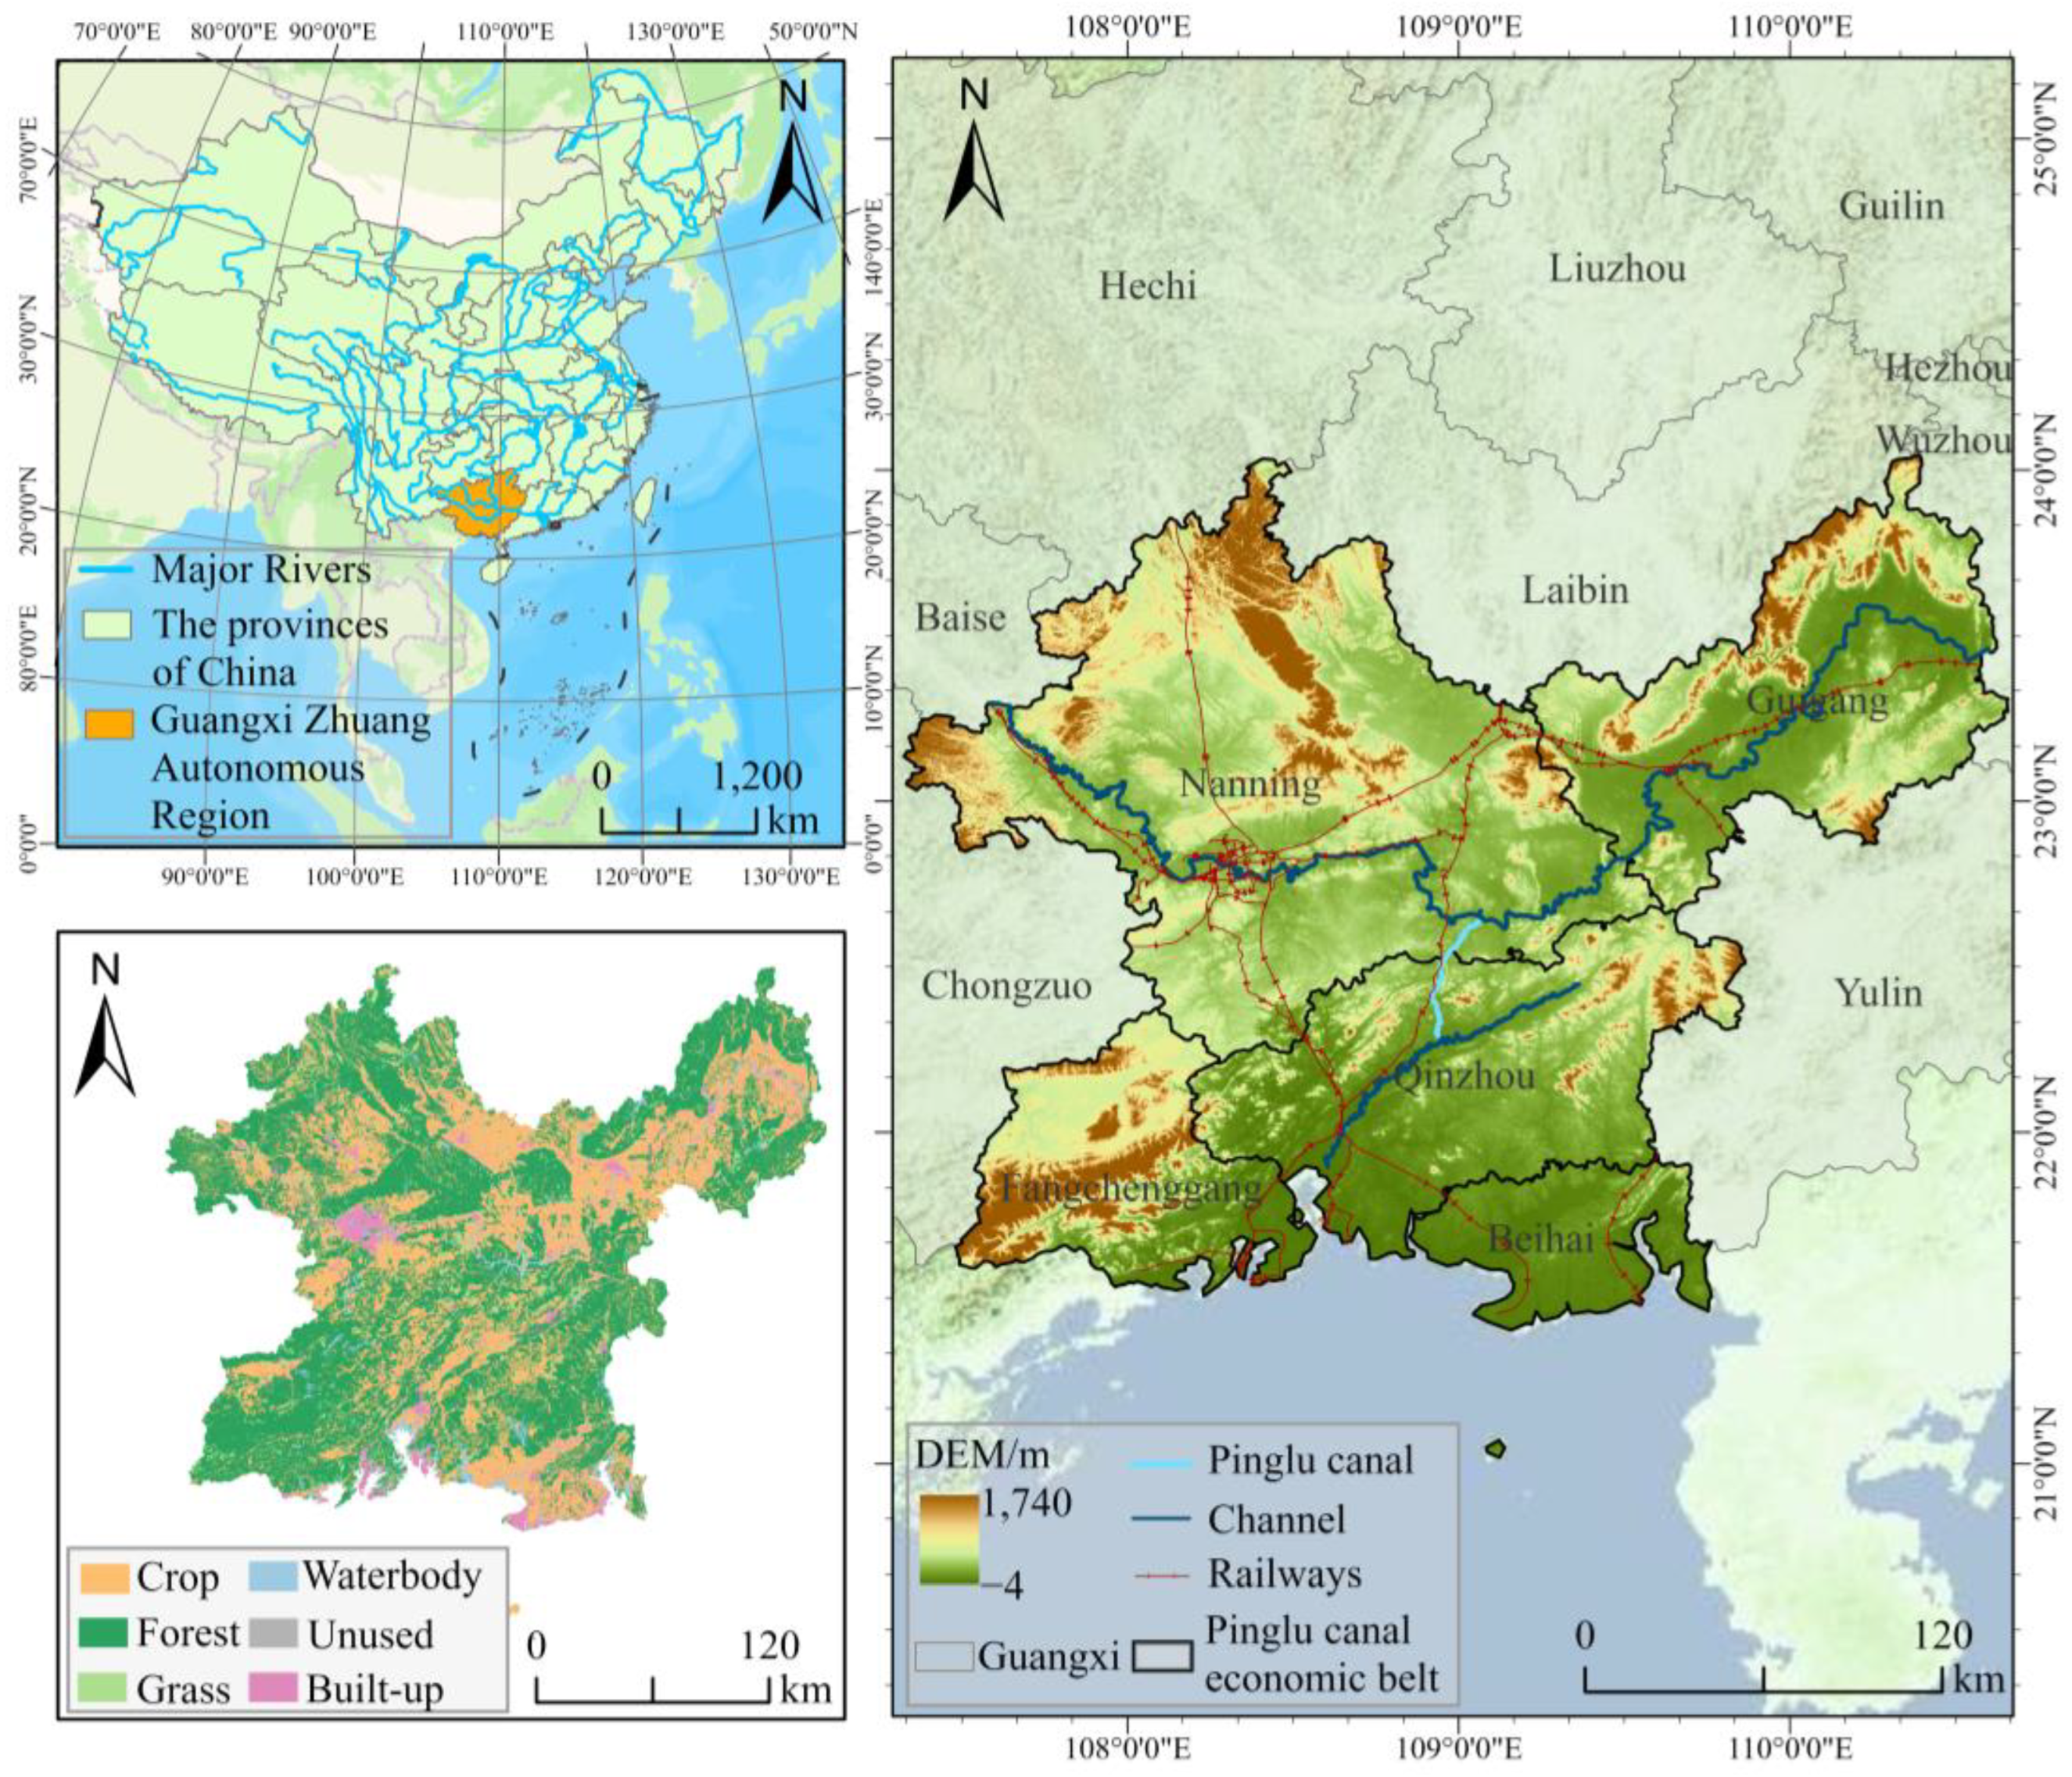
The Pinglu Canal Economic Belt (PCEB), a strategic core of the Western Land–Sea New Corridor, is situated in southwestern Guangxi, China (21°40′–23°18′ N, 107°59′–109°59′ E), encompassing the cities of Nanning, Beihai, Qinzhou, Fangchenggang, and Guigang (Figure 1). The PCEB features a complex topography, representing a typical coupled zone of mountains, rivers, and the sea, where terrestrial, fluvial, and marine systems are closely interconnected [34]. The PCEB is a classic mountain–river–sea transitional zone with a complicated terrain. The Yongjiang River, which flows east–west, and the Qinjiang River, which flows north–south, intersect it, providing crucial hydrological conditions for building an integrated transportation system for the Pinglu Canal. These features, together with its distinct border and coastal position, provide important benefits for connecting inland regions to global trade routes and encouraging maritime-oriented growth.
The PCEB GDP was reported as 947.6 billion CNY in 2020; to expand its position as a gateway to foreign markets, the Pinglu Canal project was initiated in 2022 with a total expenditure of 72.7 billion CNY. This large-scale endeavor represents an unparalleled human intervention, profoundly changing regional land-use patterns and having potentially major implications on ES in both surrounding areas and canal-adjacent communities.

2.2. Research Framework

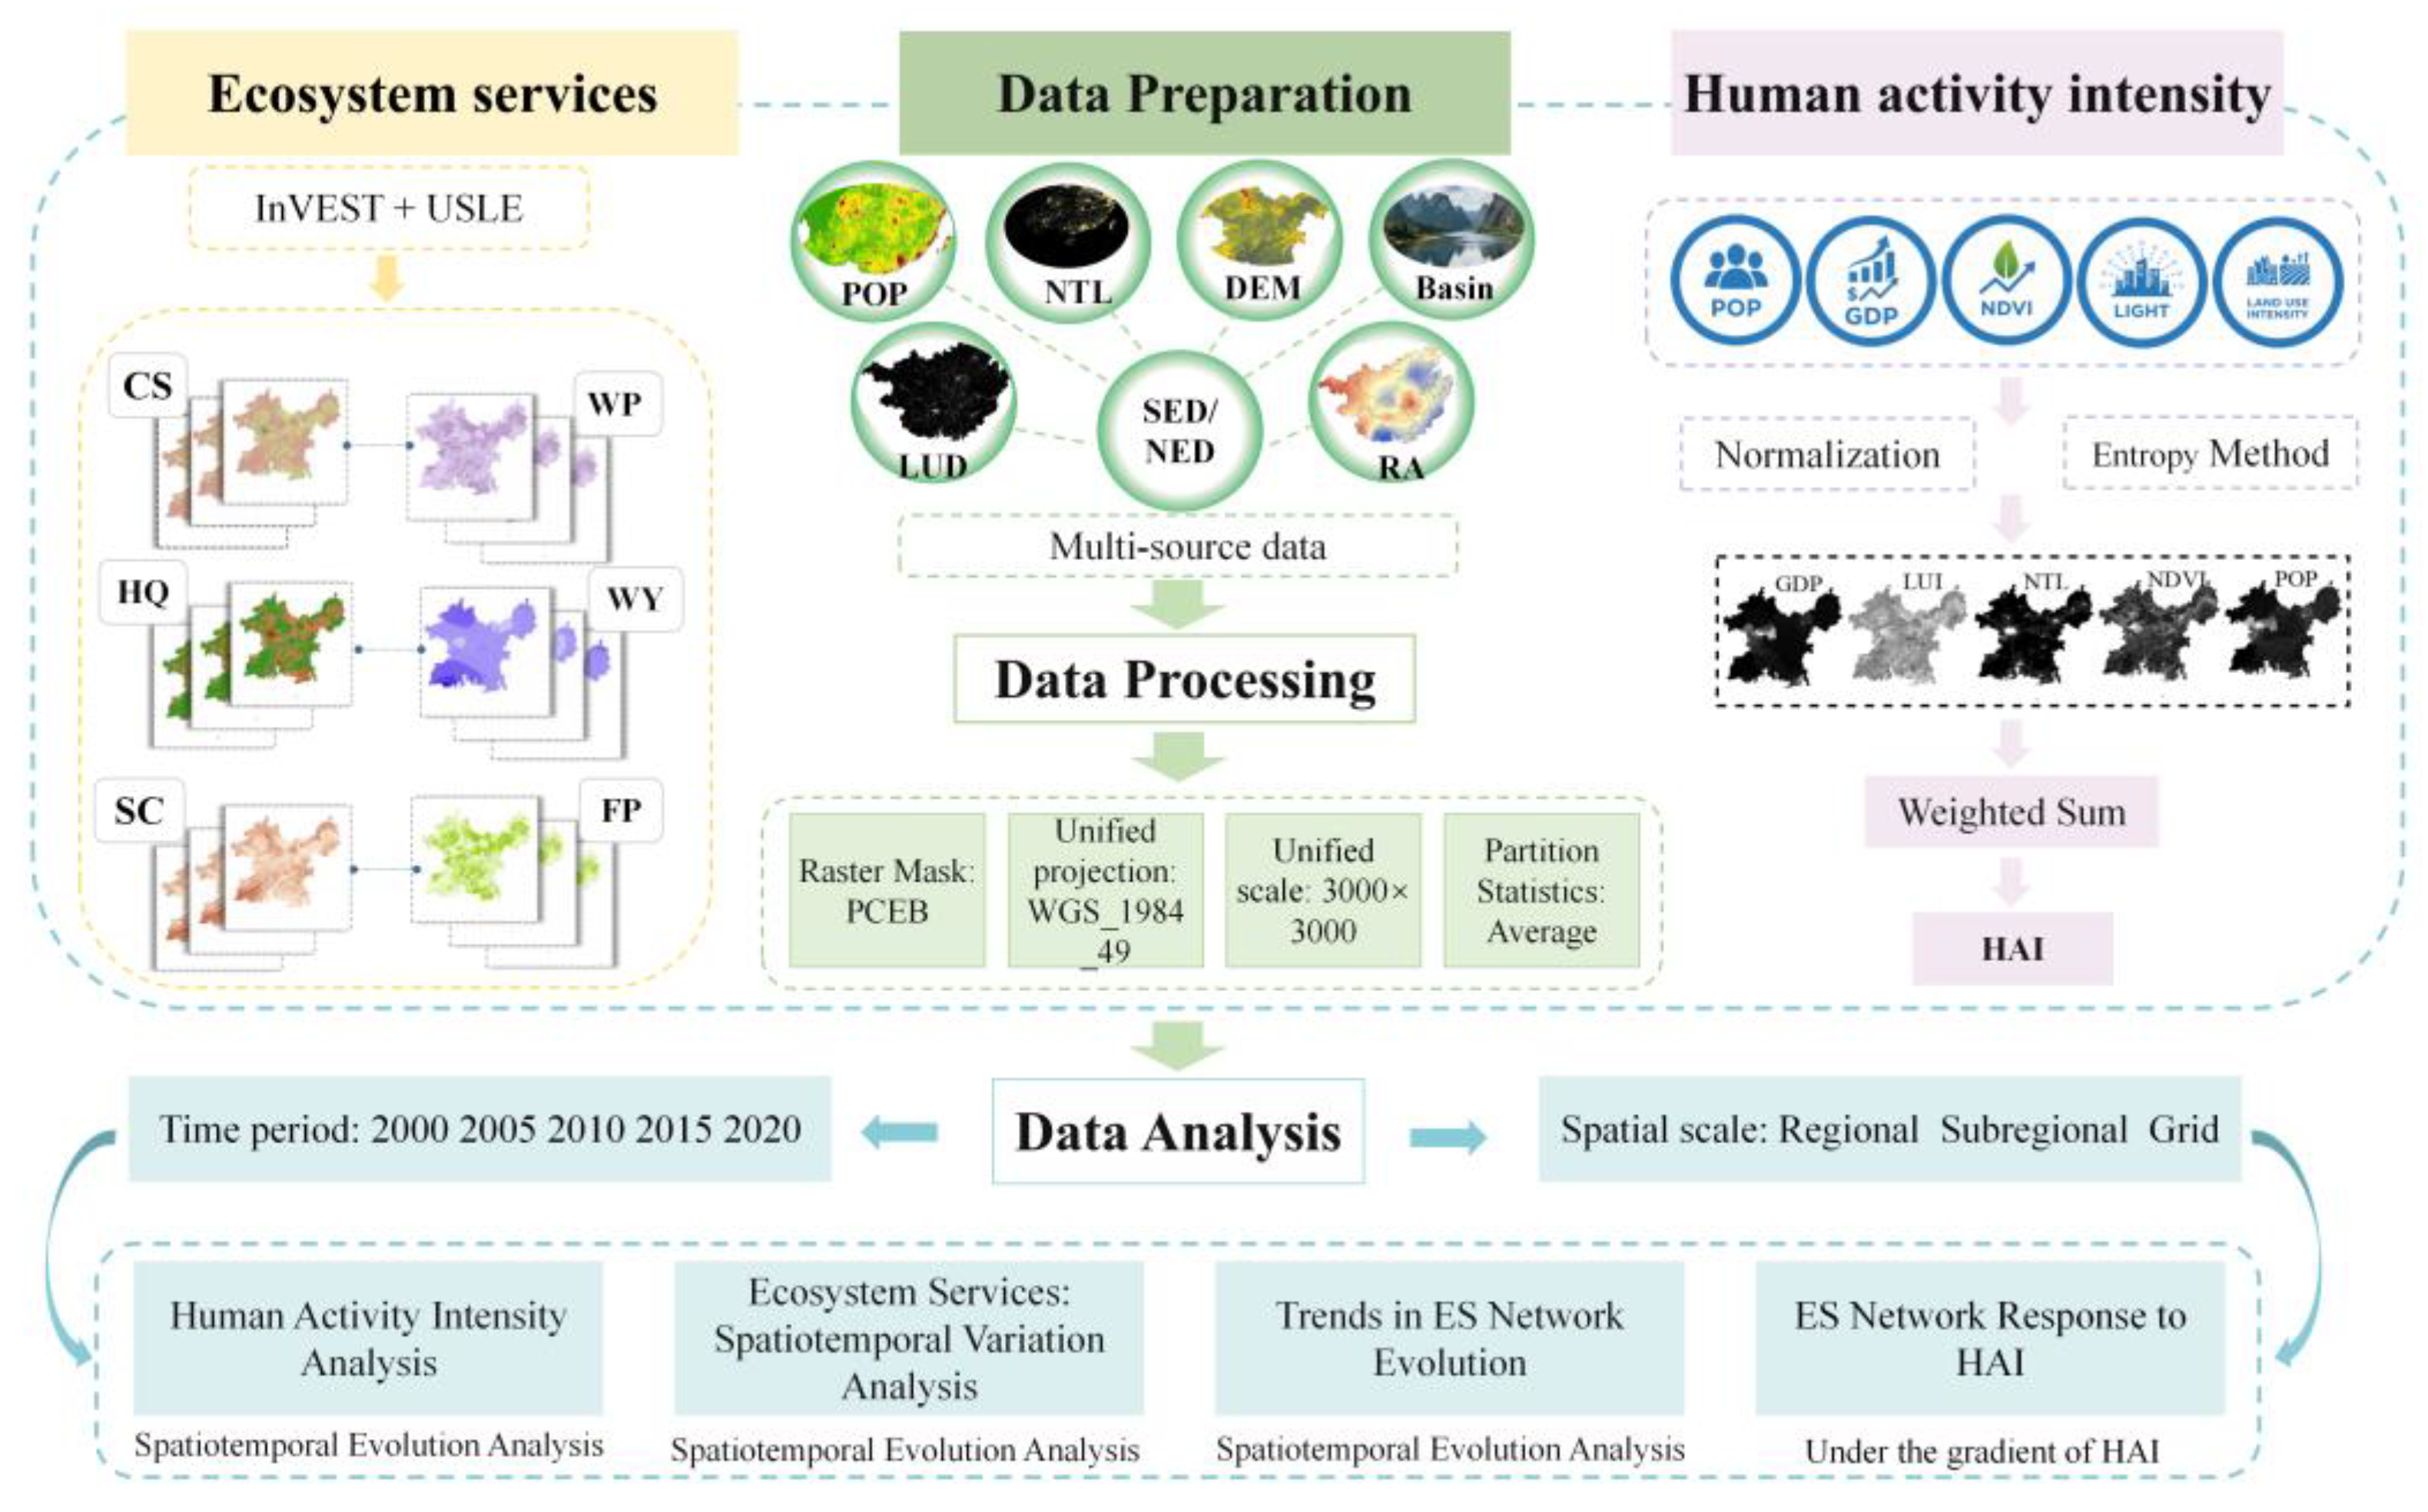
The workflow of this study is presented in Figure 2. First, multi-source data for evaluating ecosystem services (ESs) and human activity intensity (HAI) in the study area were collected and then preprocessed in ArcGIS 10.8, including data masking and coordinate standardization. Second, ES and HAI were quantified: ES were calculated and mapped using the InVEST 3.16.1 and RUSLE models, while HAI was derived through range standardization, entropy weighting, and weighted summation. The spatiotemporal variations in ES and HAI were then analyzed. Based on these results, a comprehensive ES network was constructed to explore the interrelationships among ES components across different time periods. Finally, trade-off and synergy subnetworks were developed to analyze the structural characteristics and dynamic responses of ES networks under varying HAI gradients.

2.3. Ecosystem Services Assessment

The environmental impacts of canal construction exhibit spatially diffusive and fluctuating characteristics. The drastic land-use transformations associated with the development of canals, corridors, and port areas directly threaten food production (FP), soil conservation (SC), and habitat quality (HQ). Moreover, the project reshapes the regional hydrological network, with water yield (WY) and water purification (WP) accurately reflecting changes in water quantity and quality. To align with the development vision of the Pinglu Canal as a “green and low-carbon project,” carbon sequestration (CS) is also incorporated as an indicator [35,36]. Therefore, six ecosystem services (FP, SC, HQ, WY, WP, and CS) were selected to characterize the ES supply capacity and spatial distribution patterns within the Pinglu Canal Economic Belt during the study period. These indicators provide essential data support and scientific evidence for future canal construction planning and ecological management policies [34,35,37]. In this study, five ecosystem services (HQ, CS, WY, SC, and WP) were evaluated using the InVEST and RUSLE models. Detailed calculation formulas (Equations (S1)–(S17)), data sources (Table S1), and specific input parameters (Tables S2–S4) are summarized in Supplementary Materials.

2.4. Human Activity Intensity Calculation

Human activity intensity (HAI) serves as an essential indicator for measuring the extent to which social and economic activities utilize, modify, and develop natural ecosystems [38]. Based on previous research, this study employed a multi-indicator composite weighting approach to quantify the HAI of the Pinglu Canal Economic Belt. Five representative indicators were selected: population density (POP), regional gross domestic product (GDP), nighttime light intensity, normalized difference vegetation index (NDVI), and land-use intensity (LUI) [10,39]. All datasets were generated as 1 km × 1 km raster grids for each time period. Data preprocessing and analysis were conducted in ArcGIS 10.8, including range normalization, entropy-based weight calculation, and weighted integration to derive the composite HAI scores.
HAI = k = 1 n w k × N k
where wk represents the weight of the k-th indicator, and Nk indicates the normalized value of the k-th indicator.

2.5. Network Analysis

In this study, the network analysis was conducted at a grid scale of 3000 × 3000 m. All ecosystem service (ES) data were obtained through zonal statistics in ArcGIS 10.8. Previous studies have demonstrated that the spatial patterns, trade-offs, and synergies of ecosystem services are scale-dependent, and grid-based units are commonly adopted to explicitly capture such scale effects [40,41]. Partial Spearman correlation coefficients were applied to quantify the trade-off and synergy relationships among ES [42]. To control for confounding effects, digital elevation model, slope, annual mean temperature, annual mean precipitation, and soil type were incorporated as control variables [10,22]. Positive correlations between ES pairs were interpreted as synergies, whereas negative correlations indicated trade-offs. Accordingly, two types of networks were constructed: a synergy network comprising positive correlations and a trade-off network comprising negative correlations. In both networks, the connection strength (i.e., edge weight) was represented by the absolute value of the correlation coefficient [18].
The analysis constructed three networks: an overall ES network, a synergy network, and a trade-off network. Three structural metrics were then calculated, including the weighted node degree (node level) and connectivity and modularity (edge level). The weighted node degree represents the centrality or importance of a single node (i.e., an individual ES) within the network. In ES networks, a service with a high weighted node degree indicates more numerous and stronger synergistic or trade-off relationships with other services [22]. Connectivity reflects the overall cohesiveness of the network. In synergy networks, higher connectivity reflects extensive positive interactions among services, indicating stronger system integration and greater potential for coordinated management. In contrast, in trade-off networks, higher connectivity denotes widespread antagonistic interactions, implying increased management complexity [24,43]. Modularity measures the degree of network compartmentalization, representing the extent to which the network is divided into distinct “modules” that are densely connected internally but sparsely connected externally. In ES networks, high modularity indicates that ESs tend to form several functionally independent “service bundles,” where services within each module are highly synergistic but exhibit weak interactions across modules. All metrics were calculated using the igraph package in R 4.5.1 [44]. See Table S5 in the Supplementary Materials for detailed formulas and ecological meaning.
To further examine the complex nonlinear relationships between HAI and ES network structures, this study employed a combined approach integrating the moving window method and generalized additive models [10,18]. This approach involved two main steps. First, since network metrics are calculated from sample sets rather than individual samples, a sliding window was applied along the HAI gradient to generate a series of gradient-based datasets [45]. The combination of window number, degree of overlap, and gradient coverage was comprehensively evaluated to ensure statistical robustness; a configuration of 600 windows and 60 steps was determined as optimal. Second, a correlation network was constructed for each window, from which the mean HAI value and the associated network metrics were derived [46]. The GAM was then applied to fit nonlinear relationships between these variables, revealing the continuous and dynamic trajectory of ES network structural evolution in response to HAI variation.

3. Results

3.1. Spatiotemporal Dynamics of HAI in PCEB

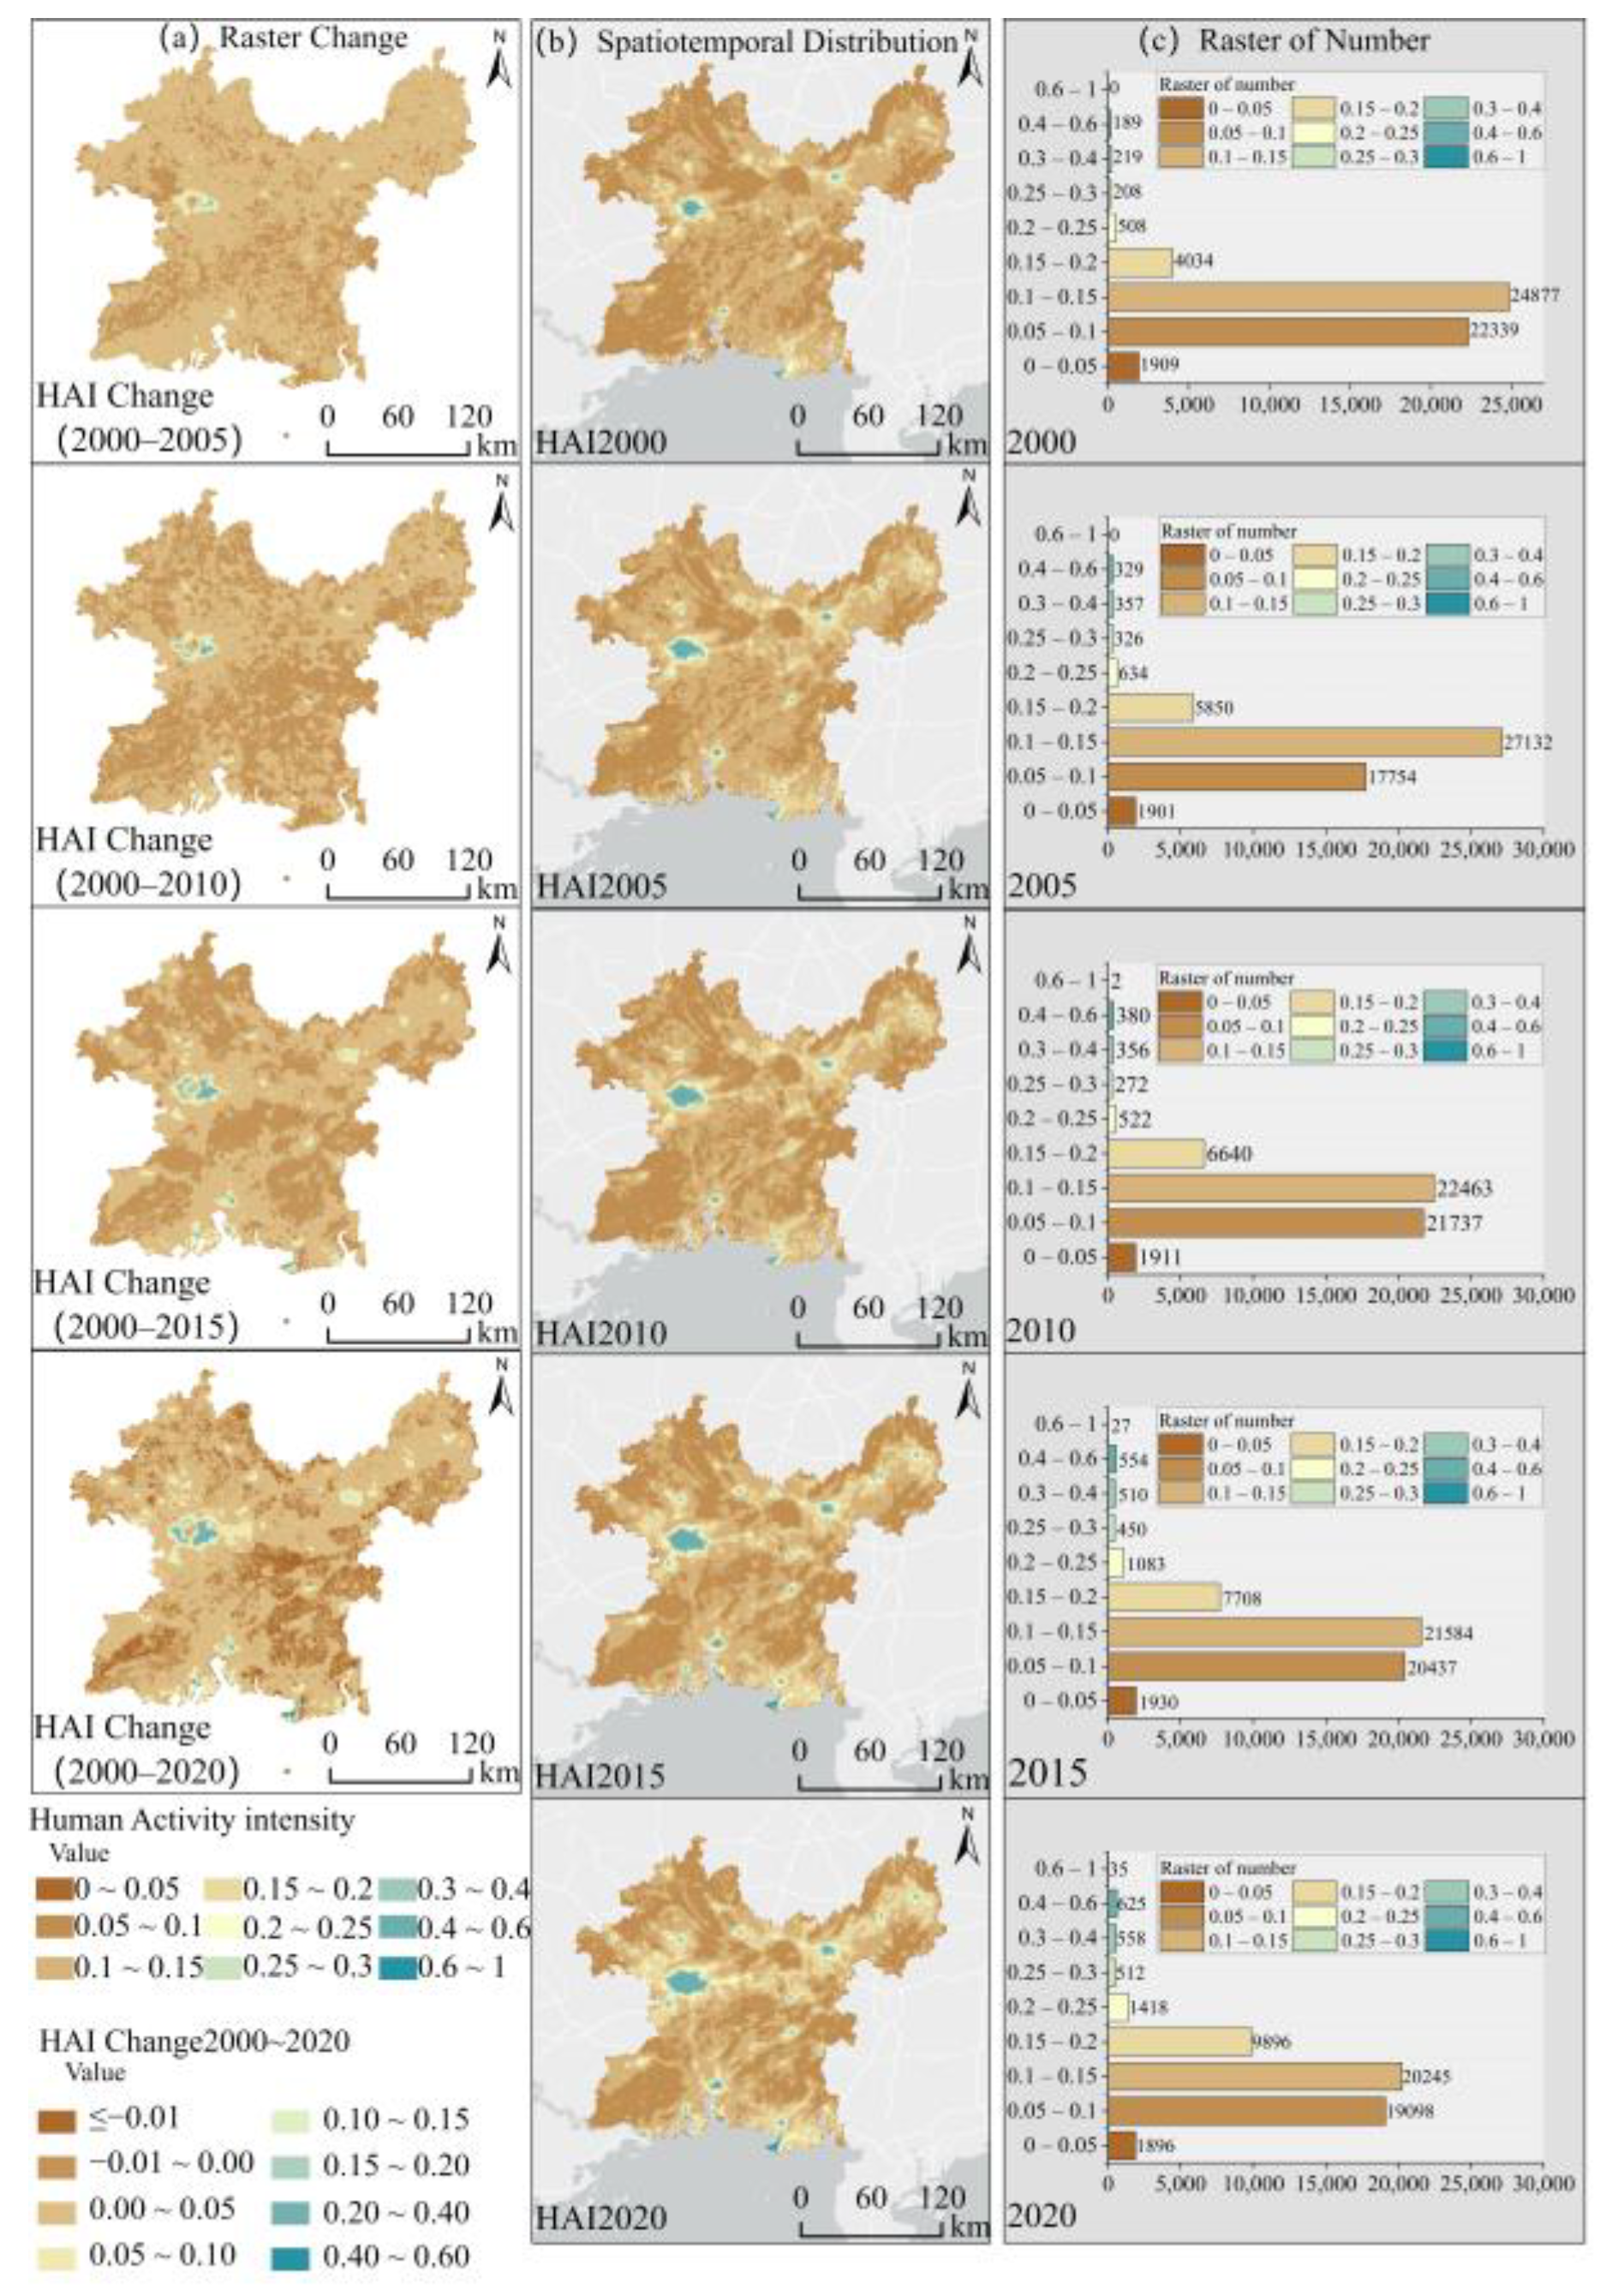
Figure 3 illustrates the spatiotemporal evolution of HAI in the PCEB in terms of grid changes, spatial patterns, and quantitative structure. Temporally, HAI in the PCEB showed a persistent upward trend, which was reflected in the sustained decrease in the proportion of low-intensity HAI grids. Between 2000 and 2020, the proportion declined from 90.5% to 75%, exhibiting a moderate decrease during 2000–2010 followed by an accelerated decline after 2010. Meanwhile, the share of medium- and high-intensity HAI grids increased notably. Spatially, HAI maintained a stable single-core agglomeration pattern centered in the western part of the PCEB. Nanning functioned as the region’s single growth pole and the dominant center of high-intensity human activity, while other cities showed only weak and localized activity that failed to develop into regional sub-centers. Spatially, HAI expansion exhibited three characteristic patterns: an east–west corridor pattern in Nanning driven by river and transport axes; a port-oriented pattern in coastal cities such as Qinzhou, Fangchenggang, and Beihai, where high-intensity activity clustered in port-industrial zones and their hinterlands; and a concentric diffusion pattern in Guigang, with expansion radiating outward from the urban core.

3.2. Spatiotemporal Dynamics of ES in PCEB

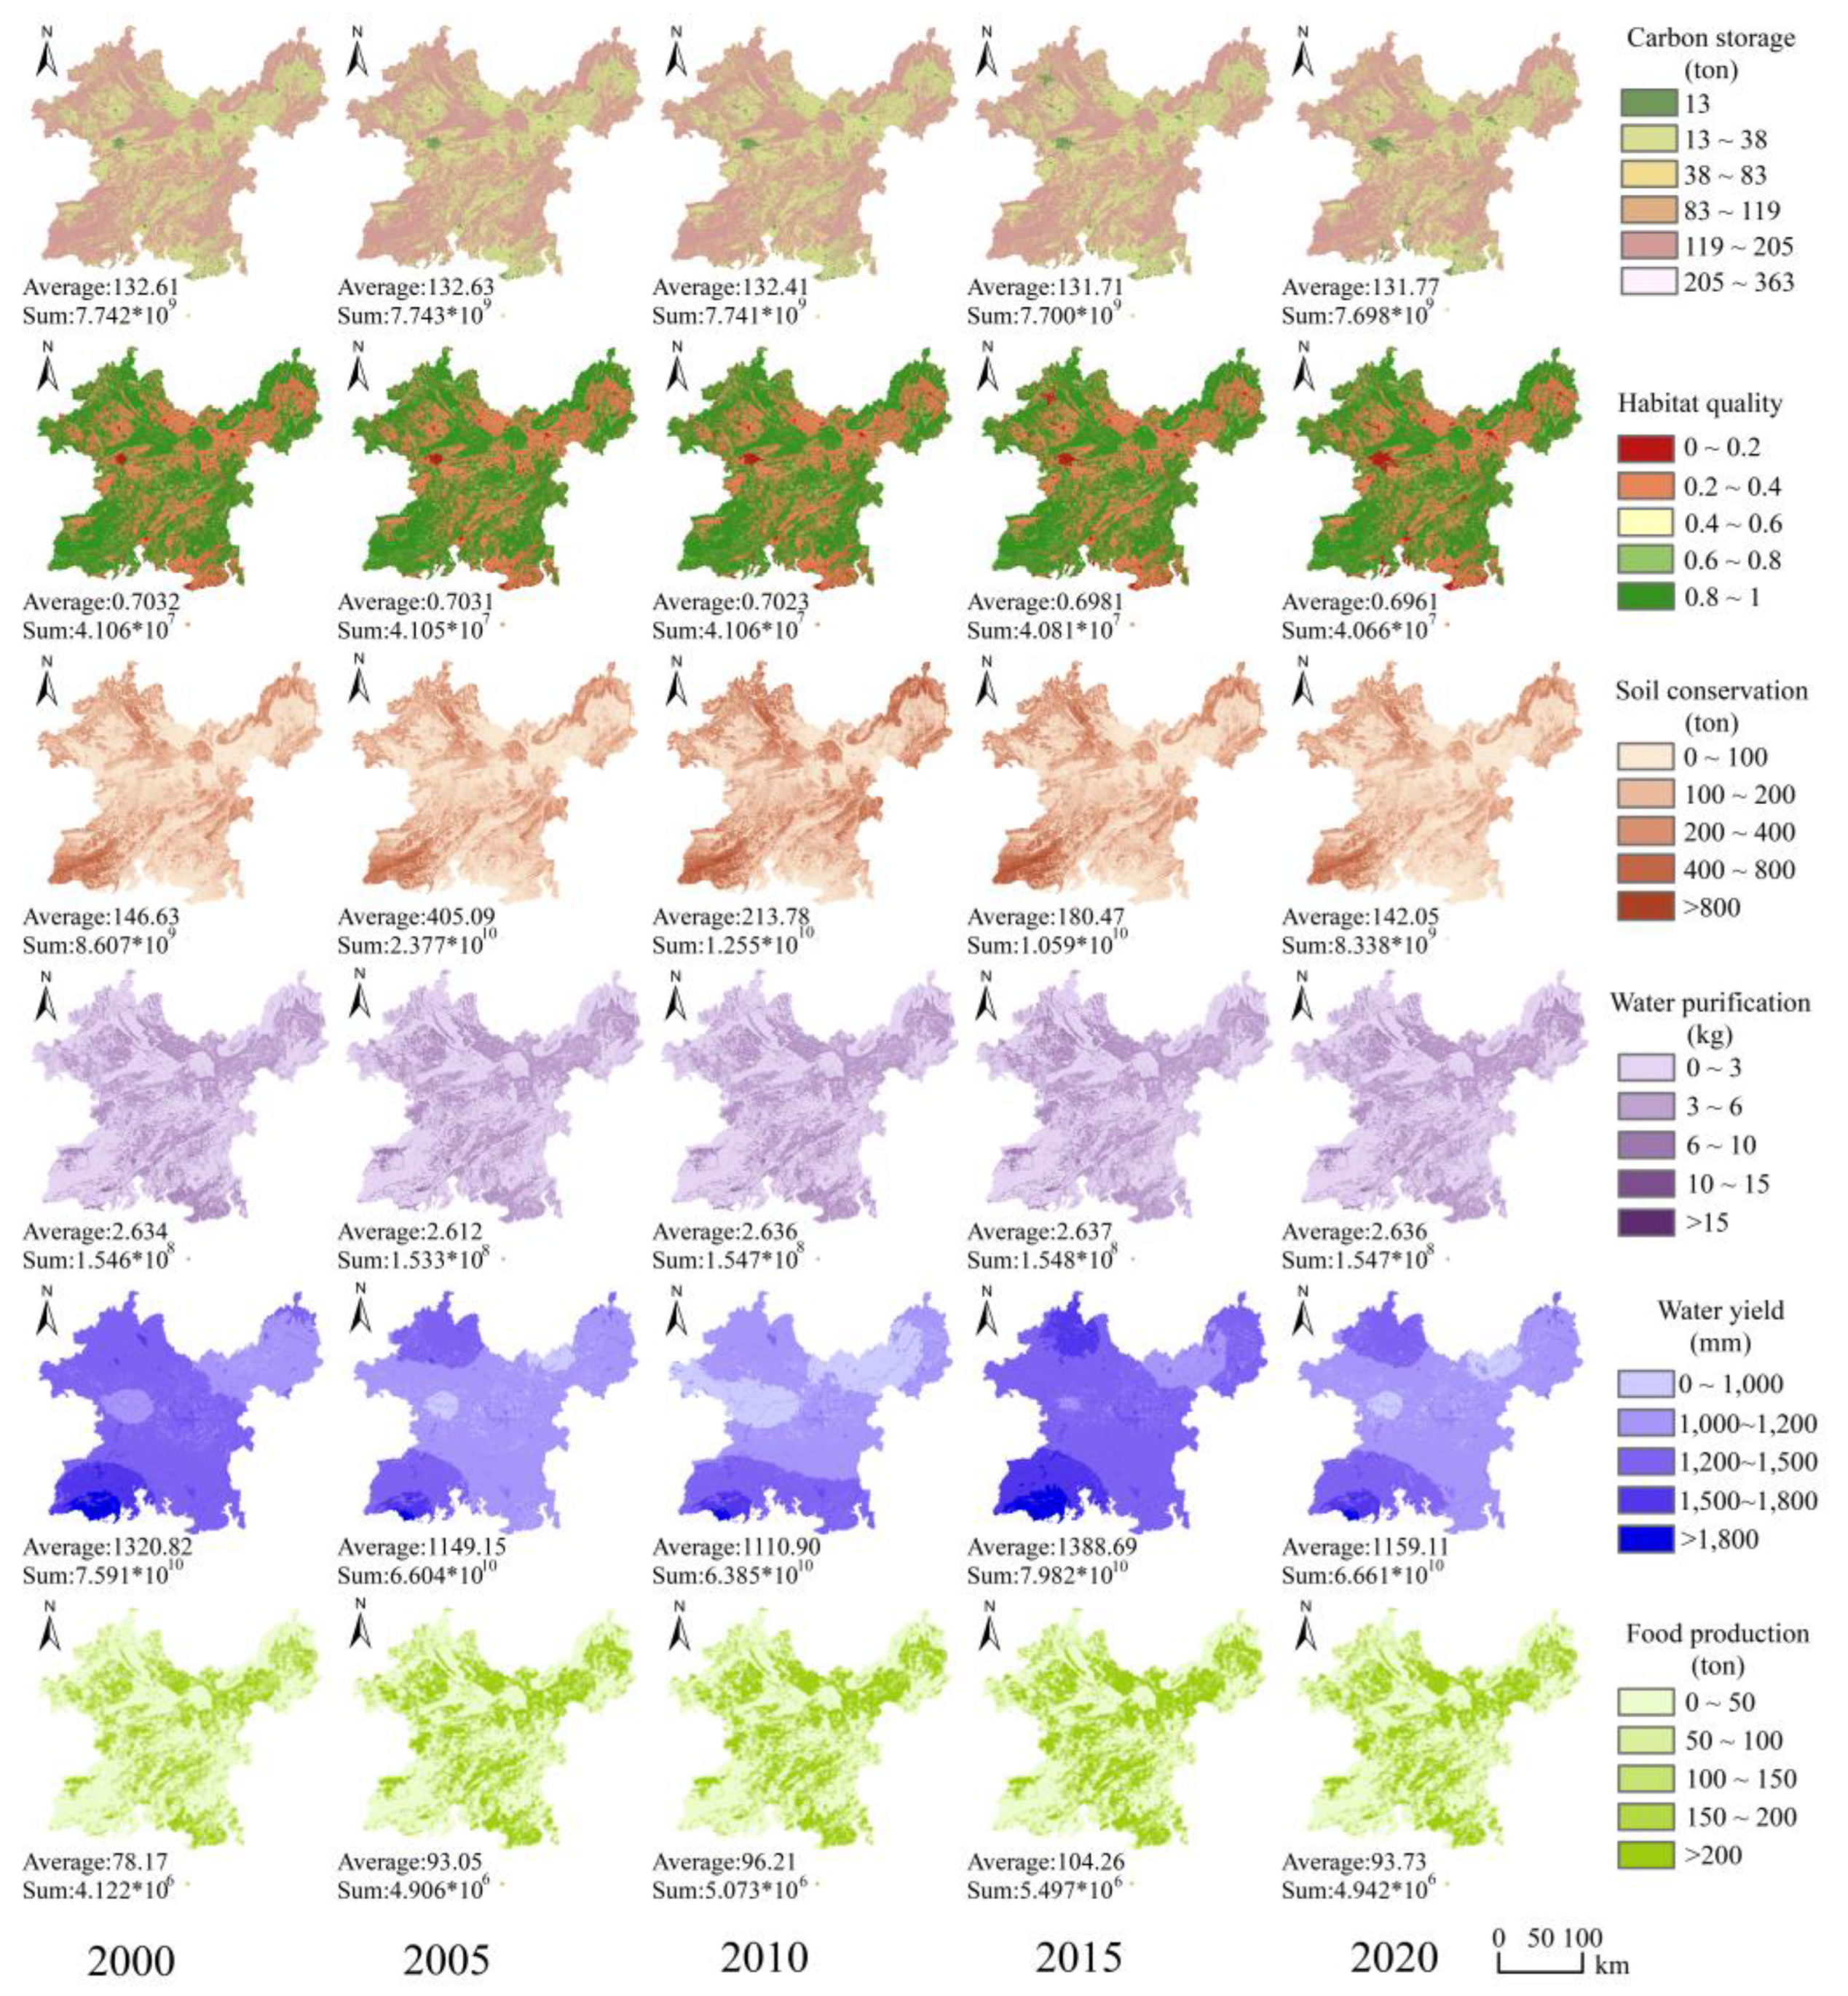
Figure 4 illustrates the temporal trends and spatial patterns of ES in PCEB from 2000 to 2020. From 2000 to 2020, all ESs generally declined. Specifically, CS, SC, and FP exhibited an increase followed by a downturn, whereas WP and WY showed a distinct decline–rise–decline pattern. HQ decreased steadily throughout the study period. Quantitatively, CS, HQ, and WP showed relatively minor changes but collectively resulted in reductions of 4.2 × 10⁷ tons in carbon sequestration, 4.0 × 10⁵ units in habitat index, and 1 × 10⁵ kg in nutrient transport. In contrast, SC and WY experienced substantial fluctuations, with a net soil loss of 2.69 × 10⁸ tons and a decrease of 8.3 × 10⁹ tons in water yield. However, FP exhibited a net increase, with grain production rising by 7.2 × 10⁵ tons. Spatially, CS and HQ displayed consistent distribution patterns, with high-value zones concentrated in the southwestern and northwestern parts of the PCEB—areas dominated by forested and mountainous landscapes. In contrast, low-value zones were observed in urban and densely built-up areas. WP and FP showed spatial differentiation from CS and HQ, forming complementary spatial patterns that reflected spatial trade-offs among ES. SC exhibited a spatial distribution similar to CS and HQ, with high-value areas concentrated in the southwest and northwest, while low-value zones extended toward the southeast and northeast. Influenced by climatic gradients, the high-value areas of WY were primarily located in the southwest, gradually decreasing toward the northeast.

3.3. Evolutionary Characteristics of ES Networks

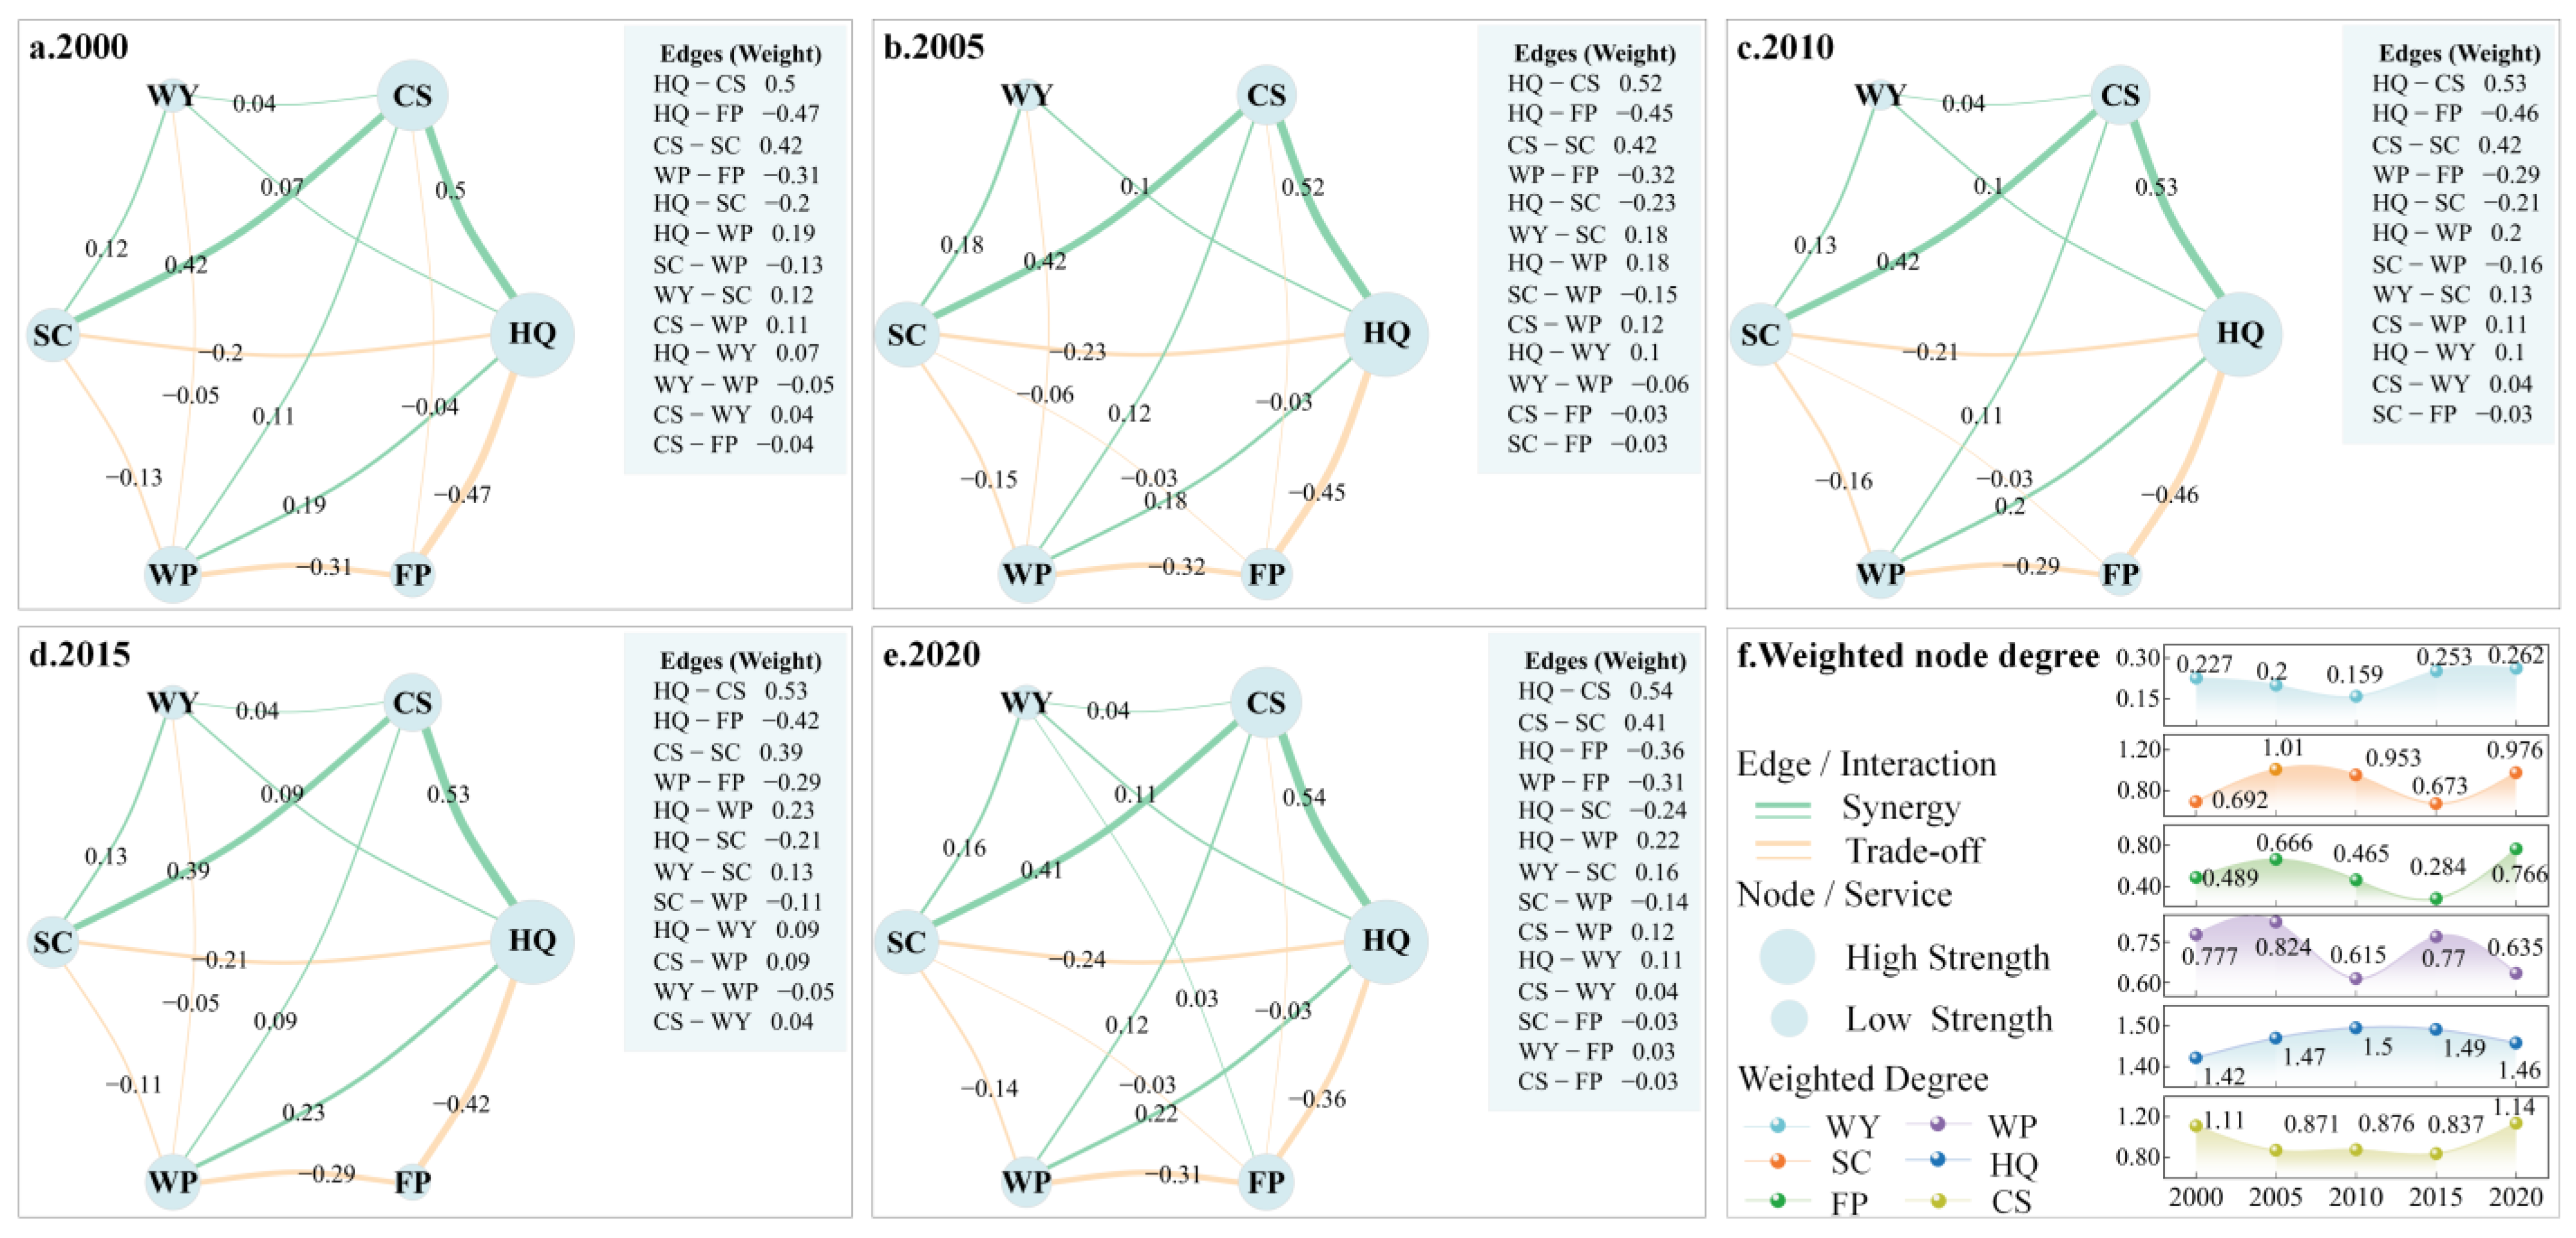
Figure 5 illustrates the overall network structure of the ES and the changes in its weighted node degrees. Between 2000 and 2020, the ES network of the PCEB maintained overall structural stability, with gradual internal adjustments that did not alter its fundamental configuration. HQ and CS consistently served as central nodes, forming the backbone of synergistic linkages, whereas FP maintained persistent trade-off relationships, particularly with WP and HQ, with a combined negative correlation strength of −0.7.
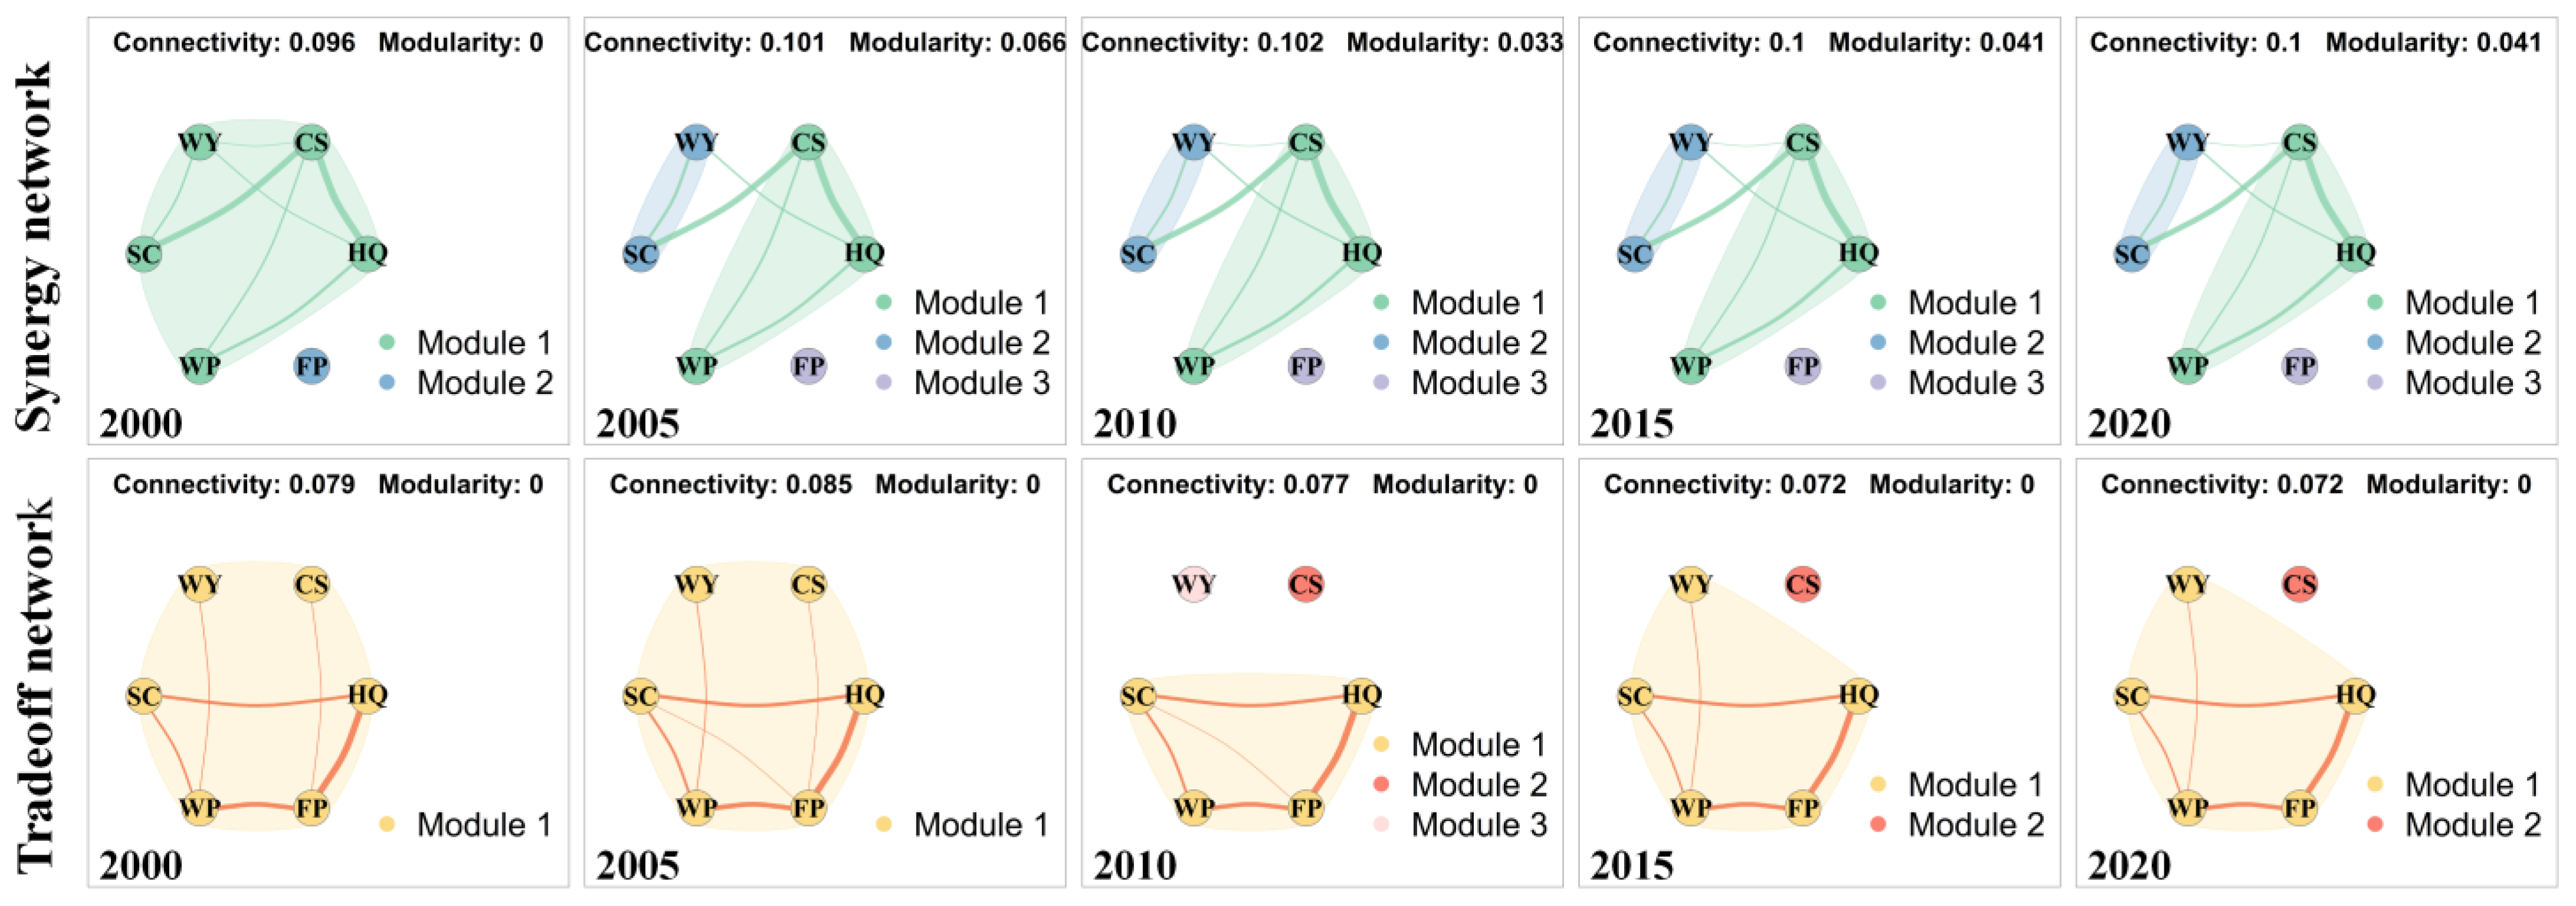
Based on the overall network analysis, the evolution of synergy and trade-off subnetworks further highlights the differentiated dynamics of ES interactions. In the synergy subnetwork, CS, HQ, SC, WP, and WY formed tightly connected cooperative clusters. Network connectivity increased steadily from 0.096 in 2000 to 0.108 in 2020, reflecting a progressive enhancement in overall network integration. Modularity exhibited an “N-shaped” trajectory, peaking at 0.066 in 2005, declining thereafter, and rising again to 0.053 by 2020, with the late-period increase indicating the emergence of more functionally independent service clusters within the network. From 2005 to 2020, three relatively stable clusters were identified: HQ–CS–WP, WY–SC, and FP. The first two clusters represented services with high internal cohesion suitable for coordinated management, whereas FP remained comparatively independent within the synergy subnetwork, suggesting differentiated management requirements.
In contrast, within the trade-off subnetwork, FP remained the dominant node with the highest degree of connections, functioning as the core driver of antagonistic interactions. The network’s connectivity declined slightly from 0.079 to 0.074 (Figure 6), remaining at a relatively low and stable level throughout the period. Its modularity remained close to zero across all years, reflecting the absence of persistent cluster formation and a more fragmented network structure compared with the synergy subnetwork. Overall, the ES network of the PCEB evolved toward a more synergistic and integrated system, characterized by strengthened cooperative relationships and spatially dispersed trade-off interactions.

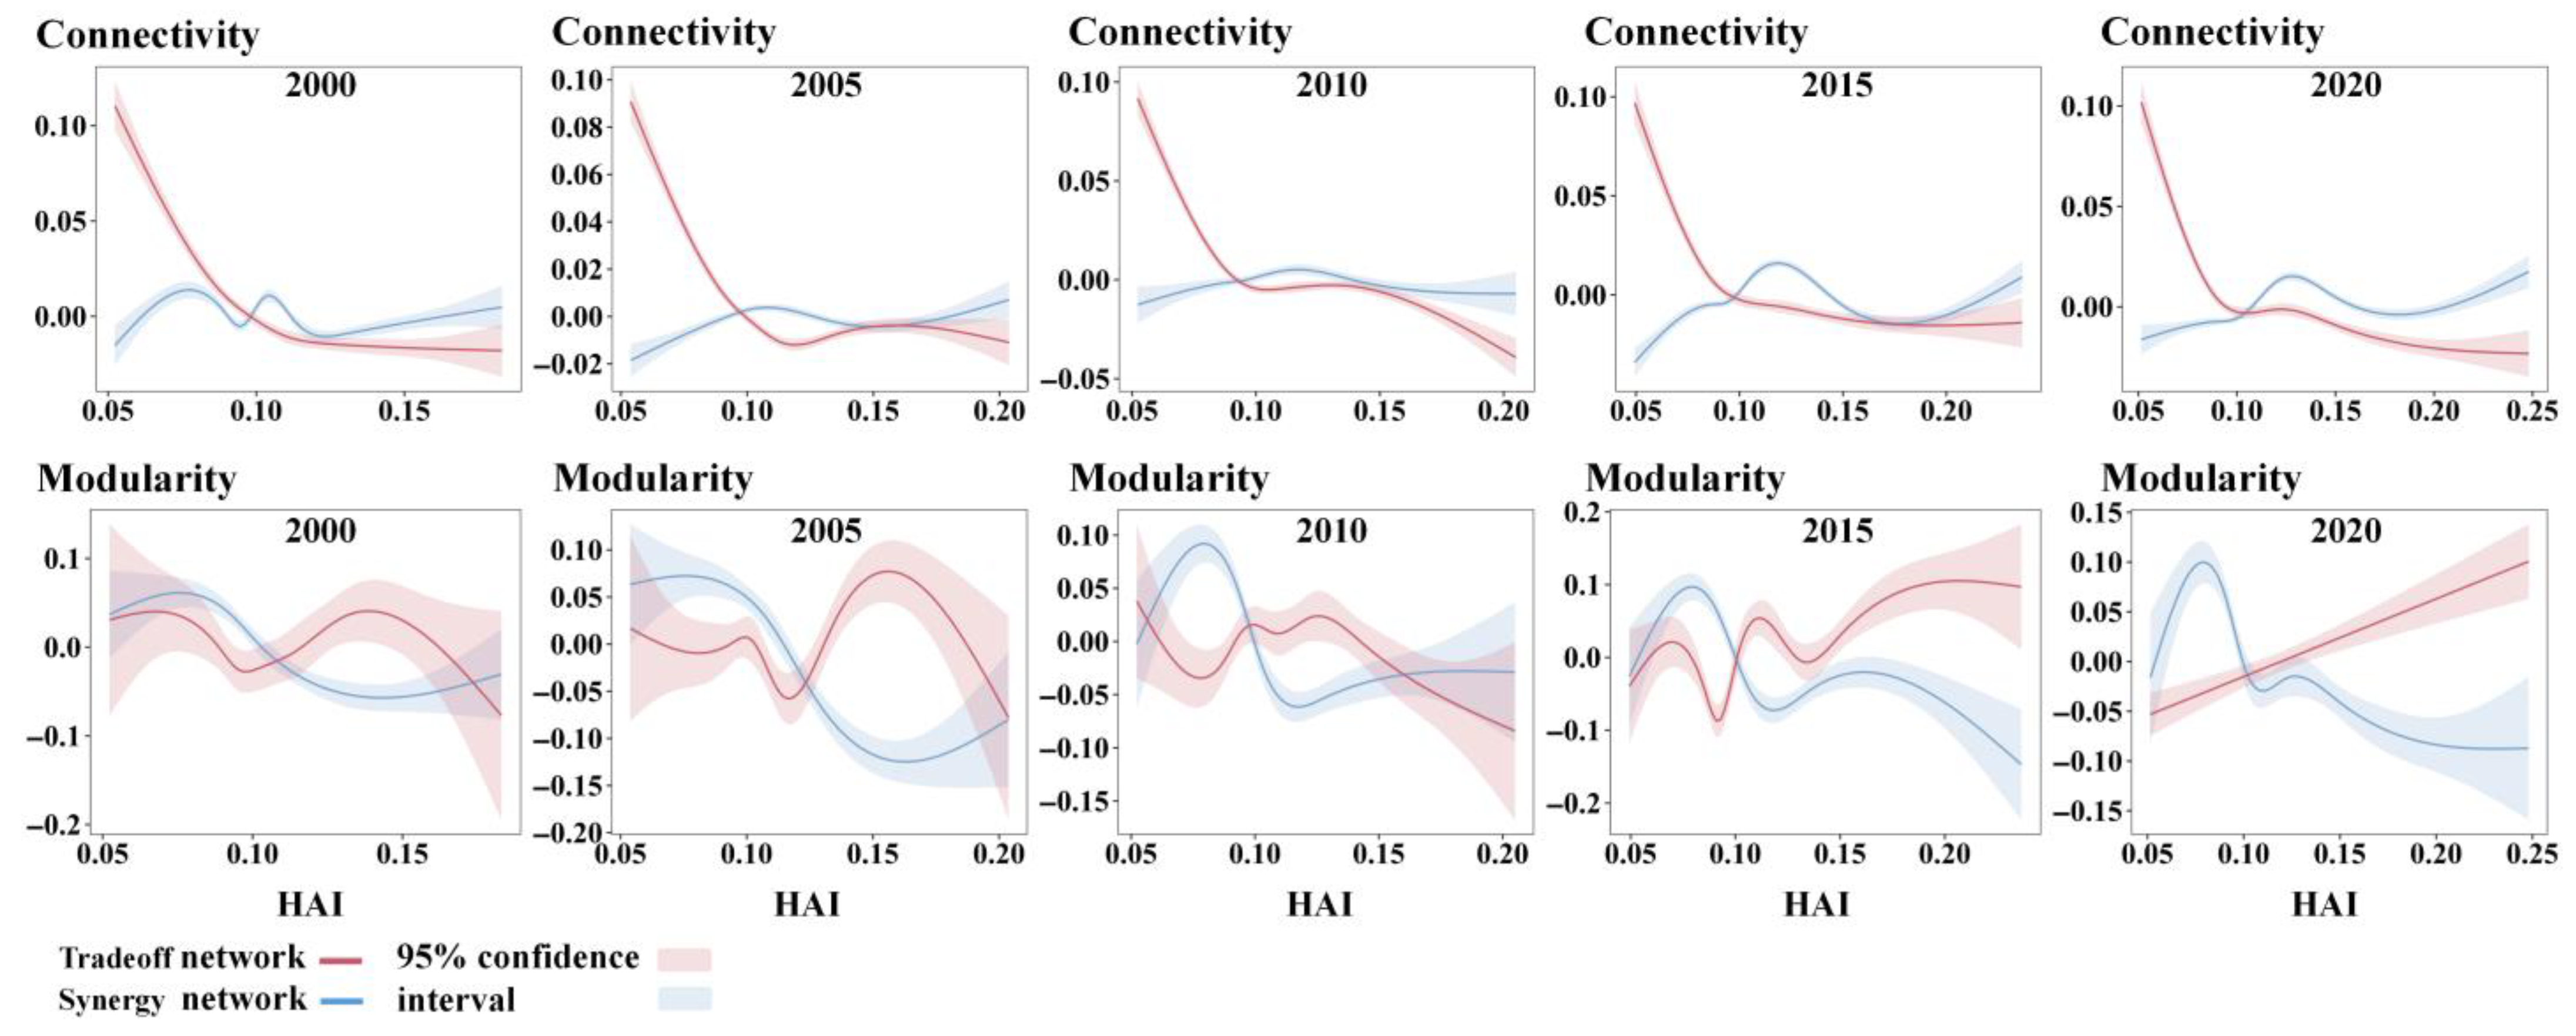
3.4. Network Response of ES Under HAI

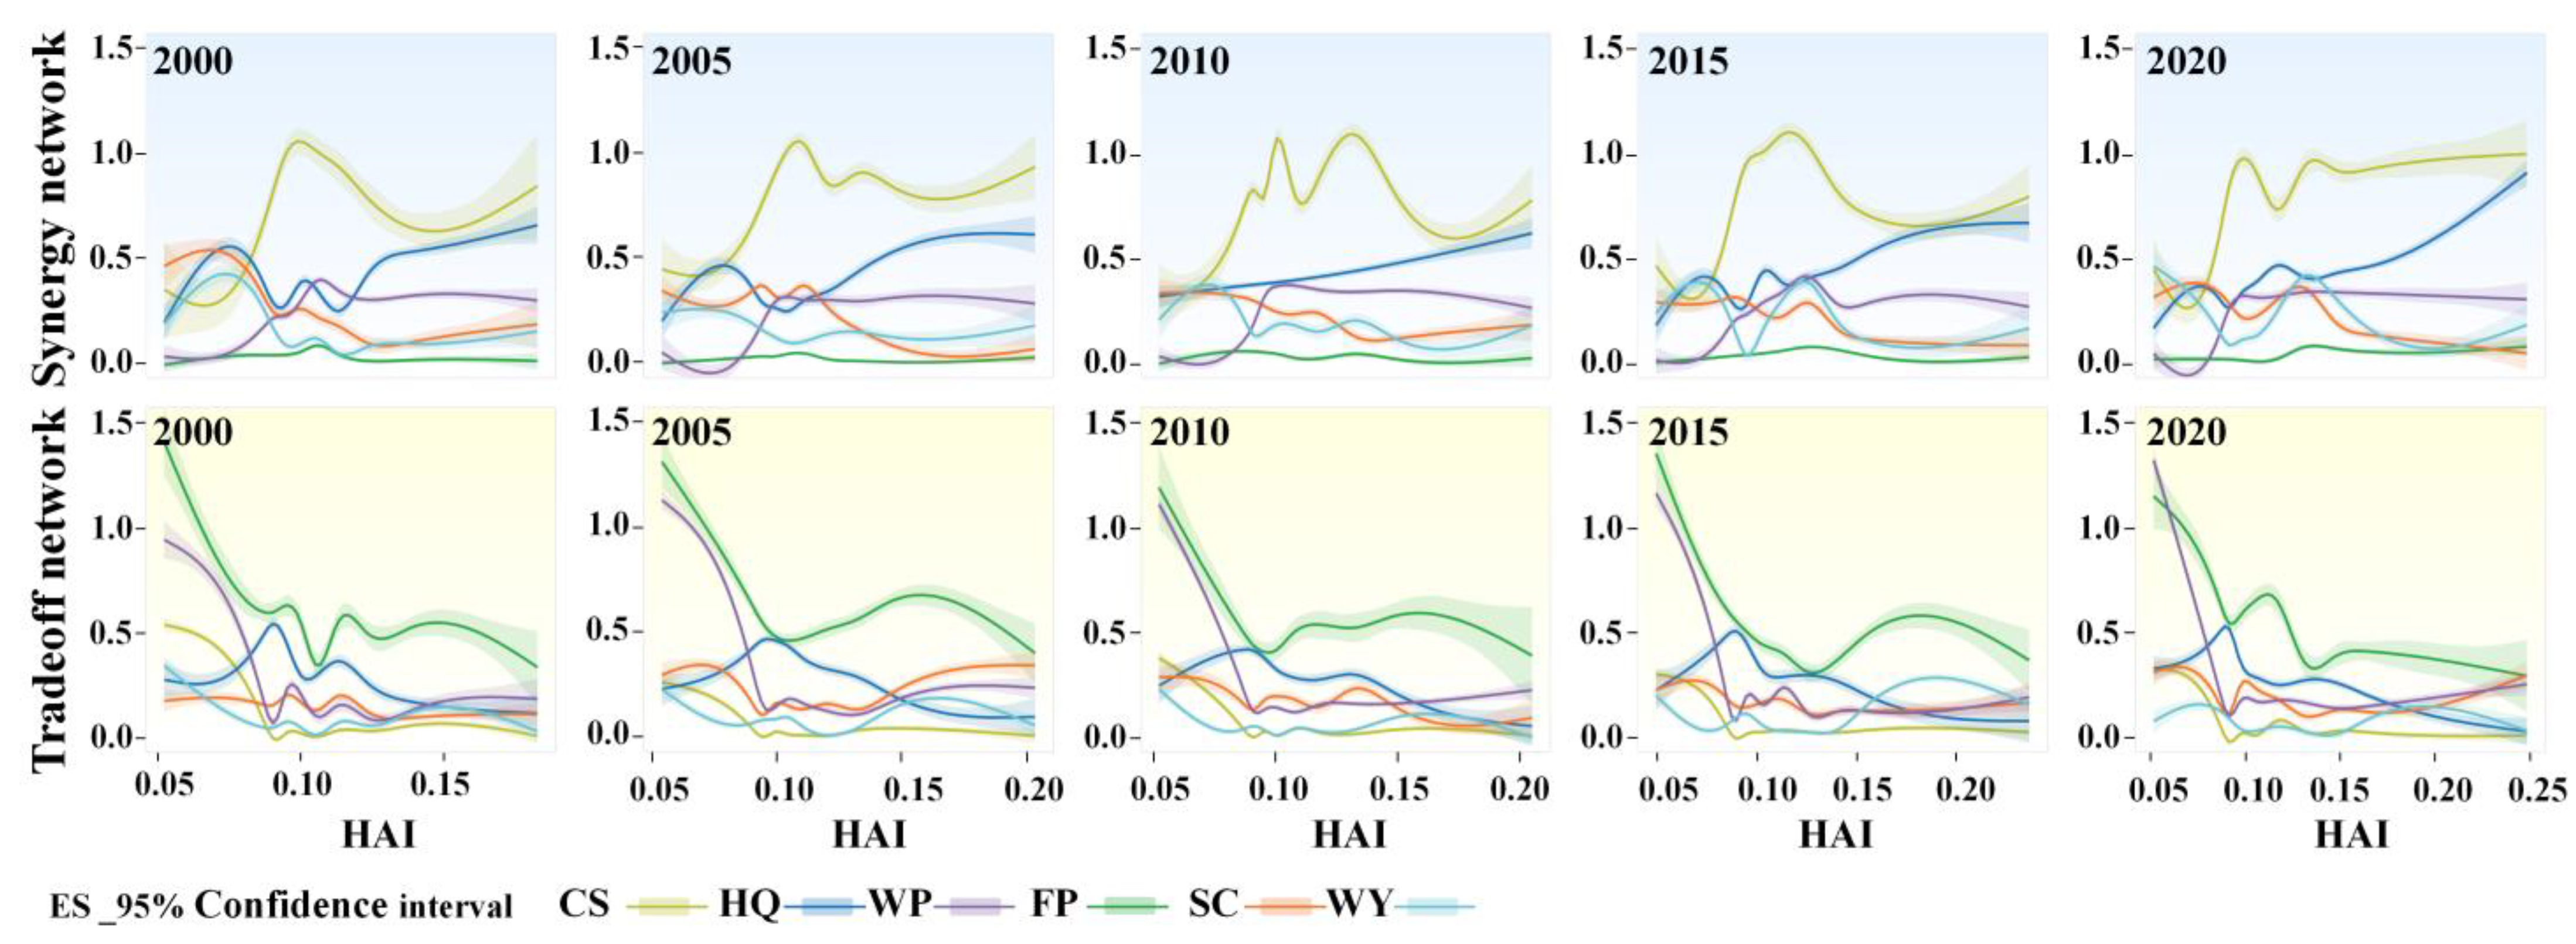
Figure 7 and Figure 8 illustrate the response of weighted node degree, connectivity, and modularity under the HAI gradient. In the synergy network, the weighted degrees of core nodes CS and HQ exhibited a distinct local maximum within the low-intensity HAI range (approximately 0.10–0.15), followed by a fluctuating decline at higher HAI levels. Other synergistic nodes exhibited similar oscillatory behavior within this range, whereas node-weight fluctuations in the trade-off network were comparatively subdued. The core node FP exhibited its highest weighted degree under low-HAI conditions (<0.10), followed by a gradual decline as HAI increased.
Throughout the study period, the trade-off network exhibited the most pronounced variation in connectivity, showing a consistent monotonic decline with increasing HAI across all years. The decrease was particularly sharp within the low-to-medium disturbance range (HAI < 0.10) and gradually leveled off at higher HAI levels, remaining persistently below the overall mean. In contrast, the synergy network maintained generally low connectivity values (<0) with limited fluctuations, yet its response patterns varied by year. In 2000, moderate HAI levels (around 0.10) induced distinct fluctuations. Between 2005 and 2010, connectivity increased progressively with rising HAI but declined again beyond a certain threshold, displaying a modest response amplitude. By 2015 and 2020, the network response became more pronounced, with connectivity in high-HAI regions showing a renewed increase.
In contrast to connectivity, modularity exhibited a more complex and nonlinear pattern of variation. From 2000 to 2005, modularity in the synergy network consistently declined with increasing HAI, indicating strengthened cross-module linkages and a gradual integration of the network structure. Since 2010, modularity in the synergy network has shown local peaks at low HAI levels (~0.10), most prominently in 2020, suggesting that mild human disturbance promotes the emergence of local clusters and strengthens internal coordination. In contrast, the trade-off network displayed markedly greater temporal and gradient-related variability. From 2000 to 2010, it followed a distinct nonlinear “peak–valley” trajectory, reaching its maximum at moderate HAI levels (~0.20–0.25) before declining sharply under high-HAI conditions (>0.25). During 2015–2020, the response pattern shifted toward a nearly monotonic increase. The coexistence of low connectivity and high modularity during this stage reflects a weakening of antagonistic interactions among clusters and a structural transition of the network toward spatial compartmentalization.

4. Discussion

4.1. Attribution of Spatiotemporal Heterogeneity in HAI

During the study period, the human activity intensity (HAI) of the PCEB exhibited a significant acceleration turning point around 2010. This temporal inflection aligns with conclusions derived from land use-based assessments, indicating that regional policy interventions exerted a decisive influence on the configuration of human activities. In particular, the implementation of the Development Plan for the Guangxi Beibu Gulf Economic Zone (2008)served as the primary institutional catalyst for the post-2010 surge and spatial restructuring of HAI [9,47]. Regarding spatial expansion modes, Nanning, as the regional political and transportation hub, displayed a corridor-type expansion along major transport axes [48]. The coastal cities of Qinzhou, Beihai, and Fangchenggang formed high-intensity clusters centered around port-industrial belts, driven by their specialized logistics and industrial functions [49]. In contrast, Guigang exhibited a concentric “ring-sprawl” mode radiating from the central urban area, reflecting the constraints of an inland-oriented economy. These patterns suggest that the evolution of HAI in the PCEB is jointly driven by the interplay of institutional planning, industrial agglomeration, and geomorphological constraints [50]. Compared with mature urban agglomerations like the Yangtze and Pearl River Deltas, the expansion of HAI in the PCEB is more strongly characterized by a policy-driven aggregation effect rather than a market-based self-organizing process [51]. In relatively underdeveloped regions, state-led spatial planning and targeted infrastructure investments preferentially attract population and capital, facilitating a state-directed spatial restructuring. Furthermore, this spatial differentiation highlights the role of karst topography as a crucial “geographical filter” [50]. While policy orientation concentrates capital in low-slope areas (e.g., river valleys and coastal plains), the rugged and fragmented karst terrain constrains high-intensity activities, creating a distinct spatial gradient. For the PCEB specifically, high-HAI zones (>0.3) correspond to densely populated urban cores, medium zones (0.15–0.30) are distributed in peri-urban transition areas, and low-HAI zones (<0.15) are concentrated in mountainous ecological forestlands [50]. Collectively, this “policy–terrain” coupling mechanism offers valuable insights into the evolution of human–environment systems under government-led regional development models [52].

4.2. The Complex Networks of ES

Through an analysis of the overall structural evolution of the ecosystem services (ESs) network, this study found that the interrelationships among ES within the study area have remained largely stable over the past two decades, without undergoing any fundamental restructuring.
At the node level, HQ was connected to all other nodes and exhibited a high weighted degree, revealing a strong structural dependency of the regional ES network. The MA framework clearly states that supporting services—such as habitat maintenance and primary productivity—form the ecological foundation upon which all other services, including regulating services like CS and SC, depend. The stability of HQ’s central role thus constitutes a critical ecological prerequisite for maintaining and optimizing the integrity of the entire ES network, particularly the synergy subnetwork. Conversely, FP serves as the dominant provider within trade-off relationships, representing a key source of tension in balancing human demand and ecological sustainability. How to maintain FP’s essential role in the regional ES framework while minimizing its trade-offs with other ecosystem functions has therefore become a major concern for contemporary policymakers seeking sustainable land management [18].
Our analysis revealed that SC exhibited trade-off relationships with FP, HQ and WP (Figure 5). However, in studies that did not control for natural background variables, HQ and SC were often identified as synergistic pairs. As noted by Bennett, interactions among ES are largely governed by shared biophysical drivers rather than direct causal relationships between services themselves [53]. Similarly, Feng demonstrated through redundancy analysis that environmental heterogeneity—such as precipitation gradients—can obscure the intrinsic trade-off between vegetation restoration and water yield on the Loess Plateau [54]. Following this reasoning, we infer that natural endowment factors shape the apparent spatial synergy between HQ and SC across the PCEB region. Once natural influences are removed, however, the residual relationship reveals the net trade-off and synergy relationships [55]. In the karst landscapes of the PCEB, the distinctive geomorphology amplifies the conflict between human intervention and ecological stability. By analyzing these “net trade-off and synergy relationships,” we can clearly reveal how FP-dominated human activities have progressively eroded the synergistic patterns established under natural conditions [55]. To simultaneously achieve the dual goals of FP and SC on steep slopes, adaptive agricultural practices—such as intercropping on cultivated forestland and contour ridge farming—have been widely adopted in karst regions of Guizhou [56,57]. While these practices alleviate soil erosion and partially reconcile the FP–SC conflict [58], they inevitably disturb surface structures and replace natural habitats [59], resulting in a decline in HQ and reinforcing the FP–SC–HQ trade-off. Overall, FP not only sustains direct trade-offs with other ESs but may also amplify inter-service trade-offs through its dominant role in shaping regional land-use intensity and ecological processes.
In terms of network evolution, our findings indicate that the regional ES network has gradually transitioned from a pattern characterized by coexisting trade-offs and synergies (characterized by intense fluctuations between antagonistic and cooperative relationships) toward one dominated by synergistic dominance (where cooperative linkages among services form the structural core). This transition is first reflected in the continuous weakening of the trade-off network’s connectivity (Figure 5 and Figure 6). Such a trend can be largely attributed to the implementation of large-scale ecological engineering programs. Similarly to findings from the Loess Plateau, where ecological restoration projects such as the Grain–for–Green program converted high-risk croplands into forests and grasslands, these measures effectively mitigated the negative pressure of FP on regulating services such as SC [54]. In the PCEB, as a result of these interventions, the edge weight of FP–SC–HQ decreased from 0.48 at the beginning of the study period to 0.36. Conversely, the connectivity and modularity of the synergy network exhibited a gradual increase (Figure 6), eventually differentiating into three major functional clusters: FP, SC–WY and HQ–CS–WP. This differentiation can be explained by the effects of spatial zoning and ecological control policies implemented in the region. Previous studies have shown that ecological zoning can reduce the risk of trade-offs among urban agglomerations by introducing physical barriers and spatial segregation [60], effectively disrupting potential negative linkages—such as disturbances arising from FP—thereby safeguarding regional synergy clusters. Furthermore, in karst landscapes, ES functions are particularly sensitive to land-use change, especially WY and SC, which are highly dependent on specific land-cover types [61]. The enforcement of ecological zoning policies has protected these sensitive habitats, thereby facilitating the formation and strengthening of karst-specific functional clusters such as SC–WY (notably, after controlling for topographic effects, SC and WY exhibited a consistent synergistic relationship). This confirms the effectiveness of zoning-based conservation in promoting spatially adaptive ecological integration. For eco-sensitive regions such as the PCEB, emphasis should be placed on differentiated zoning strategies integrated with ecological spatial restoration engineering. This approach serves to weaken the disturbances from FP on ecosystem services, which is critical for reshaping the network architecture and achieving the dual objectives of “trade-off suppression and synergy enhancement” within the regional network.

4.3. Response Characteristics of ES Networks Under HAI Gradient

After controlling for major natural background factors, this study used the HAI gradient to reveal the structural response characteristics of the ES network to anthropogenic disturbance. This approach enables a more scientific assessment of the actual ecological and environmental impacts of human activities and provides a critical basis for formulating targeted land-use and ecological restoration policies at the regional scale.
Compared with single ES indicators, the structural properties of the ES network are more sensitive in capturing the nonlinear ecological responses to variations in HAI. The analysis revealed that core nodes within the network exhibit differentiated response patterns across HAI intervals. In particular, when HAI approaches the 0.10 threshold—corresponding to the agro-ecological transition zone where agricultural and natural patches interlace—interactions among service nodes become most dynamic, and service relationships are most likely to undergo reconfiguration. As Plieninger argued, landscapes under low-intensity agricultural use often generate more complex mosaics than either pristine ecosystems or intensively cultivated lands [62]. This finding indicates that moderate levels of human disturbance are not purely destructive but, under certain conditions, can reshape the organization of ecological networks and promote the reassembly of ecosystem service relationships [22]. Therefore, identifying specific HAI thresholds is crucial for sustaining ecosystem multifunctionality. Recognizing the spatial ranges where key threshold effects occur can help policymakers design differentiated management and restoration strategies that activate potential high-supply ecological zones and enhance regional service delivery [63].
Human activities exert a pronounced dual effect on the structure and functioning of ES networks [38]. At the structural level, the connectivity of the trade-off network exhibited a significant monotonic decline as HAI intensified, indicating that intensive human disturbance weakens antagonistic linkages among ESs [64]. However, this decline does not necessarily reflect greater system stability. Instead, it is closely associated with land-use intensification and the restrictive effects of spatial planning policies. Studies have shown that rigid spatial control mechanisms—such as the over-implementation of the “Three Control Lines” policy—can reduce ecological degradation risks but often lead to functional simplification and landscape fragmentation [22,65], thereby diminishing the self-organizing capacity and resilience of ecological systems. This observation supports broader discussions on land-use intensification and network simplification: when human activities homogenize landscapes, trade-offs may diminish, but ecosystem multifunctionality and recovery potential are simultaneously lost [22]. Regulating the intensity of human activities is thus critical for preventing the functional degradation of ES networks. Although high HAI levels are inevitable in the context of rapid socioeconomic development, this does not imply that ecological degradation is unavoidable. Evidence from the Poyang Lake Eco-Economic Zone demonstrates that proactive and well-guided human interventions can effectively sustain ecological stability [38]. Consistently, our findings show that synergy network connectivity exhibited a modest recovery in high-HAI regions during 2015–2020. This pattern suggests that flexible spatial governance and ecological engineering—such as the establishment of urban ecological corridors, sponge city projects, and large-scale restoration programs—can actively supplement ecological processes, facilitating local recovery and reorganization within the synergy network [18]. Under policy-led interventions, therefore, human activities may act not only as disruptors but also as catalysts for enhancing ecological resilience and network reconfiguration.
Moreover, the modularity index reveals the stage-specific structural responses of the ES network. In regions with low-HAI (<0.10), the synergy network exhibits low modularity, indicating that highly homogeneous natural ecosystems—such as forest-dominated landscapes—are structurally integrated and functionally cohesive [22]. As HAI increases, interactions between ecological forest patches and agricultural mosaics intensify, giving rise to pronounced “local clusters.” The moderate landscape heterogeneity generated under mild disturbance promotes localized integration and functional differentiation within the synergy network. Consistent with node-level responses, this finding suggests that low to moderate human activity (HAI 0.10–0.15) can, to some extent, act as a driver of network reorganization rather than a purely destructive force.

4.4. Research Outlook and Recommendations

This study provides a novel network-based perspective to reveal how human activities systematically shape the interactions—both synergies and trade-offs—among multiple ES, The approach offers an integrated understanding of the overall functional response and structural evolution of ecosystems under anthropogenic disturbance. However, limitations exist in this research. Firstly, the current ES network was constructed using six representative services as nodes, which, although effective in capturing the dominant interaction patterns, inevitably simplifies the complexity of ecosystem functioning. Future studies could expand the node system to include additional regulating, supporting, and cultural services, and further integrate natural, socioeconomic, and policy-related variables. Such multi-layered or multiplex network models would allow for a more comprehensive exploration of the mechanisms and hierarchical dependencies underlying ES interactions. Secondly, in configuring InVEST parameters, this study adopted settings from regions with ecological and socioeconomic characteristics similar to the PCEB [34]. While the results demonstrated a high degree of consistency and robustness, incorporating field-based empirical data and localized parameter calibration would improve the spatial precision and policy relevance of model outputs. Moreover, combining remote sensing, socioeconomic surveys, and ecological monitoring data could help refine model validation and enhance the accuracy of regional ES assessments [44].
This study demonstrates that the ES network in the PCEB has undergone a progressive transition from trade-off coexistence toward synergistic integration under intensified human activities. These findings provide critical insights for developing differentiated and context-based management strategies:
(1)
Targeted regulation of FP-driven trade-offs
As the core node of the trade-off network, FP fundamentally drives conflicts such as FP–HQ–SC and FP–WP. To mitigate the nutrient load resulting from intensive FP, precision agriculture and ecological farming should be prioritized. Technologies including UAV-based variable fertilization, soil nutrient monitoring, and ecological field zoning should be promoted. Moreover, “Total Agricultural Pollution Control Zones” should be designated along the Pinglu Canal, enforcing strict limits on fertilizer and pesticide application to suppress FP–WP trade-offs [10].
(2)
Gradient-based governance for topography-constrained trade-offs
The karst terrain intensifies spatial heterogeneity and limits agricultural suitability. In steep-slope regions, ecological restoration should prioritize habitat quality (HQ), supported by government-led compensation schemes for households participating in grain-for-green programs. On moderate slopes, “eco-agricultural units” integrating micro-topographic modification and rainwater harvesting should be developed to enhance soil stability and maintain both soil conservation (SC) and FP [66,67].
(3)
Differentiated restoration focus on the agroforestry transition zone (HAI 0.10–0.15)
Network analysis identifies the agroforestry transition belt as the most dynamic zone for ES synergy and modularity reconfiguration. Restoration resources should thus prioritize this region rather than low-HAI areas. By optimizing landscape patterns, increasing forest patches, and adopting ecological intercropping, this zone can function as a synergy hotspot for maximizing ES cluster efficiency and spatial complementarity [18].
(4)
Spatial governance and network reconnection: leveraging the Pinglu Canal as an ecological reconstruction axis
While spatial zoning policies (e.g., the “Three Control Lines”) have effectively contained ecological degradation, they have also produced fragmented and isolated ecological structures. The Pinglu Canal presents an unprecedented opportunity to transform spatial segregation into ecological connectivity. A “Canal–Tributary–Hill–Bay” network should be established by [33]: (i) identifying high-HQ and high-SC patches as priority ecological nodes; (ii) constructing longitudinal and lateral corridors along waterways and hilly terrains [37]; (iii) repairing fragmented zones through greenways, riparian parks, and sponge city infrastructure.

5. Conclusions

This study analyzed the spatiotemporal evolution of the HAI and ES—including CS, HQ, SC, FP, WY, and WP—in the PCEB. Through a network-based analytical framework, it identified the key nodes and interaction patterns within the regional ES network. Furthermore, by coupling the GAM, the study revealed the nonlinear response mechanisms of the ES network under varying HAI gradients. The major findings are as follows:
(1)
The spatiotemporal evolution of human activity intensity (HAI) and the structural reorganization of the ES network in the PCEB represent a policy-driven structural response. Regional development planning, coupled with the geomorphological constraints of the karst landscape, has formed a distinctive “policy–terrain coupling” mechanism that determines the spatial concentration and expansion patterns of human activities.
(2)
HQ consistently serves as the structural core sustaining regulating services, whereas FP acts as the primary driver of key trade-offs. The ES network demonstrates an evolutionary shift from trade-off coexistence to synergy dominance, driven by ecological engineering and spatial zoning. To maintain a multi-cluster, synergistic ecological network, future spatial governance should focus on optimizing the spatial configuration of FP and mitigating its ecological pressures through spatial isolation and adaptive technologies such as ecological agriculture.
(3)
Moderate human activity (HAI 0.10–0.15) represents a threshold zone for ES network transformation in the PCEB, where mild disturbances promote service integration and synergy. However, excessive land-use intensification and rigid zoning management lead to landscape homogenization and functional simplification. Policymakers should therefore abandon overly rigid zoning frameworks, dynamically adjust spatial policies, and prioritize ecological restoration and compensation resources toward the agroforestry transition belt to activate the region’s ecological service potential.
Overall, this study advances the understanding of how human–policy–terrain feedback mechanisms shape the structure of ecosystem service networks, providing a new framework for identifying nonlinear socio-ecological responses and critical thresholds.

Supplementary Materials

The following supporting information can be downloaded at https://www.mdpi.com/article/10.3390/su18020596/s1, Table S1: Data Acquisition and Sources; Table S2: Carbon Pool Table; Table S3: Sensitivity Factor Table; Table S4: Biophysical Table; Table S5: Network metric; Table S6: GAM model Diagnostic Table. References [68,69,70,71,72,73,74,75,76,77,78] are cited in the Supplementary Materials.

Author Contributions

Conceptualization, S.W.; methodology, B.H.; software, S.W. and Z.D.; validation, S.W.; resources, B.H. and Z.D.; data curation, S.W.; writing—original draft preparation, S.W.; writing—review and editing, S.W., B.H. and J.R.; visualization, S.W.; supervision, B.H., J.R., Z.D. and J.G.; funding acquisition, B.H. and J.G. All authors have read and agreed to the published version of the manuscript.

Funding

This research was funded by Guangxi Science and Technology Major Project, Grant No. AA23062039–2.

Institutional Review Board Statement

Not applicable.

Informed Consent Statement

Not applicable.

Data Availability Statement

The original contributions presented in this study are included in the article. Further inquiries can be directed to the corresponding author.

Conflicts of Interest

The authors declare no conflicts of interest.

Abbreviations

PCEBPinglu Canal Economic Belt
ESEcosystem Service
GAMGeneralized Additive Model
HAIHuman Activity Intensity
MAMillennium Ecosystem Assessment
CSCarbon Sequestration
FPFood Production
HQHabitat Quality
SCSoil Conservation
WPWater Purification
WYWater Yield

References

  1. Costanza, R.; Kubiszewski, I.; Ervin, D.; Bluffstone, R.; Boyd, J.; Brown, D.; Chang, H.; Dujon, V.; Granek, E.; Polasky, S.; et al. Valuing ecological systems and services. F1000 Biol. Rep. 2011, 3, 14. [Google Scholar] [CrossRef]
  2. Sun, Y.; Liu, S.; Shi, F.; An, Y.; Li, M.; Liu, Y. Spatio-temporal variations and coupling of human activity intensity and ecosystem services based on the four-quadrant model on the Qinghai-Tibet Plateau. Sci. Total Environ. 2020, 743, 140721. [Google Scholar] [CrossRef]
  3. Guo, X.; Yang, C.; Wang, Z.; Wang, L. Ecosystem Services in Northeast China’s Cold Region: A Comprehensive Review of Patterns, Drivers, and Policy Responses. Sustainability 2025, 17, 7352. [Google Scholar] [CrossRef]
  4. Wang, Z.; Zhang, L.; Li, X.; Li, Y.; Fu, B. Integrating ecosystem service supply and demand into ecological risk assessment: A comprehensive framework and case study. Landsc. Ecol. 2021, 36, 2977–2995. [Google Scholar] [CrossRef]
  5. Wang, F.; Yuan, X.; Zhou, L.; Liu, S.; Zhang, M.; Zhang, D. Detecting the Complex Relationships and Driving Mechanisms of Key Ecosystem Services in the Central Urban Area Chongqing Municipality, China. Remote Sens. 2021, 13, 4248. [Google Scholar] [CrossRef]
  6. An, Q.; Yuan, X.; Zhang, X.; Yang, Y.; Chen, J.; An, J. Spatio-temporal interaction and constraint effects between ecosystem services and human activity intensity in Shaanxi Province, China. Ecol. Indic. 2024, 160, 111937. [Google Scholar] [CrossRef]
  7. Hasan, S.S.; Zhen, L.; Miah, M.G.; Ahamed, T.; Samie, A. Impact of land use change on ecosystem services: A review. Environ. Dev. 2020, 34, 100527. [Google Scholar] [CrossRef]
  8. Mao, C.; Ren, Q.; He, C.; Li, L. Coupling coordination relationship between human activities and water-related ecosystem services supply–demand in the Qinghai–Tibet Plateau. Environ. Sustain. Indic. 2025, 28, 100903. [Google Scholar] [CrossRef]
  9. Xie, Y.; Zhang, Y.; Luo, J.; Bi, L.; Tong, K. Spatiotemporal heterogeneity and influencing factors of human activity intensity in the Guangxi Beibu Gulf Zone, China. Environ. Sustain. Indic. 2024, 22, 100372. [Google Scholar] [CrossRef]
  10. Zhang, J.; Jiang, C.; Qu, J.; Wang, Y.; Shi, J.; Zhao, Y. Dynamic changes of the complex coupling relationships between ecosystem services and socio-ecological factors and the impact of human activities: Insights from network analysis. Appl. Geogr. 2025, 181, 103671. [Google Scholar] [CrossRef]
  11. Tian, C.; Lyu, K.; Feng, C.; Yao, L.; Zheng, R. Human activity-driven spatiotemporal interactions of ecosystem services in the Beijing-Tianjin-Hebei region: Insights from multi-source remote sensing data and multi-scale analysis. Environ. Sustain. Indic. 2025, 28, 100912. [Google Scholar] [CrossRef]
  12. Li, Z.; Xue, J.; Si, L.; Du, F.; Gui, J.; Zhang, B. Ecosystem services driving factors and ecological conservation pattern construction, Qinghai-Tibet Plateau. Environ. Sustain. Indic. 2024, 24, 100512. [Google Scholar] [CrossRef]
  13. Zhang, T.; Cheng, C.; Shen, S. Quantifying ecosystem quality in the Tibetan Plateau through a comprehensive assessment index. Environ. Sustain. Indic. 2024, 22, 100382. [Google Scholar] [CrossRef]
  14. Cord, A.F.; Bartkowski, B.; Beckmann, M.; Dittrich, A.; Hermans-Neumann, K.; Kaim, A.; Lienhoop, N.; Locher-Krause, K.; Priess, J.; Schröter-Schlaack, C.; et al. Towards systematic analyses of ecosystem service trade-offs and synergies: Main concepts, methods and the road ahead. Ecosyst. Serv. 2017, 28, 264–272. [Google Scholar] [CrossRef]
  15. Li, J.; Zhang, C.; Chen, X. Exploring the relative importance of socio-ecological factors to ecosystem services clusters: A support to spatially targeted management. Environ. Res. Lett. 2021, 16, 084053. [Google Scholar] [CrossRef]
  16. Raudsepp-Hearne, C.; Peterson, G.D.; Bennett, E.M. Ecosystem service bundles for analyzing tradeoffs in diverse landscapes. Proc. Natl. Acad. Sci. USA 2010, 107, 5242–5247. [Google Scholar] [CrossRef]
  17. Wang, C.; Zhao, H.; Wang, C.; Zhao, X.; He, J.; Yu, E.; Zhang, Z.; Li, Y.; Zheng, H. Driving Factors of Ecosystem Services and Their Trade-offs and Synergies in Different Land Use Functional Zones: A Case Study of Shanxi Province, China. Environ. Sustain. Indic. 2025, 24, 101011. [Google Scholar] [CrossRef]
  18. Chen, L.; Zhang, A.; Wen, L. Complex interactions of ecosystem services and their dynamic changes in response to land-use conflicts—A network analysis in the Yangtze River Economic Belt, China. Land Use Policy 2025, 155, 107582. [Google Scholar] [CrossRef]
  19. Jiang, W.; Marggraf, R. A theoretical rethinking of ecosystem services from the perspective of social-ecological system. iScience 2025, 28, 112309. [Google Scholar] [CrossRef] [PubMed]
  20. Ma, J.; Fu, X.; Song, C.; Li, Z.; Chen, L.; Zhou, M.; Huang, X. Landscape fragmentation exacerbates social-ecological system degradation in the Qinling Mountains by weakening ecosystem services. Ecol. Indic. 2025, 178, 114130. [Google Scholar] [CrossRef]
  21. Bodin, Ö.; Alexander, S.M.; Baggio, J.; Barnes, M.L.; Berardo, R.; Cumming, G.S.; Dee, L.E.; Fischer, A.P.; Fischer, M.; Mancilla Garcia, M.; et al. Improving network approaches to the study of complex social–ecological interdependencies. Nat. Sustain. 2019, 2, 551–559. [Google Scholar] [CrossRef] [PubMed]
  22. Felipe-Lucia, M.R.; Soliveres, S.; Penone, C.; Fischer, M.; Ammer, C.; Boch, S.; Boeddinghaus, R.S.; Bonkowski, M.; Buscot, F.; Fiore-Donno, A.M.; et al. Land-use intensity alters networks between biodiversity, ecosystem functions, and services. Proc. Natl. Acad. Sci. USA 2020, 117, 28140–28149. [Google Scholar] [CrossRef]
  23. He, J.; Zhou, W.; Qian, M.; Cao, A.; Zha, E.; Shi, X. Mechanisms of ecosystem function enhancement under land ecosystem restoration patterns and responses to multiple scenarios: A complex network approach. Land Use Policy 2025, 158, 107764. [Google Scholar] [CrossRef]
  24. Wu, X.; Fu, B.; Wang, S.; Song, S.; Li, Y.; Xu, Z.; Wei, Y.; Liu, J. Decoupling of SDGs followed by re-coupling as sustainable development progresses. Nat. Sustain. 2022, 5, 452–459. [Google Scholar] [CrossRef]
  25. Nassl, M.; Loffler, J. Ecosystem services in coupled social-ecological systems: Closing the cycle of service provision and societal feedback. Ambio 2015, 44, 737–749. [Google Scholar] [CrossRef]
  26. Rau, A.-L.; von Wehrden, H.; Abson, D.J. Temporal Dynamics of Ecosystem Services. Ecol. Econ. 2018, 151, 122–130. [Google Scholar] [CrossRef]
  27. Fedele, G.; Locatelli, B.; Djoudi, H.; Colloff, M.J. Reducing risks by transforming landscapes: Cross-scale effects of land-use changes on ecosystem services. PLoS ONE 2018, 13, e0195895. [Google Scholar] [CrossRef]
  28. Costanza, R.; de Groot, R.; Braat, L.; Kubiszewski, I.; Fioramonti, L.; Sutton, P.; Farber, S.; Grasso, M. Twenty years of ecosystem services: How far have we come and how far do we still need to go? Ecosyst. Serv. 2017, 28, 1–16. [Google Scholar] [CrossRef]
  29. Sun, X.; Li, Y.; Hu, Y.; Li, Y. Human and natural factors affect habitat quality in ecologically fragile areas: Evidence from Songnen Plain, China. Front. Plant Sci 2024, 15, 1444163. [Google Scholar] [CrossRef] [PubMed]
  30. Wang, Q.; Bai, X. Spatiotemporal characteristics of human activity and land use on ecosystem service functions in mountainous areas of Northeast Guizhou, Southwest China. Ecol. Eng. 2025, 212, 107473. [Google Scholar] [CrossRef]
  31. Ran, Z.; Gao, S.; Zhang, B.; Guo, C.; Ouyang, X.; Gao, J. Non-linear effects of multi-dimensional urbanization on ecosystem services in mega-urban agglomerations and its threshold identification. Ecol. Indic. 2023, 154, 110846. [Google Scholar] [CrossRef]
  32. Zhao, X.X.; Yu, J.N.; Zhou, Y. Construction and key area identification of ecosystem service supply networks based on complex networks:a case study of Hubei Province. Acta. Ecol. Sin. 2024, 44, 9610–9625. (In Chinese) [Google Scholar] [CrossRef]
  33. Wen, S.Q.; Hu, B.Q.; Xie, W.W.; Gao, C.L. Land Use Scenario Simulation and Habitat Quality Change in Pinglu River EconomicBelt Based on PLUS-InVEST Model. Environ. Sci. 2025, 46, 5122–5133. (In Chinese) [Google Scholar] [CrossRef]
  34. Gao, C.; Hu, B.; Wang, Z.; Huang, S.; Zhang, L. Study on spatiotemporal changes of ecosystem service trade-offs/synergies and driving mechanisms in the key zone of mountain-river-sea coupling: A case study of the southwest Guangxi Karst-Beibu Gulf. Ecol. Indic. 2024, 169, 112892. [Google Scholar] [CrossRef]
  35. Guo, Y.; Liu, Y.; Li, W.; Cai, X.; Liu, X.; Liao, H. Multi-Scale Impacts of Land Use Change on River Water Quality in the Xinxian River, Yangtze River Basin. Water 2025, 17, 1541. [Google Scholar] [CrossRef]
  36. Cao, Y.; Su, K.; You, Y.; Jiang, X.; Li, C.; Chen, J. Pinglu Canal Construction and Its Impact on Wildlife Habitat Connectivity: A Multi-Species Network Analysis and Ecological Restoration Strategy. Land 2025, 14, 150. [Google Scholar] [CrossRef]
  37. Dang, Z.; Hu, B.; Gao, C.; Wen, S.; Ren, J.; Liang, Y. Construction and Optimization of the Ecological Security Pattern of Pinglu Canal Economic Zone Based on the InVEST-Circuit Theory Model. Land 2025, 14, 1103. [Google Scholar] [CrossRef]
  38. Lu, Q.; Fan, H.; Zhang, F.; Chen, W.; Xia, Y.; Yan, B. The dominant role of human activity intensity in spatial pattern of ecosystem health in the Poyang Lake ecological economic zone. Ecol. Indic. 2024, 166, 112347. [Google Scholar] [CrossRef]
  39. Liu, H.; Cheng, Y.; Liu, Z.; Li, Q.; Zhang, H.; Wei, W. Conflict or Coordination? The Spatiotemporal Relationship Between Humans and Nature on the Qinghai-Tibet Plateau. Earth’s Future 2023, 11, e2022EF003452. [Google Scholar] [CrossRef]
  40. Dou, H.; Li, X.; Li, S.; Dang, D. How to Detect Scale Effect of Ecosystem Services Supply? A Comprehensive Insight from Xilinhot in Inner Mongolia, China. Sustainability 2018, 10, 3654. [Google Scholar] [CrossRef]
  41. Chen, H.; Yan, W.; Li, Z.; Wende, W.; Xiao, S.; Wan, S.; Li, S. Spatial patterns of associations among ecosystem services across different spatial scales in metropolitan areas: A case study of Shanghai, China. Ecol. Indic. 2022, 136, 108682. [Google Scholar] [CrossRef]
  42. Wang, Z.; Fu, B.; Wu, X.; Wang, S.; Li, Y.; Zhang, L.; Chen, N.; Wu, X. Exploring the interdependencies of ecosystem services and social-ecological factors on the Loess Plateau through network analysis. Sci. Total Environ. 2025, 960, 178362. [Google Scholar] [CrossRef]
  43. Egerer, M.; Anderson, E. Social-Ecological Connectivity to Understand Ecosystem Service Provision across Networks in Urban Landscapes. Land 2020, 9, 530. [Google Scholar] [CrossRef]
  44. Hu, B.; Wu, H.; Li, Z.; Jing, H.; Zheng, Z.; Han, H.; Cheng, X.; Kang, F. Aridification weakens ecosystem services by reducing complexity and stability of socio-ecological networks. J. Clean. Prod. 2023, 387, 135823. [Google Scholar] [CrossRef]
  45. Liu, X.; Guo, Q.X. Landscape pattern in Northeast China based on moving window method. Ying Yong Sheng Tai Xue Bao = J. Appl. Ecol. 2009, 20, 1415–1422. [Google Scholar]
  46. Li, D.K.; Ding, S.Y.; Liang, G.F.; Zhao, Q.H.; Tang, Q.; Kong, L.H. Landscape heterogeneity of mountainous and hilly area in the western Henan Province based onmoving window method. Acta Ecol. Sin. 2014, 34, 3414–3424. (In Chinese) [Google Scholar] [CrossRef]
  47. Yang, Y.; Chen, J.; Lan, Y.; Zhou, G.; You, H.; Han, X.; Wang, Y.; Shi, X. Landscape Pattern and Ecological Risk Assessment in Guangxi Based on Land Use Change. Int. J. Environ. Res. Public Health 2022, 19, 1595. [Google Scholar] [CrossRef]
  48. Xu, L.; Xu, H.; Wang, T.; Yue, W.; Deng, J.; Mao, L. Measuring Urban Spatial Activity Structures: A Comparative Analysis. Sustainability 2019, 11, 7085. [Google Scholar] [CrossRef]
  49. Sun, Y.G.; Zhao, D.Z.; Gao, Y.; Su, X.; Wei, B.Q.; Zhang, F.S.; Gao, S.G.; Zhang, Y.L. Evaluation method of human activity intensity based on remote sensing—A case study in Beihai, Guangxi coastal zone. Mar. Environ. Sci. 2014, 33, 407–411+424. (In Chinese) [Google Scholar] [CrossRef]
  50. Chen, C.; Xu, Y. Spatial heterogeneity of human activities and its driving factors in karst areas of Southwest China over the past 20 years. Front. Environ. Sci. 2023, 11, 1225888. [Google Scholar] [CrossRef]
  51. Yin, H.; Zhu, Z.; Pan, L.; Zhu, F.; Wu, X. Research on Spatial–Temporal Coupling and Driving Factors of Regional Economic Resilience and Port Logistics: Empirical Evidence from Southern Guangxi, China. Systems 2025, 13, 524. [Google Scholar] [CrossRef]
  52. Yang, Y.; Zhu, X. Distribution and Change Characteristics of Ecosystem Services in Highly Urbanized Areas along Gradients of Human Activity Intensity: A Case Study of Shenzhen City, China. Sustainability 2024, 16, 2543. [Google Scholar] [CrossRef]
  53. Bennett, E.M.; Peterson, G.D.; Gordon, L.J. Understanding relationships among multiple ecosystem services. Ecol. Lett. 2009, 12, 1394–1404. [Google Scholar] [CrossRef]
  54. Feng, Q.; Zhao, W.; Fu, B.; Ding, J.; Wang, S. Ecosystem service trade-offs and their influencing factors: A case study in the Loess Plateau of China. Sci. Total Environ. 2017, 607–608, 1250–1263. [Google Scholar] [CrossRef]
  55. Zuo, L.; Jiang, Y.; Gao, J.; Du, F.; Zhang, Y. Separating the effects of two dimensions on ecosystem services: Environmental variables and net trade-offs. J. Geogr. Sci 2023, 33, 845–863. [Google Scholar] [CrossRef]
  56. Xu, G.; Xiong, K.; Shu, T.; Shi, Y.; Chen, L.; Zheng, L.; Fan, H.; Zhao, Z.; Yang, Z. Bundling evaluating changes in ecosystem service under karst rocky desertification restoration: Projects a case study of Huajiang-Guanling, Guizhou province, Southwest China. Environ. Earth Sci. 2022, 81, 302. [Google Scholar] [CrossRef]
  57. Han, H.-Q.; Liu, Y.; Gao, H.-J.; Zhang, Y.-J.; Wang, Z.; Chen, X.-Q. Tradeoffs and synergies between ecosystem services: A comparison of the karst and non-karst area. J. Mt. Sci. 2020, 17, 1221–1234. [Google Scholar] [CrossRef]
  58. Guo, T.T.; Ding, H.W.; Zhang, H.; Zeng, Z.X.; Liu, X.L. Research and prospects on ecosystem services and trade-offs/syner-gies relationships in the karst regions of southwestern China. J. Nat. Resour. 2024, 39, 1384–1398. (In Chinese) [Google Scholar] [CrossRef]
  59. Han, H.; Yin, C.; Zhang, C.; Gao, H.; Bai, Y. Response of trade-offs and synergies between ecosystem services and land use change in the Karst area. Trop. Ecol. 2019, 60, 230–237. [Google Scholar] [CrossRef]
  60. Jiang, B.; Wang, X.Y.; Yang, M.F.; Cai, J.Z. Application of ecosystem services research on a protection effectiveness evaluation of the ecological redline policy. Acta Ecol. Sin. 2019, 39, 3365–3371. (In Chinese) [Google Scholar] [CrossRef]
  61. Peng, J.; Tian, L.; Zhang, Z.; Zhao, Y.; Green, S.M.; Quine, T.A.; Liu, H.; Meersmans, J. Distinguishing the impacts of land use and climate change on ecosystem services in a karst landscape in China. Ecosyst. Serv. 2020, 46, 101199. [Google Scholar] [CrossRef]
  62. Plieninger, T.; Bieling, C.; Fagerholm, N.; Byg, A.; Hartel, T.; Hurley, P.; López-Santiago, C.A.; Nagabhatla, N.; Oteros-Rozas, E.; Raymond, C.M.; et al. The role of cultural ecosystem services in landscape management and planning. Curr. Opin. Environ. Sustain. 2015, 14, 28–33. [Google Scholar] [CrossRef]
  63. Li, D.; Cao, W.; Dou, Y.; Wu, S.; Liu, J.; Li, S. Non-linear effects of natural and anthropogenic drivers on ecosystem services: Integrating thresholds into conservation planning. J. Environ. Manag. 2022, 321, 116047. [Google Scholar] [CrossRef] [PubMed]
  64. Zhao, T.; Pan, J.; Bi, F. Can human activities enhance the trade-off intensity of ecosystem services in arid inland river basins? Taking the Taolai River asin as an example. Sci. Total Environ. 2023, 861, 160662. [Google Scholar] [CrossRef]
  65. Bai, Y.; Wong, C.P.; Jiang, B.; Hughes, A.C.; Wang, M.; Wang, Q. Developing China’s Ecological Redline Policy using ecosystem services assessments for land use planning. Nat. Commun. 2018, 9, 3034. [Google Scholar] [CrossRef] [PubMed]
  66. Qiu, S.; Peng, J.; Zheng, H.; Xu, Z.; Meersmans, J. How can massive ecological restoration programs interplay with social-ecological systems? A review of research in the South China karst region. Sci. Total Environ. 2022, 807, 150723. [Google Scholar] [CrossRef]
  67. Wang, K.; Zhang, C.; Chen, H.; Yue, Y.; Zhang, W.; Zhang, M.; Qi, X.; Fu, Z. Karst landscapes of China: Patterns, ecosystem processes and services. Landsc. Ecol. 2019, 34, 2743–2763. [Google Scholar] [CrossRef]
  68. Sannigrahi, S.; Zhang, Q.; Joshi, P.K.; Sutton, P.C.; Keesstra, S.; Roy, P.S.; Pilla, F.; Basu, B.; Wang, Y.; Jha, S.; et al. Examining effects of climate change and land use dynamic on biophysical and economic values of ecosystem services of a natural reserve region. J. Clean. Prod. 2020, 257, 120424. [Google Scholar] [CrossRef]
  69. Redhead, J.W.; Stratford, C.; Sharps, K.; Jones, L.; Ziv, G.; Clarke, D.; Oliver, T.H.; Bullock, J.M. Empirical validation of the InVEST water yield ecosystem service model at a national scale. Sci. Total Environ. 2016, 569–570, 1418–1426. [Google Scholar] [CrossRef]
  70. Zhang, L.; Dawes, W.R.; Walker, G.R. Response of mean annual evapotranspiration to vegetation changes at catchment scale. Water Resour. Res. 2001, 37, 701–708. [Google Scholar] [CrossRef]
  71. Wang, Z.; Li, X.; Mao, Y.; Li, L.; Wang, X.; Lin, Q. Dynamic simulation of land use change and assessment of carbon storage based on climate change scenarios at the city level: A case study of Bortala, China. Ecol. Indic. 2022, 134, 108499. [Google Scholar] [CrossRef]
  72. Nel, L.; Boeni, A.F.; Prohászka, V.J.; Szilágyi, A.; Tormáné Kovács, E.; Pásztor, L.; Centeri, C. InVEST Soil Carbon Stock Modelling of Agricultural Landscapes as an Ecosystem Service Indicator. Sustainability 2022, 14, 9808. [Google Scholar] [CrossRef]
  73. Berta Aneseyee, A.; Noszczyk, T.; Soromessa, T.; Elias, E. The InVEST Habitat Quality Model Associated with Land Use/Cover Changes: A Qualitative Case Study of the Winike Watershed in the Omo-Gibe Basin, Southwest Ethiopia. Remote Sens. 2020, 12, 1103. [Google Scholar] [CrossRef]
  74. Ganasri, B.P.; Ramesh, H. Assessment of soil erosion by RUSLE model using remote sensing and GIS–A case study of Nethravathi Basin. Geosci. Front. 2016, 7, 953–961. [Google Scholar] [CrossRef]
  75. Chen, Z.; Gao, X.; Liu, Z.; Chen, K. Spatiotemporal Variation of Soil Erosion Characteristics in the Qinghai Lake Basin Based on the InVEST Model. Int. J. Environ. Res. Public Health 2023, 20, 4728. [Google Scholar] [CrossRef]
  76. Redhead, J.W.; May, L.; Oliver, T.H.; Hamel, P.; Sharp, R.; Bullock, J.M. National scale evaluation of the InVEST nutrient retention model in the United Kingdom. Sci. Total Environ. 2018, 610–611, 666–677. [Google Scholar] [CrossRef]
  77. Dong, D.; Zhang, R.; Guo, W.; Gong, D.; Zhao, Z.; Zhou, Y.; Xu, Y.; Fujioka, Y. Assessing Spatiotemporal Dynamics of Net Primary Productivity in Shandong Province, China (2001–2020) Using the CASA Model and Google Earth Engine: Trends, Patterns, and Driving Factors. Remote Sens. 2025, 17, 488. [Google Scholar] [CrossRef]
  78. Vannoppen, A.; Gobin, A. Estimating Farm Wheat Yields from NDVI and Meteorological Data. Agronomy 2021, 11, 946. [Google Scholar] [CrossRef]
Figure 1. Profile of study area.
Sustainability 18 00596 g001
Figure 2. Study framework.
Sustainability 18 00596 g002
Figure 3. Spatial–temporal patterns of HAI. HAI gird changes (a), HAI spatial distribution (b) and HAI number of grid cells change (c).
Sustainability 18 00596 g003
Figure 4. Spatial–temporal patterns of ES.
Sustainability 18 00596 g004
Figure 5. Network structure characteristics and weighted node degree changes in PCEB from 2000 to 2020. Changes in edges between ES and node centrality (ae), Changes in weighted node degree of ES (f).
Sustainability 18 00596 g005
Figure 6. Characteristics of connectivity and modularity in PCEB trade-offs and synergistic networks from 2000 to 2020. Note: The green lines represent synergistic connections, while the red lines represent trade-off connections. The thickness of the lines indicates the strength of the relationship.
Sustainability 18 00596 g006
Figure 7. Response of weighted node degree for ES in PCEB to HAI from 2000 to 2020.
Sustainability 18 00596 g007
Figure 8. Response of connectivity and modularity in trade-off/synergy networks under HAI gradients from 2000 to 2020.
Sustainability 18 00596 g008
Disclaimer/Publisher’s Note: The statements, opinions and data contained in all publications are solely those of the individual author(s) and contributor(s) and not of MDPI and/or the editor(s). MDPI and/or the editor(s) disclaim responsibility for any injury to people or property resulting from any ideas, methods, instructions or products referred to in the content.