Article

CO2 Emissions Scenarios in the European Union—The Urgency of Carbon Capture and Controlled Economic Growth


Energy and CO2 Research Group, Department of Mechanical Engineering, Aragon Institute of Engineering Research (I3A), Universidad de Zaragoza, 50018 Zaragoza, Spain
Sustainability 2026, 18(2), 1043; https://doi.org/10.3390/su18021043
Submission received: 28 November 2025 / Revised: 7 January 2026 / Accepted: 14 January 2026 / Published: 20 January 2026
(This article belongs to the Section Energy Sustainability)

Abstract

Although greenhouse gas emissions have significantly reduced, the European Union still faces a major challenge in meeting its 2050 net-zero goal set under the European Green Deal. Focusing on the impacts of population, economic output, and carbon intensity of economy, this study employs Index Decomposition Analysis to estimate the reductions in carbon intensity needed to reach this target. The findings show that the extent of the technical effort required for decarbonization is much influenced by economic expansion. Under a 3% annual Gross Domestic Product growth scenario, the EU’s carbon intensity of economy must decline by 11.8% per year, which is a particularly demanding rate given the already low baseline. The decomposition also quantifies the technological challenge: under high growth, up to 5867 MtCO2 in reductions would be needed by 2050 (compared with 1990), with Carbon Capture and Storage (CCS) contributing only 10–15%. In contrast, in zero- or negative-growth scenarios, required reductions fall to 4923–4594 MtCO2, with CCS accounting for up to 50–90%. These results show that decarbonization in EU industrial sectors requires systemic transformations and strategic CCS deployment. A balanced approach, limiting economic growth and increasing innovation, appears essential to achieve the climate neutrality target.

1. Introduction

The European Union (EU) has established ambitious climate targets under its European Green Deal [1] aiming a 55% decrease in greenhouse gas emissions by 2030 relative to 1990 levels and net-zero emissions by 2050. These targets are supported by policies such as the strong push for renewable energy, with the European Union (EU) aiming for 40% of its energy consumption to come from renewables by 2030 and the EU Emissions Trading System (ETS), which incentivizes emission reductions. Between 1990 and 2023 [2], the EU made significant progress, lowering its greenhouse gas emissions by almost 40%. But it needs to keep working to reach the 2050 targets, particularly given that some industries still face high emissions.
While this study is on EU emissions, it is vital to emphasize that, despite the EU’s progress, global cooperation is still absolutely necessary to combat climate change efficiently. Major emitters like China (31.9%), the United States (13.2%), and India (8.0%) have a much greater part; the EU-27 emissions constitute about 6–7% of world CO2 emissions [3]. Meeting worldwide climate objectives calls for the combined efforts of every country, particularly non-EU nations. Although the EU is making good strides, its capacity to meet long-term objectives will be compromised if other main economies, especially developing countries, do not drastically control their emissions. This worldwide issue calls for a coordinated strategy to guarantee everyone’s sustainable future.
To better understand the factors underlying emission trends across countries, an analysis covering the top ten emitting economies between 1971 and 2012 found that, from a global perspective, GDP per capita, energy intensity, and population were the most influential driving forces [4]. Particularly, the primary causes of rising emissions differed by nation: GDP growth was the primary driver in the United States, Canada, and India; energy intensity in Korea and Brazil; carbon intensity in China; and population in Russia, Japan, and Iran [4]. This analysis was conducted using the Kaya Identity, a widely applied framework for examining CO2 intensity trends. The Kaya Identity decomposes aggregate CO2 emissions into four key components, population (a social factor), GDP per capita (economic growth), energy intensity, and carbon intensity (technological variables), thus providing a structured and valuable tool for forecasting emission trajectories [5].
From 1990 to 2018, an examination for the EU shows converging toward a shared decarbonization path. Still, the elements linked to energy efficiency and reliance on fossil fuel show the lowest convergence speeds and greatest half-life values, which helps to confirm that these technical changes pose the most major hurdles for EU members in reaching carbon neutrality [6]. In general, OECD areas have shown a good trend defined by a continued drop in energy intensity and a hopeful drop in carbon intensity. It is usually considered that policies aiming the increase in energy efficiency are the most significant forces driving down GHG emissions [6,7]. In any case, carbon intensity of energy sources shows more sustained heterogeneity [8] even if energy intensity tends to converge among OECD countries. Global research confirms that, particularly over longer timeframes, carbon intensity of energy sources has lasting effects on emissions, while the effects of GDP per capita and energy intensity often attenuate over time [9].
Together with the Kaya analysis, the Index Decomposition Analysis (IDA) is a significant methodological instrument for examining the key variables in the emissions trends. IDA’s main goal is to objectively decompose an aggregate indicator, such as energy consumption or CO2 emissions, to determine and quantify the contribution of particular socioeconomic and technical driving forces to the total change in that indicator [10,11]. In the EU, for instance, extensive decompositions utilizing the LMDI (Logarithmic Mean Divisia Index) combined with convergence and decoupling analysis revealed that economic activity still drives emissions but that energy intensity has been far more important than renewables or energy-source substitution in several member states [12]. Reductions in energy and carbon intensity as the main contributors to emission declines over the last decades have also been highlighted elsewhere [13,14,15]. They concluded that technological improvements and structural changes in energy systems enabled partial decoupling between economic growth and emissions. However, both works [13,14] emphasize that the positive effect of economic activity remains strong, increasingly offsetting technical gains. This limitation becomes more evident when national or multi-sector perspectives [15] are introduced, such as in the case of Spain, where sectoral decomposition reveals that transport and electricity continue to drive emissions despite efficiency improvements [16]. The same idea is deduced in countries that have been EU members for longer often show more marked declines in energy intensity and better toward emissions targets [17].
IDA/LMDI has also been widely used to address China’s environmental challenges. The most important determinants affecting emissions have been shown to be economic growth and energy intensity; upgrades in energy efficiency emerge as the main driver of emission reduction [18,19]. But since 2010, its application has grown toward prospective studies of future emission scenarios [20], a change driven by the increasing emphasis on the Kaya identity in climate studies, including those by the Intergovernmental Panel on Climate Change (IPCC) [21] or in specific countries as China [22] to highlight the requirement of more rigorous and reformed policy frameworks guaranteeing a sustainable, low-carbon development path in the future [18]. Moreover, some studies for China use the LEAP model to explore future CO2 emission pathways under different assumptions. Results are highly sensitive to hypotheses related to land-use change and technological development [23], and alternative assumptions about policy strength and sectoral transformation lead to significantly different emission reduction trajectories [24]. These findings highlight the critical role of assumptions in scenario analysis.
Among the main strategies for pursuing a low-carbon development path and reaching CO2 reduction goals is the lowering of the carbon intensity of the economy, in which Carbon Capture and Storage (CCS) serves a significant as a technical mitigation strategy. CCS is widely recognized as a cornerstone technology for achieving deep decarbonization and capture CO2 emissions from industrial processes and store them underground, preventing their release into the atmosphere [25,26]. Its main benefit is in its capacity to dramatically lower greenhouse gas emissions, especially in difficult-to-decarbonize industries like concrete, steel, and chemical production where carbon dioxide is produced as a natural process by-product rather than just from fuel combustion [27]. Furthermore, technologies for carbon dioxide removal (CDR), mainly Bioenergy with CCS (BECCS) and Direct Air Capture (DAC), are increasingly recognized as essential for reaching net-negative emissions, thereby offsetting remaining emissions from industries incapable of complete decarbonization [28].
Despite technical developments in low-carbon solutions, worldwide emissions keep going up, therefore stressing the need of reconsidering traditional mitigation approaches. One of these strategies aims to control or restrain GDP expansion. As the foundation of human development, post-growth provides a socio-political and economic critique of the current paradigm of infinite economic growth [29]. Rather, it pushes for sustainable, egalitarian, and well-being-centered alternatives [30]. Considering that many planetary boundaries have already been crossed [31], rather than concentrating only on CO2 emissions, moderating GDP growth might be critical to preserving ecological stability. Rising as a reaction to the environmental, social, and economic difficulties connected to overexpansion (namely, climate change, inequality, and ecosystem degradation) the de-growth approach questions the premise that GDP increase equals to development. It argues that continual economic growth is essentially unsustainable on a world with limited resources.
Furthermore, some studies have concluded that consumption-based decomposition in the EU adds an important dimension by linking emissions to final demand patterns rather than production alone [32]. This approach aligns with production-based studies by reinforcing the central role of economic activity in shaping emission trajectories.
Overall, the existing literature converges on the conclusion that technological progress and efficiency improvements are necessary conditions for decarbonization, but they are insufficient to fully offset the emission pressures associated with sustained economic growth. Building on this consensus, recent studies increasingly point to the existence of structural limits to further reductions in carbon intensity. This shared evidence provides a robust empirical foundation for advancing the debate toward scenarios that explicitly combine technological change with controlled economic growth, and for assessing the feasibility of long-term climate targets under realistic macroeconomic conditions.
Against this background, the present study makes three main academic contributions. First, by focusing on population, economic output, and carbon intensity, it applies the Kaya identity and Index Decomposition Analysis to evaluate whether EU Member States are converging toward decarbonization pathways, introducing a simplified and intuitive representation of carbon intensity that facilitates interpretation and comparison. Second, the paper quantifies the extent to which carbon intensity has already declined in the EU and demonstrates that the remaining margin for further reductions is limited under continued GDP growth. Third, through the construction of CO2 emission scenarios up to 2050, the study explicitly estimates the magnitude of the technological effort required under different economic growth assumptions, including the complementary role of Carbon Capture and Storage. By quantifying how much CCS deployment and emission reductions would be necessary in each scenario, the analysis provides concrete insights into the feasibility of EU climate neutrality and highlights the policy relevance of considering degrowth or growth-constrained strategies alongside technological solutions.

2. Materials and Methods

To analyze the drivers and key variables in carbon emissions, several decomposition approaches have been developed to disaggregate the contribution of different influencing factors. Among these, Index Decomposition Analysis (IDA) is among the most widely applied methods due to its robustness, transparency, and applicability across sectors and over time [11,20]. IDA begins by defining an identity that expresses the relationship between a set of influencing factors and an aggregate indicator, such as CO2 emissions [4]. One of the most commonly used identities in this context is the Kaya identity. At the national level, the Kaya identity is represented in Equation (1):
CO2 = POP⋅GDP⋅(ENE⋅FUEL) = POP⋅GDP⋅CO2INT
where CO2 represents total CO2 emissions, POP is the population, GDP (GDP/P) is per capita GDP, and ENE (E/GDP) represents energy intensity, FUEL (CO2/E) denotes carbon intensity of the energy and CO2INT (CO2/GDP) carbon intensity of the economy. This identity allows CO2 emissions to be decomposed into four driving factors: population growth, economic activity, energy efficiency, and the carbon intensity of energy sources. Changes in emissions over time or differences between countries will be analyzed using IDA methods to quantify the contribution of each factor.
The last two variables are combined in this study into one environmental/technical component indicated by CO2 emissions per unit of GDP. Three primary elements emerge from this rewriting: (i) a social factor component reflected in population, POP; (ii) an economic–financial component linked to per capita gross domestic product, GDP; and (iii) a technical–environmental component including CO2 emissions per unit of energy used, CO2INT, the carbon intensity of the economy. This simplification is consistent with commonly used data in the literature on population, per capita income, and CO2 emissions, therefore allowing a historical analysis of the carbon intensity of the economy, i.e., CO2 emissions per unit of GDP, Figure 1.
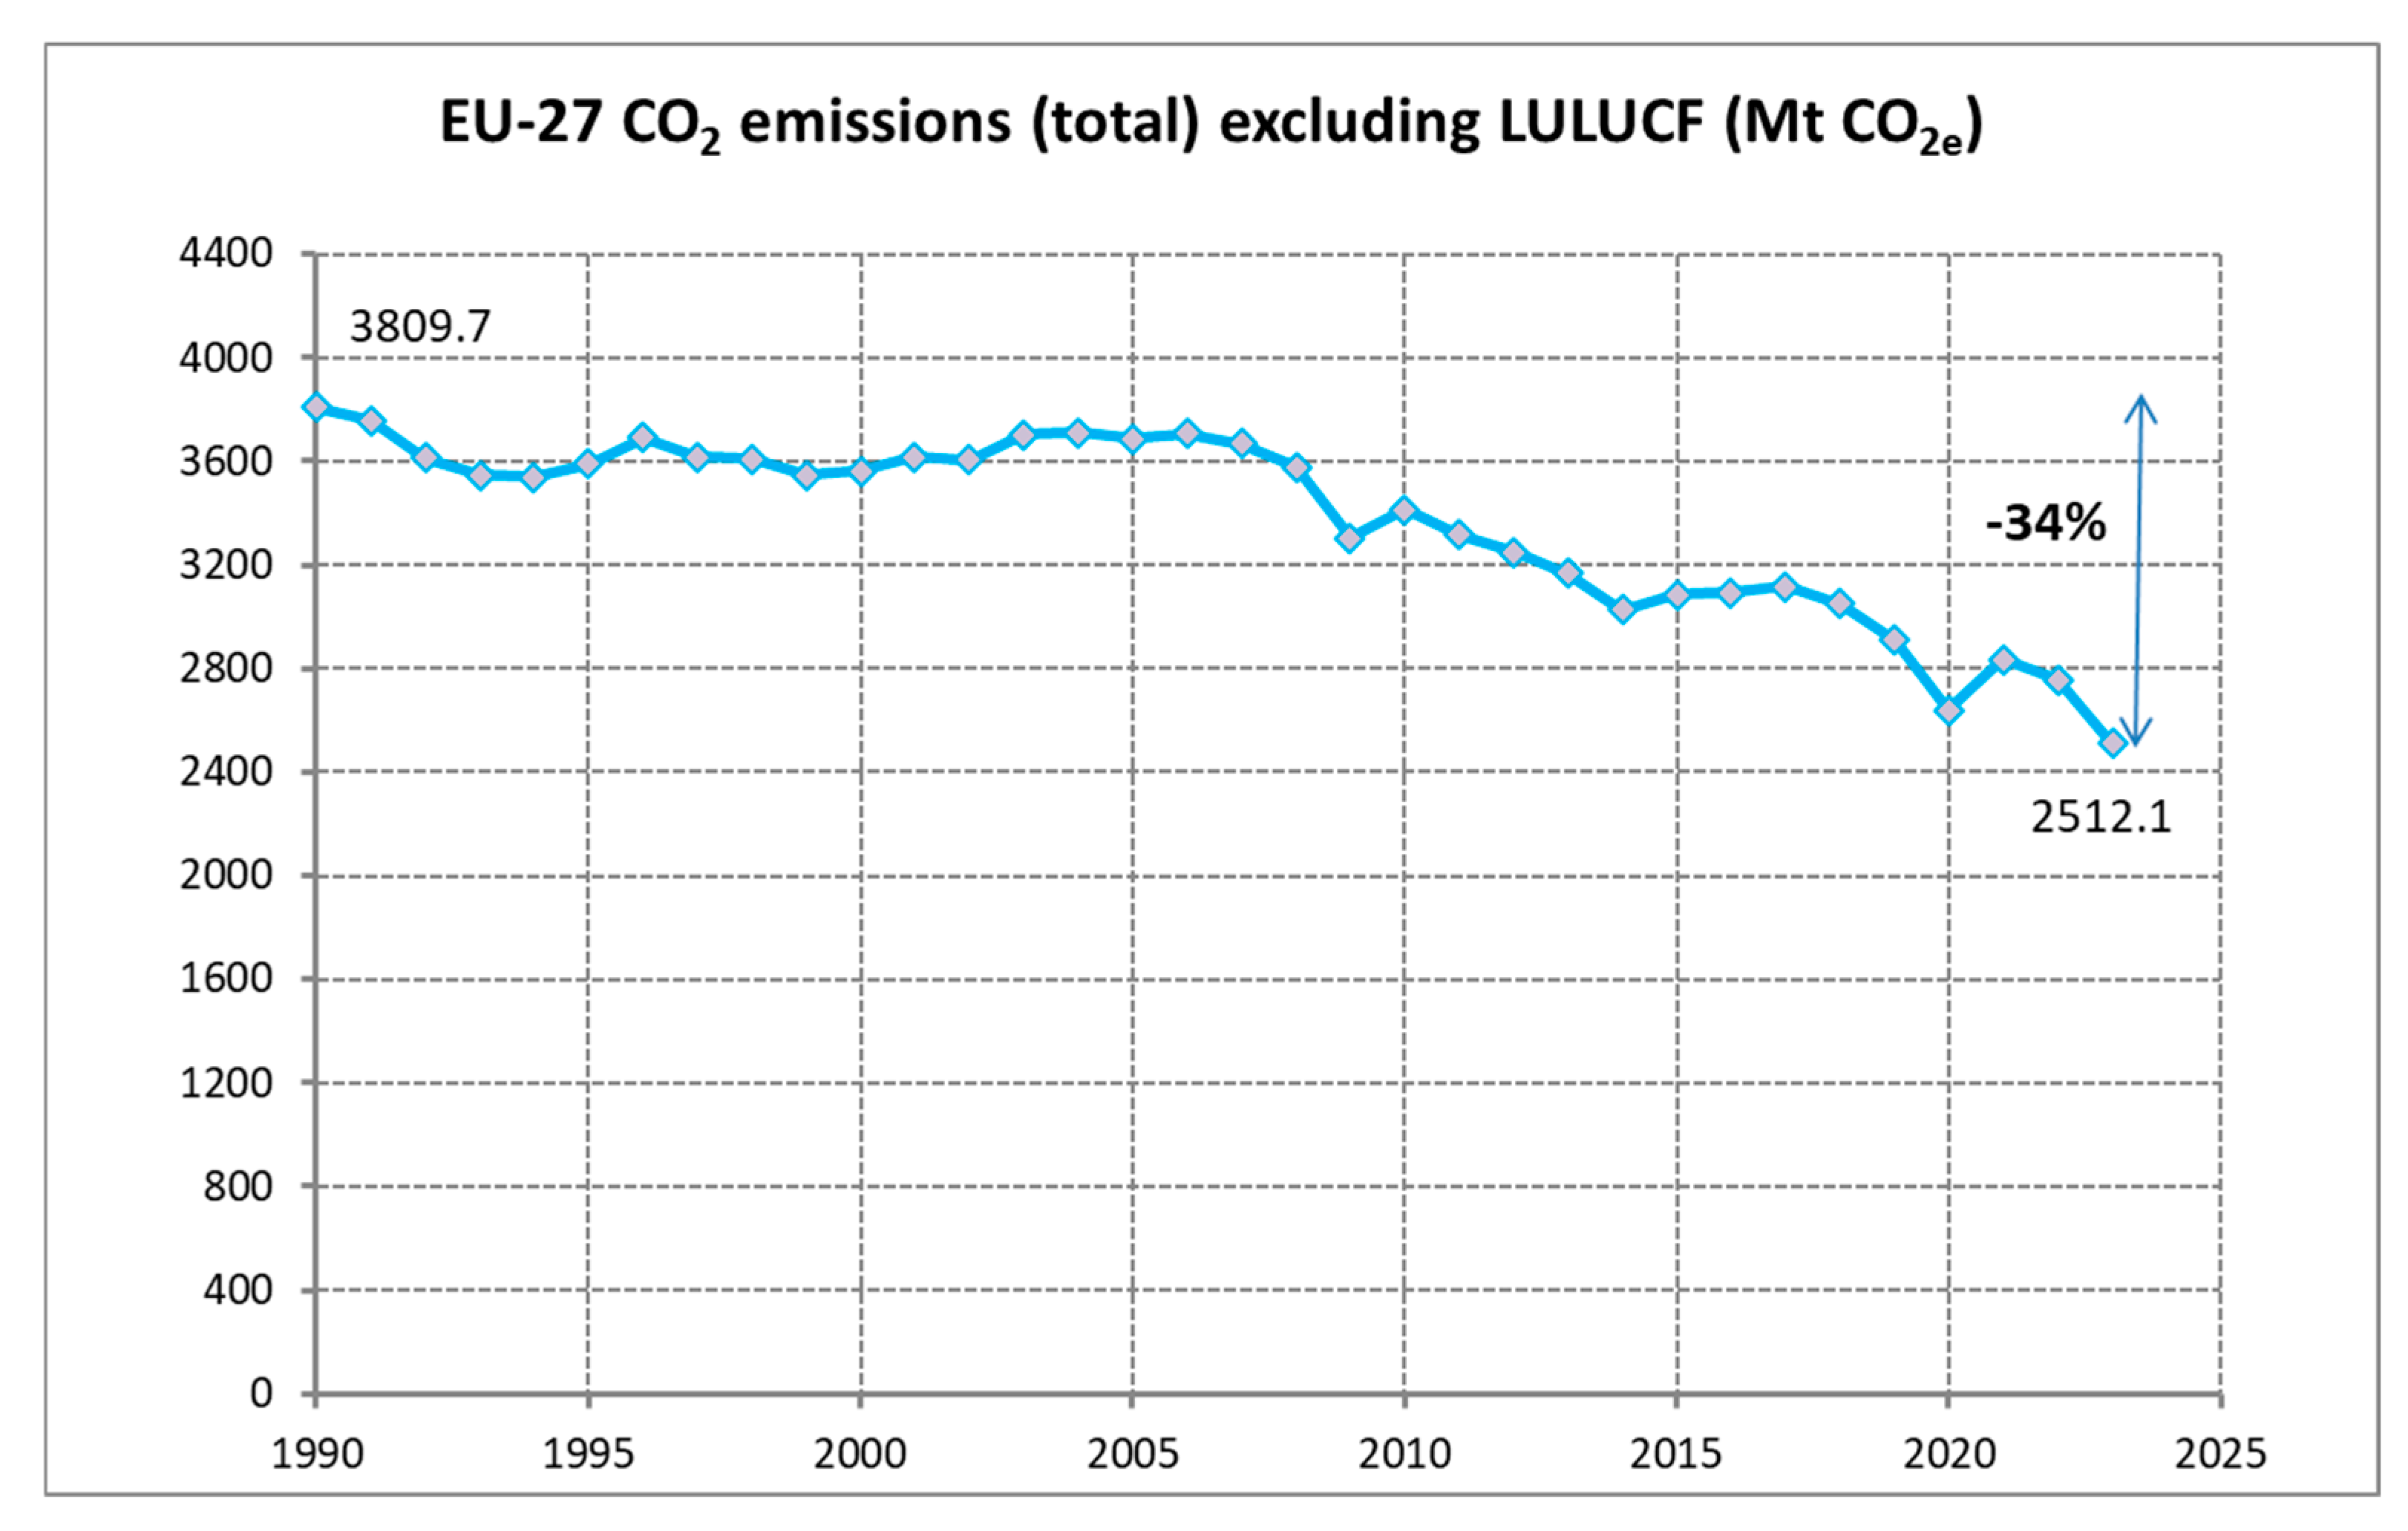
Data for population and CO2 emissions were sourced from the EUROSTAT Database [33], while GDP per capita (current US$) terms was obtained from the World Bank Development Indicators [34], without conversion to euros, as the analysis focuses on relative magnitudes and therefore preserves proportional relationships. Carbon intensity of economy was calculated between 1990 and 2023 for EU countries using Equation (1) and it is illustrated in Figure 1. Over this period, considerable progress has been made toward the decarbonization of the economy: EU achieved a significant 34% reduction in CO2 emissions, as shown in Figure 2.
This significant reduction in carbon intensity, which declined from an average of 0.526 kg of CO2 per dollar of GDP in 1990 to 0.092 kg in 2023, representing a 75% decrease (blue line in Figure 1, which also includes trends for most EU countries), emphasizes the great efforts made over the years to solve environmental problems, including increasing energy efficiency, rising energy conservation, and expansion of renewable energy sources, therefore highlighting overall decarbonization progress attained throughout the EU. The primary cause of the drop has been a significant decline in carbon intensity per unit of GDP, which points to a partial decoupling of economic expansion from emissions.
Despite these encouraging outcomes, it is important to acknowledge that many of the most accessible and cost-effective emission reduction opportunities have already been taken advantage of. One main cause is that carbon intensity of economy (CO2INT) is now approaching near-zero levels, which, combined with the diminishing returns from conventional efficiency improvements and the inherent complexity of decarbonizing certain sectors, makes further emission reductions increasingly challenging. Therefore, to keep going toward a carbon-neutral future, constant innovation, strong government support, and systematic change will be vital.
Considering the most recent data and the economy’s carbon intensity in EU-27 is nearing zero, a crucial question arises: is a more drastic reduction in CO2 emissions feasible, and what are its potential limits and consequences? While great progress has been made, achieving further reductions will require the large-scale deployment of renewable energy and deeper decarbonization across all sectors. According variables in Figure 1, two complementary strategies emerge as key pathways to achieve European climate objectives, such as those outlined in the Green Deal [1], and to mitigate the impacts of CO2 emissions for which Europe is largely responsible. First, carbon dioxide removal through advanced technologies, including CCS, is indispensable, as CO2 emissions per unit of GDP cannot realistically approach virtually zero or become negative without such interventions. Second, limiting or controlling average GDP growth is just as important as it helps to reduce effects of global warming, helps to meet EU environmental goals, and improves the efficacy of technical means of CO2 reduction. Taken together, these tactics provide a practical and essential means of tackling the dual challenge of attaining deep decarbonization while keeping social and economic stability. Furthermore, knowing how much each component contributes to total emission reductions helps one to find which techniques should be given top priority and to what degree each may reasonably solve the issue.

3. Results

3.1. Future Emission Reductions Through Index Decomposition Analysis

To evaluate the needed decrease in carbon intensity required to reach the EU’s net-zero emissions objective by 2050, a straightforward modeling research has been carried out. IDA method was employed, as it is a widely recognized approach within the context of the Kaya identity to quantify the contribution of individual driving factors to changes in CO2 emissions over time. This methodological framework allows for a transparent, quantitative understanding of how socioeconomic and technological dynamics collectively shape emission pathways, making it particularly suitable for long-term climate policy assessment. The three variables specified in Equation (1) were used for analysis in this investigation.
Among the different IDA techniques, the Logarithmic Mean Divisia Index method (LMDI) [10,35] is the most widely applied, using additive or multiplicative approaches frequently applied due to their consistency, interpretability and analytical accuracy [10,36]. As proven in studies of China’s CO2 emissions from 1957 to 2000 [37], IDA clarifies historical trends, informs next scenarios, and assesses the efficacy of energy and environmental initiatives by isolating structural and efficiency-related variables. When applying for a Temporal Analysis of Scenarios, the IDA framework is used to quantify the contribution of population, GDP per capita, and the carbon intensity of the economy (driving factors) to changes in emissions (DeltaCO2) over time within a given scenario (base year 1990). The goal is to find and measure the sources of variance in future emission paths between two points in time, therefore enabling a clearer distinction between technological, economic, and demographic influences.
This study interprets the net-zero objective for CO2 emissions as a 95% decrease in relation to 1990 levels, equivalent to a maximum allowable emission level of around 195 MtCO2, against 3810 MtCO2 in 1990. This convention is adopted because, as emission values approach zero, the application of logarithmic and division operations in the analysis may give rise to singularities, so undermining the dependability of the results. For the population variable, an annual growth rate of 0.1% was assumed, consistent with the trend observed over the past five years [33]. GDP growth scenarios were considered exogenously, reflecting projected economic trajectories within the EU context. One degree of freedom results from this: once the yearly GDP growth rate is established, the appropriate carbon intensity needed to reach net-zero emissions by 2050 is calculated. This formula provides a direct analytical connection between macroeconomic development and the technological change needed to reach climate neutrality goals by measuring the decarbonization effort required under various economic growth scenarios.
The contribution of each factor to CO2 emissions can be quantified using the IDA framework. Among the different IDA techniques, the LMDI-I method is commonly applied to ensure that the sum of individual contributions equals the total observed change [10,36]. By separating structural and efficiency-related effects, this approach improves interpretability and clarifies historical emission trends. Let a country’s CO2 emissions in the base year 0 and in year i be CO2_0 and CO2_i, respectively, so that DeltaCO2 = CO2_iCO2_0. Using the additive LMDI-I method, Equations (2)–(5), changes in emissions can be decomposed into the contributions of population (DC_POP), GDP per capita (DC_GDP), and carbon intensity of economy (DC_CO2E). When applied to scenario analysis, this framework identifies and quantifies the relative influence of demographic, economic, and technological drivers on emission trajectories over time (base year 1990), providing a clear understanding of the sources of variation between two points in time.
D C _ P O P = ( C O 2 _ i C O 2 _ 0 l n ( C O 2 _ i ) l n ( C O 2 _ 0 ) ) l n ( P O P _ i P O P _ 0 )
D C _ G D P = ( G D P _ i G D P _ 0 l n ( C O 2 _ i ) l n ( C O 2 _ 0 ) ) l n ( G D P _ i G D P _ 0 )
D C _ C O 2 E = ( C O 2 E _ i C O 2 E _ 0 l n ( C O 2 _ i ) l n ( C O 2 _ 0 ) ) l n ( C O 2 E _ i C O 2 E _ 0 )
D e l t a C O 2 = C O 2 _ i C O 2 _ 0 = D C P O P + D C _ G D P + D C _ C O 2 E
Table 1 presents the required annual reductions in the economy’s carbon intensity (CO2 per unit of GDP) under different GDP growth and contraction scenarios up to 2050. Achieving the EU’s net-zero emissions target demands substantial decarbonization efforts across all economic conditions, with the magnitude of the required reductions strongly influenced by GDP growth rates. Under higher GDP growth scenarios, the challenge is particularly acute. For instance, with a 3% annual EU average GDP growth (average annual GDP growth from 1990 to 2023 was 3.9%), carbon intensity must decline by approximately 11.8% per year, reducing CO2 per unit of GDP from the current 0.092 kgCO2 per dollar to just 0.0046 kg CO2 by 2050. Even a more moderate 2.0% growth still requires a reduction of 10.9% per year, while 1% GDP growth demands a 10.1% annual decrease. These reductions are remarkable given the already low carbon intensity and highlight the need for substantial improvements in energy efficiency, deployment of low-carbon technologies, and expansion of CCS systems.
As GDP growth slows or turns negative, the required reductions become somewhat more manageable, though still substantial. With zero GDP growth, carbon intensity must drop by 9.2% per year, while a 0.5% contraction lowers the target to 8.7% per year, and a 1% annual contraction further reduces it to 8.2%, corresponding to 0.0134 kg CO2 per dollar of GDP by 2050. The decreases are still difficult even in these situations, underlining that traditional efficiency improvements alone are insufficient and that CCS as well as other technological solutions will be crucial.
Under more pronounced economic contraction, the pressure to achieve decarbonization is somewhat alleviated. For example, a 2% annual GDP decline reduces the required annual reduction in carbon intensity to 6.3%. Although this represents a more feasible path, the figure still underscores the significant technological and structural transformations needed across energy systems, production processes, and consumption patterns to achieve deep decarbonization. Together, these results highlight a crucial insight: limiting GDP growth substantially reduces the mitigation effort required to achieve the EU’s climate targets, offering a clearer—but still challenging—path toward long-term sustainability. Clearly, these growth values refer to the average for the EU. An analysis by individual countries would be more complex, since each one has different levels of economic and technological development. However, the overall conclusion about limiting GDP growth to reduce the mitigation efforts remains valid as a whole.
Table 2 presents the same emission targets as in the previous analysis, now complemented by IDA using the additive approach. This analysis quantifies the contribution of each factor—GDP, population, and carbon intensity—to total CO2 emissions in 2050 under different GDP growth assumptions. While the final emission levels in 2050 remain approximately the same across scenarios, different combinations of GDP growth and carbon intensity reductions imply distinct levels of technological effort and policy intervention required to achieve these targets. The table shows results of the IDA and the three main variables for several GDP growth assumptions. The first column includes the information for the reference year 1990, the second column for 2023, and the rest of the columns for year 2050 under three different GDP growth +3%, 0% and a controlled decrease of 1% annually. Total CO2 emissions fell from 3809.7 Mt CO2 to 2512.1 Mt CO2 between 1990 and 2023, showing an overall emission decrease (shown in Figure 2) despite both economic and population growth. During the same period, population increased modestly from 420.5 million to 448.8 million (an increase of 6.7%), showing that the emission reductions were not driven by demographic contraction. GDP per capita experienced substantial growth, rising from $15,470 in 1990 to $41,422 in 2023 (a rise of 267.8%), reflecting sustained economic development over the three decades. Similarly, the carbon intensity of the economy—the amount of CO2 emitted per unit of GDP—declined sharply from 0.5856 to 0.1351, highlighting a significant improvement in the efficiency of economic activity with respect to carbon emissions.
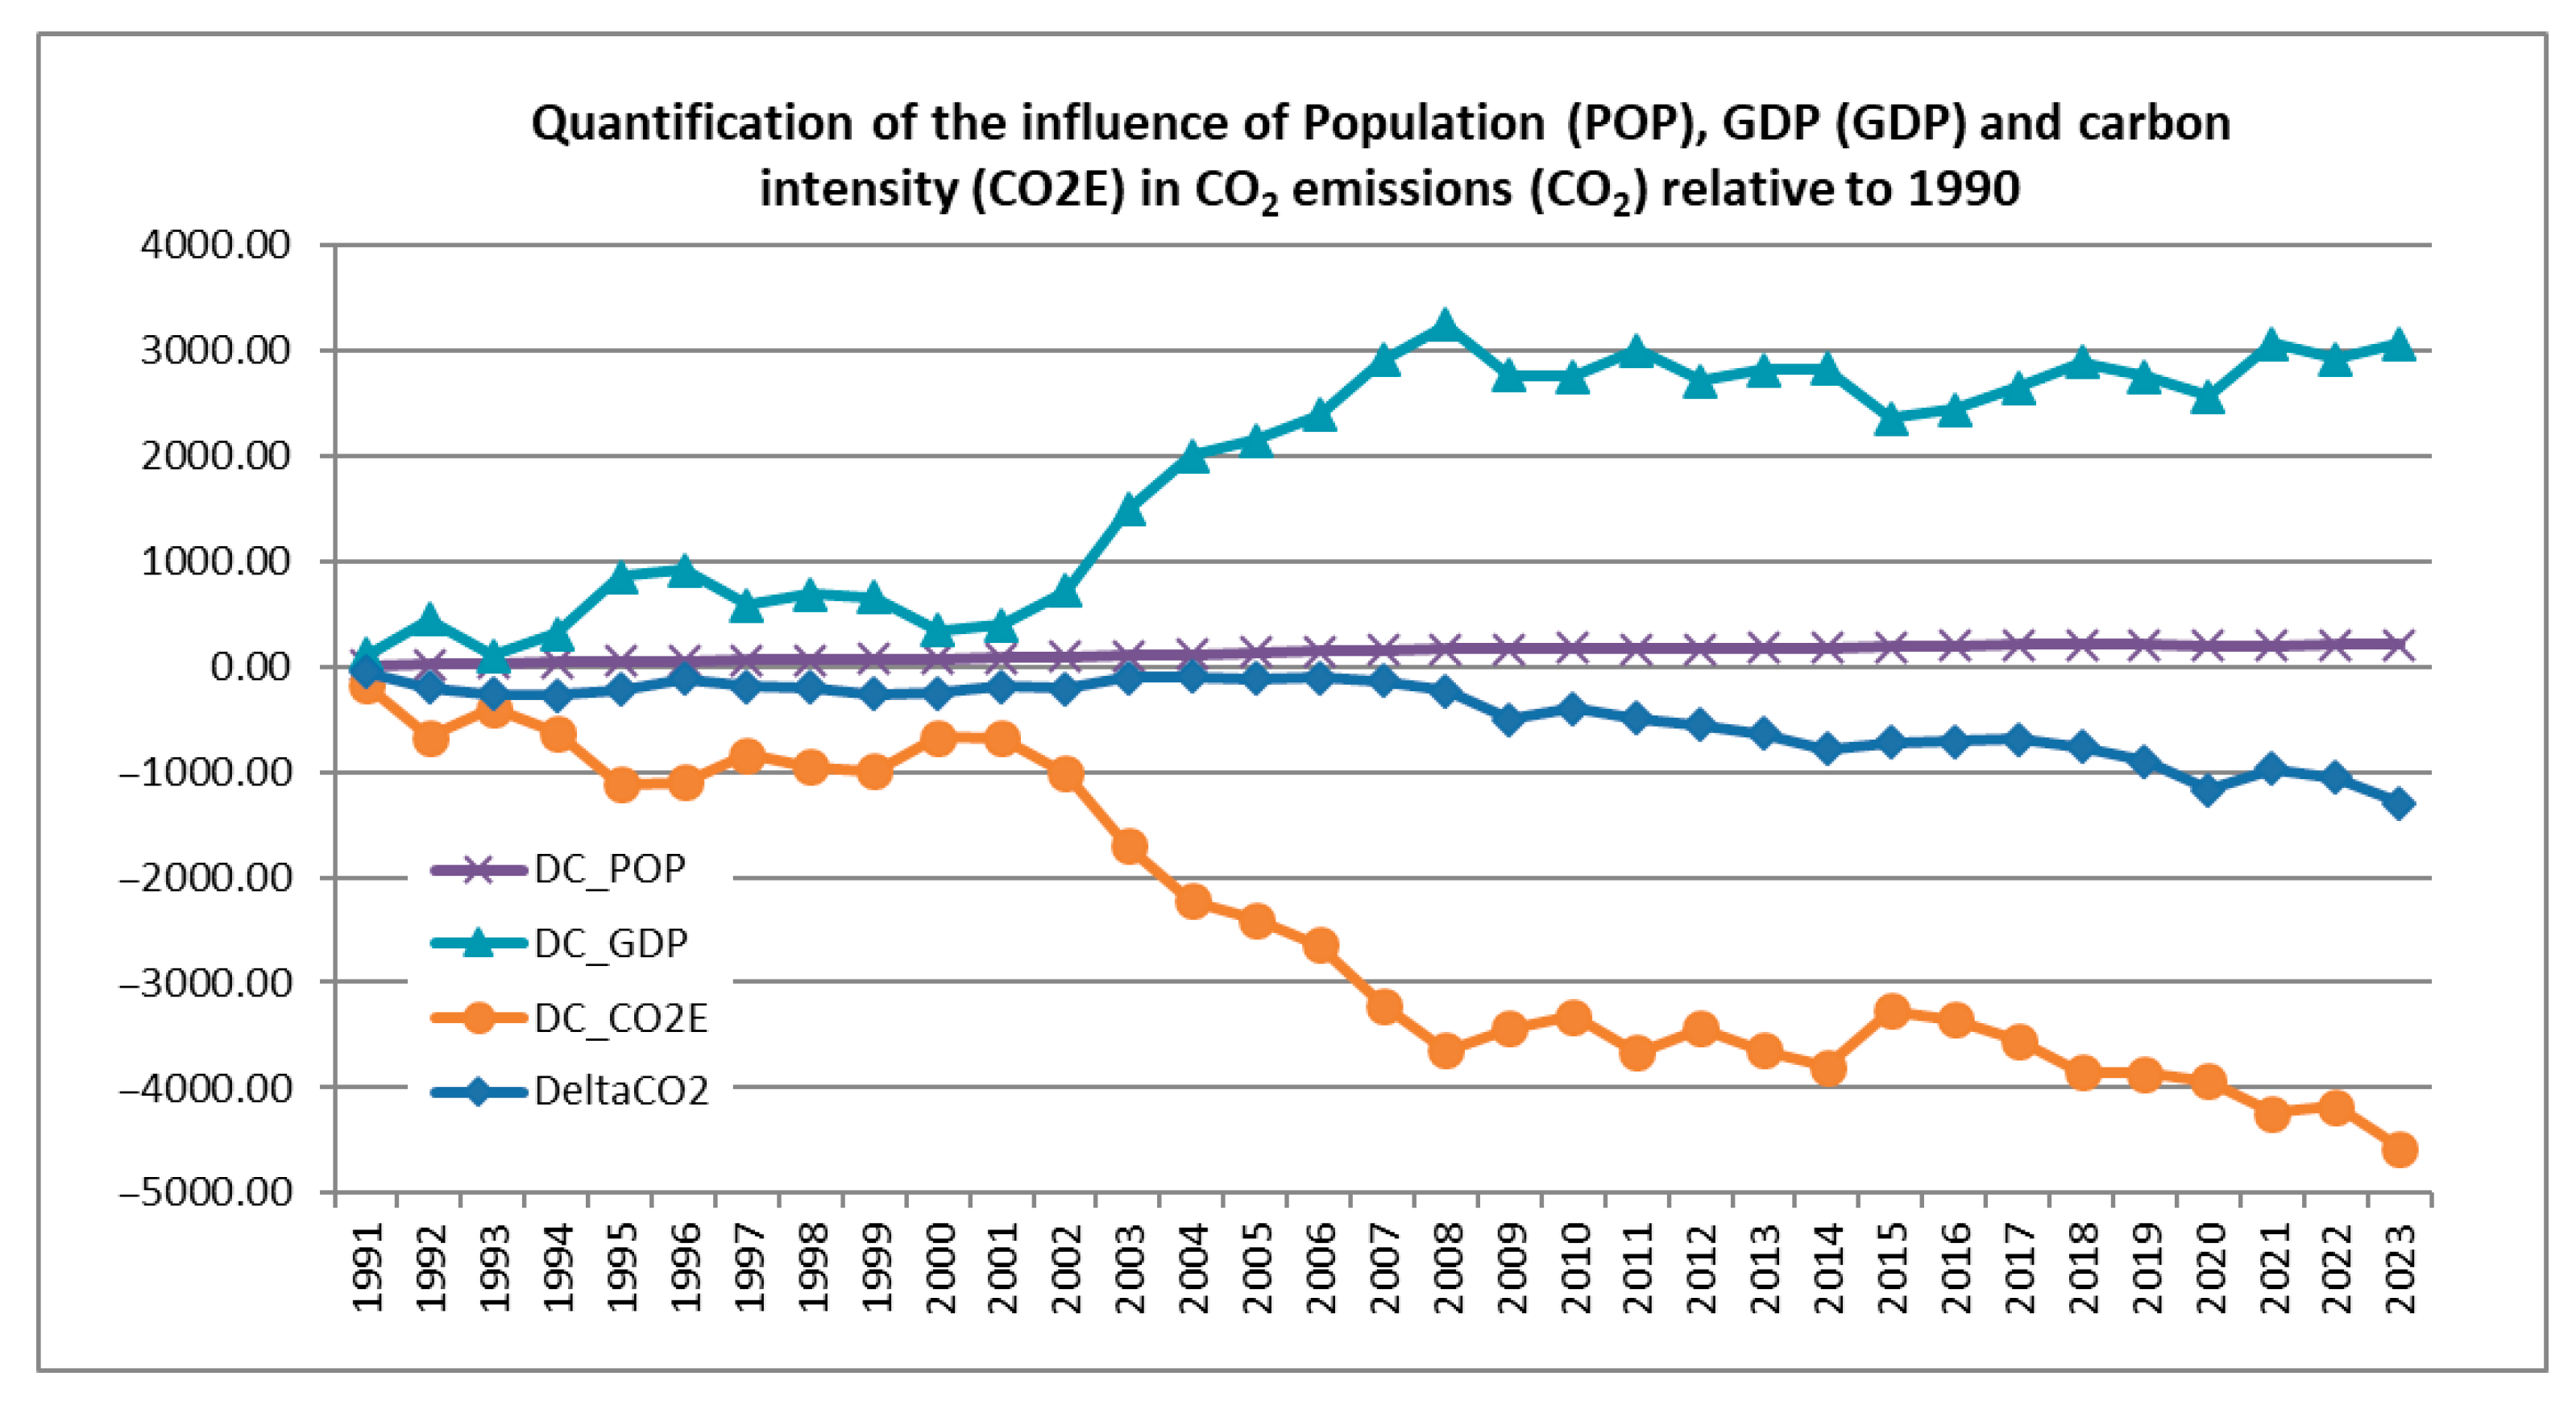
The comparison between 2023 and 1990, IDA reveals that the reduction in CO2 emissions within the European Union has been driven predominantly by a substantial decline in carbon intensity, quantified at approximately 4569 Mt CO2 in 2023. Conversely, population growth added a relatively small 202 Mt CO2 yearly whereas GDP growth aided in an increase of about 3069 Mt CO2 per year. Table 2 and Figure 2 show how together these elements contribute for the entire net decrease of around 1300 Mt CO2 over the time. Depicted in Figure 3, derived via IDA, is the temporal evolution and relative impact of population, GDP, and carbon intensity on total CO2 emissions from 1990 to 2023, which further supports these conclusions. Where “DC” refers to “Delta Change,” indicating the contribution to CO2 emissions changes arising from population (DC_POP), economic output (DC_GDP), and technical or intensity-related factors (DC_CO2E) calculated as in Equations (2)–(5). The figure clearly shows that the sustained decrease in carbon intensity (orange line) has been the dominant force behind emission reductions, reflecting advancements in energy efficiency, the growing integration of renewable energy sources, and structural shifts toward less carbon-intensive sectors of the economy. On the other hand, the GDP contribution (light blue line) has remained consistently positive, evidencing the upward pressure of economic expansion on emissions, while the population effect (purple line) has remained comparatively minor and stable. The combined influence of these factors (dark blue line, DeltaCO2) reveals a steady downward trend in aggregate emissions, particularly after 2008, when decarbonization efforts intensified. The analysis shows overall that the EU’s success in lowering emissions has mostly depended on ongoing decreases in carbon intensity, which have adequately balanced the emission increases linked to economic and population growth—therefore emphasizing the essential part of technical innovation and structural change in reaching long-run climate objectives.
Higher GDP growth rates (+3% annually) are linked with a markedly bigger technological difficulty when one compares projections for 2050 with those for 2023 or for the reference year 1990. Under these conditions, CO2 reductions resulting from changes in carbon intensity must amount to 5867 Mt CO2 by 2050. Achieving such reductions will require a considerable technological effort—not only to meet the ambitious emission targets set by the European Union but also to counterbalance the additional emissions generated by continued GDP expansion. In high-growth scenarios (+3%), this result emphasizes how crucial it is to promote low-carbon technology, renewable energy adoption, and CCS technologies. With declining assumptions of GDP growth, the size of the necessary technical effort also drops, therefore rendering the climate goals more reachable via reductions in carbon intensity and, possibly, progressive CCS system integration. Comparing the zero-growth scenario (–4920 Mt CO2) with the scenario assuming 3% yearly GDP increase (–5867 Mt CO2), the analysis emphasizes the requirement for an extra 900 Mt CO2 reduction. It also shows how sustained GDP expansion increases the decarbonization difficulty by directly influencing total emission levels.
At the opposite end of the spectrum, the extreme scenario of a 1% annual GDP decline presents very little additional technical difficulty. Carbon intensity in this scenario is −4594.6 Mt CO2, a figure comparable to the present contribution estimated for 2023 (−4569 Mt CO2). As the effect of GDP on emissions under this situation is minor, reaching the climate goals calls for no large technological development. In contrast, the zero-growth scenario still necessitates a modest technological effort to further reduce carbon intensity, quantified at roughly 350 Mt CO2 (the difference between −4920 Mt CO2 and −4569 Mt CO2). This level of effort appears technically feasible given current technological trajectories. Under such conditions, the absence of GDP-driven emission increases makes the achievement of climate neutrality significantly more attainable through manageable reductions in carbon intensity, without requiring disruptive technological transformations. These scenarios offer a more steady framework for matching economic activity with long-term sustainability objectives as well as help to relieve the strain on technical innovation and deployment rates.
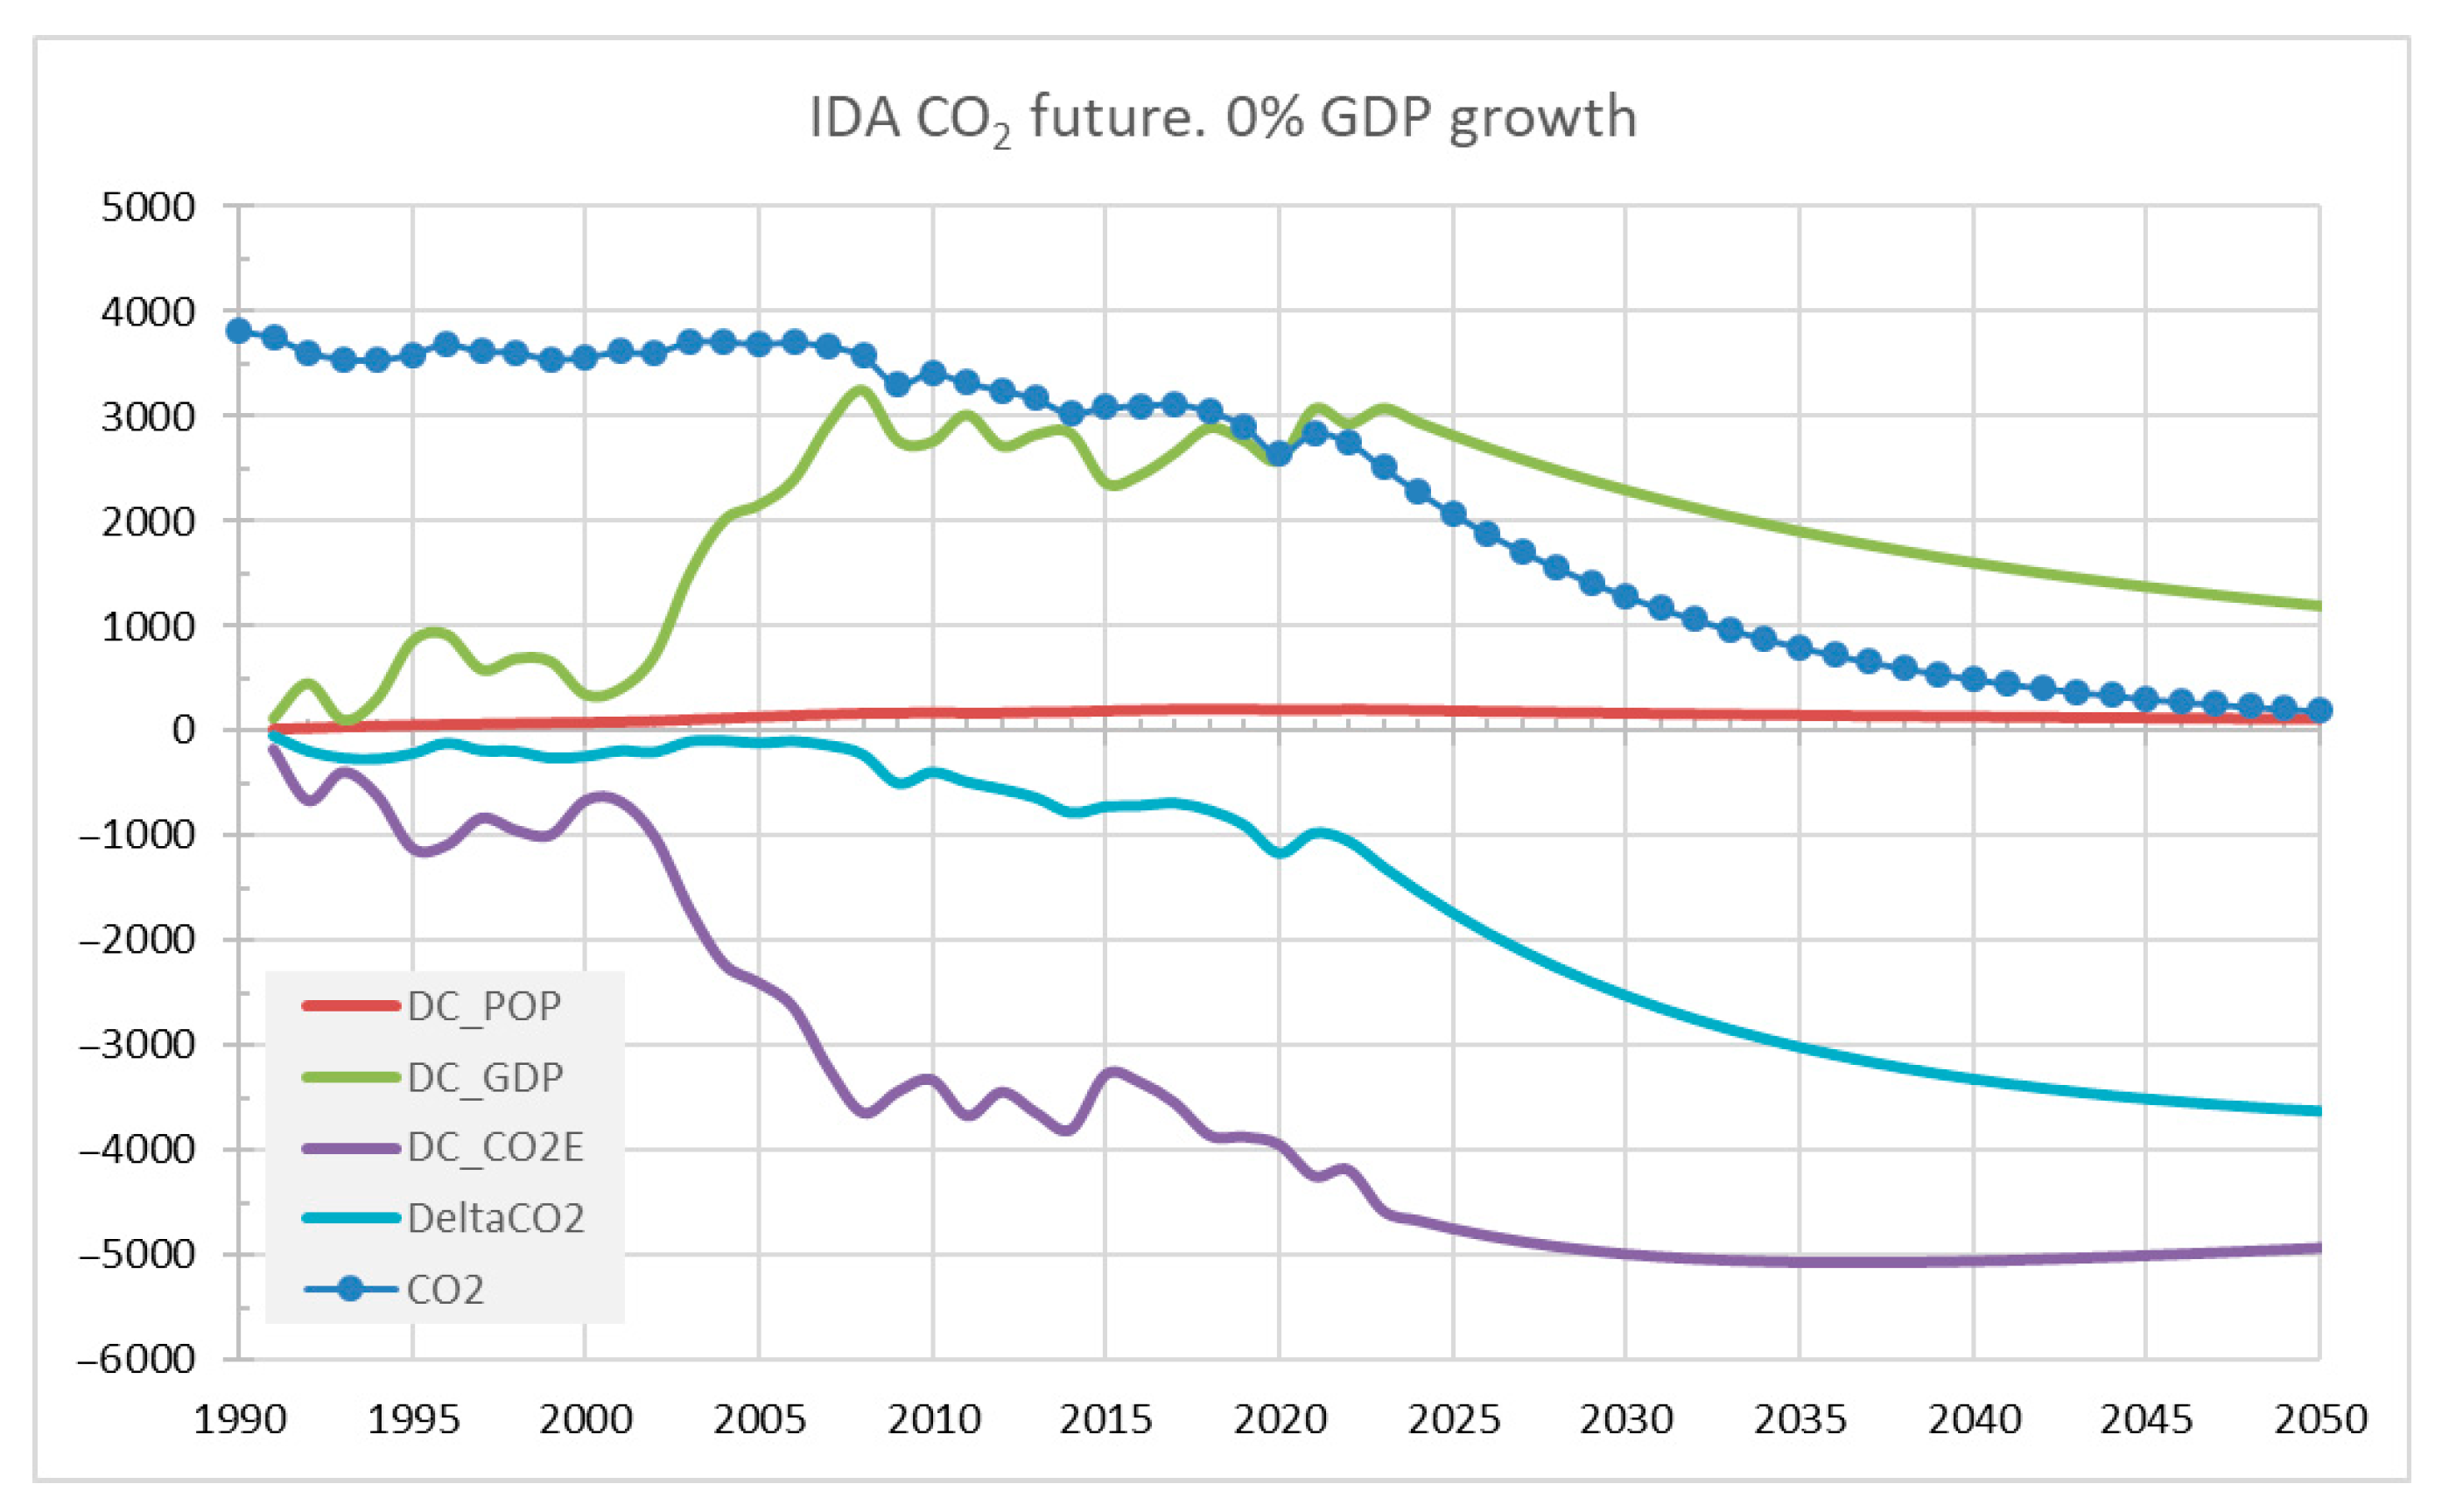
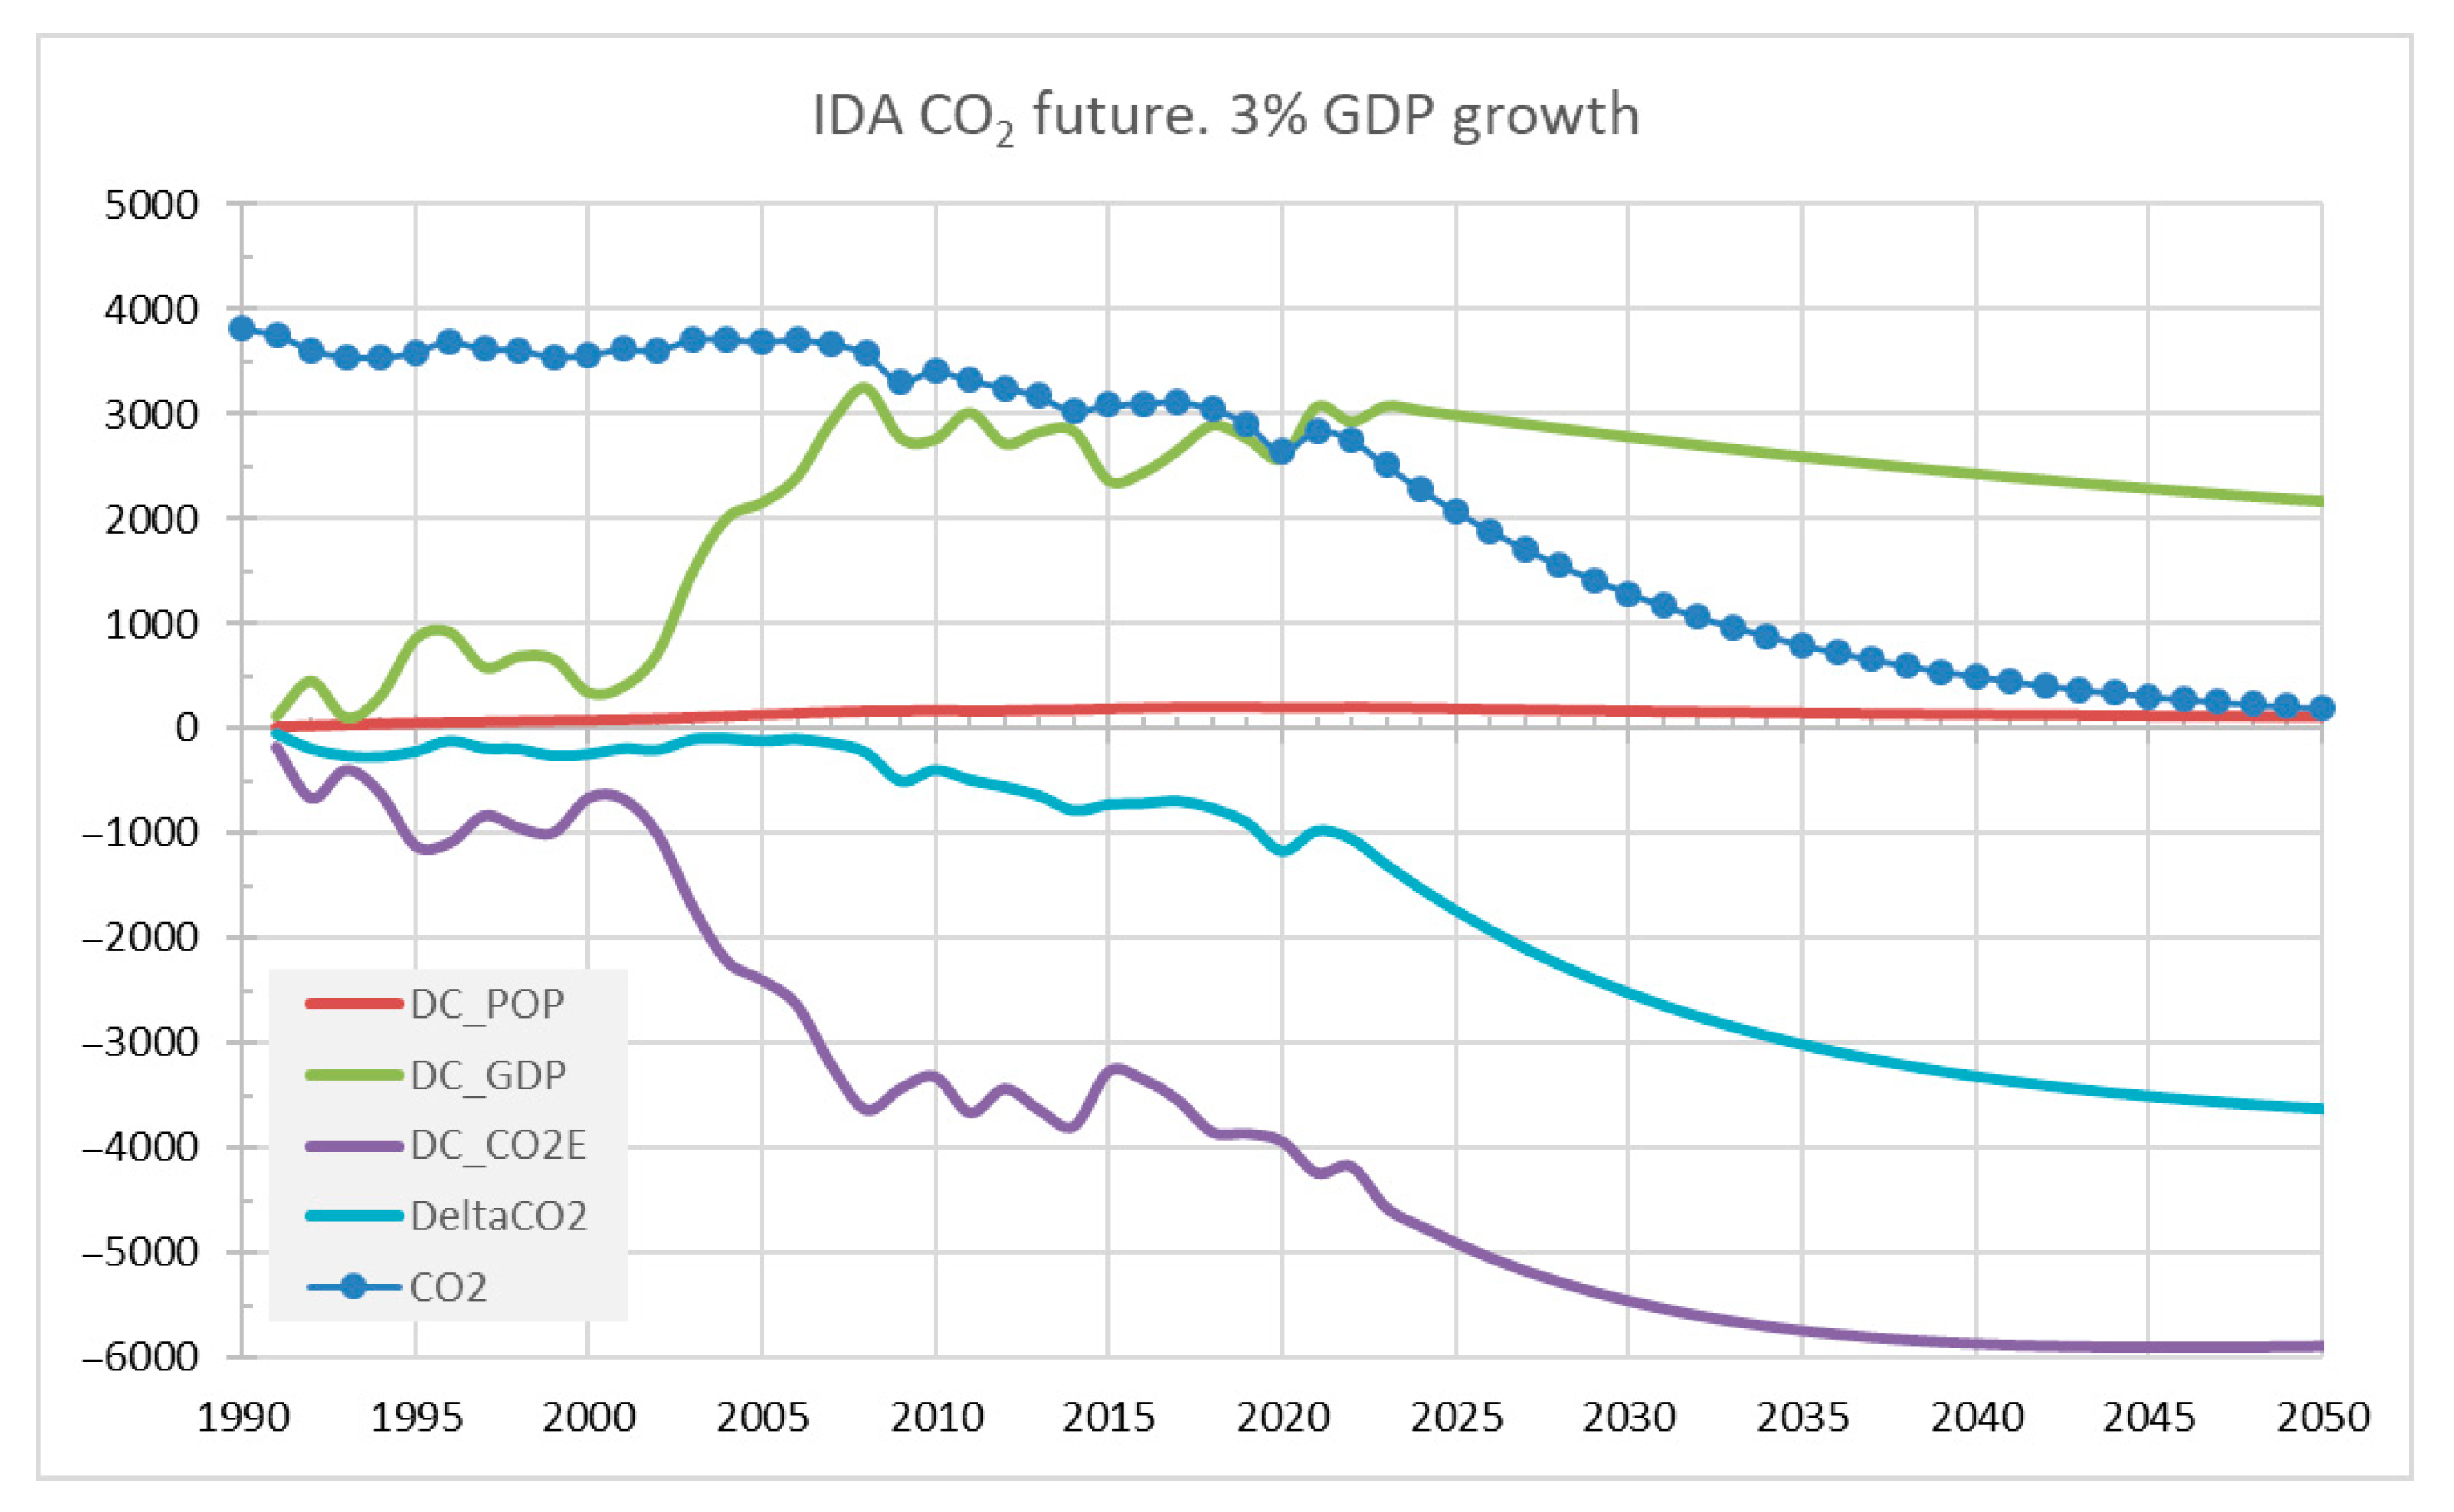
Figure 4 graphically illustrates the results of the IDA for both historical and projected CO2 emissions under a zero economic growth scenario, assuming an annual reduction in carbon intensity of 9.2% to meet the 2050 climate targets. The figure displays the temporal evolution of CO2 emissions, with the green line representing the contribution of GDP to total emissions. Assumption of zero economic growth causes this contribution to fall dramatically from 2023 onwards, therefore minimizing its influence against 2023 levels. The purple line depicts the contribution of carbon intensity, which decreases progressively over time and stabilizes near zero, reflecting the already low current intensity levels. The red line corresponds to the contribution of population growth, while the blue line represents the aggregated contribution of all three drivers. This visualization clearly highlights the relative influence of each factor in shaping future emission trajectories under a no-growth scenario, emphasizing that the stabilization of GDP and population levels substantially limits upward emission pressures, while continuous improvements in carbon intensity remain the key determinant for reaching carbon neutrality by 2050.

3.2. The Role of CCS in Future Scenarios

In all GDP growth scenarios, it becomes imperative to reduce CO2 intensity of economy and advance the development and deployment of low-carbon technologies, expand renewable energy systems, and accelerate the implementation of CCS solutions. However, achieving these goals is not without challenges, as significant costs, technological barriers, and issues of social acceptance are associated with the large-scale deployment of CCS. This requirement could be particularly pronounced in “hard-to-abate” industrial sectors, such as steel, cement, and chemicals, which depend on high-temperature processes and carbon-based feedstock that cannot be fully replaced by electrification or renewable energy. Although CCS technologies increase overall energy demand and are not an ideal or stand-alone solution, they represent a critical and pragmatic approach to achieving the EU’s climate objectives by compensating for the residual emissions that remain technically unavoidable in these sectors.
Considering the emission reduction requirements resulting from the IDA, the relevance of CCS and other such mitigation measures even clearly highlighted. Table 3 presents the projected technological CO2 reduction requirements under several GDP growth scenarios, together with the proportion of these reductions predicted to be achieved through CCS by 2050. The findings show a strong positive correlation between economic expansion and the amount of technical work needed to reach decarbonization goals.
Under the high-growth scenario (+3.0% GDP), the required technological reduction reaches 5867.4 MtCO2, which represents an increase of approximately 1300 MtCO2 relative to 2023 values. According to [38], which harmonized and analyzed sectoral projections from seventeen studies on CO2 capture deployment within EU industrial sectors, specifically focusing on the cement, iron and steel, and chemical industries for 2030 and 2050, up to 171 MtCO2 could be abated through carbon capture technologies across these sectors. The estimated potential reductions amount to 64 MtCO2 for the cement industry, 58 MtCO2 for the iron and steel sector, and 49 MtCO2 for the chemical industry. Altogether, this represents approximately 13% of the additional reduction required under the high-growth scenario, indicating that while CCS would make a significant contribution, it would still cover only a limited share of the overall mitigation need. Even under optimistic assumptions regarding technological deployment across industrial sectors, the cumulative CO2 captured would amount to approximately 275 MtCO2 [38], around 90 MtCO2 from cement, 100 MtCO2 from iron and steel, and 85 MtCO2 from chemicals, representing, in this optimistic scenario, no more than 20% of the overall reduction requirement. This result emphasizes the disproportional technical and financial difficulties related with maintaining strong economic expansion in pursuit of deep decarbonization, so strengthening the need of controlling GDP growth as a supplemental tactic to lighten the general mitigation load. Policy instruments, such as carbon pricing, industrial efficiency measures, Innovation Funds, and targeted Green Deal mechanisms are essential for sustaining and further reducing carbon intensity. These measures are indeed necessary and indispensable. However, even under optimistic assumptions regarding their effectiveness, the results suggest that continued GDP growth cannot be fully compensated by further reductions in carbon intensity alone.
Under the +1% GDP growth scenario, the relative contribution of CCS rises to roughly 25% with more moderate GDP growth rates and reaches roughly 50% under the zero-growth scenario. This development implies that CCS could be absolutely crucial and increasingly decisive role in achieving emission reductions under conditions of slower economic expansion, where the overall decarbonization burden becomes more manageable and the deployment of capture technologies more proportionate to mitigation requirements.
On the other hand, slower or negative growth scenarios significantly reduce the total CO2 reduction requirement, declining to 4591.6 MtCO2 in the −1.0% GDP case—almost converging with the carbon intensity levels observed in 2023. Under such conditions, the share of reductions projected to be covered by CCS rises sharply, reaching nearly 90% in cases of slight negative GDP growth, while becoming unnecessary to reach the complete sectoral projections in the −1.0% GDP scenario due to the overall reduction in emissions intensity. Changes in GDP assumptions may also influence population dynamics; however, our calculations indicate that the impact of population variations is negligible compared with the effects of GDP growth and carbon intensity (see Figure 3 for historical trends).
These results should be understood as a macro-level assessment rather than a uniform pathway for all EU member states. Although significant differences exist in GDP levels, carbon intensity, and CO2 emissions per capita across countries, the fundamental relationship between economic growth and the scale of required technological mitigation remains robust. The following discussion therefore examines these regional variations, showing that while national circumstances differ, the remaining potential for further intensity reductions is limited across the EU.

4. Discussion

The notion of limiting or moderating GDP growth as a means to achieve climate objectives is inherently controversial and, evidently, demands careful consideration. It is important to stress that GDP and societal well-being are not synonymous [39,40], and that economic contraction does not always mean a reduction in quality of life. Any effort to constrain or slow economic expansion for the sake of climate mitigation must therefore be pursued in a fair, balanced, and context-sensitive manner, taking into account both the current economic structures and the historical progress already achieved by each country in reducing emissions. Among Member States within the European Union, there are significant differences in economic capability, energy intensity, and technological development. These differences would be even more pronounced if the analysis were extended to countries worldwide. Consequently, a uniform approach to GDP limitation or emission reduction would be neither equitable nor effective. Instead, differentiated strategies—reflecting national circumstances, levels of industrialization, and past decarbonization achievements—are required to ensure that all countries can contribute meaningfully to the collective objective of climate neutrality, while maintaining social cohesion and economic resilience across the region.
As previously noted, the trend in carbon intensity—measured as CO2 emissions per unit of GDP—has followed a consistent pattern across all EU countries, Figure 1. However, analyzing the reduction in this factor in EU over time reveals three distinct groups of countries in EU-27. The first group includes those with very high carbon intensity in 1990, which have progressively reduced their emissions to levels close to the EU average by 2023; Poland or the Baltic states exemplify this well. The second group—Germany among others—comprises big economies first having relatively high but not extremely high carbon intensity. By 2023, these nations have also worked hard to reduce their emissions, achieving levels close to or even under the EU average. Finally, the third group comprises countries (Italy or Spain) that already had low carbon intensity in 1990 and have continued to reduce it steadily, reaching levels well below half of the current EU average. Notwithstanding these differences, all EU member states have continuously decreased their carbon intensity over time.
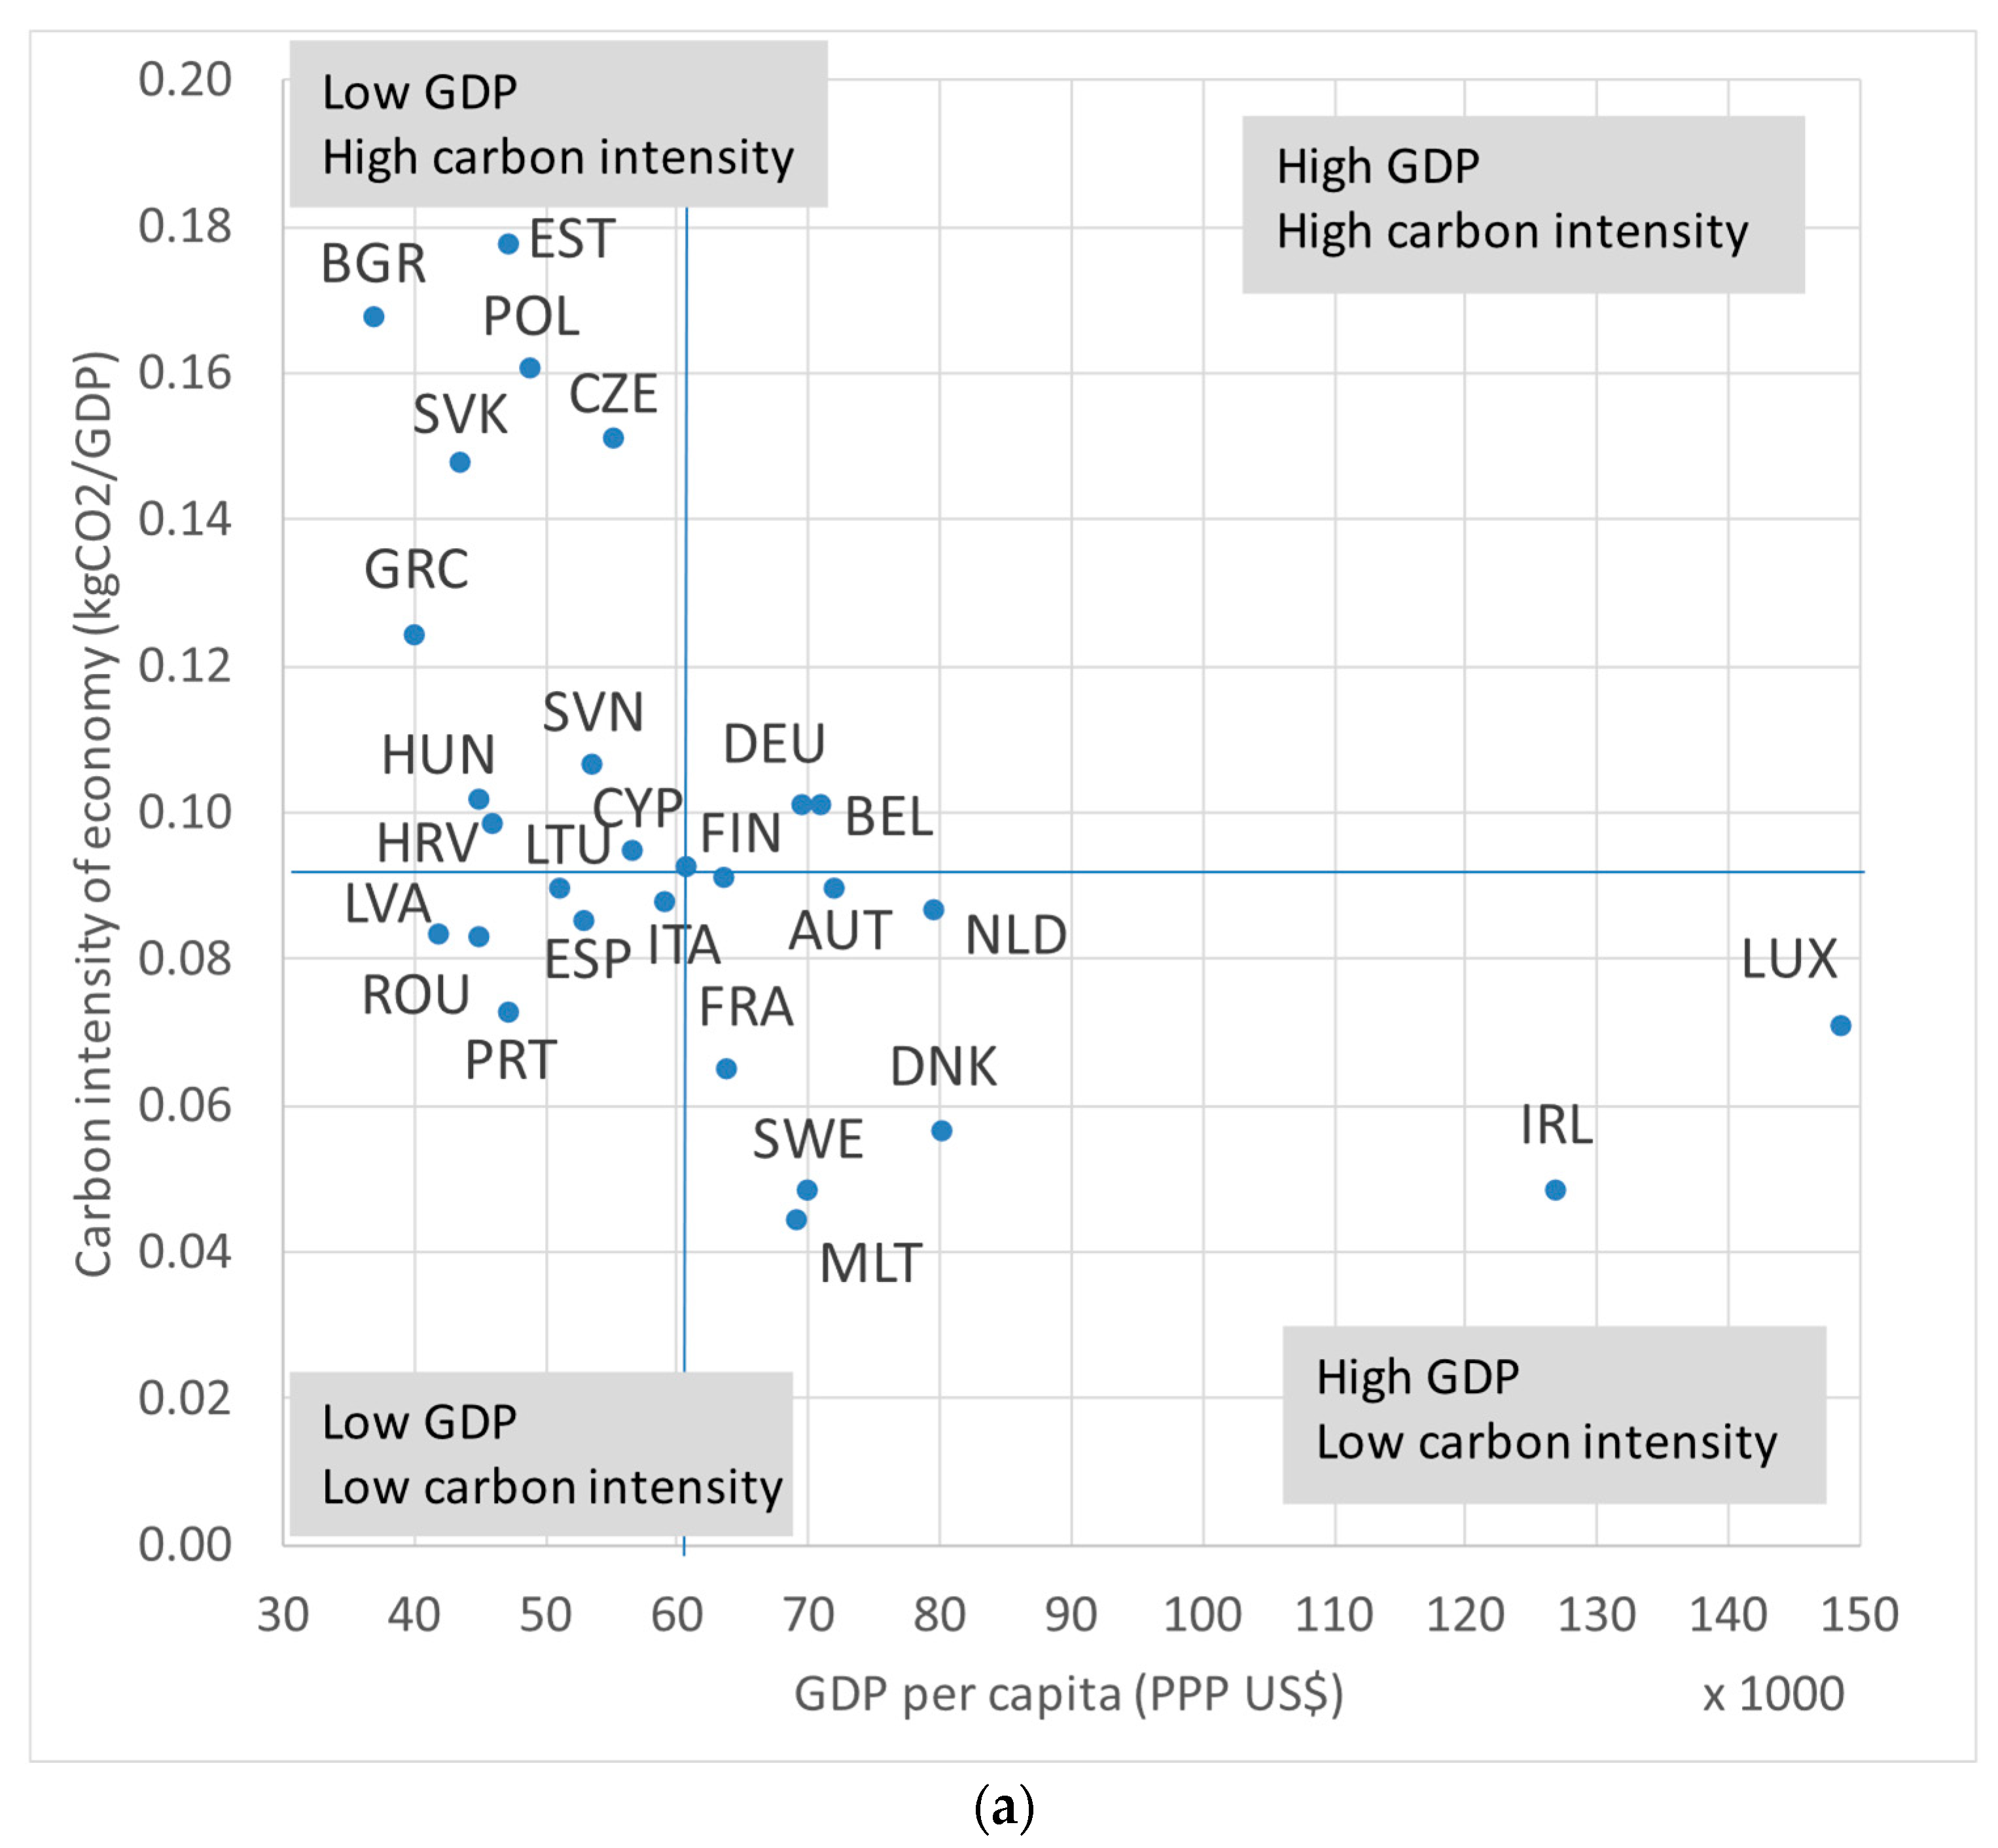
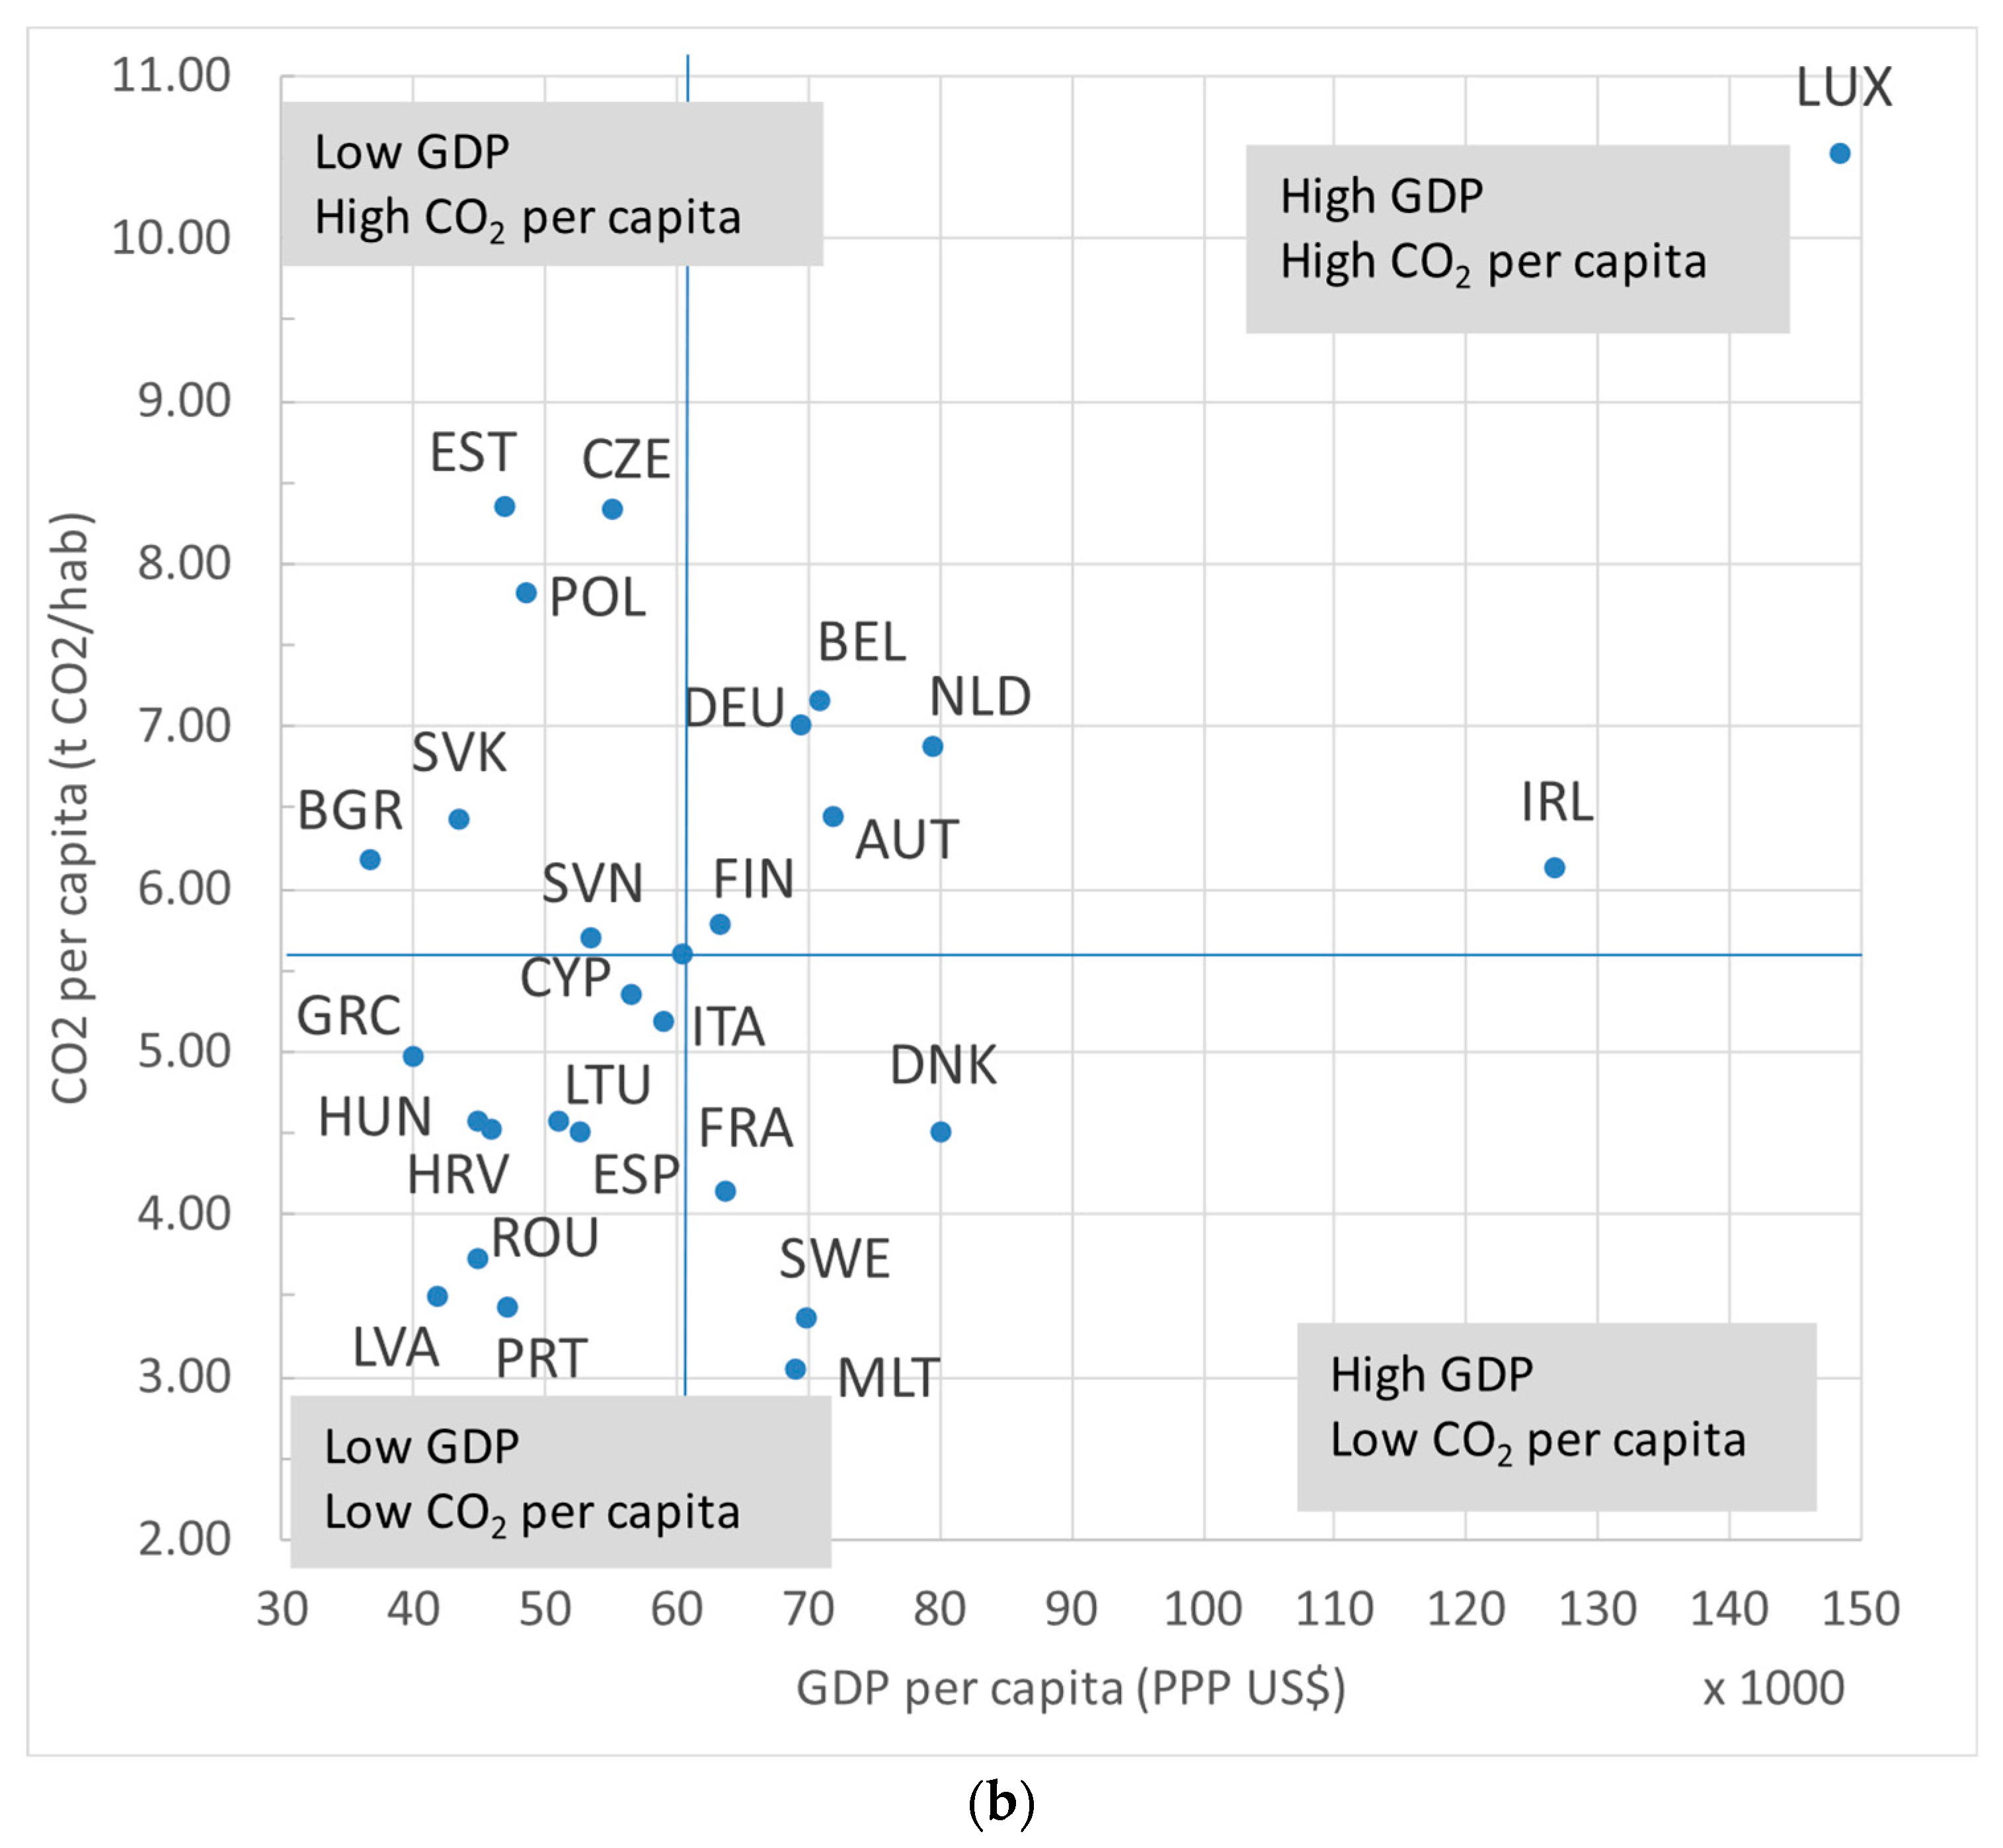
In countries with low carbon intensity, reducing economic growth is the only means by which further CO2 emissions can be achieved; however, if GDP is already low, such reductions are largely unfeasible and must therefore come from countries with higher GDP. In contrast, countries with higher carbon intensity still have room to decrease emissions through efficiency improvements, the expansion of renewable energy, and other mitigation strategies such as CCS. GDP itself also plays a crucial role in emission patterns. Some high-GDP countries continue to exhibit high emissions, while many nations with elevated carbon intensity tend to have lower GDP levels. The following figures provide a comparative analysis of carbon intensity relative to per capita GDP, as well as CO2 emissions per capita against per capita GDP. These comparisons reveal four distinct quadrants (Figure 5a):
  • Low GDP, High Carbon Intensity: EST, BGR, POL, CZE, SVK, GRC, SVN, HUN, HRV, CYP. These countries would require substantial improvements in carbon efficiency of economy, reducing fossil fuel reliance while allowing for moderate GDP growth.
  • High GDP, High Carbon Intensity: DEU, BEL. Representing two countries near the global average, these countries would need to slow economic expansion while simultaneously improving efficiency to achieve emission reductions.
  • Low GDP, Low Carbon Intensity: LTU, ITA, ESP, PRT, ROU, LVA. These countries should be allowed moderate economic growth while maintaining a trajectory of further carbon intensity reduction.
  • High GDP, Low Carbon Intensity: FRA, SWE, MLT, DNK, IRL, LUX, NLD, AUT, FIN. For these economies, further CO2 reductions will likely require limiting GDP growth, as carbon intensity improvements alone may no longer be sufficient.
Figure 5b, which shows per capita CO2 emissions as a function of GDP per capita, reinforces earlier conclusions and shows comparable patterns. This depiction helps to define clusters of countries with varying degrees of wealth and emissions. Countries with high GDP and high CO2 per capita (mainly LUX and IRL, but also DEU, BEL, NLD, AUT) face the challenge of reducing emissions controlling their GDP economic growth. Those with low GDP and high CO2 emissions per capita (EST, CZE, POL, SVK, BGR, SVN) retain significant room for sustainable development improving carbon efficiency of economy, while countries with moderate CO2 emissions per capita keep on maintaining a balance between economic growth and sustainability. Generally speaking, these quadrant-based analyses help to compare national performance, therefore emphasizing climate policy priorities customized to the position of each country inside the economic-emissions spectrum.

5. Conclusions

Despite the EU’s progress in reducing greenhouse gas emissions, the ambitious net-zero target set for 2050 under the European Green Deal poses substantial challenges. Focusing on three major drivers—population, economic output, and carbon intensity—this research uses Index Decomposition Analysis to evaluate the decreases in carbon intensity needed to satisfy this target. The study shows clearly and directly how economic expansion affects the difficulty of reaching emission goals.
Under a scenario of 3% annual GDP growth, carbon intensity of the economy (CO2/GDP) must decline by 11.8% annually—an exceptionally demanding figure considering the EU’s already low current intensity of 0.092 kg CO2/USD. Even with zero GDP growth, the required reduction remains high at 9.2% per year. These findings imply that without the application of sophisticated mitigation techniques like CCS, the rate of technical development would be inadequate in most possible growth scenarios. However, in a hypothetical scenario of 2% annual economic contraction, the necessary annual reduction drops to 7.3%, indicating that negative or low-growth trajectories could substantially ease the path to carbon neutrality.
Achieving deep decarbonization in EU industrial sectors would require both systemic transformations and strategic deployment of CCS. The decomposition study more precisely estimates how much technological work is needed to balance the emissions impact of economic growth. Under a high-growth scenario (+3% GDP), carbon intensity would need to deliver up to 5867 MtCO2 in reductions by 2050, with CCS contributing only 10–15% of this total. In a zero-growth scenario, the required reductions decline to 4923 MtCO2, while in the −1% GDP case, the figure reaches 4594 MtCO2, nearly matching the 2023 level of 4569 MtCO2—implying that further technological breakthroughs might be largely unnecessary under such conditions. Together with continued investment in CCS, carbon management, and large-scale electrification, these results highlight the need of balancing economic expansion with environmental sustainability in a realistic and cost-effective manner to reach 2050 carbon neutrality.
These results suggest that more moderate or limited economic growth paths might enable more attainable climate objectives, better matching technological capabilities and environmental restrictions. Higher growth trajectories, on the other hand, would require rapid and disproportionate technical and financial efforts and innovations, making the achievement of environmental goals extremely difficult.

Funding

This research was funded by the Government of Aragon, grant number T46_23R: Energía y CO2.

Institutional Review Board Statement

Not applicable.

Informed Consent Statement

Not applicable.

Data Availability Statement

The data presented in this study are openly available in FigShare at 10.6084/m9.figshare.30737924.

Acknowledgments

During the preparation of this manuscript, the author used ChatGPT-5.2 for the purposes of improving readability and language. The author has reviewed and edited the output and take full responsibility for the content of this publication.

Conflicts of Interest

The author declares no conflicts of interest.

Abbreviations

The following abbreviations are used in this manuscript:
CCSCarbon Capture and Storage
CINTCarbon intensity of the economy (CO2/GDP)
ENEEnergy Intensity (Energy/GDP)
EUEuropean Union
GDPGross Domestic Product
IDAIndex Decomposition Analysis
LMDILogarithmic Mean Divisia Index method
POPPopulation

References

  1. European Commission. The European Green Deal. Available online: https://commission.europa.eu/strategy-and-policy/priorities-2019-2024/european-green-deal_en?prefLang=es (accessed on 6 October 2025).
  2. European Commission. Progress on Climate Action—Climate Action. Available online: https://climate.ec.europa.eu/eu-action/climate-strategies-targets/progress-climate-action_en (accessed on 6 October 2025).
  3. Energy Institute. Statistical Review of World Energy; Energy Institute: London, UK, 2013. [Google Scholar]
  4. Tavakoli, A. A journey among top ten emitter country, decomposition of “Kaya Identity”. Sustain. Cities Soc. 2018, 38, 254–264. [Google Scholar] [CrossRef]
  5. Nakicenovic, N. Decarbonization as a long-term energy strategy. In Environment, energy, and economy: Strategies for sustainability; Kaya, Y., Yokoburi, K., Eds.; United Nations Univ. Press: Tokyo, Japan, 1997; Chapter 13; ISBN 9280809113. [Google Scholar]
  6. Bigerna, S.; Polinori, P. Convergence of KAYA components in the European Union toward the 2050 decarbonization target. J. Clean. Prod. 2022, 366, 132950. [Google Scholar] [CrossRef]
  7. González-Torres, M.; Pérez-Lombard, L.; Coronel, J.F.; Maestre, I.R. Revisiting Kaya Identity to define an Emissions Indicators Pyramid. J. Clean. Prod. 2021, 317, 128328. [Google Scholar] [CrossRef]
  8. Bulut, U.; Durusu-Ciftci, D. Revisiting energy intensity convergence: New evidence from OECD countries. Environ. Sci. Pollut. Res. 2018, 25, 12391–12397. [Google Scholar] [CrossRef] [PubMed]
  9. Yakymchuk, A.; Maxand, S.; Lewandowska, A. Economic Analysis of Global CO2 Emissions and Energy Consumption Based on the World Kaya Identity. Energies 2025, 18, 1661. [Google Scholar] [CrossRef]
  10. Ang, B.W. LMDI decomposition approach: A guide for implementation. Energy Policy 2015, 86, 233–238. [Google Scholar] [CrossRef]
  11. Xu, X.Y.; Ang, B.W. Index decomposition analysis applied to CO2 emission studies. Ecol. Econ. 2013, 93, 313–329. [Google Scholar] [CrossRef]
  12. Fernández González, P.; Landajo, M.; Presno, M.J. Multilevel LMDI decomposition of changes in aggregate energy consumption. A cross country analysis in the EU-27. Energy Policy 2014, 68, 576–584. [Google Scholar] [CrossRef]
  13. Bianco, V.; Cascetta, F.; Nardini, S. Analysis of the carbon emissions trend in European Union. A decomposition and decoupling approach. Sci. Total Environ. 2024, 909, 168528. [Google Scholar] [CrossRef]
  14. Chovancová, J.; Štofejová, L.; Gavura, Š.; Novotný, R.; Rigelský, M. Assessing energy consumption and greenhouse gas emissions in EU member states—Decomposition analysis. Entrep. Sustain. Issues 2024, 11, 242–259. [Google Scholar] [CrossRef]
  15. Ito, Y.; Fujii, H. Decomposition Analysis of CO2 Emissions in 138 Countries During the COVID-19 Pandemic. Energies 2024, 17, 5835. [Google Scholar] [CrossRef]
  16. Rivera-Niquepa, J.D.; Yusta, J.M.; Oliveira-De Jesús, P.M. Kaya factor decomposition assessment of energy-related CO2 emissions in Spain: A multi-period and multi-sector approach. Sustain. Energy Technol. Assess. 2025, 74, 104156. [Google Scholar] [CrossRef]
  17. Cámara-Aceituno, J.; Hermoso-Orzáez, M.J.; Terrados-Cepeda, J.; Zambrano, A.R.; Mena-Nieto, Á.; Golpe, A.A.; Garcia-Ramos, J.-E. Exploring the driving forces of CO2 emissions in the European Union. Open Res. Eur. 2025, 5, 132. [Google Scholar] [CrossRef] [PubMed]
  18. Zhang, C.; Su, B.; Zhou, K.; Yang, S. Decomposition analysis of China’s CO2 emissions (2000–2016) and scenario analysis of its carbon intensity targets in 2020 and 2030. Sci. Total Environ. 2019, 668, 432–442. [Google Scholar] [CrossRef]
  19. Xu, S.C.; He, Z.X.; Long, R.Y. Factors that influence carbon emissions due to energy consumption in China: Decomposition analysis using LMDI. Appl. Energy 2014, 127, 182–193. [Google Scholar] [CrossRef]
  20. Ang, B.W.; Goh, T. Index decomposition analysis for comparing emission scenarios: Applications and challenges. Energy Econ. 2019, 83, 74–87. [Google Scholar] [CrossRef]
  21. Edenhofer, O.; Pichs-Madruga, R.; Sokona, Y.; Minx, J.C.; Farahani, E.; Kadner, S.; Seyboth, K.; Adler, A.; Baum, I.; Brunner, S.; et al. (Eds.) Climate Change 2014 Mitigation of Climate Change Working Group III Contribution to the Fifth Assessment Report of the Intergovernmental Panel on Climate Change; IPCC: Geneva, Switzerland, 2014. [Google Scholar]
  22. Yang, F.; Yang, X.; Tian, X.; Wang, X.; Xu, T. Decomposition analysis of CO2 emissions of electricity and carbon-reduction policy implication: A study of a province in China based on the logarithmic mean Divisia index method. Clean Energy 2023, 7, 340–349. [Google Scholar] [CrossRef]
  23. Zhao, X.; Rao, Z.; Lin, J.; Zhang, X. Scenario forecasting of carbon neutrality by combining the LEAP model and future land-use simulation: An empirical study of Shenzhen, China. Sustain. Cities Soc. 2025, 125, 106367. [Google Scholar] [CrossRef]
  24. Liu, X.; Qiu, T.; Xie, Y.; Yin, Q. Carbon emission prediction and the reduction pathway in Huairou District (China): A scenario analysis based on the LEAP model. Sustainability 2025, 17, 8660. [Google Scholar] [CrossRef]
  25. International Energy Agency IEA. Net Zero by 2050—Analysis—IEA. Available online: https://www.iea.org/reports/net-zero-by-2050#downloads (accessed on 11 September 2024).
  26. Net Zero Roadmap: A Global Pathway to Keep the 1.5 °C Goal in Reach—Analysis—IEA. Available online: https://www.iea.org/reports/net-zero-roadmap-a-global-pathway-to-keep-the-15-0c-goal-in-reach (accessed on 11 September 2024).
  27. Global CCS Institute. State of the Art: CCS Technologies 2022; Global CCS Institute: Melbourne, Australia, 2022. [Google Scholar]
  28. Shukla, P.R.; Skea, J.; Slade, R.; Al Khourdajie, A.; van Diemen, R.; McCollum, D.; Pathak, M.; Some, S.; Vyas, P.; Fradera, R.; et al. (Eds.) Working Group III Contribution to the Sixth Assessment Report of the Intergovernmental Panel on Climate Change Mitigation of Climate Change; IPCC: Geneva, Switzerland, 2022. [Google Scholar]
  29. Slameršak, A.; Kallis, G.; O’Neill, D.W.; Hickel, J. Post-growth: A viable path to limiting global warming to 1.5 °C. One Earth 2024, 7, 44–58. [Google Scholar] [CrossRef]
  30. Mastini, R.; Kallis, G.; Hickel, J. A Green New Deal without growth? Ecol. Econ. 2021, 179, 106832. [Google Scholar] [CrossRef]
  31. Richardson, K.; Steffen, W.; Lucht, W.; Bendtsen, J.; Cornell, S.E.; Donges, J.F.; Drüke, M.; Fetzer, I.; Bala, G.; von Bloh, W.; et al. Earth beyond six of nine planetary boundaries. Sci. Adv. 2023, 9, eadh2458. [Google Scholar] [CrossRef] [PubMed]
  32. He, H.; Jiang, W.; Gao, Z.; Liu, T. Influencing factors of carbon emissions from final consumption in the EU28. Energy Rep. 2025, 12, 2025. [Google Scholar] [CrossRef]
  33. Eurostat. Database. 2025. Available online: https://ec.europa.eu/eurostat/data/database (accessed on 6 October 2025).
  34. World Bank. World Development Indicators. 2025. Available online: https://databank.worldbank.org/source/world-development-indicators (accessed on 13 January 2026).
  35. Mahony, T.O. Decomposition of Ireland’s carbon emissions from 1990 to 2010: An extended Kaya identity. Energy Policy 2013, 59, 573–581. [Google Scholar] [CrossRef]
  36. Ang, B.W. Decomposition analysis for policymaking in energy: Which is the preferred method? Energy Policy 2004, 32, 1131–1139. [Google Scholar] [CrossRef]
  37. Ang, B.W.; Xu, X.Y.; Su, B. Multi-country comparisons of energy performance: The index decomposition analysis approach. Energy Econ. 2015, 47, 68–76. [Google Scholar] [CrossRef]
  38. Martinez, G.; Jaxa-Rozen, M. Carbon Capture Science & Technology The role of carbon capture in decarbonising EU industries: A review of projections for 2030 and 2050 Intergovernmental Panel on Climate Change Network for Greening the Financial System. Carbon Capture Sci. Technol. 2025, 17, 100528. [Google Scholar] [CrossRef]
  39. Kubiszewski, I.; Costanza, R.; Franco, C.; Lawn, P.; Talberth, J.; Jackson, T.; Aylmer, C. Beyond GDP: Measuring and achieving global genuine progress. Ecol. Econ. 2013, 93, 57–68. [Google Scholar] [CrossRef]
  40. Brown, C.; Lazarus, E. Genuine Progress Indicator for California: 2010–2014. Ecol. Indic. 2018, 93, 1143–1151. [Google Scholar] [CrossRef]
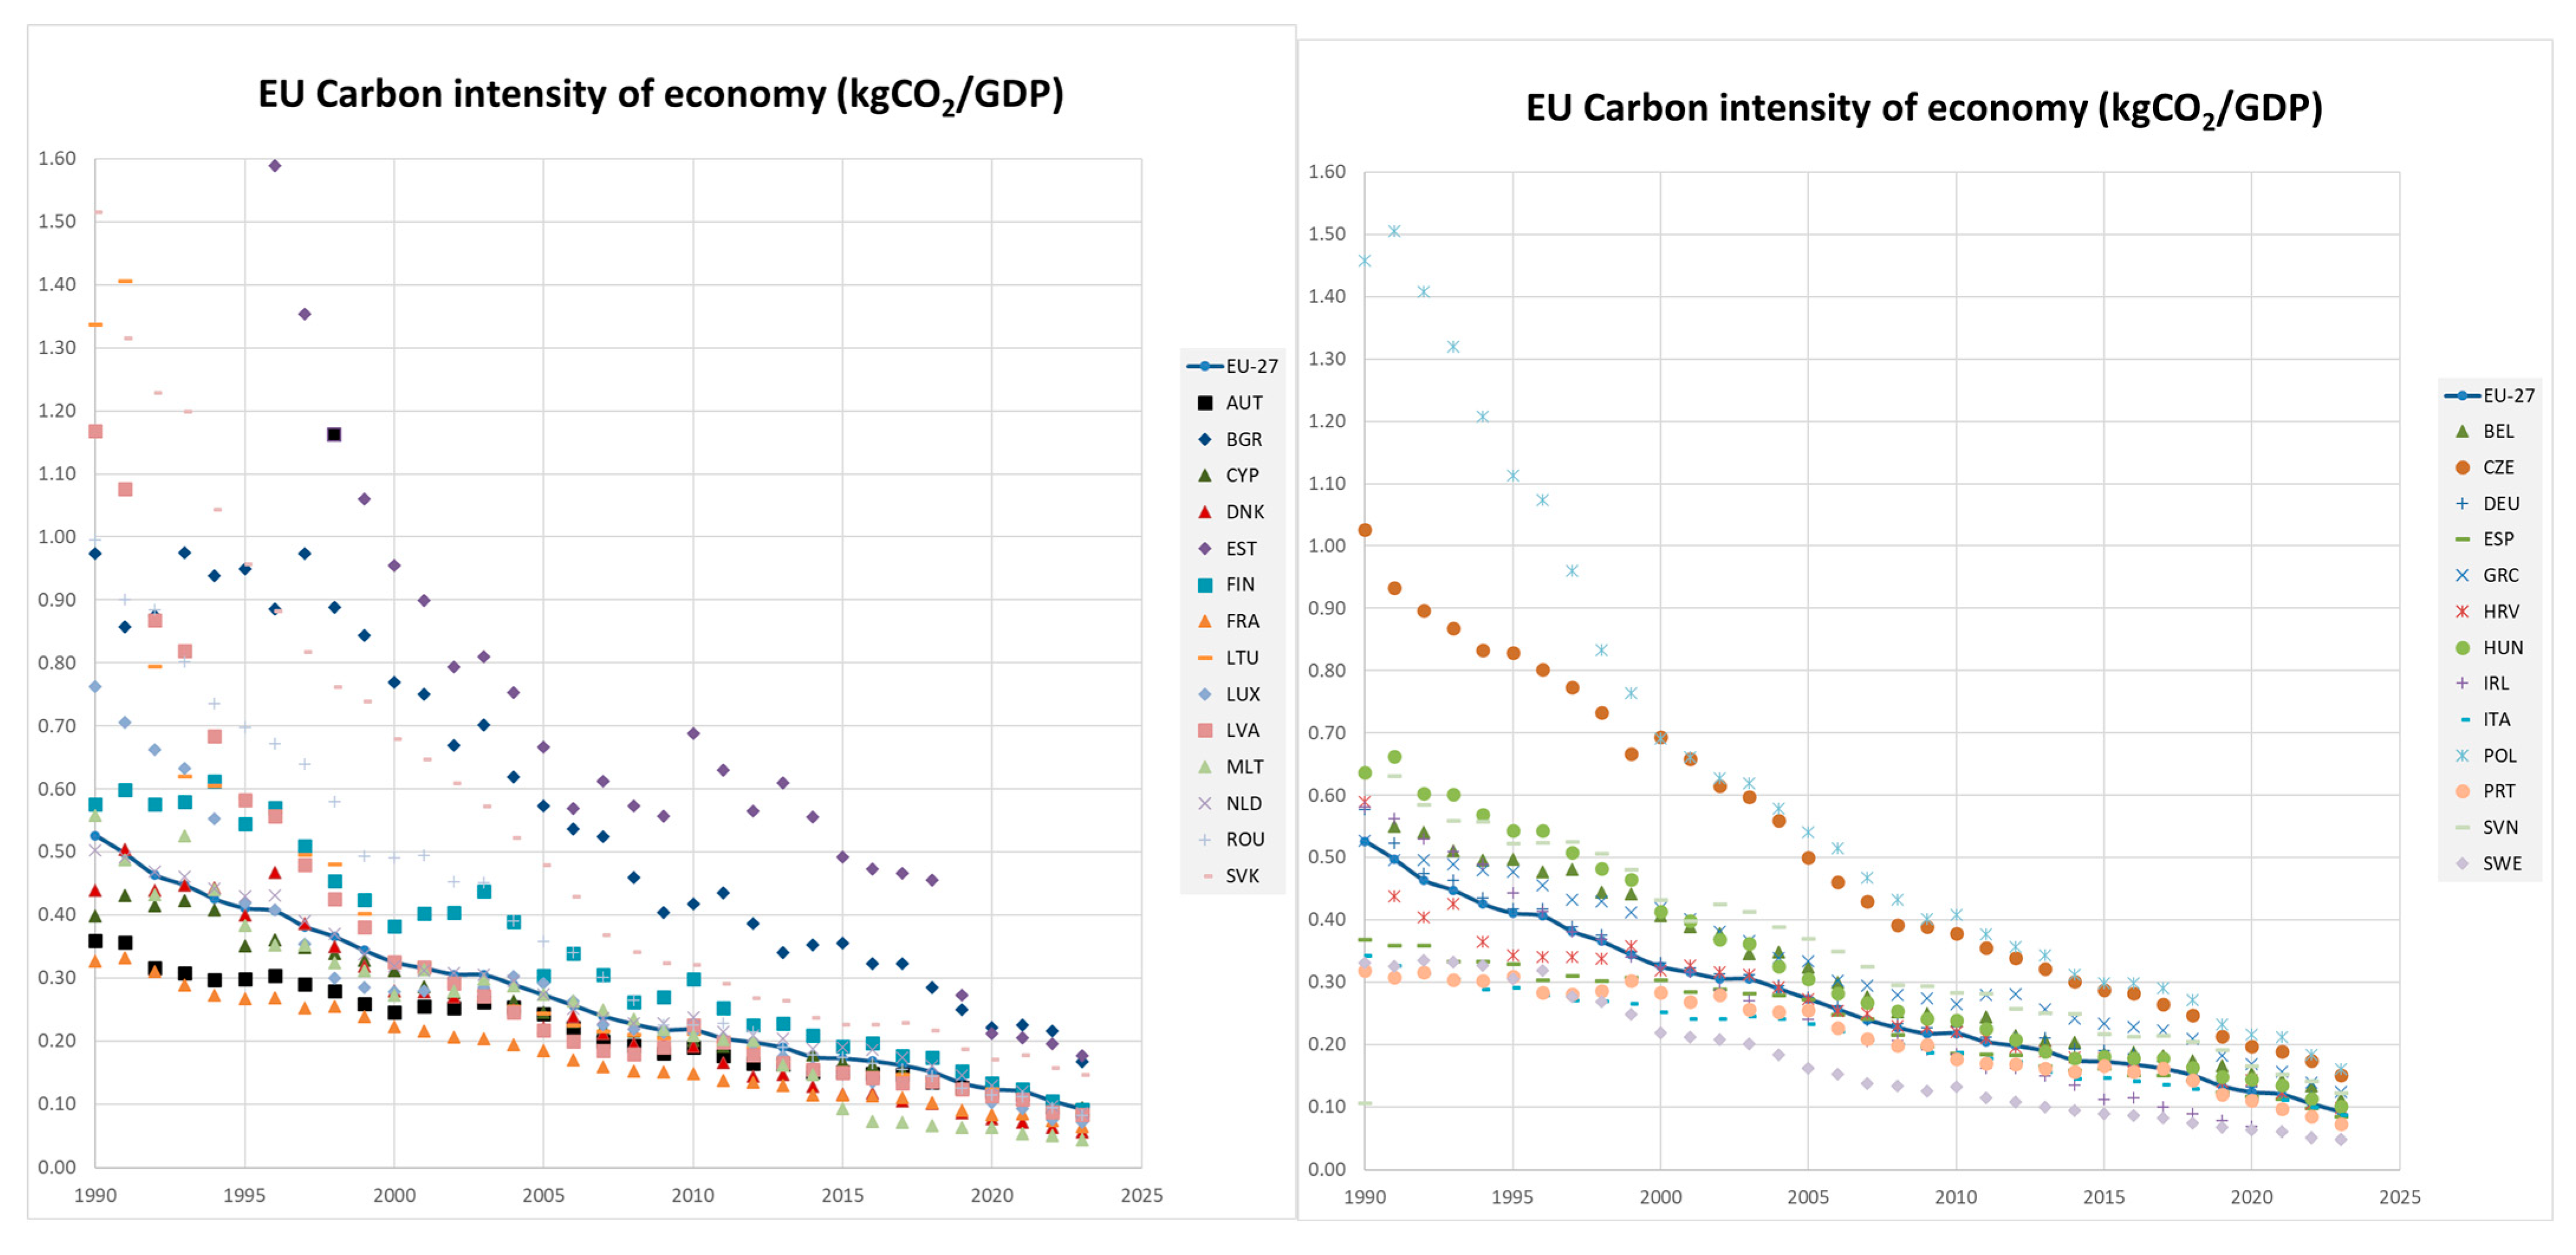
Figure 1. Carbon intensity of the economy in EU-27 (CO2/GDP per capita).
Sustainability 18 01043 g001
Figure 2. CO2 emissions (MtCO2) in EU-27.
Sustainability 18 01043 g002
Figure 3. Quantification of the influence of Population (DC_POP), GDP (DC_GDP) and carbon intensity (DC_CO2E) in CO2 emissions (DeltaCO2) relative to 1990.
Sustainability 18 01043 g003
Figure 4. IDA for future carbon emissions (MtCO2) in EU-27 achieving the 2050 targets with 3.0 and 0.0% increase in GDP and 11.8 and 9.2% reduction of carbon intensity.
Sustainability 18 01043 g004aSustainability 18 01043 g004b
Figure 5. (a) Carbon intensity of the economy (CO2/GDP per capita) and (b) CO2 emissions per capita (tCO2) in EU-27 depending on the GDP per capita.
Sustainability 18 01043 g005aSustainability 18 01043 g005b
Table 1. Relative annual reduction in the economy’s required carbon intensity under varying EU GDP growth scenarios up to 2050.
Annual GDP Growth+3.0%+2.0%+1.0%0.0%−0.5%−1.0%
GDP 2050 ($/p)92,01270,70454,19041,44236,18031,917
CO2/GDP−11.8%−10.9%−10.1%−9.2%−8.7%−8.2%
CO2/GDP 2050 (kg CO2/$) 0.00460.00600.00760.01000.01160.0134
Table 2. IDA about the relative annual reduction in the carbon intensity for different GDP increments.
Year 1990Year 2023GDP +3%Year 2050
GDP 0%
GDP −1%
CO2 emissions (Mt CO2) 3809.72512.1196.2193.4195.3
Population (Mhab) 420.52448.80461.08461.08461.08
GDP per capita $15470$41,422$92,012$41,422$31,578
Carbon intensity0.585600.135120.00460.01010.0134
IDA additive
Population-+202.8+111.7+111.7+112.0
GDP-+3069.0+2162.7+1195.1+868.1
Carbon intensity -−4569.4−5867.4−4923.0−4594.6
Table 3. Technological (Carbon intensity of the economy) CO2 reduction necessities in different GDP growth scenarios and projections of the percentage covered by CCS in 2050.
Annual GDP Growth+3.0%+2.0%+1.0%0.0%−0.5%−1.0%
Technological CO2 reduction necessities (Mt)−5867.4−5575.2−5249.0−4923.0−4758.6−4591.6
Difference relative to 2023 values (MtCO2)
(Carbon intensity in 2023: −4569.4 MtCO2)
1298.01005.8679.6353.6189.225.2
Estimation of the percentage covered by CCS in 205013%17%25%48%90%100%
Disclaimer/Publisher’s Note: The statements, opinions and data contained in all publications are solely those of the individual author(s) and contributor(s) and not of MDPI and/or the editor(s). MDPI and/or the editor(s) disclaim responsibility for any injury to people or property resulting from any ideas, methods, instructions or products referred to in the content.