Article

Construction-Land Expansion and Economic Intensification Shape Land-Use Carbon Emissions in the Yellow River Basin Provinces

1
College of Geography and Environment, Shandong Normal University, Jinan 250014, China
2
Key Laboratory of Comprehensive Observation of Polar Environment (Sun Yat-sen University), Ministry of Education, Zhuhai 519082, China
*
Author to whom correspondence should be addressed.
Sustainability 2026, 18(17), 9153; https://doi.org/10.3390/su18179153 (registering DOI)
Submission received: 7 August 2026 / Revised: 30 August 2026 / Accepted: 4 September 2026 / Published: 7 September 2026
(This article belongs to the Section Environmental Sustainability and Applications)

Abstract

Land-use change affects regional carbon accounting through ecological conversion and the concentration of energy-intensive economic activity. We combined 30 m China Land Cover Dataset maps for 2010, 2015, 2020, and 2025 with provincial socioeconomic and energy statistics to quantify land-use transitions and carbon emissions across nine Yellow River Basin provinces. Construction-land-associated emissions were decomposed using the logarithmic mean Divisia index, factors associated with land expansion were examined using random-forest models, and three 2030 scenarios were evaluated. Construction land expanded by 38.87% from 2010 to 2025, with 71.33% of new construction land converted from cropland and 17.75% from grassland. Net land-use carbon emissions increased by 69.82%, from 1139.06 to 1934.33 million t C. Economic-output density contributed 1144.84 million t C to the increase in construction-land-associated emissions, compared with 576.11 million t C from land expansion, whereas declining energy intensity offset 922.72 million t C. Projected 2030 emissions ranged from 2124.72 million t C under ecological protection to 2866.55 million t C under urban expansion. Construction-land expansion was substantial, but economic-output density made the larger positive contribution to historical emission growth. The projected 2030 estimates depended on the combined trajectories of construction-land demand, economic growth, and energy intensity. These findings highlight the importance of coordinating land-use planning, economic development, and energy-efficiency improvement for sustainable low-carbon transitions.

1. Introduction

Land-use change is one of the principal pathways through which human activities alter regional carbon sources and sinks [1,2]. Conversions among cropland, forest land, grassland, water bodies, unused land, and construction land affect vegetation cover, soil carbon storage, and ecosystem carbon uptake, while also changing the spatial distribution of energy-consuming activities [1,3]. Unlike emissions generated directly by energy consumption, the carbon consequences of land use include both ecological processes, such as carbon storage in vegetation and soils, and socioeconomic activities, such as industrial production and urban living [4]. Ecological land can partly offset emissions through carbon uptake, whereas construction land concentrates industrial, infrastructure, residential, and service activities. Regional land-use carbon accounting therefore needs to distinguish the effects of land conversion from the socioeconomic processes carried by construction land [2,3,4].
Remote-sensing data provide continuous observations of land-cover change and identify where these changes occur. Long-term satellite-derived land-cover products, particularly those based on Landsat imagery, can reconstruct historical land-use patterns, calculate transition matrices, and monitor large-scale changes in construction and ecological land [5,6,7,8]. Unlike carbon inventories based only on statistical data, remote sensing shows both the location of change and the source and destination land types [6,7]. This information is important for construction-land expansion because conversion from cropland, forest land, or grassland has different consequences for agricultural production and ecosystem functions.
Three complementary approaches are commonly used to study land-use carbon emissions [9,10,11,12]. The first is coefficient-based accounting, which assigns specific emission or absorption coefficients to cropland, forest land, grassland, water bodies, and other land types. This method is transparent and facilitates comparisons of carbon emissions and uptake across different periods. However, its results depend strongly on the coefficients selected, and it cannot fully represent complex ecosystem carbon-cycle processes. The second approach is activity- or energy-based accounting, which estimates emissions using data on energy consumption, industrial structure, gross domestic product (GDP), population, or nighttime lights. This approach better represents the socioeconomic activities supported by construction land and their emission intensity, but it generally gives limited consideration to ecological carbon sinks and provides little information about the specific land conversions underlying emission changes. The third approach combines land-use simulations with carbon accounting to compare future land-use patterns and emissions under alternative development pathways. Existing scenario-based studies, however, often focus on land area or total emissions and pay less attention to the mechanisms responsible for differences among scenarios.
Previous studies in the Yellow River Basin have investigated the spatiotemporal evolution of land-use carbon emissions, the relationship between carbon emissions and ecosystem service value, and future carbon emissions or ecosystem carbon stocks under alternative land-use scenarios [13,14,15,16]. These studies generally find that construction-land-associated emissions account for the largest share of total emissions in coefficient-based assessments and that construction-land expansion frequently occurs at the expense of cropland. However, the carbon quantities reported by different studies are not always directly comparable. Energy-related emissions assigned to construction land mainly arise from industrial production, commercial activities, and residential energy use occurring on that land. In contrast, carbon-stock changes caused by land conversion primarily reflect gains or losses in vegetation and soil carbon. Both are associated with land use, but they represent different components of the regional carbon budget.
Recent advances in continuous land-cover datasets have made it possible to link land-conversion records with carbon accounting in a consistent spatial and temporal framework. Annual or multi-year products derived from Landsat and other satellite imagery provide detailed records of land conversion [5,17,18]. In China, the 30 m China Land Cover Dataset (CLCD) has been used to monitor construction-land expansion, cropland conversion, vegetation change, and ecological restoration [7,17,18], and it can identify the source land types of newly formed construction or ecological land.
Two gaps nevertheless remain in many regional studies. First, area totals do not show which productive or ecological land types were displaced during construction-land expansion. Second, aggregate construction-land-associated emissions do not distinguish the effects of land-area growth, economic activity per unit land, and energy use per unit economic output. City-level studies indicate that both construction-land expansion and the intensity of activity carried by that land affect emissions, while industrial structure, production technology, and land-use efficiency alter construction-land emission intensity [19,20]. Combining 30 m source-to-destination transitions with emission decomposition can therefore identify where new construction land came from and separate the land, economic, and energy contributions to the associated emission trajectory. Such integrated assessments are essential for evaluating sustainable land-use pathways because carbon mitigation requires balancing urban development needs with ecological conservation and energy-efficiency improvement. However, the relative roles of land expansion and socioeconomic intensification remain insufficiently quantified at regional scales. Existing Yellow River Basin studies have often examined historical emission patterns, future land-use scenarios, carbon stocks, or ecosystem-service relationships separately [13,14,15,16]. The contribution of this study is to link a 2010–2025 30 m source-to-destination transition record with separation of construction-land area, economic-output density, and energy intensity, followed by consistent 2030 provincial scenario comparisons.
This study integrates CLCD land-cover data for 2010, 2015, 2020, and 2025 with provincial socioeconomic and energy statistics. The objectives are to: (1) characterize land-use structure and major transition pathways across the Yellow River Basin provinces from 2010 to 2025; (2) estimate land-use carbon emissions and separate the construction-land area, economic-output-density, and energy-intensity effects on construction-land-associated emission growth; and (3) compare land-use and carbon-emission outcomes under natural-development, urban-expansion, and ecological-protection scenarios for 2030. Random-forest models provide an exploratory comparison of factors associated with land expansion during 2020–2025. These analyses address two related questions: where construction land has expanded and why associated emissions have increased.

2. Materials and Methods

2.1. Study Area

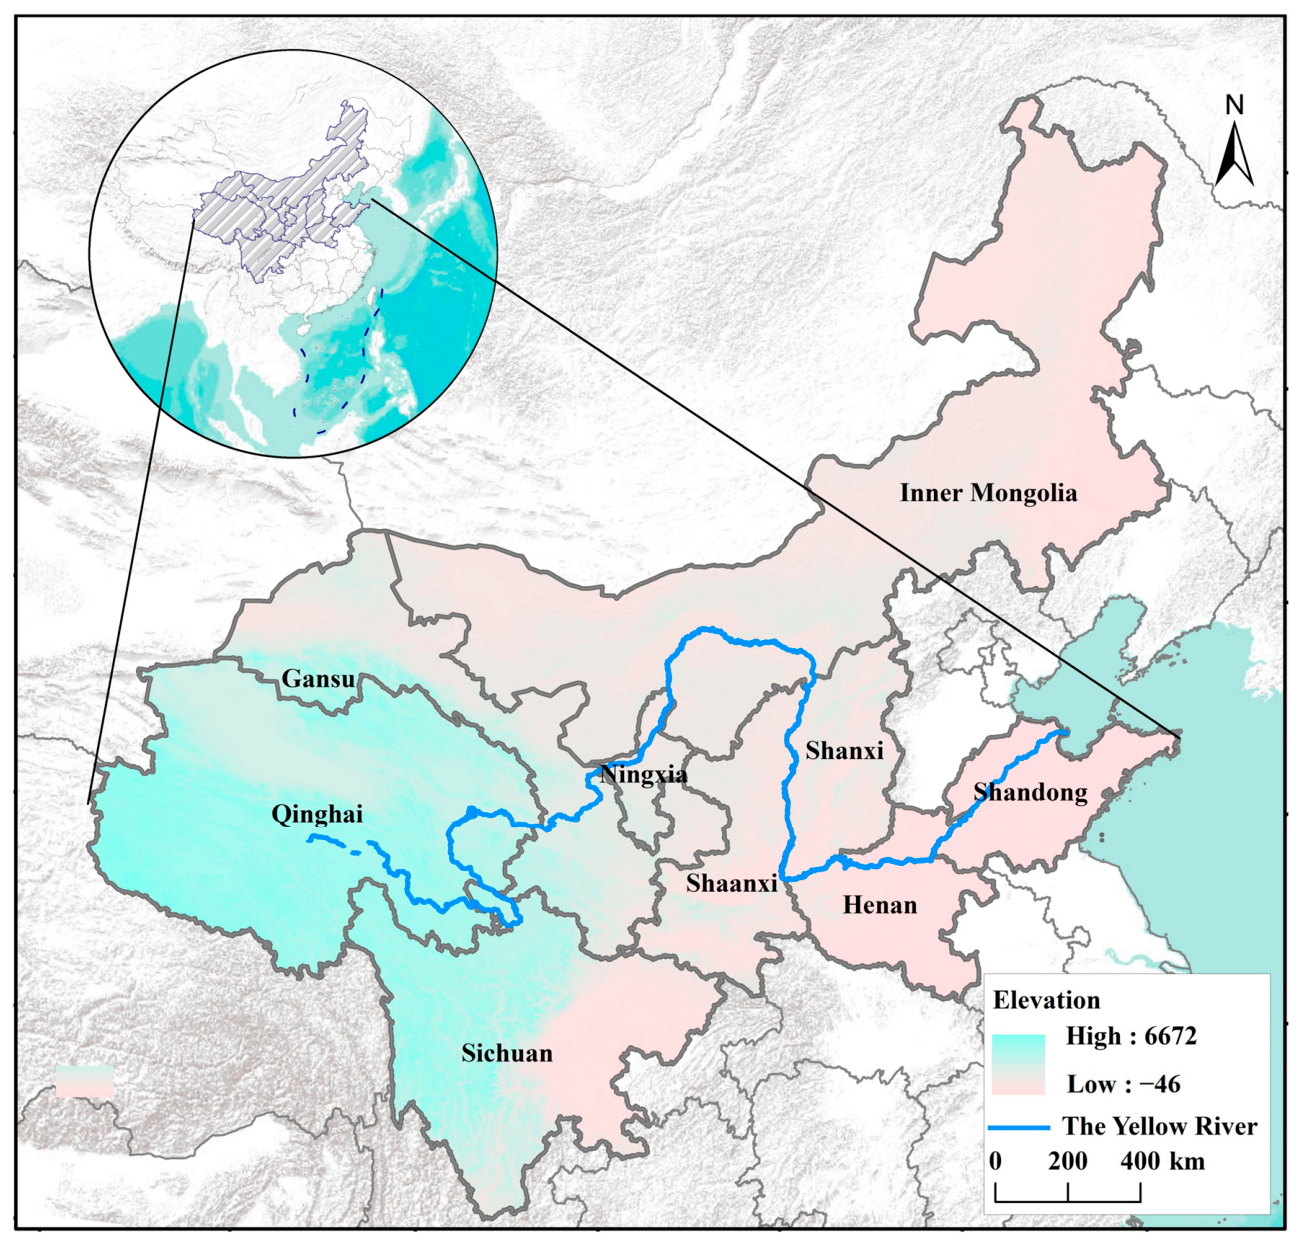
The study area comprises nine provincial-level administrative units associated with the Yellow River Basin: Qinghai, Sichuan, Gansu, Shaanxi, Ningxia, Inner Mongolia, Shanxi, Henan, and Shandong (Figure 1). Together, these provinces cover approximately 3.49 million km2 and extend from the northeastern Qinghai–Tibet Plateau across the Loess Plateau and the arid and semi-arid regions of northern China to the North China Plain. All land-use statistics, carbon-emission estimates, and 2030 scenario results were calculated for these administrative units to ensure consistency with provincial socioeconomic and energy-intensity data. The analysis uses the complete administrative territory of each province because the socioeconomic and energy statistics are available at provincial scale. Accordingly, “Yellow River Basin provinces” refers to these nine administrative units and is not synonymous with the hydrological Yellow River Basin boundary.
The region contains pronounced gradients in topography, climate, ecological function, land-use structure, population density, and economic development. The upper part of the study area is dominated by extensive grassland, water bodies, and ecologically sensitive landscapes. The middle part combines complex terrain and fragile ecosystems with resource-based industries and large areas of grassland and unused land. Henan and Shandong in the lower part are characterized by dense populations, intensive cropland, developed industrial and service sectors, and sustained demand for construction land [21,22]. These contrasts have produced marked spatial differences in land-use composition, transition pathways, and carbon-emission intensity.
These environmental and socioeconomic gradients make the nine provinces a useful comparative region. The upper and middle parts contain extensive ecological land and resource-based industries, whereas the lower part combines intensive agriculture with dense urban and industrial development. The study area therefore captures both strong land-conversion pressures and large differences in the intensity of activities carried by construction land [22,23].

2.2. Data Sources and Preprocessing

Land-use data were obtained from the China Land Cover Dataset, a 30 m annual product generated from Landsat imagery on the Google Earth Engine platform [17,24]. CLCD provides temporally consistent coverage across China. Maps for 2010, 2015, 2020, and 2025 were used to quantify land-use structure, construct transition matrices, estimate historical carbon emissions, and support the 2030 scenario analysis. The original CLCD validation reported an overall accuracy of 79.31% based on 5463 independent visually interpreted samples, with year-specific overall accuracies of 76.45–82.51% [17].
The original CLCD classes were reclassified into six land-use types: cropland, forest land, grassland, water bodies, construction land, and unused land. Forest and shrub were merged into forest land; water and wetland were merged into water bodies; impervious surface was assigned to construction land; and barren land and snow/ice were assigned to unused land. Land-use area statistics and transition matrices were calculated directly from the original 30 m maps to retain small and spatially fragmented changes, particularly those involving construction land and water bodies. For mapping and land-use expansion modelling, the 30 m transition results and explanatory variables were aggregated or resampled to a common 1 km grid. Within each 1 km grid cell, the areas of all land-use transitions identified from the underlying 30 m pixels were calculated, and the transition occupying the largest changed area was defined as the dominant transition type. For the binary model of each target land-use type, a grid cell was labelled as expansion when its dominant transition represented conversion from another land-use type to the target type; cells with no conversion to the target type were labeled as non-expansion samples. This reclassification harmonizes CLCD with the six-class carbon-accounting framework and does not imply that the merged subclasses have identical vegetation, soil, hydrological, or carbon-cycle properties. Applying one coefficient to each aggregated class is therefore treated as an accounting simplification.
Provincial secondary-industry GDP, tertiary-industry GDP, total GDP, and resident population for 2010, 2015, and 2020 were obtained from national population censuses or sample surveys, national and provincial statistical yearbooks, and the China Economic Information Network database. Population and GDP data for 2025 were obtained from provincial statistical communiqués. Energy consumption per unit of GDP for 2010, 2015, and 2020 was compiled from official provincial energy-intensity bulletins, the China Energy Statistical Yearbook, and provincial statistical yearbooks. Complete and consistently defined observed 2025 energy-intensity values were not available in a directly comparable form for all nine provinces, so the 2025 values were estimated from the most recent provincial records and trends. For provinces with annual observations through 2024, the mean annual rate of change during 2021–2024 was applied to the 2024 value. Where the annual series was incomplete, the annualized decline implied by the 2020 baseline and the cumulative 14th Five-Year Plan target was used. All energy-intensity indicators were expressed as tonnes of standard coal equivalent per 104 CNY on a comparable-price equivalent-value basis [25,26,27]. Secondary- and tertiary-industry GDP were used to estimate construction-land-associated carbon emissions, whereas population and total GDP were used to calculate emission-intensity indicators. Carbon-emission and carbon-absorption coefficients for non-construction land were adopted from Ye and Ming [28]. This treatment is reported explicitly because uncertainty in energy intensity has the largest influence on the absolute 2030 estimates in the sensitivity analysis.
Ten explanatory variables were selected to characterize the terrain, climatic, vegetation, socioeconomic, and locational conditions associated with recent land-use expansion: elevation, slope, temperature, precipitation, NDVI, GDP, population density, distance to roads, distance to railways, and distance to water bodies. These variables represent environmental constraints, human-activity intensity, and accessibility conditions commonly considered in land-use expansion modelling [11,12]. Elevation, temperature, precipitation, gridded GDP, population density, and NDVI were obtained from the Resource and Environment Science and Data Center of the Chinese Academy of Sciences [29]. Slope was derived from elevation. Road, railway, and river-network data were obtained from OpenStreetMap [30], and Euclidean-distance rasters were generated for the corresponding features. Temperature, precipitation, NDVI, GDP, and population density were represented by their 2020 values to align with the beginning of the 2020–2025 expansion period; elevation and slope were treated as static variables.
All spatial datasets were projected to a common coordinate system and clipped to the study area. The land-use maps for 2010, 2015, 2020, and 2025 were harmonized to the same grid system before overlay analysis. Land-use areas were calculated for each province and each land-use type. Transition matrices were produced by overlaying land-use maps from adjacent periods, including 2010–2015, 2015–2020, and 2020–2025. These matrices were used to quantify historical land-use conversion and to provide the transition-probability basis for the natural-development scenario in 2030.

2.3. Methods

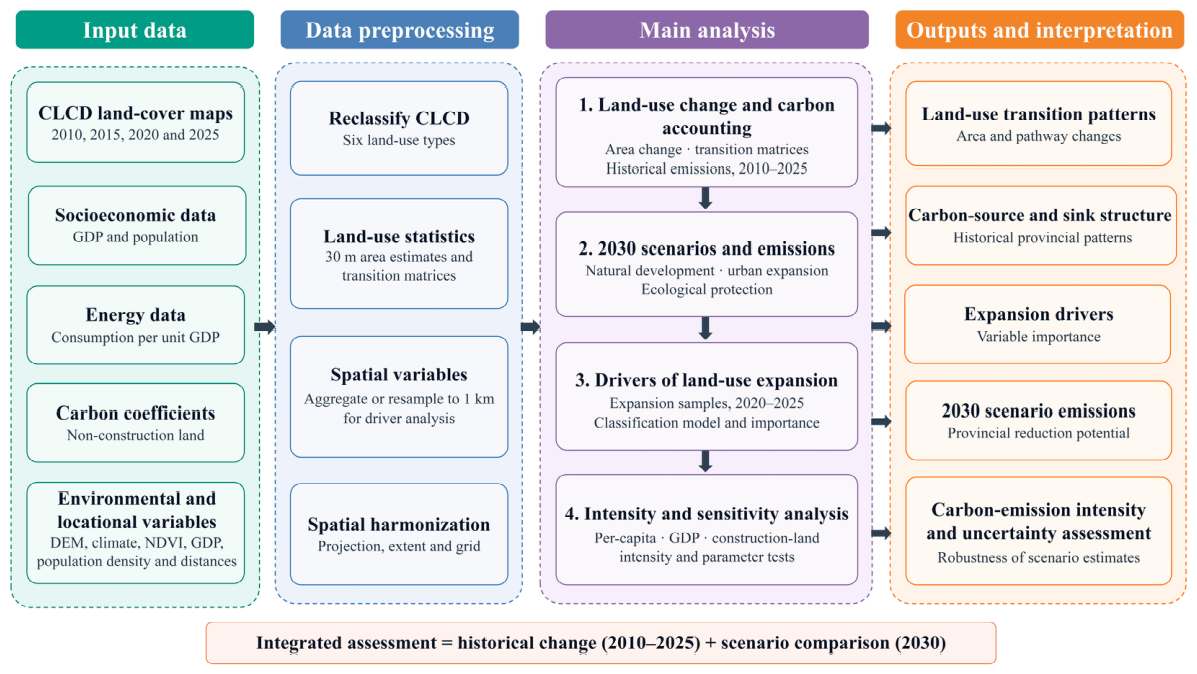
The workflow shown in Figure 2 combines four analyses: historical land transitions and carbon accounting, construction of the three 2030 scenarios, random-forest classification of recent land expansion, and provincial carbon-emission intensity analysis.

2.3.1. Land-Use Change and Carbon-Emission Accounting

Land-use change from 2010 to 2025 was analyzed using the reclassified CLCD maps for 2010, 2015, 2020, and 2025. For each province and each period, the area of cropland, forest land, grassland, water bodies, construction land, and unused land was calculated. Changes in land-use area were obtained by comparing the area of each land-use type between two adjacent periods, namely 2010–2015, 2015–2020, and 2020–2025. These results were used to describe the overall direction and magnitude of land-use change in the Yellow River Basin provinces. Land-use transition matrices were generated by overlaying land-use maps from two adjacent periods. Each matrix records the area converted from one land-use type in the initial year to another land-use type in the final year [31,32]. The transition matrices were used to identify the stability of different land-use types and the main conversion pathways among cropland, forest land, grassland, water bodies, construction land, and unused land. Particular attention was paid to the source structure of newly added construction land, because construction-land expansion is closely linked with regional carbon-emission growth.
Land-use carbon emissions were estimated separately for non-construction land and construction land. These two components represent different parts of the accounting framework. Non-construction land captures area-based ecological carbon sources and sinks, whereas construction-land-associated emissions represent energy-related emissions from secondary- and tertiary-sector activities allocated to the construction land supporting those activities. For non-construction land, a coefficient-based accounting method widely used in regional land-use carbon studies was applied [28,32]. The coefficients were adopted from the synthesis of Ye and Ming [28], and the underlying reference chain is documented in Table A1 [33,34,35,36,37,38,39]. Cropland was treated as a carbon source because it is associated with agricultural production activities, while forest land, grassland, water bodies, and unused land were treated as carbon sinks. The annual carbon emission or absorption of non-construction land was calculated as follows:
E N C , t = i A i , t C i
where Ai,t is the area of non-construction land type i in year t and Ci is its annual carbon-emission or carbon-absorption coefficient (t C hm−2 yr−1). Positive values indicate carbon emissions and negative values indicate carbon absorption.
Construction-land-associated emissions were estimated using an indirect energy-accounting method based on secondary- and tertiary-sector GDP and provincial energy intensity [28,32,40,41]. Provincial secondary- and tertiary-industry GDP were recorded in units of 108 CNY and energy intensity in tonnes of standard coal equivalent (tce) per 104 CNY. The two sectoral GDP values were summed and converted to units of 104 CNY, multiplied by energy intensity to obtain energy consumption in tce, and then multiplied by the standard-coal carbon coefficient K = 0.7476 t C tce−1 [28]. For province p and year t, construction-land-associated emissions were calculated as:
E B , p , t = G D P 2 , p , t + G D P 3 , p , t × 10 4 × J p , t × K
Total land-use carbon emissions were then obtained by combining the construction-land-associated and non-construction-land components:
E t o t a l , t = p E B , p , t + E N C , t
where E B , p , t denotes construction-land-associated emissions in province p and year t, J p , t is provincial energy consumption per unit GDP, and K is the standard-coal carbon coefficient. The non-construction-land term represents area-based ecological source/sink fluxes, while the construction-land term represents the energy-related component associated with economic activities concentrated on construction land. The resulting emissions were converted to million tonnes of carbon (million t C) for reporting.
Construction-land-associated emissions were further decomposed using the additive logarithmic mean Divisia index (LMDI) method [42] to quantify the contributions of construction-land expansion, economic-output density, and energy-intensity change. For province p and year t, the construction component was factorized into construction-land area B, economic output per unit construction land Q, energy consumption per unit GDP J, and the constant carbon coefficient K:
E p , t = B p , t Q p , t J p , t K
Economic-output density was defined as secondary- and tertiary-sector GDP per unit construction-land area:
Q p , t = G D P 2 , p , t + G D P 3 , p , t × 10 4 B p , t
For each province, the initial and final years of each five-year period were compared using the logarithmic-mean weight:
L ( a , b )   =   a     b l n   a     l n   b ,   L ( a , a )   =   a
The construction-land-area, economic-output-density, and energy-intensity effects were calculated as follows:
Δ E B   =   p   L ( E p , t ,   E p , 0 )   l n ( B p , t B p , 0 ) Δ E Q   =   p   L ( E p , t ,   E p , 0 )   l n ( Q p , t Q p , 0 ) Δ E J   =   p   L ( E p , t ,   E p , 0 )   l n ( J p , t J p , 0 )
The three effects sum exactly to the observed change in construction-land-associated emissions:
E t     E 0   =   Δ E B   +   Δ E Q   +   Δ E J
where Δ E B , Δ E Q , and Δ E J denote the construction-land-area, economic-output-density, and energy-intensity effects, respectively. Because K is constant, it has no decomposition term. The additive LMDI identity is residual-free, allowing the magnitude and direction of the three contributions to be compared directly.

2.3.2. 2030 Scenario Construction and Carbon-Emission Estimation

Three land-use scenarios were constructed for 2030: natural development, urban expansion, and ecological protection. They compare alternative construction-land pathways and ecological-land constraints following the general design of multi-scenario assessments in the Yellow River Basin and other rapid urbanizing regions [11,12,14,15,28,43,44]. The three scenarios were designed to represent contrasting development pathways. Natural development (ND) follows recent trends, urban expansion (UE) represents a high-growth pathway, and ecological protection (EP) assumes stronger control of construction-land expansion.
The natural-development scenario assumes that recent land-use transition tendencies continue to 2030. The 2020–2025 land-use transition matrix was used to derive the transition probability of each land-use type. Based on the 2025 land-use structure, the transition probabilities were applied to estimate the 2030 land-use areas of cropland, forest land, grassland, water bodies, construction land, and unused land in each province.
The urban-expansion scenario used the largest construction-land increment observed in the three five-year periods. For each province, the maximum increment during 2010–2015, 2015–2020, or 2020–2025 was added to the 2025 construction-land area. Newly added construction land was allocated from other land types according to the observed source structure during 2020–2025. This pathway is an upper-bound stress test of continued rapid expansion and may exceed growth permitted by current urban-development-boundary controls [45]; it should not be interpreted as an approved land-use target.
The ecological-protection scenario was defined as a strict construction-land-control boundary. Construction-land area in 2030 was held at the 2025 level, representing zero net growth in construction land. Relative to the natural-development scenario, the avoided construction-land expansion was reassigned to forest land, grassland, and water bodies according to the recent expansion structure of ecological land, while provincial total land area remained constant. This pathway is broadly consistent with current urban-development-boundary management and ecological-land protection policies, while its parameter settings remain based on the analytical scenario design used in this study [45].
Provincial socioeconomic and energy-intensity parameters were projected using observed five-year growth or decline rates. Under natural development, secondary- and tertiary-industry GDP and energy intensity followed their mean 2010–2025 trends. Under urban expansion, sectoral GDP followed the highest observed five-year growth rates, whereas energy intensity followed the slowest decline. Under ecological protection, secondary-industry GDP followed the lowest observed growth rate, tertiary-industry GDP followed the median growth rate, and energy intensity followed the fastest decline. These settings represent an average-trend pathway, a high-growth and slow-efficiency-improvement boundary, and a low-growth and rapid-efficiency-improvement boundary, respectively [14,28,43,44]. The assumed decline in energy intensity is consistent with the 14th Five-Year Plan energy-conservation target and the national carbon-peaking framework [46,47], although the scenario-specific numerical rates remain empirically derived from the study-period data.
To maintain consistency between projected economic activity and construction-land demand, secondary- and tertiary-industry GDP were further adjusted using sector-specific elasticities estimated from the 36 province-year observations (nine provinces × four years). Separate log–log regressions related each sector’s GDP to construction-land area. The estimated elasticities, interpreted as the percentage change in sectoral GDP associated with a 1% change in construction-land area, were 0.466 for secondary industry and 0.216 for tertiary industry. These coefficients were applied to the scenario-specific change in construction-land area after the historical growth-path projection.
The projected 2030 land-use areas, socioeconomic parameters, and energy-intensity parameters were then used to calculate land-use carbon emissions under each scenario. For non-construction land, carbon emissions or absorptions were estimated using the same coefficient-based method as in the historical period. For construction land, emissions were estimated using projected secondary- and tertiary-industry GDP, projected energy consumption per unit of GDP, and the carbon-emission coefficient of standard coal. The scenario results were compared to evaluate the carbon-emission effects of natural development, accelerated urban expansion, and ecological protection.

2.3.3. Analysis of Factors Associated with Land-Use Expansion

The factors associated with land-use expansion from 2020 to 2025 were analyzed using random-forest classification and variable importance [48]. For each land-use type, a 1 km grid cell was defined as an expansion sample when its dominant underlying 30 m transition represented conversion from another land type to the target type. Cells not assigned to expansion of the target type were treated as non-expansion samples. Separate binary models were fitted for cropland, forest land, grassland, water bodies, construction land, and unused land.
Ten explanatory variables described terrain, climate, vegetation, socioeconomic activity, and accessibility: elevation, slope, temperature, precipitation, NDVI, GDP, population density, distance to roads, distance to railways, and distance to water bodies. All expansion cells were retained as positive samples, and an equal number of non-expansion cells were randomly selected to create a balanced 1:1 dataset. Each dataset was then divided randomly into training and testing subsets at a ratio of 70:30.
All random-forest models used 500 decision trees, three candidate variables at each split (mtry = 3), a minimum terminal-node size of five samples, and no explicit maximum tree depth. Performance was evaluated using AUC, accuracy, and F1-score (Table A2). Variable importance was measured by the mean decrease in Gini impurity. For the cross-model summary, importance values were normalized within each model and then averaged across the six models using the number of expansion samples as weights. The models were implemented in Python 3.13.5 using scikit-learn version 1.8.0. A random 70:30 train-test split was used for model evaluation. Because nearby grid cells can share similar environmental conditions, spatially independent validation may yield somewhat lower performance than the metrics reported here.

2.3.4. Provincial Carbon-Emission Intensity Analysis

Total carbon emissions are strongly influenced by provincial differences in population size, economic scale, and construction-land extent and therefore cannot independently characterize the relative carbon-emission burden of different provinces. To complement the assessment of emission magnitude, three carbon-emission intensity indicators were calculated for each province under the natural-development, urban-expansion, and ecological-protection scenarios in 2030: per-capita carbon emissions, GDP-based carbon-emission intensity, and construction-land carbon-emission intensity.
Per-capita carbon emissions were calculated as the ratio of total land-use carbon emissions to the projected resident population and were expressed in t C person−1. This indicator measures the carbon-emission burden relative to population size and allows provinces with substantially different populations to be compared on a common basis. GDP-based carbon-emission intensity was calculated by dividing total land-use carbon emissions by projected provincial GDP and was expressed in t C per 104 CNY. It characterizes the amount of land-use carbon emissions associated with a unit of economic output and therefore complements comparisons based only on provincial emission totals.
Construction-land carbon-emission intensity was calculated as the ratio of construction-land-associated carbon emissions to construction-land area and was expressed in 104 t C km−2. Unlike the first two indicators, which use total land-use carbon emissions as the numerator, this indicator focuses specifically on the carbon burden carried by construction space. It was used to examine whether provinces with limited construction-land area supported disproportionately high construction-related carbon emissions.
All three indicators were calculated separately using the population, GDP, construction-land area, and carbon-emission estimates corresponding to each scenario. For basin-wide summaries, provincial numerators and denominators were first aggregated and the intensity indicators were then calculated from the aggregated values. Provincial comparisons considered both the absolute level of each indicator and the stability of provincial rankings among scenarios. Because the three indicators use different denominators, they provide complementary descriptions of provincial carbon-emission characteristics. For the 2030 intensity indicators, total GDP and resident population were extrapolated from their 2025 values using the same scenario-envelope logic: a central historical growth trajectory under natural development, an upper observed five-year growth trajectory under urban expansion, and a lower observed five-year growth trajectory under ecological protection. These denominator projections are used for scenario-consistent normalization and are not intended as precise demographic or macroeconomic forecasts.

3. Results

3.1. Land-Use Change and Transition Pathways from 2010 to 2025

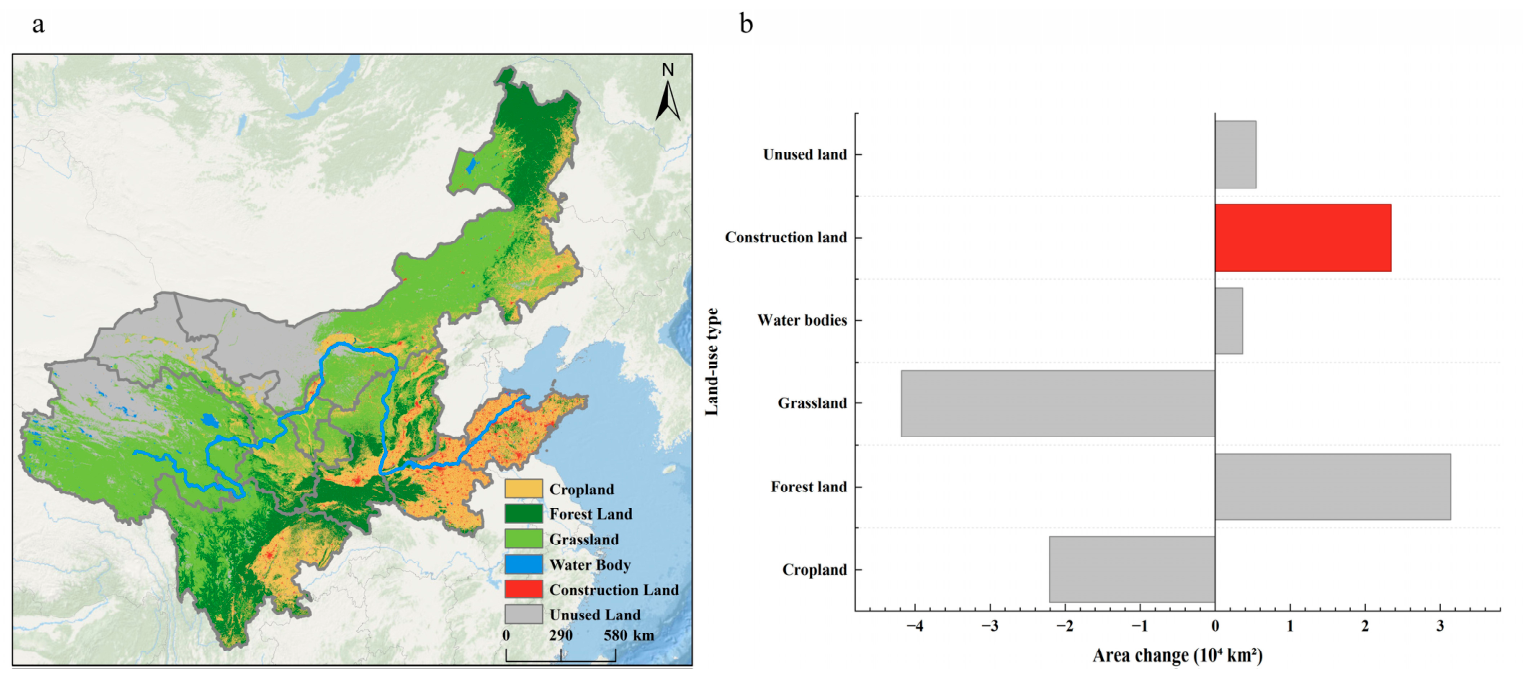
The land-use structure of the Yellow River Basin provinces remained relatively stable from 2010 to 2025, with grassland, unused land, cropland, and forest land consistently occupying most of the study area (Figure 3). In 2025, grassland was the largest land-use type, covering approximately 1.45 × 10⁶ km2, followed by unused land, cropland, and forest land, each occupying approximately 0.62–0.65 × 10⁶ km2. Although construction land accounted for only a small proportion of the total area, it experienced by far the largest relative increase, expanding from 6.03 × 10⁴ km2 in 2010 to 8.38 × 10⁴ km2 in 2025 (38.87%). Water bodies also increased moderately, from 3.15 × 10⁴ km2 to 3.52 × 10⁴ km2. Overall, the results indicate that regional land-use composition changed gradually during the study period, whereas the magnitude of change differed considerably among individual land-use types, with construction land showing the most pronounced expansion.
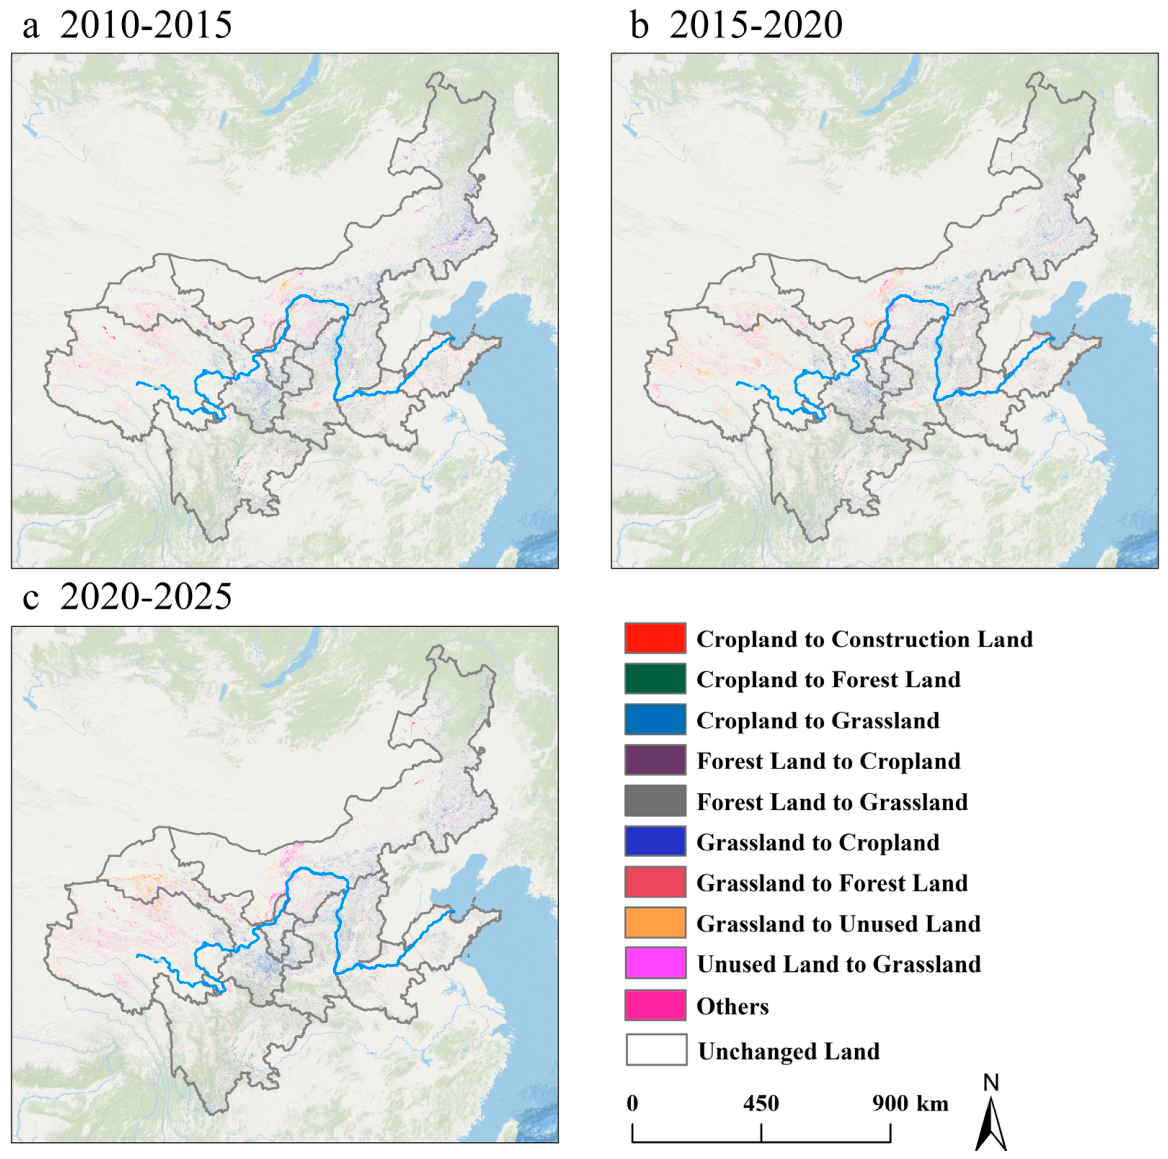
The spatial transition maps show that land-use changes were concentrated mainly in the middle and lower parts of the study area, particularly in regions characterized by intensive agriculture, rapid urban development, and industrial activity (Figure 4). Construction-land expansion occurred predominantly around existing built-up areas, which indicates that recent urban development mainly proceeded through outward expansion of established cities. In contrast, transitions among cropland, grassland, forest land, and unused land were more spatially dispersed across the basin and reflected widespread adjustments in agricultural production, ecological restoration, and natural land dynamics. Compared with construction-land expansion, these ecological land transitions generally occurred over broader areas but with lower local conversion intensity.
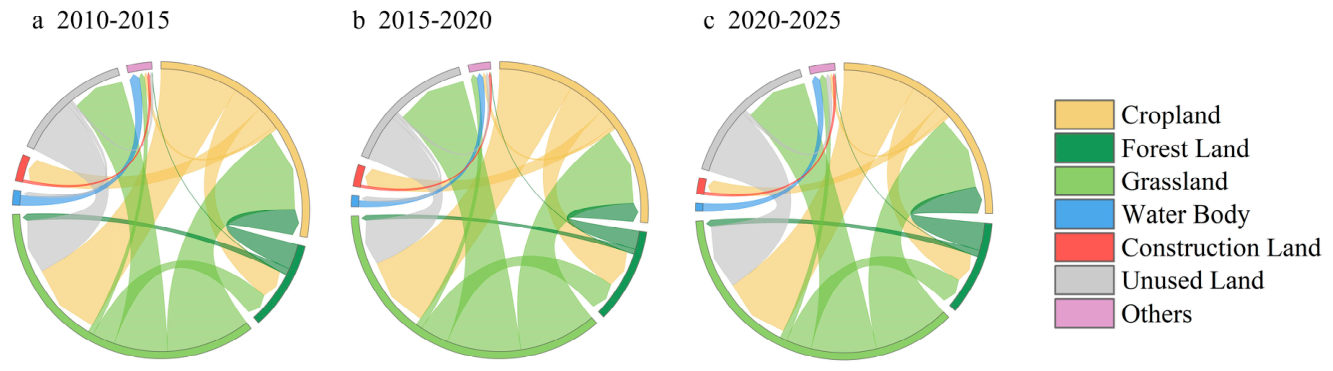
The chord diagrams further reveal the dominant pathways of land conversion among land-use types (Figure 5). To reduce visual masking caused by highly persistent land classes, unchanged pixels were excluded and only transitions accounting for at least 1% of the total converted area in each period were displayed. Despite the substantial increase in construction-land area, construction land remained highly persistent during 2020–2025, with a retention rate of 98.67%, indicating that newly developed built-up areas rarely reverted to other land-use types within the study period. Newly added construction land originated primarily from cropland and grassland, which contributed 71.33% and 17.75% of the total expansion, respectively, while water bodies and unused land accounted for 6.04% and 3.92%. Together, these transition pathways demonstrate that recent urban expansion was achieved mainly through the conversion of productive and ecological land, particularly cropland and grassland, whereas transitions among the remaining land-use types were more balanced and occurred at substantially smaller proportions.

3.2. Historical Changes in Land-Use Carbon Emissions

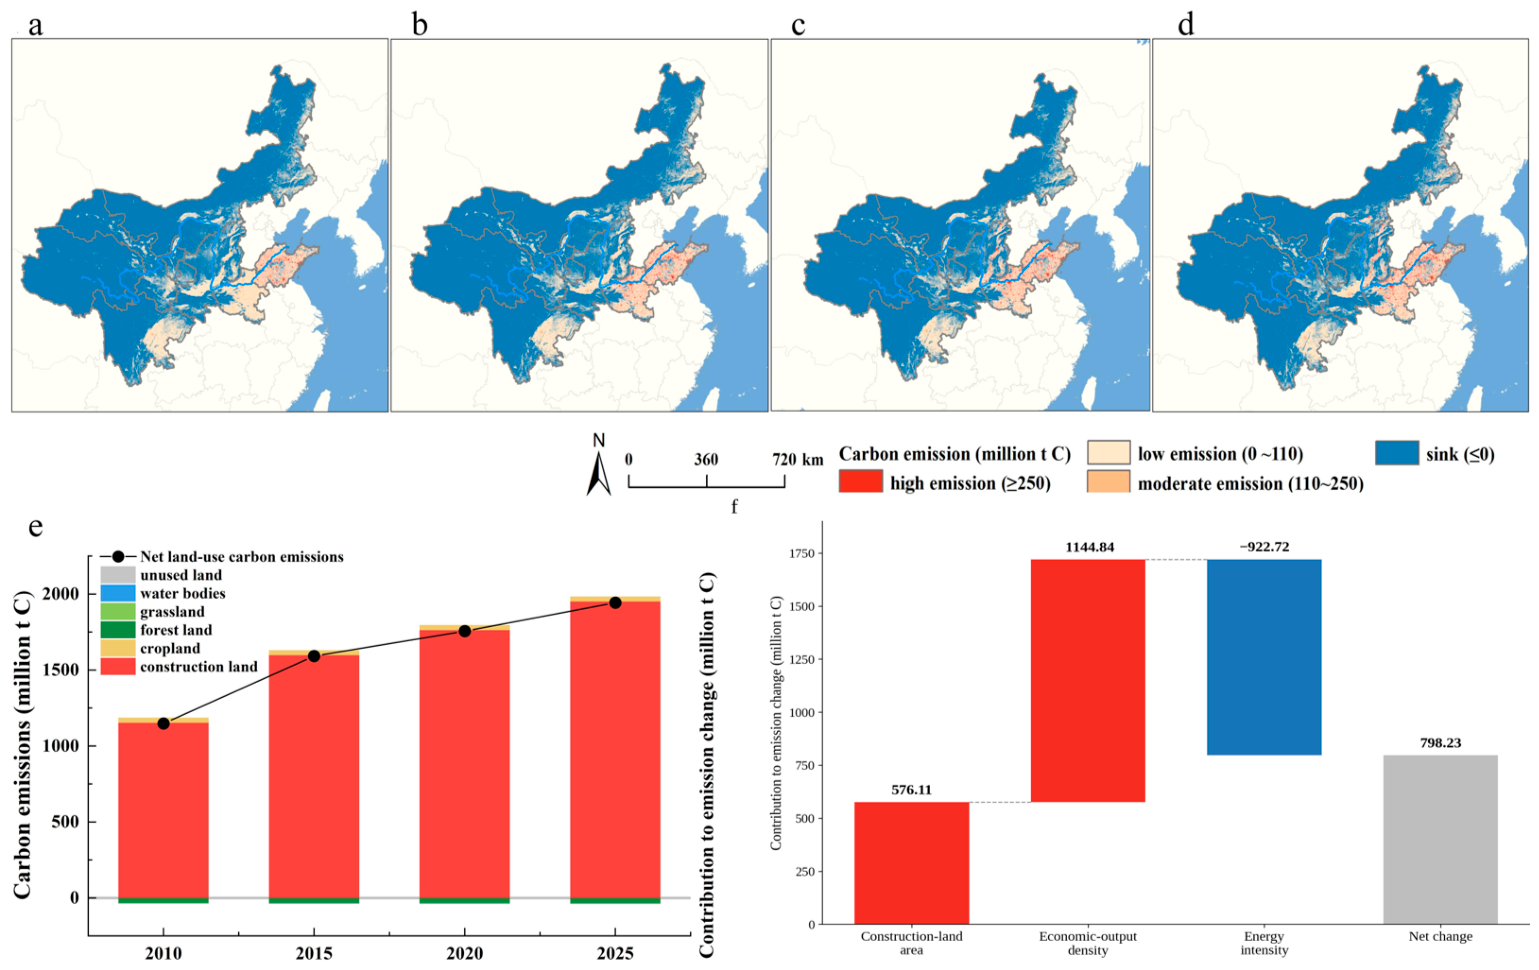
Net land-use carbon emissions increased from 1139.06 million t C in 2010 to 1934.33 million t C in 2025, a rise of 69.82% (Figure 6). Construction-land-associated emissions increased from 1152.57 to 1950.79 million t C over the same period. Their increase was slightly larger than the increase in net emissions because non-construction land provided a modest offset.
Construction-land-associated emissions dominated the positive side of the account in all four years (Figure 6e). Under the adopted coefficients, cropland was a net source of approximately 27.59 million t C in 2025, whereas forest land, grassland, water bodies, and unused land were sinks. Forest land provided the largest ecological sink, absorbing approximately 39.66 million t C.
In 2025, forest land, grassland, water bodies, and unused land absorbed a combined 44.06 million t C. After accounting for cropland emissions, non-construction land provided a net offset of 16.47 million t C. This was small relative to the 1950.79 million t C associated with construction land, so the regional total largely followed the construction-land-associated component (Figure 6e).
The three-factor LMDI decomposition attributed 576.11 million t C of the 2010–2025 increase to construction-land expansion and 1144.84 million t C to higher secondary- and tertiary-sector output per unit construction land, while declining energy intensity reduced emissions by 922.72 million t C (Figure 6f). The negative energy-intensity effect offset 53.62% of the combined positive effects. Of the two positive components, economic-output density accounted for 66.52% and land expansion for 33.48%. The same signs occurred in all three five-year periods. Within this decomposition, economic intensification therefore made the larger positive contribution to historical emission growth.

3.3. Factors Associated with Land-Use Expansion

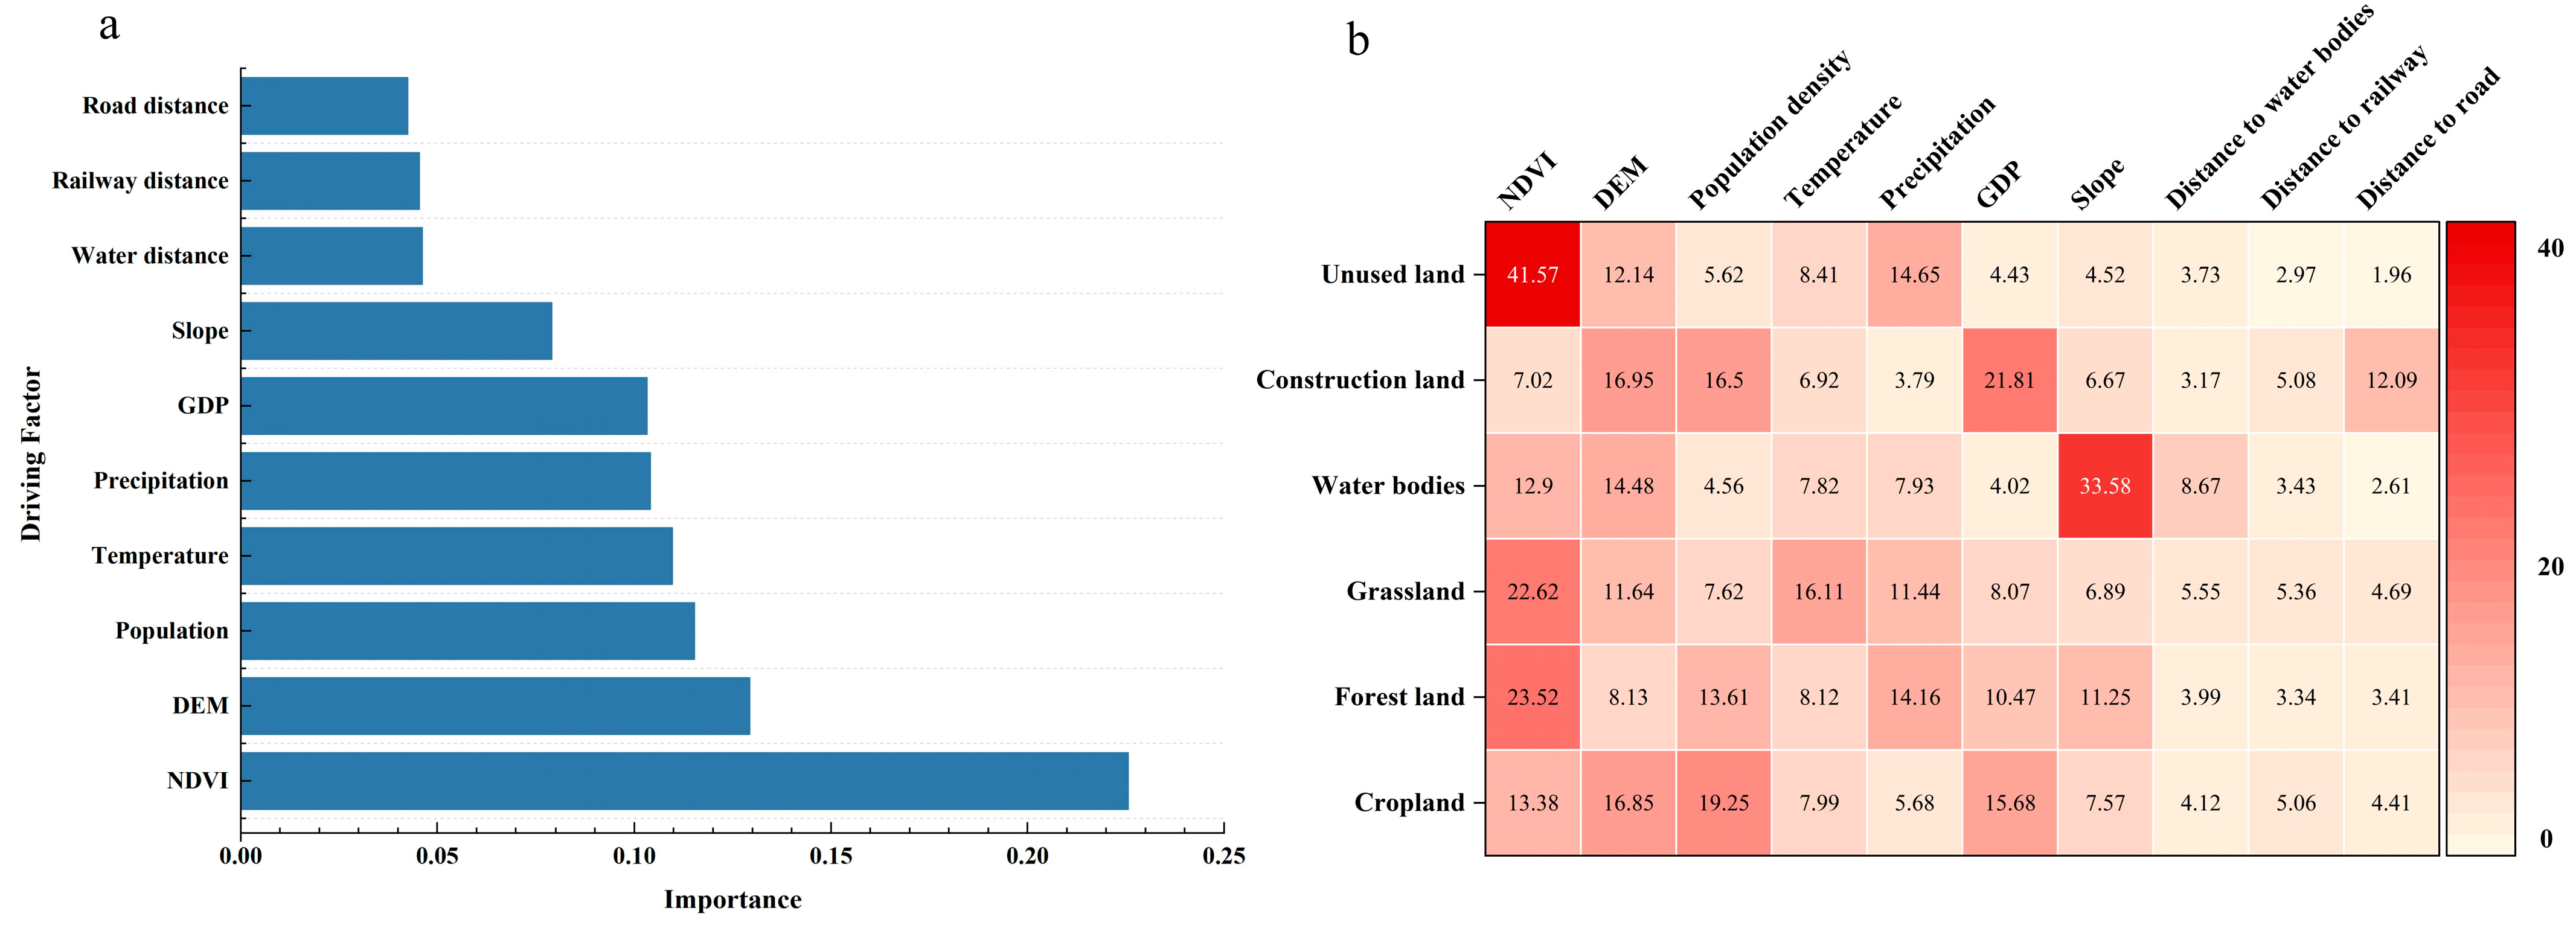
The sample-size-weighted mean of normalized importance values provided a cross-model summary of the relative contribution of the explanatory variables to land-use expansion (Figure 7a). NDVI showed the highest weighted mean importance (22.56%), indicating that vegetation conditions consistently contributed to distinguishing expansion from non-expansion areas across the six land-use types. Elevation ranked second (12.93%), followed by population density (11.52%), temperature (10.96%), precipitation (10.40%), and GDP (10.32%). Together, these variables accounted for more than two-thirds of the total importance, suggesting that recent land-use expansion was jointly associated with vegetation status, topographic constraints, climatic background, and socioeconomic activity. In contrast, accessibility-related variables, including distance to water bodies (4.62%), railways (4.54%), and roads (4.25%), showed relatively lower mean importance, while slope contributed 7.90%.
Although several variables were consistently important, their rankings varied substantially among land-use types (Figure 7b). Population density, elevation, and GDP were the three highest-ranked variables for cropland expansion, whereas NDVI dominated both the forest-land and grassland expansion models. Water-body expansion showed the strongest association with slope, while NDVI and precipitation ranked highest for unused-land expansion. Construction-land expansion differed from ecological land types by showing relatively high importance for GDP, population density, and elevation, highlighting the stronger contribution of socioeconomic conditions to distinguishing recent urban expansion. These differences indicate that no single factor consistently explained all land-use transitions and that the relative importance of environmental and socioeconomic variables depended on the land-use type being considered.
Overall, the results suggest that land-use expansion in the Yellow River Basin provinces was associated with the combined influence of environmental suitability and human activity. Environmental variables generally played a greater role in distinguishing the expansion of ecological land types, whereas socioeconomic variables were more important for construction-land expansion. This contrast reflects the heterogeneous mechanisms underlying different land-use transitions across the region. These importance patterns describe statistical associations between the predictors and land-expansion probability and do not imply direct causation.

3.4. Scenario-Based Land-Use and Carbon-Emission Estimates for 2030

The scenarios produced distinct construction-land trajectories. Under natural development, construction land reached 89,381.12 km2, an increase of 5620.12 km2 (6.71%) from 2025. Under urban expansion, it reached 93,582.00 km2, an increase of 9821.00 km2 (11.73%). Under ecological protection, construction land remained at the 2025 level of 83,761.00 km2. Relative to natural development, urban expansion added 4200.88 km2, whereas ecological protection avoided 5620.12 km2 of expansion and reassigned approximately 1475.15 km2 to forest land, 3876.26 km2 to grassland, and 268.70 km2 to water bodies.
The associated carbon-emission estimates also differed markedly (Table 1). Total emissions under natural development were 2371.39 million t C, including 2388.49 million t C associated with construction land and a 17.10 million t C net sink from non-construction land. Urban expansion increased total emissions to 2866.55 million t C, 20.88% above natural development. Ecological protection reduced the total to 2124.72 million t C, 10.40% below natural development. The difference between the two boundary scenarios was 741.83 million t C, or 25.88% of the urban-expansion estimate.
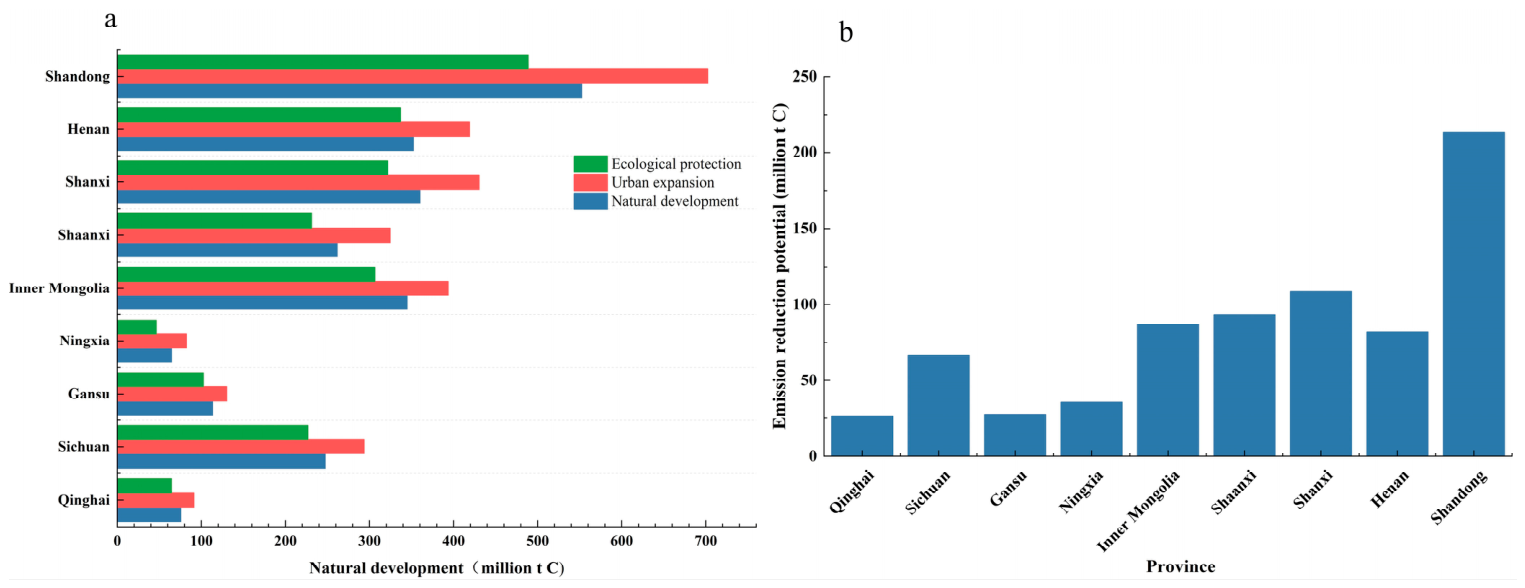
At the provincial scale, the highest carbon emissions consistently occurred in Shandong, Shanxi, Henan, and Inner Mongolia across all three scenarios (Figure 8), indicating that these provinces remained the dominant contributors to regional land-use carbon emissions regardless of future development pathway. Under the natural-development scenario, total emissions reached 552.40 million t C in Shandong, followed by 360.03 million t C in Shanxi, 352.16 million t C in Henan, and 344.70 million t C in Inner Mongolia. Under the urban-expansion scenario, emissions increased further to 702.28, 430.24, 418.93, and 393.59 million t C, respectively, whereas the ecological-protection scenario consistently produced lower emissions in every province. Although the scenario assumptions changed future emission magnitudes, the spatial ranking of provinces remained largely unchanged, with eastern and central provinces generally maintaining higher emissions than the upper-basin provinces.
The magnitude of the scenario response varied considerably among provinces. The largest absolute differences between the urban-expansion and ecological-protection scenarios occurred in Shandong (213.40 million t C), Shanxi (108.73 million t C), Shaanxi (93.36 million t C), Inner Mongolia (87.24 million t C), and Henan (82.00 million t C), indicating that these provinces contributed most to the regional divergence among future development pathways. In contrast, Ningxia exhibited the largest relative difference (43.60%), suggesting that its future emissions were proportionally more sensitive to alternative land-use and socioeconomic assumptions despite its relatively small total emissions. Overall, the provincial comparison shows that differences among the three scenarios became increasingly pronounced in provinces with either high emission levels or relatively rapid projected development, whereas provinces with lower baseline emissions generally exhibited smaller absolute changes.

3.5. Provincial Patterns of Carbon-Emission Intensity in 2030

The three carbon-emission intensity indicators revealed pronounced differences among provinces and provided a spatial pattern that differed from the distribution of total emissions (Table 2). At the basin scale, the urban-expansion scenario produced the highest per-capita carbon emissions and GDP-based carbon-emission intensity, reaching 5.79 t C person−1 and 0.469 t C per 104 CNY, respectively. The corresponding values under natural development were 5.67 t C person−1 and 0.460 t C per 104 CNY, whereas ecological protection reduced them to 5.59 t C person−1 and 0.452 t C per 104 CNY. The scenario ordering was therefore consistent with that of total emissions, although the differences in intensity were smaller than the differences in emission magnitude.
Provincial rankings based on per-capita emissions differed considerably from those based on total emissions. Inner Mongolia had the highest per-capita emissions under all three scenarios, reaching 14.82 t C person−1 under natural development, 15.08 t C person−1 under urban expansion, and 14.60 t C person−1 under ecological protection. Qinghai and Shanxi also maintained high values, ranging from 12.43 to 12.79 t C person−1 and from 10.58 to 10.86 t C person−1, respectively. By contrast, Sichuan and Henan consistently had the lowest per-capita emissions, although Henan was among the provinces with the largest total emissions. Shandong showed a similar contrast, with a high emission total but a moderate per-capita value of approximately 5.4–5.5 t C person−1. These results indicate that provinces contributing strongly to regional emissions did not necessarily have the greatest emission burden relative to population size.
GDP-based carbon-emission intensity showed a broadly similar provincial pattern. Qinghai ranked highest under all three scenarios, with values ranging from 1.189 to 1.224 t C per 104 CNY, followed by Shanxi and Inner Mongolia. Sichuan had the lowest GDP-based intensity, ranging from 0.229 to 0.239 t C per 104 CNY, while Henan and Shandong also remained below 0.4 t C per 104 CNY. The contrast between emission totals and GDP-based intensity was particularly evident for Shandong and Henan: both provinces had high total emissions, but their larger economic output resulted in comparatively moderate GDP-based intensity. Conversely, Qinghai, Shanxi, and Inner Mongolia showed a greater carbon-emission burden relative to their economic output.
Construction-land carbon-emission intensity exhibited a markedly different spatial distribution from the population- and GDP-normalized indicators. Qinghai was a clear outlier, with values exceeding 257 × 104 t C km−2 under all three scenarios. Gansu ranked second, with an intensity of approximately 12.1–12.3 × 10⁴ t C km−2, while Ningxia and Sichuan also showed relatively high values. In contrast, Henan and Shandong had the lowest construction-land intensities, generally ranging from 1.50 to 1.60 × 10⁴ t C km−2. The extremely high value in Qinghai resulted from the combination of construction-related emissions and a comparatively small construction-land denominator, and it should therefore be interpreted separately from the other provinces.
The provincial rankings of the three intensity indicators remained largely stable among scenarios, but the magnitude of the scenario response differed. Urban expansion generally increased per-capita emissions and GDP-based intensity, whereas ecological protection reduced both indicators in every province. The largest scenario-related change occurred in Ningxia, where per-capita emissions increased from 8.40 t C person−1 under natural development to 9.81 t C person−1 under urban expansion and decreased to 7.72 t C person−1 under ecological protection. Construction-land intensity did not follow a uniform scenario ordering because both construction-related emissions and construction-land area varied among scenarios. Overall, the intensity analysis shows that total emissions, population-normalized pressure, economic-output-normalized pressure, and construction-space-normalized pressure describe different dimensions of provincial carbon-emission characteristics.

4. Discussion

4.1. Distinguishing Land Expansion from Economic Intensification

Construction-land-associated emissions dominated the positive side of the regional account, as reported in other rapidly developing regions of China [9,28,32,39]. This pattern arises from the accounting framework, in which energy-related emissions from secondary- and tertiary-sector activities are allocated to construction land. The LMDI decomposition separates the growth of that land from the intensity of activity carried by it. Economic output per unit construction land contributed 1144.84 million t C to the increase, compared with 576.11 million t C from area expansion. Land expansion was therefore important, but economic intensification made the larger positive contribution.
Energy intensity provided the only negative decomposition effect. Declining energy consumption per unit GDP reduced construction-land-associated emissions by 922.72 million t C and offset 53.62% of the combined positive effects of land expansion and output-density growth. The effect was negative in all three five-year periods, showing that efficiency gains weakened—but did not reverse—the increase associated with expanding land and economic activity. Limiting construction-land growth can therefore reduce one source of pressure, but the emission outcome also depends on the amount and energy intensity of activity accommodated on that land.
Previous city-level studies provide related evidence. Peng et al. [19] found that urban construction-land expansion increased emissions, particularly where industrial land stimulated additional economic activity and energy use, while Li et al. [20] reported spatial variation in construction-land emission intensity associated with economic output, industrial structure, land-development intensity, and technology. Studies in the Yellow River Delta also found that construction land and total emissions could continue to rise while their relationship moved toward partial decoupling [49]. The present decomposition indicates how this can occur: lower energy intensity moderated emission growth, but did not outweigh the combined area and output-density effects.

4.2. Land-Transition Pathways and the Contribution of Remote Sensing

Cropland was also the principal source of new construction land in previous studies of the Yellow River Basin and Yellow River Delta [13,16,46]. The present analysis extends the record to 2025 and shows that cropland and grassland together supplied 89.08% of newly added construction land during 2020–2025. Percentages cannot be compared directly because the studies use different boundaries, periods, land-cover products, and transition definitions. The repeated predominance of cropland conversion nevertheless points to a persistent conflict between construction-land demand and agricultural land, while the substantial grassland contribution shows that ecological land was also affected. The 30 m CLCD maps locate these trade-offs and provide source-to-destination information unavailable from provincial energy statistics. Direct numerical comparison with earlier studies remains limited by differences in study period, spatial boundary, land-cover product, class aggregation, and carbon-accounting boundary. Relative to studies focused on historical patterns, future land-use scenarios, carbon stocks, or ecosystem-service relationships [13,14,15,16], the present analysis adds a 2025 update, explicit source-land attribution, and LMDI decomposition within the same provincial accounting framework.
Conversion to construction land also affects the regional carbon balance through ecological processes that are only partly represented by the fixed coefficients used here. Previous remote-sensing-based analysis has shown that built-up land expansion can reduce ecosystem productivity and alter the spatial distribution of carbon sinks and sources [50]. The present accounting captures changes in the area assigned to each annual source or sink coefficient, but it does not represent transitional losses of vegetation biomass and soil carbon, delayed ecosystem responses, or spatial variation in productivity. Moreover, the relatively small sink contribution estimated for ecological land should not be interpreted as evidence of limited ecological value, because land conversion also affects water regulation, habitat provision, soil conservation, and other ecosystem services not included in the carbon account [16].
The random-forest models describe which variables were most useful for separating expansion from non-expansion cells. GDP and population density ranked highly for construction land, whereas NDVI and terrain variables were more informative for several ecological land types. These rankings indicate the relative predictive contribution of each variable, but they do not provide the direction or magnitude of its effect. They should therefore be used as a screening result; directional interpretation would require response curves, temporally matched predictors, and spatially independent validation. Because the predictors are not uniformly pre-change and the validation is not spatially blocked, response curves were not used for mechanistic inference in this revision, as they could otherwise be overinterpreted as causal relationships.

4.3. Scenario Implications and Robustness of the 2030 Estimates

The 2030 scenario comparison demonstrates that future land-use carbon emissions are jointly determined by construction-land demand, economic growth, and energy-intensity change. Relative to natural development, total emissions under urban expansion were 20.88% higher, whereas those under ecological protection were 10.40% lower. The difference between the urban-expansion and ecological-protection scenarios reached 741.83 million t C, demonstrating that alternative development pathways can produce substantially different regional carbon outcomes by 2030.
The magnitude of this scenario gap also has potentially substantial climate–economic implications. The social cost of carbon represents the discounted economic damage caused by an additional unit of CO2 emissions and provides a monetary benchmark for comparing the external climate consequences of alternative development pathways [51]. Previous estimates under a carbon-neutral pathway ranged from approximately $79 to $291 per t CO2 [52]. Because the SCC is expressed per tonne of CO2, carbon mass was converted using 1 t C = 44/12 = 3.667 t CO2 before monetization. Applying these values, the 741.83 million t C difference between the urban-expansion and ecological-protection scenarios corresponds to about USD 215–792 billion in discounted climate damages. The total emissions projected under the ecological-protection and urban-expansion scenarios would correspond to approximately USD 0.62–2.27 trillion and USD 0.83–3.06 trillion, respectively. These values indicate that the carbon consequences of alternative provincial development pathways may be economically consequential at a scale far exceeding the immediate value of the associated land conversion. These monetary values are intended as an illustrative translation of the scenario gap and not as a formal regional cost-benefit assessment.
The large difference in both physical emissions and their indicative climate–economic consequences should not be attributed solely to construction-land expansion. The three scenarios represent contrasting combinations of construction-land demand, economic-output growth, and energy-intensity improvement. Consequently, the projected emission gap reflects both changes in the amount of construction land and changes in the intensity of economic and energy use associated with that land. The scenario results therefore emphasize that limiting construction-land growth alone would be insufficient to achieve the lowest-emission pathway if rapid economic intensification were not accompanied by continued improvements in energy efficiency.
A local one-at-a-time sensitivity check was conducted to determine whether the scenario comparison depended excessively on individual accounting assumptions (Table A3). The principal parameter groups were independently increased and decreased by 20%, while the remaining parameters were held at their baseline values. The analysis focused on energy intensity, the projected construction-land increment, and the carbon-emission or carbon-absorption coefficients assigned to non-construction land. Its primary purpose was to evaluate the stability of the scenario ranking and to identify which assumptions had the greatest influence on the absolute 2030 estimates.
Energy intensity exerted the strongest influence on projected emissions. A ±20% perturbation in energy intensity changed the regional total by approximately ±20.1% under each scenario. The near-proportional response follows from the accounting structure, in which construction-land-associated emissions dominate the regional carbon total and are directly linked to economic output and energy consumption per unit GDP. The importance of this result therefore lies not in the numerical proportionality itself, but in demonstrating that uncertainty in the assumed energy-intensity trajectory has a much greater effect on the absolute 2030 estimates than uncertainty in the other tested parameters. The projected benefits of ecological protection, as well as the additional emissions under urban expansion, thus depend strongly on whether the assumed improvement in energy efficiency is realized.
Changes in the construction-land increment produced a smaller but still distinguishable response. A ±20% perturbation changed total emissions by approximately ±1.27% under natural development and ±2.11% under urban expansion. The larger response under urban expansion reflects the greater amount of additional construction land assumed in this pathway. This test was not applicable to ecological protection because that scenario did not include a positive construction-land increment. These results indicate that controlling construction-land growth can contribute to emission reduction, but its effect on the regional total is smaller than that of changing energy intensity within the adopted scenario framework.
By comparison, perturbations in the carbon-emission and carbon-absorption coefficients for non-construction land had only a minor effect on the aggregate results. Increasing or decreasing these coefficients by 20% changed total regional emissions by no more than 0.16%. This limited response reflects the dominance of construction-land-associated emissions in the regional carbon budget. Changes in cropland, forest land, grassland, water bodies, and unused land may still alter local ecosystem carbon sources and sinks, but uncertainties in their annual coefficients have relatively little influence on the regional totals reported here. This small aggregate sensitivity should not be interpreted as validation of the fixed ecological coefficients themselves. The coefficients were adopted from Ye and Ming [28], whose synthesis was applied in Zhejiang, while the nine Yellow River Basin provinces span different climate, vegetation, soil, hydrological, and land-management conditions. Absolute source/sink estimates for individual ecological classes may therefore be more uncertain than their small contribution to the combined regional total suggests.
Most importantly, none of the tested perturbations changed the relative ordering of the three scenarios. Urban expansion consistently produced the highest emissions, natural development remained intermediate, and ecological protection produced the lowest emissions. The comparative conclusion regarding alternative development pathways is therefore more robust than the individual point estimates. Parameter variation may substantially alter the absolute totals, particularly through energy intensity, but it is unlikely to reverse the principal scenario comparison within the tested range.

4.4. Provincial Heterogeneity and Differentiated Policy Implications

The provincial results show why total emissions and intensity indicators should be interpreted together. Shandong and Henan have high absolute emissions but comparatively moderate per-capita and GDP-based intensities because their population and economic denominators are large. Inner Mongolia and Shanxi combine smaller populations with more resource- and energy-intensive economic structures, contributing to higher normalized intensities. Qinghai is an outlier for construction-land intensity because a relatively small mapped construction-land area forms the denominator; this ratio should therefore be interpreted cautiously.
These contrasts imply different mitigation priorities. Shandong and Henan should emphasize efficient use of existing construction land and protection of productive cropland, while Shanxi and Inner Mongolia have greater need for industrial restructuring and energy-efficiency improvement. In upper-basin and smaller-base provinces, ecological protection and careful control of construction-land increments remain important. These provincial differences reinforce the LMDI result that land-growth control is most effective when combined with lower energy intensity and cleaner economic activity.

4.5. Limitations and Future Research

Although the local sensitivity analysis supports the stability of the relative scenario ranking, several data and methodological limitations affect the spatial detail and absolute magnitude of the estimates. Spatially explicit studies using FLUS, InVEST, or PLUS can identify where future land conversion may occur and which landscapes are exposed [14,15,43,44,53,54]. The present scenarios do not allocate 2030 land change to individual grid cells; they retain observed provincial transition structures and estimate provincial land quantities. This design permits construction-land demand, economic output, and energy intensity to be varied jointly, but it cannot identify the future locations of conversion.
The main limitations can be grouped into three categories. First, accounting limitations mainly affect the interpretation and absolute magnitude of the estimates: construction-land-associated energy emissions are allocated at provincial scale, and fixed coefficients for non-construction land simplify spatial variation in ecosystem carbon processes. Second, data uncertainty may affect the absolute estimates and spatial comparability. The 2025 energy-intensity values were derived from recent provincial records and trends, and the 2025 CLCD data were not independently validated in this study. Third, model and scenario uncertainty mainly concerns spatial transferability and the range of future projections. Random train-test splitting may retain some spatial dependence, while the three 2030 scenarios represent contrasting development pathways with different assumptions about land demand, economic growth, and energy intensity. The sensitivity analysis indicates that these uncertainties can change absolute 2030 estimates, especially through energy intensity, but did not reverse the qualitative ordering UE > ND > EP within the tested ±20% range. The use of full provincial administrative territories also introduces a spatial-scale mismatch with the hydrological basin boundary, and aggregation of CLCD subclasses introduces additional uncertainty in class-specific ecological carbon estimates.
Future work should distinguish three components that are combined or simplified in the present accounting: energy emissions associated with activities occurring on construction land, carbon-stock losses caused directly by land conversion, and changes in annual ecosystem carbon uptake. Spatially explicit land-use-change models and dynamic carbon-stock models could improve the representation of the latter two components [55,56], while gridded fossil-fuel inventories and nighttime-light or point-source data could support a more realistic spatial allocation of construction-land-associated emissions. Future expansion analysis would also benefit from pre-change predictors, spatial block validation, and response-curve methods that characterize nonlinear relationships between land conversion and its environmental and socioeconomic controls.
A further extension would be to embed provincial land-use and socioeconomic projections within the broader SSP–RCP scenario framework [57]. The three scenarios used here were designed as transparent provincial boundary pathways and do not represent internally consistent trajectories of population, economic development, energy systems, climate forcing, and land demand over the remainder of the century. Future studies could use downscaled SSP population and GDP projections, CMIP6 climate simulations, and scenario-specific urban and agricultural land demands to assess how land-use carbon emissions evolve. More exploratory assessments could additionally consider overshoot and climate-intervention pathways [58]. Coupling these pathways with spatial land-use models would provide a more consistent assessment of long-term interactions among climate change, land conversion, and regional carbon emissions.

5. Conclusions

This study combined 30 m CLCD land-cover maps with provincial socioeconomic and energy data to quantify land-use transitions and land-use carbon emissions in the nine Yellow River Basin provinces from 2010 to 2025. LMDI decomposition, random-forest analysis, and three 2030 scenarios were used to distinguish the effects of land expansion, economic intensification, and energy-intensity change. The main conclusions include:
1. Construction land increased from 6.03 × 10⁴ km2 in 2010 to 8.38 × 10⁴ km2 in 2025, representing an increase of 38.87%. During 2020–2025, cropland supplied 71.33% of newly added construction land and grassland supplied 17.75%, while 98.67% of existing construction land remained unchanged.
2. Net land-use carbon emissions increased by 69.82%, from 1139.06 million t C in 2010 to 1934.33 million t C in 2025. Construction-land-associated emissions reached 1950.79 million t C in 2025, whereas non-construction land provided a net offset of only 16.47 million t C.
3. Economic-output-density growth produced the largest positive LMDI effect, contributing 1144.84 million t C, compared with 576.11 million t C from construction-land expansion. Declining energy intensity reduced emissions by 922.72 million t C and offset 53.62% of the combined positive effects.
4. Projected 2030 emissions ranged from 2124.72 million t C under ecological protection to 2866.55 million t C under urban expansion; the natural-development estimate was 2371.39 million t C. Relative to natural development, urban expansion increased emissions by 20.88%, whereas ecological protection reduced them by 10.40%. The relative ordering of the three scenarios remained stable in the local sensitivity check, although the absolute estimates were most responsive to energy intensity.
Three policy implications follow from the results. First, because economic-output-density growth contributed more to historical construction-land-associated emission growth than land-area expansion, compact land use should be combined with energy-efficiency improvement and industrial upgrading on existing construction land. Second, the 2030 scenarios and sensitivity analysis show that construction-land control is most effective when accompanied by a credible decline in energy intensity and coordinated protection of cropland and ecological land. Third, provincial strategies should reflect local conditions: Shandong and Henan should prioritize efficient use of large existing urban and economic bases, Shanxi and Inner Mongolia require stronger energy-efficiency and resource-industry transition measures, and upper-basin or smaller-base provinces should place greater emphasis on ecological protection and control of new construction land.


Author Contributions

Conceptualization, Y.P. and Y.R.; methodology, Y.P. and Y.R.; formal analysis, Y.P., Y.R. and A.L.; data curation, Y.P. and Y.R.; writing—original draft preparation, Y.P. and Y.R.; writing—review and editing, A.L. and Y.C.; visualization, Y.P. and Y.R.; project administration, A.L.; funding acquisition, A.L. and Y.C. All authors have read and agreed to the published version of the manuscript.

Funding

This research was funded by the Natural Science Foundation of Shandong Province, China (Grant No. ZR2025QB12 and ZR2024QD110), the Young Talent of Lifting Engineering for Science and Technology in Shandong, China (NO. SDAST2024QTA064), and the Young Taishan Scholars Program of Shandong Province (Grant No. tsqn202408142).

Institutional Review Board Statement

Not applicable.

Informed Consent Statement

Not applicable.

Data Availability Statement

The land-cover and explanatory datasets used in this study are publicly available from the sources cited in Section 2.2. The processed data and code supporting the reported results are available from the corresponding author upon reasonable request.

Acknowledgments

The authors thank the developers of the China Land Cover Dataset for providing the annual 30 m land-cover data used in this study. We also acknowledge the Resource and Environment Science and Data Center, Chinese Academy of Sciences, OpenStreetMap contributors, and the national and provincial statistical agencies that provided the environmental, socioeconomic, transport, and energy data. During preparation of this manuscript, the authors used OpenAI’s ChatGPT (GPT-5.6) to assist with language editing and refinement of selected plotting scripts. All methodological decisions, calculations, results, and interpretations were independently checked and approved by the authors.

Conflicts of Interest

The authors declare no conflicts of interest.

Appendix A

Table A1. Carbon-emission and carbon-absorption coefficients used for non-construction land.
Carbon RoleCoefficientLand-Use Type
Source0.422 t C hm−2 yr−1Cropland
Sink−0.644 t C hm−2 yr−1Forest land
Sink−0.022 t C hm−2 yr−1Grassland
Sink−0.253 t C hm−2 yr−1Water bodies
Weak sink−0.005 t C hm−2 yr−1Unused land
Note: Positive coefficients indicate carbon emissions, and negative coefficients indicate carbon absorption. The coefficients were adopted from Ye and Ming [28]; the corresponding source studies are listed in references [33,34,35,36,37,38,39].
Table A2. Validation metrics for land-use expansion classification models.
F1-ScoreAccuracyAUCExpansion CellsLand Type
0.8270.8090.87940,942Cropland
0.8460.8350.90320,987Forest land
0.7970.7860.86355,253Grassland
0.8560.8590.9373626Water bodies
0.8670.8610.9286575Construction land
0.8910.8850.94825,767Unused land
Table A3. Relative change in 2030 total emissions under one-at-a-time ±20% parameter perturbations.
ScenarioNon-Construction CoefficientsEnergy IntensityConstruction-Land Increment
Natural development+0.14%; −0.14%−20.14%; +20.14%−1.27%; +1.27%
Urban expansion+0.12%; −0.12%−20.12%; +20.12%−2.11%; +2.11%
Ecological protection+0.16%; −0.16%−20.16%; +20.16%n/a
Note: Values are the responses to −20% and +20% perturbations, respectively. Construction-land increment was not varied under ecological protection.

References

  1. Foley, J.A.; DeFries, R.; Asner, G.P.; Barford, C.; Bonan, G.; Carpenter, S.R.; Chapin, F.S.; Coe, M.T.; Daily, G.C.; Gibbs, H.K.; et al. Global consequences of land use. Science 2005, 309, 570–574. [Google Scholar] [CrossRef] [Scilit] [PubMed]
  2. Houghton, R.A.; Nassikas, A.A. Global and regional fluxes of carbon from land-use and land-cover change 1850–2015. Glob. Biogeochem. Cycles 2017, 31, 456–472. [Google Scholar] [CrossRef] [Scilit]
  3. Seto, K.C.; Güneralp, B.; Hutyra, L.R. Global forecasts of urban expansion to 2030 and direct impacts on biodiversity and carbon pools. Proc. Natl. Acad. Sci. USA 2012, 109, 16083–16088. [Google Scholar] [CrossRef] [Scilit] [PubMed]
  4. Turner, B.L., II; Lambin, E.F.; Reenberg, A. The emergence of land change science for global environmental change and sustainability. Proc. Natl. Acad. Sci. USA 2007, 104, 20666–20671. [Google Scholar] [CrossRef] [Scilit] [PubMed]
  5. Wulder, M.A.; Masek, J.G.; Cohen, W.B.; Loveland, T.R.; Woodcock, C.E. Opening the archive: How free data has enabled the science and monitoring promise of Landsat. Remote Sens. Environ. 2012, 122, 2–10. [Google Scholar] [CrossRef] [Scilit]
  6. Hansen, M.C.; Potapov, P.V.; Moore, R.; Hancher, M.; Turubanova, S.A.; Tyukavina, A.; Thau, D.; Stehman, S.V.; Goetz, S.J.; Loveland, T.R.; et al. High-resolution global maps of 21st-century forest cover change. Science 2013, 342, 850–853. [Google Scholar] [CrossRef] [Scilit] [PubMed]
  7. Gong, P.; Li, X.; Wang, J.; Bai, Y.; Chen, B.; Hu, T.; Liu, X.; Xu, B.; Yang, J.; Zhang, W.; et al. Annual maps of global artificial impervious area (GAIA) between 1985 and 2018. Remote Sens. Environ. 2020, 236, 111510. [Google Scholar] [CrossRef] [Scilit]
  8. Yang, Y.; Li, H. Monitoring Spatiotemporal Characteristics of Land-Use Carbon Emissions and Their Driving Mechanisms in the Yellow River Delta: A Grid-Scale Analysis. Environ. Res. 2022, 214, 114151. [Google Scholar] [CrossRef] [Scilit] [PubMed]
  9. Zhao, L.; Yang, C.-H.; Zhao, Y.-C.; Wang, Q.; Zhang, Q.-P. Spatial correlations of land use carbon emissions in Shandong Peninsula Urban Agglomeration: A perspective from city level using remote sensing data. Remote Sens. 2023, 15, 1488. [Google Scholar] [CrossRef] [Scilit]
  10. Oda, T.; Maksyutov, S. A very high-resolution (1 km × 1 km) global fossil fuel CO2 emission inventory derived using a point source database and satellite observations of nighttime lights. Atmos. Chem. Phys. 2011, 11, 543–556. [Google Scholar] [CrossRef] [Scilit]
  11. Liu, X.; Liang, X.; Li, X.; Xu, X.; Ou, J.; Chen, Y.; Li, S.; Wang, S.; Pei, F. A future land use simulation model (FLUS) for simulating multiple land use scenarios by coupling human and natural effects. Landsc. Urban Plan. 2017, 168, 94–116. [Google Scholar] [CrossRef] [Scilit]
  12. Liang, X.; Guan, Q.; Clarke, K.C.; Liu, S.; Wang, B.; Yao, Y. Understanding the drivers of sustainable land expansion using a patch-generating land use simulation (PLUS) model: A case study in Wuhan, China. Comput. Environ. Urban Syst. 2021, 85, 101569. [Google Scholar] [CrossRef] [Scilit]
  13. Tian, M.; Chen, Z.; Wang, W.; Chen, T.; Cui, H. Land-Use Carbon Emissions in the Yellow River Basin from 2000 to 2020: Spatio-Temporal Patterns and Driving Mechanisms. Int. J. Environ. Res. Public Health 2022, 19, 16507. [Google Scholar] [CrossRef] [Scilit] [PubMed]
  14. Niu, H.; Chen, S.; Xiao, D. Multi-Scenario Land Cover Changes and Carbon Emissions Prediction for Peak Carbon Emissions in the Yellow River Basin, China. Ecol. Indic. 2024, 168, 112794. [Google Scholar] [CrossRef] [Scilit]
  15. Zhang, J.; Yang, J.; Liu, P.; Liu, Y.; Zheng, Y.; Shen, X.; Li, B.; Song, H.; Liang, Z. Effects of Land Use/Cover Change on Terrestrial Carbon Stocks in the Yellow River Basin of China from 2000 to 2030. Remote Sens. 2024, 16, 1810. [Google Scholar] [CrossRef] [Scilit]
  16. Muga, G.; Tiando, D.S.; Liu, C. Spatial Relationship between Carbon Emissions and Ecosystem Service Value Based on Land Use: A Case Study of the Yellow River Basin. PLoS ONE 2025, 20, e0318855. [Google Scholar] [CrossRef] [Scilit] [PubMed]
  17. Yang, J.; Huang, X. The 30 m annual land cover dataset and its dynamics in China from 1990 to 2019. Earth Syst. Sci. Data 2021, 13, 3907–3925. [Google Scholar] [CrossRef] [Scilit]
  18. Brown, C.F.; Brumby, S.P.; Guzder-Williams, B.; Birch, T.; Hyde, S.B.; Mazzariello, J.; Czerwinski, W.; Pasquarella, V.J.; Haertel, R.; Ilyushchenko, S.; et al. Dynamic World, near real-time global 10 m land use land cover mapping. Sci. Data 2022, 9, 251. [Google Scholar] [CrossRef] [Scilit]
  19. Peng, J.; Zheng, Y.; Liu, C. The Impact of Urban Construction Land Use Change on Carbon Emissions: Evidence from the China Land Market in 2000–2019. Land 2022, 11, 1440. [Google Scholar] [CrossRef] [Scilit]
  20. Li, J.; Jiao, L.; Li, F.; Lu, X.; Hou, J.; Li, R.; Cai, D. Spatial Disequilibrium and Influencing Factors of Carbon Emission Intensity of Construction Land in China. J. Clean. Prod. 2023, 396, 136464. [Google Scholar] [CrossRef] [Scilit]
  21. Liu, A.; Chen, Y. Integrating Sentinel-1/2 Imagery and Climate Reanalysis for Monthly Bare Soil Mapping and Wind Erosion Modeling in Shandong Province, China. Remote Sens. 2025, 17, 3298. [Google Scholar] [CrossRef] [Scilit]
  22. Wohlfart, C.; Liu, G.; Huang, C.; Kuenzer, C. A river basin over the course of time: Multi-temporal analyses of land surface dynamics in the Yellow River Basin (China) based on medium resolution remote sensing data. Remote Sens. 2016, 8, 186. [Google Scholar] [CrossRef] [Scilit]
  23. Feng, X.; Fu, B.; Piao, S.; Wang, S.; Ciais, P.; Zeng, Z.; Lü, Y.; Zeng, Y.; Li, Y.; Jiang, X.; et al. Revegetation in China’s Loess Plateau is approaching sustainable water resource limits. Nat. Clim. Change 2016, 6, 1019–1022. [Google Scholar] [CrossRef] [Scilit]
  24. Yang, J.; Huang, X. The 30 m Annual Land Cover Datasets and Its Dynamics in China from 1985 to 2025, Version 1.0.5 [Dataset]. Zenodo 2026. [Google Scholar] [CrossRef]
  25. National Bureau of Statistics of China; Office of the Leading Group of the State Council for the Seventh National Population Census. Communiqué of the Seventh National Population Census (No. 2)—National Population; National Bureau of Statistics of China: Beijing, China, 2021.
  26. Guang, F.; He, Y.; Wen, L.; Sharp, B. Energy intensity and its differences across China’s regions: Combining econometric and decomposition analysis. Energy 2019, 180, 989–1000. [Google Scholar] [CrossRef] [Scilit]
  27. Zheng, J.; Feng, G.; Ren, Z.; Qi, N.; Coffman, D.; Zhou, Y.; Wang, S. China’s energy consumption and economic activity at the regional level. Energy 2022, 259, 124948. [Google Scholar] [CrossRef] [Scilit]
  28. Ye, C.; Ming, T. Land use carbon emissions estimation and carbon emissions control strategy effect scenario simulation in Zhejiang Province. Heliyon 2023, 9, e20783. [Google Scholar] [CrossRef] [Scilit] [PubMed]
  29. Resource and Environment Science and Data Center, Chinese Academy of Sciences. Resource and Environment Science and Data Center. Available online: https://www.resdc.cn/ (accessed on 12 July 2026).
  30. Haklay, M.; Weber, P. OpenStreetMap: User-generated street maps. IEEE Pervasive Comput. 2008, 7, 12–18. [Google Scholar] [CrossRef] [Scilit]
  31. Pontius, R.G., Jr.; Shusas, E.; McEachern, M. Detecting important categorical land changes while accounting for persistence. Agric. Ecosyst. Environ. 2004, 101, 251–268. [Google Scholar] [CrossRef] [Scilit]
  32. Chen, M.; Yan, Z.; Zhang, J.; Xue, Z. Analysis of spatio-temporal dynamics and determinants of land use carbon emissions in Jiangsu Province, China. Land 2025, 14, 905. [Google Scholar] [CrossRef] [Scilit]
  33. Zhang, W.; Tong, C.; Wu, J.; Xu, M.; Song, C. Typical wetland ecosystem carbon cycle simulation and prediction. Huan Jing Ke Xue 2007, 28, 1905–1911. (In Chinese) [Google Scholar] [CrossRef]
  34. Fang, J.; Guo, Z.; Piao, S.; Chen, A. Terrestrial vegetation carbon sinks in China, 1981–2000. Sci. China Ser. D Earth Sci. 2007, 50, 1341–1350. [Google Scholar] [CrossRef] [Scilit]
  35. Chen, Y.; Lu, H.; Li, J.; Xia, J. Effects of land use cover change on carbon emissions and ecosystem services in Chengyu urban agglomeration, China. Stoch. Environ. Res. Risk Assess. 2020, 34, 1197–1215. [Google Scholar] [CrossRef] [Scilit]
  36. Zheng, S.-Y. Spatio-temporal characteristics and decoupling relationship of carbon emissions in Jiangxi Province based on land use. Nong Ye Yu Ji Shu 2021, 41, 133–136. (In Chinese) [Google Scholar] [CrossRef]
  37. Yang, H.; Zheng, H.; Liu, H.; Wu, Q. Nonlinear effects of environmental regulation on eco-efficiency under the constraint of land use carbon emissions: Evidence based on a bootstrap approach and panel threshold model. Int. J. Environ. Res. Public Health 2019, 16, 1679. [Google Scholar] [CrossRef] [Scilit] [PubMed]
  38. Sui, D.; Zhang, Y. The economic effect of Yellow River Basin urban agglomerations on green-development efficiency. Gan Su She Hui Ke Xue 2022, 5, 217–227. (In Chinese) [Google Scholar] [CrossRef]
  39. Wei, B.; Kasimu, A.; Reheman, R.; Zhang, X.; Zhao, Y.; Ailizi, M.; Liang, H. Spatiotemporal characteristics and prediction of carbon emissions/absorption from land use change in the urban agglomeration on the northern slope of the Tianshan Mountains. Ecol. Indic. 2023, 151, 110329. [Google Scholar] [CrossRef] [Scilit]
  40. Intergovernmental Panel on Climate Change. 2006 IPCC Guidelines for National Greenhouse Gas Inventories; Institute for Global Environmental Strategies: Hayama, Japan, 2006. [Google Scholar]
  41. GB/T 2589-2020; General Rules for Calculation of the Comprehensive Energy Consumption. State Administration for Market Regulation: Beijing, China; Standardization Administration of China: Beijing, China; Standards Press of China: Beijing, China, 2020.
  42. Ang, B.W. The LMDI approach to decomposition analysis: A practical guide. Energy Policy 2005, 33, 867–871. [Google Scholar] [CrossRef] [Scilit]
  43. Yang, Y.; Yang, M.; Zhao, B.; Lu, Z.; Sun, X.; Zhang, Z. Spatially Explicit Carbon Emissions from Land Use Change: Dynamics and Scenario Simulation in the Beijing-Tianjin-Hebei Urban Agglomeration. Land Use Policy 2025, 150, 107473. [Google Scholar] [CrossRef] [Scilit]
  44. Rong, T.; Zhang, P.; Li, G.; Wang, Q.; Zheng, H.; Chang, Y.; Zhang, Y. Spatial Correlation Evolution and Prediction Scenario of Land Use Carbon Emissions in the Yellow River Basin. Ecol. Indic. 2023, 154, 110701. [Google Scholar] [CrossRef] [Scilit]
  45. Ministry of Natural Resources of the People’s Republic of China. Notice on Strengthening Urban Development Boundary Management (Trial), Natural Resources Development [2023] No. 193, 2023. Available online: https://app.www.gov.cn/govdata/gov/202310/11/508110/article.html (accessed on 27 August 2026).
  46. State Council of the People’s Republic of China. Comprehensive Work Plan for Energy Conservation and Emission Reduction during the 14th Five-Year Plan, State Council [2021] No. 33, 2021. Available online: https://www.ndrc.gov.cn/fggz/hjyzy/jnhnx/202201/t20220127_1313521.html (accessed on 27 August 2026).
  47. State Council of the People’s Republic of China. Action Plan for Carbon Dioxide Peaking Before 2030, 2021. Available online: https://en.ndrc.gov.cn/policies/202110/t20211027_1301020.html (accessed on 27 August 2026).
  48. Breiman, L. Random forests. Mach. Learn. 2001, 45, 5–32. [Google Scholar] [CrossRef] [Scilit]
  49. Wang, Q.; Yang, C.-H.; Wang, M.-L.; Zhao, L.; Zhao, Y.-C.; Zhang, Q.-P.; Zhang, C.-Y. Decoupling Analysis to Assess the Impact of Land Use Patterns on Carbon Emissions: A Case Study in the Yellow River Delta Efficient Eco-Economic Zone, China. J. Clean. Prod. 2023, 412, 137415. [Google Scholar] [CrossRef] [Scilit]
  50. Ye, X.; Chuai, X. Carbon Sinks/Sources’ Spatiotemporal Evolution in China and Its Response to Built-Up Land Expansion. J. Environ. Manag. 2022, 321, 115863. [Google Scholar] [CrossRef] [Scilit] [PubMed]
  51. Chen, Y.; Liu, A.; Cheng, X. Quantifying economic impacts of climate change under nine future emission scenarios within CMIP6. Sci. Total Environ. 2020, 703, 134950. [Google Scholar] [CrossRef] [Scilit] [PubMed]
  52. Liu, A.; Chen, Y.; Cheng, X. Social cost of carbon under a carbon-neutral pathway. Environ. Res. Lett. 2022, 17, 054031. [Google Scholar] [CrossRef] [Scilit]
  53. Xu, C.; Zhang, Q.; Yu, Q.; Wang, J.; Wang, F.; Qiu, S.; Ai, M.; Zhao, J. Effects of Land Use/Cover Change on Carbon Storage between 2000 and 2040 in the Yellow River Basin, China. Ecol. Indic. 2023, 151, 110345. [Google Scholar] [CrossRef] [Scilit]
  54. Wang, H.; Wu, L.; Yue, Y.; Jin, Y.; Zhang, B. Impacts of Climate and Land Use Change on Terrestrial Carbon Storage: A Multi-Scenario Case Study in the Yellow River Basin (1992–2050). Sci. Total Environ. 2024, 930, 172557. [Google Scholar] [CrossRef] [Scilit] [PubMed]
  55. Qin, Z.; Zhu, Y.; Canadell, J.G.; Chen, M.; Li, T.; Mishra, U.; Yuan, W. Global Spatially Explicit Carbon Emissions from Land-Use Change over the Past Six Decades (1961–2020). One Earth 2024, 7, 835–847. [Google Scholar] [CrossRef] [Scilit]
  56. Chang, X.; Xing, Y.; Wang, J.; Yang, H.; Gong, W. Effects of Land Use and Cover Change (LUCC) on Terrestrial Carbon Stocks in China between 2000 and 2018. Resour. Conserv. Recycl. 2022, 182, 106333. [Google Scholar] [CrossRef] [Scilit]
  57. Liu, A.; Moore, J.C.; Cheng, X.; Chen, Y. Solar geoengineering and carbon removal significantly lower economic climate damages. One Earth 2023, 6, 1375–1387. [Google Scholar] [CrossRef] [Scilit]
  58. Chen, Y.; Liu, A.; Moore, J.C. Mitigation of Arctic permafrost carbon loss through stratospheric aerosol ge-oengineering. Nat. Commun. 2020, 11, 2430. [Google Scholar] [CrossRef] [Scilit] [PubMed]
Figure 1. Administrative boundaries and topographic features of the nine Yellow River Basin provinces.
Sustainability 18 09153 g001
Figure 2. Methodological framework for land-use carbon-emission assessment and 2030 scenario analysis.
Sustainability 18 09153 g002
Figure 3. Land-use distribution and area changes in the Yellow River Basin provinces. (a) Spatial distribution of land-use types in 2025 and (b) net area changes from 2010 to 2025.
Sustainability 18 09153 g003
Figure 4. Spatial distribution of land-use transitions in the Yellow River Basin provinces during (a) 2010–2015, (b) 2015–2020, and (c) 2020–2025.
Sustainability 18 09153 g004
Figure 5. Major inter-class land-use transitions during (a) 2010–2015, (b) 2015–2020, and (c) 2020–2025. Unchanged pixels are excluded, and only off-diagonal flows representing at least 1% of total converted area in each period are shown. Ribbon color denotes the source land-use type, and ribbon width denotes converted area.
Sustainability 18 09153 g005
Figure 6. Historical land-use carbon emissions in the Yellow River Basin provinces: spatial distribution in (a) 2010, (b) 2015, (c) 2020, and (d) 2025; (e) diverging carbon-source and carbon-sink composition with net emissions; and (f) additive LMDI decomposition of the 2010–2025 change in construction-land-associated emissions.
Sustainability 18 09153 g006
Figure 7. Variable importance for land-use expansion from 2020 to 2025. (a) sample-size-weighted mean normalized importance across the six models and (b) normalized importance within each land-use model.
Sustainability 18 09153 g007
Figure 8. Provincial carbon emissions under the 2030 scenarios. (a) total emissions, (b) absolute difference between the urban-expansion and ecological-protection scenarios.
Sustainability 18 09153 g008
Table 1. Total land-use carbon emissions under the three 2030 scenarios (104 t C).
ScenarioTotal Carbon EmissionsConstruction-Land Carbon EmissionsNet Emissions from Non-Construction LandChange Relative to Natural Development
Natural development237,138.78238,848.81−1710.030.00%
Urban expansion286,654.87288,376.80−1721.9320.88%
Ecological protection212,471.68214,192.74−1721.06−10.40%
Table 2. Provincial carbon-emission intensity indicators under the three development scenarios in 2030.
ProvincePer-Capita Emissions
(t C Person−1)
GDP-Based Intensity
(t C per 104 CNY)
Construction-Land Intensity
(104 t C km−2)
NDUEEPNDUEEPNDUEEP
Henan3.583.633.540.3700.3750.3651.531.501.56
Gansu4.744.804.690.5520.5590.54512.2712.2212.13
Inner Mongolia14.8215.0814.600.8820.8970.8693.193.193.15
Shandong5.425.515.370.3720.3780.3681.581.541.60
Qinghai12.5712.7912.431.2031.2241.189260.15257.80257.34
Shanxi10.6910.8610.581.0001.0160.9904.364.324.32
Sichuan2.973.022.900.2350.2390.2295.225.055.45
Ningxia8.409.817.720.7410.8660.6815.566.205.40
Shaanxi6.566.686.420.4660.4750.4564.784.654.94
Note: ND, natural development; UE, urban expansion; EP, ecological protection. The exceptionally high value for Qinghai reflects its comparatively small mapped construction-land area.
Disclaimer/Publisher’s Note: The statements, opinions and data contained in all publications are solely those of the individual author(s) and contributor(s) and not of MDPI and/or the editor(s). MDPI and/or the editor(s) disclaim responsibility for any injury to people or property resulting from any ideas, methods, instructions or products referred to in the content.