Article

Digital Financial Inclusion and Agricultural New Quality Productive Forces: Evidence from China

1
School of Finance and Trade, Liaoning University, Shenyang 110036, China
2
College of Economics and Management, Shenyang Agricultural University, Shenyang 110866, China
3
Department of Agricultural Economics, Purdue University, West Lafayette, IN 47907, USA
*
Author to whom correspondence should be addressed.
Sustainability 2026, 18(17), 9149; https://doi.org/10.3390/su18179149
Submission received: 6 June 2026 / Revised: 12 July 2026 / Accepted: 17 July 2026 / Published: 7 September 2026

Abstract

Agricultural new quality productive forces (ANQP) provide an important foundation for high-quality agricultural development and sustainable rural transformation. Using panel data for 30 Chinese provinces from 2011 to 2022, this study examines the effect of digital financial inclusion (DFI) on ANQP and the channels through which that effect operates. The results show that DFI is significantly and positively associated with ANQP. A one-standard-deviation increase in DFI is associated with an increase in ANQP equivalent to approximately 64.35% of its sample mean. Green technological innovation serves as a statistically significant transmission channel, although its indirect effect accounts for only 3.31% of the total effect. The relationship between DFI and ANQP exhibits a double-threshold pattern with respect to the level of DFI and a single-threshold pattern with respect to regional economic development, with the estimated coefficients increasing gradually across regimes. Decomposing DFI shows that coverage breadth, usage depth, and digitization all contribute positively to ANQP. Further analysis of the outcome dimensions indicates that DFI is positively associated with agricultural laborers, agricultural labor objects, and agricultural labor resources. The estimated association is also larger in regions with more developed traditional financial systems. These results provide a multidimensional and stage-based understanding of the relationship between digital finance and agricultural productive-capability upgrading.

1. Introduction

The modernization of agriculture and rural areas is a central part of the global sustainable development agenda [1,2]. Persistent urban-rural divides, regional disparities, and the environmental costs of agricultural production nevertheless remain common challenges. In China, these pressures have intensified the search for new sources of agricultural and rural development. The 2025 Central Document No. 1 calls for scientific and technological innovation to guide the concentration of advanced production factors and for ANQP to be developed in ways suited to local conditions. ANQP refers to the qualitative upgrading and recombination of agricultural laborers, labor objects, and labor resources [3,4]. Recent studies also link it to high-quality agricultural development [5]. The concept is related to, but not interchangeable with, agricultural total factor productivity, agricultural modernization, high-quality agricultural development, or green agricultural development. Total factor productivity focuses on input-output efficiency; agricultural modernization describes a broader process of structural and institutional change; and high-quality or green development emphasizes development outcomes. ANQP, by contrast, concerns the productive capabilities that underpin those outcomes, including changes in human capital, technology, industrial organization, environmental practices, and production resources.
The 2024 Chinese Government Work Report identifies digital finance and inclusive finance as important means of supporting the real economy. In agriculture, DFI can ease financing constraints, improve resource allocation, and support investment in technology and advanced production resources. Three questions therefore motivate this study: Does DFI promote ANQP? Does green technological innovation provide an environmentally relevant transmission channel? And does the effect vary with DFI maturity and regional economic development? These questions connect financial inclusion with economic sustainability through productive investment, social sustainability through broader rural financial access, environmental sustainability through green innovation, and regional sustainability through more balanced development opportunities.
Two strands of literature are especially relevant. The first concerns the meaning, measurement, and consequences of ANQP. Existing studies discuss its theoretical foundations and defining features [3,4,5]. Cao et al. [6] develop a provincial evaluation framework, while other studies measure ANQP through labor quality and broader combinations of production factors [7,8,9]. Empirical work relates ANQP to rural common prosperity [1], lower agricultural carbon emissions [10], coordination between resource use and ecological conditions [11], industrial organization [12], and high-quality agricultural development [13]. This literature establishes ANQP as a multidimensional production-capability concept, but the boundary between ANQP and more established agricultural development concepts remains insufficiently defined.
The second strand examines digital finance and agricultural development. Evidence from Sub-Saharan Africa shows that mobile financial services can lower transaction costs and improve household risk sharing [14,15]. Other studies document gains in smallholder welfare [16], technology adoption under credit and insurance constraints [17], and market participation when information and transaction costs fall [18,19]. Research from South and Southeast Asia likewise points to the growing use of digital financial services by farmers and to the importance of formal credit for farm performance [20,21]. In China, DFI has been linked to a wider range of rural outcomes [22]. More recent studies consider how DFI may support ANQP [23], assess the coordination between the two [24], and report positive effects at both provincial and enterprise levels [25,26]. Even so, the literature has paid less attention to conceptual boundaries, the size of the proposed mechanism, identification concerns, nonlinear patterns, and the role of the surrounding financial system.
The analysis has three objectives. First, it clarifies ANQP as a production-capability concept and tests whether DFI promotes it using provincial panel data. Second, it examines green technological innovation as an environmentally relevant channel, while allowing for the possibility that this channel explains only a small part of the total effect. Third, it assesses whether the DFI-ANQP relationship changes as digital finance and regional economic development progress.
The paper contributes in three respects. First, it conceptualizes ANQP as a multidimensional productive capability and measures it within a unified framework of agricultural laborers, agricultural labor objects, and agricultural labor resources. This approach helps distinguish ANQP from conventional productivity measures and broader agricultural development outcomes. Second, it develops a theoretical framework in which DFI promotes ANQP through financial support and improved resource allocation and provides empirical evidence on green technological innovation as one indirect transmission channel. Third, it identifies the stage-dependent nature of the DFI–ANQP relationship by examining threshold effects associated with DFI development and regional economic conditions. Supplementary analyses of the dimensions of DFI and ANQP, together with the role of traditional financial development, further clarify the conditions under which digital finance can be more effectively translated into agricultural productive-capability upgrading.
The rest of the paper proceeds as follows. Section 2 presents the theoretical framework and research hypotheses. Section 3 describes the empirical strategy, variable construction, and data. Section 4 reports and interprets the empirical results. Section 5 discusses the main findings, policy implications, and research limitations.

2. Theoretical Framework and Research Hypotheses

2.1. Direct Effects of Digital Financial Inclusion on Agricultural New Quality Productive Forces

DFI integrates the inclusive orientation of traditional finance with digital technologies [27]. Its relatively low access barriers, lower service costs, and broad reach allow financial services to extend beyond the spatial and temporal constraints of conventional banking. These characteristics enable DFI to support ANQP by expanding financial access and improving the allocation of financial resources. The direct relationship can be understood through two complementary effects.
First, DFI generates a financial support effect. Digital channels reduce the distance and transaction costs involved in obtaining financial services [28], thereby expanding the coverage and availability of finance in rural areas. Greater access to funding enables farmers, agricultural enterprises, and other rural producers to undertake productive investment. At the level of agricultural laborers, financial support facilitates education, vocational training, and entrepreneurial start-up activities, thereby strengthening farmers’ digital literacy, professional skills, and productive capacity. At the level of agricultural labor objects, financial resources can be directed toward improved crop varieties, high-standard farmland development, and specialized agricultural products, helping to upgrade the quality and structure of agricultural production. At the level of agricultural labor resources, greater financial availability supports investment in smart machinery, drones, the Internet of Things, and other advanced equipment and digital services, accelerating the upgrading of agricultural production resources.
Second, DFI generates a resource allocation effect. Data-based financial platforms collect, integrate, and analyze multidimensional information, enabling financial institutions to improve borrower identification, risk assessment, and credit allocation [29]. This process reduces information asymmetry and allows more targeted, personalized, and diversified financial products to be matched with agricultural producers and projects. At the level of agricultural laborers, more accurate credit assessment enables skilled farmers and rural entrepreneurs with viable production plans to obtain financing more easily, encouraging human-capital accumulation, innovation, and entrepreneurship. At the level of agricultural labor objects, data-driven capital allocation can direct funds toward high-value-added and environmentally sustainable projects, improving the use of land, seed varieties, and other productive inputs. At the level of agricultural labor resources, the integration of finance and digital technology supports emerging service models, such as equipment leasing and shared machinery platforms, and promotes the wider diffusion and intelligent upgrading of advanced production resources.
Overall, the financial support and resource allocation effects of DFI enhance the productive capacity of agricultural laborers, promote the upgrading of agricultural labor objects, and expand the advanced resources available for agricultural production. These considerations lead to the following hypothesis:
Hypothesis 1.
DFI directly promotes ANQP.

2.2. Indirect Effects of Digital Financial Inclusion on Agricultural New Quality Productive Forces

DFI may promote green technological innovation by broadening financing channels, reducing financing costs, and alleviating liquidity constraints. Green innovation typically requires substantial upfront investment, involves long development cycles, and faces considerable uncertainty [30]. By providing diversified financial services and using transaction data to improve credit assessment, DFI can reduce information asymmetry, lower screening and monitoring costs, and improve access to funding for cleaner technologies and resource-saving production practices [31,32]. More convenient digital credit and payment services may also help farmers and agricultural enterprises maintain the continuous funding required for long-term green innovation activities.
Green technological innovation may, in turn, strengthen ANQP. As innovation aimed at reducing environmental pressures and supporting sustainable development [33], it can improve resource-use efficiency, reduce dependence on environmentally intensive inputs, and promote cleaner production processes. It can also support the adoption of advanced technologies, new production models, and more efficient agricultural organizations. Recent evidence based on Chinese provincial panel data finds that green technological innovation significantly promotes the formation of ANQP [34]. These changes contribute to the upgrading of agricultural labor objects and labor resources and enhance the productive capacity of agricultural laborers. Accordingly, the following hypothesis is proposed:
Hypothesis 2.
DFI indirectly promotes ANQP through green technological innovation.

2.3. Nonlinear Effects of Digital Financial Inclusion on Agricultural New Quality Productive Forces

Metcalfe’s Law [35] offers a useful intuition for why the effect of DFI may change as digital finance develops, although the analysis does not test the law’s precise functional form. At an early stage, weak infrastructure, limited financial literacy, and narrow use of digital services may restrict the productive benefits of DFI. As coverage and usage expand and supporting institutions improve, stronger links among users, platforms, financial institutions, and agricultural enterprises may gradually increase the contribution of DFI to ANQP. This reasoning suggests the following hypothesis:
Hypothesis 3a.
The positive effect of DFI on ANQP exhibits a nonlinear threshold pattern with respect to the level of DFI development and becomes stronger at higher levels.
DFI does not operate in isolation. Its contribution depends on the wider economic and financial environment, including infrastructure, human capital, market demand, and the capacity of traditional financial institutions [36]. Evidence also suggests that favorable regional conditions can strengthen the effect of DFI on economic resilience [37]. In less developed regions, weak infrastructure and limited use of financial services may prevent greater financial access from translating into productive agricultural investment. Where complementary conditions are stronger, the same access can be used more effectively. On this basis, we formulate the following hypothesis:
Hypothesis 3b.
The positive effect of DFI on ANQP exhibits a nonlinear threshold pattern with respect to the level of regional economic development and becomes stronger at higher levels.

3. Research Design

The empirical strategy follows the structure of the hypotheses. A two-way fixed-effects model is used to estimate the direct effect of DFI on ANQP. A mediation model is then used to examine the proposed green innovation channel, and a panel threshold model is used to test whether the relationship changes across different levels of digital financial and economic development.

3.1. Model

To test Hypothesis 1, we estimate the following model:
A N Q P i t = α 0 + α 1 D F I i t + α 2 X i t + μ i + ν t + ε i t
Here, i indexes provinces and t indexes years. ANQPit is the ANQP level in province i and year t; DFIit is the corresponding level of DFI; Xit is a vector of control variables; μi and νt denote province and year fixed effects, respectively; and εit is the idiosyncratic error term. A positive and statistically significant α1 would support Hypothesis 1.
To examine the mechanism proposed in Hypothesis 2, we follow Ma and Zhu [38] and estimate the following mediation equations:
G T I i t = β 0 + β 1 D F I i t + β 2 X i t + μ i + ν t + ε i t
A N Q P i t = γ 0 + γ 1 D F I i t + γ 2 G T I i t + γ 3 X i t + μ i + ν t + ε i t
Here, GTIit denotes the level of green technological innovation. In Equations (2) and (3), β1 measures the effect of DFI on GTI, γ1 is the coefficient on DFI after GTI is included in the ANQP equation, and γ2 measures the association between GTI and ANQP. Positive and statistically significant values of β1 and γ2, together with a smaller DFI coefficient in Equation (3) than in Equation (1), would be consistent with partial mediation.
To test Hypothesis 3, we use DFI and regional economic development as alternative threshold variables in the panel threshold model developed by Hansen [39]:
A N Q P i t = η 0 + η 1 D F I i t × I T H i t ϕ + η 2 D F I i t × I T H i t > ϕ + η 3 X i t + μ i + ν t + ε i t
In Equation (4), THit denotes the threshold variable, defined as either DFI or the level of economic development; I(·) is the indicator function; and φ is the estimated threshold. The equation shows a single-threshold case, while the number of thresholds is selected using the bootstrap tests reported below.

3.2. Variables

3.2.1. Measurement of Agricultural New Quality Productive Forces

ANQP is intended to capture the productive capabilities created by qualitative changes in agricultural production factors. It differs from agricultural total factor productivity, which measures how efficiently inputs are converted into output, and from high-quality or green agricultural development, which mainly describes development outcomes. Accordingly, ANQP is measured through three related dimensions: agricultural laborers, agricultural labor objects, and agricultural labor resources.
The 17 indicators were selected on three grounds: each must correspond to one of the three production-factor dimensions, reflect an aspect of agricultural capability upgrading, and be available on a consistent basis across provinces and years. At the indicator level, the average years of education among rural residents and the rural entrepreneurship activity level capture the knowledge, skills, and initiative required for technology adoption and production reorganization (Table 1). Agricultural production efficiency and the per capita disposable income of rural residents reflect the productive capacity of agricultural laborers and their ability to sustain human-capital investment. The proportion of the agricultural product processing industry, the number of national leading enterprises in agricultural industrialization, and the number of digital industrialized agricultural enterprises capture the industrial and technological upgrading of agricultural labor objects. Forest coverage, the number of green agricultural enterprises, pesticide application intensity, and fertilizer application intensity capture the ecological quality and environmental intensity of agricultural production. Rural cell phone penetration, rural Internet penetration, the number of agricultural science and technology patents per capita, expenditures on agricultural science and technology activities, the number of Taobao villages, and the active participation of enterprises in e-commerce represent the material, technological, informational, and organizational resources that support modern agricultural production. A “Taobao village” refers to a rural community with a relatively high concentration of active online merchants and e-commerce transactions; the indicator captures the extent to which e-commerce is embedded in rural production and marketing rather than the presence of a physical marketplace. Appendix A Table A1 provides the conceptual rationale for each indicator.
These indicators are combined using equal weighting, the entropy method, and the CRITIC method. Equal weighting avoids giving any indicator an a priori advantage. The entropy method assigns greater weight to indicators with more information content, while the CRITIC method also accounts for variation and correlation among indicators. Because no single method has a clear theoretical advantage, the three sets of weights are averaged. Appendix A.2 describes the weighting and aggregation procedure.

3.2.2. Measurement of Digital Financial Inclusion

DFI is measured using the provincial Digital Financial Inclusion Index compiled by the Digital Finance Research Center at Peking University [40,41]. The index provides an overall measure and three subindices: coverage breadth, usage depth, and digitization level [42]. We divide the index by 100 to make the coefficients easier to interpret. Several ANQP indicators are digital in nature, but they capture production-side infrastructure and market organization. DFI instead measures the provision and use of financial services, including payments, credit, insurance, and investment. The two concepts may be related, but they describe different economic functions.

3.2.3. Measurement of Green Technological Innovation

Regional green innovation output is measured using green patents [43]. Because not all patent applications are ultimately granted [44], we use the number of granted green invention patents, which generally involve greater technological content and stricter examination than utility-model or design patents. GTI is the natural logarithm of this count. The measure reflects the broader regional green innovation environment rather than innovation originating only in agriculture. It may nevertheless affect agricultural production through knowledge spillovers and the availability of cleaner equipment and intermediate inputs.

3.2.4. Control Variables

The regressions include five control variables. Fiscal support for agriculture (FSA) is agriculture-related fiscal expenditure as a share of total fiscal expenditure. Industrial structure upgrading (UIS) is the combined output share of the secondary and tertiary sectors. Agricultural mechanization (AML) is measured by agricultural machinery power per rural resident. Urbanization (UL) is the urban share of the population. Social consumption (SCL) is the total retail sales of consumer goods divided by GDP.

3.3. Data Sources and Descriptive Statistics

The dataset covers 30 Chinese provinces from 2011 to 2022. The starting year is determined by data availability: the provincial Digital Financial Inclusion Index is continuously available from 2011, and the ANQP indicators have relatively consistent provincial coverage from the same year onward. Data come from national and provincial statistical yearbooks, including the China Statistical Yearbook, China Rural Statistical Yearbook, China Population and Employment Statistical Yearbook, China Environmental Statistical Yearbook, China Science and Technology Statistical Yearbook, China Agricultural Products Processing Industry Yearbook, and China Trade and Foreign Economic Relations Statistical Yearbook. We also use the China Academy for Rural Development-Qiyan China Agri-research Database, CNRDS, the CNKI Patent Database, the EPS Database, and reports from the Alibaba Research Institute. Monetary variables are expressed in 2011 constant prices. Xizang, Hong Kong, Macau, and Taiwan are excluded because of substantial data gaps; isolated missing observations are interpolated. Descriptive statistics for the variables are reported in Table 2.

4. Empirical Results and Analysis

4.1. Direct Effects Analysis

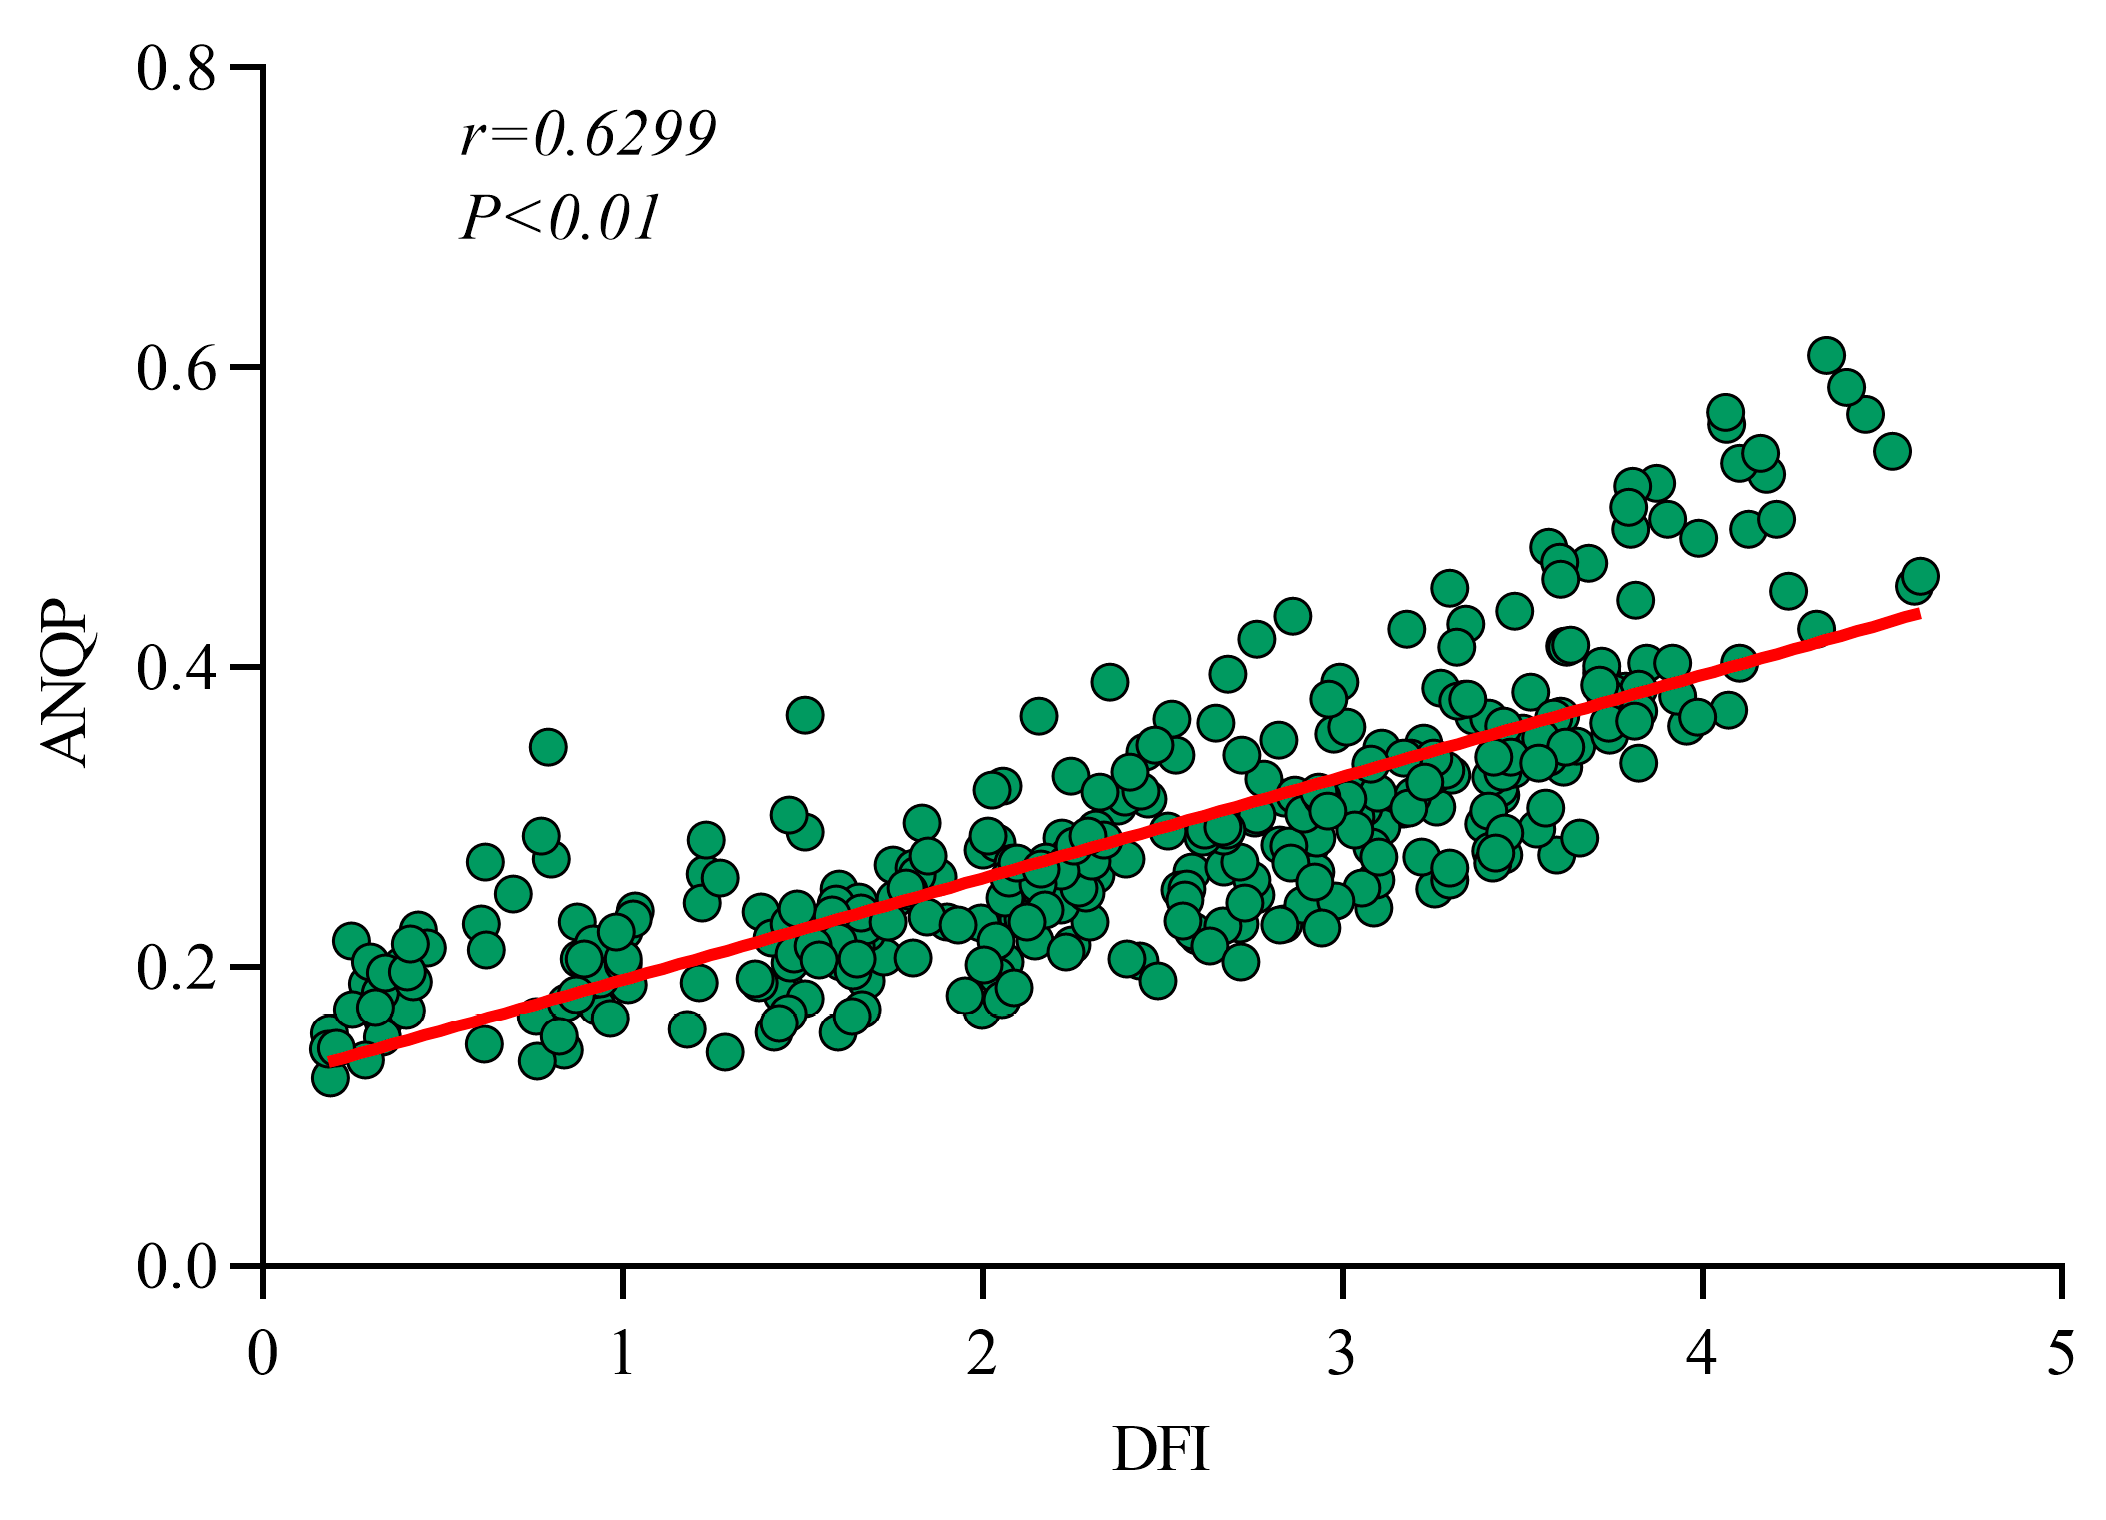
Figure 1 plots DFI against ANQP. The two variables are positively correlated, providing a descriptive indication that provinces with higher DFI also tend to have higher ANQP. Because the figure does not account for province-specific characteristics, common time shocks, or other covariates, the regression analysis below provides the main test of Hypothesis 1.
Table 3 reports the baseline results. The multicollinearity diagnostics in Table A2 raise no concern. Columns (1) and (2) show two-way fixed-effects estimates without and with controls, respectively, whereas Columns (3)–(5) report panel quantile estimates. The DFI coefficients in the fixed-effects models are 0.1910 and 0.1729, and both are significant at the 1% level. The estimates therefore support a positive relationship between DFI and ANQP. Using the specification with controls, a one-standard-deviation increase in DFI is associated with an ANQP increase of 0.1861, which is equivalent to approximately 64.35% of the sample mean.
The quantile estimates show a similar positive pattern. At the 25th, 50th, and 75th percentiles, the DFI coefficients are 0.0483, 0.0622, and 0.0626, respectively, and all are significant at the 1% level. These coefficients are smaller than the fixed-effects estimate because the two approaches summarize different parameters: the fixed-effects model estimates an average within-province association, whereas the quantile model estimates effects at particular points of the conditional ANQP distribution. The gradual increase across quantiles suggests that the association is somewhat stronger in provinces located higher in that distribution. Such provinces may be better able to convert digital financial access into productive investment because they tend to have stronger economic, financial, and institutional foundations.

4.2. Endogeneity Analysis

4.2.1. Instrumental Variables Method

The baseline results may still be affected by endogeneity. Unobserved factors could influence both DFI and ANQP, creating omitted-variable bias. Reverse causality is also possible if provinces with higher ANQP generate greater demand for digital financial services.
We address these concerns by instrumenting DFI with the interaction between each province’s distance to Hangzhou and year indicators, following Du et al. [29]. Hangzhou is used as the reference point because it was an early center of China’s platform economy and digital finance. During the early expansion of these services, provinces farther from Hangzhou were generally exposed more slowly. Distance itself is time-invariant and would be absorbed by province fixed effects, so the interaction with year indicators provides time variation as digital finance expands nationally, following the approach of Nunn and Qian [45]. The exclusion restriction is that, after province and year fixed effects and the observed controls are included, the time-varying effect of distance on ANQP operates mainly through DFI. Since distance may also proxy for broader regional conditions, the instrumental-variable estimates are treated as complementary evidence rather than as a stand-alone identification strategy.
The endogeneity test yields a statistic of 22.260 (p = 0.000), rejecting the null that DFI is exogenous. Columns (1) and (2) of Table 4 report the two-stage least-squares estimates. In the first stage, the instrument has a negative coefficient and is significant at the 1% level, consistent with slower DFI development at greater distances from Hangzhou. In the second stage, the coefficient on instrumented DFI remains positive and significant at the 1% level. The main result is therefore robust to this correction for endogeneity.

4.2.2. Dynamic Panel Analysis

ANQP is also likely to be persistent over time, since current productive capabilities build on past investments and accumulated experience. Omitting this persistence could bias the estimates. To account for it, we include the first lag of ANQP (L.ANQP) and estimate both difference GMM and system GMM models. Columns (3) and (4) of Table 4 report the results. The DFI coefficient remains positive and statistically significant in both specifications, indicating that the main finding is not driven by the omission of the lagged dependent variable.

4.3. Robustness Tests

4.3.1. Alternative Model Specifications and Sample Adjustments

Table 5 reports six robustness checks. First, ANQP is reconstructed using principal component analysis (Column 1). Second, all explanatory variables are lagged by one period to reduce concerns about reverse causality (Column 2). Third, Beijing, Tianjin, Shanghai, and Chongqing are excluded because their economic scale, resource endowments, and policy status differ markedly from those of other provinces (Column 3). Fourth, observations from 2020 to 2022 are removed to limit the influence of the COVID-19 pandemic (Column 4). Fifth, all variables are winsorized at the 5th and 95th percentiles (Column 5). Sixth, traditional financial development is added as a further control (Column 6). The coefficient in DFI remains positive and statistically significant in every specification.

4.3.2. Alternative ANQP Weighting Schemes

Table 6 provides an additional robustness check by reconstructing ANQP with alternative weighting schemes. Columns (1)–(3) use equal weights, the entropy method, and the CRITIC method, respectively. The DFI coefficients are 0.1534, 0.2251, and 0.1403, and all are significant at the 1% level. The results show that the positive association between DFI and ANQP is not driven by the benchmark weighting procedure.

4.4. Mechanism Analysis

We next examine whether green technological innovation is one channel through which DFI affects ANQP. Column (1) of Table 7 reproduces the baseline relationship. Column (2) estimates the effect of DFI on GTI, and Column (3) adds GTI to the ANQP equation.
DFI has a significant positive effect on GTI, while GTI is also positively related to ANQP. Once GTI is introduced into the ANQP equation, the coefficient on DFI decreases slightly from 0.1729 to 0.1672. The corresponding indirect effect represents 3.31% of the total effect. This relatively small share indicates that green technological innovation is not the principal mechanism through which DFI affects ANQP. This finding is understandable because ANQP is a broad composite measure covering human capital, industrial upgrading, production efficiency, digital infrastructure, and environmental performance, whereas GTI captures only one environmentally oriented component of that process. The relevance of this result therefore lies not in the size of the mediated effect, but in showing that part of the DFI–ANQP relationship is connected to green and resource-saving technological change. Most of the total effect is likely to operate through other channels, including improved credit access, agricultural risk sharing, rural entrepreneurship, and more efficient factor allocation. Hypothesis 2 therefore receives partial and qualified support.

4.5. Nonlinear Effects Analysis

We use Hansen’s panel threshold method to examine whether the DFI-ANQP relationship changes across levels of DFI and per capita GDP (PGDP). The number of thresholds is selected from 300 bootstrap replications, with further details reported in Appendix C. Table 8 supports a double-threshold specification for DFI and a single-threshold specification for PGDP.
Table 9 presents the corresponding threshold estimates. Column (1) uses DFI as the threshold variable, while Column (2) uses per capita GDP.
When DFI is no greater than 3.4486, its coefficient is 0.1012. The coefficient increases to 0.1067 between 3.4486 and 3.7883 and to 0.1134 above 3.7883; all three estimates are significant at the 1% level. The coefficient in the highest regime is about 12.1% larger than that in the lowest regime. The difference is therefore economically modest, and the estimates are better interpreted as a gradual strengthening of the relationship than as an abrupt shift between distinct regimes. Hypothesis 3a receives support in this qualified sense.
Using PGDP as the threshold variable produces a similar pattern. The DFI coefficient rises from 0.1413 below the estimated threshold of 11.2682 to 0.1494 above it, and both estimates are significant at the 1% level. The change is small but consistent with the view that stronger regional conditions make it easier to translate digital financial access into agricultural productive capabilities. This result supports Hypothesis 3b.
Taken together, these results indicate that the effect of DFI on ANQP strengthens gradually as digital finance develops. The threshold analysis complements the baseline estimates by identifying the stages at which this strengthening becomes more pronounced. The estimated thresholds also provide a practical basis for distinguishing regions that still need to expand basic financial access from those where policy can place greater emphasis on the deeper use of digital financial services and their integration with advanced agricultural production. Accordingly, the threshold results provide a stage-based interpretation of the DFI–ANQP relationship.

4.6. Heterogeneity Analysis

4.6.1. Dimension-Specific Effects

Table 10 separates DFI into coverage breadth (DFI_1), usage depth (DFI_2), and digitization level (DFI_3). Each coefficient is positive and significant at the 1% level: 0.1063 for coverage breadth, 0.0831 for usage depth, and 0.0487 for digitization. These estimates indicate that all three dimensions contribute to ANQP. Because the subindices are measured on different scales, the coefficient magnitudes should not be used to rank their relative importance. Broad coverage can ease access constraints, deeper use can widen the range of financial services available to agricultural actors, and greater digitization can reduce transaction costs.
Table 11 further estimates the relationship between DFI and the three first-level dimensions of ANQP. Columns (1)–(3) use agricultural laborers, agricultural labor objects, and agricultural labor resources as dependent variables, respectively. The DFI coefficients are 0.0263, 0.0674, and 0.0792, and all are significant at the 1% level. These results suggest that DFI contributes not only to the composite ANQP index but also to each major component of agricultural productive capability.

4.6.2. Effects of Traditional Financial Development

To explore the role of the existing financial system, we divide the sample each year at the median level of traditional financial development [46]. Table 12 reports the results for the high- and low-development groups. The DFI coefficient is positive and significant in both groups, but it is larger in the high-development group (0.1943 versus 0.1474). This pattern is consistent with the view that traditional financial infrastructure and market institutions complement digital finance, although the subgroup comparison alone does not establish a statistically significant difference between the two coefficients.

5. Conclusions and Discussion

This study examines the effect of digital financial inclusion on agricultural new quality productive forces using panel data for 30 Chinese provinces from 2011 to 2022. The main conclusions are as follows. First, DFI is significantly and positively associated with ANQP, and this finding remains robust across alternative estimation methods, variable constructions, sample adjustments, and endogeneity treatments. Second, green technological innovation serves as a statistically significant transmission channel through which DFI is associated with ANQP, although the indirect effect accounts for a relatively small share of the total effect. Third, the relationship between DFI and ANQP exhibits a double-threshold pattern with respect to the level of DFI and a single-threshold pattern with respect to regional economic development. The estimated coefficients increase gradually across regimes, indicating that the contribution of DFI becomes stronger as digital finance and regional economic conditions improve. Fourth, decomposing DFI shows that coverage breadth, usage depth, and digitization are all positively associated with ANQP. Further analysis of the outcome dimensions indicates that DFI contributes positively to agricultural laborers, agricultural labor objects, and agricultural labor resources. Fifth, the positive association between DFI and ANQP is stronger in regions with more developed traditional financial systems, suggesting that digital finance and conventional financial infrastructure may play complementary roles in supporting agricultural productive-capability upgrading.
These findings contribute to the literature by conceptualizing ANQP as a multidimensional production capability rather than as a conventional productivity outcome. International evidence provides a broader context for interpreting this relationship. Mobile money can reduce transaction costs and improve risk sharing [15], while access to credit and insurance can facilitate technology adoption [18]. Evidence on smallholder welfare [17] and farm performance [21] further suggests that improved financial access can strengthen the capacity of rural producers to invest, reorganize production, and participate in wider markets. Viewed through the ANQP framework, these changes may enhance the skills and productive capacity of agricultural laborers, support the technological upgrading of agricultural production, and expand the financial, informational, and organizational resources available to rural producers. China’s extensive platform ecosystem and digital infrastructure may reinforce these links by connecting farmers and agricultural enterprises more closely with finance, technology, and markets. The broader implication is that digital finance may support agricultural productive-capability upgrading in other developing economies, although the strength of this relationship depends on local financial, institutional, and infrastructural conditions.
The policy implications vary across stages of DFI development and regional economic conditions. Using the 2022 sample values as illustrative examples, policy priorities in provinces below the first DFI threshold of 3.4486, such as Qinghai, Xinjiang, Jilin, and Guizhou, could center on three areas: expanding basic digital infrastructure, improving access to formal financial accounts, and strengthening financial literacy among farmers and small agricultural enterprises. In provinces within the intermediate DFI regime, such as Gansu, Heilongjiang, Yunnan, Hebei, Guangxi, and Sichuan, greater emphasis could be placed on the effective use of digital credit, agricultural insurance, payment services, and supply-chain finance, together with improvements in agricultural credit information systems. For provinces that exceed both the second DFI threshold and the PGDP threshold, such as Beijing, Shanghai, Jiangsu, Zhejiang, Fujian, and Guangdong, policy could focus on integrating digital finance with green innovation, smart agriculture, and agricultural value chains, while strengthening data protection, algorithmic governance, and consumer protection. Provinces with relatively high DFI but PGDP below the estimated threshold, such as Henan, Anhui, and Hainan, may benefit more from complementary investment in market access, workforce skills, logistics, and agricultural infrastructure, so that existing digital financial services can be translated more effectively into agricultural productive capabilities. The dimension-specific results further suggest that policy design should address the three components of ANQP jointly by supporting rural human capital, promoting industrial and technological upgrading, and improving the digital, informational, and organizational resources available for agricultural production.
While this study provides a systematic analysis of the relationship between DFI and ANQP, including its nonlinear and heterogeneous features, several aspects merit further investigation. First, due to data availability, the analysis is conducted at the provincial level. Future research could extend the analysis to the city, county, enterprise, or household level to reveal finer spatial and micro-level variation in the DFI–ANQP relationship. Second, as digital financial services and platforms continue to evolve, developing broader and more diversified measures of digital finance would help assess whether the findings extend beyond the Peking University DFI Index. Third, this study examines only green technological innovation as a transmission channel. Future research could extend the mechanism framework by investigating additional pathways, such as agricultural credit access, risk sharing, entrepreneurship, and resource allocation, and by comparing their relative contributions to the DFI–ANQP relationship.

Author Contributions

Conceptualization, S.L. and L.Q.; Methodology, S.L. and Z.M.; Software, Y.Q., Z.M. and Z.D.; Validation, Y.Q. and Z.D.; Formal analysis, S.L., Y.Q. and Z.M.; Investigation, Z.D.; Data curation, Y.Q. and Z.D.; Writing—original draft, S.L.; Writing—review & editing, S.L., Y.Q., Z.M., Z.D. and L.Q.; Visualization, Z.D.; Supervision, L.Q.; Project administration, L.Q.; Funding acquisition, L.Q. All authors have read and agreed to the published version of the manuscript.

Funding

This research was funded by Liaoning Provincial Social Science Planning Fund Project [L25BJY027].

Institutional Review Board Statement

Not applicable.

Informed Consent Statement

Not applicable.

Data Availability Statement

The raw data supporting the conclusions of this article will be made available by the authors on request.

Conflicts of Interest

The authors declare no conflicts of interest.

Appendix A. Conceptual Rationale and Measurement of Agricultural New Quality Productive Forces

Appendix A.1. Conceptual Rationale for Indicator Selection

Table A1 summarizes the conceptual rationale linking each indicator to the three dimensions of ANQP.
Table A1. Conceptual rationale for the ANQP indicators.
DimensionIndicatorConceptual Rationale
Agricultural laborersAverage years of education among rural residentsCaptures the human capital needed to understand and adopt advanced agricultural technologies.
Agricultural laborersRural entrepreneurship activity levelReflects initiative and organizational capacity to develop new products and production models.
Agricultural laborersAgricultural production efficiencyIndicates the ability of agricultural labor to convert inputs into productive output.
Agricultural laborersPer capita disposable income of rural residentsReflects capacity to sustain labor reproduction, skill formation, and productive reinvestment.
Agricultural labor objectsProportion of the agricultural product processing industryCaptures value-chain extension and upgrading beyond primary production.
Agricultural labor objectsNumber of national leading enterprises in agricultural industrializationReflects scale, commercialization, and coordination across agricultural value chains.
Agricultural labor objectsNumber of digitally industrialized agricultural enterprisesCaptures the integration of digital technologies with agricultural production and organization.
Agricultural labor objectsForest coverage rateRepresents the ecological quality and regenerative capacity of the production environment.
Agricultural labor objectsNumber of green agricultural enterprisesReflects the organizational base for environmentally responsible production.
Agricultural labor objectsPesticide application intensityMeasures dependence on chemical inputs and the associated ecological pressure.
Agricultural labor objectsFertilizer application intensityCaptures resource intensity and environmental pressure from agricultural input use.
Agricultural labor resourcesRural cell phone penetration rateMeasures mobile connectivity for production information, coordination, and market communication.
Agricultural labor resourcesRural Internet penetration rateReflects access to digital information, knowledge services, and production networks.
Agricultural labor resourcesAgricultural science and technology patents per capitaCaptures the accumulation and output of agricultural technological knowledge.
Agricultural labor resourcesExpenditures on agricultural science and technology activitiesReflects sustained investment in agricultural innovation and technology diffusion.
Agricultural labor resourcesNumber of Taobao villagesCaptures cluster-based digital organization of rural production and marketing.
Agricultural labor resourcesActive participation of enterprises in e-commerceReflects integration of agricultural enterprises into digital markets and value chains.

Appendix A.2. Weighting and Aggregation Procedure

The ANQP index combines three weighting methods. Equal weighting treats all indicators symmetrically, the entropy method reflects differences in information content, and the CRITIC method incorporates both variation and correlation among indicators. Since there is no firm theoretical basis for favoring one method, we average the three resulting weights. The calculation proceeds in three steps.
First, standardize the evaluation indicators:
Positive   indicator :   X i j = X i j min X i j max X i j min X i j
Negative   indicator :   X i j = max X i j X i j max X i j min X i j
where i indexes provinces and j indexes indicators; Xij and X′ij are the original and standardized values, respectively, for indicator j in province i.
Second, multiply each standardized indicator by its assigned weight:
D i j = W j × X i j
where Dij is the weighted value of indicator j in province i, and Wj is the corresponding weight.
Third, sum up the weighted indicator values to obtain ANQP:
U i = j = 1 n D i j
where Ui is the ANQP index for province i; a larger value indicates a higher level of ANQP.

Appendix B. Multicollinearity Test Results

Table A2. Results of the multicollinearity test.
VariablesVIF1/VIF
UL3.030.330
FSA3.020.331
UIS2.570.388
AML1.500.668
DFI1.490.672
SCL1.080.930
Mean VIF2.11

Appendix C. Details of the Threshold-Effect Tests

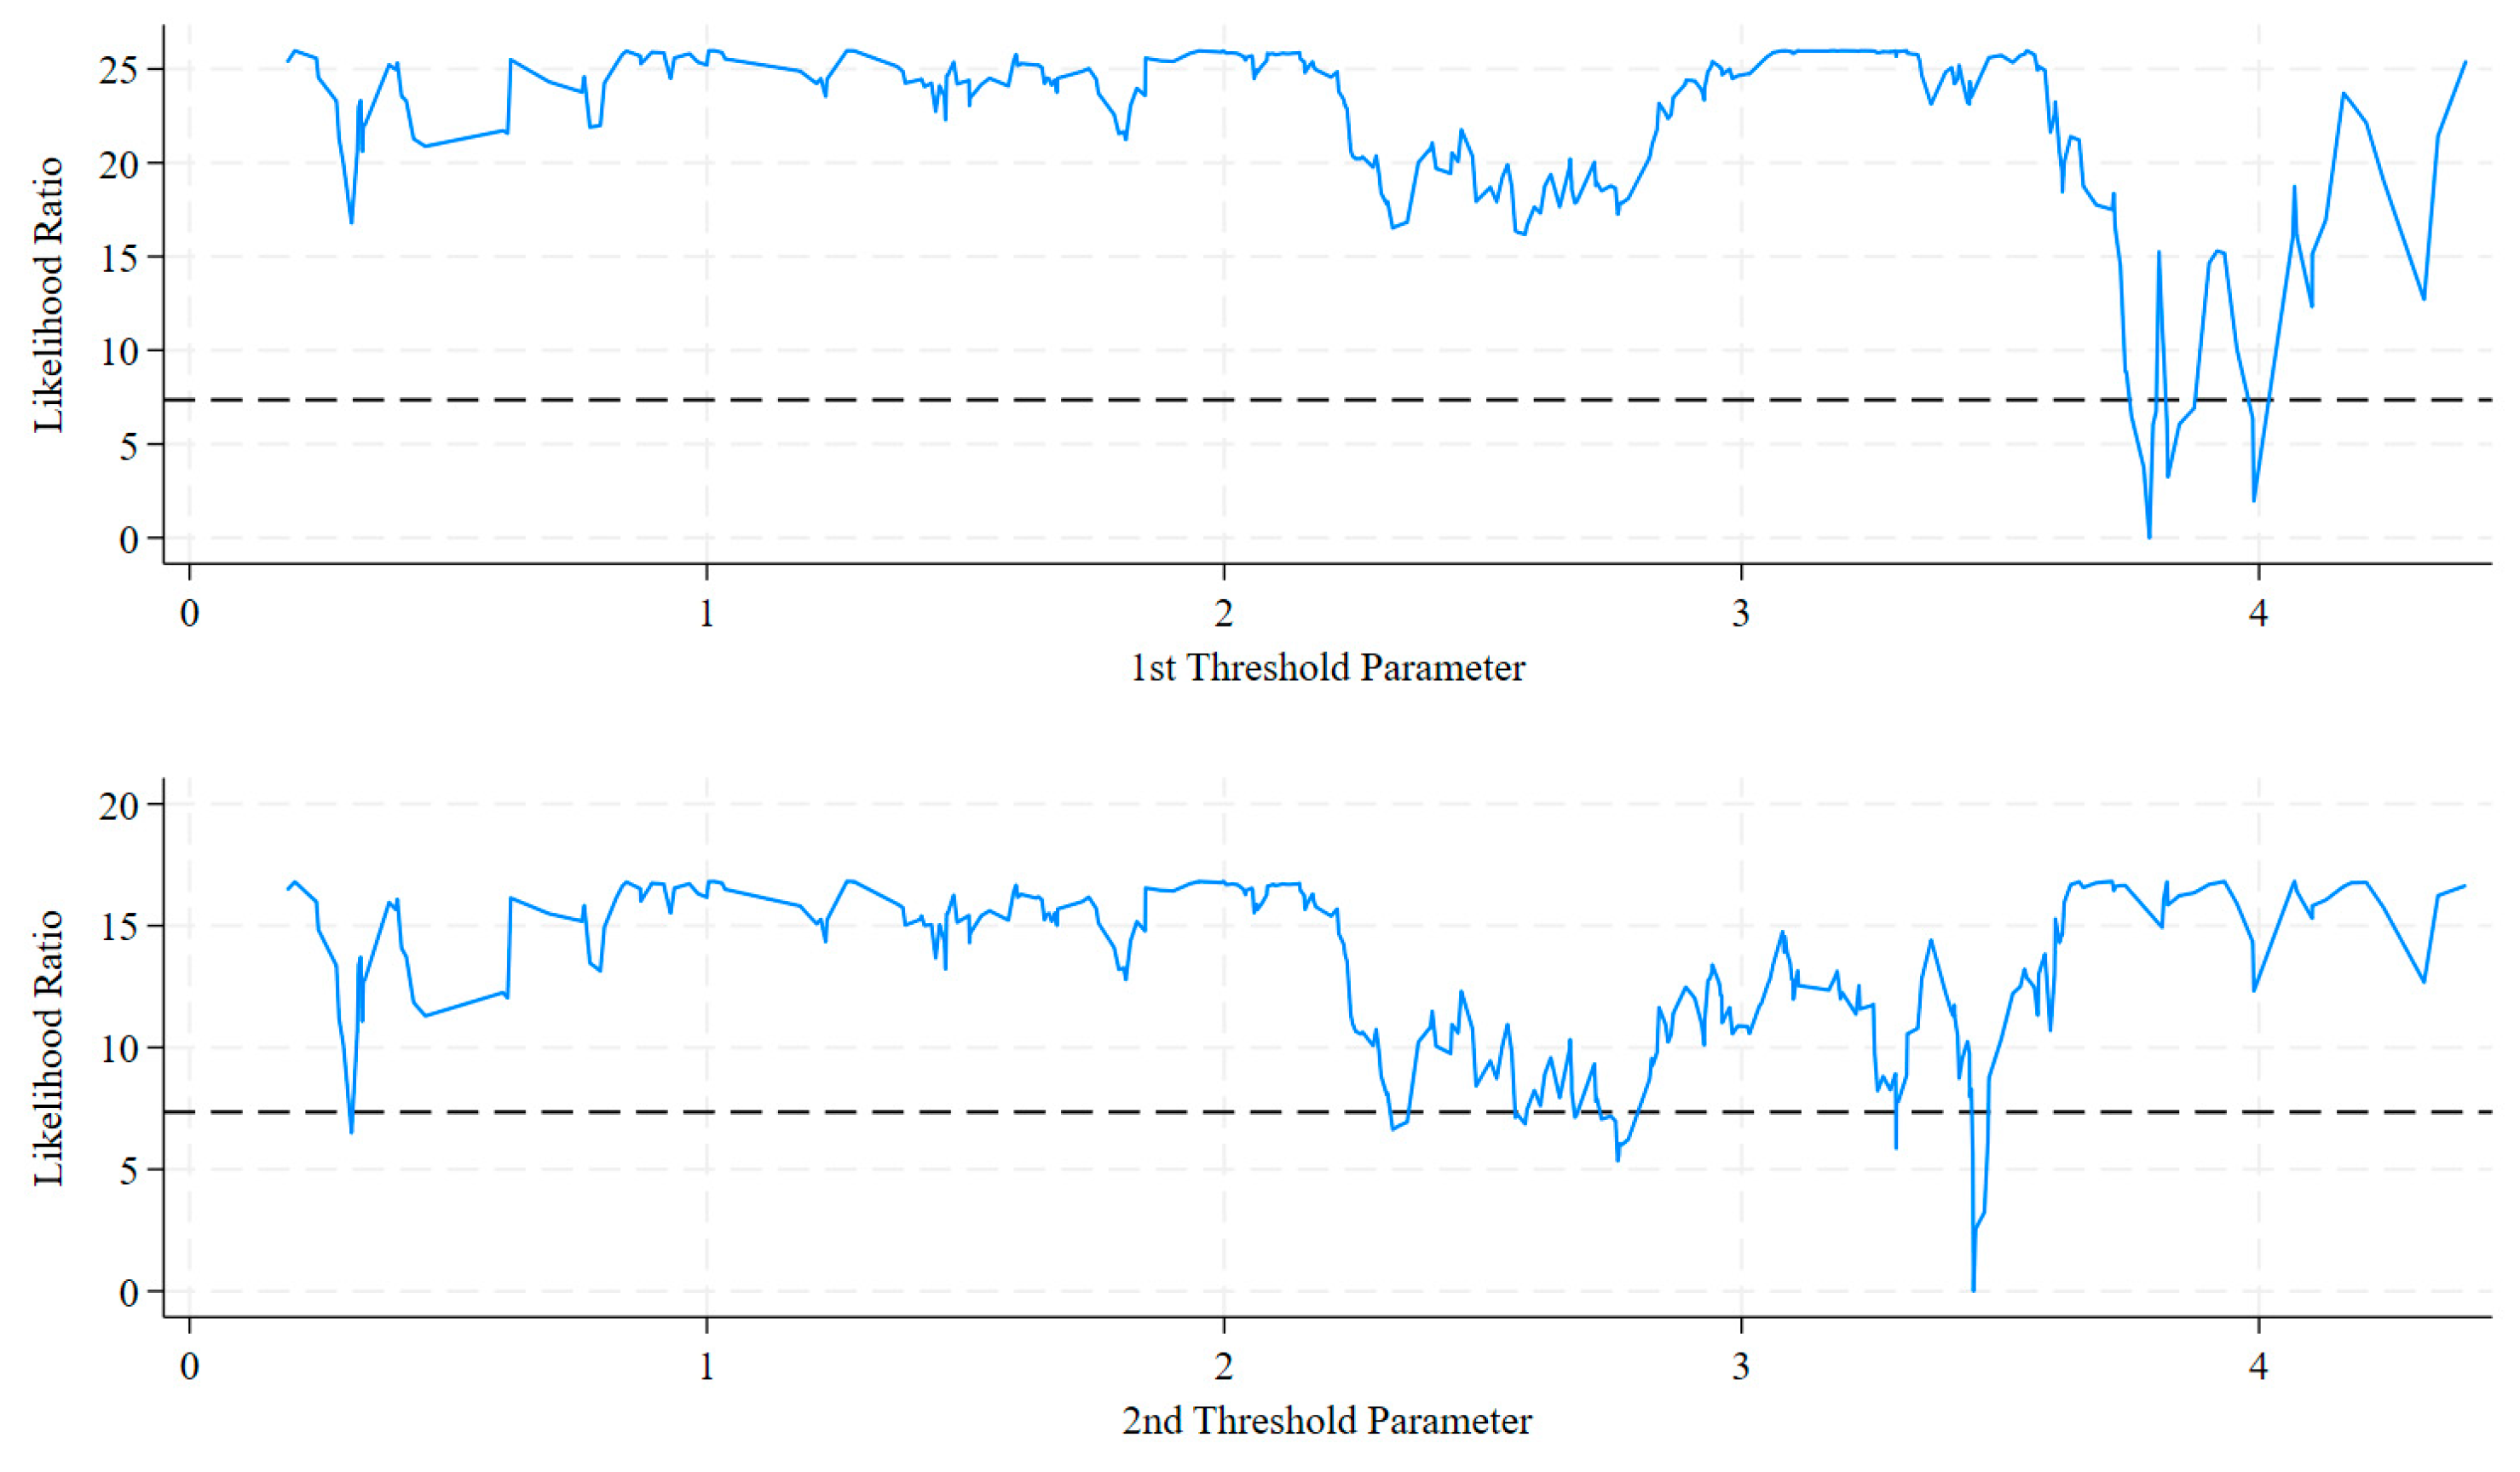
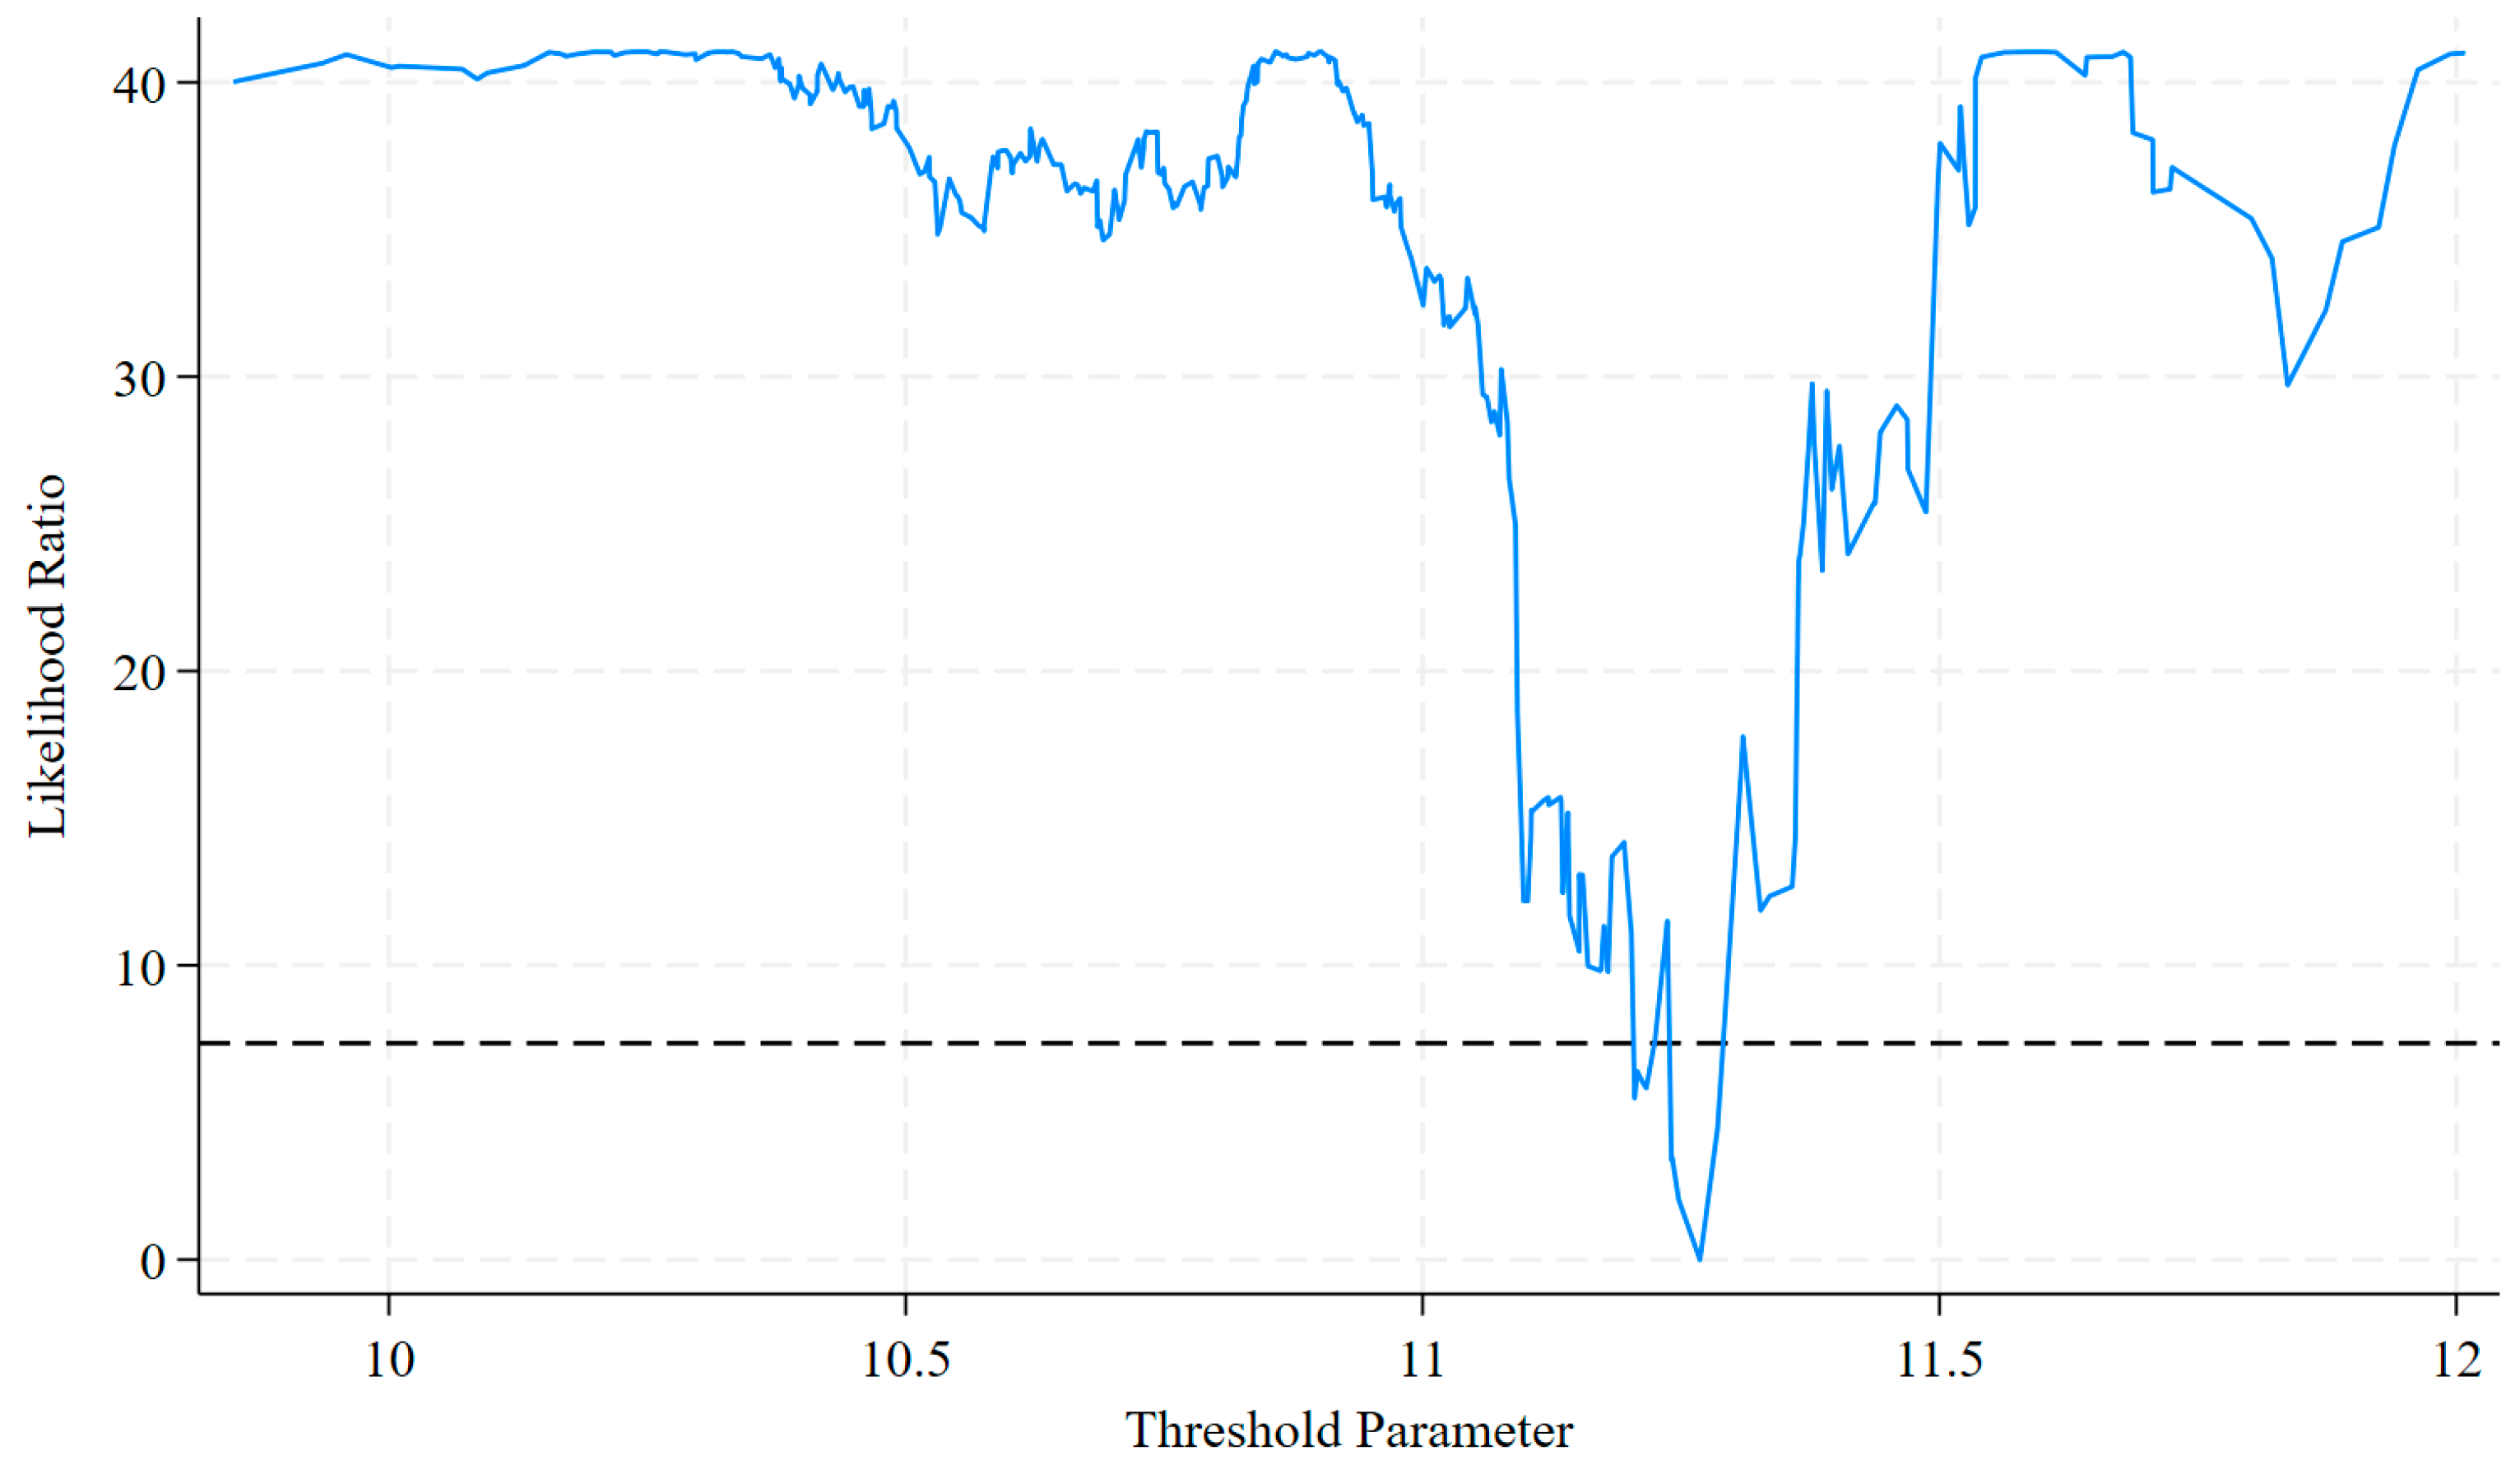
Table A3 reports the estimated thresholds: 3.4486 and 3.7883 for DFI, and 11.2682 for PGDP. Figure A1 and Figure A2 plot the corresponding likelihood-ratio profiles. In each case, the minimum LR statistic falls below the critical value of 7.35, supporting the reported threshold estimate.
Table A3. Estimated threshold values.
VariablesModelThresholdConfidence Interval
DFISingle3.4486[3.4458, 3.4522]
Double3.7883[3.7605, 3.7953]
PGDPSingle11.2682[11.2423, 11.2694]
Figure A1. Threshold-validity test for digital financial inclusion. Note: The dashed horizontal line marks the 95% critical value (7.35); threshold values below it form the 95% confidence interval.
Sustainability 18 09149 g0a1
Figure A2. Threshold-validity test for the level of economic development. Note: The dashed horizontal line marks the 95% critical value (7.35); threshold values below it form the 95% confidence interval.
Sustainability 18 09149 g0a2

References

  1. Peng, Y.; Tan, C.; Huang, D.; Li, P. Agricultural new-quality productive forces empowering rural common prosperity: Examining the mediating mechanism of village digitalization. Front. Sustain. Food Syst. 2025, 9, 1609899. [Google Scholar] [CrossRef] [Scilit]
  2. Xiao, J.; Qiao, J.J.; Han, D.; Ma, Y.L.; Zhu, Q.K.; Wang, W.W. Spatial distribution and transformation mechanism of specialized villages in typical agricultural areas: Case study of Henan province, China. Habitat Int. 2024, 146, 103034. [Google Scholar] [CrossRef] [Scilit]
  3. Huang, G.Q. Connotation, characteristics, significance, and development pathways of new quality productive force in agriculture. Chin. J. Appl. Ecol. 2025, 36, 1281–1288. (In Chinese) [Google Scholar] [CrossRef] [Scilit] [PubMed]
  4. Luo, B.L.; Geng, P.P. New Quality Agricultural Productivity: Theoretical Framework, Core Concepts, and Enhancement Pathways. Issues Agric. Econ. 2024, 4, 13–26. (In Chinese) [Google Scholar] [CrossRef]
  5. Yan, Y.F.; Cui, J.H. Developing new agricultural productivity and empowering high-quality agricultural development. Bull. Chin. Acad. Sci. 2025, 40, 561–570. (In Chinese) [Google Scholar] [CrossRef]
  6. Cao, X.Y.; Lei, J.H.; Shi, D.H.; Yu, W.L.; Tao, T.H.; Zhang, X.; Wang, A. New quality productivity of agriculture and rural areas at the provincial scale in China: Indicator construction and Spatiotemporal evolution. ISPRS Int. J. Geo-Inf. 2025, 14, 104. [Google Scholar] [CrossRef] [Scilit]
  7. Hao, M.Y.; Xie, Y.M.; Chen, Q.L.; Zhou, Z.D. Research on the evaluation of the development level of new quality productive forces in China’s agriculture. J. Front. Econ. Manag. Res. 2025, 1, 1–14. [Google Scholar] [CrossRef] [Scilit]
  8. Qin, L.G.; Liu, S.Q.; Wang, W.Z.; Miao, F.S.; Xie, F.J. Regional differences, dynamic evolution, and obstacle factors in the development of agricultural new quality productive forces in China. J. Resour. Ecol. 2025, 16, 1499–1514. [Google Scholar] [CrossRef] [Scilit]
  9. Wang, Y.; Li, J.Q.; Fan, Y.Q.; Chen, W.L. High-Standard Farmland Construction Policy, Agricultural New-Quality Productivity, and Greenhouse Gas Emissions from Crop Cultivation: Evidence from China. Land 2025, 14, 1157. [Google Scholar] [CrossRef] [Scilit]
  10. Fan, Z.N.; Qin, Z.H.; Ding, Z.G.; Tan, Q.J. Impact of China’s new quality agricultural productive forces on carbon emissions from grain production and its mechanism. Resour. Sci. 2025, 47, 1312–1326. (In Chinese) [Google Scholar] [CrossRef] [Scilit]
  11. Li, J.; Zhang, Z.Y.; Mao, X.F.; Zhang, R.N. Evaluation and suggestions about China agricultural layout based on resources and ecological load. Issues Agric. Econ. 2016, 37, 26–33+110. (In Chinese) [Google Scholar] [CrossRef]
  12. Li, S.L.; Liu, J.N.; Guo, W.Y. Empowered or Negative? Research on the Impact of Industrial Agglomeration on the Development of Agricultural New Quality Productive Forces: Evidence from Shandong Province, China. Sustainability 2025, 17, 3348. [Google Scholar] [CrossRef] [Scilit]
  13. Fan, S.B.; Peng, S.C.; Zhang, X.D. Agricultural New Productivity, Agricultural Support and Protection Policies and High-Level Development of the Agricultural Economy. Stat. Res. 2025, 42, 106–120. (In Chinese) [Google Scholar] [CrossRef]
  14. Aker, J.C.; Mbiti, I.M. Mobile phones and economic development in Africa. J. Econ. Perspect. 2010, 24, 207–232. [Google Scholar] [CrossRef] [Scilit]
  15. Jack, W.; Suri, T. Risk sharing and transactions costs: Evidence from Kenya’s mobile money revolution. Am. Econ. Rev. 2014, 104, 183–223. [Google Scholar] [CrossRef] [Scilit]
  16. Suri, T.; Jack, W. The long-run poverty and gender impacts of mobile money. Science 2016, 354, 1288–1292. [Google Scholar] [CrossRef] [Scilit] [PubMed]
  17. Kikulwe, E.M.; Fischer, E.; Qaim, M. Mobile money, smallholder farmers, and household welfare in Kenya. PLoS ONE 2014, 9, e109804. [Google Scholar] [CrossRef] [Scilit] [PubMed]
  18. Giné, X.; Yang, D. Insurance, credit, and technology adoption: Field experimental evidence from Malawi. J. Dev. Econ. 2009, 89, 1–11. [Google Scholar] [CrossRef] [Scilit]
  19. Yao, B.H.; Shanoyan, A.; Schwab, B.; Amanor-Boadu, V. Mobile money, transaction costs, and market participation: Evidence from Côte d’Ivoire and Tanzania. Food Policy 2022, 112, 102370. [Google Scholar] [CrossRef] [Scilit]
  20. Prodhan, M.M.H.; Jalal, M.J.E.; Alam, H.; Mostofa, M.S.; Khondker, B.H.; Khan, M.A. State and potential of digital financial services among farmers in Bangladesh: An in-depth study. J. Agric. Food Res. 2024, 16, 101209. [Google Scholar] [CrossRef] [Scilit]
  21. Haryanto, T.; Wardana, W.W.; Jamil, I.R.; Brintanti, A.R.D.; Ibrahim, K.H. Impact of credit access on farm performance: Does source of credit matter? Heliyon 2023, 9, e19720. [Google Scholar] [CrossRef] [Scilit] [PubMed]
  22. Yu, C.J.; Jia, N.; Li, W.Q.; Wu, R. Digital inclusive finance and rural consumption structure–evidence from Peking University digital inclusive financial index and China household finance survey. China Agric. Econ. Rev. 2022, 14, 165–183. [Google Scholar] [CrossRef] [Scilit]
  23. Shen, Y.; Liu, Y.J.; Li, J.R. The logic, obstacles, and paths for digital inclusive finance to empower the enhancement of new-quality agricultural productivity. J. Nanjing Agric. Univ. (Soc. Sci. Ed.) 2024, 24, 158–171. (In Chinese) [Google Scholar] [CrossRef]
  24. Qin, L.G.; Liu, S.Q.; Wang, W.Z.; Xie, F.J. Study on the coupling coordination relationship between digital financial inclusion and agricultural new quality productive forces in the Yangtze River Economic Belt. Areal Res. Dev. 2025, 44, 16–24,32. (In Chinese) [Google Scholar] [CrossRef]
  25. Zeng, F.S.; Chen, H.Q. Impact of Digital Finance on Agricultural New Quality Productive Forces at the Provincial Level. Econ. Geogr. 2025, 45, 200–209. (In Chinese) [Google Scholar] [CrossRef]
  26. Cao, Z.D.; Tu, Q.; Hu, Z.Z. Impact of inclusive digital finance on the new quality productive forces of agriculture-related enterprises: A mechanism analysis based on rural industry integration. J. Hunan Agric. Univ. (Soc. Sci.) 2024, 25, 106–116. (In Chinese) [Google Scholar] [CrossRef]
  27. Shen, Y.; Hueng, C.J.; Hu, W.X. Measurement and spillover effect of digital financial inclusion: A cross-country analysis. Appl. Econ. Lett. 2021, 28, 1738–1743. [Google Scholar] [CrossRef] [Scilit]
  28. Fu, X.T.; Guo, C.J. Digital Inclusive Finance and the Construction of Agricultural Modernization. Int. Rev. Econ. Financ. 2025, 102, 104332. [Google Scholar] [CrossRef] [Scilit]
  29. Du, Y.N.; Wang, Q.X.; Zhou, J.P. How does digital inclusive finance affect economic resilience: Evidence from 285 cities in China. Int. Rev. Financ. Anal. 2023, 88, 102709. [Google Scholar] [CrossRef] [Scilit]
  30. Weber, T.A.; Neuhoff, K. Carbon markets and technological innovation. J. Environ. Econ. Manag. 2010, 60, 115–132. [Google Scholar] [CrossRef] [Scilit]
  31. Ma, K.L. Digital inclusive finance and corporate green technology innovation. Financ. Res. Lett. 2023, 55, 104015. [Google Scholar] [CrossRef] [Scilit]
  32. Ren, S.M.; Li, L.Q.; Han, Y.Q.; Hao, Y.; Wu, H.T. The emerging driving force of inclusive green growth: Does digital economy agglomeration work? Bus. Strategy Environ. 2022, 31, 1656–1678. [Google Scholar] [CrossRef] [Scilit]
  33. OECD. Sustainable Manufacturing and Eco-Innovation: Towards a Green Economy; OECD Policy Brief; OECD: Paris, France, 2009; Available online: https://www.greenpolicyplatform.org/sites/default/files/downloads/resource/Sustainable_Manufacturing_and_Eco-innovation_OECD.pdf (accessed on 3 July 2026).
  34. Wan, J.; Zhang, Q.; Lu, Y.C. Mechanisms of green technological innovation in promoting the formation of agricultural new quality productive forces. J. Minzu Univ. China (Philos. Soc. Sci. Ed.) 2025, 52, 85–98. (In Chinese) [Google Scholar] [CrossRef]
  35. Qiu, Y.; Liu, W.H.; Wu, J.J. Digital economy and urban green innovation: From the perspective of environmental regulation. J. Environ. Plan. Manag. 2025, 68, 267–289. [Google Scholar] [CrossRef] [Scilit]
  36. Casanova, L.; Cornelius, P.K.; Dutta, S. Banks, credit constraints, and the financial technology’s evolving role. In Financing Entrepreneurship and Innovation in Emerging Markets; Academic Press: Cambridge, MA, USA, 2018; pp. 161–184. [Google Scholar] [CrossRef] [Scilit]
  37. Shang, X.Y.; Liu, Q. Digital inclusive finance and regional economic resilience: Evidence from China’s 283 Cities over 2011–2021. Financ. Res. Lett. 2024, 69, 105953. [Google Scholar] [CrossRef] [Scilit]
  38. Ma, D.; Zhu, Q. Innovation in emerging economies: Research on the digital economy driving high-quality green development. J. Bus. Res. 2022, 145, 801–813. [Google Scholar] [CrossRef] [Scilit]
  39. Hansen, B.E. Threshold effects in non-dynamic panels: Estimation, testing, and inference. J. Econom. 1999, 93, 345–368. [Google Scholar] [CrossRef] [Scilit]
  40. Liu, Z.Y.; Zhang, Y.C.; Zhang, L.; Zhang, J.M. Digital inclusive finance, digital technology application and entrepreneurial activity: Evidence from China’s provincial panel data. Eur. J. Innov. Manag. 2025, 28, 3103–3128. [Google Scholar] [CrossRef] [Scilit]
  41. Razzaq, A.; Yang, X.D. Digital finance and green growth in China: Appraising inclusive digital finance using web crawler technology and big data. Technol. Forecast. Soc. Change 2023, 188, 122262. [Google Scholar] [CrossRef] [Scilit]
  42. Guo, F.; Wang, J.Y.; Wang, F.; Kong, T.; Zhang, X.; Cheng, Z.Y. Measuring China’s Digital Financial Inclusion: Index Compilation and Spatial Characteristics. China Econ. Q. 2020, 19, 1401–1418. (In Chinese) [Google Scholar] [CrossRef]
  43. Han, X.F.; Song, W.F.; Li, B.X. Could Trade Openness Accelerate Regional Green Innovation? Based on Bidirectional FDI Dynamic Adjustment. Manag. Rev. 2023, 35, 105–115. (In Chinese) [Google Scholar] [CrossRef]
  44. Wang, Z.W.; Jiao, F.Y.; Zhao, T.T. Digital Inclusive Finance, Green Technology Innovation, and Common Prosperity. J. Southwest Minzu Univ. (Humanit. Soc. Sci. Ed.) 2023, 44, 111–122. (In Chinese) [Google Scholar] [CrossRef]
  45. Nunn, N.; Qian, N. US Food Aid and Civil Conflict. Am. Econ. Rev. 2014, 104, 1630–1666. [Google Scholar] [CrossRef] [Scilit]
  46. Wang, L.L. A study on spatial heterogeneity and influencing factors of digital inclusive finance in China. Financ. Econ. 2021, 3, 12–20. (In Chinese) [Google Scholar] [CrossRef]
Figure 1. Scatterplot of DFI and ANQP.
Sustainability 18 09149 g001
Table 1. Evaluation index system of agricultural new quality productive forces.
Primary IndicatorSecondary IndicatorTertiary IndicatorsExplanationAttribute
Agricultural
laborers
Agricultural labor
potential
Rural human capitalAverage years of education among rural residents+
Rural entrepreneurship awarenessRural entrepreneurship activity level+
Agricultural labor
productivity
Agricultural economic outputAgricultural production efficiency+
Agricultural economic incomePer capita disposable income of rural residents+
Agricultural
labor objects
Agricultural industry
development level
Traditional agriculture upgradingProportion of the agricultural product processing industry+
Emerging agriculture growingNumber of national leading enterprises in agricultural industrialization+
Future agricultural constructionNumber of digital industrialized agricultural enterprises+
Agricultural green
development level
Agricultural ecology
development
Forest coverage rate+
Number of green agricultural enterprises+
Agricultural environmental
protection
Pesticide application intensity
Fertilizer application intensity
Agricultural
labor resources
Agricultural material
labor resource
Agricultural digital infrastructureRural cell phone penetration rate+
Rural Internet penetration rate+
Agricultural intangible
labor resource
Agricultural science & technology innovationNumber of agricultural science and technology patents per capita+
Expenditures on agricultural science and technology activities+
Agricultural digital levelNumber of Taobao villages+
Active participation of enterprises in e-commerce+
Note: “+” denotes a positive indicator, whereas “−” denotes a negative indicator.
Table 2. Descriptive statistics.
VariablesObsMeanStd. Dev.MinMax
ANQP3600.28920.0920.12570.6085
DFI3602.43931.07640.18334.6069
GTI3605.91011.45151.38639.1658
FSA3600.11350.03340.04040.2038
UIS3600.90270.05310.74200.9990
AML3601.79970.98360.32646.7085
UL3600.60140.12050.35030.8958
SCL3600.39170.06550.17960.6101
Table 3. Results of the baseline regression.
Variables(1)(2)(3)(4)(5)
ANQPANQPANQP (0.25)ANQP (0.5)ANQP (0.75)
DFI0.1910 ***0.1729 ***0.0483 ***0.0622 ***0.0626 ***
(10.0451)(10.5515)(35.2676)(10.3999)(84.0704)
FSA −0.5658 ***−0.6562 ***−0.3466 **−1.0325 ***
(−5.5554)(−34.0647)(−1.9820)(−50.5455)
UIS −0.0931−0.3728 ***0.1637−0.0188 **
(−0.9649)(−12.8168)(1.1635)(−2.1430)
AML −0.0003−0.0137 ***−0.0098 ***−0.0081 ***
(−0.0934)(−19.5052)(−4.1176)(−20.4457)
UL 0.2726 ***0.2620 ***0.08490.1125 ***
(3.2336)(6.3245)(1.6373)(16.6543)
SCL 0.0696 ***0.01450.1072 **0.0183 **
(2.8835)(1.2749)(2.2238)(2.5720)
_cons−0.1767 ***−0.1749
(−3.8202)(−1.6092)
Province FEYESYESYESYESYES
Year FEYESYESYESYESYES
N360360360360360
Adj. R-squared0.95110.9607
Note: t-statistics (or z-statistics for quantile regressions) appear in parentheses. **, and *** denote significance at the 5%, and 1% levels, respectively.
Table 4. Results of instrumental-variable and GMM estimations.
Variables(1)(2)(3)(4)
DFIANQPANQPANQP
L.ANQP 0.7171 ***0.7466 ***
(8.2087)(8.2947)
IV−0.0136 ***
(−6.4123)
DFI 0.3101 ***0.0547 **0.0437 *
(8.7989)(2.4058)(1.8235)
Constant34.6134 ***−0.1064−0.0656−0.1440
(6.8413)(−0.8385)(−0.6266)(−1.1719)
Control variablesYESYESYESYES
Province FEYESYESYESYES
Year FEYESYESYESYES
Kleibergen-Paap rk LM 63.71
[0.000]
Kleibergen-Paap rk Wald F 41.12
{16.38}
AR(1) −3.72−3.88
[0.000][0.000]
AR(2) −0.85−1.25
[0.395][0.210]
Hansen 13.6413.18
[0.626][0.588]
Observations360360330330
Adj. R-squared0.99770.9532
Note: t-statistics (or z-statistics for quantile regressions) appear in parentheses. *, **, and *** denote significance at the 10%, 5%, and 1% levels, respectively.
Table 5. Results of robustness tests.
Variables(1)(2)(3)(4)(5)(6)
ANQPANQPANQPANQPANQPANQP
L.DFI 0.1557 ***
(8.4219)
DFI1.6037 *** 0.2069 ***0.1238 ***0.1741 ***0.1665 ***
(7.9609) (12.1769)(6.8291)(10.9897)(10.1310)
Constant−1.8386−0.07330.09550.1034−0.2378 **−0.2537 **
(−1.5210)(−0.6363)(0.6663)(1.0604)(−2.0278)(−2.2583)
Control variablesYESYESYESYESYESYES
Province FEYESYESYESYESYESYES
Year FEYESYESYESYESYESYES
Observations360330312270360360
Adj. R-squared0.97870.96020.96180.96710.96090.9613
Note: t-statistics (or z-statistics for quantile regressions) appear in parentheses. **, and *** denote significance at the 5%, and 1% levels, respectively.
Table 6. Robustness tests based on alternative ANQP weighting schemes.
Variables(1)(2)(3)
ANQP (Equal Weights)ANQP (Entropy)ANQP (CRITIC)
DFI0.1534 ***0.2251 ***0.1403 ***
(10.2313)(9.5421)(9.9873)
Constant−0.1745 *−0.1672−0.1831 *
(−1.7232)(−1.1540)(−1.8195)
Control variablesYESYESYES
Province FEYESYESYES
Year FEYESYESYES
Observations360360360
Adj. R-squared0.97070.93000.9698
Note: t-statistics (or z-statistics for quantile regressions) appear in parentheses. *, and *** denote significance at the 10%, and 1% levels, respectively.
Table 7. Results of the green technological innovation mechanism tests.
Variables(1)(2)(3)
ANQPGTIANQP
DFI0.1729 ***0.4222 ***0.1672 ***
(10.5515)(2.5970)(10.1861)
GTI 0.0136 **
(2.1723)
_cons−0.1749−2.8455 **−0.1363
(−1.6092)(−2.2617)(−1.2011)
Control variablesYESYESYES
Province FEYESYESYES
Year FEYESYESYES
Sobel test0.0057 *
(1.693)
Indirect effect0.0057 *
(1.693)
Direct effect0.1672 ***
(9.400)
Total effect0.1729 ***
(9.725)
Proportion of indirect effect0.0331
Observations360360360
Adj. R-squared0.96070.98330.9613
Note: t-statistics (or z-statistics for quantile regressions) appear in parentheses. *, **, and *** denote significance at the 10%, 5%, and 1% levels, respectively.
Table 8. Results of the threshold-effect tests.
VariablesModelF-Statisticp-ValueCritical ValueThreshold95% Conf. Interval
1%5%10%
DFISingle30.71 **0.006726.78117.222714.86563.4486[3.4458, 3.4522]
Double17.79 *0.036725.998516.976613.03013.7883[3.7605, 3.7953]
Triple18.390.566747.440540.040335.3215
PGDPSingle43.28 **0.013347.819236.033128.674611.2682[11.2423, 11.2694]
Double13.150.390036.978830.202924.6257
Triple7.990.696744.894632.515726.6011
Note: t-statistics (or z-statistics for quantile regressions) appear in parentheses. *, and ** denote significance at the 10%, and 5% levels, respectively.
Table 9. Threshold-regression results.
Variables(1)(2)
ANQPANQP
DFI (DFI ≤ 3.4486)0.1012 ***
(5.1028)
DFI (3.4486 < DFI ≤ 3.7883)0.1067 ***
(5.4968)
DFI (DFI > 3.7883)0.1134 ***
(5.9950)
DFI (PGDP ≤ 11.2682) 0.1413 ***
(8.0069)
DFI (PGDP > 11.2682) 0.1494 ***
(8.6431)
_cons0.0548−0.0507
(0.5176)(−0.4623)
Control variablesYESYES
Province FEYESYES
Year FEYESYES
Observations360360
Adj. R-squared0.93370.9324
Note: t-statistics (or z-statistics for quantile regressions) appear in parentheses. *** denote significance at the 1% levels, respectively.
Table 10. Dimension-specific regression results for DFI.
Variables(1)(2)(3)
ANQPANQPANQP
DFI_10.1063 ***
(4.2013)
DFI_2 0.0831 ***
(6.8841)
DFI_3 0.0487 ***
(7.3923)
_cons0.1785−0.0785−0.0204
(1.5872)(−0.6809)(−0.1701)
Control variablesYESYESYES
Province FEYESYESYES
Year FEYESYESYES
Observations360360360
Adj. R-squared0.95150.95730.9561
Note: t-statistics (or z-statistics for quantile regressions) appear in parentheses. *** denote significance at the 1% levels, respectively.
Table 11. Dimension-specific regressions for ANQP.
Variables(1)(2)(3)
Agricultural LaborersAgricultural Labor ObjectsAgricultural Labor Resources
DFI0.0263 ***0.0674 ***0.0792 ***
(6.0844)(7.8977)(7.3154)
_cons0.1465 ***−0.2039 ***−0.1175 **
(6.3595)(−3.1903)(−1.9933)
Control variablesYESYESYES
Province FEYESYESYES
Year FEYESYESYES
Observations360360360
Adj. R-squared0.98260.91770.9443
Note: t-statistics (or z-statistics for quantile regressions) appear in parentheses. **, and *** denote significance at the 5%, and 1% levels, respectively.
Table 12. Subgroup regression results by traditional financial development.
Variables(1)(2)
H-TFDL-TFD
ANQPANQP
DFI0.1943 ***0.1474 ***
(6.9214)(6.2435)
_cons−0.3167 *0.1997
(−1.8304)(1.1053)
Control variablesYESYES
Province FEYESYES
Year FEYESYES
Observations180180
Adj. R-squared0.95620.9669
Note: t-statistics (or z-statistics for quantile regressions) appear in parentheses. *, and *** denote significance at the 10%, and 1% levels, respectively.
Disclaimer/Publisher’s Note: The statements, opinions and data contained in all publications are solely those of the individual author(s) and contributor(s) and not of MDPI and/or the editor(s). MDPI and/or the editor(s) disclaim responsibility for any injury to people or property resulting from any ideas, methods, instructions or products referred to in the content.