1. Introduction
New quality productive forces (NQPF) represent an advanced qualitative state of productivity characterized by high technology, high efficiency, and high quality [
1], serving as an inherent requirement for driving high-quality economic development in the context of the new era [
2]. At the Third Plenary Session of the 20th Central Committee of the Communist Party of China in 2024, the strategic directive to “develop new quality productive forces according to local conditions” was formally proposed. In March 2025, the Government Work Report of the State Council explicitly listed this objective as the second of ten annual priority tasks, underscoring the critical position and significant importance of vigorously developing new quality productive forces within China’s high-quality economic development framework. Since the concept of new quality productive forces was first introduced in September 2023, theoretical research has progressively deepened, encompassing connotation and characteristics [
3,
4], cultivation pathways [
5,
6], and empowerment mechanisms [
7,
8]. Quantitative research remains in its nascent stage, yet scholarly output concerning regional and industrial new quality productive forces at the meso-level has grown considerably. Regional-dimension studies have predominantly focused on provincial-level samples [
9,
10,
11,
12,
13], while city-level research has only recently emerged [
14,
15,
16,
17,
18]. Among these, Shi et al. (2025), employing the entropy weight method to measure NQPF across China’s five major urban agglomerations, utilized kernel density estimation, the Gini coefficient, and Markov chain analysis to explore spatial and temporal dynamics and evolutionary trends [
14]. Mi et al. (2025) examined the Yangtze River Delta urban agglomeration, measuring and analyzing the urban association network characteristics of NQPF development and the effects of network structure on environmental improvement [
15]. Gu and Liu (2025) measured the impact of innovation pilot policy implementation on urban NQPF [
17]. Zhang et al. (2026) employed the Gini coefficient, kernel density distribution, and variance decomposition to measure regional disparities and dynamic evolutionary patterns in NQPF development among Chinese cities, subsequently identifying driving factors using the obstacle-factor method [
18]. Cities play an indispensable role in China’s participation in international competition and cooperation, in sustaining national economic growth, and in promoting coordinated economic development. As China enters an accelerated phase of implementing the new-type urbanization strategy, urban development confronts a series of emerging opportunities and challenges, making inter-city disequilibrium and coordinated development equally crucial [
19,
20]. Consequently, vigorously cultivating urban new quality productive forces carries substantial practical value. Conducting an in-depth and detailed analysis of the dynamic evolution, spatial layout, and associated-pathway characteristics of NQPF development in Chinese cities constitutes a pivotal research agenda for thoroughly implementing the strategy of “developing new quality productive forces according to local conditions” and optimizing the spatial allocation of new-quality factor resources.
As China’s primary social contradiction has evolved, the issues of unbalanced and inadequate development in economic growth have drawn increasing attention. Urban development models have also exhibited a more diversified trajectory, transitioning from traditional monocentric patterns toward polycentric configurations, with spatial structures currently undergoing accelerated restructuring [
21]. The intensification of urban economic activities serves as the fundamental driver of evolutionary change in urban agglomeration network structures [
22], while urban innovation linkages formed through knowledge flows, scientific and technological collaboration, and other channels constitute a critical momentum for reshaping spatial relationships. Consequently, optimizing the spatial allocation of factor resources has become an essential component of enhancing regional coordinated development. Existing research in this domain has primarily focused on spatial disparities, spatial spillovers, and social network perspectives [
23,
24,
25], deriving findings from inter-city differences, association intensity, and network centrality. Concurrently, inter-city competition and cooperation arising from endowment disparities, geographic location, and development policies also represent important elements in the holistic optimization of spatial layouts. The concept of “ecological niche” originated in biological evolutionary theory and matured within ecology. Charles Robert Darwin, in On the Origin of Species, observed that natural selection operates on those variations that are “better adapted to certain positions” within the natural system of a region [
26]. The “positions” referred to herein denote “ecological niches.” Niche theory is progressively emerging as a new frontier in regional economics, with related concepts such as “regional ecological niche” and “urban ecological niche” having been proposed to characterize the “positions” and “functions” of distinct spatial entities within spatial systems [
27,
28,
29]. An ecological niche denotes an N-dimensional hypervolume system in which biological species survive and undergo self-iteration, serving as a framework for evaluating competitive, predatory, and other interactive relationships among different biological populations under consideration of physiological characteristics and habitat conditions [
30,
31]. Cities exhibit certain similarities to species; when a city is conceptualized as an individual population, its “position” in space—given that it occupies only a portion of the resource space—is termed its urban ecological niche. Existing measurements of urban ecological niches have primarily focused on niche width and niche overlap, with niche width used to characterize a city’s capacity to acquire external resources, and niche overlap employed to reflect the degree of resource competition among cities. However, research on niche height remains relatively scarce. Distinct from niche width and overlap, niche height is used to characterize the energy-level state of a city’s internal resource endowment [
32,
33]. Given the limited body of work on niche height characteristics and the absence to date of urban niche height measurements grounded in new quality productive forces, research on the competitive advantages of urban new-quality factor resources remains in its nascent stage.
Guided by this framework, this study addresses three questions: (1) how urban NQPF levels changed across 283 prefecture-level cities and China’s four official economic regions from 2010 to 2023; (2) how niche width, height, and overlap evolved over the same period; and (3) which conditional associations and dominant configurations connect these niche characteristics to NQPF levels. Behind these questions lies a practical issue: as local governments mobilize strikingly similar packages of digital investment, high-tech talent, and strategic projects, each city must strengthen external connections and internal capability without intensifying homogeneous competition—otherwise, “developing according to local conditions” risks degenerating into “developing identically.” Academically, the study asks whether ecological niche measures can render this balance transparent at the city level, which existing designs cannot achieve because they conflate external breadth, internal endowment, and competitive similarity in a single construct. Although the empirical setting is China, this tension is not country-specific; the framework therefore offers a transferable descriptive vocabulary for economies transitioning toward innovation-driven development.
This study makes three contributions relative to existing literature. First, whereas prior city-level studies either measure NQPF directly or examine niche width and overlap in isolation, it links the NQPF with a three-dimensional niche framework, producing a unified city-year measurement system that separately identifies resource level, resource breadth, and inter-city similarity. Second, it extends city-level evidence beyond single urban agglomerations by examining 283 cities over fourteen years under a reproducible official regional classification. Third, it employs multiple regression models and combinatorial pathway analysis to characterize how different niche characteristics are associated with urban NQPF, both individually and in combination, thereby providing structured evidence to inform regional differentiation strategies.
3. Analysis of Urban Ecological Niche Characteristics of NQPF
3.1. Evolutionary Characteristics of Urban NQPF
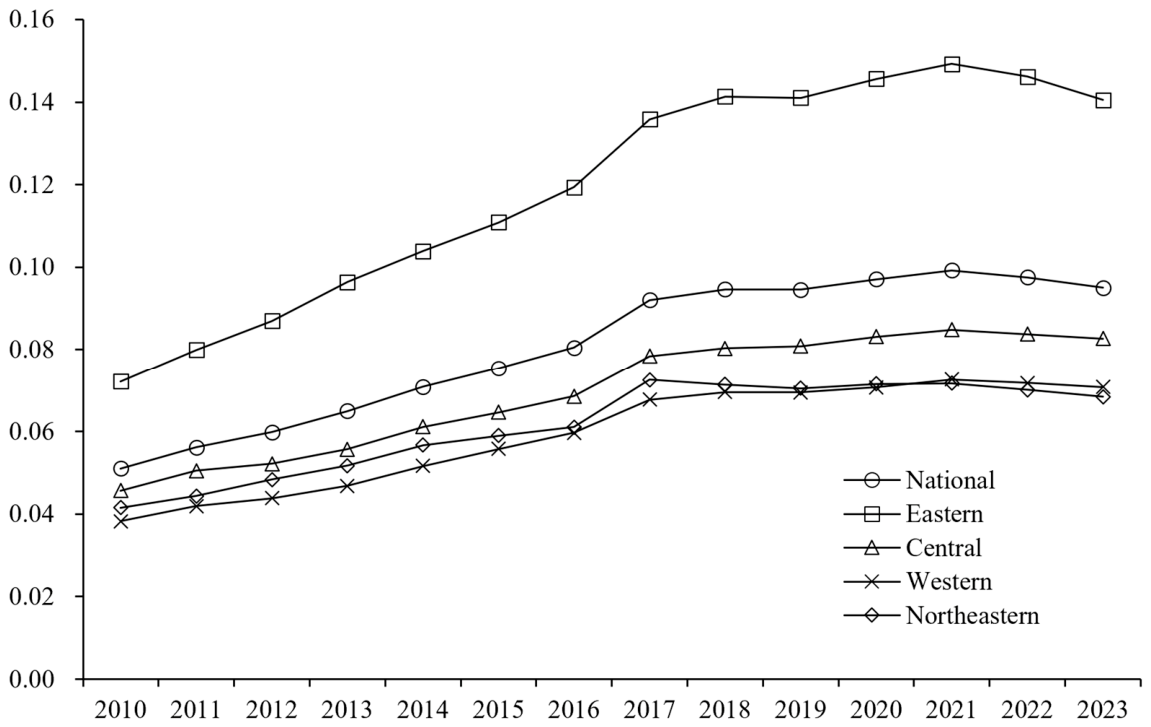
First, based on Equations (1)–(4), the NQPF level values for all cities are obtained.
Figure 1 presents the mean value curves for the national sample and the four economic zones, and
Table 2 reports the statistical results of the typological distribution of NQPF. According to the evolution curve of the mean NQPF across all cities in
Figure 1, the NQPF exhibits a sustained upward trend over the period 2010–2023. In 2010, the mean value was 0.0511, rising to 0.0950 by 2023, representing a cumulative increase of 85.91% and an average annual geometric growth rate of 4.89%. This indicates that, during the study period, China’s urban NQPF maintained a continuous growth trajectory at an annual rate of 4.89%. A phased breakdown reveals that during the 12th Five-Year Plan period (2011–2015), the average annual geometric growth rate was approximately 8.09%, representing a relatively high growth phase, which is defined as the “rapid growth period.” During the 13th Five-Year Plan period (2016–2020), the average annual geometric growth rate moderated to approximately 5.19%. Although still in a growth phase, the pace slowed notably, termed the “moderated growth period.” Entering the 14th Five-Year Plan period (2021–2025), by 2023, the average annual growth rate adjusted to approximately −0.0073%, hovering near zero. Specifically, a slight increase occurred from 2020 to 2021, followed by negative growth in 2021–2022 and 2022–2023. This indicates that, during the 14th Five-Year Plan period, urban NQPF development has essentially entered a “moderate decline period.” In summary, China’s urban NQPF has exhibited a sustained upward trajectory, with an average annual growth rate of approximately 4.89% over the study period. Concurrently, distinct phased characteristics are evident, transitioning from “rapid growth” to “moderated growth” and then to “moderate decline” across the 12th, 13th, and 14th Five-Year Plan periods. Since the onset of the 14th Five-Year Plan period, NQPF has entered a phase of moderate decline, making urban NQPF development a critical challenge for high-quality development.
Second, as shown in
Figure 1, the mean value of NQPF in the Eastern economic zone remains at the highest level. It is significantly higher than the mean values of the Central, Western, and Northeastern regions, and also markedly exceeds the national average across all cities. Moreover, comparing the NQPF curves of the Eastern region with the national sample reveals a widening gap over time: in 2010, the Eastern mean exceeded the national average by approximately 0.0211, and by 2023, this gap had increased to 0.0455. Thus, the Eastern economic zone occupies a “leading” position in urban NQPF development. Relative to the national city sample, the Central economic zone’s NQPF development was generally slightly below the national average during the study period. However, since 2020, the gap has narrowed significantly, and by 2023, the two values were essentially on par. This suggests that the Central economic zone represents an “actively catching up” type. Meanwhile, the mean NQPF levels of the Western and Northeastern regions consistently remained below the national average, indicating that both regions have maintained a “relatively low level” of NQPF development. Taking 2017 as a turning point, the Northeastern region shifted from being slightly above the Western region to slightly below it, with the Western region’s growth rate slightly outpacing that of the Northeast. Consequently, the four major economic zones exhibit a spatial gradient distribution pattern characterized by “Eastern leadership, active Central catch-up, and relatively low levels in the West and Northeast.”
Third, employing the tercile method, urban NQPF development is classified into three types: high-level, medium-level, and low-level, with
Table 2 presenting the distribution statistics of cities across these types for the corresponding years. Historically, the number of low-level cities has declined rapidly and significantly. In 2010, there were 195 low-level cities, accounting for 68.90% of the total and occupying an absolutely dominant position among the three types, but this number decreased to 108 by 2015, 37 by 2020, and 43 by 2023. This indicates that low-level cities have withdrawn from their dominant position, now covering only approximately 15.19% of prefecture-level cities in recent years. Conversely, high-level cities have experienced a dramatic and sustained expansion. Starting with only 34 prefecture-level and above cities in 2010, this number rose to 127 by 2017, surpassing low-level cities in absolute quantity. By 2023, the number of high-level cities reached 123, accounting for 43.46% of the total, making them the largest group and the core force supporting urban NQPF development. Meanwhile, medium-level cities have shown transitional growth, with their number increasing from 54 (19.08%) in 2010 to 117 (41.34%) in 2023. Although they no longer constitute the dominant group, they play a crucial transitional role between the high and low levels. Ultimately, the pattern of “high-level expansion, medium-level transition, and low-level shrinkage” has now taken shape.
In summary, during the period 2010–2023, urban NQPF has generally maintained an upward trajectory. However, the phased, regional, and typological evolution characteristics should not be overlooked. Specifically, the evolution exhibits a phased pattern of “rapid growth → moderated growth → slight decline,” with a modest decline observed since the onset of the 14th Five-Year Plan period. Across the four major economic zones, a gradient distribution pattern of “Eastern leadership, Central catch-up, and relatively low levels in the West and Northeast” has emerged. The number of low-level cities has declined sharply, while high-level cities have grown rapidly to become the largest group, establishing the current typological pattern of “high-level dominance.”
3.2. Measurement and Evolutionary Patterns of Niche Width Characteristics
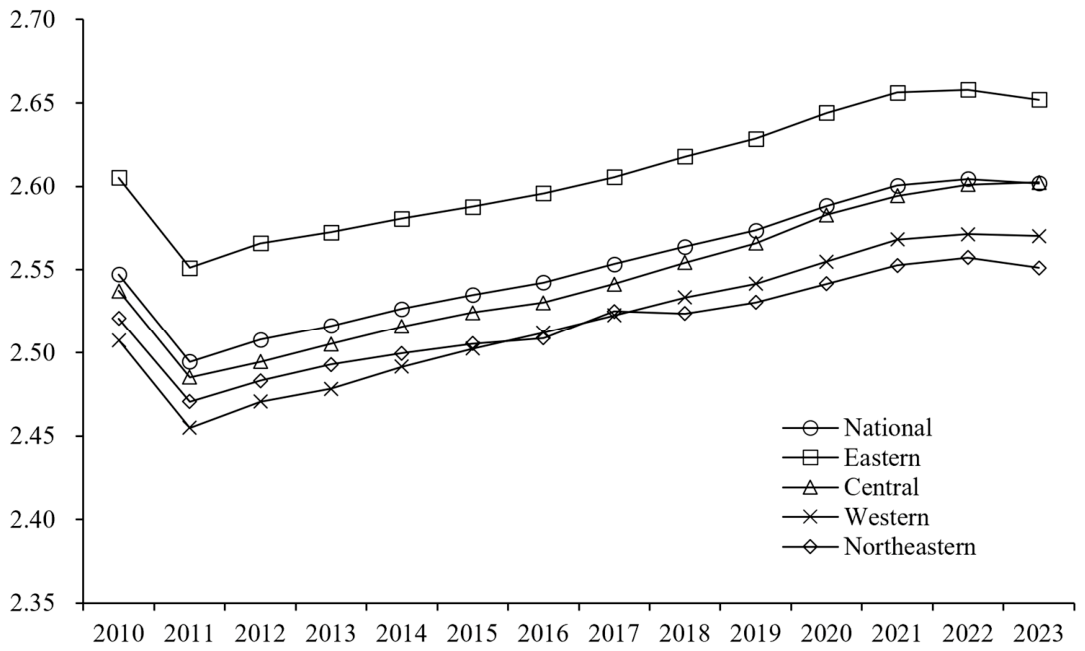
Based on Equation (5), the urban niche width measurement results for 2010–2023 are obtained.
Figure 2 presents the mean value curves for the national sample and the four major economic zones.
First, as shown in
Figure 2, the national mean width exhibits an overall upward trend over the observation period. In 2010, the mean niche width was 2.5472, rising to 2.6019 by 2023, representing a cumulative increase of 2.15%. Specifically, the period 2010–2011 experienced a notable short-term decline of 2.07%, defined as the “short-term adjustment period.” This dip reflects the structural growing pains and resource reallocation frictions as China’s urban economy transitioned from traditional extensive growth to a new innovation-driven development model. From 2011 onward, during the 12th and 13th Five-Year Plan periods, the national mean width grew steadily, reaching a cumulative increase of 4.25% by 2021, with an average annual compound growth rate of 0.42%. This phase is defined as the “long-term growth period,” indicating that cities gradually adapted to the new development paradigm and expanded their capacity to acquire external NQPF factors. Entering the 14th Five-Year Plan period, growth momentum began to decelerate from 2021 to 2022, and in 2023, negative growth (−0.10%) emerged, termed the “momentum attenuation period,” reflecting the mounting pressure of resource bottlenecks and diminishing marginal returns in external factor acquisition. In summary, from 2010 to 2023, the national mean niche width of urban NQPF in China increased modestly, while exhibiting a three-phase pattern of “short-term adjustment → long-term growth → momentum attenuation.”
Second, as shown in
Figure 2, the Eastern economic zone has maintained a sustained lead in niche width, i.e., the external acquisition capacity for NQPF factor resources. This persistent lead is deeply rooted in its first-mover advantage in institutional innovation and its concentration of high-end innovation platforms, which generate a strong “siphon effect” for external resources. However, its growth momentum has gradually weakened, and its first-mover advantage is being progressively narrowed by the Central economic zone, with the gap shrinking by 28.22%. In 2022, the Eastern region became the first to experience negative growth, indicating that its resource acquisition capacity is approaching a saturation point under existing structural constraints. The Central economic zone has demonstrated a robust catching-up trajectory, with a cumulative width increase of 2.56%. This “counter-trend overtaking” aligns with the theoretical framework of regional gradient transfer, where the Central region actively undertakes industrial and factor spillovers from the East, leveraging its geographic hub status. Since 2018, the Western economic zone has surpassed the Northeast, ending the former pattern of “Northeast > West.” This shift is largely attributable to national strategic support, such as the Western Development Strategy, which has effectively enhanced the West’s institutional capacity to attract emerging productive forces. Conversely, the Northeastern economic zone has experienced a cumulative width increase significantly lower than other regions, with its regional standing in continuous decline. This reflects a severe “path dependence” on traditional heavy industries and institutional rigidities, which hinder the inflow of new quality factors. Taking 2018 as the dividing point, the regional ordering shifted from “East > Central > Northeast > West” to “East > Central > West > Northeast.”
Third, employing the tercile method, all cities are classified into three types of niche width: high-level, medium-level, and low-level, with
Table 3 presenting the distribution statistics of cities across these types. From a dynamic evolution perspective, the number of low-level cities first increased and then decreased, reflecting the cyclical shocks of macroeconomic restructuring on resource allocation. The proportion of low-level cities surged to 67.14% in 2011 during the initial structural adjustment phase, before declining rapidly to 6.36% by 2022. However, in 2023, the proportion rebounded slightly to 7.77%, suggesting mounting upward mobility barriers for tail-end cities that suffer from geographic and institutional marginalization. Meanwhile, medium-level cities have played a crucial buffering role in the transition. Their proportion peaked at 44.17% in 2019 before gradually declining to 35.34% in 2023, serving as a transitional reservoir for cities upgrading to higher levels. Most notably, high-level cities have experienced dramatic quantitative expansion, becoming the absolute dominant group. The number of high-level cities grew continuously from 83 (29.33%) in 2010 to 161 (56.89%) in 2023. This structural shift is theoretically consistent with the “agglomeration economy” effect: as NQPF heavily relies on knowledge spillovers and digital networks, factor resources increasingly concentrate in cities with high niche width, creating a “rich-get-richer” cumulative causation process. Overall, the typological distribution of urban niche width has transitioned from a decentralized “pyramid-shaped” structure to a “high-level dominant” inverted-pyramid structure, though the marginal rebound of low-level cities warrants policy attention regarding inclusive development.
In summary, the niche width of NQPF factor resources in Chinese cities has exhibited a significant overall upward trend, with phased changes characterized by “short-term fluctuation → stable growth → recent attenuation.” Across the four major urban agglomerations, the regional pattern has shifted from “East > Central > Northeast > West” to “East > Central > West > Northeast,” with the Western region’s catch-up momentum driven by strategic support contrasting sharply with the Northeast’s institutional lock-in. Meanwhile, the dominant position of high-level cities has steadily strengthened, reflecting the inherent agglomeration logic of new quality productive forces, and the distribution has evolved into a “high-level dominant” structure.
3.3. Measurement and Evolutionary Patterns of Niche Height Characteristics
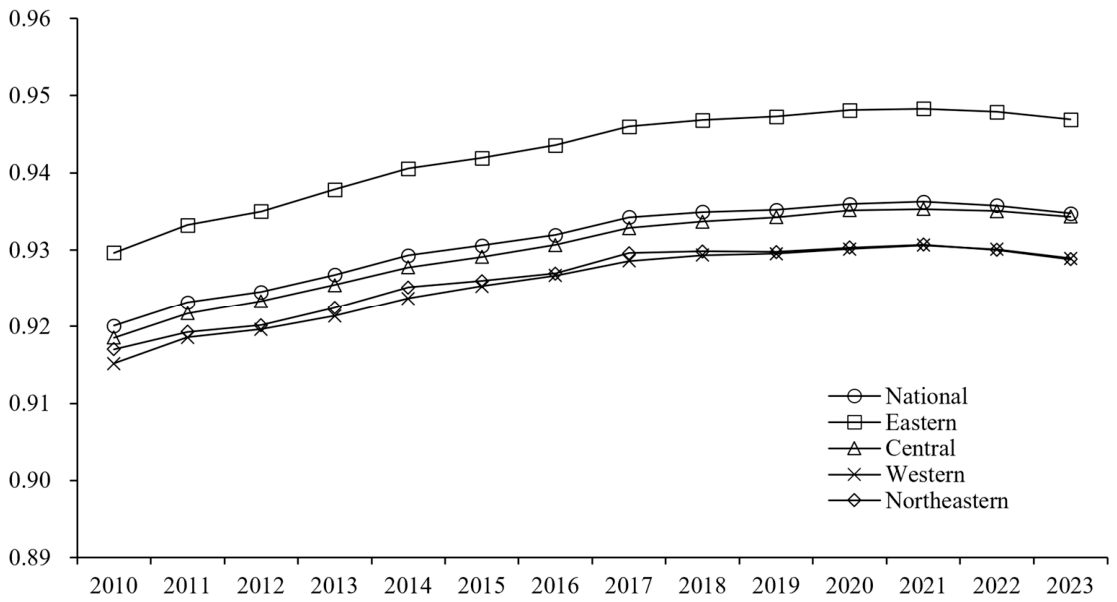
First, based on Equations (6)–(8), the urban niche height measurement results for all cities are obtained.
Figure 3 presents the mean value curves for the national sample and the four major economic zones. As shown in
Figure 3, during the period 2010–2023, urban niche height in China exhibited a sustained upward trend. In 2010, the mean niche height was 0.9201, reaching a peak of 0.9362 in 2021, with a cumulative increase of 1.75%. This was followed by two consecutive years of decline from 2021 to 2022 and from 2022 to 2023, with a cumulative decrease of 0.16% over the 2021–2023 period. This initial rise and subsequent decline closely mirror China’s macroeconomic transition: the early gains reflect the demographic and structural dividends of shifting from traditional extensive growth to innovation-driven development under the supply-side structural reforms, while the recent decline since 2021 points to the mounting external pressures of technological “chokepoints” and the diminishing marginal returns of domestic R&D investment in high-quality factor cultivation. A phased breakdown reveals that during the 12th Five-Year Plan period (2011–2015), the average annual growth rate was 0.23%, characterized as a “steady improvement period.” During the 13th Five-Year Plan period (2016–2020), the growth rate slowed slightly to 0.12%, entering a “moderated growth period.” In the first three years of the 14th Five-Year Plan period (2021–2023), the mean value shifted from increase to decrease, with an average annual decline of 0.04%, characterized as a “moderate decline period.” Therefore, while urban niche height in China’s NQPF development has maintained a long-term upward trajectory, it exhibits a phased pattern of “sustained rise followed by a modest decline in recent years.”
Second, a comparison of the niche height curves for the Eastern, Central, Western, and Northeastern economic zones in
Figure 3 reveals that the Eastern region has long maintained an absolute leading position. Its energy-level state of NQPF factor resources is significantly higher than the national average, positioning it as the most favorable urban agglomeration for NQPF factor resources and occupying a core status. This sustained leadership is theoretically grounded in the “Matthew effect” of regional innovation systems: the Eastern region’s entrenched advantages in top-tier universities, national laboratories, and headquarters economies create a self-reinforcing cycle of high-end talent attraction and proprietary technology generation. The Central economic zone’s energy-level state of NQPF factor resources is slightly below the national average, while the Western and Northeastern economic zones occupy the third tier, significantly below the national average, representing the regions with the lowest energy levels of NQPF factor resources in China. The lag of the Northeast can be attributed to institutional lock-in and severe brain drain, whereas the West, despite strategic state support, still lacks the dense innovation networks necessary to autonomously cultivate high-energy factors. Thus, the energy-level state of NQPF factor resources across Chinese cities exhibits a gradient distribution pattern of “Eastern sustained leadership, Central secondary, Western and Northeastern lagging behind,” with the Eastern economic zone’s concentration of high-energy NQPF factor resources being particularly prominent.
Third, employing the tercile method, all cities are classified into three types of niche height: high-level, medium-level, and low-level.
Table 4 presents the distribution statistics of cities across these three types. The dynamic evolution reveals a fundamental structural reshaping of the energy-level state of NQPF factor resources. Historically, in 2010, there were 220 low-level cities, accounting for an overwhelming 77.74% of the total, representing a classic “pyramid” structure heavily skewed toward the bottom. However, this landscape underwent a rapid hollowing-out process at the base. The proportion of low-level cities plummeted to 15.19% (43 cities) by 2023. Concurrently, medium-level cities experienced substantial expansion, growing from just 25 cities in 2010 to 121 cities (42.76%) in 2023, thereby establishing themselves as the largest single group. Furthermore, high-level cities demonstrated a remarkable trajectory of persistent ascent, with their numbers increasing more than threefold from 38 in 2010 to 119 (42.05%) in 2023. By 2023, the combined proportion of medium- and high-level cities reached 84.81%, definitively ending the historical dominance of low-level cities. This dual transition is theoretically consistent with the “threshold effect” in regional economics: only after surpassing a critical mass of innovation infrastructure and human capital can cities upgrade their factor energy levels, moving from a low-quality resource pool to medium- and high-level ecosystems. This structural shift indicates that while the overall energy-level state of NQPF factor resources in Chinese cities has been steadily rising, the “medium-level to high-level” transition has become the critical descriptive and mechanistic pathway for future high-quality development, highlighting the urgency of overcoming technological bottlenecks to sustain this upward mobility.
In summary, during the study period, the urban energy-level state of NQPF factor resources in China generally maintained a stable upward trajectory, with a modest decline observed since 2021. In terms of spatial distribution, the Eastern economic zone has consistently remained the center of factor resource agglomeration, followed by the Central urban agglomeration, while the Western and Northeastern regions remain far below the national average. Typologically, the tercile method reveals a profound structural transition from a “low-level dominant” pyramid to a “medium-high level dual-peak” structure, with medium- and high-level cities accounting for 84.81% of the total by 2023, making the transition toward higher energy levels a critical evolutionary pathway.
3.4. Measurement and Evolutionary Patterns of Niche Overlap Characteristics
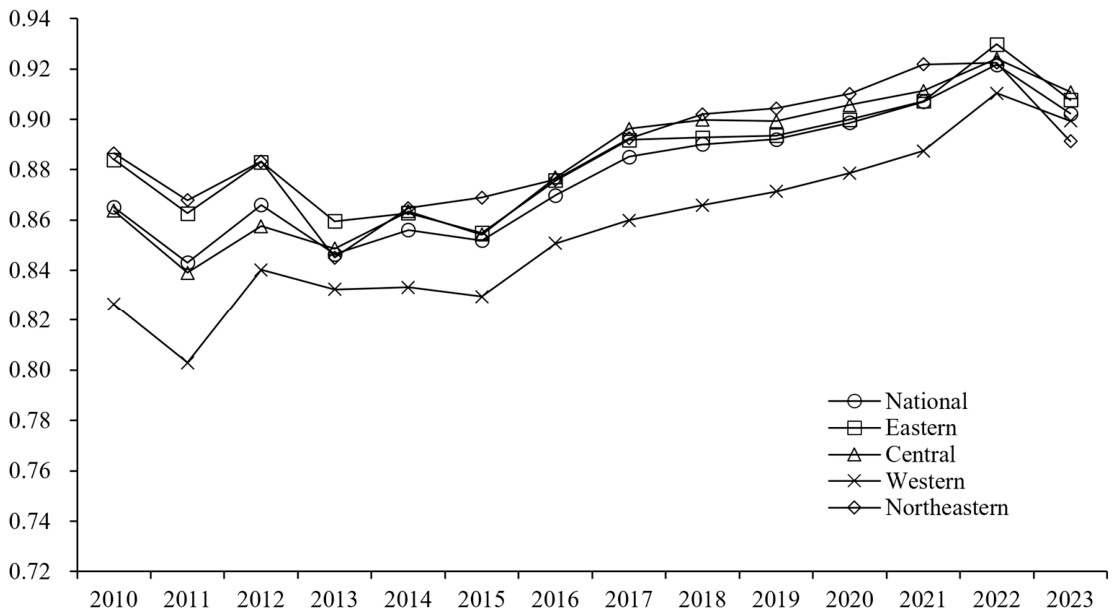
First, based on Equation (9), the urban niche overlap values for 2010–2023 are obtained.
Figure 4 presents the mean niche overlap values for all cities and for the four major economic zones. According to the overall mean curve shown in
Figure 4, the mean niche overlap increased from 0.8651 to 0.9023 over the study period, exhibiting a fluctuating upward trend with an average annual growth rate of 0.32%. A phased breakdown reveals that during the 12th Five-Year Plan period (2011–2015), the overlap increased from 0.8431 to 0.8519, with the average annual growth rate moderating to approximately 0.26%. This indicates that the intensity of inter-city competition for NQPF factor resources continued to rise, albeit at a decelerating pace. This intensifying competition in the early stages reflects the “convergent” industrial policies adopted by local governments rushing to seize emerging technology tracks, leading to homogenized resource allocation. During the 13th Five-Year Plan period (2016–2020), the average annual growth rate accelerated to 0.81%, marking a significant increase in the pace of competition. Entering the 14th Five-Year Plan period, the overlap value declined moderately to 0.9023 over 2021–2023, exhibiting a modest downward trend. The recent downturn suggests an initial optimization of resource allocation, potentially driven by the construction of a unified national market and central guidance for differentiated development to alleviate excessive homogenization. Therefore, the intensity of inter-city competition for NQPF factor resources in China exhibits an evolutionary pattern of “low-speed growth → medium- to high-speed growth → moderate decline.”
Second, as shown in the evolution curves of niche overlap for the four major economic zones in
Figure 4, the overlap values for the Eastern, Central, and Northeastern regions all lie close to the national average. Prior to 2015, the curves for the three regions exhibited notable differentiation, with the Eastern and Northeastern economic zones significantly higher than the Central economic zone. From 2016 onward, the niche overlap values of the three regions essentially converged, aligning closely with the national average. Concurrently, over the study period, the Western economic zone’s niche overlap remained significantly below the national average; however, since 2015, the gap has narrowed considerably, with a pronounced catch-up effect. The persistently lower overlap in the West indicates that it has not yet been fully integrated into the core network of national factor competition, but its catch-up trajectory shows it is increasingly drawn into the competitive arena. Thus, in terms of inter-zone comparison for NQPF factor resources, all four economic zones—Eastern, Central, Northeastern, and Western—have demonstrated a steady upward trend. The spatial pattern, characterized by slightly higher overlap in the Eastern, Central, and Northeastern regions and slightly lower overlap in the Western region, remains evident, yet regional disparities have narrowed significantly.
Third, employing the tercile method, all cities are classified into three types of niche overlap: low-level, medium-level, and high-level, with
Table 5 presenting the distribution statistics for the three types over the study period. The dynamic evolution reveals a profound structural shift toward high-intensity competition. In 2010, the distribution was relatively dispersed, with medium-level cities dominating at 132 (46.64%) and low-level cities closely following at 104 (36.75%). However, the landscape underwent a dramatic hollowing-out of the middle and bottom tiers over the decade. By 2023, high-level cities surged to 187, accounting for an overwhelming 66.08% of the total, while medium- and low-level cities shrank to 46 (16.25%) and 50 (17.67%), respectively. This structural transition toward a “high-level dominant” overlap pattern indicates that inter-city competition for NQPF factors has entered a state of “homogenized involution.” Cities are increasingly competing for identical strategic resources—such as AI talent and new energy projects—within the same ecological niche, elevating the risk of zero-sum competition. From the perspective of niche theory, this excessive overlap necessitates urgent policy guidance for “niche differentiation” to avoid redundant investments and foster complementary, synergistic development pathways. How to avoid excessive competition among cities in this resource domain is gradually becoming an important issue in the spatial planning of China’s NQPF development.
In summary, inter-city competition for NQPF factor resources in China has maintained a steady upward trend over the study period, with regional disparities in competitive intensity continuing to narrow and converging over time. This evolution culminated in a structural transition toward “high-intensity competition dominance.” Avoiding excessive competition arising from homogenization and guiding differentiated urban development are increasingly becoming critical issues in accelerating NQPF development.
5. Discussion
5.1. Interpretation and International Relevance
This study systematically analyzes the ecological niche characteristics and evolutionary pathways of urban NQPF in China. To clarify the novelty and positioning of our contribution, we situate these findings within the broader international scholarship on regional innovation systems, agglomeration economies, and evolutionary economic geography [
34,
35,
36,
37], to which the ecological-niche framing is closely related.
The empirical results reveal several important findings. First, the long-term upward trend in urban NQPF and the persistent Eastern lead are consistent with recent city-level and province-level measurements in China. The niche framework adds a different lens by separating external resource breadth, internal endowment, and inter-city similarity. The positive associations for niche width and niche height align with regional innovation systems research [
34], which emphasizes that innovation depends on both local capability and connections to external knowledge and institutions. Niche width, measuring a city’s capacity to acquire external resources, corresponds to the concept of regional absorptive capacity and urban network externalities. Broader access to knowledge, capital, talent, and industrial inputs enlarges opportunities for recombination and reduces dependence on a narrow development path. Niche height, reflecting the internal energy-level state of factor resources, corresponds to agglomeration economies and regional path creation, where high-quality factor endowments drive cumulative causation through self-reinforcing cycles of innovation and investment. The observed spatial gradient pattern, characterized by Eastern leadership, Central catch-up, and Western and Northeastern lagging, is not merely an administrative phenomenon but a spatial manifestation of regional path dependence and core-periphery dynamics [
35].
Second, regarding the negative association between niche overlap and NQPF, it is necessary to further explore its underlying mechanisms at a conceptual level. Although the regression design establishes association rather than strict causation, the consistent negative sign across multiple robustness checks invites plausible mechanism-based interpretation. The suppression of NQPF by high niche overlap can be interpreted through three distinct channels. The first is the crowding-out channel. High overlap implies intense competition among cities for identical new-quality factors, such as high-tech talent, specific digital investments, and strategic emerging industry projects, leading to diminishing marginal returns and crowding out productive investments. The second is the homogenization channel. High overlap reflects structural isomorphism. Instead of pursuing place-based differentiated pathways, cities converge on similar “hot” industries, leading to homogenized competition, price wars, and a loss of differentiation advantages. The third is the knowledge-spillover channel. While agglomeration economies typically suggest positive knowledge spillovers, when niche overlap is excessively high, local knowledge spillovers may become redundant rather than complementary. Breakthrough innovations require a degree of technological distance and related variety [
36,
37]. Without it, the marginal benefit of localized knowledge exchange drops, stifling true novelty. These interpretations remain mechanism-based explanations rather than tested mediation results, and future work should distinguish these channels with direct measures.
Third, the configuration analysis reveals a structural transformation in the combinatorial pathways of urban NQPF. The shift from LLL and MLM dominance in 2010 to HHH and MMH dominance in 2023 indicates that the evolution of NQPF is not a single-factor process but a multi-dimensional synergetic transition. Cities that successfully upgraded their NQPF levels achieved coordinated improvements across width, height, and overlap simultaneously. The emergence of MMH as a dominant pathway in medium-level cities further suggests that the transition of niche overlap from medium to high is a critical gateway for cities moving toward high-level NQPF. This finding aligns with the evolutionary economic geography perspective that regional development trajectories are shaped by the co-evolution of multiple dimensions rather than any single factor in isolation.
Furthermore, although the empirical context is specific to China’s transitional economy, the theoretical implications of these findings have broader relevance. The spatial evolution from low-level to medium-high-level dominance and the shift in combinatorial pathways represent a spatial manifestation of the transition from extensive growth to innovation-driven development. The challenge of optimizing resource allocation while avoiding homogenized competition is a universal dilemma faced by urban systems globally undergoing structural transformation. Regions in many countries face a related problem: they need access to mobile knowledge, capital, and talent while maintaining local capabilities and avoiding uniform industrial strategies. The width-height-overlap framework offers a transferable descriptive vocabulary for this balance. The framework proposed in this study does not require other countries to mechanically replicate China’s indicator system. Instead, researchers and policymakers in different national contexts may combine the ecological-niche framework with their own institutional arrangements, urban development stages, and data availability. In this sense, the China-based evidence presented in this study provides a reference for constructing locally adapted measures of innovation-driven urban productivity and for analyzing how such productivity transformation reshapes inter-city competitive and cooperative relationships in other developing economies.
5.2. Limitations and Future Research
While this study offers valuable insights, a candid acknowledgment of its boundaries is necessary to help readers calibrate the policy recommendations and guide future extensions.
First, regarding data aggregation, the study relies on prefecture-level aggregate data. The exclusion of county-level dynamics limits the analysis of intra-regional heterogeneity and micro-level spatial interactions. Future research could integrate county-level or firm-level data to explore the micro-driving factors of NQPF. Second, concerning the descriptive nature of the niche measures, although this study constructs a three-dimensional structural analysis framework, these measures primarily capture the macro-level states of resource acquisition, energy levels, and competitive intensity. They do not fully uncover the underlying micro-mechanisms or the dynamic interactions among specific agents within the region. Third, regarding causal identification, while the multiple regression and robustness check effectively identify the key driving effects, the study does not employ strict quasi-experimental designs (e.g., instrumental variables or difference-in-differences) to fully rule out potential endogeneity. However, given that the primary objective of this study is to characterize evolutionary patterns and identify major driving pathways rather than evaluate a specific policy’s causal impact, this limitation does not undermine the core conclusions of the study.
To address these constraints, we propose concrete extensions for future research: (1) Spatial econometric modeling: Future studies should employ Spatial Durbin Models (SDM) or Spatial Error Models (SEM) to disentangle the direct and indirect spatial spillover effects of NQPF dimensions across city networks. (2) Explicit mechanism testing: Future research could use mediation analysis to empirically test the three channels (crowding-out, homogenization, knowledge-spillover) through which niche overlap affects productivity. (3) Comparison with alternative regional schemes: Researchers could compare results using alternative regional classifications (e.g., mega-city regions like the Yangtze River Delta) to test the sensitivity of the framework.
6. Research Conclusions and Policy Implications
From an ecological niche perspective, this study evaluates city resource endowments, external access, and inter-city similarity and describes their associations and dominant configurations in relation to NQPF. The main conclusions are as follows.
6.1. Main Research Conclusions
First, the spatiotemporal evolution of urban NQPF in China exhibits multidimensional complexity. Temporally, NQPF maintained an overall upward trend from 2010 to 2023 with an average annual growth rate of 4.89%, yet the trajectory shifted from rapid growth during the 12th Five-Year Plan period to moderated growth in the 13th, and then to a slight decline in the initial years of the 14th. Spatially, a stable gradient pattern persists in which the Eastern region leads with a widening advantage, the Central region actively catches up and has essentially reached parity with the national average, while the Western and Northeastern regions remain relatively low. Typologically, low-level cities have withdrawn from their dominant position, high-level cities have become the largest group, and a pattern of high-level expansion, medium-level transition, and low-level shrinkage has taken shape.
Second, the niche characteristics of urban NQPF exhibit significant dynamic evolution and spatial differentiation. Niche width shows an overall upward trend following a three-phase trajectory of short-term adjustment, long-term growth, and recent momentum attenuation, with its typological distribution transforming from a pyramid-shaped into a high-level dominant structure. Regionally, the ordering shifted after 2018 from East above Central above Northeast above West to East above Central above West above Northeast. Niche height rose steadily before a modest recent decline, remaining highly concentrated in the Eastern region; medium- and high-level cities now jointly account for the vast majority, marking a transition toward a medium–high dual-peak configuration. Niche overlap increased in a fluctuating manner with narrowing regional disparities, and high-overlap cities have come to dominate, raising concerns about homogenized competition.
Third, urban NQPF development exhibits a dynamic pattern of niche linkage and pathway differentiation. Regression results indicate that niche width and height are significantly and positively associated with NQPF levels, whereas overlap exhibits a significant negative association. These associations display marked regional heterogeneity: the width association is strongest in the Central region, the height associations are most prominent in the Eastern and Northeastern regions, and the negative overlap association appears only weakly in the Western region. Combinatorial pathway analysis reveals a structural shift from LLL and MLM types to HHH and MMH types as the dominant configurations. For high-level cities, the HHH pathway has become absolutely dominant; for medium-level cities, MMH has grown into the primary route of gradient ascent; for low-level cities, the dominant pathway shifted from LLL to LLH. Overall, China’s urban NQPF follows a gradient upgrading trajectory characterized by high-level expansion, medium-level reinforcement, and low-level quality improvement.
6.2. Policy Implications
First, the spatial optimization of NQPF factor resource allocation should be prioritized, given that both niche width and height are positively associated with NQPF levels, yet currently exhibit a spatial hierarchy of East highest, Central second, and West and Northeast lowest. For the Eastern economic zone, which holds the most favorable position in both dimensions, policy should continue to support advanced labor force cultivation and cutting-edge technological R&D, reinforcing its leading role in high-quality factor agglomeration—while remaining alert to saturation signals reflected in its attenuating width growth. For the Central economic zone, where the width association is strongest nationally, improving the investment environment and strengthening spatial diffusion channels to attract factor spillovers from the East may yield greater marginal returns and thus merit priority in policy design. For the Western and Northeastern zones, accelerated catch-up should be pursued through factor flow attraction, preferential policy support, and talent and industrial transfer. Notably, the Northeastern region displays a comparatively strong height association alongside its weakest width association, implying that policies prioritizing external openness and market vitality, so as to convert its substantial innovation foundations into effective resources, may be especially valuable.
Second, differentiated development pathways should be encouraged to mitigate the risks arising from high niche overlap. Given the significant negative association between niche overlap and NQPF, and given that high-overlap configurations had come to dominate the national landscape by 2023, reducing inter-city resource redundancy deserves to be treated as a strategic direction. Cities at all levels should conduct comprehensive assessments of their NQPF factor resources, including systematic SWOT analyses, to formulate development plans aligned with their unique endowments. R&D-intensive cities should consolidate positions in high-end talent cultivation, commercialization of high-tech outcomes, and specialized enterprise incubation. Beyond such pathways, differentiated models such as green-factor-driven, high-tech-industry-driven, and digitalization-driven routes should be cultivated to achieve staggered, complementary development. Special caution is warranted in the Western region, where early signs of homogenized competition have begun to appear, and preemptive guidance against blindly chasing trending industries may help avoid redundant investment.
Third, inter-regional spillover channels and coordinated incentive policies should be reinforced to facilitate gradient upgrading and holistic improvement of urban NQPF. Enhanced support for the Central, Western, and Northeastern regions through fiscal transfers, tax incentives, and industrial policies should guide resources toward these areas, accelerating digital infrastructure construction and technological capacity building to narrow gaps with the East. Dedicated funds could support R&D in key core technologies, while collaboration between innovative enterprises in the East and research institutions in the Central and Western regions should be encouraged to achieve technology sharing and innovation synergy. Inter-regional education cooperation and talent exchange should be promoted through targeted assistance and joint training programs to cultivate and retain high-quality talent. Additionally, industrial transfer and absorption should be strengthened with improved supporting systems that facilitate chain extension and upgrading. Closer industrial synergy mechanisms within the Yangtze River Delta and Pearl River Delta urban agglomerations may serve as replicable reference models for raising regional NQPF levels and cultivating globally influential science and technology innovation centers.