1. Introduction
Every retired traction battery forces a choice that current practice makes largely ad-hoc [
1]: restore the pack, redeploy it in a less demanding role, recover its materials, or scrap it. Packs sold during the first wave of electric-vehicle (EV) and plug-in hybrid electric-vehicle (PHEV) adoption are now approaching the end of their first automotive service life [
2,
3], and how they are handled is central to the circular-economy ambition of retaining embodied value and energy rather than discarding them [
4]. Value-retention strategies form an ordered hierarchy, from refurbishment and remanufacturing through second-life redeployment to material recycling [
4,
5,
6,
7], and each pathway carries distinct economic, environmental, and safety implications [
1,
8]. The reported benefits are conditional rather than intrinsic: second-life use can lower levelized storage cost and life-cycle greenhouse-gas emissions relative to new systems under favorable conditions [
9,
10]; remanufacturing can deliver environmental advantages in specific settings, set against the substantial manufacturing carbon intensity of lithium-ion cells [
11,
12,
13,
14,
15]; consumer acceptance of refurbished products is governed by trust instruments under information asymmetry [
16,
17,
18,
19]; and the regulatory architecture around Regulation (EU) 2023/1542 and the Digital Battery Passport (DPP) is still taking shape [
20,
21,
22,
23]. Two operational obstacles sharpen the decision. First, residual capacity is routinely treated as a sufficient proxy for battery health, with the commonly cited ~80% state-of-health (SoH) retirement convention used as a single pass/fail criterion [
24]; SoH is in fact multidimensional—impedance growth, thermal behavior, inter-cell homogeneity, round-trip efficiency, and self-discharge govern usable power, safety margin, and the realizable second-life trajectory [
25,
26,
27]—so capacity-only screening can admit unsafe packs and exclude suitable ones [
24], and a defensible decision requires a multimodal diagnostic basis coupled to an auditable decision rule. Second, feasibility is set by the surrounding system as much as by the pack: end-of-life detection, aggregation, and the regulated transport of used lithium-ion batteries constrain every pathway upstream of any choice [
1,
8]. Confronted with a specific used pack, the question facing a fleet operator, dismantler, refurbisher, or policymaker is therefore decisional: when should the pack be refurbished, redeployed in a second-life application, recycled, or rejected for safe disposal? Answering it requires the simultaneous weighing of technical residual performance, safety, economic viability, environmental benefit, regulatory readiness, and market or implementation readiness, together with the operational and safety risks that attach to each pathway.
The building blocks of such a decision are individually well studied, but they have developed largely in isolation. Degradation research characterizes second-life potential and its conditionality on residual condition and host application [
2,
9,
10]; life-cycle studies quantify manufacturing burdens and the settings in which remanufacturing pays off environmentally [
11,
12,
13,
14,
15]; recycling research documents process challenges and dedicated recovery technologies [
3,
6,
7]; consumer research examines trust and acceptance in refurbished-product markets [
16,
17,
18,
19,
28]; and reverse-supply-chain and trade-in models formalize the flows and the cost and demand conditions under which life extension is economically preferable [
5,
29]. Where pack-level data are scarce, structured methods substitute transparent reasoning for deterministic estimates: failure mode, effects, and criticality analysis (FMECA) prioritizes risk [
30,
31], and multi-criteria decision analysis (MCDA) methods—the weighted sum, the Technique for Order of Preference by Similarity to Ideal Solution (TOPSIS) [
32], VIKOR [
33], the analytic hierarchy process (AHP) [
34], and the best-worst method (BWM) [
35]—rank alternatives under conflicting criteria, with design science framing artifact construction [
36] and Delphi elicitation the disciplined route to calibration under uncertainty [
37]. These strands rarely meet in a single decision rule. FMEA–MCDA hybrids apply MCDA operators to rank failure modes rather than pathways [
31]; circular automotive decision studies map decision contexts without a reproducible composite index [
1]; MCDA pathway treatments rank alternatives without a separately computed failure-risk penalty [
32,
33]; and a recent lifecycle-management framework allocates retired packs on technical indicators and passport-based traceability without stakeholder-weighted benefit criteria or an explicit residual-risk penalty [
38]. The closest recent contribution, by Ma et al. [
39], optimizes reuse-versus-recycling allocation of retired lithium-ion batteries on measured economic and environmental functions, with chemistry-specific (lithium iron phosphate (LFP) and nickel–manganese–cobalt (NMC)) and state-of-health-differentiated data and a service-based functional unit; it is empirically grounded where the present framework is deliberately screening-level, but it does not model safety, regulation, or traceability as decision criteria, carries no explicit pathway-level residual-risk penalty, and does not treat automotive-grade refurbishment or rejection as distinct alternatives. Within the corpus assembled by the scoping synthesis of
Section 2.2, we did not identify a framework that jointly combines technical risk, safety, economic viability, environmental impact, refurbishment feasibility, traceability, regulation, infrastructure, and market acceptance to choose among refurbishing, reusing, recycling, or rejecting an EV/PHEV battery within one transparent, reproducible decision logic;
Table 1 positions the present framework against the closest integrative contributions. The gap addressed here is therefore not the absence of studies on individual pathways or methods [
1,
5,
29,
31,
32,
33,
38,
39], but the lack of an integrated, risk-penalized decision architecture that links battery-level diagnostic eligibility to pathway-level viability under data scarcity—most acutely in emerging-market settings, where the regulatory enablers of trust, such as the EU Digital Product Passport [
21], and the readiness of the local market to act on them may be temporally mismatched (a motivating assumption delimited in
Section 2.6, not an empirical claim about any specific market).
This paper develops a risk-informed multi-criteria decision-support framework for assessing the conditional viability of refurbished EV/PHEV batteries within circular-economy systems: FMECA-based risk prioritization [
30,
31] characterizes each pathway’s failure exposure, MCDA ranking (weighted-sum and TOPSIS) [
32,
33] orders the four alternatives on six benefit criteria, and a screening-level avoided-burden proxy anchored in published life-cycle data [
15,
40,
41] positions the environmental criterion. Five research questions structure the development: RQ1, which technical, safety, economic, environmental, and regulatory criteria determine the conditional viability of refurbished EV/PHEV batteries; RQ2, how FMECA can identify and prioritize the failure modes affecting the refurbishment, second-life, and recycling pathways; RQ3, how MCDA methods can rank circular battery pathways under conflicting criteria; RQ4, how a screening-level indicator anchored in published life-cycle data can be embedded without claiming a full ISO-compliant life-cycle assessment; and RQ5, what measurement and elicitation architecture would render the framework empirically testable. The contribution is integrative rather than method-level the components are established and used as published, and the novelty lies in their coupling, sequencing, and decision architecture. Five design elements carry it: benefits and risk enter the final index as distinct terms, six stakeholder-weighted benefit criteria forming a weighted score from which a separately computed FMECA residual-risk penalty is subtracted in the Integrated Viability Index (IVI, Equation (
15); the risk-penalty coefficient
is explicit and tunable, so the dependence of pathway preference on the credibility of risk-mitigation instruments (warranty, independent SoH certification, battery-passport traceability [
20,
21,
23]) is an inspectable parameter rather than an implicit assumption; a battery-level Refurbished-Battery Suitability Index (RBSI) is proposed—specified, not executed—to connect multimodal diagnostics to the pathway-level IVI, composite indexing itself not being claimed as novel [
42]; data scarcity is met with declared, illustrative input matrices released together with the scripts and sensitivity analyses, so every reported result can be regenerated and its dependence on the assumptions traced; and the comparison spans all four end-of-life pathways, including rejection, so the framework can conclude that no value-retaining pathway is defensible for a given pack. The calibration protocol (Delphi-based weighting, empirical diagnostics, and an ISO-compliant life-cycle assessment) is specified as future work. The paper proceeds as follows:
Section 2 sets out the design-science methodology and the conceptual framework, separating completed work from deferred calibration protocols;
Section 3 formalizes the model as Equations (2)–(16), the battery-level RBSI having been defined as Equation (
1);
Section 4 demonstrates the model on illustrative inputs;
Section 5 discusses theoretical, practical, and policy implications;
Section 6 states the limitations and the validation agenda; and
Section 7 concludes.
4. Illustrative Results
This section exercises the full machinery, the IVI, TOPSIS, the FMECA penalty, and the scenario and sensitivity checks, on a single illustrative pack. All inputs are those of
Section 3: the performance matrix (
Table 2) with C4 derived through Equation (
14), the FMECA penalties of Equation (
6) on conventional 1–10 scales consistent with practice discussed in [
30,
31], the six weight vectors of
Table 5, and the baseline
. The results demonstrate the decision logic under stated assumptions and are not recommendations for any real battery population;
Figure 1,
Figure 2,
Figure 3 and
Figure 4 report them.
4.1. Pathway Profiles and Conditional Preference
The scores of
Table 2,
Table 3 and
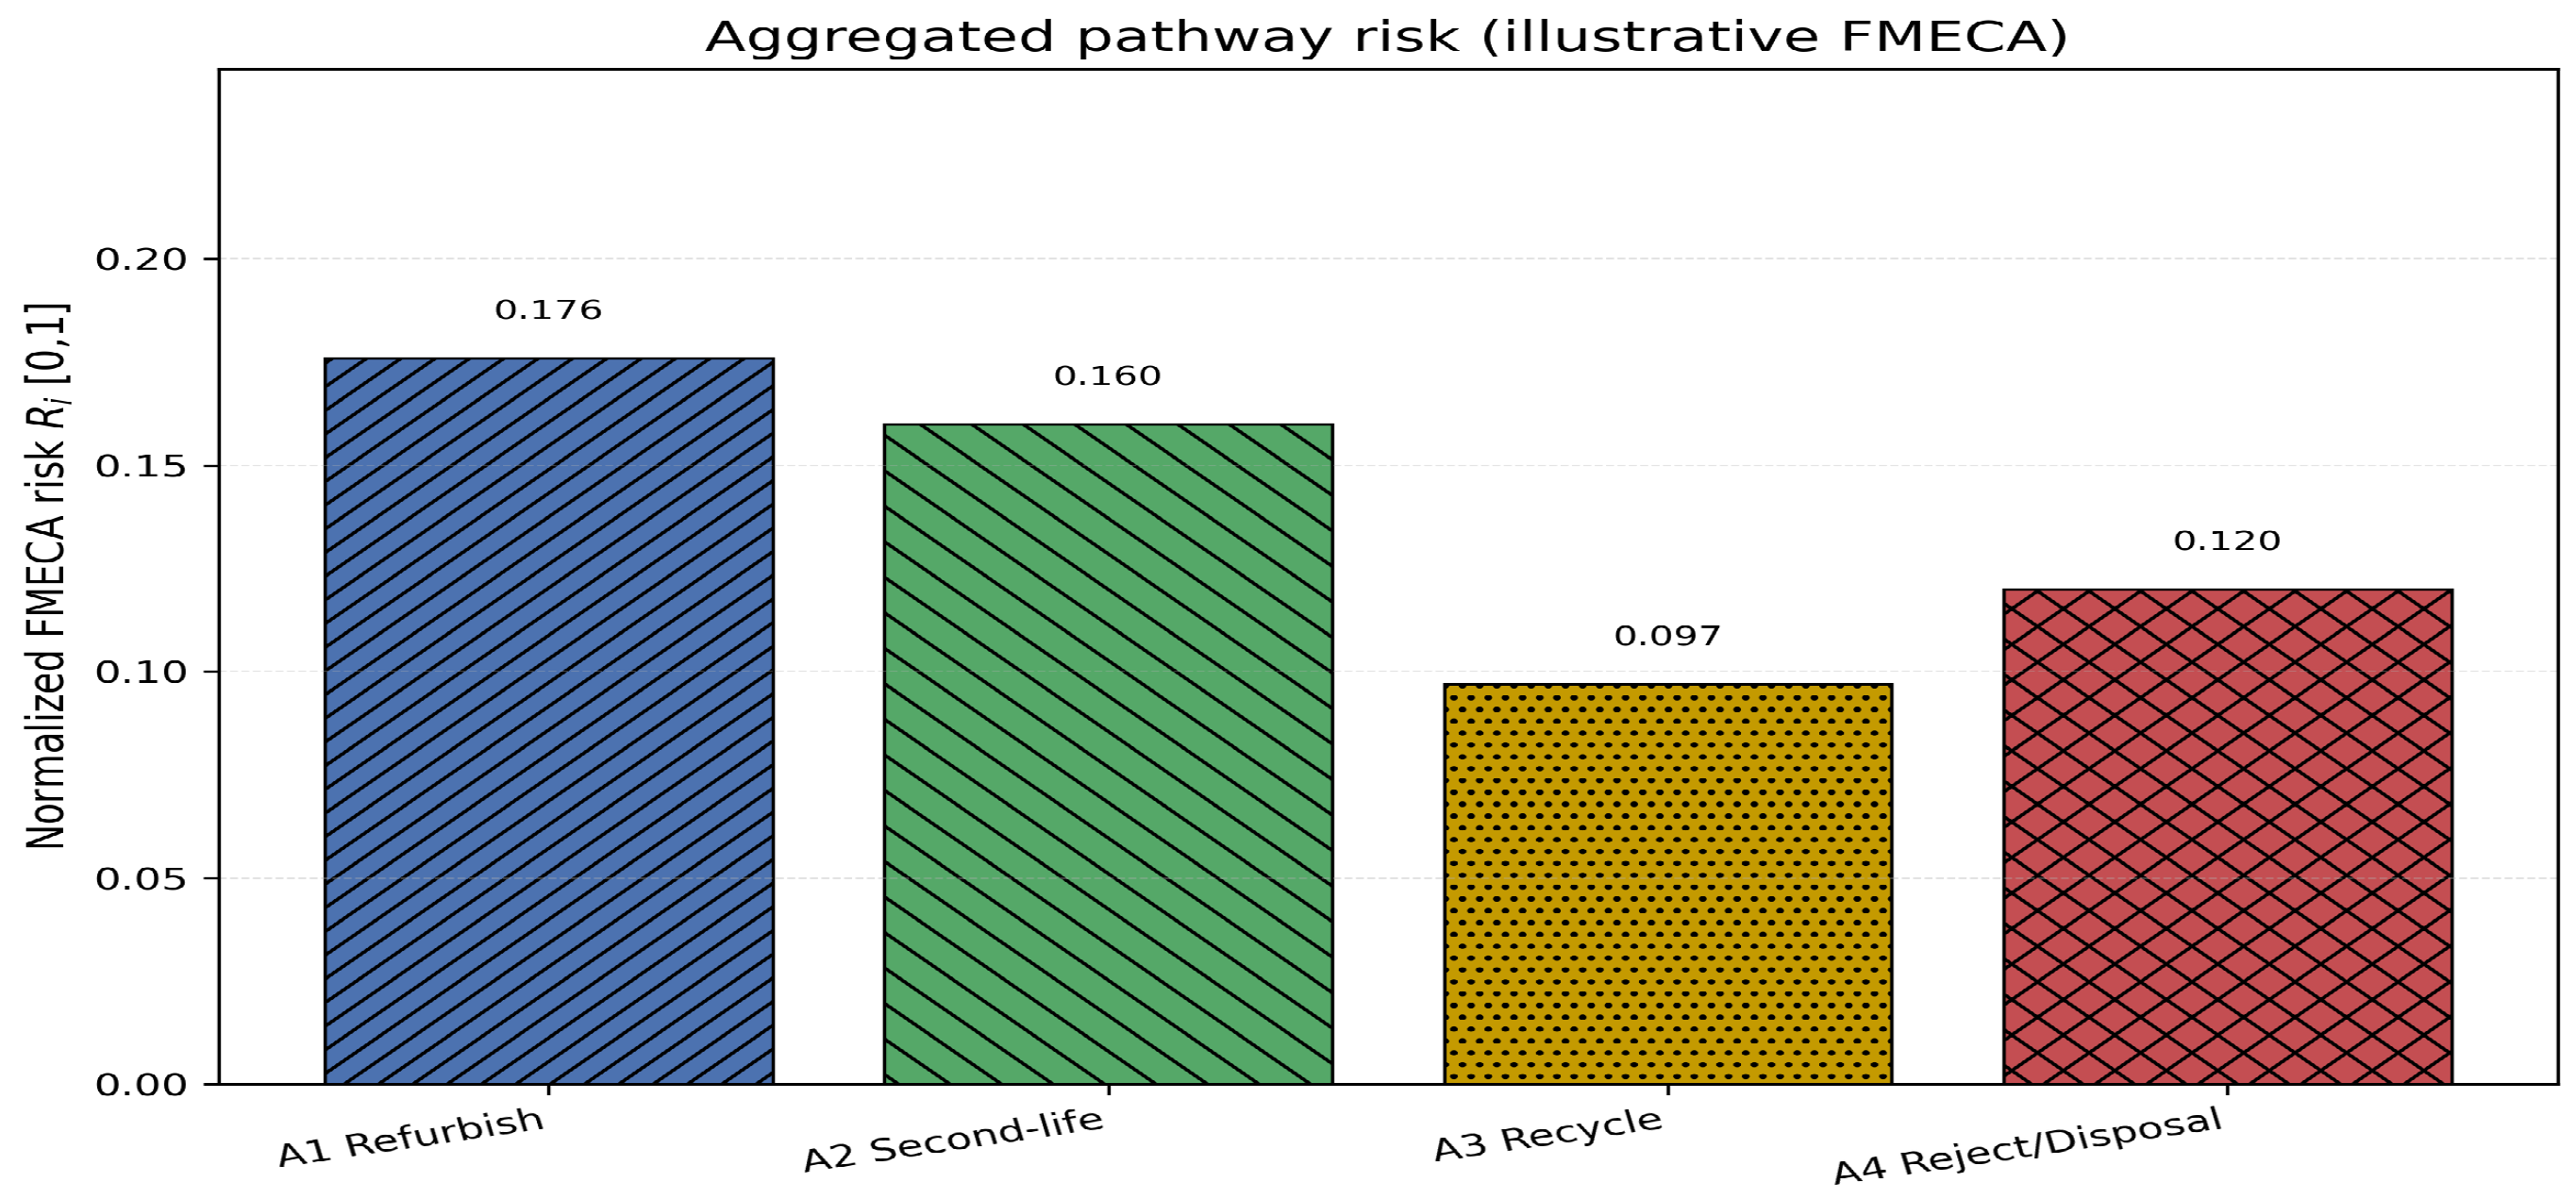
Table 4 give each pathway a distinct profile, and the IVI converts those profiles into conditional preference. Refurbishment offers the largest value-retention upside but concentrates operational and trust-related risk: its penalty, the highest of the four (
Figure 3), is driven by undetected degradation and provenance asymmetry, both with high detection difficulty, consistent with the literature on information asymmetry in refurbished markets [
4,
5,
11,
16,
19,
28]. It leads under cost-priority weighting, and its preferred status is contingent on economic or technical emphasis and on credible containment of the penalized risks. Second-life reuse carries the strongest proxy-derived environmental score (
Table 4) and moderate scores elsewhere; its penalty reflects the engineering uncertainty of repurposing (duty-cycle change, battery-management-system integration) rather than acute information asymmetry [
9,
10]. It leads under environmental priority and is otherwise the mid-range compromise. Recycling combines the strongest designed-safety, regulatory, and market scores with the lowest penalty, consistent with its status as the most established and most explicitly regulated route [
6,
7,
8,
20]; it becomes preferred under safety-priority, regulatory-strict, and infrastructure-constrained weightings. Rejection is never preferred in any scenario, its IVI remaining lowest throughout, in line with value-retention logic [
1,
4,
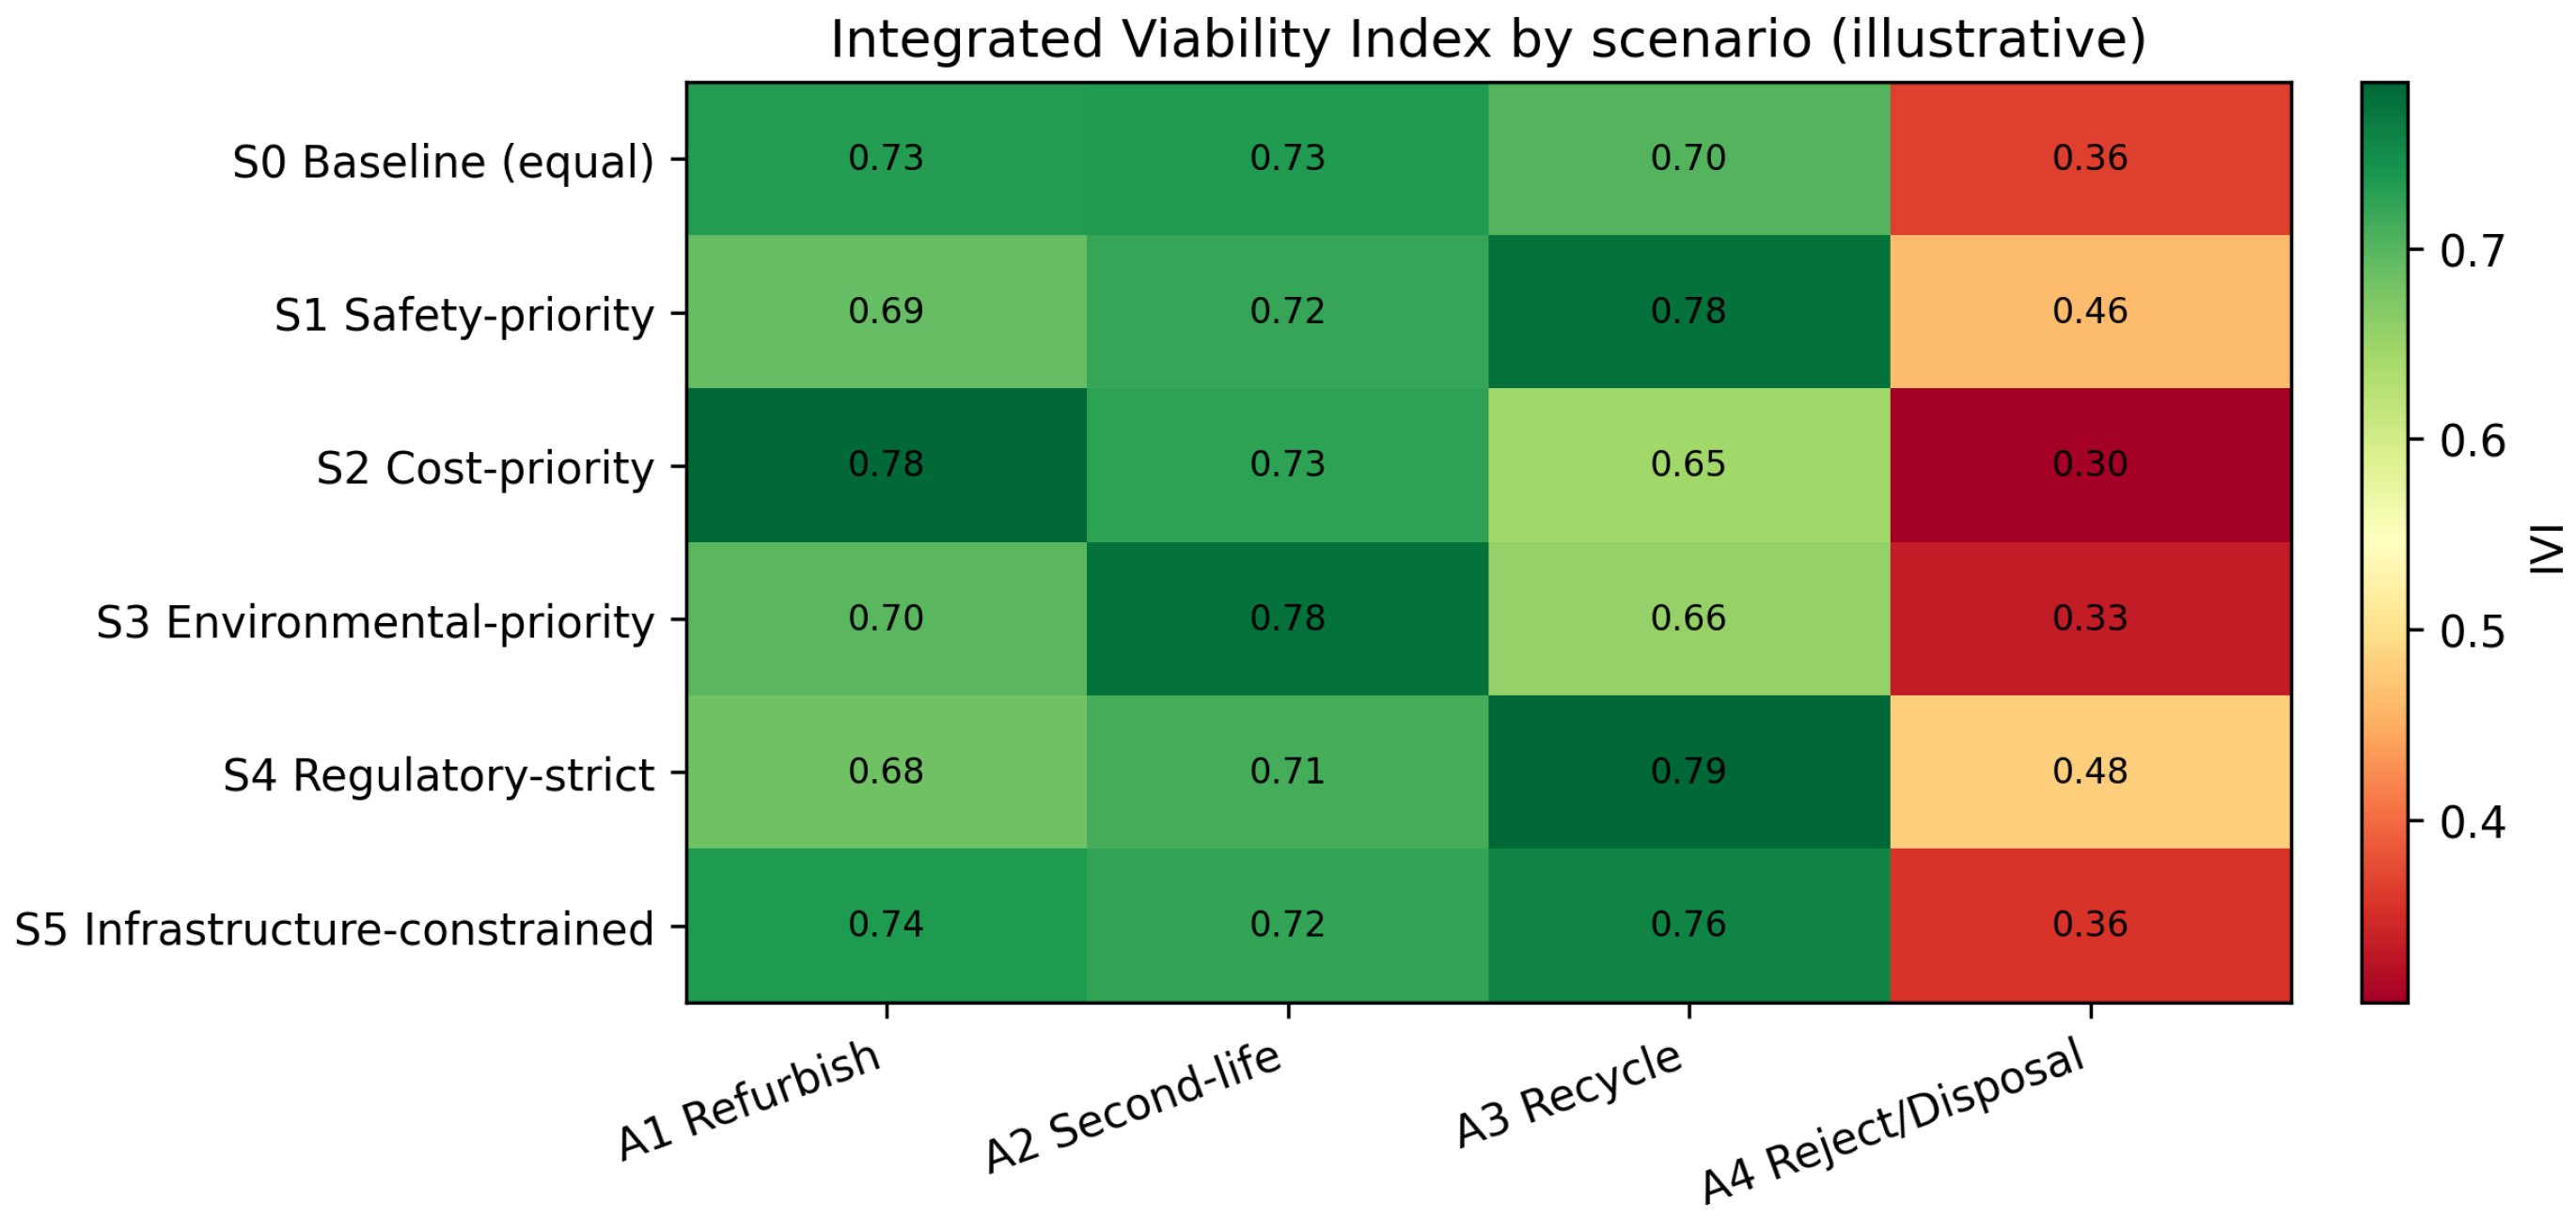
5]. Scenario-level IVI values are consolidated in
Section 4.2 and
Figure 1.
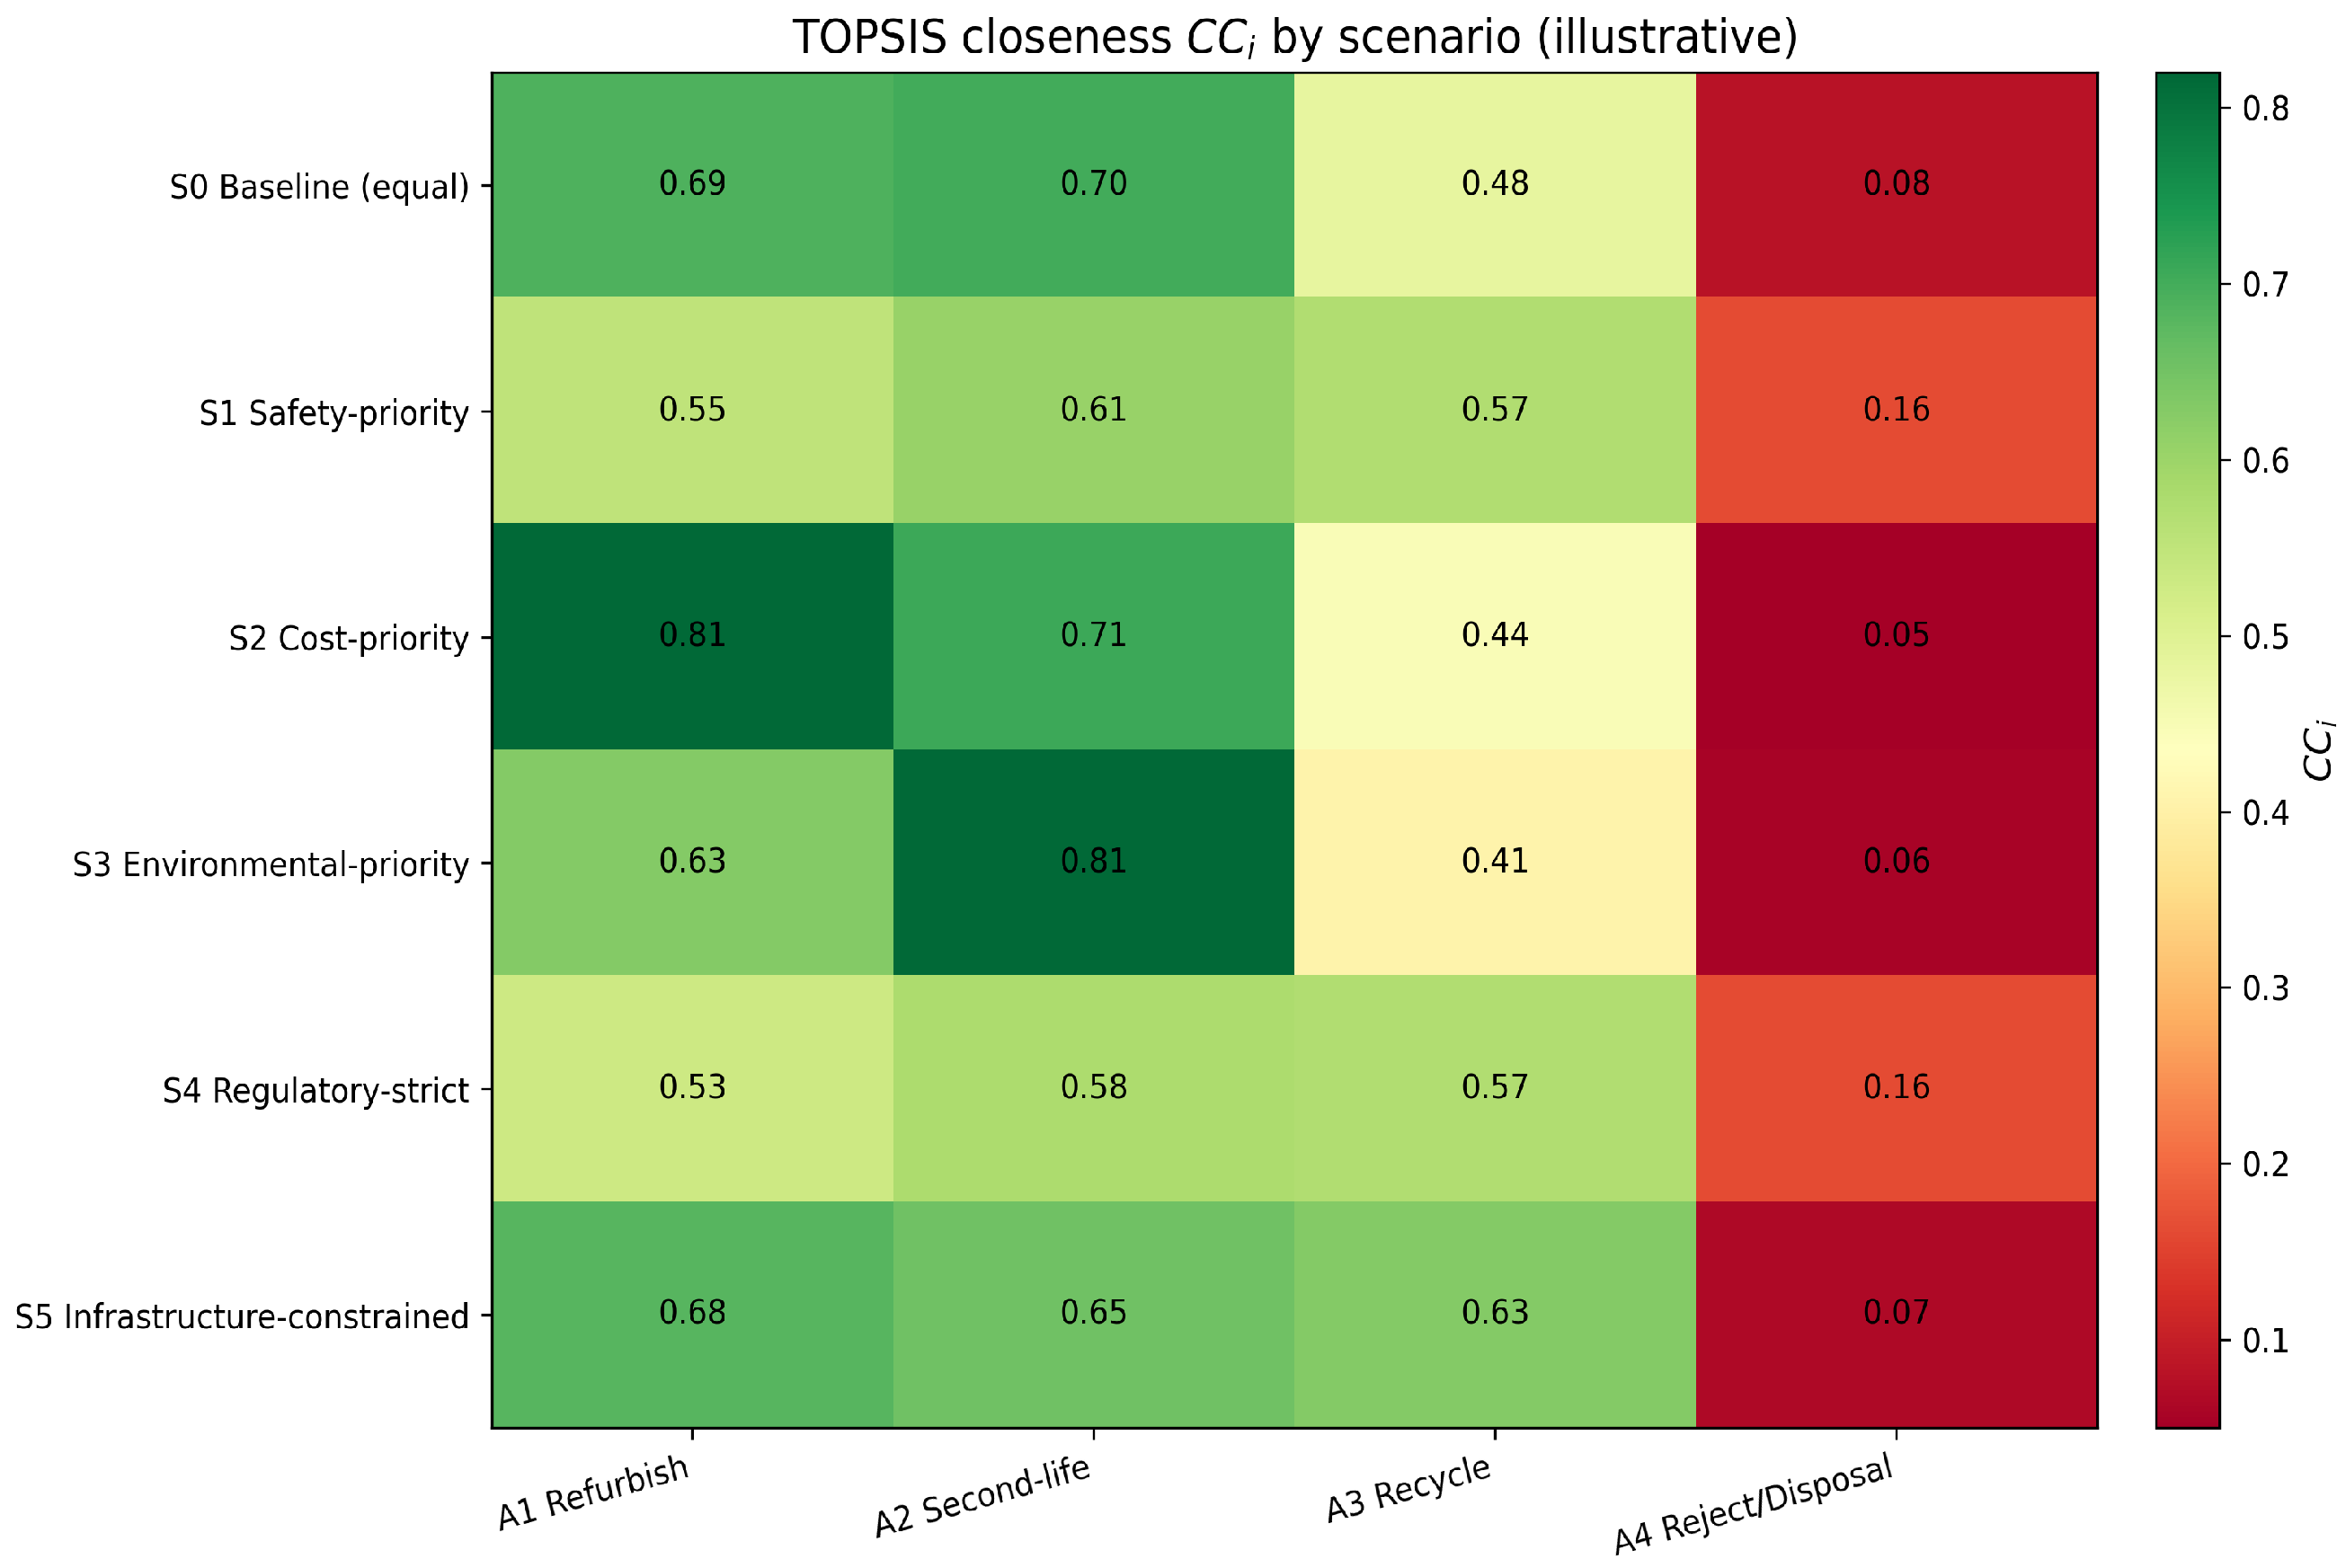
The TOPSIS comparison is informative precisely because the two rules do not coincide. They agree on the leading pathway in three of six scenarios (baseline and environmental priority, led by second-life reuse; cost priority, led by refurbishment) and agree that rejection is last in all six (
). They diverge in the safety-priority, regulatory-strict, and infrastructure-constrained scenarios: the IVI ranks recycling first, whereas TOPSIS, which subtracts no risk penalty, still favors a value-retention pathway, and recycling never attains the top TOPSIS closeness in any scenario. A controlled ablation on the same matrix and weights isolates three mechanisms. First, adding the explicit penalty
changes the leader in S5 (from A1 to A3) under both column-maximum and vector-normalized weighted sums; in S1 and S4 it preserves A3 as leader. Second, switching weighted-sum normalization (column-maximum to vector) changes magnitudes but not the leader in S1, S4, and S5. Third, TOPSIS still selects A2 in S1 and S4 despite the same weighted, vector-normalized inputs, indicating that the distance-to-ideal aggregation rule itself, not only normalization, contributes to divergence. Closeness values are also sensitive to the composition of the alternative set, a known property of distance-to-ideal methods [
32,
33]. The full closeness coefficients are tabulated in
Table 6;
Figure 4 displays them by scenario.
4.2. Comparative Ranking Under Alternative Assumptions
The substantive result is not that different pathways lead in different scenarios, which the scenario construction makes near-inevitable, but that the framework localizes where, why, and at what risk penalty each change of preference occurs. Under the stated assumptions the leading pathway varies as follows (
Figure 1): at baseline S0 the two value-retention pathways jointly lead, second-life reuse marginally ahead of refurbishment (0.734 versus 0.732), both above recycling (0.702) and disposal (0.365); refurbishment leads under cost-priority S2 (0.785); second-life reuse under environmental-priority S3 (0.777); and recycling under safety-priority S1 (0.777), regulatory-strict S4 (0.787), and infrastructure-constrained S5 (0.757). Rejection is preferred in none, its IVI ranging from 0.304 to 0.480 and remaining lowest in every case.
The baseline ordering between the two value-retention pathways lies within scoring noise and must not be over-read. Across the 20,000 perturbed replicates of
Section 3.9, second-life reuse leads in 50.9% of runs, refurbishment in 43.1%, recycling in 5.9%, and rejection in none, conditional on the stated perturbation model, with a median top-two margin of about 0.022. The substantive baseline finding is that the two value-retention pathways jointly dominate recycling and disposal; which of the two leads is inside the noise.
A one-at-a-time examination of the weights clarifies the broader pattern. From the equal-weight baseline, boosting C2, C5, or C6 moves the lead toward recycling; boosting C1 or C3 moves it toward refurbishment; and boosting C4 moves it toward second-life reuse. These shifts are intuitive given the performance profiles (recycling carries the strongest safety, regulatory, and market scores with the lowest penalty, while second-life carries the strongest environmental score) and indicate that the ranking responds coherently to the criterion emphasized rather than erratically.
The framework does not produce, and is not intended to produce, a context-free best pathway; the orderings characterize the behavior of the decision logic under illustrative inputs, not the relative merit of real battery pathways.
4.3. Sensitivity and Robustness Analysis
The checks specified in
Section 3.9 are reported here in turn.
The
sensitivity (
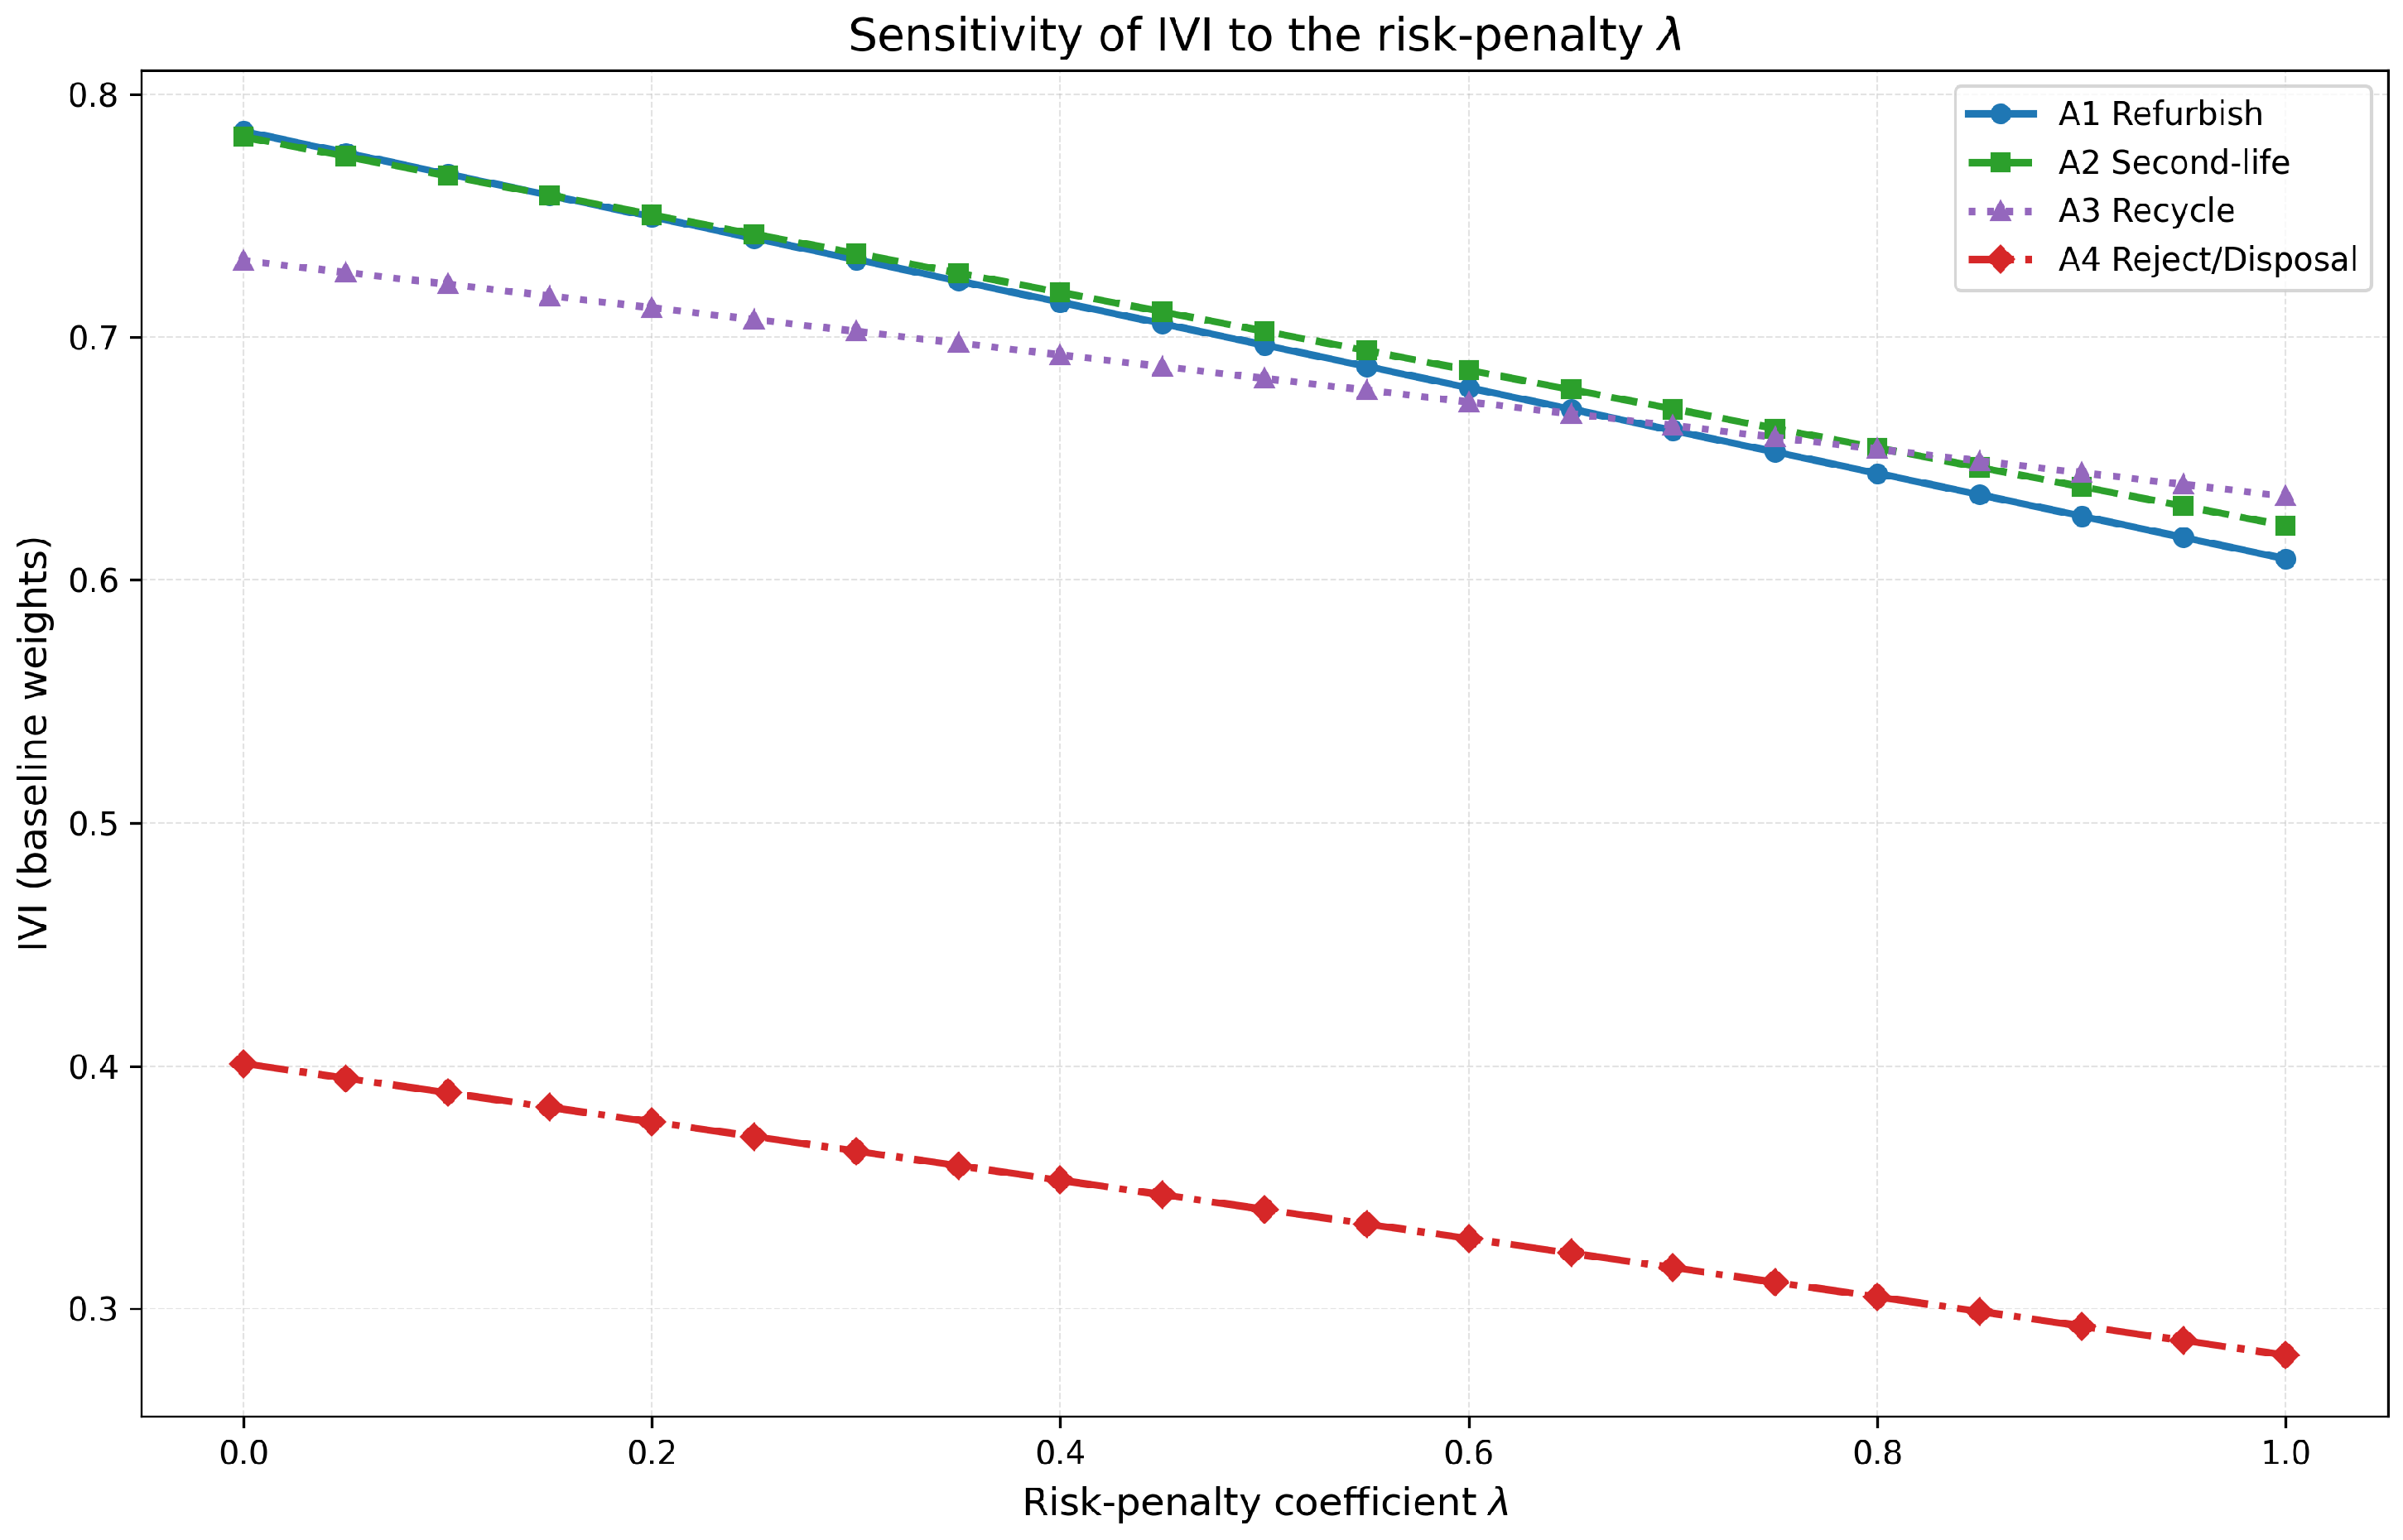
Figure 2) traces each pathway’s IVI under baseline weights as
increases from zero. Because refurbishment carries the highest penalty and recycling the lowest (
Table 3), leadership migrates: from refurbishment to second-life reuse between
and
, and from second-life reuse to recycling between
and
. Since
proxies mitigation credibility (
Section 3.7), the transitions state the conditions under which refurbishment is preferred, not an actionable magnitude of risk containment.
Removing the C2 benefit entirely, so that safety enters only through , preserves the non-dominance structure, with three productive pathways still leading across scenarios and rejection never leading, but changes the leader in two of six scenarios (safety-priority and infrastructure-constrained, where refurbishment overtakes recycling). The conditionality is therefore not an artifact of counting safety twice, while the scenario-level leaders are C2-sensitive: C2 carries decision-relevant information about designed safety beyond what the residual-risk penalty captures (Section Construct Partition: Inherent Safety (C2) Versus Residual Operational Risk ()).
Recomputing the penalty with the severity-aware blended rule of
Section 3.3 gives
,
,
, and
, and re-running the IVI leaves the leading pathway in every scenario unchanged: only the magnitude of the penalty, not the ordering, depends on the aggregation choice. An SoH sweep of the threshold rules (Equation (
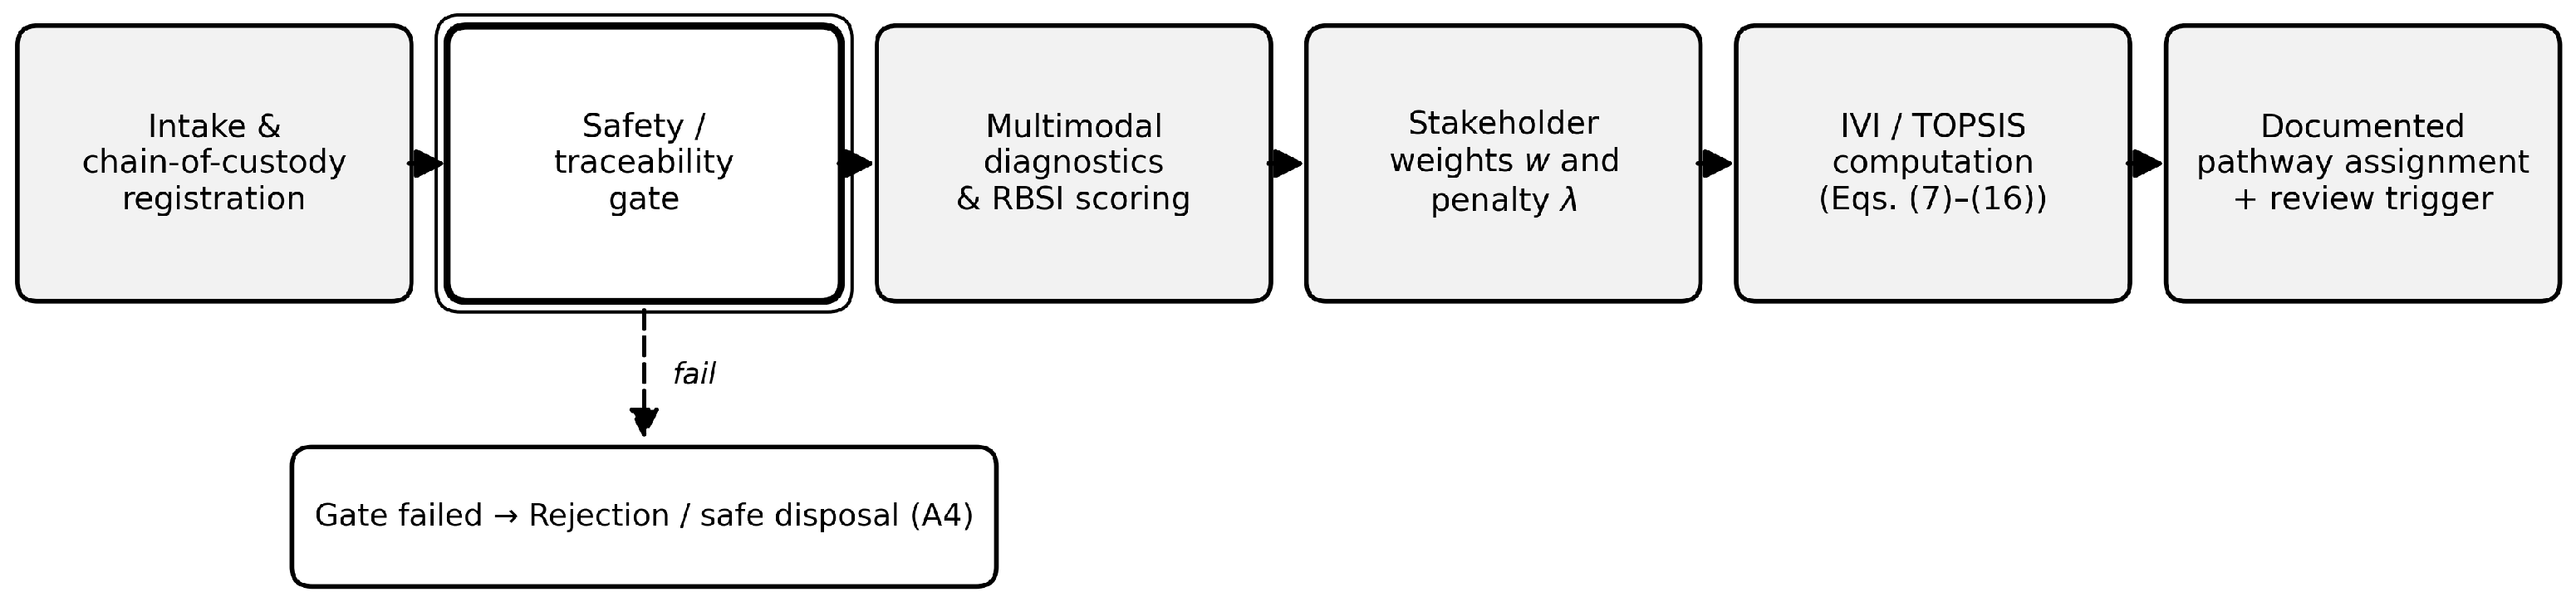
16)) at a fixed safety level of 0.65 and aggregate risk of 0.30 fires the gates as specified: SoH ≥ 0.80 routes to refurbishment, 0.60 ≤ SoH < 0.80 to second-life reuse, SoH = 0.55 (below
) to recycling, and safety-critical risk above 0.70 to rejection.
Table 7 provides a compact subset of the sweep in the main text.
The checks converge. Pathway preference remains conditional; the two value-retention pathways jointly lead at baseline, their internal order sitting inside scoring noise; leadership migrates with ; rejection never leads; and the structure survives both C2 removal and the alternative FMECA aggregation. These remain demonstrations under assumed inputs, not findings about real batteries.
6. Limitations and Future Validation
The framework is conceptual, and its limitations follow from that positioning. No primary empirical results are reported: no expert panel, survey, or battery testing was conducted, and every numeric input (performance scores, FMECA ratings, scenario weights, thresholds, and the coefficient
) is illustrative or literature-informed. The scenario results demonstrate the behavior of the decision logic, not the relative merit of real pathways; different but defensible inputs would shift the numbers, and the contribution rests in the reproducible mapping from inputs to a risk-penalized ranking (Equation (
15)).
Five structural caveats follow. The baseline ordering of the two value-retention pathways is a statistical near-tie (
Section 4.2), so the robust baseline finding is their joint dominance over recycling and disposal, not the ordering between them. The six weighting scenarios were constructed to span the criterion families, so the absence of a dominant pathway is partly by design; what carries evidential weight is the traceable structure of the conditionality, namely which criterion moves the lead and at what risk penalty. The environmental criterion derives from a screening-level avoided-burden proxy (per-pack basis, cradle-to-gate only, single point intensity) and cannot support environmental claims; a full ISO 14040/14044 assessment [
15,
40,
41] with a service-based functional unit is future work. The NMC811-based static displacement fractions used for C4 are not automatically transferable to LFP or other chemistries: manufacturing-intensity baselines, degradation trajectories and service life, recoverable-material value, refurbishing process burdens, and reverse-logistics profiles can differ materially by chemistry and region, and directional ranking changes should not be asserted without chemistry-specific and regionalized inventories. The FMECA layer uses the classical S×O×D structure with assumed ratings, a deliberately non-exhaustive failure-mode inventory, and thresholds that are illustrative parameters rather than normative limits, their appropriate values depending on chemistry, application, regulatory regime, and risk appetite. The severity-aware aggregation and the catastrophic-severity gate leave the scenario leaders unchanged, but penalty magnitudes, and the
values at which preference shifts, depend on ratings yet to be elicited. Finally, some overlap between designed safety (C2) and residual risk (
) is unavoidable: removing C2 changes the leader in two of six scenarios while preserving the non-dominance structure (
Section 4.3). TOPSIS closeness values likewise remain sensitive to the alternative set and normalization [
32,
33], so the IVI–TOPSIS divergence is reported as a methodological contrast that bounds any single-method claim.
Three scope limitations bound generalizability. The scoping synthesis is structured but not PRISMA-systematic, so omission of adjacent frameworks cannot be excluded. The proposed RBSI and diagnostic sublayer remain unexecuted specifications with uncalibrated weights; first-life history is often unavailable, degrading traceability, and retired-pack populations are heterogeneous, so models calibrated on one cohort may not transfer. Assembling standardized diagnostic data across manufacturers adds further obstacles: SoH definitions and retirement conventions vary [
24], access to BMS data and their formats remains fragmented—the motivation for open formats such as the Battery Data Format [
57]—and diagnostics must resolve condition at cell, module, and pack level across chemistries and form factors before cohorts become comparable. The uncertainty architecture that remains to be executed is multi-source: measurement uncertainty (sensor/test error), between-cell heterogeneity (true chemical dispersion), expert-judgment uncertainty (weights and S/O/D ratings), and model/scenario uncertainty (aggregation choice, normalization, and pathway assumptions) should be kept separate and propagated hierarchically from cell to module to pack in future validation. Under this proposed protocol, the RBSI would be reported as a distribution or interval rather than a point value, summarized by a conservative statistic (for example, a lower quantile) and guarded by a non-compensatory gate for safety-critical cells or modules, so that chemical outliers—heterogeneous lithium-inventory loss, active-material isolation, or impedance growth concentrated in a few cells—are not masked by averaging; the resulting distributions would then be propagated through the IVI to the techno-economic and life-cycle outputs by Monte Carlo or another justified method, reporting intervals and threshold-crossing probabilities rather than single numbers. None of this propagation has been executed here. The framework targets data-scarce, emerging-market settings, where its transparency is a strength but also a boundary: in data-rich settings, richer probabilistic or option-based methods [
43,
44,
45] may be preferable.
Operationalization is a defined program rather than an aspiration, and its minimum data requirements can be stated compactly: cell-, module-, and pack-level diagnostics with first-life history; real cost data and operating profiles; incident records or expert ratings for the FMECA layer; regionalized, chemistry-specific life-cycle inventories with a service-based functional unit; reverse-logistics, recovery-yield, regulatory-traceability, and market-acceptance data; and external cohorts for validation. The logical sequence is: Delphi-based weight and rating elicitation with AHP/BWM, including refinement of the failure-mode inventory across chemistries (
Section 2.3) [
34,
35,
37]; execution of the four-layer diagnostic sublayer with RBSI calibration and validation on external cohorts (
Section 2.7); a primary consumer-acceptance survey to replace the literature-informed market-readiness assumptions [
16,
17,
18,
19,
28]; an ISO 14040/14044-compliant life-cycle assessment with regionalized inventory [
11,
12,
13,
14,
15,
40,
41]; techno-economic assessment [
61]; a cross-country comparison and an industrial pilot; and ingestion of Digital Battery Passport and certification records [
20,
21,
22,
23], with the full protocols in the
Supplementary Materials. Until that program is carried out, the framework is a decision-support instrument, not a substitute for physical testing.
7. Conclusions
This paper addressed a decisional question that the battery-circularity literature treats mostly in fragments: under which conditions should a retired EV/PHEV pack be refurbished, redeployed in second-life storage, recycled, or rejected? The answer developed here is architectural. An Integrated Viability Index combines six stakeholder-weighted benefit criteria with a separately computed FMECA residual-risk penalty, scaled by a single coefficient
that makes the role of risk-mitigation credibility explicit; a screening-level avoided-burden indicator positions the environmental criterion without claiming a life-cycle assessment; and TOPSIS provides a methodological contrast that localizes where the explicit risk penalty changes the decision. The five research questions are answered in turn: the six-criterion set (RQ1); the FMECA characterization of pathway-specific failure modes (RQ2); the weighted-sum and TOPSIS rankings with their localized divergence (RQ3); the screening-level environmental embedding (RQ4); and the calibration and measurement architecture of
Section 2.3 and
Section 2.7 (RQ5).
Exercised on illustrative, literature-informed inputs, the framework yields three structural conclusions. Preference is conditional: refurbishment leads under economic and technical priority with credible risk containment, second-life reuse under environmental priority, and recycling under safety, regulatory, and infrastructure constraints. Preference migrates with risk penalization: as rises, leadership passes from refurbishment through second-life reuse to recycling, so defensible value retention depends on investment in warranty, certification, and traceability instruments. And rejection never leads, consistent with disposal as a fallback rather than a strategy. These are properties of the decision logic under stated assumptions, not empirical findings about battery fleets.
The proposed RBSI–IVI coupling defines the route from measurement to decision, and its calibration, together with Delphi-based weighting and an ISO-compliant life-cycle assessment, constitutes the validation agenda (
Section 6). The framework’s interim value is precisely what data-scarce settings lack: a transparent, reproducible way to reason about circular pathway selection, and to document that reasoning, while the evidence base matures. It supports and structures decisions; it does not replace the physical testing and safety certification on which any deployment must ultimately rest.